Embed Size (px)
Citation preview
1
Evaluation of soils on a toposequence formed from the coastal plain sands of the Imo river basin,
Southeastern Nigeria
ARTICLE INFO Article history: Received September 19, 2020 Received in revised form January 9, 2021 Accepted January 19, 2021 Available online March 21, 2021
ABSTRACT
Due to the increasing land degradation in southeastern Nigeria – with particular reference to the ubiquitous gully network in the region – selected soils formed from the Coastal Plain Sands of the Imo River Basin were evaluated and char-acterized to determine their potentials and capabilities. , Three profile pits were consequently dug on the upper slope (Umuariam), -mid-slope (Umulogho), and foot slope (Umungwa) of three towns on the Imo River Basin underlain by the coastal plain sands. The soil color ranged from greyish brown (5 YR 5/2) to dull brown (7.5 YR 5/3) in the topsoil and from dull orange (5 YR 6/4) to or-ange (5 YR 6/7) in the subsoil. The soils had sandy topsoil and relatively more clayey subsoil. The pH (in KCl) ranged from very strongly acidic (4.5 – 5.0) to moderately acidic (5.1 – 6.0). They had low organic matter, low total nitrogen, low ECEC, low Al saturation, and moderate base saturation. The soils of Umuariam (Upper Slope) and Umulogho (Mid Slope) were classified as Typic Hapludults (Chromic Acrisols), while that of Umungwa (Foot Slope) was clas-sified as Typic Udipsamments (Rubic Arenosols). Umuariam had a USDA land capability class of IIes and a USBR land capability class of 2v/C. Umulogho and Umungwa both had a USDA and USBR capability class of IVs and 3v/C respectively. Though moderately to marginally irrigable, the soils can still pro-duce increased and sustainable agricultural yield if the appropriate land use and husbandry practices are adopted, with particular reference to erosion control, organic manure, lime, and fertilizer application.
Keywords:
Coastal Plain Sands Toposequence Soil Characterization Soil Classification Land Evaluation River Basin.
Corresponding Author’s E-mail Address:
[email protected] https://doi.org/10.36265 njss.2021.310201
ISSN– Online 2736-1411
Print 2736-142X
© Publishing Realtime. All rights reserved.
A. Nnamdi Azikiwe University, Awka, Anambra State B. Federal College of Agriculture, Ishiagu, Ebonyi State
1.0. Introduction
Coastal Plain Sands underlie up to 50 % of the Imo River Basin of Southeastern Nigeria. It consists of unconsolidat-ed yellow and white sand materials which are sometimes cross-bedded with clays, sandy clays, and pebbles (Orajaka, 1975). Soils on Coastal Plain Sands are deep, highly weathered, strongly acidic, coarse-textured, easily eroded, and generally of low total nitrogen, organic matter, ECEC, base saturation, and inherent chemical fertility (Osuji et al., 2002; Obi, 2015; Osujieke et al., 2018; Abam and Orji, 2019). This inherent low fertility and poor structural stability ne-cessitate the need for effective management and sustaina-ble use. Unfortunately, due to inadequate soil information, uninformed land allocation, and land use planning, the soils of the region have become largely degraded. The extent and magnitude of the degradation areare immense,
encompassing a multiplicity of aspects, some of which include soil erosion, pollution, deforestation, and loss of soil fertility and sustainability, to mention but a few. These problems are compounded by the very high annual rainfall amount and intensity recorded in the region. All of these have collectively resulted in numerous social, economic, psychological, and environmental malaise in the region, fueling social and political unrest among the restive population. In the face of these disturbing realities, the importance of the soil survey and land use planning of the region cannot be overemphasized. It is indeed a prereq-uisite for the sustainable use and management of this lim-ited resource (FAO, 2015). More so, Esu (2004) contended that as far as food security and environmental sustainabil-ity determinations are concerned, the 1985 reconnaissance soil map of Nigeria is of little or no value. Similarly, Fagbami and Ogunkunle (2000) stated that the soil map of
Madueke, C.O.a, Nnabude, P.C.a, Okore, I.K.a, Onunwa, A.O.a, Madueke, E.C.b, Okafor, M.J.a, Nnabuihe, E.a, Nwosu, T.V.a
Madueke et al. NJSS 31 (2) 2021 1-9
2
Nigeria has credibility problems and too small a scale to give satisfactory direction on project site selection, soil management, and land use planning. As such, while the conduct of a detailed and/or semi-detailed soil survey of Nigeria is still strongly advocated as the panacea for effective and sustainable agricultural development, in the light of the extent of soil degradation in Southeastern Nigeria, interim measures must be taken to forestall further deterioration. Therefore, the major objec-tive of this study is to evaluate the nature and properties of soils formed from the Coastal Plain Sands, which is one of the major geologic formations in Southeastern Nigeria. The specific objectives are to:
characterize soils on the toposequence overlying th Coastal Plain Sands of the Imo River Basin
classify the soils using the Soil Taxonomy and the World Reference Base for Soil Resources
determine the USDA and USBR land capability classes of the soils
make land use management recommendations.
2.0. Materials and methods
2.1 The Physical Environment of the Study Area The area receives an average of 2134 mm of rainfall dis-tributed to about 139 days of the year (Madueke, 2010). It is double maxima, with an August break occurring in July or August. The daily temperature ranges from a minimum of 21oC to a maximum of 34oC. The relative humidity reaches a minimum of 60 % in January (at the peak of the dry season) and rises to 80 - 90 % in July (at the peak of the rains) (Monanu, 1975). The original vegetation of the study area was the tropical rain forest (Igbozuruike, 1975). The rain forest has however been destroyed largely
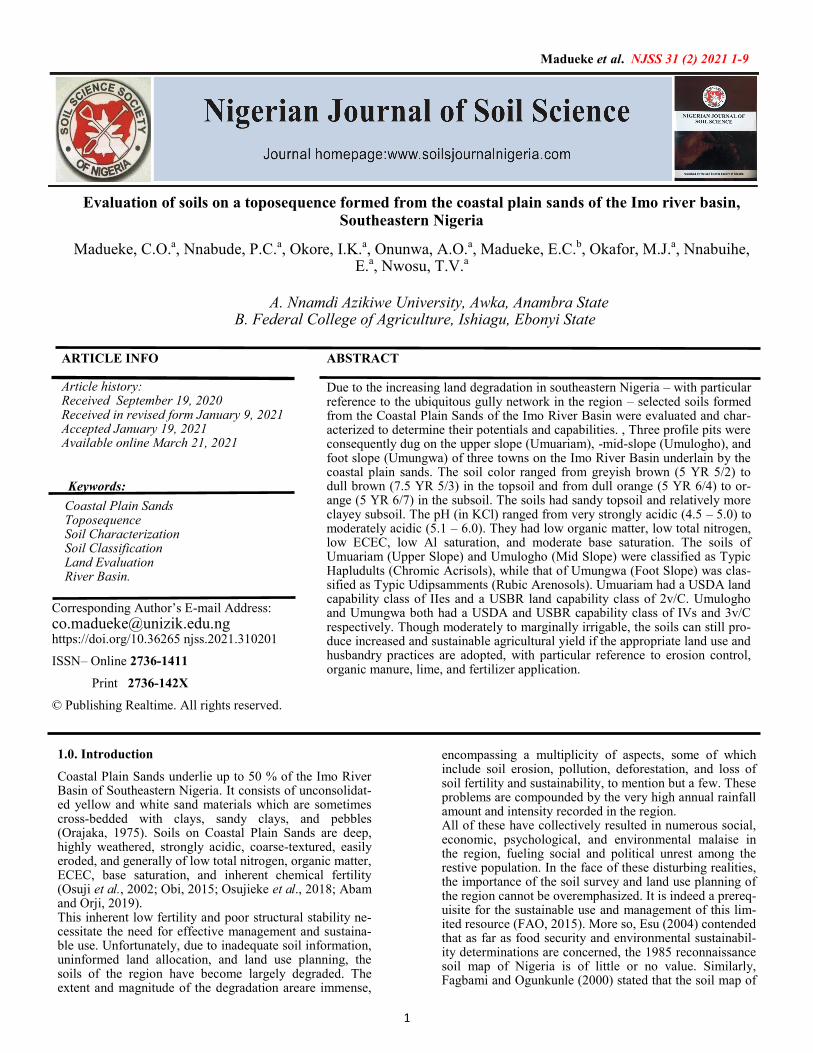
through human activities and supplanted with what is to-day referred to as the oil palm bush. 2.1.1 Selection of Study Area Three profile pits were dug on three different physiograph-ic positions on the portion of the Imo River Basin under-lain by the Coastal Plain Sands. The geologic map of the Imo River Basin indicating the region underlain by the Coastal Plain sands is shown in Figure 1. The following were the study sites: Umuariam (Upper Slope), Umulogho (Mid Slope), and Umungwa (Foot Slope) (Figure 2, 3, 4, and 5). The geographic coordinates (latitude, longitude, and altitude) were measured using the global positioning system (GPS) (Garmin Ltd, Taiwan).
2.2 Soil Characterization 2.2.1 Fieldwork Three profile pits were dug in three towns of Imo State, viz: Umuariam (upper slope), Umulogho (-mid-slope), and Umungwa (foot slope). The site and profile description aswas in accordance withthe method described by FAO (2006). Delineation of horizon boundaries was accom-plished before actual sample collection for laboratory anal-ysis. Soil samples were taken from each of the constituent horizons, starting from the bottom horizon. These samples were placed inappropriately labeled polythene bags and transported to the laboratory. The samples were then air-dried for three days, crushed, and passed through a 2 mm sieve before routine laboratory analysis. A small quantity (about 10 g) of each sample was finely ground and pre-served for the determination of organic carbon and total nitrogen. Undisturbed soil samples for determination of saturated hydraulic conductivity and bulk density were collected in cylindrical metal canisters.
Evaluation of soils on a toposequence formed from the coastal plain sands of the Imo river basin, Southeastern Nigeria
Figure 1: Geologic Map of Imo River Basin Fig. 2: Schematic Diagram of the Toposequence on Coastal Plain Sands (Benin Formation)
3
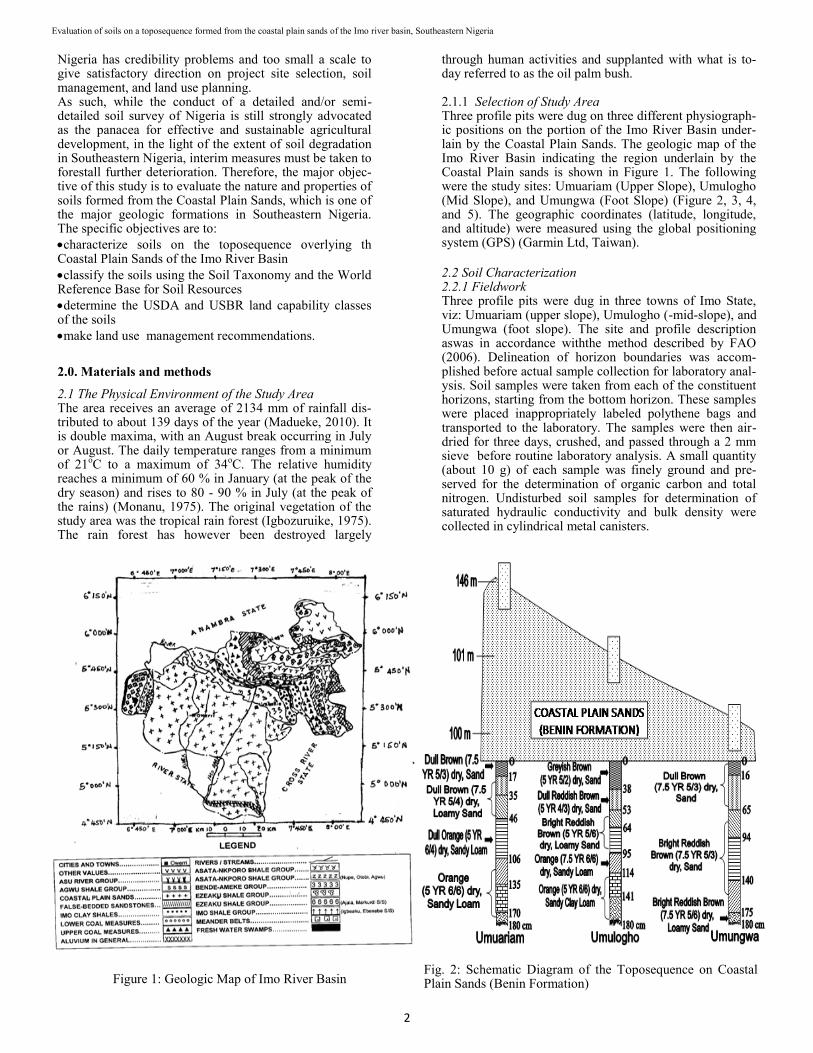
Fig. 3: Depth Function of Clay at Umuariam (Upper Fig. 4: Depth Function of Clay atUmulogho(Mid Slope) Fig. 5: Depth Function of Clay at Umungwa (Foot Slope)
2.3 Laboratory Soil Analysis The physical and chemical properties of the soil samples were determined using routine analytical methods. The mois-ture content was determined gravimetrically. Particle size distribution was carried out by the hydrometer method (Gee and Bauder, 1986). Bulk density was determined using the procedure outlined by Arshad et al. (1996). Porosity was computed from bulk and particle density as described by Vomocil (1965). Saturated hydraulic conductivity was deter-mined by the Falling Head Method, as reported by McWhort-er and Sunda (1977). Soil pH was measured electrometrical-ly by glass electrode in pH meter in both KCI (1 N) and dis-tilled water suspension using a soil: liquid ratio of 1: 2.5 (International Institute for Tropical Agriculture, 1979). Elec-trical conductivity was determined electrometrically with the electrical conductivity meter using a soil: liquid ratio of 1: 2.5. Exchangeable basic cations were extracted with neutral ammonium acetate (NH4OAC). Exchangeable calcium and magnesium were determined by the ethylene diamine-tetraacetic acid (EDTA) titration method while exchangeable potassium and sodium were estimated by flame photometry (Jackson, 1962). Exchangeable acidity was extracted with KCl (1 N) and measured titrimetrically according to the pro-cedure of Mclean (1982). Effective Cation Exchange Capaci-ty (ECEC) was computed as the sum of the exchangeable bases and the exchange acidity, while base saturation, alumi-num saturation, exchangeable sodium percentage, and ex-changeable potassium percentage were computed as the per-
centage of the ratios exchangeable bases, exchangeable alu-minum, exchangeable sodium, and exchangeable potassium respectively to ECEC. Ca: Mg ratio and K: Mg ratios were calculated from the exchangeable basic cations. Soil organic carbon (SOC) was determined by Walkley and Black diges-tion method (Nelson and Sommers, 1982). Total Nitrogen was estimated by the micro-Kjeldahl digestion method (Bremner and Mulvaney, 1982) while available phosphorus was determined by Bray II Method (Olsen and Sommers, 1982). 2.4 Soil Classification and Land Use Planning The soils were classified in accordance with the USDA Soil Taxonomy (Soil Survey Staff, 2003) and the World Refer-ence Base for Soil Resources (FAO, 2001; IUSS, 2006). The soils were further classified based on the USDA (Klingbiel and Montgomery, 1961) and the USBR Land Capability Classification (USBR, 1953; Landon, 2013). The land use recommendations were then made with respect to these clas-sifications and the Physicochemical properties of the soils.
3.0. Results and Discusion
3.1 The Geo-References of the Study Area
The geographic information of the soils isis shown in Table 1, while the schematic diagram of the toposequence is shown in Figure 2. The profile pits were sited as shown in Table 1.
Study area Physiographic position Latitude Longitude Altitude Umuariam Upper Slope N 05o 33' 09.0" E 007o 21' 05.8" 146 m Umulogho Mid Slope N 05o 34' 21.0" E 007o 22' 30.8" 101 m Umungwa Foot Slope N 05o 33' 39.1" E 007o 24' 19.7" 100 m
Table 1: Geo-Information of the Study Area
3.2 Physical Properties The physical properties of the soils are shown in Table 2. Soil texture ranged from sand in the topsoil to sandy clay loam in the Bt2 (114 – 141 cm) and Bt3 (141 – 180 cm) hori-zons of Umulogho (Mid slope). They generally have sandy topsoil, with relatively more clayey subsoil (Figures 3, 4, and 5), a phenomenon that could be diagnostic of the existence of argillic horizons. Similar results were also reported by Chikezie et al. (2010). Sand content ranged from 78 % in the Bt3 horizon (141 – 180 cm) of Umulogho to 94 % in the Ap horizon (0 – 17 cm) of Umuariam, with an average value of 86.80 %. Silt content ranged from 1 – 2 % in the profiles under study, with a mean of 1.2 %. This generally low silt content as also reported by Chikezie et al. (2010), is in line with the assertion of
Akamigbo (1984) that soils of Southeastern Nigeria are low in silt as a result of the high degree and extent of weathering and leaching they have undergone. Clay content ranged from 5 % in the Ap horizon (0 – 17 cm) of Umuariam to 21 % in the Bt3 horizon (141 – 180 cm) of Umulogho. Clay was generally higher in the subsoil of all the profiles studied. It was least in the topsoil, increasing down the profile, except at Umuariam where it attained a peak value in the Bt1 horizon (106 – 135 cm) and started decreasing. The higher clay content in the subsurface hori-zon may be a result of illuviation, which is diagnostic of the existence of argillic horizons (Soil Survey Staff, 2014). The bulk density ranged from 1.28 Mg/m3 in the Ap horizon (0 – 17 cm) of Umuariam to 1.61 Mg/m3 in the Bt2 (114 – 141 cm) and Bt3 horizons (170 – 180 cm) of Umulogho and
Madueke et al. NJSS 31 (2) 2021 1-9
4
Umuariam respectively. In all the constituent horizons, bulk density was below the value quoted as the minimum bulk density at which root-restricting conditions will occur on sandy loam soils (1.75 – 1.80 Mg/m3) (USDA-NRCS,
1996), sand (1.6 Mg/m3), and clay (1.4 Mg/m3) (Donahue et al., 1990). The low bulk density showed that the soils were not compacted (Esu and Ojanuga, 1986).
Hor.
Depth (cm)
Moisture Content (%)
Particle Size Distribution Bulk Density (Mg/m3)
Porosity
S. H. C. (cm/s) San
d (%)
Silt (%)
Clay (%)
Textural Class
Umuariam – Upper Slope
Ap 0-17 0.96 94 1 5 Sand 1.28 51.55 2.38
A2 17-35 0.93 88 1 11 Loamy Sand 1.33 49.89 2.27
A3 35-46 0.93 87 2 11 Loamy Sand 1.36 48.60 1.62
AB 46-106 2.68 83 1 16 Sandy Loam 1.41 46.83 1.41
Bt1 106-135 4.50 81 1 18 Sandy Loam 1.44 45.58 1.08
Bt2 135-170 3.77 83 1 16 Sandy Loam 1.42 46.60 0.76
Bt3 170-180 2.86 83 1 16 Sandy Loam 1.61 39.28 0.43
Umulogho – Mid Slope
Ap 0-38 0.85 93 1 6 Sand 1.34 49.43 6.49
A2 38-53 0.92 93 1 6 Sand 1.46 44.87 5.30
A3 53-64 2.78 89 2 10 Loamy Sand 1.42 46.53 3.78
BA 64-95 2.65 88 2 10 Loamy Sand 1.44 45.70 2.49
Bt1 95-114 6.86 80 2 19 Sandy Loam 1.42 46.53 0.32
Bt2 114-141 7.55 79 1 20 Sandy Clay Loam 1.61 39.25 0.22
Bt3 141-180 7.92 78 1 21 Sandy Clay Loam 1.59 39.85 0.05
Umungwa – Foot Slope
Ap 0-16 0.85 91 1 8 Sand 1.49 43.66 4.00
A2 16-65 0.89 92 1 8 Sand 1.51 42.87 2.59
BA 65-94 0.92 89 1 10 Loamy Sand 1.52 42.79 2.27
B1 94-140 0.93 89 1 10 Loamy Sand 1.52 42.53 1.73
B2 140-175 1.87 88 1 11 Loamy Sand 1.53 42.43 1.41
B3 175-180 1.79 88 1 11 Loamy Sand 1.59 39.85 1.19
Table 2: Physical Properties of Soils of the Study Area
Hor. = Horizon, S.H.C. = Saturated Hydraulic Conductivity
Saturated hydraulic conductivity ranged from 0.05 cm/s in the Bt3 (141 – 180 cm) horizon of Umulogho to 6.49 cm/s in the Ap horizon (0 – 38 cm) of Umulogho, with a mean value of 2.09 cm/s. It was generally highest in the topsoil, decreasing down the profile, as also reported by Igwe and Akamigbo (2001) and Oguike and Mbagwu (2009). This was generally due to the lower bulk density and clay con-tent of topsoil.
3.3 Chemical Properties The chemical properties of soils are shown in Table 3. The pH ranged from 4.19 (very strongly acidic) in the Bt3 hori-zon (170 – 180 cm) of Umuariam to 6.51 (moderately acidic) in the Ap horizon (0 – 16 cm) of Umungwa. This relatively low soil pH, as also reported by Akpa et al. (2019), is characteristic of soils in Southeastern Nigeria and may be attributed to the acidic nature of the parent rocks, coupled with the influence of the leached profile under high annual rainfall condition. The soil organic mat-ter content ranged from 0.69 % in the Bt3 horizon (170 - 180 cm) of Umuariam to 5.15 % in the Ap horizon (0 - 38 cm) of Umulogho. Similarly, Brady and Weil (2016) re-ported that the topsoil of most cultivable soils contains 1 – 6 % organic matter. Total Nitrogen ranged from 0.04 % in the Bt2 (135 – 170 cm) and Bt3 horizon (170 – 180 cm) of Umuariam to 0.22 % in the Ap horizon (0 – 38 cm) of Umulogho. The low total nitrogen is a common phenome-non in the soils of Southeastern Nigeria and is a result of the high nitrogen losses sustained through the leaching of nitrates, as well as the rapid mineralization of organic mat-ter in the humid tropics. The soils were acutely deficient in available phosphorus (< 3.0 ppm), except for the topsoil where it was marginal (6.5 – 13.0 ppm). The moderate to low available phosphorus
concentration is, however, a widespread phenomenon in the humid tropical soils of Southeastern Nigeria and can be attributed to the high phosphate fixation capacity of these soils. The ECEC of the soils ranged from 1.57 cmol/kg in the Ap horizon (0 - 38 cm) of Umulogho to 2.54 cmol/kg in the Bt2 horizon (114 – 141 cm) of Umulogho. This low ECEC is in line with the assertion by Osuji et al. (2002) that soils formed on Coastal Plain Sands and sandstones are acidic, low in CEC, base saturation, and fertility levels. Exchangeable Calcium was generally low (< 4 cmol/kg). Exchangeable magnesium was also low (< 0.5 cmol/kg). This low concentration is characteristic of the soils of Southeastern Nigeria. It can be attributed to the acidic na-ture of the parent rocks, coupled with the influence of the leached profile under the high annual rainfall condition of the region. Potassium concentration was low to moderate (< 0.6 cmol/kg). Similarly, Osemwota et al. (2005) reported low potassium reserve in soils formed from Coastal Plain Sands in Central Southern Nigeria. This low potassium con-centration may be attributed to the fact that there is general-ly a low potassium reserve in acid sands. This is necessitat-ed by the highly mobile nature of exchangeable potassium relative to calcium and magnesium and its consequent mas-sive loss through leaching. Sodium concentration was gen-erally low (< 1.0 cmol/kg). As such, none of the soils can be classified as sodic or alkaline soils. Exchangeable aluminum was low in the topsoils. It ranged from 0.20 cmol/kg in the B2 horizon (140 – 175 cm) of Umungwa to 1.25 cmol/kg in the Bt2 horizon (114 – 141 cm) of Umulogho. Aluminum saturation ranged from 11 % in the B3 horizon (175 – 180 cm) of Umungwa to 49 % in the A3 horizon (35 – 46 cm) of Umuariam. Sanchez (1976) reported that there is less than 1.0 ppm aluminum in the soil solution when aluminum saturation is less than 60 % but
Evaluation of soils on a toposequence formed from the coastal plain sands of the Imo river basin, Southeastern Nigeria
5
rises sharply when aluminum saturation increases beyond 60 %. As such, due to the low aluminum saturation (< 60%) in the soils, there is little risk of aluminum concentration attain-ing toxic levels. Base saturation generally ranged from as low as 24 % in the Bt2 horizon (114 – 141 cm) of Umulogho to 51 % in the Ap
horizon (0 – 16 cm) of Umungwa. Base saturation was gen-erally highest in the topsoil. This may be attributed to the positive correlation that exists between pH and base satura-tion. As such, the decrease of base saturation with increas-ing depth is attributable to pH, which tended to decrease with increasing depth.
H or
.
Dep
th
pH
O
rg
. C
(% )
Or
g.
Ma
t.
(% )
To
t.
N
(% )
C:
N
Ra
-ti
o
Ava
. P
(p
pm
)
Ex.
Ba
ses
(cm
ol/
kg
) E
x.
Acid
. (c
mo
l/k
g)
EC
EC
(c
mo
l/k
g)
Cla
y
Acti
vit
y
(cm
ol/
kg
)
Ba
se
Sa
t. (% )
Al
Sa
t.
( % )
E S P
( % )
E P P
( % )
K:
Mg
R
a-
tio
Ca
: M
g
Ra
-ti
o
EC
(m
mh
o/
m x
10
-2)
H2
O
KC
l C
a
Mg
K
Na
Al
H
Um
ua
ria
m –
Co
ast
al
Pla
in S
an
ds
(To
p S
lop
e)
A p
0-1
7
5.2
9
4.8
7
2.3
8
4.1
0
0.1
7
14
:1
6.5
3
0.2
1
0.1
0
0.3
0
0.1
7
0.6
0
0.5
1
1.8
9
21.0
0
41
32
9
16
3:
1
2:
1
11.2
6
A 2
17-3
5
5.3
8
4.9
0
1.7
0
2.9
3
0.1
3
13
:1
3.7
3
0.1
8
0.1
0
0.4
4
0.1
2
0.9
0
0.3
5
2.0
9
19.0
0
40
43
6
21
9:
2
2:
1
9.8
4
A 3
35-4
6
5.3
6
4.8
6
1.6
6
2.8
6
0.1
3
13
:1
4.6
6
0.1
4
0.0
9
0.3
4
0.1
1
0.9
0
0.2
4
1.8
2
18.2
0
37
49
6
19
4:
1
3:
2
13.5
9
A B
46-1
06
5.3
6
4.7
7
1.5
5
2.6
7
0.1
2
13
:1
1.8
7
0.1
3
0.0
9
0.4
3
0.1
3
0.7
2
0.8
4
2.3
4
14.6
3
33
31
6
18
5:
1
4:
3
8.5
2
Bt
1
106-
135
4.9
2
4.8
3
0.5
0
0.8
6
0.1
4
13
:1
2.8
0
0.1
3
0.0
8
0.4
8
0.1
6
0.6
6
0.9
8
2.4
9
13.8
3
34
27
6
19
6:
1
3:
2
8.3
2
Bt
2
135-
170
4.9
2
4.8
3
0.4
5
0.7
8
0.0
4
11
:1
1.8
7
0.1
2
0.0
8
0.2
8
0.0
8
0.3
0
1.0
2
1.8
8
11.7
5
30
16
4
15
7:
2
3:
2
5.5
5
Bt
3
170-
180
4.1
9
4.8
7
0.4
0
0.6
9
0.0
4
10
:1
1.8
7
0.1
2
0.1
0
0.2
3
0.0
7
0.8
7
0.4
2
1.8
1
11.3
1
29
48
4
13
9:
4
6:
5
4.1
3
Um
ulo
gh
o (
Mid
Slo
pe)
A p
0-3
8
5.9
6
5.7
2
2.9
9
5.1
5
0.2
2
14
:1
9.3
3
0.2
5
0.1
4
0.2
4
0.1
0
0.4
1
0.4
3
1.5
7
26.1
7
46
26
6
15
5:
3
2:
1
13.7
6
A 2
38-5
3
5.6
5
5.1
6
2.2
0
3.7
9
0.1
4
9:1
4
.66
0.2
5
0.1
0
0.3
0
0.1
3
0.5
0
0.6
2
1.9
0
31.6
7
41
26
7
16
3:
1
5:
2
6.0
4
A 3
53-6
4
5.4
0
5.0
1
1.5
0
2.5
9
0.1
1
14
:1
6.5
3
0.1
7
0.0
9
0.3
3
0.1
0
0.5
3
0.5
3
1.7
5
17.5
0
39
30
6
19
11
: 3
2:
1
3.6
5
B A
64-9
5
5.2
0
4.8
3
1.3
0
2.2
4
0.1
0
13
:1
1.8
7
0.1
7
0.1
0
0.2
7
0.0
9
0.8
3
0.5
3
1.9
9
19.9
0
32
42
5
14
8:
3
5:
3
3.3
7
Bt
1
95-1
14
5.0
9
4.7
8
1.3
0
2.2
4
0.1
1
12
:1
1.8
7
0.1
4
0.0
8
0.3
8
0.1
0
1.1
0
0.6
2
2.4
2
12.7
4
29
45
4
16
5:
1
2:
1
2.4
9
Bt
2
114-
141
4.9
0
4.7
8
0.7
2
1.2
4
0.0
6
12
:1
1.8
7
0.1
0
0.0
7
0.3
6
0.0
9
1.2
5
0.6
7
2.5
4
12.1
0
24
49
4
14
5:
1
4:
3
2.9
6
Bt
3
141-
180
4.9
4
4.7
8
0.6
5
1.1
2
0.0
6
11
:1
1.8
7
0.1
3
0.0
7
0.3
7
0.1
0
1.1
1
0.8
2
2.6
0
11.8
2
26
43
4
14
4:
1
2:
1
2.7
5
Um
un
gw
a (
Foo
t S
lop
e)
A p
0-1
6
6.5
1
5.7
7
1.7
0
2.9
3
0.1
2
14
:1
11.1
9
0.3
8
0.1
1
0.2
8
0.0
9
0.4
5
0.3
8
1.6
9
33.8
0
51
27
5
17
5:
2
7:
2
5.2
9
A 2
16-6
5
5.6
0
5.0
0
1.4
0
2.4
1
0.1
0
14
:1
4.6
6
0.2
8
0.1
0
0.3
0
0.1
0
0.4
5
0.6
8
1.9
1
23.8
8
41
24
5
16
3:
1
3:
1
2.1
9
B A
65-9
4
5.1
6
4.8
1
1.3
0
2.2
4
0.1
0
13
:1
2.8
0
0.2
0
0.0
9
0.3
2
0.1
0
0.5
1
0.9
6
2.1
8
21.8
0
33
23
5
15
7:
2
11
: 5
1.1
3
B 1
94-1
40
5.1
7
4.8
1
1.2
0
2.0
7
0.1
0
12
:1
2.8
0
0.1
7
0.0
8
0.2
8
0.0
8
0.5
7
0.9
0
2.0
8
18.9
1
29
27
4
13
7:
2
2:
1
1.3
3
B 2
140-
175
5.1
7
4.8
1
1.1
0
1.9
0
0.0
9
12
:1
2.8
0
0.1
6
0.1
0
0.3
0
0.1
0
0.2
5
0.9
9
1.9
0
17.2
7
35
13
5
16
3:
1
3:
2
1.1
4
B 3
175-
180
5.0
9
4.8
1
0.5
5
0.9
5
0.0
5
11
:1
2.8
0
0.1
3
0.0
7
0.3
9
0.1
0
0.2
0
0.9
0
1.7
9
16.2
7
39
11
6
22
11
: 2
2:
1
1.6
6
Ho
r. =
Ho
rizo
n,
EC
EC
= E
ffec
tive
Cat
ion E
xchange
Cap
acit
y,
Ex.
Acid
. =
Exchange
Acid
ity,
ES
P =
Exchangea
ble
So
diu
m P
erce
nta
ge
, E
PP
= E
xchangea
ble
po
tass
ium
Per
centa
ge,
EC
= E
lect
rical
Co
nduct
ivit
y,
Ca
= C
alc
ium
, M
g =
Mag
nesi
-
um
, K
= P
ota
ssiu
m,
Na
= S
odiu
m,
KC
l =
Pota
ssiu
m C
hlo
ride,
H2O
=W
ater
, O
rg. C
= O
rgan
ic C
arbo
n,
Org
. M
at. =
Org
anic
Mat
ter,
Tot.
N =
Tota
l N
itro
gen
, A
va.
P =
Avail
able
Pho
spho
rus
Tab
le 3
: C
hem
ical
Pro
per
ties
of
the
Stu
dy A
rea
Madueke et al. NJSS 31 (2) 2021 1-9
6
3.4 Soil Classification 3.4.1 Taxonomic and WRB Classification The soils of Upper Slope (Umuariam) and Mid Slope (Umulogho) were classified as Typic Hapludults (Chromic Acrisols), while that of Foot Slope (Umungwa) was classi-fied as Typic Udipsamments (Rubic Arenosols) (Table 4). 3.4.2 USDA Land Capability Classification Soils on the Coastal Plain Sands (Mid Slope and Foot Slope) had moderate susceptibility to erosion and subsoil permeability but were generally classified as IVs due to their sandy topsoil texture. Umuariam, on the Upper Slope, was placed in class IIes due to its moderate suscep-tibility to erosion, subsoil permeability, and loamy sand topsoil texture. 3.4.3 USBR Land Capability Classification The soils of Upper Slope (Umuariam), Mid Slope (Umulogho), and Foot Slope (Umungwa) all met the mini-mum soil, topographic, and drainage requirements to war-rant placement in class 1 of irrigable lands, but for the textural limitation. Owing to the loamy sand topsoil tex-ture recorded at Umuariam, it was placed in class 2 of irri-gable lands, with the classification 2v/C. Umulogho and Umungwa, with sandy topsoil texture, were placed in class 3 (3v/C). 3.4.4 Land Use and Management Recommendations The land use recommendations of the soils on the different physiographic positions are shown in Table 4. Brady and Weil (2016) reported that soils of capability classes I to IV are suitable for intense grazing, forestry, wildlife, water supply, aesthetic purposes, and different intensities of ara-ble crop production. As such, being of classes II and IV the soils of the study area can be said to be suitable for the afore-mentioned land uses. Also, since the soils all had an exchangeable sodium per-centage of less than 15 % and electrical conductivity of less than 4000 Umho/cm, the soils are not at risk of be-coming sodic or saline. Similarly, since the exchangeable potassium percentage (EPP) is less than 25 %, the soils are not potassium-rich enough to negatively affect crop growth and soil structural stability. They all also had EPP of more than 2 % - which is the minimum level to avoid potassium deficiency in the humid tropics.
Upper Slope (Umuariam): This is a soil of USDA land capability class II. It is suitable for intense cultivation. As soils of USBR land capability class of 2v/C, it is moderately irrigable. Most arable crops are grown in Southeastern Nigeria (e.g., yam, cassava, maize, okra, and fluted pumpkins, etc.), can be sustainably grown here. The soil, however, requires moderate conserva-tion measures geared towards improving subsoil po-rosity and permeability and curbing water erosion. As such, high organic manure input, contour ridging, and minimum tillage are recommended. This is in line with the assertion of Brady and Weil (2016) that though Acrisols (Ultisols) are not fertile soils, they respond to good management and can be quite pro-ductive where adequate levels of fertilizers and lime are applied. Furthermore, FAO (2001) recommended that undemanding, acid-tolerant cash crops such as oil palm, pineapple, cashew, or rubber can be grown on Acrisols. Umuariam had a K: Mg ratio of greater than 2: 1, which inhibits Mg uptake. They consequently require the increased application of Mg fertilizers, relative to K fertilizers. Due to topsoil Ca: Mg ratio of 3: 1 to 4: 1, Umuariam met the optimum approximate Ca: Mg ratio for most crops.
Mid Slope (Umulogho): As soils of USDA land capa-bility class IV, this soil is marginally suitable for ara-ble crop production due to its sandy topsoil texture. The soils are of USBR land capability class 3v/C and are classified as marginally irrigable soils. There is a limited range of crops that can be substantially grown on these soils, though crops like yam, cassava, maize, okra, and fluted pumpkins can be grown on the soil with careful management. They require high organic matter input to improve soil available water holding capacity and curb erosion by water. Landon (2013) asserted that soils in this class (IV) are suited only for two or three common crops, or harvest produced may be low in relation to inputs over a long period. He suggested the growth of such crops as fruits, ornamen-tals, and shrubs. These soils (Class IV) are thus only suitable for limited cultivation. Similarly, FAO (2001) asserted that Acrisols are unproductive soils that must gulp down some capital investment on soil conserva-tion and productivity improvement if they are to be used for intensive food production. Umulogho soils had K: Mg ratio of less than 2: 1, therefore Mg uptake will not be inhibited.
Foot Slope (Umungwa): As soils of USDA land capa-bility class IV, this soil is marginally suitable for ara-ble crop production due to its sandy topsoil texture. The soils are of USBR land capability class 3v/C and are classified as marginally irrigable soils. Brady and Weil (2016) corroborated this when they stated that the productivity of Entisols is restricted by inadequate clay content and water availability. There is a limited range of crops that can be sustainably grown on these soils even with careful management. Similarly, FAO (2001) asserted that Arenosols in the humid tropics are best left under their natural vegetation. They, how-ever, agreed that Arenosols can be planted for peren-nial crops such as rubber, pepper, coconut, cashew, and pine, especially where good quality groundwater is within reach of the root system. Due to the ease of cultivation, rooting and harvesting of root and tuber crops on these soils, FAO (2001) also recommended growing cassava and (Bambara) groundnuts on Arenosols. More so, Brady and Weil (2016) opined that some Entisols can be quite productive if properly managed. They require high organic matter input and minimum tillage to improve soil available water hold-ing capacity and curb erosion by water. As class IV soils, like Umulogho on the -mid-slope, only a limited number and intensity of crops can be grown here, in-cluding fruits, ornamentals, and shrubs. It is conse-quently recommended that most crops grown in Southeastern Nigeria like cassava, maize, yam, and vegetables, can be grown at Umungwa but a lower intensity, and with greater organic matter and fertiliz-er input. Umungwa soil had a K: Mg ratio of greater than 2: 1, which inhibits Mg uptake. They conse-quently require an increase in the application of Mg fertilizers, relative to K fertilizers. With a Ca: Mg ratio of less than 3: 1, Umungwa soil is likely to have inhibited P uptake. They consequently require liming or the application of Calcium-based fertilizer supple-ments.
Evaluation of soils on a toposequence formed from the coastal plain sands of the Imo river basin, Southeastern Nigeria
7
Ta
xo
no
mic
Cla
ss
WR
B/F
AO
Cla
ss
US
DA
Cla
ss
La
nd
Use
/ M
gt.
R
eco
mm
en
da
tio
ns
US
BR
Cla
ss
La
nd
Use
/ M
gt.
R
eco
mm
en
da
tio
ns
Up
per S
lop
e (U
mu
aria
m)
Typ
ic H
aplu
du
lts
Ch
rom
ic A
cris
ols
II
es
- In
ten
se s
uit
abil
ity f
or
cult
ivat
ion
-
Ad
apte
d t
o t
he
cult
ivat
ion
of
all
the
up
land
cro
ps
of
the
regio
n
- T
hey
req
uir
e h
igh o
rgan
ic m
atte
r in
pu
t/m
inim
um
to n
o-
till
age
to i
mp
rove
soil
poro
sity
, re
du
ce r
un
off
an
d
curb
wat
er e
rosi
on
.
2v
C
- M
od
erat
ely i
rrig
able
-
Req
uir
es o
rgan
ic m
atte
r in
put
and
/or
no /
min
imum
til
lage
/ gre
en m
anu
rin
g t
o i
mp
rove
avai
lab
le w
ater
hold
ing
capac
ity (
AW
C).
Mid
Slo
pe
(Um
ulo
gh
o)
Typ
ic H
aplu
du
lts
Ch
rom
ic A
cris
ols
IV
s -
Lim
ited
suit
abil
ity f
or
cult
ivat
ion
-
Lim
ited
ch
oic
e of
pla
nts
an
d c
aref
ul
man
agem
ent
re-
quir
ed
- ver
y h
igh
org
anic
mat
ter
inpu
t/m
inim
um
to n
o-t
illa
ge
isre
quir
ed t
o i
mp
rove
soil
avai
lab
le w
ater
cap
acit
y,
as w
ell
as r
edu
ce r
un
off
an
d e
rosi
on
3v
C
- M
argin
ally
irr
igab
le
- R
equir
es h
igh
inpu
t o
f org
anic
mat
ter/
min
imu
m t
o n
o-t
illa
ge
to i
mp
rove
soil
AW
C
- A
dap
ted t
o u
se o
f d
rip
irr
igat
ion
syst
em w
her
eas
mu
ch w
ater
to
mee
t p
lant
nee
d a
re s
upp
lied
at
any p
arti
cula
r m
om
ent
in t
ime,
an
d n
ot
more
-
crop
s gro
wn
are
red
uce
d t
o t
hose
adap
ted
to s
uch
cond
itio
ns
Foo
t S
lop
e (
Um
un
gw
a)
Typ
ic U
di-
psa
mm
ents
R
ub
ic A
ren
oso
ls
IVs
- B
ein
g i
s C
lass
IV
s, i
t h
as l
imit
atio
ns
and
lan
d u
ses
sim
i-la
r to
th
ose
of
Um
ulo
gh
o (
AB
OV
E).
3
v
C
- B
ein
g i
n t
he
sam
e cl
ass
as U
mu
logho,
they
are
both
ass
um
ed
to h
ave
sim
ilar
lim
itat
ion
s an
d l
and
use
s (S
EE
UM
U-
LO
GH
O).
Tab
le 4
: L
and
Use
Rec
om
men
dat
ions
of
So
ils
of
the
Stu
dy A
rea
Madueke et al. NJSS 31 (2) 2021 1-9
8
4.0. Conclusion
The soils of the Upper Slope (Umuariam) and the Mid Slope (Umulogho) were classified as Typic Hapludults (Chromic Acrisols), while that of the Foot Slope (Umungwa) was classified as Typic Udipsamments (Rubic Arenosols). The Upper Slope (Umuariam) had a USDA land capability class of IIes and a USBR land capability class of 2v/C. The Upper Slope (Umuariam) and the Mid Slope (Umulogho) both had a USDA and USBR capability class of IVs and 3v/C respectively. These soils are suitable for such land uses as intense grazing, forestry, wildlife, water supply, aesthetic purposes, and different intensities of arable crop production. However, if the soils are to pro-duce increased and sustainable agricultural yield, devoid of further environmental degradation, the appropriate land use, and husbandry practices should be adopted, with par-ticular reference to erosion control, organic manure, lime, and fertilizer application.
References
Abam, P.O. and Orji, O.A. (2019) Morphological and Physicochemical properties of soils formed from di-verse parent materials in Cross River State, Nigeria. IOSR Journal of Applied Geology and Geophysics (IOSR-JAGG), 7 (1): 1 – 7
Akamigbo, F.O.R. (1984). The accuracy of field texture in a humid tropical environment. Soil Survey and Land Evaluation 493: 63-70.
Akpa, E. A., Eyong, M. O., Afu, S. M. andOlim, D. M. (2019)Hydraulic Properties of Soils of Akani Esuk Orok in Calabar, Cross River State, Nigeria. World News of Natural Sciences, 22: 102 – 109
Arshad, M.A., Lowery, B. and Grossman, B. (1996) Phys-ical tests for monitoring soil quality. Pp. 123-142. In: J.W. Doran and A.J. Jones (eds.) Methods for as-sessing soil quality. Soil Science Society of America Special Publication 49. SSSA, Madison, W.I.
Brady, N.C., and Weil, R.R. (2016) Nature and properties of soils (15th ed.). Columbus: Pearson Education, Inc. 1104 pp.
Bremner, J. M and Mulvaney, G. S. (1982) Nitrogen total. In: A. L. Page, R. H. Miller, and D. R. Keeney, (eds.) Methods of soil analysis. Parts 2. American Society of Agronomy, No, 9, Madison, WIS Pp. 595-624.
Chikezie, I.A., Eswaran, H., Asawalam, D.O. and Ano, A.O. (2010) Characterization of two benchmark soils of contrasting parent materials in Abia state, South-eastern Nigeria. Global Journal of Pure and Applied Sciences, 16 (1): 23 – 29.
Donahue, R.L., Miller, R.W. and Shickluna, J.C. (1990) Soils: An introduction to soil and plant growth (5th ed.). New Delhi: Prentice Hall of India. 667 pp.
Esu, I.E. (2004) Soil characterization and mapping for food security and sustainable environment in Nigeria. A Keynote address was presented at the 29th Annual Conference of the Soil Science Society of Nigeria held at the University of Agriculture, Abeokuta Nigeria. Pp. 9-18.
Esu, I.E. and Ojanuga, A.G. (1986) Soil characterization studies within the natural levees of River Kaduna, Nigeria. Nigerian Journal of Soil Science 6: 1-13.
Fagbami, A.A. and Ogunkunle, O.O. (2000) Soil survey, land evaluation, and agronomy: The Nigerian case study. In: Agronomy of Nigeria. Pp. 165-173.
FAO (2001) Lecture notes on the major soils of the world. In: P. Driessen, J. Deckers and F. Nachtergaele (eds.). Rome: Food and Agriculture Organisation of the United Nations.
FAO (2006) Guidelines for soil description (4th ed.). Rome: Food and Agriculture Organization of the United Nations. 97 pp.
FAO (2015) Sustainable soil management: Key to food security and nutrition in Africa. Nature & Faune, 30 (1): 1 – 119. Accra: Food and Agriculture Organiza-tion of the United Nations.
Gee, G. W. and Bauder, J. W. (1986). Particle size analy-sis. In: A. Klute (ed.) Methods of soil analysis (Part 1) American Society of Agronomy, Madison, WIS. pp: 91-100
Igbozuruike, M. U. (1975). Vegetation types. In: Nigeria in maps: Eastern States. G. E. K. Ofomata (ed.). Benin City: Ethiope Publishing. Pp. 30-32.
Igwe, C.A. and Akamigbo, F.O.R. (2001) Application of topo maps and aerial photo interpretation in a detailed soil survey for irrigation purposes in a derived savan-na zone of Southeastern Nigeria. In: Proceedings of the 27th Annual Conference of the Soil Science Society of Nigeria held at University of Calabar, Nigeria. Pp.18-28.
International Institute for Tropical Agriculture [IITA] (1979) Selected methods for soil and plant analysis. IITA Manual Series No. 1. IITA Ibadan, Nigeria. 71pp.
IUSS (2006) World reference base for soil resources 2006. World Soil Resources Reports No. 103. Rome: Food and Agriculture Organization of the United Nations.
Jackson, M.L. (1962) Soil chemical analysis. New York: Prentice-Hall Inc. 498 pp.
Klingebiel, A.A. and Montgomery, P.H. (1961) Land ca-pability classification. Agricultural Handbook 210, Soil Conservation Service. Washington, D.C.: U.S. Govt. Printing Office. 21 pp.
Landon, J.R. (ed.) (2013) Booker tropical soil manual: A handbook for survey and agricultural land evaluation in the tropics and subtropics. Oxon: Routledge. 474 pp.
Madueke, C.O. (2010) Characterization, classification, and land use recommendations of selected soils in parts of Imo River Basin in Southeastern Nigeria. An M. Sc. thesis submitted to the Postgraduate School, Federal University of Technology, Owerri, Imo State, Nigeria. [Accessed on 12/01/2020 from https://futospace.futo.edu.ng/bitstream/handle/123456789/2911/MADUEKE_CLASSIFICATION_2010.pdf?sequence=1&isAllowed=y]
Mclean, E.V. (1982) Aluminum. In: A.L. Page, R.H. Mil-ler and D.R. Keeney (eds.) Methods of soil analysis (Parts 2). America Society of Agronomy, Madison, WIS. Pp 978-998.
McWhorter, D.B. and Sunda, D.K. (1977) Ground-water hydrology and hydraulics. Fort Collins: Water Re-sources Publications. Pp. 79-80.
Monanu, P. C. (1975) Humidity. In: G.E.K. Ofomata (ed.)
Evaluation of soils on a toposequence formed from the coastal plain sands of the Imo river basin, Southeastern Nigeria
9
Nigeria in maps: Eastern States. Benin City: Ethiope Publishing House. Pp. 19-21.
Nelson, D. W., and Sommers, L. E. (1982) Total carbon, organic carbon and organic matter. In: A. L. Page, R. H. Miller and D. R. Keeney (eds.) Methods of soil analysis (Part 2). American Society of Agronomy. Madison, WIS. Pp. 539-599.
Obi, J.C. (2015) Prediction of characteristics of coastal plain soils using terrain attributes. Agro-Science Journal of Tropical Agriculture, Food, Environment and Extension, 14 (3): 22 – 26.
Oguike, P.C. and Mbagwu, J.S.C. (2009)Variations in some physical properties and organic matter content of soils of Coastal Plain Sand under different land-use types.World Journal of Agricultural Sciences 5 (1): 63 – 69.
Olsen, S. R., and Somers, L.E. (1982) Phosphorus. In: A. L. Page, R. H. Miller and D. R. Keeney (eds.) Methods of soil analysis (Part 2). American Society of Agronomy, MadisonWIS, Pp 403-430.
Orajaka, S. O. (1975) Geology. In: G.E.K. Ofomata (ed.) Nigeria in maps: Eastern states. Benin City: Ethiope Publishing House. Pp. 5-7.
Osemwota, I.0., Izevbigie, A., Ogboghodo, I.A. and Agh-irnien, E.A. (2005) Different forms of potassium in some soils of central southern Nigeria. Indian Journal of. Agri-cultural Research, 39 (4): 249 – 255.
Osuji, G.E., Eshett, E.T., Oti, N.N. and Ibeawuchi, I.I. (2002)
Land use practices and the predisposition of selected watersheds in Imo State to erosion. In: Proceedings of the 36th Annual Conference of the Agricultural Society of Nigeria held at Federal University of Technology, Owerri, Nigeria. Pp. 397-401.
Osujieke, D.N., Imadojemu, P.E., Okon, M.A., andOkeke, O.M. (2018) Profile Distribution of Physical and Chemi-cal Soil Properties in Izombe, Rainforest Zone of Nige-ria. Bulgarian Journal of Soil Science, 3 (2): 90 – 103.
Sanchez, P.A. (1976) Properties and management of soils in the tropics. New York: John Wiley and Sons. 618 pp.
Soil Survey Staff (2014) Keys to soil taxonomy (12th ed.). Washington, DC: Natural Resources Conservation Ser-vice, United States Department of Agriculture (USDA). 359pp.
USBR [United States Bureau of Land Reclamation] (1953) Land classification handbook. US Department of Interi-or Publication V, Part 2. 53 pp.
USDA-NCRS (1996) Soil quality information sheet – Soil quality indicators: Aggregate stability. Prepared by the National Soil Survey Centre in conjunction with the Soil Quality Department of the Natural Resource Conserva-tion Centre (NCRS) and National Soil Tilth Laboratory of the United States Department of Agriculture (USDA).
Vomocil, J.A. (1965) Porosity. In: C.A. Black (ed.) Methods of soil analysis (Part 1). American Society of Agronomy 9: 99-314.
Madueke et al. NJSS 31 (2) 2021 1-9