Embed Size (px)
Citation preview
THE EFFECT OF CAPITAL STRUCTURE ON PERFORMANCE OF BANKS IN GHANA
KWAME NKRUMAH UNIVERSITY OF SCIENCE AND TECHNOLOGY, KUMASI.
SCHOOL OF BUSINESS
By
ANAMAN MARGARET DANSOA
A Thesis Submitted to the School of Business,
Kwame Nkrumah University of Science and Technology in Partial Fulfillment of the Requirements for
the Degree
Of
MASTER OF BUSINESS ADMINISTRATION
June, 2011
i
ABSTRACT
This study aims to find the impact of the capital structure on performance of banks in Ghana.
Existing literatures conclude that, capital structure of a firm has impact on the performance of the
firm. The study uses ROE as performance indicator; the researcher employs the uses of
correlation analysis by using the Pearson correlation coefficient to find the multicollinearity
among the variables used. Regression analysis was use to find the impact or the contribution of
each of the variables used. It was found that banks in Ghana uses leverage in its financing and
was noted that, banks in Ghana operates above its minimum requirements stated by the bank. It
became evidently known through the analysis that, short term debt contributes higher to the
performance of banks. the higher the short term debt of the bank, the higher its performance.
However long term debt financing was also recorded to have a positive impact on the
profitability of the bank even though it is minimal. Moreover, the findings show that, assets held
by banks increase its profitability if managed efficiently. The research is aimed to be added to
the existing literature on the capital structure and performance.
ii

DECLARATION
I hereby declare that this submission is my own work towards the award of master of Business
Administration and that to the best of my knowledge it contains no material previously published
by another person nor material which has been accepted for the award of any other degree of the
University except where due acknowledgement has been made in the text.
ANAMAN MARGARET DANSOA ------------------------------ ----------------
Signature Date
MR, NEWLOVE G. ASAMOAH ------------------------------ ----------------
(Supervisor) Signature Date
------------------------------- ------------------------------ ----------------
Head of Department Signature Date
iii

DEDICATION
This project is dedicated to my parents, siblings and friends for their love and care throughout
this course.
iv

ACKNOWLEDGEMENT
I express my profound gratitude to the Almighty God for seeing me through this course. I would
also like express special appreciation to my supervisor, Mr. Newlove G. Asamoah for his
penetrating criticism, guidance, and unceasing assistance in every aspect of my work.
Recognition is given to all the academic facilitators who taught me during the two years master’s
program.
I also thank Price water house coopers for their help in gathering my data for this project.
v

Table of Contents
ABSTRACT………………………………………………………………………………………………………………...iiDECLARATION........................................................................................................................iii
DEDICATION............................................................................................................................iv
ACKNOWLEDGEMENT...........................................................................................................v
Table of Contents........................................................................................................................vi
LIST OF TABLES......................................................................................................................ix
CHAPTER ONE INTRODUCTION.......................................................................................1
1.2 Problem Statement.................................................................................................................3
1.3 Objectives of the Study..........................................................................................................4
1.4. Research Questions...............................................................................................................5
1.5 Justification of the Study........................................................................................................5
1.6 Scope of the study..................................................................................................................6
1.7 Overview of the Research Methodology...............................................................................7
1.8 Organisation of the Study......................................................................................................7
1.9 Limitations of the Study.........................................................................................................8
CHAPTER TWO LITERATURE REVIEW..........................................................................9
Introduction..................................................................................................................................9
2.1 Performance Theory...............................................................................................................9
2.2 Capital structure theory........................................................................................................11
2.2.1 Static Trade-Off Theory....................................................................................................11
2.2.2 Agency Cost Theory.........................................................................................................14
2.2.3 Information Asymmetry Theory.......................................................................................15
2.2.4 Capital Structure Life Stage Theory and Performance.....................................................16
2.2.5 Pecking Order Theory.......................................................................................................17
2.3 Strategic Management Research and Capital Structure.......................................................18
vi

2.4 Overview of the banking industry in Ghana........................................................................21
2.4.1 Recent Developments, Structure and Regulation............................................................24
CHAPTER THREE METHODOLOGY...............................................................................26
Introduction................................................................................................................................26
3.1 The Research Paradigm.......................................................................................................26
3.2 The Research Method..........................................................................................................27
3.2.1 The Study Population........................................................................................................27
3.2.2 Sampling Techniques........................................................................................................27
3.2.3 Sample Size.......................................................................................................................27
3.2.4 Data Source and Collection Method.................................................................................28
3.3 Data Analysis.......................................................................................................................28
3.4 Proposed Model Used for the Study....................................................................................29
3.4.1 The proposed model is outlined below.............................................................................29
3.4.2 Research Variables............................................................................................................30
3.4.3 Variables Rationalization..................................................................................................31
3.4.4 Predictor or Explanatory Variables...................................................................................31
3.4.5 Control Variables..............................................................................................................32
3.5 Hausman Specification Test.................................................................................................34
3.6 Pearson Correlation Coefficients.........................................................................................35
CHAPTER FOUR DATA PRESENTATION, ANALYSIS AND DICUSSIONS..............36
Introduction................................................................................................................................36
4.1 Descriptive Statistics............................................................................................................36
4.2 Pearson Correlation Analysis...............................................................................................38
4.3 Regression Results from Stata 10 Output............................................................................41
4.3.1 Discussions from Model One on Bank Performance, Bank Capital and the Control Variables....................................................................................................................................43
4.3.2 Discussions on Model Two on Bank Performance, Short – term Debt and Control Variables....................................................................................................................................47
4.3.3 Discussions of Mode Three on Bank Performance, Long-term Debt and the Control Variables....................................................................................................................................50
vii
4.3.3 Discussions of Model Four on Bank Performance, Total Debt and the Control Variables....................................................................................................................................................53
CHAPTER FIVE FINDINGS, CONCLUSIONS AND RECOMMENDATIONS............54
Introduction................................................................................................................................54
5.1 Findings................................................................................................................................54
5.1.1 Key findings......................................................................................................................54
5.2 Conclusions..........................................................................................................................56
5.3 Recommendations................................................................................................................56
References..................................................................................................................................58
viii

LIST OF TABLES
Table 4.1 Descriptive Statistics of Variables …………………………………………………38
Table 4.2: Pearson Correlation Coefficients ………………………………………………….39
Table 4.3A: Regression Result for Model One, with Total Assets …………………………..41
Table 4.3B: Regression Result for Model One, with Loans and Investments ……………….42
Table 4.4A: Regression Result for Model Two, with Total Assets ………………………….45
Table 4.4B: Regression Result for Model Two, with Loans and Investments ………………46
Table 4.5A: Regression Result for Model Three, with Total Assets ………………………..48
Table 4.5B: Regression Result for Model One, with Loans and Investments ………………49
Table 4.6A: Regression Result for Model Four, with Total Assets …………………………51
Table 4.6B: Regression Result for Model Four, with Loans and Investments ……………..52
ix

CHAPTER ONE
INTRODUCTION
1.1 Background Study
A firm’s performance is very important for different groups of people. All agents that have made
financial decisions about companies were concerned with its financial position and its
performance. Thus, owners, managers, potential investors, banks, other financial institutions,
creditors, business partners, employees, and government had been interested in the capital
structure of the company in order to analyse and predict its performance. Much of the ground-
breaking work in the field of corporate finance focused on why firms chose differing proportions
of debt and equity to finance their operations. Perhaps the most famous work in this field was the
arbitrage argument of Modigliani and Miller (1958) which spawned a flood of research in the
area of capital structure.
Most capital structure researches have been concentrated on the search for an optimal capital
structure. Three main theories have been subsequently advanced: Pecking Order (POH), Agency
Cost (ATF) and Static Trade-off (tax based). Pecking order theory ( information asymmetry
theory) states that firms prefer to finance new investment, first from internally with retained
earnings , then with debt , and finally with an issue of new equity (Myers,1984). The agency cost
of capital structure states that an optimal capital structure will be determined by minimizing the
cost arising from conflict between the parties involved. Even in the absence of agency problems
the presence of asymmetric information may cause firms to under invest – which in itself is a
source of inefficiency (Myers and Majluf 1984). The existence of asymmetric information is the
root cause of these inefficiencies (Brooks and Davidson, 2003).
1

Five major sub-theories within capital structure theory which attempt to explain why capital
structure matters and how it contributed to the overall value of the firm have emerged, however,
none of the researches had proved conclusive (Myers, 2001). One of the five sub-theories
proposed that capital structure may be influenced by the organisational life stage of a firm, as
financing needs change with the changing circumstances of the firm (Damodaran, 2001; Bender
& Ward, 1993). However, capital structure theory and performance theory are generally
approached in isolation. Capital structure research has typically been carried out by researchers
with a background in corporate finance or economics, while performance has evolved out of
research in the field of strategic management.
While the link between capital structure and performance has been suggested by researchers on
the periphery of both fields, it appears never to have been directly tested.
Lizal (2002) states three reasons of firm’s failure: wrong asset and capital structure, wrong
financial structure, corporate governance problems. According to the neoclassical approach
liquidation is an instrument for reallocation of resources from inefficient to efficient use. By
going liquidation a firm frees the wrongly allocated resources for their more efficient use within
the same or even another industry. These come as a result of low performances of the firms.
Another reason for firm’s liquidation may be wrong financial structure, even if the asset structure
is appropriate. This means that firm goes bankrupt in the short run, even though it would
survive in the long run the quality of the capital markets is important in this case as
they could provide some support for temporarily financially constrained firms. There is also
a corporate governance problem, which often leads to liquidation, but changing the management
of the firm would be a better solution in such case. Creditors (banks, different financial
2
institutions, business partners, suppliers) are interested in predicting performance of the
company as a means of risk management. They should be able to evaluate the credit quality of
the company in order to adjust the contracts and create the appropriate reserves.
1.2 Problem Statement
The argument pertaining to the relationship of firms performance and capital structure has been
a subject of discussion of late among professionals in the financial markets since the work of
Miller (1958). Locally, various research have been made towards the finding of the optimal
capital structure and its determinants (Amidu, 2007, Boateng 2004 and Abor and Biekpe, 2004),
role of debt in Balance sheets (Aboagye, 1996), capital structure and firm’s performance (Abor,
2005 and Kyereboa-Coleman, 2007) of which these also capitalized on the optimal capital
structure. Of all these researchers only Kyereboa (2007) took into consideration the performance
of banks, yet this study takes a different look from that of Kyereboa-Coleman.
Kyereboah-Coleman (2007) sought to investigate the impact of capital structure on the
performance of microfinance institutions in Ghana and Amidu (2007) who was interested in the
determinants of capital structure of Banks in Ghana. Abor (2005) whose work actually
investigated the relationship between capital structure and profitability of listed firms on the
Ghana Stock Exchange (GSE) and;. The difference that this study sought to brings is on the basis
of the objectives as Kyereboah-Coleman (2007), limited the study to only micro-finance
institutions in Ghana and therefore did not include banks whereas this study looks at banks only,
moreover, Abor (2005), study was too broad to be applicable to the unique
3
characteristics of banks and also did not include unlisted banks. However, Amidu (2007) did not
look at the relationship between capital structure and bank performance but rather the
determinants of bank capital structure
Issues such as corporate governance, agency cost, and capital structure also play important role
because of the crucial roles played by banks in providing credit to non-financial firms, in
transmitting the effects of monetary policy, and in providing stability to the economy as a whole
( Pratomo and Ismail, 2006). These have placed strong emphasis on the need to study the
relationship between capital structure and bank performance. The researcher’s attention,
however, shall be concentrated on differences across banks and not between banks and other
firms, since banks in the proposed sample are subject to essentially equal regulatory capital and
other constraints.
1.3 Objectives of the Study
This general objective of the study is to find the correlation between capital structure and
performance of banks in Ghana, with the specific objectives being:
1. To find the leverage of Banks in Ghana, and to know whether they use more short term debt as
long term debt financing.
2. To know whether the banks operate above or below the required minimum capital adequacy
ratio
3. To examine the nature of capital structure of Banks in Ghana;
4. To examine the effect of debt financing on the performance of banks in Ghana
5. To find the effect of the total value of the bank assets to profitability
6. The association between the bank’s risk and performance
4
Hypothesis
Ho: Profitability of banks has no relationship with its capital structure.
Ha: Profitability of banks has a relationship with its capital structure
.
1.4. Research Questions
This study sought to answer the following questions to achieve the goal and objectives of the
study.
1. What is the leverage mainly used by Banks in Ghana, and does the banks use short term debt
as long term debt financing?
2. Does banks in Ghana operate below or above the required minimum capital adequacy ratio set
by the central bank?
3. What is the nature of capital structure of banks in Ghana?
4. What effects does debt financing have on performance of banks in Ghana?
5. What effect does the total value of the bank assets have on profitability?
6. Is there an association between the bank’s risk and performance?
1.5 Justification of the Study
This research provide in depth information about the behavior of capital structure and
performance of a firm as it exists today on some selected banks in the banking industry in Ghana.
As a result of the discoveries of crude oil in Ghana, it is becoming imperative that, the sector
needs huge financial inflows to invest in these areas, however, the participation of a financial
5

companies depend on the capital structure and agency cost associated with the firms and its
influences on the performance of the firm. Internal funds plays a major role in financing the
sector, nevertheless, most investors assess the performance and the capital structure of the bank
in order to assigned a contract to it due to the fact that these areas needs a huge financial capital
In addition to the above, these banks as a result of increasing their financial base to place itself in
a strategic level in order to attract foreign and local investors, capital structure and performance
have become the tool use to assess these banks as it serves as the bench mark one will used to
asses the bank to draw conclusion whether the bank has a strong capital base to support such
huge investment or not.. Thus, assessment can be based on the firms debt financing method and
its eventual effects on the performance, capital structure plays a major role for most investors
and the general banking industry to asses its performance and to know if these have a
relationship.
Capital structure and performance of a firm will play an important role to determine the healthy
of a firm that will help investors and financial educators to know the trend and stand of a
particular firm in order to attract investors. This will have an impact on the local economy if
local banks will have the needed capital to invest in this major sector of the economy of which
banks capital structure and its performance will be the sole indicator to choose which entity and
medium will be appropriate for financing.
1.6 Scope of the study
The study was conducted within the framework of the effect of capital structure on performance
of banks in Ghana. The study was carried out on selected banks who have been in operation as at
2004 and having annual report from 2004-2010, within the commercial banking license of the
6
central bank for operation. This study is not a case study approach of one particular bank;
however, it covers all other players in the banking industry to reflect in the entire industry
response to the effect of capital structure on their performance. Hence the result would be
generalized and placed in the relevant context of the performance of banks in Ghana.
1.7 Summary of Methodology
The study concentrates on the performance of some selected banks in Ghana by considering their
capital The research looks at the activities of the selected banks performances over the past five
years because it is listed on the Ghanaian stock exchange, privately owned and some have
operated for over eight years, which makes it unique. Secondary data were gathered from the
banks website as well as the Price Water-coopers to aid as a check up of figures and to ensure the
validity of these data, since the data are numeric in value, quantitative techniques were applied.
Descriptive statistics were employed to make inferences and scientific judgment on data.
Statistical analysis such as the correlation matrix and the multi variable regression models were
applied to obtained the needed results as being extensively explained in chapter three.
1.8 Organisation of the Study
The study has five chapters. Chapter one deals with the introduction of the study area. Which
comprises the background of the study, problem statement, significance. Goal and objectives,
research questions methodology, limitations and organization of the study.
7
Chapter two captures the review of relevant literature to the study. The third chapter of the study
presents detailed methodology that was used in this study.
Chapter four contains data presentation, analysis and discussion whilst the final chapter
concludes the summary of major findings, recommendations and conclusion.
1.9 Limitations of the Study
The researcher was constrained by time and financial resources and could not therefore apply
other methods of data collection aside the information on the internet and from the banks. Most
of the staff and senior managers these companies were always busy attending to customers which
make it very difficult to solicit information from them. Some of these information were sourced
from branch offices in Kumasi and their head office in Accra as well as the firm’s websites this
brought additional cost to the researcher as the researcher travelled up and down to Accra for
information.
8

CHAPTER TWO
LITERATURE REVIEW
Introduction
There has been a great deal of research into both organizational performance and capital
structure theory, but relatively little into how the two theories may relate to one another. In order
to lay a theoretical framework for our study, we review performance theory and capital structure
theory literature independently. We also explore how and why existing research suggests that
there might be a link between the two ideas.
2.1 Performance Theory
The pioneer modern theory of capital structure of a company and its relation to performance
began with the paper of Modigliani and Miller (1958). They prove that the choice of between
debt and equity financing in order to increase performance had no material effects on the value
of firm or on the cost of availability. Since, then, various studies have been directed to explore
the optimal capital structure in the absence of Modigliani-Miller’s assumption. Jensen and
Meckling (1976), for example, argue that an optimal capital structure can be obtained by trading
off the agency cost of debt against the benefit of debt to raise performance. The implication of
this argument is that firms, which have fewer opportunities for asset substitution such as banks
and mature firms, will have higher debt levels and eventually will affects its performances,
ceteris paribus. Moreover, firms which have plenty of cash inflows but have a slow growth
should have more debt. Large cash inflows without investment prospects create the resources to
consume perquisites, build empires, overpay subordinates, etc. Increasing debt reduces amount
9

of cash flows and increases manager fractional ownership of the residual claim. Jensen (1989)
predicts that the firms that have optimal capital structure should be characterized by high
leverage to aid it to perform creditably.
Previous study by Myers (1977) finds that higher leverage can mitigate conflict between
shareholders and manager concerning the choice of investment and the eventual performance of
the company. For firms that need to finance a new investment, Myers (1984) recommends using
a low risk debt than increasing equity. The reason is that if there is an asymmetric information
where investor is less well-informed than current firm insiders about the value of firm’s assets,
then it leads to a mis-priced of equity in the market. Investors do not believe on the new
profitable project and make the security is so severely undervalued.
Berger (2002) supports Myer’s argument. He argues that increasing the leverage ratio should
result in lower agency costs of outside equity and improve firm performance, all else held
constant. He suggests that under the efficiency risk hypothesis, more efficient firms choose lower
equity ratio than other firms, because higher efficiency reduce the expected costs of liquidation
and the financial distress. Higher profit efficiency may create a higher expected return for a
certain capital structure and a corresponding higher performance, and this condition does not
protect firms against future crises. Profit efficiency is strongly positively correlated with
expected return and higher expected return is substituted for equity capital to manage risks.
The empirical studies on those relationship have been conducted, among others are Titman and
Wessel (1988), Mester (1993), Pi and Timme (1993), Gorton and Rosen (1995), Mehran (1995),
McConnell and Servaes (1995) DeYoung, Spong and Sullivan (2001). Although these empirical
literatures have been successful in the sense that many of the capital structure plus some control
variables are correlated with firms’ performance.
10
Banks in the sample are subject to essentially equal regulatory constraints, and we focus on
differences across banks, not between banks and other firms. Most banks are well above the
regulatory capital minimums, and our results are based primarily on differences at the margin,
rather than the effects of regulation.
2.2 Capital structure theory
‘One of the most contentious issues in the theory of finance during the past quarter century has
been the theory of capital structure’ (Bradley et al, 1984). Even Stewart Myers, one of the
foremost researchers in the field, concluded, as recently as 2001, that ‘there is no universal
theory of the debt-equity choice, and no reason to expect one’ (Myers, 2001).
While there may be a lack of consensus on exactly what drives the capital structure decision,
there is no lack of alternative hypotheses. One of these theories, capital structure performance
theory, is conspicuously underdeveloped. Although mentioned in text-books (Damodaran, 2001),
mentioned obliquely in some research (Morgan & Abetti, 2004), and even referred to in the
development of some of the other major theories (Myers, 2001), the idea that the capital structure
of a firm may be related to its performance, appears to have received very little direct theoretical
or empirical examination. We now briefly review the capital structure theories.
2.2.1 Static Trade-Off Theory
The debate about how and why firms choose their capital structure began in 1958 (Myers, 2001),
when Modigliani and Miller (1958) published their famous arbitrage argument showing that ‘the
market value of any firm is independent of its capital structure’. Based on Modigliani and
11
Miller’s value invariance theory, we would not expect capital structure to vary from firm to firm,
or over the performance of a single firm. But the theory was developed under a ‘deliberately
artificial set of conditions’ (Barclay et al, 1995) of no information costs, no personal or corporate
taxes, no contracting or transaction costs, and a fixed investment policy. Unravelling Modigliani
and Miller’s assumptions introduce us to the other major capital structure theories. The
introduction of taxation effects implies that firms should, theoretically, seek to increase their debt
levels in order to increase performance as far as possible (Miller, 1988). However other theorists
(Stiglitz, 1974) added limitations to the optimal level of firm debt by arguing that liquidation
costs increase as the firm’s level of debt increases, and this places an upper limit on the amount
of debt that should be present in a firm’s capital structure. This evolved into the static trade-off
theory, which proposes that firms attempt to achieve an optimal capital structure that maximises
the value of the firm by balancing the tax benefits, with the liquidation costs, associated with
increasing levels of debt (Myers, 1984). Some researchers have identified problem areas in the
ability of static trade-off theory to explain actual firm behavior and its performance. Myers
(2001) argued that static trade-off theory implies that highly performed profitable firms should
have high debt ratios in order to shield their large profits from taxation, whereas in reality, highly
profitable firms tend to have less debt than less profitable firms.
Warner (1977) suggested that liquidation costs are much lower than the tax advantages of debt,
implying much higher debt levels than predicted by the theory. There is, however, also some
empirical evidence and theoretical support for the idea that firms – at least in part –construct
their capital structure to take advantage of the interest tax shield (net of the interest tax burden to
investors), while ensuring that they avoid incurring excessively high financial distress costs for
the sake of performance. Kayhan and Titman (2004) found that, over the long term, firms do
12

tend to move towards target debt ratios consistent with the theory to build a formidable capital
structure and to improve performance. Static trade-off theory therefore offers one possible
explanation of how firms choose their capital structure. It also provides some important support
for capital structure theory and performance.
Warner (1977) found that the ratio of ‘the value of direct liquidation costs to the market value of
the firm appears to fall as the value of the firm increases due to a higher performance, a view that
has also found support from Esperenca (Esperenca et al, 2003). We might expect, therefore, to
see liquidation costs reducing in importance as firms grow and develop, resulting in higher
optimal debt ratios and higher levels of debt in larger, more mature firms and higher
performance.
Opler and Titman’s (1994) study of indirect performances of banks using liquidation costs
among retailers suggested that firms in the infancy, and adolescence life stages should have
lower debt levels than firms in later life stages, as their liquidation costs are higher due to lower
performances associated with them. It has also been argued that ‘optimal firm leverage is related
inversely to the variability of firm earnings’ (Bradley et al., 1984), which suggests that prime and
stable firms, with more predictable earnings streams, should have higher debt ratios than
younger, less predictable firms. Graham (2000) found that firms with unique products, low asset
collateral or large future growth opportunities – in other words, firms at early stages of
development (infancy to adolescence) – tend to have lower levels of debt than firms in the stable
or aristocracy life stages.
In summary, static trade-off theory suggests that firms in infancy, go-go and adolescence cannot
afford debt as their liquidation costs are high, and their earnings are too low to use the tax benefit
of increasing interest payments. In the prime and stable stages, the larger, more predictable
13

earnings makes the tax shield advantage of debt more beneficial. Liquidation costs are also
smaller in the prime and stable life stages. In the stages from aristocracy to death, firms are likely
to experience a decrease in earnings (and hence a decrease in the tax shield benefit of debt) and
as a result might be inclined to use less debt.
Static trade-off theory thus suggests that the proportion of debt in a firm’s capital structure
should follow a low-high-low pattern over the firm’s life stages to enhance performance over the
various stages.
2.2.2 Agency Cost Theory
There is also another argument for how capital structure may be predisposed by symmetries
between managers and investors. Not only do managers have diverse information about the
prospects of the firm than shareholders do, but managers also have interests that diverge from
those of shareholders. Agency costs are a good reason for firms to increase the amount of debt in
their capital structure since it has a direct relationship with the performance of a company, as
debt ‘enables managers to bond their promise to pay out future cash flows’ (Jensen, 1986).
According to agency cost theory, firms use more debt in their capital structure when investors
seek to pressure management to use funds efficiently. Fosberg (2004) found that the debt ratio
decreases as agency costs decrease because of an increasing proportion of ownership by
management, and that those firms with fewer shareholders have more debt than firms with many
shareholders. The link between fewer shareholders and more debt suggests that shareholders,
who are able to influence capital structure in their favour, do so in a way that increases the level
of debt.
14

Jensen (1986) argued that agency costs are especially severe ‘when the organisation generates
substantial free cash flow’, and that the control function of debt is most important in old,
declining organisations that actually need to shrink. In the context of the Adizes life stage model
this suggests that firms in the prime, stable, aristocracy, recrimination and bureaucracy life stages
should take on more debt to control agency costs which will ultimately leads to higher
performance.
Jensen also argued that debt is less effective in reducing agency costs in rapidly growing
organisations with ‘large and highly profitable investment projects but no free cash flow’ . The
firm with the lowest agency costs is, by definition, the one that is run by its owner (Ang et al,
2000) and therefore one would expect start-up firms (the infancy, go-go and adolescence life
stages) that are run by the entrepreneur to have the least debt and higher performance.
The agency cost argument therefore also offers support for capital structure theory. This time,
however, the pattern of the relationship pattern is low-high-high. In terms of agency cost theory,
we would expect young owner managed firms to have the least debt, and that debt levels will
gradually increase as the firm develops and acquires a greater number of shareholders and more
professional managers.
2.2.3 Information Asymmetry Theory
Stephen Ross developed the information asymmetry theory of capital structure by removing
another assumption underlying Modigliani and Miller’s value invariance theory, namely that ‘the
market possesses full information about the its performance and funding activities of firms’
(Ross, 1977). If instead we assume that managers possess information about the firm’s future
15

prospects that the market does not have, then managers’ choice of a capital structure may signal
some of this information to the market (Ross, 1977). Increasing leverage, he reasoned, would
signal to the market that the firm’s managers are confident about being able to pay interest in
future, and hence are confident about future earnings prospects and performance. Increasing
leverage would, therefore, increase the value of the firm by signalling to investors the size and
stability of future cash flows (Ross, 1977). Fama and French (1988), on the other hand,
countered by pointing to the fact that more profitable firms which are associated with higher
performances tend to have lower levels of debt. They argued that increasing debt actually signals
poor prospects for future earnings and cash flow as there will be less internal financing available
to fund development. Therefore, while it has been argued that information asymmetries decrease
over the lifetime of a firm (Baeyens & Manigaart, 2003), there is insufficient clarity on exactly
how signalling, within the context of information asymmetries, affects capital structure
decisions. We cannot, therefore, look directly to information asymmetries, and how they change
over time, as an explanation of why capital structure might change over a firm’s periods of
operation to increase performance.
2.2.4 Capital Structure Life Stage Theory and Performance
Some theorists have approached the problem of how organisational life stage relates to capital
structure. Bender and Ward (1993) focused on the trade-off between business risk and financial
risk, positing that business risk reduces and performance increases over the life stages of a firm,
allowing financial risk to increase. (Opler et al, 2001) offered a similar view, stating that ‘firms
should use relatively more debt to finance assets in place and relatively more equity to finance
growth opportunities’, and should, therefore, use progressively more debt in their financing mix
16

as they mature. This is supported by Damodaran (2001) who proposed that expanding and high-
growth firms would finance themselves primarily with equity, while mature firms would replace
equity with debt. Capital structure life stage theory would seem to suggest, therefore, that debt
ratios should increase as the firm progress and performance through the early life stages. From
an empirical point of view, however, little work has been done to support or refute this idea.
Most of the evidence for and against appears in the context of other arguments. In their analysis
of the venture-capital financing of biotech ventures, for example, Morgan and Abetti (2004)
argued that high technology ventures are so risky that they can only be financed by ‘venture
capital and private equity sources’, a view that supports the theory that riskier firms in the
infancy, adolescence and go-go life stages should use more equity. There has been little research
focusing directly on capital structure life stage theory and its performance, but the little there is
suggests, in line with static trade-off theory, that debt ratios should follow a low-high- low
pattern over the firm’s life. Firms in infancy, go-go and adolescence have a high business risk
and cannot afford financial risk, while firms in prime and stable can afford the extra risk that
accompanies debt financing. Firms in the declining life stages would again experience a growth
in business risk and would need to decrease their exposure to debt.
2.2.5 Pecking Order Theory
Myers observed how firms actually structure their balance sheets, and found that firms tend to
follow a ‘pecking order’ in financing their projects: first they use internal equity, then debt, and
only then do they use external equity (Myers, 1984). In contrast to Ross (1977), who argued that
firms use more debt to overcome information asymmetries and signal better prospects, Myers
(2001) used information asymmetries to argue that managers are unlikely to issue equity because
17
they fear it will signal that the stock price is overvalued. In addition to the evidence presented by
Myers, several other studies have lent support to pecking order theory. For example Allen
(1993), like Fama and French (1988 ), found that leverage is inversely related to profitability and
performance, which supports the pecking order theory view that debt is only issued when there is
insufficient retained income to finance investment.
According to the pecking order theory, we might expect firms in infancy, adolescence and go-go,
with little retained earnings, to seek the maximum available debt funding before resorting to
external equity. Prime and stable firms, in contrast, generate substantial retained earnings and
therefore need less debt than they did in their high-growth phase. As they move into the stages of
decline, retained earnings will decrease and firms again will increase their debt levels to finance
acquisitions of young firms. Pecking order theory, therefore, also suggests a strong relationship
between life stage performance and capital structure. In contrast to static trade-off theory,
however, pecking order theory suggests a high-low-high pattern of debt ratio over time.
2.3 Strategic Management Research and Capital Structure
A firm’s capital structure refers to the mix of its financial liabilities. As financial capital is an
uncertain but critical resource for all firms, suppliers of finance are able to exert control over
firms . Debt and equity are the two major classes of liabilities, with debt holders and equity
holders representing the two types of investors in the firm. Each of these is associated with
different levels of risk, benefits, control and performance. While debt holders exert lower
control, they earn a fixed rate of return and are protected by contractual obligations with respect
18
to their investment. Equity holders are the residual claimants, bearing most of the risk, and,
correspondingly, have greater control over decisions.
Questions related to the choice of financing have increasingly gained importance in management
research as it has a bare relationship with performance. Traditionally examined in the discipline
of finance, these issues have gained relevance in the past few years, with researchers examining
linkages to strategy and strategic outcomes. Bettis (1983) argued that modern capital structure
theory and strategic management are based on very different paradigms, resulting in opposing
conclusions. He called for more integrative research to resolve the controversies. Strategic
management scholars exhibit disparate opinions regarding the possibility of such integration into
capital structure. Oviatt (1984) suggested that a theoretical integration between the two
disciplines is indeed possible as more and more re structuring of capital within a firm has a
significant impact on performance. In contrast, Bromiley (1990) believed that the scope for
integration is limited, if at all possible. According to him, capital structure strategy should
neither import empirical results from finance, nor should they work towards integration of
strategic and financial research. Therefore, while strategy should expand its domain to study
areas traditionally considered in finance to increase performance, researchers should be careful
to maintain a strategic Perspective on how capital structure should be integrated.
Some management researchers have viewed capital structure decisions as arising from the
preferences of various stakeholders such as managers (Barton et al, 1987,88), board of directors (Stearns
et al 1993) and institutional investors (Chaganti et al, 1999). Other researchers have viewed capital
structure as an antecedent to firm strategy, such as diversification into new businesses with
19
prime issue on performance (Chatterjee,1990, 91). While these studies have definitely
contributed to some understanding of the linkages between performance and capital structure,
Does it matter how firms finance their assets? and do different modes of financing make a
difference?
While anecdotal evidence suggests that the amount and type of financing should be closely tied
to a firm’s strategy and its previous performance (Gupta et al, 1995) few researchers have looked
at the strategy/financing interaction (Sandberg et al, 1987). A firm consists of a bundle of
resources, some of them able to contribute to sustainable competitive advantage (Penrose, 1959).
The financial management function of a firm - including its capital structure decision - deals with
the management of the sources and uses of finances. Firms enter into transactions with suppliers
of finance raising capital for strategic assets.
The different types of financing, however, are also associated with different levels of costs as
these affects capital structure.
This paper suggests that the efficient set of transactions, as indicated by an optimal debt-to-
equity ratio, is determined by the nature of strategic assets in the firm. Therefore, those firms that
succeed in setting up the efficient set of transactions will be able to realize the full value of these
assets. On the other hand, firms that are not able to determine and/or organize their transactions
efficiently (as per asset requirements) will suffer a decline in performance. This decline arises
from a decrease in the net benefits available from strategic assets. Consequently, superior
financial management matching capital structure to resources can provide a firm added benefit
over its competitors.
20

2.4 Overview of the banking industry in Ghana
Banking in Ghana started in 1896. In that year, a branch of the Bank of British West Africa
(BBWA) was opened in Accra and in the Gold Coast (now known as Ghana). Shortly after the
Bank was established, it was able to acquire the business of maintaining the Government
accounts. In addition, it was able to introduce the use of cheques in settlement of Government
accounts which helped to advertise the usefulness of the Bank to the public (Buckle et al (1999).
Buckle stated that, by 1918, the operations of BBWA in the Gold Coast had been so successful
that another expatriate bank, the Colonial Bank decided to commence banking. In 1925 the
Colonial Bank merged with the Anglo-Egyptian Bank, the National Bank of South Africa and
Barclays Bank under the leadership and name of Barclays Bank (Dominion Colonial and
Overseas). Barclays soon developed into a strong competitor of BBWA. From the late 1920s
until the early 1950s, banking services in the Gold Coast continued to be exclusively provided by
these two expatriate banks. Branches were opened in many of the provincial capital towns and in
the main trading centres in the Gold Coast Colony, and, subsequently, in Ashanti and the
Northern Territories of the Gold Coast.
The Bank of Gold Coast Ordinance was passed by the legislature in October 1952. Sir Cecil
Trevor’s report (1952) outlines the business that the bank may be authorised to carry, generally
in line with any typical commercial bank as follows:
The accepting of money on deposit, either with or without interest, from and the
collection of money for the Government, local authorities, banks and any other persons;
purchase and sale of foreign exchange;
21

the making of loans and advances payable on demand or on expiry of fixed period not
exceeding six months against certain specified securities (i.e. stocks, gold, silver etc);
the issue of demand drafts made payable at its own offices or agencies;
the purchase and sale of securities;
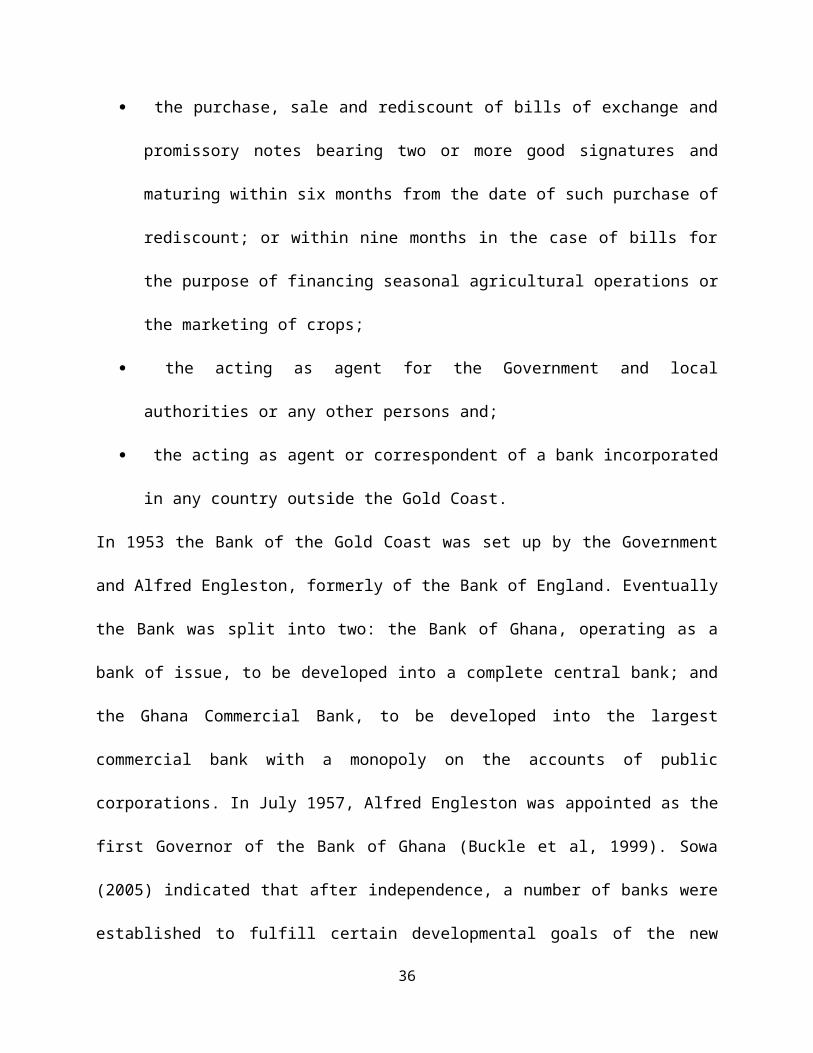
the purchase, sale and rediscount of bills of exchange and promissory notes bearing two
or more good signatures and maturing within six months from the date of such purchase
of rediscount; or within nine months in the case of bills for the purpose of financing
seasonal agricultural operations or the marketing of crops;
the acting as agent for the Government and local authorities or any other persons and;
the acting as agent or correspondent of a bank incorporated in any country outside the
Gold Coast.
In 1953 the Bank of the Gold Coast was set up by the Government and Alfred Engleston,
formerly of the Bank of England. Eventually the Bank was split into two: the Bank of Ghana,
operating as a bank of issue, to be developed into a complete central bank; and the Ghana
Commercial Bank, to be developed into the largest commercial bank with a monopoly on the
accounts of public corporations. In July 1957, Alfred Engleston was appointed as the first
Governor of the Bank of Ghana (Buckle et al, 1999). Sowa (2005) indicated that after
independence, a number of banks were established to fulfill certain developmental goals of the
new State. Thus, the National Investment Bank (NIB) which started operations in 1964 was
charged with the main object of assisting Ghanaian entrepreneurs in the establishment and
expansion of their enterprises. The Agricultural Development Bank (ADB) which originally was
part of the Bank of Ghana Rural Credit Unit was formed in 1965 with the aim of reaching
smallscale farmers. The third development, the Bank for Housing and Construction (BHC), was
22
established by the state in 1972 to cater for the building and construction industry. It is important
to note that the period of the establishment of these banks coincided with the “controlled regime”
when the State arrogated to itself the power to make all economic decisions and allocations, to
the exclusion of the private sector.
By the late 1980s, the banks had suffered substantial losses from a number of bad loans in their
portfolios. In addition, cedi depreciation had raised the banks' external liabilities. In order to
strengthen the banking sector, the government in 1988 initiated comprehensive reforms. In
regulatory framework, and gradually improved resource mobilization and credit allocation. In
1992 the Government began to privatise, what has for some time been regarded as the flagship in
banking, the Ghana Commercial Bank; and in 1994 took steps to divest itself of most of its
interests in the Social Security Bank.
The liquidation of Bank for Housing and Construction and Ghana Co-operative Bank in January
2000 and the collapse of Bank for Credit and Commerce in June 2000 called for pragmatic
approaches in capital adequacy, including holding a capital buffer of sufficient size, enough
liquid assets, and engaging in efficient risk management (Amidu, 2007). A critical analysis of
some selected banks revealed that Bank for Housing and Construction (BHC) and the Ghana
Cooperative Bank (COOP) showed signs of liquidity crunch before their liquidation. On
profitability, these banks showed abysmally poor performance while their capital structure ratios
did not favour these banks either (BoG, Financial Markets Department, 2000). These led to the
enactment of the following Acts: Bank of Ghana Act 2002, Act 612; Banking Act 2004, Act 673
and its subsequent amendments in 2007.
23

2.4.1 Recent Developments, Structure and Regulation
Some of the significant changes in banking regulations in Ghana in the past two years include the
Banking (Amendment) Act 2007, Act 738 which was enacted, introducing three types of banking
licenses; General Banking License (for universal and off-shore banking ),Class 1 Banking
License (for universal banking ) and class 2 Banking License ( for off-shore banking). The Credit
Reporting Act 2007 (Act 746) and Anti-Money Laundering Act, 2007 (Act 749). BoG also
proposed to increase the minimum capital requirement of banks from GHC 7 million to a range
of between GHC 50-60 million (BoG, 2007). This is to propel economic growth for the country
particular, the amended banking law of August 1989 required banks to maintain a minimum
capital base equivalent to 6 percent of net assets adjusted for risk and to establish uniform
accounting and auditing standards. The law also introduced limits on risk exposure to single
borrowers and sectors. These measures strengthened central bank supervision, improved them to
achieve a middle income status.
Time table for full compliance is given by BoG as follows:
End of 2009 for banks with majority foreign shareholdings (foreign banks); and
End of 2012 for banks with majority Ghanaian shareholdings (local banks).
The abolition of the 15% secondary reserve ( in August , 2006) requirements of banks and the
reduction of governments overall domestic debt-to-GDP from 29% (2002) to 10.1% (2006) and
reduction in the prime rate 24.5% (2002) to 12.5% (2006) also allowed banks to have more
money for private sector freed up significant liquidity for lending to businesses. The National
reconstruction Levy, which ranged between 2.5% to 5% of profit before tax was abolished at the
end of 2006 (The Ghana Banking survey, 2007). Total Domestic Credit for the period under
review rose from GHC635.40 million (in 1999) to GHC 7,290.3 million (in 2008) (ISSER,
24
2009). Some other recent improvements in the Banking industry include the introduction of the
e-zwitch, Automated Cheque codeline clearing system and the supervision of the redenomination
of the cedi.
The total number of major banks as at 2007 stood at 23. All of these banks were in compliance
with the minimum capital requirements of GHC 7 million for universal banking business under
class 1Banking license. All but one bank complied with the minimum capital adequacy ratio of
10.00 percent, with an industry ratio of 14.8 per cent (BoG, 2007).
25

CHAPTER THREE
METHODOLOGY
Introduction
This chapter brings to bear the research method adopted for this study; the study actually
involves association between performance and capital structure. In view of this, the researcher
sought to used data from the secondary source, since data on capital structure and performance of
corporate institutions are available both online and other data management consults, these
include the financial statements of the banks selected for the study. The chapter outline the
regression method adopted for the study as well as the Pearson correlation coefficient to find the
strength of association the exist between variables chosen for the study.
3.1 The Research Paradigm.
Research always adopt either one or both paradigm for study, i.e either inductive or deduction.
When data is first collected and then, after analyzing the data a theory is developed consequently, the
approach is of inductive nature which is quantitative. On the other hand, if a theory or hypothesis is first
developed and then, later a research strategy is designed to test the hypothesis, the approach is of
deductive nature Saunders et al. (2007). In this study, empirical findings were based on the use of
quantitative nature of the research. Therefore, quantitative approach was applied to this study.
26

3.2 The Research Method
3.2.1 The Study Population
The study population comprises all banks licensed by the central bank thus Bank of Ghana (BoG),
however, banks under certain categories are not considered to be part for this study, such banks classified
as rural bank and licensed by the central Bank of Ghana are not part of the study and does not constitute
to be part of the population. Financial services licensed by the central bank also do not constitute to be
part of the population for the study. Only banks or commercial banks form the population for the study.
The researcher chose this population due to the ever increasing number of merchant and commercial
banks operating around the shores of the nation.
3.2.2 Sampling Techniques
The researcher uses a convenience sampling method which is a non probability techniques for
the selection of the sample size for the study, the study initially was to include all commercial
banks in the country licensed by the central bank and fulfill the study population requirements, as
well as having its financial statement available from 2004-2010. Since not all the banks qualify
under this category, then the researcher selected the banks that meet the prerequisite for her own
convenience. Thus the reason for the convenience sampling method used for the selection of
selected banks.
3.2.3 Sample Size
27

Data were gathered from the Annual Reports of all banks selected for the study in Ghana from
2004 – 2010. The method of sampling was to include all registered commercial banks of the
Bank of Ghana with financial statements from within the stated period. In all 24 banks qualified
to be included in the sample. Since the study was purposely on the banking sector, commercial
banks being licensed by the central bank were all forms part of the study population.
3.2.4 Data Source and Collection Method
Data for this study was secondary taken from the annual financial statements of the selected
banks for the stipulated period. Price Waterhouse Coopers’ Ghana Annual Banking survey and
also from the respective published site of the selected banks website repository.
3.3 Data Analysis
Since the research paradigm was quantitative in nature, the researcher used a combination of
both descriptive statistics and inferential statistics to analysed her data gathered. Data was
analysed by using multiple regression analysis to find the cause and effect of the explanatory
variables or the predictor variables on the response or dependent variables, ratios, percentage,
mean and standard deviation were outline in a descriptive tables.
The panel disposition of the data allows for the use of panel data methodology. Panel data
involves the pooling of observations on a cross-section of units over several time periods and
provides results that are simply not detectable in pure cross-section studies. Of late, the structure
conduct- performance relationship is tested by the panel data method because its results take into
28
consideration structural change as well as cyclical fluctuations (Domowitz et al, 1986). in the
analysis of the data, the researcher employ the help of statistical and econometric software tools
such as RGui, Microsoft Excel and E-view software’s to aid her to come up with the results
3.4 Proposed Model Used for the Study
The researcher used a model proposed by Berger and di Patti (2002) and latter adopted by
Pratomo and Ismail (2006) that shows the correlation of bank’s profit and capital structure. The
basic model is used by Pratomo and Ismail was altered slightly to suit the needs for this study
and to allow for a detach testing of the effect of capital, short-term debt, long-term debt and total
debt on profitability. It also allows for inclusion of the age, total assets (sizea) variables and the
combination of the loans and investment in securities variables (loinl), which were considered
necessary in this particular study.
3.4.1 The proposed model is outlined below
EFCi,t = α0 + βCAPi,t + δRISK i,t + ØSIZEi,t + ΦLOANi,t + γSSECi,t + θHERFi,t + εi,t ..(Basic
Model )
PROFi,t = α0 + βCAPi,t + δSDROE i,t + ΦSIZEA (LOINL)i,t + ℓAGEi,t + θHERFGi,t + εi,t ...1
PROFi,t = α0 + βSDAi,t + δSDROE i,t + ΦSIZEA (LOINL)i,t + ℓAGEi,t + θHERFGi,t + εi,t....2
PROFi,t = α0 + βLDAi,t + δSDROE i,t + ΦSIZEA (LOINL)i,t + ℓAGEi,t + θHERFGi,t + εi,t ...3
PROFi,t = α0 + βTDAi,t + δSDROE i,t + ΦSIZEA (LOINL)i,t + ℓAGEi,t + θHERFGi,t + εi,t ...4
Where:
PROFi,t measures bank performance. The researcher measured this variable by using
29

return on Equity (ROE). ROE i,t is EBIT divided by equity for bank i in time t;
CAP i,t is Equity capital divided by net total assets for bank i in time t;
SDA i,t is short-term debt divided by net total assets for bank i in time t;
LDA i,t is long-term debt divided by net total assets for bank i in time t;
TDA i,t is total debt divided by net total assets for bank i in time t;
SDROE is used to measure bank risk. SDROE i,t is standard deviation of the ROE for
bank i in time t from the average ROE of bank i for the study period;
SIZEA i,t is the log of the total assets for bank i in firm t. It is used as a measure of bank
size;
LOINL i,t is the log of the total value of loan and investment for bank i in time t;
AGE i,t is a measure for bank loyalty. It is calculated as the log of the AGE for bank i in
time t;
HERFG i,t is a deposit market concentration using Herfindahl index for bank i in time t;
and
εi,t is the error term
3.4.2 Research Variables
The researcher used the accounting measure of performance such as the Return on Equity (ROE)
to operationalized profitability. The response or dependent variable in this study is Return on
Equity (ROE) whereas the explanatory variables include total asset ratio , short-term debt to net
total asset ratio ,capital to net total asset ratio , long-term debt to net and total debt to net total
asset ratio.
30
Equation 1 was used to find the correlation between bank efficiency as measured by Return on
Equity (ROE) and capital ratio (CAP).
Equation 2 was used to assess the relationship between ROE and short-term debt ratio whiles
Equation 3 was used to investigate the relationship between ROE and long-term debt
ratio and
Finally, equation 4 was used to ascertain the relationship between ROE and total debt.
3.4.3 Variables Rationalization
Response Variable - Return on Equity (ROE)
Various studies on performance employs various measures to predict agency cost hypothesis,
(Kyereboah-Coleman 2007) . Some of the measures of performance that have been used over the
years include financial ratios (Demstz and Lehn, 1985; Gorton and
Rosen, 1995; Mehran, 1995), and stock market return and their volatility (Saunders et al., 1990;
Cole and Mehran, 1998). Mehran, (1995); also used a financial ratio (ROE) as a measure of firm
performance.
ROE is used as a measure of bank efficiency in preference to other variables (like return on
assets profitability and cost efficiency) that could have been used. Due to the fact that, ROE
measures the profitability of a bank relative to equity holders, who are considered the true
owners of the firm. The use of earnings before interest and as proxy for profitability further
allows the researcher to capture the total returns generated by all the contributors of capital (i.e.
the entire capital structure). This makes it possible to also assess the impact of both debt and
equity on the performance of banks, Abor (2005).
31

3.4.4 Predictor or Explanatory Variables
Long-term debt to Net Total Assets (LDA)
LDA measures the relationship between long-term debt (all debts of a bank with a lifespan of
more than 1 year) and net total assets. It shows the value per cedi of net total assets contributed
by long-term loans. This relationship enables the researcher to test the impact of long-term loans
on bank efficiency.
Short-term debt to Net Total Assets (SDA)
SDA is used to measure the relationship between short-term debt (all Owings by a bank which
fall due within a year) and net total assets. It is used to ascertain the portion of net total assets
financed by short-term debt. It shows the stake that short-term debt holders have in the business
and it is used to assess their impact on bank efficiency.
Capital Ratio (CAP)
CAP is the standard measure of leverage in banking research (Pratomo and Ismail, 2006). It
allows the researcher to ascertain the portion of net total assets contributed by equity holders.
This is then used as proxy to assess the impact of equity capital on bank profitability.
3.4.5 Control VariablesSIZEA
This is the proxy for bank size. It is taken to be the total bank assets as against other measures
like sales or number of employees. The reason is as a result of the fact that assets are the
32
economic resources controlled by an entity as a result of past transactions from which the entity
expects to gain future economic benefits. It follows therefore that the size of a firm’s assets
influences the sales that it can generate or the number of employees to be employed. This proxy
allows the researcher to assess the impact that assets in general have on performance. It is
expected that total assets will impact positively on the performance of the bank.
AGE
Age is calculated as the log of the number of years of existence for a bank since incorporation (or
since commencement of business, where the date for incorporation cannot be ascertained with a
degree of precision). Age is chosen as one of the control variables because, all other things being
equal, the length of time that a bank has been in existence will not only enable the bank to gain
experience in banking in Ghana but also improve its reputation and enhance customer loyalty.
These are expected to translate to bank efficiency if the bank can use its experience to gain
competitive advantage. This is not measured by the other variables, hence its inclusion in the
model.
Standard deviation of Return on Equity (SDROE)
SDROE is used to measure the uncertainty of returns to the true owners of the banks. It is a
standard measure for risk in investments. In investment, as the risk of an investment increases,
return is also expected to be high enough to cover the additional risk being taken by the
investors. In other words, as banks engage in risky adventures, the volatility of the earnings
33
should be compensated by higher rewards. Consequently, it is expected that the relationship
between SDROE and ROE would be positive.
Total Loans and Investment (LOINL)
LOINL is considered as a control variable because banks get a lot of operating income from
loans and investments. The granting of loans and credit is the principal activity of banks. It is
calculated as the total of all loans and advances irrespective of their life spans. Banks major
source of revenue comes from this source. Consequently the relationship between loans and ROE
is expected to be positive. Another operating activity of banks is the undertaking of investments.
Banks earn operating income from this source in the form of discounts, dividend etc and they can
have significant impact on the profitability of a bank. It is expected that the higher the amount of
a banks investment the higher its return. Therefore it is expected that total loans and investments
would have a positive impact on bank profitability.
Herfindahl Index (HERFG)
HERFG is the square of the deposit market share for a bank for a particular year. The resultant
figure is then multiplied by 10,000. Deposit is selected as the basis for calculating HERFG
because it is expected that a customer’s loyalty to a particular bank can be best reflected in the
amount he/she is willing to deposit with that bank. Deposits therefore give a justifiable indication
of the proportion of the entire market controlled by a bank. Thus banks with larger market share
are expected to have higher ROEs signaling a positive association between HERFG and ROE.
34

3.5 Hausman Specification TestTo determine the use of either random effect mode or the fixed effect model, the researcher
employed the used of the Hausman (1978) specification test. The use of Hausman specification
test is due to its characteristics which is normaly and commonly used to make the comparison of
random and fixed effect model estimates of coefficients. In the random effect model, the
intercept is assumed to be random drawing from a much larger population with a constant mean
value. The implication of this statement is that the Random effect Model is used when the
sample is so large and the data is randomly selected to represent the analysis, Pratomo and Ismail
(2006). As this research uses data from selected banks in Ghana, the researcher prefers Fixed
Effect Model as a representative model. Moreover, to strengthen the result, the researcher
analyzed the result of the estimated regression using Hausman Test. The different estimation
methods were used to run the multiple regression models.
3.6 Pearson Correlation Coefficients
Person correlation coefficient is a statistical/mathematical tool use to measure the degree or
strength of association between two variables or more variables; it always yields a value between
-1≤ r ≤1 inclusive. When the value r = 1 it shows that there is a perfect positive correlation,
whiles r = -1 means that there is a perfect inverse correlation. A value r near zero means there is
no clear relationship exists between the two variables, moreover, the measure also assumes an
assumption of values of 0.7 (absolute) and above is considered to be more correlated or have a
strong degree of association between the two variables involved, values from 0.5 -0.699
(absolute) is also considered to have an association either positive or inverse depending on the
sign associated with the value.
35

36
CHAPTER FOUR
DATA PRESENTATION, ANALYSIS AND DICUSSIONS
Introduction
This chapter deals with the descriptive statistics of the various predictor various and its
association with the performance indicator, correlation analysis have also been discussed to find
the strength of relationship between the variables used. Regression analysis have also be
employed in this chapter of the various models to find the impact of the various predictors
variables contribution to the performance of banks in Ghana.
4.1 Descriptive Statistics
Table 4.1 Descriptive Statistics
Descriptive statistics gives the means and equips the researcher to have a fair view of the values
from the data processed. Form table 4.1, it gives information about the descriptive statistics of
the dependent/response variable, the independent/predictor variables as well as the control
variables used in the collection of the data for the entire discussions. From the table, it is evident
that, a greater percentage of the capital structure of banks in Ghana is made up of debt
accounting for about 81.68 percent of the bank’s capital. Short term debt was also revealed to
accounts for about 79.34 percent of total capital whiles long term debt accounts constitute for
6.56 percent. Apparently short term debt accounts for a higher source of funding for most banks
in Ghana with a greater portion coming from customer deposits. Nevertheless, long term debt
financing proves otherwise, as it does not seem to be a major source of funding for the banks in
Ghana. These findings are noted to be in agreement to existing literature, (Abor, 2005; Amidu,
37
2007). Amidu (2007) reveals that more than 87% of the banks in Ghana are financed by debt and
that average long-term debt represents around 8.2%.
Evidently, it has also shown that the banks in the industry operate above the minimum required
capital adequacy ratio of 10percent as it was found that, the mean capital ratio of banks in
Ghana is 13.86 percent. The low standard deviations of 3.75 percent (equity capital) and 12.77
percent (total debt) attest to the fact that almost all the banks in Ghana sources of funding are
similar and do not vary. The performance indicator (ROE) has a mean of 82.57 percent and a
standard deviation of 54.65 percent, which shows that, clearly, the banking industry performed
extremely well in the period under review but it is also obvious since the standard deviation is
quite large it indicates that not all the banks are benefiting from this high industry performance ,
some are actually not doing their best. The average risk level in the industry was 0.3476 with a
deviation of 38.54 percent. Which shows a fairly stable risk among banks. The mean of total
assets (log) was 6.24 (standard deviation of 70.24 percent) whiles that of total loans and
investments (log) was 6.59 (with a standard deviation of 63.82 percent). The extremely high
level of standard deviation of firm-level deposit-herfindahl Index suggests that the banking
industry is concentrated with only few banks in Ghana control the total deposits in the industry.
This may offer support for the high disparity in ROE, total assets and total loans and
investments. Probably these disparities are as a result of the fact that some of the banks have
been in existence for far more years than others (the standard deviation of the log of age is 58.72
percent whiles the average age (log) is 2.0586).
38

Table 4.1 Descriptive Statistics of Variables
Variable Observation Mean Value Std. Dev
ROE 24 .8256876 .54659
CAP 24 .1385680 .03752
SDA 24 .7934057 .13363
LDA 24 .0655987 .14036
TDA 24 .8167868 .12774
SDROE 24 .3476450 .38549
SIZEA 24 6.239879 .70236
LOINL 24 6.589452 .63821
AGE 24 2.058645 .58724
HERFG 24 57.81113 133.271
4.2 Pearson Correlation Analysis
Pearson correlation matrix was found to enable the researcher to find, it there exist
multicollinearity among the predictor variables. As explained in chapter three. Person
Correlation coefficient is a statistical/mathematical tool use to measure the degree or strength of
association between two variables or more variables; which always leads to yield a value
between -1≤ r ≤1 inclusive. The value r = 1 shows a perfect positive correlation or strength of
association, whiles r = -1 means a perfect inverse correlation or strength of association. A value r
near zero indicates no clear relationship existences between the two variables, moreover, the
measure also assumes an assumption of values of 0.7 (absolute) and above is considered to be
more correlated or have a stronger degree of association between the two variables involved,
values from 0.5 to 0.699 (absolute) is also considered to have an association either positive or
inverse depending on the sign associated with the value.
39

Table 4.2: Pearson Correlation Coefficients
ROE CAP SDA LDA TDA SDROE SIZEA LOINL AGE HERFG
ROE 1.0000 -0.4984* 0.3287* 0.1276* 0.5428* 0.3875* 0.0397 0.0543 0.0415 0.2013**
CAP 1.0000 -0.67808* -0.0674 -0.6875* -0.2167* -0.2698* -0.3167* -0.1187 -0.2246***
SDA 1.0000 -0.6157* 0.5784* 0.2314* 0.2404* 0.2431* 0.03462 0.2104*
LDA 1.0000 0.4033* -0.0491 0.0228 0.0510 0.0583 -0.1645**
TDA 1.0000 0.2346* 0.2876* 0.3015* 0.1033 0.1043
SDROE 1.0000 -0.2376* -0.2325* -0.2056* -0.2376*
SIZEA 1.0000 0.8502* 0.6238* 0.5187*
LOINL 1.0000 0.6743* 0.5437*
AGE 1.0000 0.6548*
HERFG 1.0000
40

Correlation Analysis
Clearly, the performance indicator (ROE) has a significantly inverse relationship with capital, a
significantly positive relationship with short-term debt, long-term debt total debt, and risk and
deposit herfindahl index, even though the strength of association was great, however, it shows a
significance which cannot be ignored. Although ROE exhibits a positive relationship with total
assets, total loans and investments and age, these relationships are not significant. Equity capital
(CAP) has a significantly inverse relationship with all the control variables except for age (with
which the negative relationship is not significant) however, LDA also shows insignificance of
the relationship. The relationship between SDA and all the control variables is significantly
positive except for age (with which the positive relationship is not significant). LDA exhibits an
insignificantly positive relationship with total assets, total loans and investments and age but a
significantly positive relationship with herfindahl index.
On the other hand LDA’s relationship with risk is inverse and insignificantly. Statistically, the
relationship between Total debt and risk, total assets and total loans and investments is
significantly positive but although total debt has positive relation with age and herfindahl index,
the relationship is not significant. The high magnitude of the correlation coefficient of the
relationship between total asset and total loans and investments indicates the presence of
multicollinearity. However, a forward regression was used to analyzed the data to include the
multicollinearity variables.
wise regression for the inclusion of the two variables.
* Denotes significant at 1 percent
** Denotes significant at 5 percent
*** Denotes significant at 10 percent
41
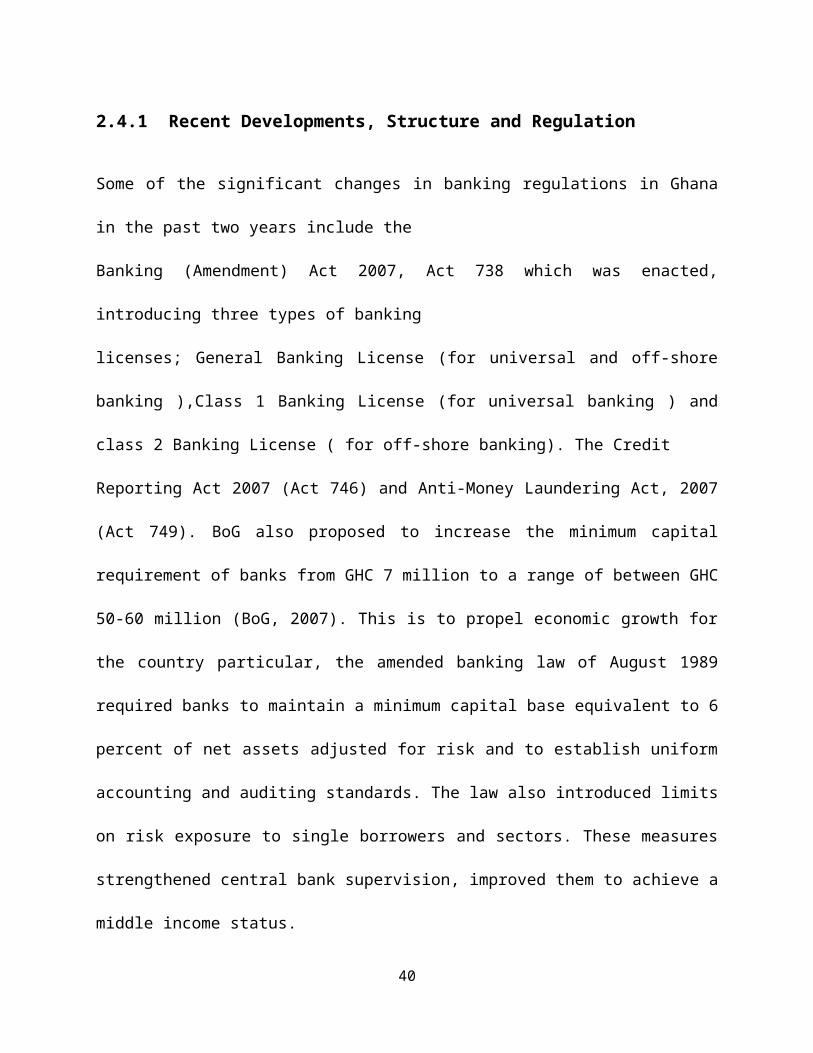
4.3 Regression Results from Stata 10 Output
Table 4.3A: Regression Result for Model One, with Total Assets
Anova Table
Source | SS df MS Number of obs = 168
-------------+----------------------- F(6,167) = 2.10
Model | 3654.82611 6 609.1376 Prob > F = 0.0121
Residual| 107.888177 161 0.67011 R-squared = 0.97132
-------------+------------------------ Adj R-squared = 0.7265
Total | 3762.71429 167 615.48396 Root MSE = 0.8186
-------------+------------------------
Coefficients
---------------------------------------------------------------
ROE | Coef. Std. Err. t P>|t| [95% Conf. interval]
-------------+--------------------------------------------------CAP |-4.51978 .5440752 -2.16 0.020 -5.1285967 -3.0246395 SDROE |.3076805 .212417 -3.43 0.042 .0148144 .5005465
SIZEA |.3655441 .213041 1.86 0.000 .0468094 .6778976
AGE |-.065441 .353041 2.89 0.160 -.468094 .1778976
HERFG |-.000651 .0053041 1.60 0.060 -.0018094 .0008976
_cons | -2.152 1.31881 1.34 0.123 -3.47101 5.01403
-------------+--------------------------------------------------
42

Table 4.3B: Regression Result for Model One, with Loans and Investments
Anova Table
Source | SS df MS Number of obs = 168
-------------+----------------------- F(6,167) = 2.10
Model | 4314.34171 6 719.05695 Prob > F = 0.0035
Residual| 231.12307 161 1.435547 R-squared = 0.94915
-------------+------------------------ Adj R-squared = 0.8364
Total | 4545.46478 167 720.92497 Root MSE = 1.19814
-------------+------------------------
Coefficients
---------------------------------------------------------------
ROE | Coef. Std. Err. t P>|t| [95% Conf. interval]
-------------+--------------------------------------------------CAP |-4.3951 .812706 -4.40 0.000 -5.34875 -3.055732 SDROE |.309346 .147549 -3.23 0.003 .09432 .524407
LOINL |.482370 .134103 1.47 0.000 .02543 .6759970
AGE |-.16345 .1156307 -2.09 0.240 -.36737 .1505689
HERFG |-.00074 .000562 -1.63 0.081 -.00286 .0000874
_cons | -1.673 1.00321 -1.34 0.003 -3.7010 -.0103664
-------------+--------------------------------------------------
43

4.3.1 Discussions from Model One on Bank Performance, Bank Capital and the Control Variables
Table 4.3A gives the results of the first model which aims at testing the relationship between
bank performance, bank capital and the control variables, as indicated in the table, the anova
tables shows a significant differences in the averages of the bank capital and the control variables
and hence has R-square of 0.97132, which indicates that, the capital and the control variables
accounts for 97.132 percent in the changes of the performance variable (ROE). The results of the
constants in the coefficient table in table 4.3A indicates that that equity has a significantly an
inverse relationship with firm performance (ROE). These results interprets to mean that banks
with high amount of capital are unfavorably affecting its performance and that increasing a
bank’s capital does not increase its profitability. The low level of debt in high equity capital
structures reduces bank responsibility towards debt holders, in terms of interest and principal
payments. This also declines the threat of insolvency. As a result, management would not be
under pressure to increase profit in order to meet the bank’s periodic debt repayments. These
findings are in agreement with the agency costs hypothesis – higher leverage or lower equity
capital ratio is associated with profit efficiency, all else equal.
Moreover, total asset, total loans and investments all have a significantly positive relationship
with performance. These are found to be in consistent with the usual known paradigm ’larger
banks are better diversified and can thus hold less capital to buffer against losses’. Thhis also
confirms the general knowledge that businesses generate economic benefits from the assets it
acquires.if and only if they are managed efficiently. Also loans and advances given out and
investments undertaken enable banks to increase their profitability by increasing their interest
income, interest received, dividend income and other investment income. Risk has the expected
44

impact of positively affecting performance. Also high risk investments and adventures
undertaken by banks are normally associated with higher returns because of the extra rewards
demanded for taken on additional risk, thus increasing bank performance.
Unexpectedly, Age and Deposit herfindahl index give inverse relationship with bank erformance
even though these relationships are not statistically significant since P> 0.05 both in table 4.3A,
B . The age factor may be an indication of the fact depositors and/ borrowers do not consider the
duration of a bank’s existence when selecting a bank to deal with. However, the negative sign of
deposit herfindahl index is a carefulness to banks on how efficiently they are managing the
proportion of deposits that they control. It clearly shows that the larger the volume of deposits
controlled by a bank, the lesser its performance; even though this is not significant when total
assets are use in the model thus table 4.3A. But the significantly inverse relationship between
herfindahl index and bank performance when total loans and investments are used in the
equation thus table 4.3B makes it much more worrying. It appears that, some banks are not
managing their deposits well, therefore leading to affecting its performance.
45

Table 4.4A: Regression Result for Model Two, with Total Assets
Anova Table
Source | SS df MS Number of obs = 168
-------------+----------------------- F(6,167) = 2.10
Model | 5431.62151 6 1456.3992 Prob > F = 0.0136
Residual| 297.810707 161 1.849756 R-squared = 0.94802
-------------+------------------------ Adj R-squared= 0.87745
Total | 5729.432217 167 1458.24896 Root MSE = 1.36006
-------------+------------------------
Coefficients
---------------------------------------------------------------
ROE | Coef. Std. Err. t P>|t| [95% Conf. interval]
-------------+--------------------------------------------------SDA |1.256439 .464824 2.59 0.000 0.534287 3.0003434
SDROE | .458206 .128346 3.77 0.014 .277032 .7322765
SIZEA | .630286 .137704 -1.25 0.033 .365201 1.0036724
AGE |-.274305 .153030 -1.88 0.067 -.462012 .0270046
HERFG |-.003361 .000934 -1.38 0.028 -.0020934 .0006655
_cons |-4.57204 1.44034 -4.34 0.023 -7.482001 -2.5234013
-------------+--------------------------------------------------
46
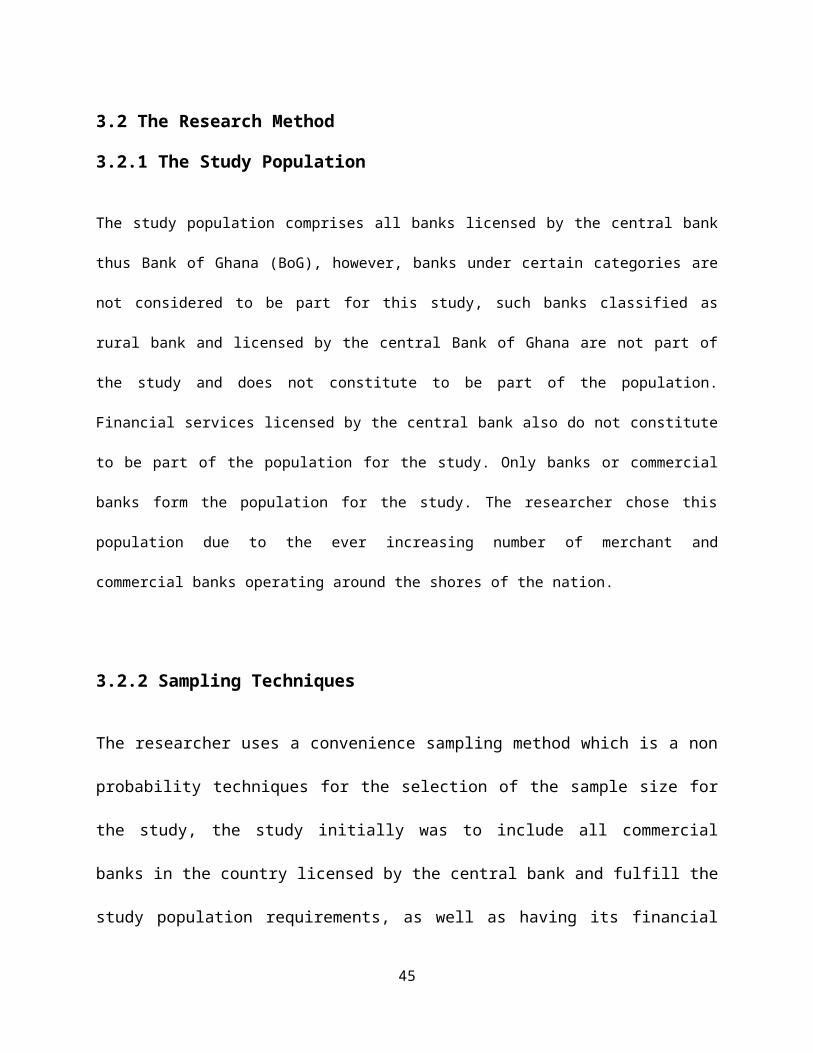
Table 4.4B: Regression Result for Model Two, with Loans and Investments
Anova Table
Source | SS df MS Number of obs = 168
-------------+----------------------- F(6,167) = 2.10
Model | 2999.4624 6 499.9104 Prob > F = 0.0010
Residual| 112.81377 161 0.70070 R-squared = 0.96375
-------------+------------------------ Adj R-squared = 0.9251
Total | 3112.27617 167 500.61111 Root MSE = 0.83707
-------------+------------------------
Coefficients
---------------------------------------------------------------
SDA | Coef. Std. Err. t P>|t| [95% Conf. interval]
-------------+--------------------------------------------------CAP |1.259804 .407153 2.68 0.010 2.996548 2.02635773 SDROE |.5076577 .202107 3.44 0.024 .2180841 .7405445
LOINL |.6350412 .130466 5.06 0.003 .4064504 .9628960
AGE |-.276451 .123030 -2.14 0.000 -.448007 -.0789655
HERFG |-.001368 .000504 -2.06 0.037 -.002007 .0000726
_cons | -5.1502 1.00038 5.39 0.003 -7.50131 -3.349093
-------------+--------------------------------------------------
47
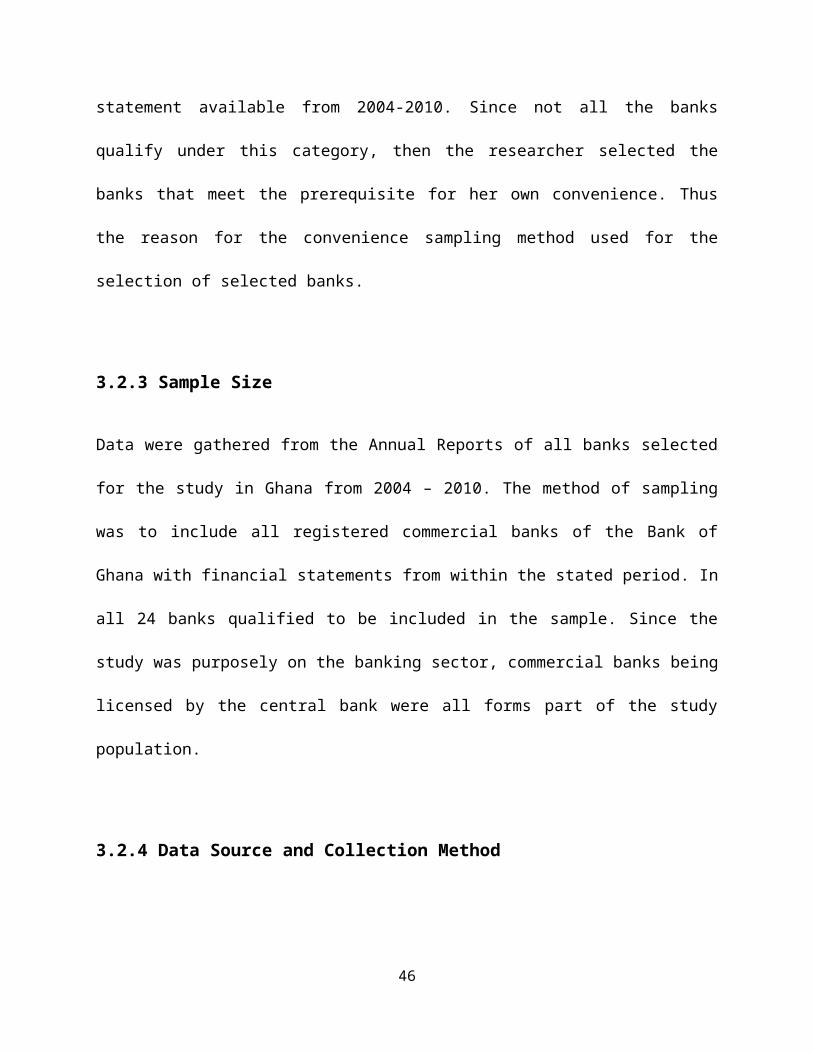
4.3.2 Discussions on Model Two on Bank Performance, Short – term Debt and Control Variables
On the other hand short term debt, was noted to have a direct positive relationship with
performance which also depicts to be a significantly positive relationship with ROE. This
confirms the fact that, the more short-term debt a bank holds on its capital structure the higher its
performance. The lower cost and risk of short term debt financing could be the main reason for
its direct positive relationship with performance. As a result banks benefit greatly when they use
more short-term debt.
Both table 4.4A and 4B shows that the predictor variables , thus SDA and the other control
variables accounts for much of the variation in the performance indicator (ROE) from the various
banks. Age and deposit herfindahl index show a significantly inverse relationship with
performance while risk, total asset, total loans and investments show a statistically positive
relationship with performance, moreover significant. These suggest that banks which have been
in existence for relatively long have not been successful in cashing in on first-mover advantages.
It could also be as a result of their inability to manage some of their assets well. Furthermore it is
also probable that long-term- existent-banks have not been relatively successful in the
management of their reputation as compared to banks which are new in the industry. It can be
conclude that, these results are unfavorable to banks in the industry that have existed for longer
years in the industry.
48
Table 4.5A: Regression Result for Model Three, with Total Assets
Anova Table
Source | SS df MS Number of obs = 168
-------------+----------------------- F(6,167) = 2.10
Model | 3558.2673 6 593.04455 Prob > F = 0.0001
Residual| 99.4672 161 0.617809 R-squared = 0.97281
-------------+------------------------ Adj R-squared = 0.9254
Total | 3657.7345 167 593.66236 Root MSE = 0.78601
-------------+------------------------
Coefficients
---------------------------------------------------------------
ROE | Coef. Std. Err. t P>|t| [95% Conf. interval]
-------------+--------------------------------------------------LDA |1.03934 .44054 2.36 0.022 .124904 1.02395
SDROE |.571940 .12310 3.99 0.002 .3114407 .854605
SIZEA |.565403 .130841 4.02 0.000 .3668904 .8775926
AGE |-.36704 .157045 -2.57 0.100 -.568494 -.0789716
HERFG |-.00019 .000504 -0.44 0.840 -.0014043 .0009706
_cons | -3.757 1.04489 -3.44 0.003 -5.47501 -1.51033
-------------+--------------------------------------------------
49

Table 4.5B: Regression Result for Model One, with Loans and Investments
Anova Table
Source | SS df MS Number of obs = 168
-------------+----------------------- F(6,167) = 2.10
Model | 4053.6141 6 675.6023 Prob > F = 0.0121
Residual| 182.8877 161 1.135948 R-squared = 0.95683
-------------+------------------------ Adj R-squared = 0.9259
Total | 4236.5018 167 676.738248 Root MSE = 1.0658
-------------+------------------------
Coefficients
---------------------------------------------------------------
ROE | Coef. Std. Err. t P>|t| [95% Conf. interval]
-------------+--------------------------------------------------LDA |.983478 .440520 2.23 0.021 .125673 1.924395 SDROE |.572680 .1124172 3.68 0.002 .342815 .750567
LOINL |.655440 .1521045 4.06 0.000 .396895 1.077971
AGE |-.36744 .1173043 -3.19 0.100 -.648104 -.578376
HERFG |-.000259 .005043 0.49 0.660 -.00137 .000795
_cons | -4.152 .9431816 -4.34 0.003 -5.9471 -2.019034
-------------+--------------------------------------------------
50

4.3.3 Discussions of Mode Three on Bank Performance, Long-term Debt and the Control Variables
Long term debt which forms part of financing shows a significantly positive relationship with
performance indicator (ROE), Long term debt is generally scarce and expensive, which comes
with terms and conditions which indirectly work for the good of the organization, such as
restrictive covenants, collateral requirements, fixed repayment terms leave management with no
option but to remain profitable in order to safeguard the interest of shareholders and other
stakeholders. This result, is not in Abor (2005), In his paper, he found that, the relationship
between long term debt and Ghanaian listed firms’ profitability was found to be significantly
negative. The reason, which does not differ significantly from the afore mentioned studies is the
fact that long-term debts are relatively more expensive, and therefore employing high
proportions of them could lead to low profitability. In this particular study, it appears that the
financial benefits of long-term usage far outweigh the cost, this may also be due to the short
period used for the study.
Age’s if firms contribution shows inverse relations with performance. Nevertheless, risk, total
asset, total loans and investment maintain their significantly positive relationships with bank
performance. In this model deposit herfindahl index depicts an insignificantly inverse
relationship with performance. Consequently it reveals that banks management of the proportion
of deposits controlled is improved when they use high long term debt in financing. In effect, long
term debt increases management ability in asset maximization and enables them to be scrupulous
in the application of scarce bank resources.
51
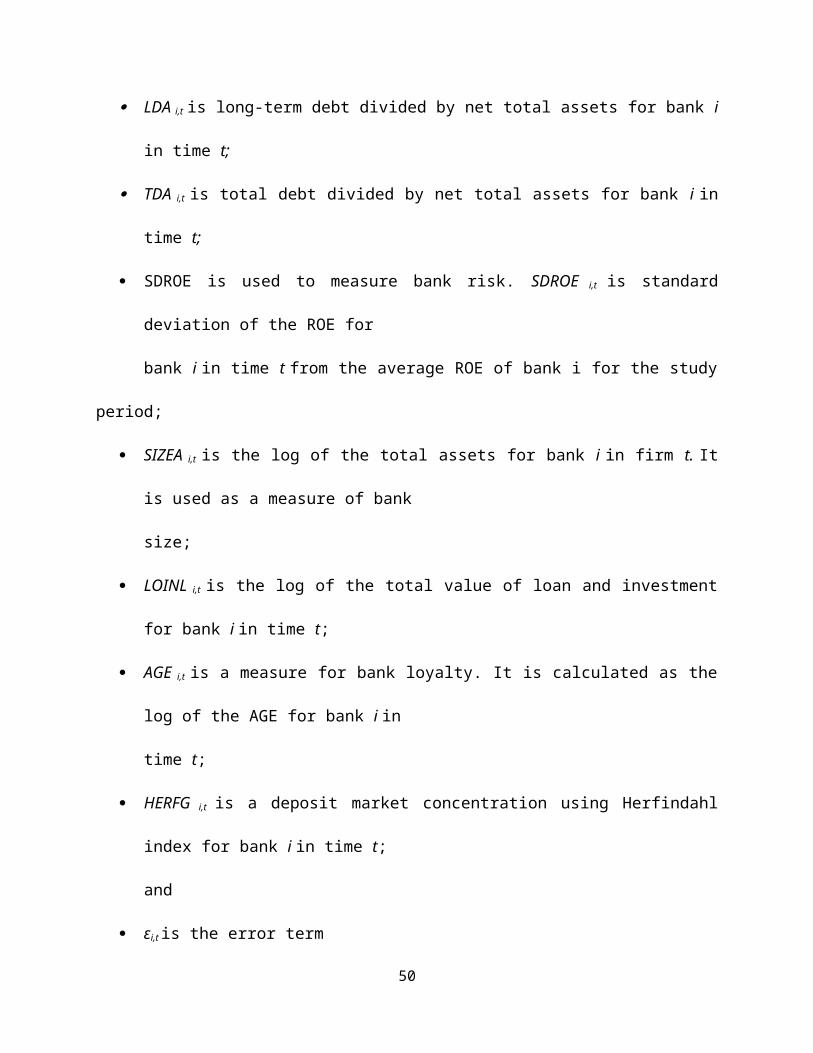
Table 4.6A: Regression Result for Model Four, with Total Assets
Anova Table
Source | SS df MS Number of obs = 168
-------------+----------------------- F(6,167) = 2.10
Model | 3994.7452 6 665.7909 Prob > F = 0.0021
Residual| 1307.8277 161 8.123153 R-squared = 0.75336
-------------+------------------------ Adj R-squared = 0.7198
Total | 5302.8277 167 673.91405 Root MSE = 2.85011
-------------+------------------------
Coefficients
---------------------------------------------------------------
ROE | Coef. Std. Err. t P > |t| [95% Conf. interval]
-------------+--------------------------------------------------TDA |3.00348 .444752 5.64 0.020 1.12346 4.0002432
SDROE |.376105 .102459 3.11 0.000 .0146504 .5775065
SIZEA |.399543 .13843 2.98 0.000 .1046894 .6678760
AGE |-.09856 .113005 -1.59 0.107 -.304016 .070871
HERFG |-.000616 .000301 -1.21 0.160 -.001704 .0002964
_cons | -4.956 1.00481 -4.91 0.100 -6.5711 -3.06438
-------------+--------------------------------------------------
52

Table 4.6B: Regression Result for Model Four, with Loans and Investments
Anova Table
Source | SS df MS Number of obs = 168
-------------+----------------------- F(6,167) = 2.10
Model | 4337.2267 6 722.8711 Prob > F = 0.0001
Residual| 1104.5845 161 6.86077 R-squared = 0.79702
-------------+------------------------ Adj R-squared = 0.7395
Total | 5441.8112 167 729.73187 Root MSE = 2.619307
-------------+------------------------
Coefficients
---------------------------------------------------------------
ROE | Coef. Std. Err. t P>|t| [95% Conf. interval]
-------------+--------------------------------------------------TDA |2.59178 .407512 6.16 0.020 1.12597 3.524395 SDROE |.363420 .125415 3.03 0.042 .16812 .620046
LOINL |.650347 .123053 3.89 0.000 .0468094 .767876
AGE |-.28555 .151645 -2.39 0.160 -.468094 .007897
HERFG |-.000741 .00030 -1.60 0.060 -.0018094 .000197
_cons |-4.96752 .99514 -5.34 0.123 -3.47101 -3.540327
-------------+--------------------------------------------------
53
4.3.3 Discussions of Model Four on Bank Performance, Total Debt and the Control Variables
Model 4 rsults, as indicated in table 6A, B indicates that, the total debt and the control variable
accounts for more variations in the performance of the bank, it clearly exposes that, the
relationship between total debt and performance is significantly positive. The results confirms
earlier findings in this study on capital, short term debt and long term debt; leverage increases
performance of banks in Ghana. This means that increasing the level of debt in the capital
structure of a bank results in higher performance. This notwithstanding, banks are also advised
against excessive debt which can be recipe for insolvency and financial distress. This indicates
that, bank could result in debt financing within a controllable limit which won’t affect its
operations to put it into financial distress.
The relationship between performance and risk, total assets, total loans and investments were
also noted to be positive and significant. Conversely, in table 4.6B, deposit herfindahl index
shows a inverse but insignificant relationship with performance. Also, age has a significantly
negative relationship with performance when total loans and investments are employed in the
equation but not when total assets are employed.
54
CHAPTER FIVE
SUMMARY OF FINDINGS, CONCLUSIONS AND RECOMMENDATIONS
Introduction
The earlier literatures such as the work of Modigliani and Miller opened the debate for studies on
the effect of capital structure on firm performance; however it still remains a puzzle in the
finance sector. Although various literatures by and large agree that capital structure has an effect
on firm performance, the direction of this effect is largely inconsistent with the various studies so
far. While some reveal that debt has a positive effect on firm performance, others have proven
otherwise. This study sought to provide further evidence on the effect of capital structure on firm
performance, by using data from financial institutions, with respect to banks in Ghana.
5.1 Summary of findingsThe debate of capital structure on firm’s performance continues to gain attention in the financial
sector research works. Numerous literatures on the topic have contributes enough to bring an end
to the discussions, however, contended in results still opens the it wide for a thorough work to be
done in the topic. This study contributes to the existing literatures by using data from banks to
provide further evidence on the ongoing debase on the association or impact of capital structure
and firms performance.
5.1.1 Key findingsThe researcher came across various findings of which they are in agreement with some existing
literatures, these include the following.
55
The study confirms that, debt or leverage in any form tends to increase the entire profitability of
bank and hence leads to higher performance, unexpectedly, and contrary to some existing
literatures, long-term debt was also found to affects bank profitability positively, even though
they account for a minimal percentage of bank capital, whereas that of short term tends to have a
significant impact on the profitability of banks in Ghana. Nevertheless, the use of equity reduces
bank profitability, as it also was found to have an inverse relationship with the performance
indicator (ROE).
Additionally, Bank’s risk was found to be associated with high performance, nevertheless age of
banks and deposit herfindahl index was found to have an inverse relationship with bank
performance. Clearly it was also found that, bank assets (bank size) held also increases bank
profitability as well as total loans and investments also increase bank profitability.
Besides, since both the short-term and long term leverage have a positive impact on the
profitability on the bank, it was generally, find that, the total debt of the bank contributes to its
performance, however, the performance increases if the short term debt accounts for more of the
debt due to its low risk and high interest.
Specifically, the descriptive statistics indicates and brings to bear that, Banks in Ghana are highly
leveraged. Accounts for 81.68 percent of bank assets are provided by debt thus either in any form
of leverage which were found to have a positive impact on performance.
Furthermore, most banks in Ghana use more short-term debt 79.34 percent as against long-term
debt which accounts for 6.56 percent. Evidently, the banks were found to operate above the
required minimum capital adequacy ratio of 10%. The results give must to be believed that, the
average capital of banks in Ghana is about 13.86 percent.
56

Findings on Hypothesis
Clearly as indicated in all the Anova tables for all the models indicates that, there is a
relationship between the profitability and capital structure since all the p < 0.05, therefore we fail
to accept the null hypothesis that there is no relationship between the profitability and capital
structure.
5.2 Conclusions
The findings discovered were consistent with existing literature on firms and performance with
insignificant difference. The results clearly indicates that, banks in Ghana do well when they
apply more debt both short-term debt and long-term debt in the financing of their activities. As a
result, increase in bank capital structure is discouraged and should be done with much care,
increase in bank debt - especially short-term debt - is encouraged. Nevertheless, banks are
advised against excessive debt levels because of the inverse consequences associated with high
debt usage. Which tends to agree with the agency cost hypothesis, under which high leverage
corporate tends to reduce agency costs? It is imperative therefore, that banks in Ghana strategies
their capital structure.
5.3 Recommendations
Based on the findings observed earlier, the following recommendations are suggested
From the analysis, debt was found to be highly associated with high performance. Banks with
high debt have high return, irrespective of the nature of debt used, however, short term debt is
57

the preference. Therefore it is recommended that, banks are encourage to increase their level of
debt, however careful measures should be taken not to drive the bank into insolvency.
Moreover, due to the effects of the capital structure on the various performance of a firm, it will
be recommended that, banks should only increase their capital when they are operating below the
required minimum capital adequacy ratio to provide protection for its depositors
Banks are rather encourage to create innovations in their products to bring in more of their
clients to save more, since banks could finance their debt or use its leverage to effectively
manage the short term and the long term debt. savers amount could be used to service these debts
and will shield the bank from borrowing from the central bank to increase profitability and hence
performance.
What is more, most banks use short term debt and most of these short term debt are in the form
of customer deposits such as fixed, savings accounts, current accounts and other time deposits.
Banks in Ghana should therefore find more ways of attracting while discouraging withdrawals.
Again more efficient deposit-withdrawal management can give banks virtually free capital which
also has the potential to increase their performance. Furthermore, it appears that banks in Ghana
do not benefit from the proportion of customer deposits they control.
Likewise on the academic front, it is recommended that, capital structure and firms performance
relationship could be analyzed by using data set from a hybrid of financial institutions such as
insurance firms, and other financial institutions licensed by the central bank.
58
References
Aboagye A.Q.Q, (1996).”Financial Statements and Ratios: the Case of Ghanaian Public Companies “in S. Mensah (Ed.) African Capital Markets: Comtemporary Issues, African Capital Markets Forum: Rector Press Limited pp. 321-335.
Abor J., (2005).”The effect of capital structure on profitability: an empirical analysis of listed firms in Ghana.” Journal of Risk Finance, Vol. 6(5) pp: 438-445 Emerald Group Publishing Limited.
Abor J., and Biekpe N. (2004).” What Determines the Capital Structure of Listed firms in Ghana?” Afr. Finance Journal 7(1):37-48.
Allen, D. E. (1993). ‘The pecking-order hypothesis: Australian evidence’, Applied Financial Economics, 25(1):101-112.
Amidu, M. (2007.”Determinants of capital structure of banks in Ghana: an empirical approach.” Baltic Journal of Management Vol.2 No.1 pp: 67-79, Emerald Group Publishing Limited.
Ang, J. S., Cole, R. A. and Lin, J. W. (2000). ‘Agency costs and ownership structure’, The Journal of Finance, 55 (1):81-106.
Baeyens, K. and Manigaart, S. (2003). ‘Dynamic financing strategies: The role of venture capital’, Journal of Private Equity, 7(1):50-58.
Bank of Ghana (2000), “Analysis of Past Performance of Some Banks in the Ghanaian Financial System”, a paper by the Financial Markets Department
Bank of Ghana Annual Report 2007
Barclay, M. J., Smith, C.W. and Watts, R. L. (1995). ‘The determinants of corporate leverage and dividend policies’, Journal of Applied Corporate Finance, 7(4):4-19.
Barney, J.B.,(1986)“Factor Markets: Expectations, Luck, and Business Strategy,” Management Science 32, 1986, pp. 1231- 1241.
59

Barton, S.L. and P.J. Gordon,(1988).“Corporate Strategy and Capital Structure,” Strategic Management Journal 9, 1988, pp. 623-632.
Barton, S.L. and P.J. Gordon, (1987) “Corporate Strategy: Useful Perspective for the Study of Capital Structure?” Academy of Management Review 12, 1987, pp. 67-75.
Bender, R. and Ward, K. (1993). Corporate financial strategy. Oxford: Butterworth-Heinemann.
Berger, N., A. and di Patti, E., B. (2002).”Capital structure and Firm Performance: A new Approach to Testing Agency Theory and an Application to the Banking Industry”. Feds Paper.
Bettis, R.A.,(1983) “Modern Financial Theory, Corporate Strategy and Public Policy: Three Conundrums,” Academy of Management Review 8, 1983, pp. 406-415.
Boateng A (2004),”Determinants of Capital Structure: Evidence from International Joint Ventures in Ghana.” Int. Journal Social Econ. 31(1/2):56-66.
Bradley, M., Gregg, A. J., and Han Kim, E. (1984). "On the Existence of an Optimal Capital Structure: Theory and Evidence."Journal of Finance 39, no.3: 857-80.
Bromiley, P., (1990) “On the Use of Financial Theory in Strategic Management,” Advances in Strategic Management 6, 1990, pp. 71-98.
Brooks, R. and Davidson, S., (2003). Rand D., Agency Costs and Capital Structure: International Evidence. An unpublished manuscript
Chaganti, R. and Damanpour F.,(1991). “Institutional Ownership, Capital Structure, and Firm Performance,” Strategic Management Journal 12, 1991, pp. 479-491.
Chatterjee, S. and B. Wernerfelt, (1991). “The Link Between Resources and Type of Diversification: Theory and Evidence,” Strategic Management Journal 12, 1991, pp. 33-48.
Chatterjee, S., (1990). “Excess Resources, Utilization Costs, and Mode of Entry,” Academy of Management Journal 33, 1990, pp. 780-800.
60

Cole, R. A. and Mehran, H. (1998). “The effect of changes in ownership structure on performance: evidence from the thrift industry”. Journal of Banking and Finance, Vol. 21 pp.895-947.
Damodaran, A. (2001). Corporate finance: Theory and practice. New York: John Wiley and Sons.
Demstz, H. and Lehn, K.(1985).”The structure of corporate ownership: causes and consequences”, Journal of Political Economy, Vol.93 pp. 1155-77.
DeYoung, R., Spong K. and R.J. Sullivan, (2001). “Who's Minding the Store? Motivating and Monitoring Hired Managers at Small, Closely Held Commercial Banks,” Journal of Banking and Finance 25: 1209-1243.
Domowitz, I., Hubbart, G. R., and Peterson, B., (1986). ”Business Cycles and the Relationship between Concentration and Price-Cost Margin. Rural Journal of Economics, Vol.17, pp.1-17.
Esperenca, J. P., Gama, A. P. M. and Gulamhussen, M. A. (2003). ‘Corporate debt policy of small firms: An empirical (re)examination’, Journal of Small Business and Enterprise Development, 10(1):61-80.
Fama, E. F. and French, K. R. (1988). ‘Taxes, financing decisions and firm value’, The Journal of Finance, 53(2):819-844.
Fosberg, R. H. (2004). ‘Agency problems and debt financing: leadership structure effects’, Corporate Governance, 4(1):31-38.
Gorton, G. and Rosen, R. (1995).”Corporate control, portfolio choice, and the decline of banking”. Journal of Finance, Vol. 50 pp. 1377-420.
Graham, J. R. (2000), ‘How big are the tax benefits of debt?’, The Journal of Finance, 55(5): 1901-1942.
Gupta, U., (1995). “How Much?” Wall Street Journal, May 22, 1995, p. R7.
Gupta, U., (1995). “The Right Fit,” Wall Street Journal, May 22, 1995, p. R8.Hausman, J., (1978).”Specification tests in econometrics”, Vol. 46 pp. 1251
61

Hovakimian, A., Opler, T. and Titman, S. (2001). ‘The debtequity choice’, Journal of Financial and Quantitative Analysis, 36(1):1-24.
Jensen, M. (1989). “The eclipse of the public corporation”. Harvard Business Review, 67:60-70.
Jensen, M. C. (1986). ‘Agency costs of free cash flow, corporate finance and takeovers’, American Economic Review, 76(2):323-330.
Kayhan, A. and Titman, S. (2004). ‘Firms’ histories and their capital structures’. NBER Working Paper, May.
Kyereboah-Coleman, A., (2007). The impact of capital structure on the performance of micro-finance institution. The Journal of Risk Finance. Vol. 8 (1), pp. 56-71
McConnell, J.J., and H. Servaes, 1990. “Additional evidence on equity ownership and corporate value,” Journal of Financial Economics 27: 595-612.
Mehran, H. (1995). “Executive compensation structure, ownership, and firm performance”, Journal of Finance Economics, Vol. 38 pp. 163 – 84.
Mehran, H., (1995). “Executive compensation structure, ownership, and firm performance,” Journal of Financial Economics 38: 163-184.
Mester, L.J., (1993). “Efficiency in the Savings and Loan Industry,” Journal of Banking and Finance 17: 267-86.
Miller, M. (1988), ‘The Modigliani-Miller Propositions after Thirty Years’, Journal of Economic Perspectives, 2(4) : 99- 121.
Modigliani, F. and Miller M.H., (1958). “The Cost of Capital, Corporation Finance, and the Theory of Investment,” American Economic Review 48, 1958, pp. 261-297.
62

Morgan, Jr, I. W. and Abetti, P. A. (2004). ‘Private and public ‘cradle to maturity’ financing patterns of U.S. biotech ventures’, The Journal of Private Equity, 7(2):9-26.
Myers, S. (1977).”Determinants of Corporate Borrowing.” Journal of Financial Economics, Vol.5 (5), pp. 147-75.
Myers, S.(1984) “The Capital Structure Puzzle,” Journal of Finance 39, 1984, pp. 575-592.
Myers, S. C. (1984). ‘The capital structure puzzle’, The Journal of Finance, 39(3):575-583.
Myers, S.C., (2001). “Capital Structure,” Journal of Economic Perspectives, 15(2):81-102.
Opler, T. C. and Titman, S. (1994). ‘Financial distress and corporate performance’, The Journal of Finance, 49(3): 1015-1040.
Oviatt, B.M.,(1984) “On the Integration of Financial Management and Strategic Management,” Academy of Management Best Paper Proceedings, 1984, pp. 27-31.
Penrose, E.T., (1993) The Theory of the Growth of the Firm, Oxford: Blackwell, 1959.
Pi, L., and S.G. Timme, (1993). “Corporate Control and Bank Efficiency,” Journal of Banking and Finance 17: 515-30.
Pratomo, W., A. and Ismail, A., G. (2006). “Islamic Bank Performance and Capital Structure. “ Munich Personal RePEc Archive, Paper No. 6012.
Ross, S.A. (1977). ‘The determination of financial structure: The incentive-signalling approach’, The Bell Journal of Economics, 8(1):23-41.
Sandberg, C.M., Lewellen, W.G. and K.L. Stanley,(1987). “Financial Strategy: Planning and Managing the Corporate Leverage Position,” Strategic Management Journal 8, 1987, pp. 15-24.Saunders, A., Strock, E., and Travlos, N. (1990).”Ownership structure, deregulation, and bank risk taking”. Journal of Finance, Vol. 45 pp. 643-58.
63
Saunders, M., Lewis, P., Thornhill, A. (2007), Research Methods for Business Students, Fourth Edition, Prentice Hall, Pearson Education, London, England.
Sowa, N.K. (2005). Central banking and monetary management in Ghana
Stearns, L.B. and M.S. Mizruchi,(1993). “Board Composition and Corporate Financing: The Impact of Financial Institution Representation on Borrowing,” Academy of Management Journal 36, 1993, pp. 603-618.
Stiglitz, J.E. (1974). ‘On the irrelevance of corporate financial policy’, The American Economic Review, 64(6):851-867.
The Ghana Banking survey (various editions). PricewaterhouseCoopers in association with Ghana Association of Bankers.
Titman S. and Tsyplakov, S., (2007). “A dynamic Model of Optimal Capital Structure”. Review of Finance 11(3), 401-451.
Titman, S. (1984). “The Effect of capital structure on a Firm’s Liquidation decision”, Journal of Financial Economics, Vol. 13, pp. 137-151.
Titman, S. and Wessels R., (1988). “The Determinants of Capital Structure Choice”. The Journal of Finance 43(1), 1- 19.
Trevor, C. (1952). Report on the banking conditions in the Gold Coast and the question of setting up a national bank. Published by The Government Printing Department. Accra, Goldcoast.
Warner, J. B. (1977). ‘Bankruptcy costs: Some evidence’ The Journal of Finance, 32(2): 337-348.
64