Embed Size (px)
Citation preview
MAGIA2: from miRNA and genes expression dataintegrative analysis to microRNA–transcriptionfactor mixed regulatory circuits (2012 update)Andrea Bisognin1, Gabriele Sales2, Alessandro Coppe3, Stefania Bortoluzzi1,* and
Chiara Romualdi1,*
1Department of Biology, University of Padova, Padova 35131, 2Department of Statistical Science, University ofPadova, Padova 35121 and 3Department of Comparative Biomedicine and Food Sciences, University ofPadova, Padova 35020, Italy
Received March 1, 2012; Revised April 23, 2012; Accepted April 30, 2012
ABSTRACT
MAGIA2 (http://gencomp.bio.unipd.it/magia2) is anupdate, extension and evolution of the MAGIA webtool. It is dedicated to the integrated analysis ofin silico target prediction, microRNA (miRNA) andgene expression data for the reconstruction ofpost-transcriptional regulatory networks. miRNAsare fundamental post-transcriptional regulators ofseveral key biological and pathological processes.As miRNAs act prevalently through target degrad-ation, their expression profiles are expected to beinversely correlated to those of the target genes.Low specificity of target prediction algorithmsmakes integration approaches an interestingsolution for target prediction refinement. MAGIA2
performs this integrative approach supporting dif-ferent association measures, multiple organismsand almost all target predictions algorithms.Nevertheless, miRNAs activity should be viewed aspart of a more complex scenario where regulatoryelements and their interactors generate a highlyconnected network and where gene expressionprofiles are the result of different levels of regula-tion. The updated MAGIA2 tries to dissect this com-plexity by reconstructing mixed regulatory circuitsinvolving either miRNA or transcription factor (TF)as regulators. Two types of circuits are identified:(i) a TF that regulates both a miRNA and its targetand (ii) a miRNA that regulates both a TF and itstarget.
INTRODUCTION
MicroRNAs (miRNAs) are fundamental post-transcrip-tional regulators of several biological processes, whose al-terations have been demonstrated in a number of diseasesand in almost all human cancers (1–5).miRNA imperfectly bind the 30-untranslated region
(30-UTR) of their target mRNAs and may cause transla-tion inhibition and/or mRNA cleavage and degradation(6,7). miRNAs can have multiple targets and a singleprotein-coding gene can be targeted by multiplemiRNAs. In this perspective, the network of post-trans-criptional regulatory relationships is expected to have ahighly complex connectivity structure.In silico target identification is based on (i) sequence
similarity search, possibly considering target site evolu-tionary conservation and (ii) thermodynamic stability.However, it is known that the results of target predictionalgorithms are characterized by very low specificity (8).This is caused both by the limited comprehension of themolecular basis of miRNA-target pairing and by thecontext-dependency of post-transcriptional regulationdue to the cooperative interactions of different miRNAs.The integration of target predictions with miRNA andgene expression profiles has been recently proposed toimprove the detection of functional miRNA-target rela-tionships (9,10). As miRNAs act prevalently throughtarget degradation, expression profiles of miRNA andtarget genes/transcripts are expected to be inverselycorrelated.Although some studies have demonstrated that the
regulation of single key targets may largely explain thefunction of a given miRNA in tumorigenesis or metastasisdevelopment (11–13), the mechanisms of RNA regulation
*To whom correspondence should be addressed. Tel: +39 049 827 7401; Fax: +39 049 827 6159; Email: [email protected] may also be addressed to Stefania Bortoluzzi. Tel: +39 049 827 6502; Fax: +39 049 827 6209; Email: [email protected]
The authors wish it to be known that, in their opinion, the first two authors should be regarded as joint First Authors.
Nucleic Acids Research, 2012, 1–9doi:10.1093/nar/gks460
� The Author(s) 2012. Published by Oxford University Press.This is an Open Access article distributed under the terms of the Creative Commons Attribution Non-Commercial License (http://creativecommons.org/licenses/by-nc/3.0), which permits unrestricted non-commercial use, distribution, and reproduction in any medium, provided the original work is properly cited.
Nucleic Acids Research Advance Access published May 21, 2012 at U
niversita Degli Studi D
i Padova on May 28, 2012
http://nar.oxfordjournals.org/D
ownloaded from
are emerging to be much more complex than previouslyexpected. miRNA activity should be viewed as part of acomplex system where regulatory elements and theirinteractors generate a highly connected network, whichregulates gene expression on multiple levels.Unfortunately, from an experimental point of view, thecooperation of different miRNAs acting on more thanone target and the interplay with other regulatory levelsare still challenging to be proved.The gene regulation at the transcriptional level is, in
general, quantitatively stronger than that occurringpost-transcriptionally. Both levels impact on mRNA/genes expression profiles. Indeed, the miRNAs expressionlevel can be activated or repressed by transcription factors(TFs), whereas mRNAs encoding TFs can be silenced bymiRNAs. miRNAs and TF can share targets. Thus,miRNAs and TFs can form feedback or feed-forwardloops, cooperating to tune gene expression (14) andplaying critical roles in various biological processes. In aseminal review, Inui et al. (15) describes the role ofmiRNAs in pathways as decision maker elements to dis-criminate real versus too weak or too transient signals. Inthis context, the association between miRNAs and targetexpression profiles is generally more complex than linearcorrelation.Although many researchers have attempted to under-
stand the mechanism of miRNAs to regulate targetgenes and their roles in various diseases, the study ofmiRNA regulation by TFs (TF–miRNA regulation) hasbeen relatively limited (16). Some attempts have beenreported in order to computationally reconstruct regula-tory circuits concerning miRNA–TFs and their jointtargets (17–19). However, the identification of miRNApromoters is a challenging task. As promoter regionscould be several thousands of base pairs upstream of theprimary-miRNA, a correct way of identifying putativemiRNA regulatory regions was not clearly established sofar. To this aim, a few databases have been developed tostore experimentally validated TF-miRNAs interactions(16,20).Although several web tools (21–27) were recently de-
veloped in order to enhance the functional insights ofmiRNA functions and to improve miRNA–mRNA inter-actions identification almost none of them face thecomplex problem of the reconstruction of the above-men-tioned TF–miRNA–target circuits.Here, we present MAGIA2 (miRNA and genes
integrated analysis 2012 update, freely available athttp://gencomp.bio.unipd.it/magia2) an updated andfully redesigned release of MAGIA (21), a web applicationfor the integrative analysis of in silico target prediction,miRNA and gene expression data. As in the previousrelease, MAGIA2 refines in silico target predictionthrough miRNA–target expression association measures.MAGIA2 extends the analysis, supporting multiple organ-isms (human, mouse, rat and drosophila), and using agreatly expanded list of target predictions algorithms. Itallows the combination of multiple predictions and theselection of user-defined thresholds for each one. TheMAGIA2 architecture was completely redesigned: bothdata and analyses results are stored in a user-specific
environment keeping the data private. Furthermore, theupdated MAGIA2 tries to dissect regulatory complexityreconstructing mixed regulatory circuits involving eitherhuman miRNA or TF as regulators (Figure 1A). In par-ticular, two types of mixed regulatory circuits areidentified: (i) a TF that regulates both a given miRNAand its target gene; (ii) a miRNA that regulates both agiven TF and its regulated gene (Figure 1B). In order tohelp the user in the interpretation of the results, novelfeatures are implemented into MAGIA2. Among them(i) miRNA–target interactions experimentally validated[as reported in miRecords (28), TarBase (29)and mirTarBase (30) databases] are specifically marked;(ii) Functional enrichment of the gene network componentcan be performed directly from MAGIA2 using DAVIDplatform.
WEB TOOL IMPLEMENTATION
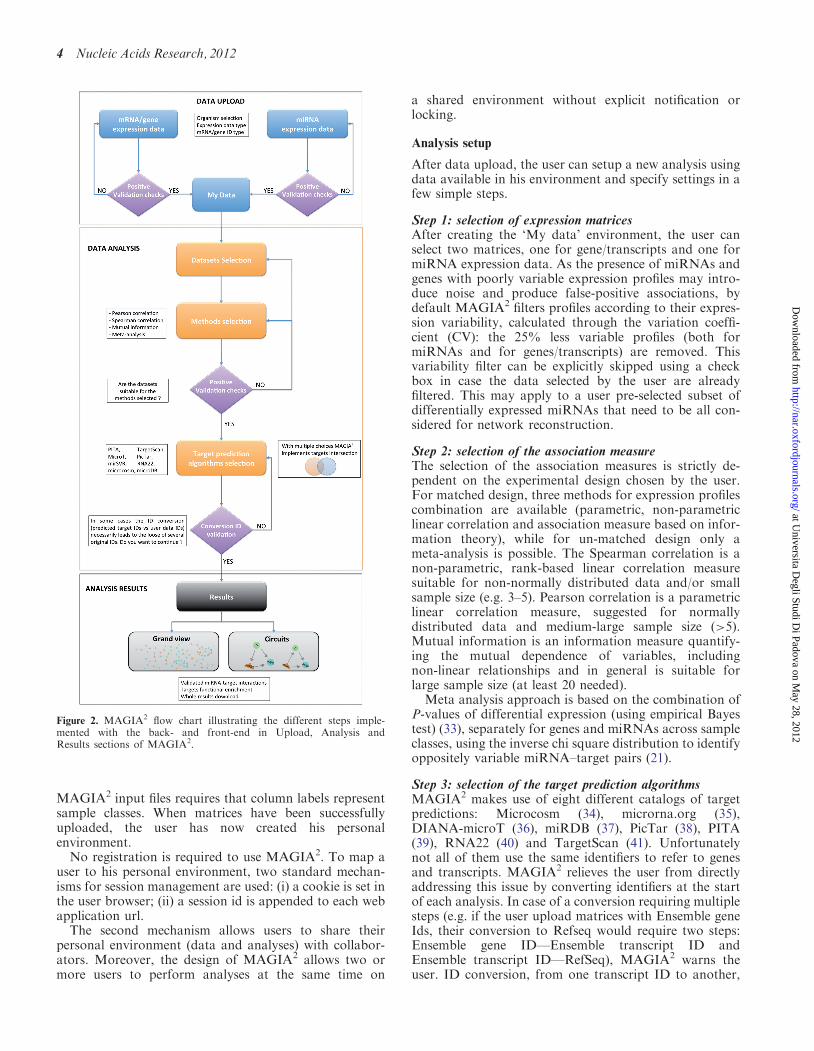
In Figure 2, MAGIA2 architecture comprises three mainsections: (i) data upload, (ii) data analysis and methodssetup and (iii) results visualization, browsing and linkingto external knowledgebase and tools.
Data upload
In the first section, the user selects the organism, definesthe gene or transcript ID used (EntrezGene, RefSeq,ENSEMBL gene or transcript are allowed) and uploadsmiRNA and gene (or transcript) expression data. In thisway, a private MAGIA environment is created. Input filesmust be tab-delimited matrices (samples on the columnsand, genes/transcripts or miRNAs on the rows).
Gene and miRNA expression profiles should be alreadynormalized and filtered. Specifically, mRNA and miRNAprofiles could be generated using different platforms andcould be pre-processed with different algorithms as correl-ation coefficient and mutual information are invariantunder a linear transformation.
Platform-specific probes (Affymetrix and Agilent IDs)are not unique, with several probes mapping on the samegene/transcript and being frequently associated with notconcordant expression. Besides, over 30% of theAffymetrix probes do not correctly map to the genesthey are supposed to belong (31,32). For these reasons,in the expression signal reconstruction phase, we suggestthe user (i) to use custom CDF for Affymetrix technologyand (ii) to choose the best probe (in term of quality checkflag, or using other criteria) for Agilent technology.
The first columns of matrices should contain miRNAand gene/transcripts IDs of supported organisms; theheader lines should be set according to the experimentaldesign chosen. MAGIA2 considers two different experi-mental designs: (i) matched case—gene/transcript andmiRNA expression data from the same biologicalsamples and (ii) non-matched case—mRNA/transcriptand miRNA expression data on different biologicalsamples, belonging to the same set of classes, possibly re-sulting in different sample sizes. When using matchedprofiles the names of the columns of miRNA and gene/transcript matrices should correspond exactly; otherwise,
2 Nucleic Acids Research, 2012
at Universita D
egli Studi Di Padova on M
ay 28, 2012http://nar.oxfordjournals.org/
Dow
nloaded from
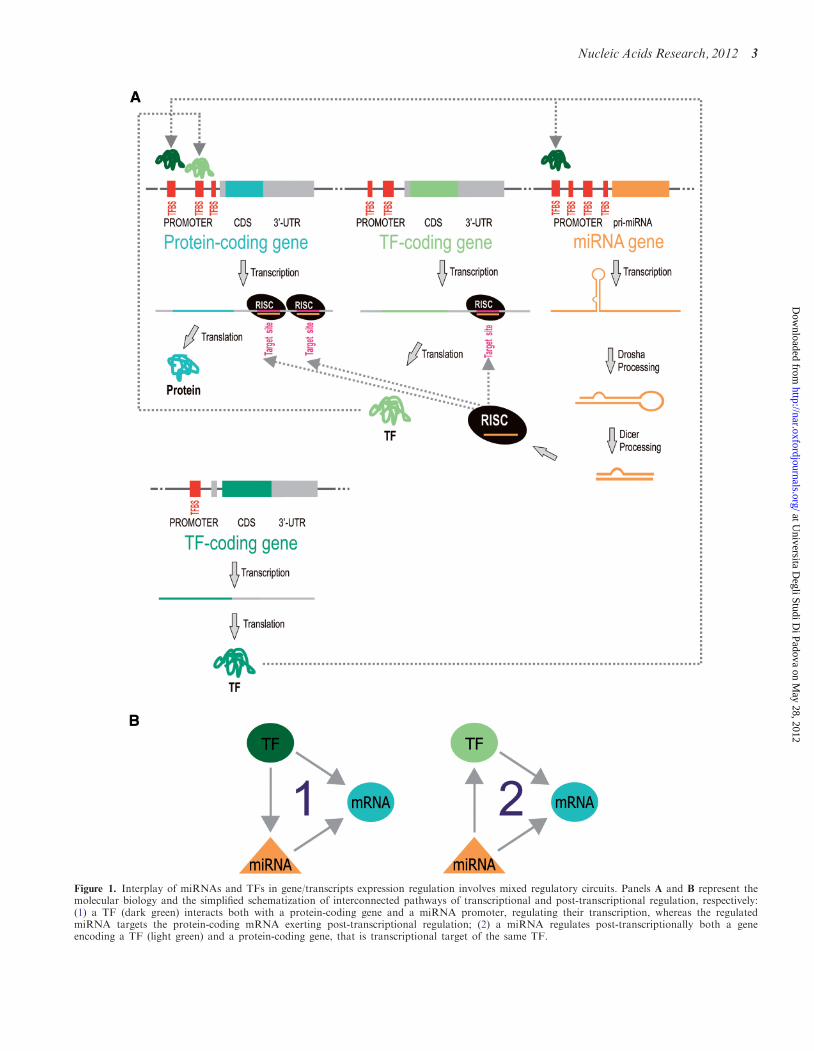
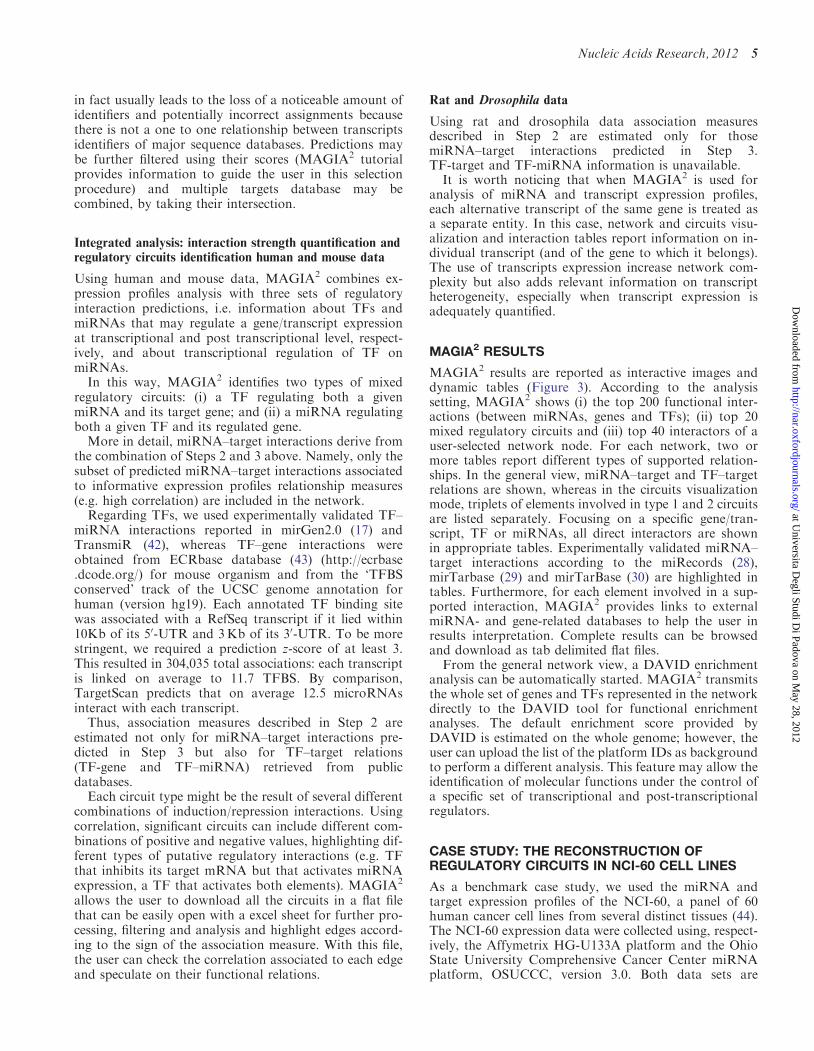
Figure 1. Interplay of miRNAs and TFs in gene/transcripts expression regulation involves mixed regulatory circuits. Panels A and B represent themolecular biology and the simplified schematization of interconnected pathways of transcriptional and post-transcriptional regulation, respectively:(1) a TF (dark green) interacts both with a protein-coding gene and a miRNA promoter, regulating their transcription, whereas the regulatedmiRNA targets the protein-coding mRNA exerting post-transcriptional regulation; (2) a miRNA regulates post-transcriptionally both a geneencoding a TF (light green) and a protein-coding gene, that is transcriptional target of the same TF.
Nucleic Acids Research, 2012 3
at Universita D
egli Studi Di Padova on M
ay 28, 2012http://nar.oxfordjournals.org/
Dow
nloaded from
MAGIA2 input files requires that column labels representsample classes. When matrices have been successfullyuploaded, the user has now created his personalenvironment.No registration is required to use MAGIA2. To map a
user to his personal environment, two standard mechan-isms for session management are used: (i) a cookie is set inthe user browser; (ii) a session id is appended to each webapplication url.The second mechanism allows users to share their
personal environment (data and analyses) with collabor-ators. Moreover, the design of MAGIA2 allows two ormore users to perform analyses at the same time on
a shared environment without explicit notification orlocking.
Analysis setup
After data upload, the user can setup a new analysis usingdata available in his environment and specify settings in afew simple steps.
Step 1: selection of expression matricesAfter creating the ‘My data’ environment, the user canselect two matrices, one for gene/transcripts and one formiRNA expression data. As the presence of miRNAs andgenes with poorly variable expression profiles may intro-duce noise and produce false-positive associations, bydefault MAGIA2 filters profiles according to their expres-sion variability, calculated through the variation coeffi-cient (CV): the 25% less variable profiles (both formiRNAs and for genes/transcripts) are removed. Thisvariability filter can be explicitly skipped using a checkbox in case the data selected by the user are alreadyfiltered. This may apply to a user pre-selected subset ofdifferentially expressed miRNAs that need to be all con-sidered for network reconstruction.
Step 2: selection of the association measureThe selection of the association measures is strictly de-pendent on the experimental design chosen by the user.For matched design, three methods for expression profilescombination are available (parametric, non-parametriclinear correlation and association measure based on infor-mation theory), while for un-matched design only ameta-analysis is possible. The Spearman correlation is anon-parametric, rank-based linear correlation measuresuitable for non-normally distributed data and/or smallsample size (e.g. 3–5). Pearson correlation is a parametriclinear correlation measure, suggested for normallydistributed data and medium-large sample size (>5).Mutual information is an information measure quantify-ing the mutual dependence of variables, includingnon-linear relationships and in general is suitable forlarge sample size (at least 20 needed).
Meta analysis approach is based on the combination ofP-values of differential expression (using empirical Bayestest) (33), separately for genes and miRNAs across sampleclasses, using the inverse chi square distribution to identifyoppositely variable miRNA–target pairs (21).
Step 3: selection of the target prediction algorithmsMAGIA2 makes use of eight different catalogs of targetpredictions: Microcosm (34), microrna.org (35),DIANA-microT (36), miRDB (37), PicTar (38), PITA(39), RNA22 (40) and TargetScan (41). Unfortunatelynot all of them use the same identifiers to refer to genesand transcripts. MAGIA2 relieves the user from directlyaddressing this issue by converting identifiers at the startof each analysis. In case of a conversion requiring multiplesteps (e.g. if the user upload matrices with Ensemble geneIds, their conversion to Refseq would require two steps:Ensemble gene ID—Ensemble transcript ID andEnsemble transcript ID—RefSeq), MAGIA2 warns theuser. ID conversion, from one transcript ID to another,
Figure 2. MAGIA2 flow chart illustrating the different steps imple-mented with the back- and front-end in Upload, Analysis andResults sections of MAGIA2.
4 Nucleic Acids Research, 2012
at Universita D
egli Studi Di Padova on M
ay 28, 2012http://nar.oxfordjournals.org/
Dow
nloaded from
in fact usually leads to the loss of a noticeable amount ofidentifiers and potentially incorrect assignments becausethere is not a one to one relationship between transcriptsidentifiers of major sequence databases. Predictions maybe further filtered using their scores (MAGIA2 tutorialprovides information to guide the user in this selectionprocedure) and multiple targets database may becombined, by taking their intersection.
Integrated analysis: interaction strength quantification andregulatory circuits identification human and mouse data
Using human and mouse data, MAGIA2 combines ex-pression profiles analysis with three sets of regulatoryinteraction predictions, i.e. information about TFs andmiRNAs that may regulate a gene/transcript expressionat transcriptional and post transcriptional level, respect-ively, and about transcriptional regulation of TF onmiRNAs.
In this way, MAGIA2 identifies two types of mixedregulatory circuits: (i) a TF regulating both a givenmiRNA and its target gene; and (ii) a miRNA regulatingboth a given TF and its regulated gene.
More in detail, miRNA–target interactions derive fromthe combination of Steps 2 and 3 above. Namely, only thesubset of predicted miRNA–target interactions associatedto informative expression profiles relationship measures(e.g. high correlation) are included in the network.
Regarding TFs, we used experimentally validated TF–miRNA interactions reported in mirGen2.0 (17) andTransmiR (42), whereas TF–gene interactions wereobtained from ECRbase database (43) (http://ecrbase.dcode.org/) for mouse organism and from the ‘TFBSconserved’ track of the UCSC genome annotation forhuman (version hg19). Each annotated TF binding sitewas associated with a RefSeq transcript if it lied within10Kb of its 50-UTR and 3Kb of its 30-UTR. To be morestringent, we required a prediction z-score of at least 3.This resulted in 304,035 total associations: each transcriptis linked on average to 11.7 TFBS. By comparison,TargetScan predicts that on average 12.5 microRNAsinteract with each transcript.
Thus, association measures described in Step 2 areestimated not only for miRNA–target interactions pre-dicted in Step 3 but also for TF–target relations(TF-gene and TF–miRNA) retrieved from publicdatabases.
Each circuit type might be the result of several differentcombinations of induction/repression interactions. Usingcorrelation, significant circuits can include different com-binations of positive and negative values, highlighting dif-ferent types of putative regulatory interactions (e.g. TFthat inhibits its target mRNA but that activates miRNAexpression, a TF that activates both elements). MAGIA2
allows the user to download all the circuits in a flat filethat can be easily open with a excel sheet for further pro-cessing, filtering and analysis and highlight edges accord-ing to the sign of the association measure. With this file,the user can check the correlation associated to each edgeand speculate on their functional relations.
Rat and Drosophila data
Using rat and drosophila data association measuresdescribed in Step 2 are estimated only for thosemiRNA–target interactions predicted in Step 3.TF-target and TF-miRNA information is unavailable.It is worth noticing that when MAGIA2 is used for
analysis of miRNA and transcript expression profiles,each alternative transcript of the same gene is treated asa separate entity. In this case, network and circuits visu-alization and interaction tables report information on in-dividual transcript (and of the gene to which it belongs).The use of transcripts expression increase network com-plexity but also adds relevant information on transcriptheterogeneity, especially when transcript expression isadequately quantified.
MAGIA2 RESULTS
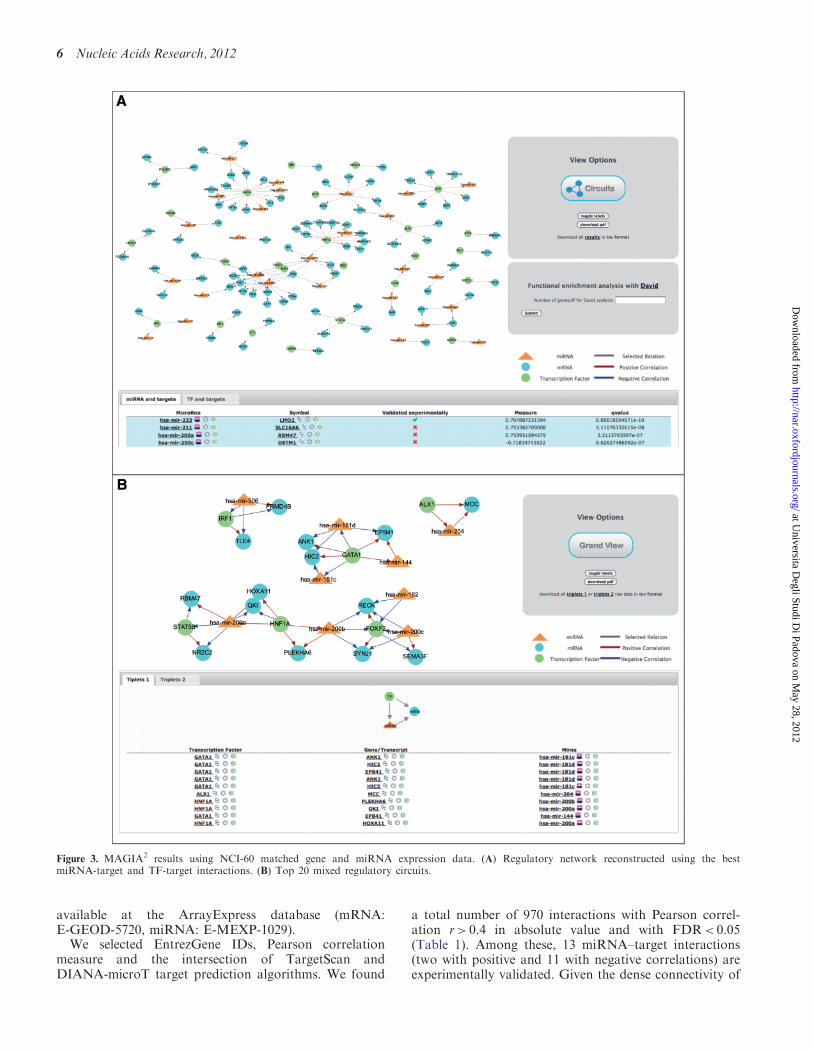
MAGIA2 results are reported as interactive images anddynamic tables (Figure 3). According to the analysissetting, MAGIA2 shows (i) the top 200 functional inter-actions (between miRNAs, genes and TFs); (ii) top 20mixed regulatory circuits and (iii) top 40 interactors of auser-selected network node. For each network, two ormore tables report different types of supported relation-ships. In the general view, miRNA–target and TF–targetrelations are shown, whereas in the circuits visualizationmode, triplets of elements involved in type 1 and 2 circuitsare listed separately. Focusing on a specific gene/tran-script, TF or miRNAs, all direct interactors are shownin appropriate tables. Experimentally validated miRNA–target interactions according to the miRecords (28),mirTarbase (29) and mirTarBase (30) are highlighted intables. Furthermore, for each element involved in a sup-ported interaction, MAGIA2 provides links to externalmiRNA- and gene-related databases to help the user inresults interpretation. Complete results can be browsedand download as tab delimited flat files.From the general network view, a DAVID enrichment
analysis can be automatically started. MAGIA2 transmitsthe whole set of genes and TFs represented in the networkdirectly to the DAVID tool for functional enrichmentanalyses. The default enrichment score provided byDAVID is estimated on the whole genome; however, theuser can upload the list of the platform IDs as backgroundto perform a different analysis. This feature may allow theidentification of molecular functions under the control ofa specific set of transcriptional and post-transcriptionalregulators.
CASE STUDY: THE RECONSTRUCTION OFREGULATORY CIRCUITS IN NCI-60 CELL LINES
As a benchmark case study, we used the miRNA andtarget expression profiles of the NCI-60, a panel of 60human cancer cell lines from several distinct tissues (44).The NCI-60 expression data were collected using, respect-ively, the Affymetrix HG-U133A platform and the OhioState University Comprehensive Cancer Center miRNAplatform, OSUCCC, version 3.0. Both data sets are
Nucleic Acids Research, 2012 5
at Universita D
egli Studi Di Padova on M
ay 28, 2012http://nar.oxfordjournals.org/
Dow
nloaded from
available at the ArrayExpress database (mRNA:E-GEOD-5720, miRNA: E-MEXP-1029).We selected EntrezGene IDs, Pearson correlation
measure and the intersection of TargetScan andDIANA-microT target prediction algorithms. We found
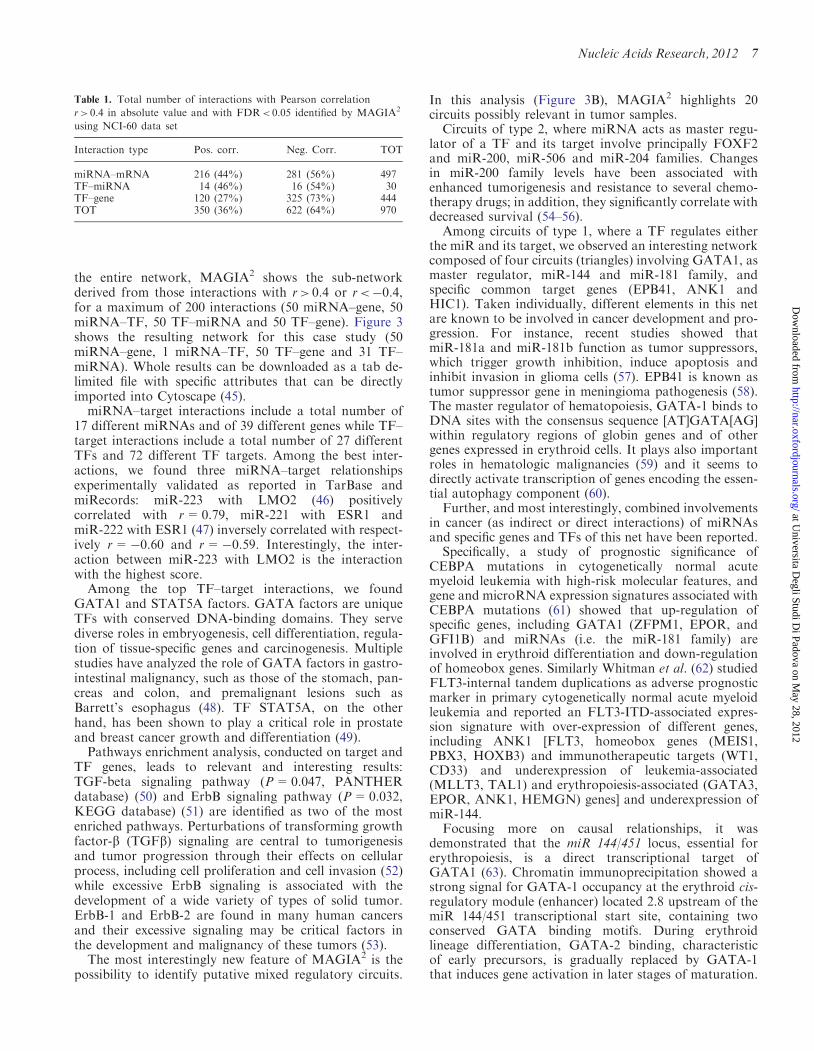
a total number of 970 interactions with Pearson correl-ation r> 0.4 in absolute value and with FDR< 0.05(Table 1). Among these, 13 miRNA–target interactions(two with positive and 11 with negative correlations) areexperimentally validated. Given the dense connectivity of
Figure 3. MAGIA2 results using NCI-60 matched gene and miRNA expression data. (A) Regulatory network reconstructed using the bestmiRNA-target and TF-target interactions. (B) Top 20 mixed regulatory circuits.
6 Nucleic Acids Research, 2012
at Universita D
egli Studi Di Padova on M
ay 28, 2012http://nar.oxfordjournals.org/
Dow
nloaded from
the entire network, MAGIA2 shows the sub-networkderived from those interactions with r> 0.4 or r<�0.4,for a maximum of 200 interactions (50 miRNA–gene, 50miRNA–TF, 50 TF–miRNA and 50 TF–gene). Figure 3shows the resulting network for this case study (50miRNA–gene, 1 miRNA–TF, 50 TF–gene and 31 TF–miRNA). Whole results can be downloaded as a tab de-limited file with specific attributes that can be directlyimported into Cytoscape (45).
miRNA–target interactions include a total number of17 different miRNAs and of 39 different genes while TF–target interactions include a total number of 27 differentTFs and 72 different TF targets. Among the best inter-actions, we found three miRNA–target relationshipsexperimentally validated as reported in TarBase andmiRecords: miR-223 with LMO2 (46) positivelycorrelated with r=0.79, miR-221 with ESR1 andmiR-222 with ESR1 (47) inversely correlated with respect-ively r=�0.60 and r=�0.59. Interestingly, the inter-action between miR-223 with LMO2 is the interactionwith the highest score.
Among the top TF–target interactions, we foundGATA1 and STAT5A factors. GATA factors are uniqueTFs with conserved DNA-binding domains. They servediverse roles in embryogenesis, cell differentiation, regula-tion of tissue-specific genes and carcinogenesis. Multiplestudies have analyzed the role of GATA factors in gastro-intestinal malignancy, such as those of the stomach, pan-creas and colon, and premalignant lesions such asBarrett’s esophagus (48). TF STAT5A, on the otherhand, has been shown to play a critical role in prostateand breast cancer growth and differentiation (49).
Pathways enrichment analysis, conducted on target andTF genes, leads to relevant and interesting results:TGF-beta signaling pathway (P=0.047, PANTHERdatabase) (50) and ErbB signaling pathway (P=0.032,KEGG database) (51) are identified as two of the mostenriched pathways. Perturbations of transforming growthfactor-b (TGFb) signaling are central to tumorigenesisand tumor progression through their effects on cellularprocess, including cell proliferation and cell invasion (52)while excessive ErbB signaling is associated with thedevelopment of a wide variety of types of solid tumor.ErbB-1 and ErbB-2 are found in many human cancersand their excessive signaling may be critical factors inthe development and malignancy of these tumors (53).
The most interestingly new feature of MAGIA2 is thepossibility to identify putative mixed regulatory circuits.
In this analysis (Figure 3B), MAGIA2 highlights 20circuits possibly relevant in tumor samples.Circuits of type 2, where miRNA acts as master regu-
lator of a TF and its target involve principally FOXF2and miR-200, miR-506 and miR-204 families. Changesin miR-200 family levels have been associated withenhanced tumorigenesis and resistance to several chemo-therapy drugs; in addition, they significantly correlate withdecreased survival (54–56).Among circuits of type 1, where a TF regulates either
the miR and its target, we observed an interesting networkcomposed of four circuits (triangles) involving GATA1, asmaster regulator, miR-144 and miR-181 family, andspecific common target genes (EPB41, ANK1 andHIC1). Taken individually, different elements in this netare known to be involved in cancer development and pro-gression. For instance, recent studies showed thatmiR-181a and miR-181b function as tumor suppressors,which trigger growth inhibition, induce apoptosis andinhibit invasion in glioma cells (57). EPB41 is known astumor suppressor gene in meningioma pathogenesis (58).The master regulator of hematopoiesis, GATA-1 binds toDNA sites with the consensus sequence [AT]GATA[AG]within regulatory regions of globin genes and of othergenes expressed in erythroid cells. It plays also importantroles in hematologic malignancies (59) and it seems todirectly activate transcription of genes encoding the essen-tial autophagy component (60).Further, and most interestingly, combined involvements
in cancer (as indirect or direct interactions) of miRNAsand specific genes and TFs of this net have been reported.Specifically, a study of prognostic significance of
CEBPA mutations in cytogenetically normal acutemyeloid leukemia with high-risk molecular features, andgene and microRNA expression signatures associated withCEBPA mutations (61) showed that up-regulation ofspecific genes, including GATA1 (ZFPM1, EPOR, andGFI1B) and miRNAs (i.e. the miR-181 family) areinvolved in erythroid differentiation and down-regulationof homeobox genes. Similarly Whitman et al. (62) studiedFLT3-internal tandem duplications as adverse prognosticmarker in primary cytogenetically normal acute myeloidleukemia and reported an FLT3-ITD-associated expres-sion signature with over-expression of different genes,including ANK1 [FLT3, homeobox genes (MEIS1,PBX3, HOXB3) and immunotherapeutic targets (WT1,CD33) and underexpression of leukemia-associated(MLLT3, TAL1) and erythropoiesis-associated (GATA3,EPOR, ANK1, HEMGN) genes] and underexpression ofmiR-144.Focusing more on causal relationships, it was
demonstrated that the miR 144/451 locus, essential forerythropoiesis, is a direct transcriptional target ofGATA1 (63). Chromatin immunoprecipitation showed astrong signal for GATA-1 occupancy at the erythroid cis-regulatory module (enhancer) located 2.8 upstream of themiR 144/451 transcriptional start site, containing twoconserved GATA binding motifs. During erythroidlineage differentiation, GATA-2 binding, characteristicof early precursors, is gradually replaced by GATA-1that induces gene activation in later stages of maturation.
Table 1. Total number of interactions with Pearson correlation
r> 0.4 in absolute value and with FDR< 0.05 identified by MAGIA2
using NCI-60 data set
Interaction type Pos. corr. Neg. Corr. TOT
miRNA–mRNA 216 (44%) 281 (56%) 497TF–miRNA 14 (46%) 16 (54%) 30TF–gene 120 (27%) 325 (73%) 444TOT 350 (36%) 622 (64%) 970
Nucleic Acids Research, 2012 7
at Universita D
egli Studi Di Padova on M
ay 28, 2012http://nar.oxfordjournals.org/
Dow
nloaded from
In summary, we can affirm first that key cancer genes,TFs and miRNAs are represented in top circuits blindlyidentified by MAGIA2 mixed circuits reconstruction basedon cancer cell lines expression data. Furthermore, bothcombined involvement in cancer signatures and/or the ex-istence of direct regulatory interactions relevant for celldifferentiation regarding different pairs among the set ofTFs, miRNAs and target genes found in MAGIA2 mixedcircuits clearly corroborates the biological significance ofmixed regulatory circuits identified by MAGIA2.
ACKNOWLEDGEMENTS
We acknowledge the CINECA Award N. HP10BDJ9X8,2010 for the availability of high performance computingresources and support.
FUNDING
Funding for open access charge: University ofPadova [CPDA119031 to C.R.] to S.B. and to A.C.;Associazione Italiana per la Ricerca sul Cancro (AIRC,Milano) ‘Special Program Molecular Clinical Oncology5x1000’ to AGIMM (AIRC-Gruppo Italiano MalattieMieloproliferative).
Conflict of interest statement. None declared.
REFERENCES
1. Miller,B.H. and Wahlestedt,C. (2010) MicroRNA dysregulation inpsychiatric disease. Brain Res., 1338, 89–99.
2. Maes,O.C., Chertkow,H.M., Wang,E. and Schipper,H.M. (2009)MicroRNA: implications for Alzheimer disease and other humanCNS disorders. Curr. Genomics, 10, 154–168.
3. Ha,T.-Y. (2011) MicroRNAs in human diseases: from cancer tocardiovascular disease. Immune Netw., 11, 135–154.
4. Esquela-Kerscher,A. and Slack,F.J. (2006) Oncomirs: microRNAswith a role in cancer. Nat. Rev. Cancer, 6, 259–269.
5. O’Connell,R.M., Rao,D.S., Chaudhuri,A.A. and Baltimore,D.(2010) Physiological and pathological roles for microRNAs in theimmune system. Nat. Rev. Immunol., 10, 111–122.
6. Rajewsky,N. (2006) microRNA target predictions in animals. Nat.Genet., 38(Suppl), S8–S13.
7. Flynt,A.S. and Lai,E.C. (2008) Biological principles ofmicroRNA-mediated regulation: shared themes amid diversity.Nat. Rev. Genet., 9, 831–842.
8. Alexiou,P., Maragkakis,M., Papadopoulos,G.L., Reczko,M. andHatzigeorgiou,A.G. (2009) Lost in translation: an assessment andperspective for computational microRNA target identification.Bioinformatics, 25, 3049–3055.
9. Ma,L., Huang,Y., Zhu,W., Zhou,S., Zhou,J., Zeng,F., Liu,X.,Zhang,Y. and Yu,J. (2011) An integrated analysis of miRNA andmRNA expressions in non-small cell lung cancers. PLoS One, 6,e26502.
10. Nunez-Iglesias,J., Liu,C.-C., Morgan,T.E., Finch,C.E. andZhou,X.J. (2010) Joint genome-wide profiling of miRNA andmRNA expression in Alzheimer’s disease cortex reveals alteredmiRNA regulation. PLoS One, 5, e8898.
11. Croce,C.M. (2009) Causes and consequences of microRNAdysregulation in cancer. Nat. Rev. Genet., 10, 704–714.
12. Lai,E.C. (2005) miRNAs: whys and wherefores ofmiRNA-mediated regulation. Curr. Biol., 15, R458–R460.
13. Dorsett,Y., McBride,K.M., Jankovic,M., Gazumyan,A.,Thai,T.-H., Robbiani,D.F., Di Virgilio,M., Reina San-Martin,B.,Heidkamp,G., Schwickert,T.A. et al. (2008) MicroRNA-155
suppresses activation-induced cytidine deaminase-mediatedMyc-Igh translocation. Immunity, 28, 630–638.
14. Cui,Q., Yu,Z., Pan,Y., Purisima,E.O. and Wang,E. (2007)MicroRNAs preferentially target the genes with hightranscriptional regulation complexity. Biochem. Biophys. Res.Commun., 352, 733–738.
15. Inui,M., Martello,G. and Piccolo,S. (2010) MicroRNA control ofsignal transduction. Nat. Rev. Mol. Cell Biol., 11, 252–263.
16. Wang,J., Lu,M., Qiu,C. and Cui,Q. (2010) TransmiR: atranscription factor-microRNA regulation database. Nucleic AcidsRes., 38, D119–D122.
17. Friard,O., Re,A., Taverna,D., De Bortoli,M. and Cora,D. (2010)CircuitsDB: a database of mixed microRNA/transcription factorfeed-forward regulatory circuits in human and mouse. BMCBioinformatics, 11, 435.
18. El Baroudi,M., Cora,D., Bosia,C., Osella,M. and Caselle,M.(2011) A curated database of miRNA mediated feed-forwardloops involving MYC as master regulator. PLoS One, 6, e14742.
19. Le Bechec,A., Portales-Casamar,E., Vetter,G., Moes,M.,Zindy,P.-J., Saumet,A., Arenillas,D., Theillet,C.,Wasserman,W.W., Lecellier,C.-H. et al. (2011) MIR@NT@N: aframework integrating transcription factors, microRNAs and theirtargets to identify sub-network motifs in a meta-regulationnetwork model. BMC Bioinformatics, 12, 67.
20. Alexiou,P., Vergoulis,T., Gleditzsch,M., Prekas,G., Dalamagas,T.,Megraw,M., Grosse,I., Sellis,T. and Hatzigeorgiou,A.G. (2010)miRGen 2.0: a database of microRNA genomic information andregulation. Nucleic Acids Res., 38, D137–D141.
21. Sales,G., Coppe,A., Bisognin,A., Biasiolo,M., Bortoluzzi,S. andRomualdi,C. (2010) MAGIA, a web-based tool for miRNAand genes integrated analysis. Nucleic Acids Res., 38,W352–W359.
22. Nam,S., Li,M., Choi,K., Balch,C., Kim,S. and Nephew,K.P.(2009) MicroRNA and mRNA integrated analysis (MMIA): aweb tool for examining biological functions of microRNAexpression. Nucleic Acids Res., 37, W356–W362.
23. Liang,Z., Zhou,H., He,Z., Zheng,H. and Wu,J. (2011) mirAct: aweb tool for evaluating microRNA activity based on geneexpression data. Nucleic Acids Res., 39, W139–W144.
24. Huang,G.T., Athanassiou,C. and Benos,P.V. (2011) mirConnX:condition-specific mRNA-microRNA network integrator. NucleicAcids Res., 39, W416–W423.
25. Friedman,Y., Naamati,G. and Linial,M. (2010) MiRror: acombinatorial analysis web tool for ensembles of microRNAs andtheir targets. Bioinformatics, 26, 1920–1921.
26. Alexiou,P., Maragkakis,M., Papadopoulos,G.L., Simmosis,V.A.,Zhang,L. and Hatzigeorgiou,A.G. (2010) The DIANA-mirExTraweb server: from gene expression data to microRNA function.PLoS One, 5, e9171.
27. Nam,S., Kim,B., Shin,S. and Lee,S. (2007) miRGator: anintegrated system for functional annotation of microRNAs.Nucleic Acids Res., 36, D159–D164.
28. Xiao,F., Zuo,Z., Cai,G., Kang,S., Gao,X. and Li,T. (2009)miRecords: an integrated resource for microRNA-targetinteractions. Nucleic Acids Res., 37, D105–D110.
29. Vergoulis,T., Vlachos,I.S., Alexiou,P., Georgakilas,G.,Maragkakis,M., Reczko,M., Gerangelos,S., Koziris,N.,Dalamagas,T. and Hatzigeorgiou,A.G. (2012) TarBase 6.0:capturing the exponential growth of miRNA targets withexperimental support. Nucleic Acids Res., 40, D222–D229.
30. Hsu,S.-D., Lin,F.-M., Wu,W.-Y., Liang,C., Huang,W.-C.,Chan,W.-L., Tsai,W.-T., Chen,G.-Z., Lee,C.-J., Chiu,C.-M. et al.(2011) miRTarBase: a database curates experimentally validatedmicroRNA-target interactions. Nucleic Acids Res., 39,D163–D169.
31. Ferrari,F., Bortoluzzi,S., Coppe,A., Sirota,A., Safran,M.,Shmoish,M., Ferrari,S., Lancet,D., Danieli,G.A. and Bicciato,S.(2007) Novel definition files for human GeneChips based onGeneAnnot. BMC Bioinformatics, 8, 446.
32. Dai,M., Wang,P., Boyd,A.D., Kostov,G., Athey,B., Jones,E.G.,Bunney,W.E., Myers,R.M., Speed,T.P., Akil,H. et al. (2005)Evolving gene/transcript definitions significantly alter theinterpretation of GeneChip data. Nucleic Acids Res., 33, e175.
8 Nucleic Acids Research, 2012
at Universita D
egli Studi Di Padova on M
ay 28, 2012http://nar.oxfordjournals.org/
Dow
nloaded from
33. Smyth,G.K. (2004) Linear models and empirical bayes methodsfor assessing differential expression in microarray experiments.Stat. Appl. Genet. Mol. Biol., 3, Article 3.
34. Griffiths-Jones,S., Saini,H.K., van Dongen,S. and Enright,A.J.(2008) miRBase: tools for microRNA genomics. Nucleic AcidsRes., 36, D154–D158.
35. Betel,D., Wilson,M., Gabow,A., Marks,D.S. and Sander,C. (2007)The microRNA.org resource: targets and expression. NucleicAcids Res., 36, D149–D153.
36. Maragkakis,M., Alexiou,P., Papadopoulos,G.L., Reczko,M.,Dalamagas,T., Giannopoulos,G., Goumas,G., Koukis,E.,Kourtis,K., Simossis,V.A. et al. (2009) Accurate microRNA targetprediction correlates with protein repression levels. BMCBioinformatics, 10, 295.
37. Wang,X. (2008) miRDB: a microRNA target prediction andfunctional annotation database with a wiki interface. RNA, 14,1012–1017.
38. Krek,A., Grun,D., Poy,M.N., Wolf,R., Rosenberg,L.,Epstein,E.J., MacMenamin,P., da Piedade,I., Gunsalus,K.C.,Stoffel,M. et al. (2005) Combinatorial microRNA targetpredictions. Nat. Genet., 37, 495–500.
39. Kertesz,M., Iovino,N., Unnerstall,U., Gaul,U. and Segal,E. (2007)The role of site accessibility in microRNA target recognition.Nat. Genet., 39, 1278–1284.
40. Miranda,K.C., Huynh,T., Tay,Y., Ang,Y.-S., Tam,W.-L.,Thomson,A.M., Lim,B. and Rigoutsos,I. (2006) A pattern-basedmethod for the identification of microRNA binding sites andtheir corresponding heteroduplexes. Cell, 126, 1203–1217.
41. Grimson,A., Farh,K.K.-H., Johnston,W.K., Garrett-Engele,P.,Lim,L.P. and Bartel,D.P. (2007) MicroRNA targeting specificityin mammals: determinants beyond seed pairing. Mol. Cell, 27,91–105.
42. Wang,J., Lu,M., Qiu,C. and Cui,Q. (2010) TransmiR: atranscription factor–microRNA regulation database. Nucleic AcidsRes., 38, D119–D122.
43. Loots,G.G. and Ovcharenko,I. (2007) ECRbase: database ofevolutionary conserved regions, promoters, and transcriptionfactor binding sites in vertebrate genomes. Bioinformatics, 23,122–124.
44. Weinstein,J.N. (2006) Spotlight on molecular profiling:‘‘Integromic’’ analysis of the NCI-60 cancer cell lines. Mol.Cancer Ther., 5, 2601–2605.
45. Smoot,M.E., Ono,K., Ruscheinski,J., Wang,P.L. and Ideker,T.(2011) Cytoscape 2.8: new features for data integration andnetwork visualization. Bioinformatics, 27, 431–432.
46. Yuan,J.-Y., Wang,F., Yu,J., Yang,G.-H., Liu,X.-L. and Zhang,J.-W. (2009) MicroRNA-223 reversibly regulates erythroid andmegakaryocytic differentiation of K562 cells. J. Cell. Mol. Med.,13, 4551–4559.
47. Zhao,J.-J., Lin,J., Yang,H., Kong,W., He,L., Ma,X., Coppola,D.and Cheng,J.Q. (2008) MicroRNA-221/222 negatively regulatesestrogen receptor alpha and is associated with tamoxifenresistance in breast cancer. J. Biol. Chem., 283, 31079–31086.
48. Ayanbule,F., Belaguli,N.S. and Berger,D.H. (2011) GATA factorsin gastrointestinal malignancy. World J. Surg., 35, 1757–1765.
49. Koptyra,M., Gupta,S., Talati,P. and Nevalainen,M.T. (2011)Signal transducer and activator of transcription 5a/b: biomarkerand therapeutic target in prostate and breast cancer. Int. J.Biochem. Cell Biol., 43, 1417–1421.
50. Thomas,P.D., Kejariwal,A., Campbell,M.J., Mi,H., Diemer,K.,Guo,N., Ladunga,I., Ulitsky-Lazareva,B., Muruganujan,A.,Rabkin,S. et al. (2003) PANTHER: a browsable database of gene
products organized by biological function, using curated proteinfamily and subfamily classification. Nucleic Acids Res., 31,334–341.
51. Kanehisa,M. and Goto,S. (2000) KEGG: kyoto encyclopedia ofgenes and genomes. Nucleic Acids Res., 28, 27–30.
52. Blobe,G.C., Schiemann,W.P. and Lodish,H.F. (2000) Role oftransforming growth factor beta in human disease. N. Engl. J.Med., 342, 1350–1358.
53. Normanno,N., De Luca,A., Bianco,C., Strizzi,L., Mancino,M.,Maiello,M.R., Carotenuto,A., De Feo,G., Caponigro,F. andSalomon,D.S. (2006) Epidermal growth factor receptor (EGFR)signaling in cancer. Gene, 366, 2–16.
54. Marchini,S., Cavalieri,D., Fruscio,R., Calura,E., Garavaglia,D.,Nerini,I.F., Mangioni,C., Cattoretti,G., Clivio,L., Beltrame,L.et al. (2011) Association between miR-200c and the survival ofpatients with stage I epithelial ovarian cancer: a retrospectivestudy of two independent tumour tissue collections. Lancet Oncol,12, 273–285.
55. Pogribny,I.P., Filkowski,J.N., Tryndyak,V.P., Golubov,A.,Shpyleva,S.I. and Kovalchuk,O. (2010) Alterations of microRNAsand their targets are associated with acquired resistance ofMCF-7 breast cancer cells to cisplatin. Int. J. Cancer, 127,1785–1794.
56. Iorio,M.V., Visone,R., Di Leva,G., Donati,V., Petrocca,F.,Casalini,P., Taccioli,C., Volinia,S., Liu,C.-G., Alder,H. et al.(2007) MicroRNA signatures in human ovarian cancer. CancerRes., 67, 8699–8707.
57. Shi,L., Cheng,Z., Zhang,J., Li,R., Zhao,P., Fu,Z. and You,Y.(2008) hsa-mir-181a and hsa-mir-181b function as tumorsuppressors in human glioma cells. Brain Res., 1236, 185–193.
58. Piaskowski,S., Rieske,P., Szybka,M., Wozniak,K., Bednarek,A.,Pluciennik,E., Jaskolski,D., Sikorska,B. and Liberski,P.P. (2005)GADD45A and EPB41 as tumor suppressor genes in meningiomapathogenesis. Cancer Genet. Cytogenet., 162, 63–67.
59. Bresnick,E.H., Katsumura,K.R., Lee,H.Y., Johnson,K.D. andPerkins,A.S. (2012) Master regulatory GATA transcriptionfactors: mechanistic principles and emerging links to hematologicmalignancies. Nucleic Acids Res., April 5 (doi:10.1093/nar/gks281;epub ahead of print).
60. Kang,Y.A., Sanalkumar,R., O’Geen,H., Linnemann,A.K.,Chang,C.J., Bouhassira,E.E., Farnham,P.J., Keles,S. andBresnick,E.H. (2012) Autophagy driven by a master regulator ofhematopoiesis. Mol. Cell Biol., 32, 226–239.
61. Marcucci,G., Maharry,K., Radmacher,M.D., Mrozek,K.,Vukosavljevic,T., Paschka,P., Whitman,S.P., Langer,C.,Baldus,C.D., Liu,C.G. et al. (2008) Prognostic significance of, andgene and microRNA expression signatures associated with,CEBPA mutations in cytogenetically normal acute myeloidleukemia with high-risk molecular features: a cancer and leukemiagroup B study. J. Clin. Oncol., 26, 5078–5087.
62. Whitman,S.P., Maharry,K., Radmacher,M.D., Becker,H.,Mrozek,K., Margeson,D., Holland,K.B., Wu,Y.Z., Schwind,S.,Metzeler,K.H. et al. (2010) FLT3 internal tandem duplicationassociates with adverse outcome and gene- andmicroRNA-expression signatures in patients 60 years of age orolder with primary cytogenetically normal acute myeloidleukemia: a cancer and leukemia group B study. Blood, 116,3622–3626.
63. Dore,L.C., Amigo,J.D., Dos Santos,C.O., Zhang,Z., Gai,X.,Tobias,J.W., Yu,D., Klein,A.M., Dorman,C., Wu,W. et al. (2008)A GATA-1-regulated microRNA locus essential forerythropoiesis. Proc. Natl Acad. Sci. USA, 105, 3333–3338.
Nucleic Acids Research, 2012 9
at Universita D
egli Studi Di Padova on M
ay 28, 2012http://nar.oxfordjournals.org/
Dow
nloaded from