Embed Size (px)
Citation preview
2/26/2015 Magic Quadrant for Business Intelligence and Analytics Platforms
http://www.gartner.com/technology/reprints.do?id=12AH4Q85&ct=150224&st=sb 1/38
Magic Quadrant for Business Intelligence andAnalytics Platforms23 February 2015 ID:G00270380
Analyst(s): Rita L. Sallam, Bill Hostmann, Kurt Schlegel, Joao Tapadinhas, Josh Parenteau, Thomas W.Oestreich
VIEW SUMMARY
Traditional BI market share leaders are being disrupted by platforms that expand access to analytics anddeliver higher business value. BI leaders should track how traditionalists translate their forwardlookingproduct investments into renewed momentum and an improved customer experience.
Market Definition/DescriptionBI and Analytics Platform Capabilities DefinitionThe BI and analytics platform market is undergoing a fundamental shift. During the past ten years, BIplatform investments have largely been in ITled consolidation and standardization projects for largescalesystemsofrecord reporting. These have tended to be highly governed and centralized, where ITauthored production reports were pushed out to inform a broad array of information consumers andanalysts. Now, a wider range of business users are demanding access to interactive styles of analysis andinsights from advanced analytics, without requiring them to have IT or data science skills. As demandfrom business users for pervasive access to data discovery capabilities grows, IT wants to deliver on thisrequirement without sacrificing governance.
While the need for systemofrecord reporting to run businesses remains, there is a significant change inhow companies are satisfying these and new businessuserdriven requirements. They are increasinglyshifting from using the installed base, traditional, ITcentric platforms that are the enterprise standard, tomore decentralized data discovery deployments that are now spreading across the enterprise. Thetransition is to platforms that can be rapidly implemented and can be used by either analysts andbusiness users, to find insights quickly, or by IT to quickly build analytics content to meet businessrequirements to deliver more timely business benefits. Gartner estimates that more than half of net newpurchasing is datadiscoverydriven (see "Market Trends: Business Intelligence Tipping Points Herald aNew Era of Analytics"). This shift to a decentralized model that is empowering more business users alsodrives the need for a governed data discovery approach.
This is a continuation of a sixyear trend, where the installedbase, ITcentric platforms are routinelybeing complemented, and in 2014, they were increasingly displaced for new deployments and projectswith businessuserdriven data discovery and interactive analysis techniques. This is also increasing IT'sconcerns and requirements around governance as deployments grow. Making analytics more accessibleand pervasive to a broader range of users and use cases is the primary goal of organizations making thistransition.
Traditional BI platform vendors have tried very hard to meet the needs of the current market bydelivering their own businessuserdriven data discovery capabilities and enticing adoption throughbundling and integration with the rest of their stack. However, their offerings have been pale imitations ofthe successful data discovery specialists (the gold standard being Tableau) and as a result, have hadlimited adoption to date. Their investments in nextgeneration data discovery capabilities have thepotential to differentiate them and spur adoption, but these offerings are works in progress (for example,SAP Lumira and IBM Watson Analytics).
Also, in support of wider user adoption, companies and independent software vendors are increasinglyembedding traditional reporting, dashboards and interactive analysis into business processes orapplications. They are also incorporating more advanced and prescriptive analytics built from statisticalfunctions and algorithms available within the BI platform into analytics applications. This will deliverinsights to a broader range of analytics users that lack advanced analytics skills.
As companies implement a more decentralized and bimodal governed data discovery approach to BI,business users and analysts are also demanding access to selfservice capabilities beyond data discoveryand interactive visualization of ITcurated data sources. This includes access to sophisticated, yetbusinessuseraccessible, data preparation tools. Business users are also looking for easier and faster waysto discover relevant patterns and insights in data. In response, BI and analytics vendors are introducingselfservice data preparation (along with a number of startups such as ClearStory Data, Paxata, Trifactaand Tamr), and smart data discovery and pattern detection capabilities (also an area for startups such asBeyondCore and DataRPM) to address these emerging requirements and to create differentiation in themarket. The intent is to expand the use of analytics, particularly insight from advanced analytics, to abroad range of consumers and nontraditional BI users — increasingly on mobile devices and deployed inthe cloud.
Interest in cloud BI declined slightly during 2014, to 42% compared with last year's 45% — of customersurvey respondents reporting they either are (28%) or are planning to deploy (14%) BI in some form ofprivate, public or hybrid cloud. The interest continued to lean toward private cloud and comes primarilyfrom those lines of business (LOBs) where data for analysis is already in the cloud. As data gravity shiftsto the cloud and interest in deploying BI in the cloud expands, new market entrants such as SalesforceAnalytics Cloud, cloud BI startups and cloud BI offerings from onpremises vendors are emerging to meet
STRATEGIC PLANNING ASSUMPTIONS
By 2018, data discovery and data managementevolution will drive most organizations to augmentcentralized analytic architectures with decentralizedapproaches.
By 2017, most data discovery tools will haveincorporated smart data discovery capabilities toexpand the reach of interactive analysis.
By 2017, most business users and analysts inorganizations will have access to selfservice tools toprepare data for analysis.
By 2017, most business intelligence and analyticsplatforms will natively support multistructured dataand analysis.
Through 2016, less than 10% of selfservice businessintelligence initiatives will be governed sufficiently toprevent inconsistencies that adversely affect thebusiness.
ACRONYM KEY AND GLOSSARY TERMS
AWS Amazon Web Services
BI business intelligence
CPG consumer packaged goods
CPM corporate performance management
ETL extraction, transformation andloading
HDFS Hadoop Distributed File System
IoT Internet of Things
KPI key performance indicator
LOB line of business
MDX Multidimensional Expressions
OLAP online analytical processing
SMB small or midsize business
EVIDENCE
1 Gartner defines total software revenue as revenuethat is generated from appliances, new licenses,updates, subscriptions and hosting, technical support,and maintenance. Professional services revenue andhardware revenue are not included in total softwarerevenue (see "Market Share Analysis: BusinessIntelligence and Analytics Software, 2013").
Gartner's analysts, the ratings and commentary in thisreport are based on a number of sources: customers'perceptions of each vendor's strengths and challenges,as gleaned from their BIrelated inquiries to Gartner;an online survey of vendors' customers conducted inOctober 2014, which yielded 2,083 responses; aquestionnaire completed by the vendors; vendors'briefings including product demonstrations, strategyand operations; an extensive RFP questionnaireinquiring how each vendor delivers specific featuresthat make up the 13 critical capabilities (see updatedtoolkit); a prepared video demonstration of how wellvendor BI platforms address the 13 criticalcapabilities; and biscorecard.com research.
NOTE 1CHANGE IN CAPABILITIES DEFINITIONSFROM LAST YEAR'S MAGIC QUADRANT
Capabilities dropped/changed:
Microsoft Office integration was dropped as astandalone critical capability. It is factored intosubcriteria for IT Developed Reporting andDashboards (Produce)
2/26/2015 Magic Quadrant for Business Intelligence and Analytics Platforms
http://www.gartner.com/technology/reprints.do?id=12AH4Q85&ct=150224&st=sb 2/38
this demand and offer more options to buyers of BI and analytics platforms. While most BI vendors nowhave a cloud strategy, many leaders of BI and analytics initiatives do not have a strategy for how tocombine and integrate cloud services with their onpremises capabilities.
Moreover, companies are increasingly building analytics applications, leveraging a range of newmultistructured data sources that are both internal and external to the enterprise and stored in the cloudand onpremises to conduct new types of analysis, such as location analytics, sentiment and graphanalytics. The demand for native access to multistructured and streaming data combined with interactivevisualization and exploration capabilities comes mostly from early adopters, but are becoming increasinglyimportant platform features.
As a result of the market dynamics discussed above, for this Magic Quadrant, Gartner defines BI andanalytics as a software platform that delivers 13 critical capabilities across three categories — enable,produce and consume — in support of four use cases for BI and analytics. These capabilities supportbuilding an analytics portfolio that maps to shifting requirements from IT to the business. From deliveryof insights to the analytics consumer, through an information portal often deployed centrally by IT, to ananalytics workbench used by analysts requiring interactive and smart data exploration (see "How toArchitect the BI and Analytics Platform"), these capabilities enable BI leaders to support a range offunctions and use cases from systemofrecord reporting and analytic applications to decentralized selfservice data discovery. A data science lab would be an additional component of an analytics portfolio.Predictive and prescriptive analytics platform capabilities and vendors are covered in the "Magic Quadrantfor Advanced Analytics Platforms."
See Note 1 for how capability definitions in this year's Magic Quadrant have been modified from last yearto reflect our current view of the critical capabilities for BI and analytics platforms.
The 13 Critical Capabilities and Use CasesVendors are assessed for their support of four main use cases:
1. Centralized BI Provisioning: Supports a workflow from data to ITdeliveredandmanaged content.2. Decentralized Analytics: Supports a workflow from data to selfservice analytics.3. Governed Data Discovery: Supports a workflow from data to selfservice analytics to systemsof
record, ITmanaged content with governance, reusability and promotability.4. OEM/Embedded BI: Supports a workflow from data to embedded BI content in a process or
application.
Vendors are also assessed according to the following 13 critical capabilities. Subcriteria for each are listedin Note 2. How well Magic Quadrant Leaders' and Challengers' platforms support these critical capabilitiesis explored in greater detail in the "Critical Capabilities for BI and Analytics Platforms" (to be publishedshortly).
BI and Analytics Platform Capabilities for 2015
EnableBusiness User Data Mashup and Modeling: "Drag and drop," userdriven data combination ofdifferent sources and the creation of analytic models such as userdefined measures, sets, groupsand hierarchies. Advanced capabilities include semantic autodiscovery, intelligent joins, intelligentprofiling, hierarchy generation, data lineage and data blending on varied data sources, includingmultistructured data.
Internal Platform Integration: A common look and feel, install, query engine, shared metadata,promotability across all platform components.
BI Platform Administration: Capabilities that enable securing and administering users, scalingthe platform, optimizing performance and ensuring high availability and disaster recovery. Thesecapabilities should be common across all platform components.
Metadata Management: Tools for enabling users to leverage the same systemsofrecordsemantic model and metadata. They should provide a robust and centralized way for administratorsto search, capture, store, reuse and publish metadata objects, such as dimensions, hierarchies,measures, performance metrics/KPIs, and report layout objects, parameters and so on.Administrators should have the ability to promote a businessuserdefined data mashup andmetadata to the systemsofrecord metadata.
Cloud Deployment: Platform as a service and analytic application as a service capabilities forbuilding, deploying and managing analytics and analytic applications in the cloud, based on data bothin the cloud and onpremises.
Development and Integration: The platform should provide a set of programmatic and visualtools and a development workbench for building reports, dashboards, queries and analysis. It shouldenable scalable and personalized distribution, scheduling and alerts, and workflow of BI and analyticscontent and applications via email, to a portal or to mobile devices. It should include the ability toembed and customize BI platform components in a business process, application or portal.
ProduceFreeForm Interactive Exploration: Enables the exploration of data via the manipulation ofchart images, with the color, brightness, size, shape and motion of visual objects representingaspects of the dataset being analyzed. This includes an array of visualization options that go beyondthose of pie, bar and line charts, including heat and tree maps, geographic maps, scatter plots andother specialpurpose visuals. These tools enable users to analyze the data by interacting directlywith a visual representation of it.
Analytic Dashboards and Content: The ability to create highly interactive dashboards andcontent with visual exploration and embedded advanced and geospatial analytics to be consumed byothers.
ITDeveloped Reporting and Dashboards: Provides the ability to create highly formatted, printready and interactive reports, with or without parameters. ITauthored or centrally authoreddashboards are a style of reporting that graphically depicts performance measures. This includes theability to publish multiobject, linked reports and parameters with intuitive and interactive displays;dashboards often employ visualization components such as gauges, sliders, checkboxes and maps,and are often used to show the actual value of the measure compared with a goal or target value.Dashboards can represent operational or strategic information.
Traditional Styles of Analysis: Ad hoc query enables users to ask their own questions of the
Geospatial and Location Intelligence is now asubcriteria for Analytics Dashboards and Content(Produce)Support for Big Data Sources is now included as asubcriteria of Development and Integration(Enable)OLAP and Adhoc Query and Reporting are nowsubcriteria of Traditional Styles of Analysis(Produce)Embedded Advanced Analytics is now a subcriteriaof Analytics Dashboards and Content (Produce)Embeddable Analytics is now Embedded BI(Consume)SearchBased Data Discovery is now a subcriteriaof Freeform Data Exploration (Produce)Interactive Visualization is now subcriteria ofAnalytics Dashboards and Content and FreeformData Exploration (Produce)We have created two capabilities for dashboards:Analytics Dashboards and Content and ITDeveloped Reports and Dashboards, todifferentiate between businessuserdriven andfreeform interactive dashboards and those thatare ITdefined.Reporting is now part of IT Developer Reports andDashboards.
Capabilities Added:
Cloud Deployment
NOTE 2DETAILED CAPABILITIES SUBCRITERIA
Business User Data Mashup and Modeling: "Dragand drop," userdriven data combination of differentsources and the creation of analytic models, such asuserdefined measures, sets, groups and hierarchies.Advanced capabilities include semantic autodiscovery,intelligent joins, intelligent profiling, hierarchygeneration, data lineage and data blending on varieddata sources, including multistructured data.
Business user data mashup and joinsBusinessuserdefined calculations, groupingData inferenceData profiling and enrichmentBusiness user data lineage
Internal Platform Integration: A common look andfeel, install, query engine, shared metadata,promotability across all platform components.
Integration with complementary BI capabilitiesAbility to promote businessusergenerated datamashups to the systems of recordCommon security model and administrationapplication components across the platformIntegrated semantic/metadata layerIntegrated and common frontend tools
BI Platform Administration: Capabilities that enablesecuring and administering users, scaling the platform,optimizing performance and ensuring high availabilityand disaster recovery. These capabilities should becommon across all platform components.
ArchitectureSecurityUser administrationScalability and performanceHigh availability and disaster recovery
Metadata Management: Tools for enabling users toleverage the same systemsofrecord semantic modeland metadata. They should provide a robust andcentralized way for administrators to search, capture,store, reuse and publish metadata objects, such asdimensions, hierarchies, measures, performancemetrics/key performance indicators (KPIs), and reportlayout objects, parameters and so on. Administratorsshould have the ability to promote a businessuserdefined data mashup and metadata to the systemsofrecord metadata.
PromotabilityData modelingReuseConnectivity and data sourcesData lineage and impact analysis
Cloud Deployment: Platformasaservice andanalyticapplicationasaservice capabilities forbuilding, deploying and managing analytics andanalytic applications in the cloud based on data both inthe cloud and onpremises.
Builtin data management capabilities (includingdata integration and data warehouse)Specialpurpose connectors to cloudbased datasourcesDirect connect for both cloud and onpremises datasources (hybrid)Packaged contentSelfservice administrationSelfservice elasticity
Development and Integration: The platform shouldprovide a set of programmatic and visual tools and a
2/26/2015 Magic Quadrant for Business Intelligence and Analytics Platforms
http://www.gartner.com/technology/reprints.do?id=12AH4Q85&ct=150224&st=sb 3/38
data, without relying on IT to create a report. In particular, the tools must have a reusable semanticlayer to enable users to navigate available data sources, predefined metrics, hierarchies and so on.Online analytical processing (OLAP) enables users to analyze data with fast query and calculationperformance, enabling a style of analysis known as "slicing and dicing." Users are able to navigatemultidimensional drill paths. They also have the ability to writeback values to a database forplanning and "what if?" modeling. This capability could span a variety of data architectures (such asrelational, multidimensional or hybrid) and storage architectures (such as diskbased or inmemory).
ConsumeMobile: Enables organizations to develop and deliver content to mobile devices in a publishingand/or interactive mode, and takes advantage of mobile devices' native capabilities, such astouchscreen, camera, location awareness and naturallanguage query.
Collaboration and Social Integration: Enables users to share and discuss information, analysis,analytic content and decisions via discussion threads, chat, annotations and storytelling.
Embedded BI: Capabilities — including a software developer's kit with APIs and support for openstandards — for creating and modifying analytic content, visualizations and applications, andembedding them into a business process and/or an application or portal. These capabilities can resideoutside the application, reusing the analytic infrastructure, but must be easily and seamlesslyaccessible from inside the application, without forcing users to switch between systems. Thecapabilities for integrating BI and analytics with the application architecture will enable users tochoose where in the business process the analytics should be embedded.
Magic Quadrant
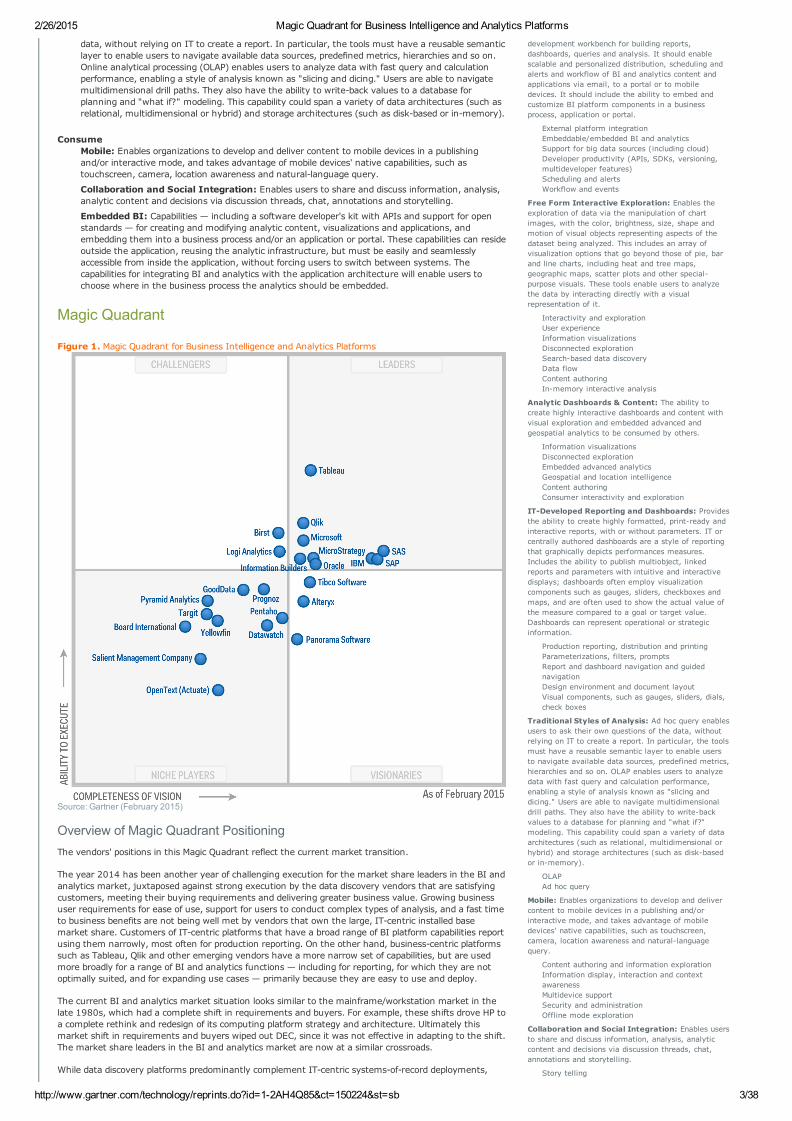
Figure 1. Magic Quadrant for Business Intelligence and Analytics Platforms
Source: Gartner (February 2015)
Overview of Magic Quadrant PositioningThe vendors' positions in this Magic Quadrant reflect the current market transition.
The year 2014 has been another year of challenging execution for the market share leaders in the BI andanalytics market, juxtaposed against strong execution by the data discovery vendors that are satisfyingcustomers, meeting their buying requirements and delivering greater business value. Growing businessuser requirements for ease of use, support for users to conduct complex types of analysis, and a fast timeto business benefits are not being well met by vendors that own the large, ITcentric installed basemarket share. Customers of ITcentric platforms that have a broad range of BI platform capabilities reportusing them narrowly, most often for production reporting. On the other hand, businesscentric platformssuch as Tableau, Qlik and other emerging vendors have a more narrow set of capabilities, but are usedmore broadly for a range of BI and analytics functions — including for reporting, for which they are notoptimally suited, and for expanding use cases — primarily because they are easy to use and deploy.
The current BI and analytics market situation looks similar to the mainframe/workstation market in thelate 1980s, which had a complete shift in requirements and buyers. For example, these shifts drove HP toa complete rethink and redesign of its computing platform strategy and architecture. Ultimately thismarket shift in requirements and buyers wiped out DEC, since it was not effective in adapting to the shift.The market share leaders in the BI and analytics market are now at a similar crossroads.
While data discovery platforms predominantly complement ITcentric systemsofrecord deployments,
development workbench for building reports,dashboards, queries and analysis. It should enablescalable and personalized distribution, scheduling andalerts and workflow of BI and analytics content andapplications via email, to a portal or to mobiledevices. It should include the ability to embed andcustomize BI platform components in a businessprocess, application or portal.
External platform integrationEmbeddable/embedded BI and analyticsSupport for big data sources (including cloud)Developer productivity (APIs, SDKs, versioning,multideveloper features)Scheduling and alertsWorkflow and events
Free Form Interactive Exploration: Enables theexploration of data via the manipulation of chartimages, with the color, brightness, size, shape andmotion of visual objects representing aspects of thedataset being analyzed. This includes an array ofvisualization options that go beyond those of pie, barand line charts, including heat and tree maps,geographic maps, scatter plots and other specialpurpose visuals. These tools enable users to analyzethe data by interacting directly with a visualrepresentation of it.
Interactivity and explorationUser experienceInformation visualizationsDisconnected explorationSearchbased data discoveryData flowContent authoringInmemory interactive analysis
Analytic Dashboards & Content: The ability tocreate highly interactive dashboards and content withvisual exploration and embedded advanced andgeospatial analytics to be consumed by others.
Information visualizationsDisconnected explorationEmbedded advanced analyticsGeospatial and location intelligenceContent authoringConsumer interactivity and exploration
ITDeveloped Reporting and Dashboards: Providesthe ability to create highly formatted, printready andinteractive reports, with or without parameters. IT orcentrally authored dashboards are a style of reportingthat graphically depicts performances measures.Includes the ability to publish multiobject, linkedreports and parameters with intuitive and interactivedisplays; dashboards often employ visualizationcomponents such as gauges, sliders, checkboxes andmaps, and are often used to show the actual value ofthe measure compared to a goal or target value.Dashboards can represent operational or strategicinformation.
Production reporting, distribution and printingParameterizations, filters, promptsReport and dashboard navigation and guidednavigationDesign environment and document layoutVisual components, such as gauges, sliders, dials,check boxes
Traditional Styles of Analysis: Ad hoc query enablesusers to ask their own questions of the data, withoutrelying on IT to create a report. In particular, the toolsmust have a reusable semantic layer to enable usersto navigate available data sources, predefined metrics,hierarchies and so on. OLAP enables users to analyzedata with fast query and calculation performance,enabling a style of analysis known as "slicing anddicing." Users are able to navigate multidimensionaldrill paths. They also have the ability to writebackvalues to a database for planning and "what if?"modeling. This capability could span a variety of dataarchitectures (such as relational, multidimensional orhybrid) and storage architectures (such as diskbasedor inmemory).
OLAPAd hoc query
Mobile: Enables organizations to develop and delivercontent to mobile devices in a publishing and/orinteractive mode, and takes advantage of mobiledevices' native capabilities, such as touchscreen,camera, location awareness and naturallanguagequery.
Content authoring and information explorationInformation display, interaction and contextawarenessMultidevice supportSecurity and administrationOffline mode exploration
Collaboration and Social Integration: Enables usersto share and discuss information, analysis, analyticcontent and decisions via discussion threads, chat,annotations and storytelling.
Story telling
2/26/2015 Magic Quadrant for Business Intelligence and Analytics Platforms
http://www.gartner.com/technology/reprints.do?id=12AH4Q85&ct=150224&st=sb 4/38
they are being used for much of the new analytics project investments. The result has been increasedmarginalization of the installedbase vendors, which without competitive offerings have feweropportunities for expanded growth.
Displacement of the incumbents by Tableau, Qlik and others are increasing in pockets, particularly inSMBs, although this trend is not yet mainstream. Gartner inquiries and survey data suggest that,increasingly, companies would like to expand their use of, and even standardize on, data discoveryplatforms for their larger enterprise BI deployments, but find that in many cases these platforms lack thenecessary enterprise features in relation to governance, administration and scalability (among otherthings). The data discovery vendors continue to invest in capabilities to reverse these limitations.
If we begin to see largescale displacements by these and other businessusercentric vendors, themarket shift will be complete (see "Market Trends: The Collision of Data Discovery and BusinessIntelligence Will Cause Destruction"). Right now, the majority of buyers seem to be waiting to see if theirenterprisestandard BI platform will deliver on the businessuseroriented capabilities they prefer to use tomeet new analytics requirements beyond production reporting. The existence of separate systemsofrecord reporting platforms and data discovery platforms can pose challenges for organizations attemptingto govern, scale and support these different environments and pace layers (see "Applying Gartner's PaceLayer Model to Business Analytics"), with no single vendor fully addressing both.
It is very likely that 2015 will be a critical year in which democratizing access to analytics will continue todominate market requirements and stress the need for governance. Nextgeneration data discoverycapabilities that leverage advanced analytics, but hide its complexity to simplify business user datapreparation and automate pattern exploration, are likely to be more important enablers. The extent towhich these emerging capabilities and trends impact buying in 2015 and beyond will determine whichexisting and new vendors emerge from this market transition as market leaders.
The need for platforms to scale and perform for larger amounts of diverse data will also continue todominate BI market requirements. At the same time, the ability to bridge decentralized businessuserledanalytics deployments with those centralized to serve the enterprise will be a crucial ongoing challenge forIT and BI vendors. With the added complexities introduced by new data sources (such as the cloud, realtime streaming events and sensors, and multistructured data) and new types of analysis (such aslink/network and sentiment analysis, and new algorithms for machine learning), new challenges andopportunities will emerge to integrate, govern and leverage these new sources to build business value.Leaders of BI initiatives will be under pressure to identify and optimize these opportunities and to deliverresults faster than ever before.
This document presents a global view of Gartner's opinion of the main software vendors that should beconsidered by organizations seeking to use BI and analytics platforms to develop BI applications. Buyersshould evaluate vendors in all four quadrants and not assume that only the Leaders can deliversuccessful BI implementations. Yearoveryear comparisons of vendors' positions are not particularlyuseful, given the market's dynamics (such as emerging competitors, new product road maps and newbuying centers); also, clients' concerns have changed since our last Magic Quadrant, particularly since weare in the middle of a significant shift in this market. It is also important to avoid the natural tendency toascribe your personal definitions for Completeness of Vision and Ability to Execute to this Magic Quadrant.For the purposes of evaluation in this Magic Quadrant, the measures are very specific and likely to bebroader than the axis titles may imply at first glance. Readers are encouraged to look at the EvaluationCriteria and Vendor Strengths and Cautions sections carefully to fully understand the nuances of vendorplacement that may not be apparent in the Magic Quadrant graphic. For guidance on the Magic Quadrantevaluation process and on how to use a Magic Quadrant, see "How Markets and Vendors Are Evaluated inGartner Magic Quadrants."
Gartner surveyed 2,083 users of BI platforms as part of the research for this report. Vendors are assessedon a number of key customer survey metrics referred to throughout this report (see Note 3 for howthese are calculated). For a detailed explanation of vendor positioning, please see the Vendor Strengthsand Cautions section and the Quadrant Descriptions section in this document.
A more detailed assessment of product capabilities for vendors positioned in the Leader's and Challenger'squadrant (as well as those vendors that were in the Leader's quadrant last year) are included in theforthcoming "Critical Capabilities for BI and Analytics Platforms."
Vendor Strengths and CautionsAlteryxThe Alteryx platform offers a subscriptionbased analytics platform targeted at business users. Alteryx'stools include easytouse advanced data preparation capabilities, location analytics and extensiveintegration with the R analytics ecosystem.
Alteryx maintains its position in the Visionaries quadrant due to its ability to support business users withan integrated set of intuitive tools for data preparation, embedded advanced analytics and applicationsharing as well as deep geospatial analytics. Instead of being one more reporting and dashboard tool inthe BI space, this vendor takes a unique approach to the market — broadening the range of userscapable of developing analytic processes.
Strengths
Selfservice data preparation is a platform strength, with 54% of Alteryx customers using theplatform for this purpose. It earned the top product score for this capability. Embedded BI, includingembedded advanced analytics, is another platform strength. Recognizing the benefits of thisapproach, customers have awarded Alteryx the highest scores for market understanding (ease ofuse, complexity of analysis and breadth of use — see Note 3), with a wide gap to the secondbestvendor. The platform is also able to integrate with Tableau and Qlik, which complement Alteryx byproviding the interactive visualization capabilities missing in its own portfolio. It's a winwinsituation, because Alteryx in turn fills the gaps in data preparation and analytics features for Tableauand Qlik. Alteryx has been able to leverage these partnerships, participating in joint events andmarketing activities — which greatly appeals to its customers. Cloudera (for Hadoop), Databricks (forSpark) and Revolution Analytics (for R), recently acquired by Microsoft, are other examples of closepartners supporting a range of expanding capabilities in the big data analytics space. Consulting andsystem integration companies such as Accenture, Amdocs, BCG, Deloitte and KPMG are also startingto deploy Alteryx in their customer bases.
Discussion threadsIntegration with social platformsTimelinesSharing and realtime collaboration
Embedded BI: Capabilities including a softwaredeveloper's kit with APIs and support for openstandards for creating and modifying analytic content,visualizations and applications, embedding them into abusiness process, and/or an application or portal.These capabilities can reside outside the application,reusing the analytic infrastructure, but must be easilyand seamlessly accessible from inside the application,without forcing users to switch between systems. Thecapabilities for integrating BI and analytics with theapplication architecture will enable users to choosewhere in the business process the analytics should beembedded.
Capabilities for embedding (APIs, open standards,SDKs, component libraries)Capabilities to consume common analyticsmethods, such as Predictive Model MarkupLanguage (PMML) and Rbased models in themetadata layer and/or in a report object oranalysis
NOTE 3CUSTOMER SURVEY METRICSREFERENCED IN THIS REPORT
Magic Quadrant customer survey composite successmeasures are referenced throughout the report.Customer survey participants scored vendors on eachmetric on a scale of 1 to 7 (where 1 to 2 = poor, 3 to5 = average, and 6 to 7 = outstanding).
Below is a reference for how these composite metricsare calculated:
Customer Experience: This is a combined scoreconsisting of rating for product quality, support,availability of skills, user enablement (whichincludes scores for training, online videos, onlinecommunities and documentation) and migrationdifficulty.Sales Experience: Customers rate theirsatisfaction with presales, contracting, pricing andaccount management.Market Understanding: This is a compositemeasure of ease of use for consumers, ease of usefor developers, ease of use for administration anddeployment, complexity of analysis (describedbelow) breadth of use (this measures the range ofanalytic activities for which the platform is used).We believe these three measures map to currentbuying requirements.Complexity of Analysis: This is a weightedaverage score based on the percentage ofrespondents reporting use of the platform score forthe types of analysis users conduct with theplatform — more interactive and advanced typesof analysis result in a higher score than static orparameterized reporting. Activities are weighted asfollows:
Viewing static reports = 1Monitoring performance via a scorecard = 1Viewing parameterized reports = 2Doing simple ad hoc analysis = 3Interactive exploration and analysis of data =4Doing moderately complex to complex ad hocanalysis = 5Using predictive analytics and/or data miningmodels = 5
User Enablement: This is a composite scoreconsisting of individual ratings for documentation,online tutorials for content authors, online tutorialsfor consumers, online communities, training,availability of skills and user conferences.Business Benefits: The business benefits score isan average of scores on 11 different benefit areasas follows:
Increased revenueBetter, faster decisionsBusiness benefits: customer satisfactionReduce IT head countReduce LOB head countReduce external IT costsReduce other nonIT costsExpand types of analysisMake better insights available to more peopleLink KPIs to corporate objectivesMonetize data
EVALUATION CRITERIA DEFINITIONS
Ability to ExecuteProduct/Service: Core goods and services offered bythe vendor for the defined market. This includescurrent product/service capabilities, quality, featuresets, skills and so on, whether offered natively or
2/26/2015 Magic Quadrant for Business Intelligence and Analytics Platforms
http://www.gartner.com/technology/reprints.do?id=12AH4Q85&ct=150224&st=sb 5/38
Alteryx's platform earns the thirdhighest score for ease of use for content creation, but still has thegreatest ability to solve complex questions (according to the customer survey for this MagicQuadrant). Ease of use is also reflected in a fasterthanaverage report development time of only2.1 days — a result in the top three (for fastest report development times) in this Magic Quadrant.
Alteryx's customers are generally happy with the platform, with 60% reporting no problems withthe tool and 46% of those surveyed reporting no limitations to its expansion in the organization(both these results are above the survey average). The platform achieved the secondbest scores forperformance, at run time. Customers also rate Alteryx in the top three vendors (for this MagicQuadrant) in terms of achieving business benefits. These experiences contributed to customers'positive view of Alteryx's future.
Cautions
Alteryx is primarily used in decentralized BI deployments and does not support a centralized BI usecase — putting it among the lowest percentage for customers using the platform in this way. OnlyDatawatch and GoodData customers report lower percentages of centralized deployments. It alsosupports the lowest number of users, with only 55 on average. This confirms the use of Alteryx as apoint solution for analytics at the departmental level. It should, therefore, be deployed as acomplement to other tools within an organization.
The platform excels in some capabilities (as identified above), but has also clear limitations in areassuch as reporting, dashboards, mobile — BI content visualization and delivery in general, plusmetadata management and BI platform administration. These gaps serve to highlight its best fit asa complement to other tools.
Cost of the platform is a barrier to its adoption, with 34% of customers identifying this as alimitation to further expansion. This could become an issue as other tools with better price points(namely in the data discovery space) gain more advanced capabilities for data preparation andanalytics — closing Alteryx's window of opportunity. We should, however, recognize that this is amajor improvement over last year's results — when 67% of customers identified cost as a limitationto further expansion.
Although increasingly supported by the partner networks of Tableau and Qlik, Alteryx still lacks awide geographic presence; it has coverage in North America, a limited presence in Europe andexploratory moves and partnerships into other regions. The company is investing to overcome thischallenge and will continue to expand its geographic presence through indirect channels, building onthe current network of partners present in 60 countries.
BirstBirst has defined the pioneering vision of what a set of cloud BI and analytics capabilities should look like.It has a unique twotier data architecture coupled with a BI and analytics platform and allows customersto keep their data onpremises if they so choose.
Birst is a Challenger in this Magic Quadrant, primarily because of its product strategy and innovations andbecause it has adapted its strategy, organization and focus as the market for cloud BI has evolved. It hasgrown the business at a good pace in execution/delivery and customer satisfaction.
Strengths
Birst's twotier architecture — which plugs into existing data warehouses, data lakes or applications— automates the process of refining the data and creating a more unified model/view of the data,and adds a BI layer for business users' analytics needs. Birst offers an appliance with the same codebase as the cloud offering — for those customers that want to take advantage of its productstrengths but prefer a private cloud. Unlike most other cloudonly players, with Birst a customer'sapplication data can be left onpremises in the "Birst Live Access" mode, while a BI/analyticsapplication (using the data) runs in the Birst cloud. Customers report that 59% of their data comesfrom cloud sources — the highest of any vendor in this Magic Quadrant. Only GoodData, the otherpureplay cloud vendor, comes close with 52%.
Birst scores well for a centralized BI use case, with core product strengths in cloud deployment, BIplatform administration, development and integration, embedded BI, metadata management, ITdeveloped reports and dashboards, and traditional styles of analysis.
Birst is rated as easy to integrate and use. A short development time for fairly complex reports andanalysis is cited by customers. Birst has among the highest integration scores (both within andexternal to the platform) and also scored high on ease and breadth of use. Customers report highachievement of business benefits. Many customers are using Birst's predefined, vertically specific BIapplications (for example, Birst Sales Analytics Solution Accelerator, Birst for Insurance, Birst forUsage Analytics), which help accelerate time to value and business benefits.
Operational execution is a key strength and Birst has among the highest customer experience (seeNote 3) scores in this Magic Quadrant. Birst is the only BI vendor with a chief customer officer whois responsible for developing best practices and working with customers from the onset of anengagement to ensure their success. Every two weeks, Birst hosts "Office Hours" for its customersvia a Web meeting; any customer can join to discuss product usage and best practices.
Birst has a broad range of technology provider partnerships and integrations with companies such asSAP, Amazon, NetSuite, Salesforce and Informatica, and more recently with Tableau.
Cautions
Birst scored well overall in product functionality, but its main product limitations are around the lackof adoption/penetration of its data discovery and mobile capabilities. Collaboration capabilities arealso an area where it will need to increase its level of innovation to competitively meet business userrequirements.
Survey data for cloud BI (for this Magic Quadrant) shows that the primary interest (and investment)is in hybrid and private cloud offerings. Birst has generally been viewed as more of a pureplay publiccloud BI/analytics company, with limited support for private clouds, and little awareness of itsappliance offering. It needs to reposition itself to be viewed as a generalpurpose BI/analyticsplatform rather than as a specialty cloud vendor.
Large software vendors such as MicroStrategy, Oracle, IBM, SAP and Salesforce are entering themarket with their own cloud BI/analytics services and could bring additional pricing and competitivepressures to pureplays such as Birst.
Birst is not the incumbent platform in most of its customers' companies. Most large organizations
through OEM agreements/partnerships as defined inthe market definition and detailed in the subcriteria.
Overall Viability: Viability includes an assessment ofthe overall organization's financial health, the financialand practical success of the business unit, and thelikelihood that the individual business unit will continueinvesting in the product, will continue offering theproduct and will advance the state of the art within theorganization's portfolio of products.
Sales Execution/Pricing: The vendor's capabilities inall presales activities and the structure that supportsthem. This includes deal management, pricing andnegotiation, presales support, and the overalleffectiveness of the sales channel.
Market Responsiveness/Record: Ability to respond,change direction, be flexible and achieve competitivesuccess as opportunities develop, competitors act,customer needs evolve and market dynamics change.This criterion also considers the vendor's history ofresponsiveness.
Marketing Execution: The clarity, quality, creativityand efficacy of programs designed to deliver theorganization's message to influence the market,promote the brand and business, increase awarenessof the products, and establish a positive identificationwith the product/brand and organization in the mindsof buyers. This "mind share" can be driven by acombination of publicity, promotional initiatives,thought leadership, word of mouth and sales activities.
Customer Experience: Relationships, products andservices/programs that enable clients to be successfulwith the products evaluated. Specifically, this includesthe ways customers receive technical support oraccount support. This can also include ancillary tools,customer support programs (and the quality thereof),availability of user groups, servicelevel agreementsand so on.
Operations: The ability of the organization to meetits goals and commitments. Factors include the qualityof the organizational structure, including skills,experiences, programs, systems and other vehiclesthat enable the organization to operate effectively andefficiently on an ongoing basis.
Completeness of VisionMarket Understanding: Ability of the vendor tounderstand buyers' wants and needs and to translatethose into products and services. Vendors that showthe highest degree of vision listen to and understandbuyers' wants and needs, and can shape or enhancethose with their added vision.
Marketing Strategy: A clear, differentiated set ofmessages consistently communicated throughout theorganization and externalized through the website,advertising, customer programs and positioningstatements.
Sales Strategy: The strategy for selling products thatuses the appropriate network of direct and indirectsales, marketing, service, and communicationaffiliates that extend the scope and depth of marketreach, skills, expertise, technologies, services and thecustomer base.
Offering (Product) Strategy: The vendor's approachto product development and delivery that emphasizesdifferentiation, functionality, methodology and featuresets as they map to current and future requirements.
Business Model: The soundness and logic of thevendor's underlying business proposition.
Vertical/Industry Strategy: The vendor's strategyto direct resources, skills and offerings to meet thespecific needs of individual market segments, includingvertical markets.
Innovation: Direct, related, complementary andsynergistic layouts of resources, expertise or capitalfor investment, consolidation, defensive or preemptive purposes.
Geographic Strategy: The vendor's strategy to directresources, skills and offerings to meet the specificneeds of geographies outside the "home" or nativegeography, either directly or through partners,channels and subsidiaries as appropriate for thatgeography and market.
2/26/2015 Magic Quadrant for Business Intelligence and Analytics Platforms
http://www.gartner.com/technology/reprints.do?id=12AH4Q85&ct=150224&st=sb 6/38
have extensive investments in BI/analytics infrastructure and tools. Birst is still most often deployeddepartmentally, and must successfully position itself as a complement to the enterprise standard.
Birst is primarily focused on North America and Northern Europe, but has expansion plans —including ecosystem partners for the international market. However, these plans are currently astrategic "work in progress" compared with the Leaders in this Magic Quadrant.
Board InternationalBoard delivers a single, integrated platform, which provides programmingfree BI, analytics and corporateperformance management (CPM) capabilities. The focus is to deliver a central, unified and consistentinformation platform as a basis for BI and performance management applications. Europe is Board's mainmarket and it has subsidiaries in Europe, North America and Asia/Pacific, and supports clients in SouthAmerica though partners.
Board is positioned as a Niche Player in this Magic Quadrant. (It is also part of the Magic Quadrant for CPMsuites, where it was positioned as a Visionary player in 2014). It serves the submarket for unified BI andCPM platforms, which are centralized and mostly ITdriven deployments. Board is wellpositioned in thissubmarket and has achieved strong growth for several consecutive years.
Strengths
The predominant reasons for selecting Board are in line with the overall survey results with respectto the top selection criteria: 31% of survey respondents selected ease of use for developers andease of use for end users as important selection criteria, followed by 19% of respondents selectingfunctionality as an important criterion.
Board achieved aboveaverage scores across the three criteria for ease of use — for contentcreation, for end users and for administration and implementation. Board is also in the top quartilefor shortest report development times. Survey respondents also rate Board as above average forachievement of business benefits.
Board's customers show a very high level of loyalty and it achieved the highest score overall, with98% of customers indicating that they have no plans to discontinue the relationship. This is furthersupported by about 90% of the respondents reporting that they either have a positive view ofBoard's future or their view has changed to a positive outlook during the past year.
Board has continued to invest in new platform capabilities to improve performance, advancedanalytics and mobile. The newly introduced Hybrid Bitwise Memory Pattern (HBMP) will furtherimprove the performance of the platform and enable a hybrid inmemory architecture forperformance optimization. Board has also started to deliver predictive analytics through itsproprietary Board Enterprise Analytics Modeling (BEAM) for statistical forecasting and other statisticalfunctions. Currently, Board does not support R, but it does have native mobile support for iPad,Android and Microsoft tablets.
Board's product "sweet spot" is in its integrated CPM capabilities. The combination of BI and CPMcapabilities is Board's key differentiator. It also scored well on ITdeveloped reports and dashboards,metadata management and freeform exploration, as well as on traditional styles of analysis.
Cautions
Board achieved scores that were slightly below average in all three supportrelated aspects (that is,support time to resolution, support response and support level of expertise). Respondents ratedproduct quality with a score close to the overall average, which might be related to the migrationscore of "more difficult than average." Next to cost, support quality was often mentioned by surveyrespondents as a limitation. Prospective customers should pay attention to this during a proof ofconcept, in particular outside Board's core market in Europe.
Compared with last year, the average size of Board deployments grew significantly in both datavolume accessed and number of end users. Despite this, Board is still in the lowest quartile for bothdeployment size and data volume — with 348 end users, on average, and 1.4TB of data. Prospectiveand existing customers with the intention to implement large deployments should performscalability tests and check Board's references to ensure Board can handle their specificrequirements.
Board is predominantly used for centralized BI use cases and onpremises deployments in smallercompanies, and for departmental deployments. Board achieved the secondhighest responsepercentage with respect to a centralized BI platform use case. It scored the secondlowest inenabling users to conduct complex types of analysis (see Note 3) — indicating a rather narrowutilization of analytic capabilities, with a focus on systemsofrecord reporting. Consequently, Boardachieved an overall market understanding score that was slightly below average.
DatawatchDatawatch offers an interactive data discovery platform (desktop and server) specializing in visuallyanalyzing streaming and multistructured data. It is based on a combination of technologies: Monarch, amature product for structuring data from PDFs and semistructured and unstructured sources that wasprimarily used by customers to migrate, or otherwise leverage, data in legacy reports; and Panopticon(acquired 2013), a visualbased data discovery platform wellsuited for realtime dashboards for analyzingstreaming time series data in addition to historical data.
Datawatch entered this Magic Quadrant for the first time this year, in the Niche Players quadrant. Strongscores for customer experience and a differentiated product and vision for data discovery on realtime andmultistructured data have contributed to its position.
Strengths
Datawatch offers interactive data discovery that is differentiated by its support for analyzing realtime streaming and time series data coming from messaging middleware, streaming infrastructureincluding Amazon Kinesis, and complexevent processing (CEP) engines including Tibco StreamBase,OneTick, OneTick CEP, Thomson Reuters Velocity Analytics and SAP Sybase ESP. An inmemory,OLAPbased StreamCube is associated with each graphical display object. The system processes newdata as it arrives, selects the subset of important data, recalculates the relevant sections of themodel and refreshes the associated parts of the display immediately. In particular, the ability tocompare realtime data with historical data is a differentiator from the other data discoveryspecialists — including Tibco Spotfire, which has a level of integration with Tibco StreamBase.
Customers report using the platform for more complex types of analysis than with most other
2/26/2015 Magic Quadrant for Business Intelligence and Analytics Platforms
http://www.gartner.com/technology/reprints.do?id=12AH4Q85&ct=150224&st=sb 7/38
vendors in this Magic Quadrant. Advanced geospatial and location intelligence capabilities in partcontribute to users performing advanced types of analysis, particularly for realtime geospatialanalysis. Customers report among the most narrow use of platform functionality, with a focus oninteractive analysis. Datawatch registered the highest percentage of customers using its platform forinteractive analysis. Customers also have an aboveaverage perception of their overall customerexperience (see Note 3), particularly in the areas of support and product quality.
Unlike both the data discovery specialists and the data discovery capabilities of ITcentric vendors,Datawatch's selfservice data preparation capabilities, which leverage its Monarch technology, canaccess and structure semistructured and unstructured data such as JavaScript Object Notation(JSON), PDF and HTML as a data source for analysis, in addition to traditional and many big datasources. Scheduling and alerting capabilities are also more extensive than those available forTableau, but require a degree of scripting.
A large percentage of customers use the product's software development kit (SDK) for embeddingworkbooks in other applications — Datawatch customers report the highest incidence, at 50%, ofusing the product either as an OEM or for embedded BI (versus an average of 27% for this MagicQuadrant). Most of the remaining customers use Datawatch in a decentralized deployment.
As a public company, Datawatch has more ready access to funding than a typical startup, albeitcoupled with the lessforgiving pressure to meet Wall Street's expectations. Datawatch also has aseasoned management team (of exCognos and TM1 executives), who have thus far positivelysteered its platform integration and gotomarket strategy toward differentiation in a growing areaof the market. Datawatch has a large installed base in the financial services market and isexpanding into other verticals. It is particularly well positioned for the emerging requirementsaround streaming data for the Internet of Things (IoT).
Cautions
Datawatch has limited awareness in an increasingly crowded market and has had difficulty indifferentiating the platform against other data discovery platforms, outside of its core streaming datause cases. Moreover, Datawatch is in the process of building its sales force, partner program andgeographic presence, but these gotomarket programs are more limited than those of its datadiscovery competitors. Enhancements to the product and product road map since acquisition, plusgrowing demand around requirements for the IoT, should improve Datawatch's competitive positionwith a broader range of buyers. However, customers report a belowaverage sales experience withDatawatch. Gartner inquiries also suggest a level of dissatisfaction in the legacy Monarch installedbase as Datawatch transitions it to the new integrated platform.
Datawatch is primarily used departmentally, as a desktop product, with among the smallest averagedeployment size in terms of number of users of any vendor in this Magic Quadrant. While a serverversion is available for broader deployment, the platform's enterprise features are a work inprogress, particularly in areas such as centralized BI administration and user monitoring capabilities,security, versioning, data lineage and impact analysis, and metadata management.
Customers rate Datawatch as less intuitive than other data discovery specialists, although theplatform supports a full range of interactivity features and analystoriented data explorationcapabilities. Moreover, unlike the other specialist data discovery tools that are primarily chosen forease of use, the primary reason customers choose Datawatch is for its functionality and data accessand integration.
Datawatch is not yet cloudready. Users can connect to cloud and big data sources, such as AmazonKinesis, Amazon Redshift, Cloudant and MongoDB, but there are limited capabilities for deploying inthe cloud. This is on the road map, however.
Datawatch has a smaller percentage of users deploying the product on mobile devices than mostother vendors in the Magic Quadrant. The mobile capabilities support HTML5 interactivity only — nonative applications — and do not support content authoring or offline analysis. Moreover, Datawatchis limited in its support for ITdeveloped reports and dashboards and traditional styles of analysis.
GoodDataGoodData is a cloud BI and analytics specialist, providing a comprehensive multitenant, cloudonlyplatform that includes data integration, a fully managed data warehouse repository, frontend BI toolsand packaged applications. Its customers can also expect a broad range of data connectors — namely, tocloudbased data sources such as social media — and a vendor able to work directly with business usersand support the full BI environment without much involvement from internal IT teams.
GoodData has a strong position in the Niche Players quadrant because it was early to the cloud BI marketand has gained market traction in the deployment of embedded and digital marketing use cases as well asthe integration of social media data sources.
Strengths
GoodData offers customers an endtoend business analytics platformasaservice solution for dataintegration, data warehousing and BI, with aboveaverage scores for breadth of use. By specializingin a cloudonly solution, GoodData is able to focus its efforts on the delivery and support of a tightlyintegrated offering to support rapid time to deployment. It receives high customer scores for itscohesive architecture, support time to resolution of problems and support expertise.
The platform's strengths include cloud deployment, BI platform administration, embedded BI, anddevelopment and integration capabilities. It receives the top score in the Magic Quadrant survey forthe OEM/embedded use case. GoodData has a solid base of customers (many of whom are alsocloudbased) that are embedding its solution.
Customers praise the software quality, with a score in the top three for this Magic Quadrant.Furthermore, although GoodData introduces new functionality quarterly, customers can count onan easy migration processes — as we would expect from a cloudbased solution where the vendormanages the full platform.
GoodData's average report development time is 3.1 days, faster than the average of 4.0 days forthe vendors in this Magic Quadrant. The product is also easier to use than the average, with a userinterface experience mostly intended for business users.
GoodData is a leader in the use of social media data sources, with 22% of customers using it forthat purpose. Moreover, 51% of customers report the use of cloudbased data sources (the secondbest result for this Magic Quadrant), well ahead of the third vendor at 31%. This is not surprisingsince customers tend to be more open to cloud BI platforms when most of their data resides in thecloud. GoodData offers accelerator solutions for social and other cloud data that should appeal to
2/26/2015 Magic Quadrant for Business Intelligence and Analytics Platforms
http://www.gartner.com/technology/reprints.do?id=12AH4Q85&ct=150224&st=sb 8/38
marketing and sales departments. IT teams lacking knowledge in the area, can also leverageGoodData as a point solution for social media analysis, complementing existing BI tools fortraditional business reporting.
Cautions
GoodData earned belowaverage product scores for a decentralized BI use case and is less wellsuited for analytic dashboards, business user data mashups, collaboration and freeform interactiveexploration than many other vendors in this Magic Quadrant. Consistent with that assessment,customers rate GoodData in the bottom five vendors for support for complex types of analysis (seeNote 3) — which is not surprising, because it only recently added a data discovery offering. Wewould expect these results to improve as customers start using its new components — AnalyticalDesigner and Data Explorer — as part of their data discovery offering.
Approximately 62% of customer responses reported some type of problem with the software(versus 49% on average), with 20% of customers citing absent or weak functionality as a problemwith the software — almost twice the survey average. Again, the new data discovery offering couldhelp mitigate this issue.
Despite having a scalable architecture and being capable of handling the data of many customers inits cloud environment, GoodData customers report having deployments with relatively smallnumbers of users and data volumes. It shows a belowaverage number of 611 users and thesmallest average data volume size with just 308GB per customer. Prospective customers with largedeployment ambitions should use a proof of concept to ensure that GoodData's platform is able tohandle their requirements.
IBMIBM offers a broad range of enterprisegrade BI, performance management and advanced analyticsplatform capabilities, complemented by a deep services organization that is ready to implement them insolutions for any domain, industry or geography. IBM Cognos is an integrated BI platform with capabilitiesfor Webbased ad hoc query, report and dashboard authoring and consumption, OLAP, scorecarding,production reporting, scheduling, alerting, data discovery and mobile.
IBM has demonstrated innovation and has a compelling vision for the future with Watson Analytics, itsnextgeneration data discovery capability, but has faced challenges in the core BI business to deliver apositive customer experience and meet important businessusercentric market requirements. Highmarks for sales strategy and industry and geographic reach also bolster IBM's position on this MagicQuadrant. In 2015, IBM must translate its vision into market momentum and improve its customerexperience to retain its position in the Leaders quadrant.
Strengths
A product strategy spanning BI, performance management and advanced analytics and innovationaround smart data discovery in IBM Watson Analytics (made generally available in December 2014),contributed to IBM's strong position for Completeness of Vision. IBM hopes Watson Analytics has thepotential to give business users access to a new user experience for data discovery, featuring anintegrated analytic workflow that includes selfservice data preparation, naturallanguage querygeneration and exploration, and automatic pattern detection and prediction — to allow businessanalysts and citizen data scientists to find valuable insights in data without advanced skills.
IBM earned a strong overall product score. Enterprise features supporting centralized deployments— such as BI platform administration, IT developed reports and dashboards, metadata managementand traditional styles of analysis — in addition to collaboration (through integration of IBMConnections with IBM Cognos 10), are platform strengths.
IBM Cognos is wellsuited to large deployments centered on global production reporting that arecentrally managed by IT. IBM is ranked in the top four (in percentage) by customers reporting usingthe platform for centralized BI deployments. It was ranked in the top five in terms of the extent ofglobal deployment and average deployment size (at 2,690 users versus the average of 1,554 forthis Magic Quadrant) with aboveaverage data sizes. More than 77% of IBM's customers consider itto be their BI standard, which ranks it third highest. Moreover, enterprise features for BI platformadministration, metadata, BI platform integration, ITdeveloped reports and dashboards,development and integration and traditional styles of BI (ad hoc reporting and OLAP) are productstrengths.
IBM has taken a positive step toward improving its sales relationship with customers. Pricingintroduced in July 2014 has been simplified into fewer roles, which has resulted in many usersgetting access to more functionality in the Cognos platform through existing contracts.
Cautions
While IBM Cognos is embedded and sold in over 130 IBM applications, during the past year Gartnerhas seen fewer new greenfield IBM Cognos purchases; rather, its growth has come mostly fromupgrades and audits with much of the new businessuserdriven analytics projects in its installedbase going to Tableau or Qlik. Execution is slightly better than SAP and Oracle, but despite a broadproduct portfolio IBM Cognos BI is still used primarily for systemsofrecord reporting and customersreport achieving lower business value than most other vendors in this Magic Quadrant. Narrow use,despite broad functionality, is a challenge faced by most of the ITcentric platforms in this MagicQuadrant.
While IBM's vision is strong, its current execution is not. Since the attempt to position its CognosInsight planning client for the data discovery market met with limited market adoption, IBM ispursuing a new strategy around IBM Watson Analytics to meet emerging businessuserrequirements. Customer scores for market understanding (see Note 3), which include ease of use(for consumers, authors and administrators), support for a range of complex types of analysis, andbreadth of use across analytics capabilities, continue to be rated in the bottom quartile of thevendors in this Magic Quadrant. Moreover, IBM's customers placed IBM in the bottom quartile forachievement of business benefits from its BI deployments — similar to most other ITcentricvendors. IBM is investing aggressively in IBM Watson Analytics, hoping to reverse this criticalcustomer perception.
Customers continue to rank the IBM sales experience as near the bottom. While the new pricingmodel is a positive step, anecdotally, Gartner inquiries suggest that IBM customers are not happywith their sales relationship. Contract negotiations are often protracted and perceived as inflexible,and auditing is a frequent source of customer complaint and dissatisfaction with IBM. Moreover,
2/26/2015 Magic Quadrant for Business Intelligence and Analytics Platforms
http://www.gartner.com/technology/reprints.do?id=12AH4Q85&ct=150224&st=sb 9/38
customers express concerns around the time and effort needed to manage IBM's subcapacitymonitoring for Processor Value Unit (PVU) pricing in a shared virtual environment. This has beenmore challenging because IBM Cognos does not have builtin license monitoring capabilities. IBM istaking steps to address this with enhancements in the latest Cognos BI release to help customersmonitor their environments for compliance.
Customer experience (see Note 3), which is a combination of ratings for product support, productquality, migration/upgrade difficulty, user enablement and availability of skills, is rated by IBMs'customers as an ongoing source of dissatisfaction. This is an important element in a customer'soverall view of their BI vendor.
IBM's stated intention is to skip a generation of data discovery tools and move into "smartdiscovery," but it could take some time for the product to mature and for customers to realize its fullpotential. IBM has been less aggressive than some of its competitors in pursuing a cloud strategy.IBM's first public cloud BI offering, IBM Watson Analytics, forms the cornerstone of its nascent cloudBI strategy. IBM Cognos BI will be available in 1Q15 on the IBM SoftLayer cloud.
Information BuildersInformation Builders is a leader in the market for BI and analytics platforms. It sells multiple componentsof its integrated WebFOCUS BI and analytics platform (AppStudio, InfoDiscovery, InfoAssist, BI Portal,Server, Active Technologies, Magnify, Mobile Faves, Performance Management Framework and RStat). Inaddition to the traditional reports and dashboards for senior management, WebFOCUS is frequently usedby IT developers to create analytic applications for operational workers and information consumers —inside and outside the firewall.
Information Builder's position as a Leader in this Magic Quadrant is driven by its positive track record increating pervasive BI solutions for a high volume of mainstream users, particularly in customerfacingscenarios. Its WebFOCUS platform is wellarchitected and offers a broad array of functionality; however,its execution is hampered by perpetually modest growth and customer adoption. After a slow start,Information Builders made significant progress in the selfservice/data discovery area with the release ofInfoDiscovery; however, Gartner needs to see how well this product is adopted during 2015. InformationBuilders' lowerthanexpected customer experience scores (see Note 3) from the customer referencesurvey prevent it from rising higher in the Leaders quadrant.
Strengths
Information Builders clearly differentiates itself in the area of pervasiveness. A significant percentageof its clients disseminate information and decision support to thousands of operational workers.Information Builders' reference customers reported almost double the average (for this MagicQuadrant) for size of deployment in terms of numbers of users.
Information Builders earned high product scores for centralized and embedded BI use cases, whereits BI platform administration, development and integration, IT developed reports and dashboards,metadata management and mobile are platform strengths.
Breadth of functionality is another key strength of Information Builders. While WebFOCUS isprimarily known for its strong interactivity through parameterized reporting, during the past fewyears Information Builders has modernized WebFOCUS with an array of technologies, including adhoc analysis (Active Reports), search (Magnify), Mobile (Faves), advanced analytics (RStat) andlocation intelligence. Information Builders also offers a number of vertical applications based on theplatform for industries such as law enforcement, financial services, higher education and healthcare.
Information Builders does have an enthusiastic installed base, evidenced by the fact the vendor wasable to provide more than twice as many customer references as any other vendor surveyed.
Developers are attracted to WebFOCUS and its ability to access disparate data and applicationssources to create not just reports and dashboards, but to build information applications with thecommensurate security and writeback functionality.
Cautions
Information Builders was slow to promote, and benefit from, the trend toward selfservice and datadiscovery. InfoDiscovery, released in 2H14, is a solid first offering and leverages the vendor's nativeintegration capabilities for its data mashup and modeling capability. Moreover, its vision for agoverned data discovery architecture, exemplified by its "Visualize Responsibly" campaign, is a soundstrategy and ties in nicely to the tightly managed metadata layer of WebFOCUS. However, we needto see more adoption of InfoDiscovery to consider Information Builders a true data discoveryvendor. Information Builders is rated weaker in businessuseroriented data discovery, analyticsdashboards, freeform data exploration, collaboration, cloud deployment as well as for traditionalstyles of analysis (specifically OLAP). This is consistent with Information Builders' primary use for ITcentralized deployments as well as the fact that Information Builders' data discovery offering isnewly released with limited adoption to date.
Overall, Information Builders' customer experience scores are not as strong as we would expect —compared with last year and given its hightouch model and close relationship with customers, theenthusiasm at its user conference and the willingness of the vendor to support customizations. Inparticular, customers are concerned with the availability of skills and their moredifficultthanaverage migration experience. The migration ratings make sense as most of the references had justcompleted upgrading to Release 8, which was a major upgrade in architecture, security and thefront end. Future upgrades to WebFOCUS are likely to be less difficult. Moreover, given its focus oncustomerfacing applications, we would have expected much higher scores for achievement ofbusiness value. For example, it ranks as below average on the customer reference scores forcomposite business benefits achieved with the platform. Customer references who identifiedthemselves as primarily business users did score Information Builders significantly higher onbusiness benefit questions than the references primarily from IT; however, the former were aminority of the vendor's references.
Information Builders has been unable to turn a robust product platform and generally positive salesexperience into aboveaverage market growth. The vendor perpetually shows modest customeradoption, making it unable to capture a dominant share of the market. Information Builders hasbolstered its indirect channels and improved its global presence as a key growth enabler. This is adelicate balance, however, because indirect sales channels and geographic breadth will make itdifficult for the vendor to execute on its hightouch model based on a willingness to customizesolutions to meet client requirements.
2/26/2015 Magic Quadrant for Business Intelligence and Analytics Platforms
http://www.gartner.com/technology/reprints.do?id=12AH4Q85&ct=150224&st=sb 10/38
Logi AnalyticsLogi Analytics' BI platform is composed of two distinct products, Logi Info and Logi Vision. Logi Infodelivers a wide range of functionality typically used by IT developers to deliver analytic content such asreports and dashboards to end users. Logi Info is also used extensively by organizations in an OEMcapacity to embed analytic content in websites and applications, and by enduser organizations to extendBI access externally to customers, partners and suppliers. Logi Vision is a relatively new data discoverytool, launched in January 2014, and offers business users and analysts the ability to prepare and analyzedata and share findings using Logi's differentiated collaboration capabilities. Integration between the twoproducts is a "work in progress," but there is a clear road map to improve interoperability between LogiInfo and Logi Vision — through the development of a common underlying data hub and new applicationservices — during 2015.
With the introduction of Logi Vision, to address business users' buying requirements for data discovery,coupled with a product road map aimed at addressing analytics governance concerns, Logi is againpositioned as a Challenger. In addition to creating the framework needed to offer governed data discoverycapabilities through the platform, Logi has introduced innovative social collaboration and crowdsourcingfunctionality into the Logi Vision product, which contributed to its improved product vision rating thisyear.
Strengths
Through its two primary products, Logi Info and Logi Vision, Logi delivers a wide range of analyticcapabilities at a price point that attracts customers to the platform and offers an alternative tosupporting several BI and analytic tools to support different users and use cases. More than 30% ofreferences cited low license cost, or implementation cost and effort, as the top reasons for selectingLogi; it ranked in the top quartile in sales experience of all vendors in this Magic Quadrant.
Logi Analytics scores well in product features that support centralized and embedded use cases;specifically, development and integration, embedded BI, ITdeveloped reports and dashboards, andtraditional styles of analysis. The platform is also rated highly for collaboration and analyticdashboards, indicating good potential for Logi Vision in meeting businessuser requirements.
Customer experience (see Note 3) is a clear focus and strength for Logi. It was rated third highest(of all the vendors in this Magic Quadrant) for customer experience — customers rated it fourthoverall for support and fifth overall for product quality (two key metrics for customer experience).Logi's high customer experience score was also driven by a strong userenablement rating and byreceiving the lowest overall migration difficulty rating.
Logi is widely used by independent software vendors and enduser organizations who leverage theplatform's ability to embed content in websites and applications and to extend the reach andaccessibility of BI and analytics to a broad range of users. More than 50% of references report usingLogi's platform in an OEM/embedded use case, ranking it thirdhighest.
Logi has, at 28%, the fifthhighest percentage of references actively using mobility for BI, which issignificantly higher than the average of 19%. An additional 30% of Logi's customers cited theirintention to deploy mobile BI within the next 12 months, which validates Logi's investment inmobile capabilities within the platform.
Cautions
Logi is currently being used primarily to support relatively simple analytic use cases such asreporting, dashboards and basic ad hoc analysis, based on the fourthlowest rating for complex typesof analysis. Most customers are currently using Logi Info, which supports these types of use cases;adoption of Logi Vision, which is used for more complex types of analysis, does not yet have thesame level of traction and adoption in Logi's customer base — resulting in the low score and rankingfor complexity of analysis (which measures how the platform is used within organizations — seeNote 3).
Related to the first caution noted, Logi is used by organizations primarily in support of centralized/ITdelivered BI and OEM/embedded use cases and is among the lowest of all the vendors in this MagicQuadrant for use in decentralized and governed data discovery use cases. This is likely to change asLogi Vision matures as a data discovery product and is integrated with the overall platform.
The average deployment size and data volumes within organizations that have deployed Logi areboth below the average for this Magic Quadrant. Average data volume for a Logi deployment is7.9GB, compared with an overall average of 14.2GB; the average deployment size for Logi is 509users, compared with an overall average of 1,554. Although its average deployment size was belowthe survey average, it should be noted that deployments at reference organizations ranged from asfew as three users to over 5,000. While Logi does have large customers, and is the enterprisestandard in almost 70% of survey reference organizations, scalability should be evaluated for largercustomers considering Logi — particularly in organizations with higherthanaverage data volumes.
Weaker capabilities include businessuser data mashup, cloud deployment, freeform explorationand metadata management, largely driven by some missing or weak subcriteria identified withineach capability. Cloud deployment is an example where Logi performed well on some subcriteria —such as special purpose connectors to cloud data sources and direct connect for cloud and onpremises data sources — but is weaker on packaged content, selfservice elasticity and selfserviceadministration. It should be noted that Logi recently announced an hourly pricing model for LogiVision for Amazon Web Services (AWS) that should improve some of the weaker areas of its clouddeployment capabilities, particularly around selfservice elasticity and administration.
MicrosoftThe Microsoft BI and analytics product portfolio supports a diverse range of centralized and decentralizedBI use cases and analytic needs for its large customer base. Organizations typically deploy SQL Server andSharePoint to support ITdevelopercentric data management, reporting and administrationrequirements, while businessuseroriented, selfservice data preparation and analysis needs are deliveredby the Power BI components of the portfolio through Excel 2013 and Office 365. Businessuserenablement is a clear focus of Microsoft's product road map and business model evolution — as evidencedby its new "freemium" Power BI product offering (currently in preview), which can be deployed as astandalone solution for business users to author and share analytic content without the need for Excel2013 or an Office 365 subscription.
Microsoft's leadership position in the Magic Quadrant is primarily driven by a strong product vision andfuture road map, as well as a clear understanding of the market's desire for a platform that can support
2/26/2015 Magic Quadrant for Business Intelligence and Analytics Platforms
http://www.gartner.com/technology/reprints.do?id=12AH4Q85&ct=150224&st=sb 11/38
systemsofrecord requirements and deliver easytouse data discovery capabilities, with support forpromotability of businessuser content and governance. Power BI has gained some traction, but has yetto gain widespread market acceptance due to the complexity of onpremises deployments and therelatively limited functionality currently delivered through the Office 365 cloud; barriers which Microsoft istrying to address with the new Power BI offering currently in preview and due to be released later in2015. As Power BI matures and cloud adoption grows, Microsoft is positioned to leverage its largecustomer base (and capitalize on the already pervasive use of Excel and the existing SQL Server AnalysisServices footprint in the market) to expand the breadth and depth of its deployments in organizationsand increase its overall BI and analytics market share, if it can increase its focus on BI sales andmarketing and overcome customers' structural barriers to adoption.
Strengths
Overall cost of ownership and license cost remain the top reasons customers choose Microsoft(according to the survey). Microsoft has integrated good capabilities into Excel such as Power Query,Power Pivot, Power View and Power Map, which are included with existing enterprise licenseagreements. Additional cloudbased consumption and collaboration capabilities are currentlyavailable in Power BI through a subscriptionbased pricing model in Office 365. Microsoft recentlyannounced a freemium license model for its new standalone Power BI offering, which includesPower BI Designer for content authoring, set to be officially released during 2015 and featuring afree tier for up to 1GB of data storage per user and a Power BI Pro option for up to 10GB availablefor $10 per user per month (significantly reduced from the Power BI version currently offeredthrough an Office 365 subscription).
Many organizations already use Microsoft Excel extensively for data manipulation and presentationof information through spreadsheets, which gives Microsoft a strong foundation on which to buildwith Power BI and close the gap between it and the data discovery leaders. A key differentiator forMicrosoft is its ability to deliver a range of business user capabilities, encompassing selfservice datapreparation with Power Query and Power Pivot, interactive visualization through Power View andPower Map and the ability to share with SharePoint and Office 365, which few vendors can claimwithout thirdparty support and partnership. Platform scalability is a strength of the Microsoftplatform, which ranked highest for data volume accessed — with an average data size of 62TB,compared with an overall average of 14.2TB.
Microsoft reference organizations also report deployment sizes larger than those of any other vendorin this Magic Quadrant, with an average number of end users of 6,000 compared with an overallaverage deployment size of 1,554. With the release of the new standalone version of Power BI,business users will have access to builtin connectivity to onpremises SQL Server Analysis Servicescubes, which will allow organizations to leverage existing data assets without having to move toreplicate in the cloud and further unlock the value of existing multidimensional data structures.
Microsoft products scored well in its traditional areas of strength: BI administration anddevelopment, and integration and collaboration. They also scored highly on businessuser datamashup — an area of investment for Microsoft with Power Pivot and Power Query.
Reorganization and new leadership at Microsoft appears to be positive for Microsoft BI. Since takingover, new CEO Satya Nadella has made support for Apple and Android devices, as well as clouddeployment, a high priority.
Cautions
Microsoft's product portfolio is complex and includes many components, which can cause confusionfor customers evaluating purchase options. The fact that many of the newer capabilities that areimportant to buyers in this market require current versions of Office, SQL Server and SharePointadds to the complexity and represents a barrier to adoption for many organizations that are on olderversions and are not yet willing to buy Office 365 and deploy BI and analytics in the cloud. Forexample, the workflow between components such as Power Query, Power View and Power Pivot isnot yet completely seamless. Moreover, the role of SharePoint dashboards and Reporting Serviceshas not been clearly articulated; Reporting Services is not supported in Azure. While it is a work inprogress, Microsoft is attempting to address many of these limitations in the forthcoming standalone version of Power BI, which does not require Office 2013 or an Office 365 subscription and canaccess Analysis Services structures and content without physically moving underlying enterprisedata to the cloud.
Microsoft had the highest percentage of customer references citing absent or weak functionality (forexample, no drillthrough capabilities in Power View) as a platform problem. This is consistent withlast year's results; and while Microsoft is addressing weakness in mobility, analytic dashboards andfreeform interactive exploration with Power BI, market awareness and adoption has been slow tomaterialize — as shown by minimal client inquiries since its launch in early 2014.
Microsoft's sales model continues to be a pain point for customers, who rated Microsoft fourth lowestfor overall sales experience. Customers have historically found it difficult to engage directly withMicrosoft during the sales cycle, which was a major complaint from IT but is an even greaterconcern for Microsoft as it attempts to appeal to business buyers that have high expectations ofsimplified license models and purchase options.
Microsoft has a large network of implementation partners and developers that are skilled in mostaspects of traditional centralized BI deployments. However, customers may have difficulty findingexternal resources with experience in the newer Power BI stack, which requires a different set ofskills and expertise than Microsoft's sweet spot of systemsofrecord, developerfocused BIdeployments.
MicroStrategyMicroStrategy offers an enterprisegrade and organically grown endtoend BI platform that is wellsuitedto large and complex systemofrecord reporting and governed data discovery requirements. It has acompelling product and vision for largescale governed data discovery and has invested early in cloud andmobile BI; however, its execution during the past year has been poor and the company is regrouping.
Executive turnover and the announced restructuring may have contributed to eroding the customerexperience at a time when the company must distance itself from its "old BI" brand and convince themarket that it has a compelling platform for the future. MicroStrategy has made key executive hires andis refocusing and repositioning to leverage its differentiators into renewed momentum in 2015. We needto see execution at MicroStrategy during 2015, if it is to remain a Leader in the Magic Quadrant in thefuture.
2/26/2015 Magic Quadrant for Business Intelligence and Analytics Platforms
http://www.gartner.com/technology/reprints.do?id=12AH4Q85&ct=150224&st=sb 12/38
Strengths
MicroStrategy is an enterprisegrade platform with strong vision around governed data discovery(including for selfservice data preparation), and is well suited to companies that need largescalesystemofrecord reporting, mobile and dashboards, and are not tied to an enterprise applicationstack (such as Oracle or SAP).
MicroStrategy continues to earn strong composite product ratings from customers and is most oftenchosen because of its functionality. It also ranked in the top five vendors in this Magic Quadrant as aplatform used for ITdriven, centralized BI deployments. While most customers deploy the platformcentrally, it scores well across all four use cases. It has particular strengths in enterprise features,such as BI platform administration, internal platform integration, metadata management andtraditional styles of analysis. It is also rated highly for analytic dashboards, businessuser datamashup and freeform exploration — largely due to its investments in its data discovery capabilities,Visual Insight.
MicroStrategy remains an industry benchmark for large BI deployments running on top of largeenterprise data warehouses, and is often viewed as the vendor of choice when enterpriserequirements are complex. The company invests continuously in scalability and performance as wellas big datarelated enhancements (for example, Prime, a scalable multiterabyte inmemory enginedeveloped with Facebook and direct Hadoop connectivity) for its natively developed and largelyintegrated portfolio. This enables it to support among the largest average data volumes accessed indata repositories and among the largest average number of users (2,648 versus an average of1,554). Moreover, MicroStrategy is typically deployed in larger enterprises that consider it to be theirenterprise BI standard more often than most other vendors.
MicroStrategy is the only vendor in this Magic Quadrant whose customers report selecting it for theirmobile capabilities as a top reason — 51% of customers either have deployed or are piloting it formobile, compared with an average of 30% overall. The cloud has been another area of early andaggressive strategic investment for MicroStrategy compared with other BI vendors, withMicroStrategy Cloud customers primarily using it for hosted private cloud deployments.
Customers not only value simplification in their user experience, they also want simplification intheir vendor relationship. MicroStrategy has taken the bold and difficult step of simplifying its pricing(21 SKUs down to four) and making it public on its website. Pricing complexity has been a perennialcomplaint of MicroStrategy customers. This change is an important step in reversing this perceptionin particular, and in improving the customer experience in general.
Cautions
A challenging year for MicroStrategy, 2014 saw sales momentum decline, a revolving door at theexecutive level and deep cuts in staff (20%) across the board, which has resulted in disruptionacross all functions. MicroStrategy customers report a belowaverage customer experience, includingsupport, product quality, a more difficult than average migration experience, and belowaverageachievement of business benefits — consistent with the results of the other ITcentric vendors. Thecompany is regrouping and has made a number of positive changes to improve in the future. It willneed to regain momentum in 2015 to remain a significant player in the market.
MicroStrategy must overcome a branding problem in the market and its installed base. It continuesto be associated with "traditional BI," due in part, perhaps, to competitors effectively pigeonholing itas such — even though the product portfolio and road map is focused on important requirementsfor governed data discovery in very large deployments, with additional differentiators around selfservice data preparation.
While the MicroStrategy development environment is robust and flexible, there is a steep learningcurve — even for seasoned report developers building any level of analytic complexity intoparameterized reports that simulate ad hoc analysis and interactive dashboards for business users.Even though usability enhancements continue to be delivered with MicroStrategy 9.x (such as moreoneclick user actions, reusable dashboards and dashboard design wizards) and more planned inMicroStrategy 10, its customers continue to rate the platform as below average for ease of use fordevelopment, ease of use for end users, and ease of administration and implementation. Broaderadoption of Visual Insight should contribute to resolving these issues and changing this assessment,but its relevance is still low in the overall user base.
OpenText (Actuate)The OpenText (Actuate) iHub 3.1 platform supports an integrated suite of reporting and analysis tools(Designer Pro, Analytics) in the Business Intelligence Reporting Tool (BIRT) product family, supporting theneeds of most user types from developers to information consumers and business analysts. In particular,Actuate is known for delivering highly personalized datadriven applications in customerfacing externaluse cases. It has also built up a large population of application developers in the Eclipse community toembed Actuate software into their applications.
Actuate is positioned in the Niche Players category because it primarily succeeds in one dominant usecase — embedded analytical applications for developers. Actuate has invested in a visual data discoveryand analytics offering, BIRT Analytics, but the product has yet to be widely adopted. Moreover, Actuate'scustomer reference scores have brought down its scores for Ability to Execute and Completeness ofVision.
Strengths
Actuate's greatest strength is its ability to deliver datadriven applications to a high volume of users,particularly in an embedded use case. An overwhelming percentage of customers (greater than90%) report using the product for static and parameterized reporting.
BIRT is commonly used by developers to embed BI and analytic content into applications, and itsproduct scores indicate that the capabilities within the platform to create and embed content arebetter than the average for vendors in this Magic Quadrant.
During the past few years, Actuate has modernized the iHub interface, delivering an improved userexperience and better integration across the product line. In addition, Actuate is focused on the IoTtrend, providing a new rich source of data for informationcentric applications.
The OpenText acquisition is largely viewed as a positive move — giving the vendor more stability,and access to more resources, salespeople and channel partners — although it also introduces someuncertainty that Actuate will continue as a dedicated analytics group inside OpenText.
Cautions
2/26/2015 Magic Quadrant for Business Intelligence and Analytics Platforms
http://www.gartner.com/technology/reprints.do?id=12AH4Q85&ct=150224&st=sb 13/38
Actuate was ranked at the bottom of 24 vendors on customer experience (see Note 3) and salesexperience; and 20 out of 24 for market understanding (which is a composite of ease of use,complexity of analysis and breadth of use). It also scored highest in migration difficulty. The netresult of all these scores is to push Actuate deeper into the Niche Players quadrant.
Actuate's core strength — providing customerfacing analytic applications to high volumes of users,will come under increasing competitive pressure as more vendors move to the cloud and are able toprovide similar user scalability to high user volumes outside the firewall.
While Actuate has a broad product family covering both the information delivery needs ofconsumers and the analysis needs of power users, it is overwhelmingly used for the former — withweaker product scores for the latter. BIRT Analytics is a capable offering, but Actuate needs to showgreater customer adoption to be viewed as a comprehensive BI and analytics platform.
The downside of the OpenText acquisition is the complexity of crafting a cogent marketing messagearound such a diverse product set; one that spans two major markets in enterprise contentmanagement and BI and analytics platforms. It was already challenging enough for Actuate toweave a story that combined the BIRT Content Services (Xenos) with BIRT Analytics (Quiterian) andiHub.
OracleOracle has a very large and diverse set of capabilities provided by the many products in its BI andanalytics portfolio, which is most often used for largescale enterprise deployments. Its products rangefrom hardware to software platforms, and include Oracle BI Foundation Suite, more than 80 prebuilt BIapplications, Oracle Endeca Information Discovery and Oracle Essbase — most of which are available onthe Oracle Exalytics Engineered System. The product portfolio also includes Oracle Transactional BusinessIntelligence, a family of embedded SaaS analytics offerings in the Oracle Fusion SaaS applications; anewly announced and generally available (September 2014) BI Cloud Service; and Oracle Big DataDiscovery (now generally available). Additional BI and analyticsrelated products (but not included in thisMagic Quadrant evaluation) include Oracle Database 12c, Hyperion Financial Management, OracleAdvanced Analytics, Hyperion Planning, and Hyperion Profitability and Cost Management, and the familyof Oracle Big Data products.
Oracle's position on the Magic Quadrant reflects a relatively fragmented product vision compared withother large vendors, and low scores in the Gartner customer satisfaction survey. Oracle must translate itsinvestments in improved usability, businessuserdriven data discovery and cloud into higher businessvalue for customers and an improved customer experience to be competitive across its wide range ofproducts and competitors and to remain in the Leaders quadrant in the future.
Strengths
Oracle is primarily used for largescale, centrally provisioned systemsofrecord reporting, most oftenin companies that also deploy Oracle EBusiness Suite. Integration with enterprise applications is theprimary reason for selecting Oracle, according to customer references. Consistent with thisdominant use, Oracle earned aboveaverage product scores for development and integration andtraditional styles of analysis. It has also demonstrated vision around multistructured and big dataanalytics with Oracle Endeca, a searchbased data discovery platform, and the newly released BigData Discovery platform for Hadoop.
Oracle's packaged business domain and industry analytics applications for Oracle EBusiness Suite,PeopleSoft, Siebel and JD Edwards, are a top buying driver and give customers a way to deployOracle BI more quickly, leveraging Oracle applications and other data. The analytic applicationsinclude prebuilt extraction, transformation and loading (ETL) using Oracle Data Integrator, physicalstar schema models, prebuilt reports and dashboards for a range of functional areas includingfinancial management, CRM and supply chain, as well as industry verticals including retail andtelecommunications.
Oracle BI has gained adoption in the cloud through embedded analytics in its Fusion SaaSapplications in the human capital management, CRM and ERP domains. Oracle TransactionalBusiness Intelligence (OTBI) has introduced Oracle BI to growing numbers of lineofbusiness usersin HR, sales, service and marketing, and finance functions. Oracle now also offers a warehousebased version called OTBI Enterprise, which offers packaged analytic capabilities in the cloud similarto its onpremises BI applications.
Oracle has a substantial sales and marketing footprint, and a large set of global system integratorstrained on many of the Oracle products who can build, implement and deploy custom applicationsand integrations.
Oracle's talent, products and technology gained with the Endeca acquisition can be leveraged bycustomers to address growing requirements for searchbased data discovery on multistructureddata. Oracle Endeca also received top quartile scores for searchbased data discovery.
Cautions
Customers rate Oracle near the bottom across all customer experience measures. Complexity andcost of product line are sources of customer concern. Difficulty of use, development andadministration, low product quality and quality of support are primary challenges noted by referencecustomers. Low sales experience and low achievement of business benefits were also cited.
Oracle scored below the average for this Magic Quadrant on most product capabilities, but above theaverage for development and integration and for traditional styles of analysis.
Oracle has recently entered the market with a cloud BI platform offering, but is late to the marketcompared with cloud BI pureplay vendors. The new Oracle BI Cloud Services offering is likely toappeal to Oracle's cloud customers and be bundled with larger cloud services deals, but earlyversions will not be competitive with other cloud offerings that have been in the market muchlonger.
Oracle is very late to market with data discovery capabilities to address mainstream buyingrequirements. The newly announced Big Data Discovery tool (launched during February 2015) andVisual Analyzer (in Beta from January 2015) may help Oracle fend off the data discoverycompetition in its installed base. Big Data Discovery looks promising and may provide Oracle withnew opportunities both inside and outside its installed base.
Panorama SoftwarePanorama Software's Panorama Necto suite innovatively combines social BI with enterprise features to
2/26/2015 Magic Quadrant for Business Intelligence and Analytics Platforms
http://www.gartner.com/technology/reprints.do?id=12AH4Q85&ct=150224&st=sb 14/38
deliver a unique and guided interactive and data discovery experience that is collaborative andautomatically highlights important insights to the user.
Panorama is in the Visionaries quadrant because of its product vision, innovation and strong marketunderstanding. It has delivered a nextgeneration yet governed data discovery experience based on aunique combination of social and collaboration features together with smart data discovery. However,limited sales, marketing, partnering and geographic presence hinder its growth potential.
Strengths
Panorama Necto combines social, collaboration and smart insight capabilities with enterprisefeatures to deliver a unique, yet governed and guided data discovery experience. Necto is animplementation of smart data discovery with automatic recommendations of relevant insights basedon patterns in the data, users' preferences and past behavior. Panorama has achieved strong resultsacross key measures of Completeness of Vision, such as market understanding (see Note 3), withhigh marks for ease of use, breadth of use and enabling users to conduct complex types of analysis.
The main reasons why customers choose Panorama's software are its ease of use for end users anddevelopers and its functionality. Customers report among the fastest average report developmenttimes of any vendor in this Magic Quadrant. Moreover, Panorama's survey results again indicate thewidest use of collaboration capabilities, which confirms that its native social and collaborationcapabilities are central to what customers value about the product. Collaboration, analyticdashboards and business user data mashup are key product strengths.
While Panorama Necto supports a range of relational and OLAP data sources, it continues to be usedextensively as a front end for Microsoft SQL Server Analysis Services — via MultidimensionalExpressions (MDX). It can also leverage Microsoft Power Pivot and Reporting Services as datasources, and integrates well with Microsoft SharePoint. This may, in part, also explain its fast reportdevelopment time results. However, unlike traditional OLAP frontend tools, Panorama Necto offersdeep OLAPstyle analysis within an updated social and collaborationbased guided data discoveryuser experience.
Panorama also continues to receive high reference scores on critical customer experience metrics forsupport and product quality. Customers also rank Panorama highly for achievement of businessbenefits.
Although Panorama customers tend to be smaller companies that report smaller data volumes anduser sizes, 75% of them consider it to be their enterprise standard.
Cautions
Panorama Software relies heavily on Microsoft, with products optimized for Microsoft SQL Server,SharePoint, Power Pivot and Azure. Although this creates an opportunity to sell into Microsoft's largeinstalled base of customers, and was a particularly attractive when Microsoft's BI capabilities werelacking, it is also increasingly a risk. Microsoft continues to improve its own BI offerings with acompelling costvalue proposition and road map. This is likely to narrow the opportunity for productsthat only complement Microsoft's information management stack. Panorama is moving to lower itsstrategic reliance on the Microsoft stack.
Cloud, mobile BI and metadata management are weaker components of the platform, althoughPanorama has recently added support for Android and iOS devices.
Compared with its competitors, Panorama has a small direct sales team and a limited partnerprogram. This continues to pose challenges for Panorama in generating awareness and gainingtraction in an increasingly crowded and competitive market — particularly as other vendors withgreater resources (including Logi Analytics, SAP, SAS and IBM) are beginning close in on Panorama'sproduct innovation gap.
Panorama's unique capabilities, exceptional customer satisfaction and lack of resources to capitalizeon its differentiators, make it an attractive acquisition candidate for an organization looking forbusinessuseroriented capabilities. Any acquisition could cause disruption to customers.
Panorama's limited geographical presence remains an issue preventing broader awareness. AlthoughPanorama has support centers and distributors globally, its sales are concentrated in the MiddleEast, North America and Europe.
PentahoPentaho is transforming from an opensourcebased BI platform into a big data and embedded analyticsspecialist, enabling significantly more complex use cases. Pentaho's data integration (PDI) and analyticscomponents (Weka and Data Science Pack) are at the core of this transformation, delivering tightintegration with Hadoop and other NoSQL databases as well as support for advanced analytics with R.Pentaho is positioned to the right in the Niche Players quadrant, due to its focus and innovation in the bigdata analytics space.
On 10 February 2015, Hitachi Data Systems announced its intention to acquire Pentaho. Hitachi DataSystems plans to continue to operate Pentaho as a separate business unit and to embed Pentaho into itsportfolio of big data and analytics products and services, with a particular emphasis on solutions for theIoT. The acquisition is expected to close by June 2015.
Strengths
Pentaho continues to have success with embedded BI — where it has a large installed base ofcustomers — and continues to offer a broad spectrum of traditional BI tools. Embedded BI andtraditional styles of analysis are rated as platform strengths and the company is steadily shifting tobig data initiatives. Customers recognize its ability to collect and transform many data sources,including social media, and with 20% of reference customers claiming to use Pentaho to collect andanalyze data this type of data placing it among the top three in this category. Data access andintegration is a top reason why customers choose Pentaho.
Pentaho has been early to invest in selfservice data preparation, with 17% of its customerreferences saying they use the platform for this purpose — the thirdhighest score in this MagicQuadrant. It will continue to expand the breadth of connectors offered with the new solutions thatwill be available during the coming months — for big data sources in particular, such as cloud andsensor data supporting the IoT.
Customers are generally satisfied with the cost/value proposition of Pentaho. Customers reportachieving aboveaverage business benefits, and the low license cost is the top reason whycustomers select the platform. Pentaho is also in the top quartile of vendors whose customers report
2/26/2015 Magic Quadrant for Business Intelligence and Analytics Platforms
http://www.gartner.com/technology/reprints.do?id=12AH4Q85&ct=150224&st=sb 15/38
no limitations to further adoption of the platform.
The average report development time with Pentaho is 3.6 days — slightly better than the overallaverage of 4.0 days. Coupled with the data preparation and advanced analytics capabilities offeredby the vendor, this addresses the needs of a new type of user — the data scientist — which expandsPentaho's opportunity beyond its traditional developer customer base.
Cautions
Pentaho faces a number of important challenges that may hamper its future growth, as 14% ofreference customers report that the software quality is a limitation that prevents the expansion ofuse and 68% of customers (the highest percentage in the Magic Quadrant) report some type ofproblem with the platform. Also, 24% of the reference customers claim that the platform isunreliable and unstable, while another 24% tag it as difficult to implement. Moreover, customersgive Pentaho lowerthanaverage scores for customer experience (see Note 3), including productquality and support. All these issues may have been the result of the gradual customer migrationprocess to version 5.0, a major release that included a completely rearchitected platform and newuser experience. Furthermore, Pentaho asserts that these issues are largely addressed with versions5.1 and 5.2, introduced during 2014. We would expect these results to improve in 2015 ascustomers upgrade to these new releases.
Pentaho continues to rebrand itself and must continue to generate awareness in the market toestablish itself as an innovator, based on the forwardlooking capabilities available on its portfolio.Many organizations still see Pentaho as an opensource BI pureplay vendor. The company needs toclose some of the gaps in its platform, such as expanded cloud support (a coming release will signala stronger partnership with AWS) — and more userfriendly tools for freeform informationexploration. Collaboration, metadata management and mobile are also rated as weaker componentsof the platform.
Over the years, Pentaho' legacy as an opensource and embedded solution has contributed to ageographic presence that is more pervasive than that of many other companies of equivalent size.That network of partners needs to be able to support more advanced initiatives leveraging theplatform's capabilities. They will need ongoing training and certification to support the company'snew set of capabilities in the big data space. They should also be able to support other componentsof big data architectures, such as Hadoop as the ecosystem expands. We would expect theacquisition of Pentaho by Hitachi Data Systems will significantly improve Pentaho's ability to expandglobally.
PrognozThe Prognoz BI platform (Prognoz Platform) consists of a highly integrated, endtoend suite ofcomponents used for the development, deployment and administration of tightly coupled data warehouseand BI solutions. The platform supports the full spectrum of analytic capabilities, including traditionalreporting and dashboarding, interactive visualization and advanced analytics such as time series analysis,modeling and forecasting. Prognoz also offers a wide range of industry and domainspecific analyticalapplications built on top of the platform, which are typically productized versions of solutions built forcustomers who leverage the extensive services capabilities of Prognoz.
While Prognoz does offer a wide range of capabilities, and despite investments in a global strategy, itssuccess and primary customer base remains concentrated in Eastern Europe and the platform has yet togain significant awareness and traction in other regions of the world — which is a major executionrelatedreason for its placement in the Niche Players quadrant again this year. From a Completeness of Visionperspective, the product road map currently lacks some critical forwardlooking components — aroundsmart data discovery and businessuser data preparation — that we expect to drive buying requirementsin the future and that are being planned and developed by competing BI and analytics vendors.
Strengths
Customers rated Prognoz second (of the vendors in this Magic Quadrant) in terms of salesexperience, indicating a high level of satisfaction during the entire sales cycle. Customers value theflexible pricing model that Prognoz offers, coupled with the fact a single endtoend platformeliminates the complexity of engaging with multiple vendors to support their BI and analytic needs.The desire for a fullfeature platform ranks high on the list of buying criteria for customers, with42% of references citing functionality as their top reason for buying Prognoz.
Prognoz earned an aboveaverage aggregate product score, with aboveaverage ratings on mostproduct capabilities — apart from business user data mashup, collaboration and freeformexploration. This underscores why Prognoz scored better for centralized and embedded BI use casesthan for decentralized deployments.
Prognoz was rated third overall in market understanding (see Note 3), which measures how well thevendor delivers on current buying requirements. It is composed of ease of use, complexity ofanalysis and breadth of use, and Prognoz was rated above the overall average for all of these.
When asked about platform problems, such as performance and scalability issues, difficulty with useor implementation, instability or missing functionality, Prognoz received a top rating with 90.5% ofreferences indicating no such issues with the platform. Similarly, Prognoz received a top ratingregarding limitations to wider deployment, with 82.5% of references citing no such limitations.
Prognoz ranked second in user enablement, which includes documentation, training, tutorials, usercommunity, customer conferences and availability of skills. For the related strength of overallsupport, Prognoz was ranked in the top five by its references, with ratings above the overall averagefor all individual components of support: response time, level of expertise of support staff and timeto resolution.
Cautions
The Prognoz platform is considered to be the enterprise standard in only 60% of referenceorganizations that responded to the survey, which is somewhat surprising given the range offunctionality that it delivers. However, 37% of Prognoz references indicated that their organizationhas no enterprise standard BI platform, which may indicate that fullscale deployment of allcomponents of the platform is a workinprogress for the customers of Prognoz.
While the Prognoz platform delivers strong data integration capabilities through its builtin ETL,primarily used by developers to prepare data for analysis, its support for businessuseroriented datamashup was identified as a weaker platform capability — contributing to an overall lower productscore for a decentralized deployment use case, where mashup capabilities are weighed heavily.
2/26/2015 Magic Quadrant for Business Intelligence and Analytics Platforms
http://www.gartner.com/technology/reprints.do?id=12AH4Q85&ct=150224&st=sb 16/38
Prognoz's lower score for a decentralized deployment use case was also impacted by the relativelyweak collaboration and social capabilities offered within its platform.
According to the survey, Prognoz customers report that they generally deploy 12 IT fulltimeequivalents to author BI content and administer the platform and support users, which is slightlyhigher than the overall average for the vendors in this Magic Quadrant and is compounded by thesmallerthanaverage deployment size reported by references — 836 versus an overall average of1,554. Potential buyers should note, however, that the Prognoz platform includes a datamanagement layer (ETL and database) which may explain the need for a slightly higher number ofIT fulltime equivalents compared with other BI vendors that do not offer fully integratedinformation management and analytic capabilities within their platform. It should also be noted thatPrognoz typically requires a significant services engagement to set up and deploy the platform,which should also be considered when evaluating ownership cost.
While support is a clear strength related to customer experience, some other key componentsrelated to customer support — product quality and migration difficulty — were not rated as highly byPrognoz's survey references. Customers rated it as slightly more difficult to migrate than the overallaverage, and product quality was rated only slightly above the overall average.
Pyramid AnalyticsPyramid Analytics is an emerging and wellfunded vendor positioned as a Niche Player for the secondconsecutive year. Targeted primarily at customers using the Microsoft BI stack, its platform, BI Office, is aWebbased, endtoend BI platform offering a range of analytic capabilities for selfservice BI, interactiveanalysis and visualization, while keeping all data and metadata within the BI Office repositories to supportgovernance. BI Office is an integrated platform for relational inmemory or multidimensional analysis andvisualization. The suite incorporates: Data Discovery (formerly bioXL) for ad hoc querying, OLAP analysisand interactive visualizations; Dashboards (formerly bioPOINT) for dashboards and KPI scorecards; andPublisher (formerly bioWRITER) for report publishing, alerting and distribution. Advanced analytics needsare addressed with a newly introduced integration of R, which replaces the previously announcedbioMINER module. BI Office Online, which was introduced during 2014, is a public cloud offering thatdelivers the same endtoend BI functionality as the onpremises platform.
Pyramid Analytics' strong customer experience scores, and its product and vision for governed datadiscovery are key drivers of its Magic Quadrant placement.
Strengths
Functionality was the primary reason for selecting BI Office, followed by ease of use for developersas well as end users and implementation cost and effort. In line with that perception, surveyrespondents scored Pyramid Analytics as above average with respect to handling complex analysis,overall ease of use, and business benefits achieved. Pyramid Analytics users report it as having thefastest time to create simple, moderate or complex reports and dashboards of any vendor in theMagic Quadrant.
BI Office offers an endtoend platform with a common interface. This is the key strength of theplatform and Pyramid Analytics achieved among the highest scores for traditional style of analysisand platform integration, as well as for enterprise features for BI platform administration, metadatamanagement, ITdeveloped reports and dashboards and cloud deployment. The platform receivedaggregate aboveaverage marks for centralized, governed data discovery and embedded use cases.
This year, customers revealed improvements in product quality, which was an issue last year. This,in addition to the comprehensive analytic capabilities and newly introduced features, might be thereasons why approximately 42% (third highest overall) of customers changed their mind from lastyear and now feel more positive about Pyramid Analytics' future.
While Pyramid Analytics came late to supporting mobile BI, it now offers native support for Microsoft,iOS and Android. The high demand of its customers, as expressed in last year's survey, turned into31% of respondents now actively using mobile BI (a percentage in the top quartile of active usage).
Cautions
Pyramid Analytics started approaching "governed data discovery" with BI Office. Business usersusing the bioXL module can use MashPit for selfservice data mashup on data sources that havebeen added to the platform as a data source, and interactively explore the data. However, thesebusinessuser data mashup capabilities are rated lower than other features — with minimal datainference, profiling and enrichment capabilities.
While mobile use is high relative to other vendors in this Magic Quadrant, the capabilities for it andfor collaboration, which were significantly enhanced (including timelines and seamless integrationwith thirdparty social networks such as Yammer and Chatter) are rated lower than the overallaverage.
The primary problems stated by survey respondents are reliability and stability issues, indicating thatPyramid Analytics still has room for improvement in that respect. As the customer base and numberof users are growing, Pyramid Analytics should also place more emphasis on improving userenablement — where it earned a belowaverage score overall.
Although it is expanding its strategy, Pyramid Analytics' predominantly Microsoftcentric approachcontinues to be a risk for future growth as Microsoft invests heavily in enhancing its own BIcapabilities. It is also a potential limitation for Pyramid Analytics in expanding its footprint in largeenterprises.
BI Office deployments are most likely to be largely used by SMB customers, or in departmentaldeployments at large enterprises. This is indicated by the average number of users, which is 451compared with this year's average of 1,554 users, although the number of users grew by a factor ofthree compared with last year. The same holds true for data volume accessed, which has more thandoubled and is now slightly above the average. Prospective customers looking for largescaledeployments should check Pyramid Analytics' references.
QlikQlik is a market leader in data discovery. It sells two products, both based on an inmemory associativesearch engine. QlikView is a mature, selfcontained, tightly integrated development platform used by IT ormore technical users for building intuitive and interactive dashboard applications faster and easier thantraditional BI platforms. Qlik Sense is a new platform (released during September 2014) that givesbusiness users the ability to build their own dashboards while giving IT the ability to govern, manage,scale and embed them.
2/26/2015 Magic Quadrant for Business Intelligence and Analytics Platforms
http://www.gartner.com/technology/reprints.do?id=12AH4Q85&ct=150224&st=sb 17/38
Qlik's position as a Leader in this Magic Quadrant is driven by strong vision around governed datadiscovery with the introduction of Qlik Sense and high level of market understanding, but executionaround customer experience (particularly support) and the sales experience — combined with slowermarket momentum, particularly in the runup to the Qlik Sense release — are concerns. Following theQlik Sense release, interest in Qlik seems to have rebounded. During 2015, for continued momentum,Qlik must refocus on the customer experience as it transitions to effectively selling two products andmatures Qlik Sense's functional capabilities through its newly introduced agile point release schedule(that is, three per year).
Strengths
Qlik offers a highly interactive dashboard development product portfolio that spans businessuserselfservice, centralized dashboard application development, and IT needs for enterprise features tosupport governed data discovery. Qlik made the bold decision to invest in Qlik Sense, a completelynew platform, to enhance its enterprise features and deliver on governed data discovery. Eventhough Qlik Sense is new to the market, with still limited adoption to date, Qlik has the highestpercentage of survey customers (mostly using QlikView) reporting that they use the platform forgoverned data discovery. Qlik continues to build differentiation into the platform through bothinternal development and strategic acquisitions (for example, NComVA, DataMarket and NPrinting).
Ease of use, particularly for dashboard consumers, is a key reason customers report buying Qlik, inaddition to low implementation time and effort — particularly compared with traditional BIplatforms. Qlik also enables users to conduct a broader range of more complex types, of analysis —through intuitive interactive discovery — than most vendors in this Magic Quadrant. Thiscombination has been a key driver of its success. Qlik offers free desktop versions of both of itsproducts and this freemium model gives users a riskfree way to try out the product. Consistentwith its use and reasons for purchase, Qlik scored well on analytics dashboards (responsive designand storytelling), freeform exploration (associative, smart search) and mobile — in support of bothdecentralized and governed data discovery use cases — both platform strengths.
Qlik has shown an increased penetration into the enterprise from last year. Although Qlik's averagedeployment size is at 791 users, below the overall average of 1,554, more than 62% of Qlik'scustomers consider it to be their BI standard (versus around 50% last year) and customerreferences report that it is among the top five in terms of being deployed broadly acrossdepartments and enterprisewide. As Qlik Sense is more broadly adopted, enterprise penetrationshould increase.
While many aspects of customer experience (see Note 3) declined, user enablement and availabilityof skills are exceptions. Reference customers rate Qlik in the top five for user enablement, whichincludes documentation, online training, tutorials, user communities and conferences, and for wideavailability of skills. A particular strength is the Qlik Community, which offers an online collaborationhub and center of excellence for prospects, customers, partners and employees.
Partners, including SIs, resellers and now OEMs, have been more instrumental in Qlik's globalawareness and growth strategy than for any other BI or standalone data discovery vendor. QlikSense's emphasis on open APIs should expand the opportunities for partners to build valueaddedapplications with the platform.
Cautions
Qlik offers two products with two different pricing models. While this dual product and pricingstrategy expands options for customers, it may also be confusing as they try to decide when todeploy Qlik Sense versus QlikView, or in combination; how the different pricing models are managedand affect overall cost; and how and when to migrate. BI buyers will need to invest time inunderstanding the differences and to assess fit with their requirements.
Qlik Sense is a new, 1.0 product and platform that has a number of differentiators over QlikView andthe rest of the market (for example, storytelling, smart visualizations and smart search), but is alsoa workinprogress in a number of functional areas. This will result in limited adoption of Qlik Sensewhile Qlik enhances its capabilities to support interactive exploration for the business analyst, to bemore competitive with other data discovery tools; and to extend its capabilities for advanceddashboard applications, to be more comparable to QlikView for those customers that want to moveto Qlik Sense as their single platform. A focus on maturing the Qlik Sense platform may limit Qlik'sbandwidth to invest in more forwardlooking capabilities (such as smart data discovery, selfservicedata preparation, cloud and other) to differentiate/help the platform remain competitive in thefuture.
Qlik has not offered production reporting and its direct query to relational sources capabilities (versusinmemory only) have not been widely adopted. Customers have had to be prepared to mix andmatch for systemofrecord reporting. This has limited Qlik's use as an enterprise standard when acustomer wants to perform both data discovery and reporting in a single platform. Product scoresreflect this previous direction, with weaker ratings in ITdeveloped reports and dashboards andtraditional styles of analysis. However, Qlik has recently acquired (during February 2015) existingpartner NPrinting — a report generation, distribution and scheduling application with Microsoft Officeintegration capabilities for QlikView (integration with Qlik Sense is on the road map) to address thislimitation. NPrinting has over 1,000 current QlikView customers. The platform also scored lowerthan the overall average in BI administration, metadata management (Qlik Sense is better thanQlikView for both) and for business user data mashup. Selfservice data preparation is a future roadmap item for Qlik.
Qlik has had inconsistent sales execution during the past couple of years, potentially explained by itsshift from selling to departments to supporting the needs of strategic enterprise deployments.However, this transition has taken a toll on how customers view their sales experiences with Qlik —for which it was rated in the bottom five of the vendors in this Magic Quadrant. This is often asource of concern during Gartner client inquiries. Perception of customer experience has alsodeclined from last year, driven primarily by low customer support ratings (it was rated in the bottomfour vendors). Customer experience matters to buyers, and a successful transition on both fronts isimportant if Qlik is to accelerate its market penetration.
Qlik has been later than a number of other Leaders to deliver a fully featured cloud offering. QlikSense's cloudbased sharing capabilities represent its first step. Qlik's customers put it in the topthree for having no plans to adopt it for cloud BI.
Salient Management CompanySalient Management Company offers its Collaborative Intelligence Suite, which provides deep data
2/26/2015 Magic Quadrant for Business Intelligence and Analytics Platforms
http://www.gartner.com/technology/reprints.do?id=12AH4Q85&ct=150224&st=sb 18/38
discovery capabilities that are used by its clients for an array of analytic solutions including: revenuemanagement, merchandising and category optimization, supply chain optimization, margin analysis, andothers.
Salient is positioned in the Niche Players quadrant because it provides one dominant use case — datadiscovery for business analysts and power users. While Salient is strong in this area, it has only recentlyreleased a dashboard product that would increase the breadth of features in the information deliveryarea. Moreover, it has very limited adoption — primarily in North America — and doesn't have a largenumber of users in each customer site. Despite its limited growth and adoption, Salient scored particularlywell on some of the key aspects of our customer reference survey.
Strengths
Salient was ranked third out of 24 vendors for overall sales experience, and first in customerexperience (which is a composite score of product quality, support, sales experience, skills availabilityand user enablement — minus migration difficulty — see Note 3).
Salient's customers identified writeback for driverbased planning and constraintbased modeling asamong its key strengths. The ability to perform in scenariomodeling and supportplanning types ofuse cases is less common in inmemory BI products, which tend to focus on ad hoc "slice and dice"interactions. The platform rates most highly in traditional styles of analysis (OLAP and ad hocanalysis).
With its inmemory model and visual data mining capabilities, Salient offers an unfettered drillingexperience, giving users control over all relevant data.
In particular, Salient is strong in the beverage and consumer packaged goods (CPG) industries,especially for revenue management applications such as those for sales forecasting and marginanalysis. Recently, it has also made strides in the state government and healthcare sectors.
Cautions
Salient was ranked in the bottom quartile (of the vendors in this Magic Quadrant) for breadth of use.Even within the data discovery environment, Salient is used for traditional OLAP activity (albeit on amodern inmemory architecture) for drilling and writeback; but the platform is not meant for theincreasingly dominant use case of user autonomy, selfservice and data blending. Salient hasrecently released new dashboard and native mobile applications that could broaden its scope towardmore information delivery use cases.
Salient's weakest product components are its analytics dashboards, BI platform administration,development and integration, and embedded BI, making it better suited for decentralized use cases.
Salient was ranked in the bottom four of 24 in deployment size (number of users). This is notsurprising as Salient has traditionally offered an architecture primarily for power users rather thaninformation consumers. Salient's new dashboard and mobile products are intended to increaseadoption among information consumers.
For business benefit, Salient was only ranked 9 out of 24 vendors. This is surprising, given itspositive results in other parts of the customer reference survey and its solution mentality. (Businessbenefit is a composite score of 11 survey questions.) Salient is better suited to some (such as theability to make better decisions faster), than others (such as reducing IT head count).
Although its partner network continues to grow and has support in all major regions of the globe,Salient is still not very wellknown in the market. It is primarily a North American vendor, with alimited sales presence, a small partner ecosystem and few global resources.
SAPSAP delivers a broad range of BI and analytic capabilities: for large ITmanaged enterprise BI deploymentswith the SAP BusinessObjects BI platform; and for decentralized data discovery deployments with SAPLumira. This is complemented with the SAP Hana inmemory data platform. Companies often choose SAPas their enterprise BI standard, particularly if they also standardize on SAP for ERP applications.
SAP's position in the Leaders quadrant is primarily based on two aspects. SAP is investing heavily in avisionary product direction with SAP Lumira and has good product scores that have improved with thenew release, and it has introduced its simplification strategy for the BI platform components. However,SAP continuously gets belowaverage scores in almost all areas of customer experience and businessbenefits achieved, and has had limited success to date in addressing businessuser data discoveryrequirements. SAP must translate its visionary investments into momentum and an improved customerexperience to remain a Leader in the future.
Strengths
SAP has continued investing in new capabilities with a number of potential differentiators. Forinstance: SAP Lumira's advanced selfservice data preparation and Infographics features; smart datadiscovery, by integrating Predictive Analytics (SAP's advanced analytics platform acquired fromKXEN) and Lumira; governed data discovery, by integrating SAP Lumira with SAP BusinessObjectsEnterprise, and integration with SAP Hana. However, SAP's future success in gaining traction andadoption with its new capabilities will demonstrate to what extent SAP can compete successfullywith data discovery leaders.
SAP product capabilities scored above average in aggregate, with a broad range of functionality andparticular strengths in BI platform administration and mobile.
Survey responses show that SAP BusinessObjects BI is predominantly used for large customerdeployments. The average number of users is more than twice the survey average and the thirdhighest overall. SAP is, most often, the enterprise BI standard — as indicated by 81% of surveyrespondents (among the highest percentage in the survey) — often in combination with SAPbusiness applications (more than 60% of its surveyed customers use SAP as their primary ERPsystem, although the company has said that new BI revenue is derived from a much lowerpercentage of SAP ERP customers).
SAP announced its product simplification strategy during 2014, aiming to significantly reduce thenumber of BI components. While this is still a workinprogress, it is a clear sign of intent. Togetherwith SAP's investments in SAP Lumira, this might have led 35% of the respondents to feel morepositive about SAP's future (a percentage above the overall average). Furthermore, less than 8% ofcustomers, slightly below the survey average, consider discontinuing their use of SAP's BI platform.
2/26/2015 Magic Quadrant for Business Intelligence and Analytics Platforms
http://www.gartner.com/technology/reprints.do?id=12AH4Q85&ct=150224&st=sb 19/38
Cautions
Despite SAP continuing its BI Customer Success initiative, its customer experience (see Note 3)scores are among the lowest across all measures. It is also scores below average in marketunderstanding, reflecting its ongoing struggle to meet businessuseroriented data discoveryrequirements in addition to meeting the requirements for large ITmanaged enterprise BIdeployments. Moreover, analytic dashboards are identified as one of the weaker components of theplatform. SAP needs to further invest in improving customer experience within its installed base andnot risk overstressing its clients' loyalty and stack stickiness.
SAP's reference customers rated it near the lowest score overall for sales experience this year.Consistent with last year, 42% identified cost as the most important limitation for widerdeployment. Apparently, SAP's simplified pricing and licensing model, which was introduced duringSeptember 2014, is still early in its roll out and has not yet had a positive effect. Additionally, inGartner's dealings with clients, SAP customers continue to raise concerns regarding additionallicense and maintenance costs when considering upgrading to the latest version to fully leverage allavailable BI capabilities.
Customers previously reported improvements in product quality and stability with version 4.1 of SAPBusinessObjects BI. However, SAP needs to continue improving product quality as its scores aresecond from the bottom again this year. Stability and reliability problems were identified as the topissues by the respondents; followed by absent or weak functionality as the second most importantproblem. SAP also rated below average in BI platform integration, which can be an additionalchallenge when support and product quality are an issue. SAP's BI platform is mostly used for largeITmanaged enterprise BI with traditionalstyle analysis and reportingcentric use cases, which arerelated to the more basic types of analysis reported by users of the platform. SAP is also rated thesecond lowest across all three measures of ease of use — that is, ease of use for end users, contentcreation, and administration and implementation.
While SAP started to offer a number of cloud BI options, ranging from infrastructure, platform andSaaS to managed cloud as a service, it just started to get traction in comparison with cloud BI pureplay vendors.
SASSAS offers vast array of integrated components within its Business Intelligence and Analytics suite thatcombines deep expertise in statistics and predictive modeling with innovative visualization enabled bypowerful inmemory processing capabilities. SAS Visual Analytics is the flagship product in the suite fordelivering interactive, selfservice analytic capabilities at an enterprise level — extending the reach of SASbeyond its traditional user base of power users, data scientists and IT developers within organizations.SAS also leverages its range of platform components and expertise in various industries to offer a widerange of vertical and domainspecific analytic applications.
SAS is again a Leader this year as it continues to build momentum with SAS Visual Analytics, which wasreleased in 2012 and has gained some traction in the market against the data discovery leaders throughproduct differentiation and a more accessible pricing model (with a lower entry point than initially offered).SAS also continues to demonstrate very strong vision in many areas such as the expansion of both smartdata discovery capabilities and embedded advanced analytics within SAS Visual Analytics, seamlessnavigation between SAS Visual Analytics and SAS Visual Statistics, and integration across other coreanalytic components of the platform in order to address enterprise requirements for governed datadiscovery.
Strengths
SAS was rated slightly higher for market understanding (by references) than the average for thisMagic Quadrant; this is a composite measure combining ease of use, complexity of analysis andbreadth of use (see Note 3). Support for complex analytic use cases is an obvious strength for SAS,but the fact that eight other vendors ranked higher for complexity of analysis may indicate that inmany cases the primary product being used is Enterprise BI, which offers more traditional styles ofreporting, and that penetration and adoption of Visual Analytics to address more complex use casesis a workinprogress within SAS's BI customer base. The portfolio of products reaches a broaderrange of users leveraging the platform to support use cases spanning the full analytic spectrum,which is a positive for SAS and a differentiator for its platform.
The main reasons reference customers choose SAS are functionality and product quality, which areclear strengths. SAS delivers a full range of functionality through integrated BI and analytic platformcomponents such as SAS Visual Analytics, SAS Office Analytics and SAS BI/Enterprise BI Server(EBI) as well as complementary products used for data integration, data management, data miningand predictive modeling — all built with a focus on product quality for which SAS was rated justabove the overall average.
The SAS BI and analytics platform can be deployed to meet the needs of a diverse set of use cases,as indicated by reference organizations that ranked SAS third for frequency of deployment in bothcentralized and decentralized BI use cases. This diversity positions SAS favorably to differentiateitself from other vendors in the market with a platform that is able to meet both the enterpriseneeds of IT and the selfservice needs of the business.
Nearly 15% of survey references report using the integrated selfservice data preparationcapabilities offered by SAS to allow business users and analysts to access, integrate and transformdata in preparation for analysis. The availability of integrated businessuser data preparationcapabilities is a differentiator for SAS compared with other data discovery vendors; particularlyTableau, which relies on thirdparty integration with vendors such as Alteryx, Paxata, and Trifacta todeliver this capability to its customers.
Cautions
License cost was again a concern for SAS customers in 2014 and was cited as a barrier to widerdeployments by 46% of the reference organizations who responded to the survey, higher than allbut one other vendor in the Magic Quadrant. It is expected that this will improve in next year'ssurvey as customers benefit from the fact that SAS revamped its Visual Analytics pricing structurein September 2014 — to address this concern and offer its customers a per user price point thatmore closely aligns with competitive data discovery products in the market. With this change, SAShas also made Visual Analytics more accessible to the SMB market with a lower point of entry —fourcore server license priced at $8,000, which can support up to five power users. Under the newpricing structure, the peruser license cost of Visual Analytics is more comparable to leading datadiscovery offerings, which is critical to SAS's goal of extending the reach of analytics more broadly
2/26/2015 Magic Quadrant for Business Intelligence and Analytics Platforms
http://www.gartner.com/technology/reprints.do?id=12AH4Q85&ct=150224&st=sb 20/38
within its customer base and to win net new customers.
Customers reported significant difficulty in migrating to the latest release of the SAS platformcomponents they have deployed, as indicated by its being given the fourthhighest migrationdifficulty rating. While the migration difficulty rating is high (compared with other Magic Quadrantvendors included in the survey) it should be noted that the score corresponds to a rating between"straightforward" and "somewhat complex" according to the scale used in the survey. It is also likelythat the complexity reported by some customers is related to platformlevel migrations rather thanversion updates to individual products.
Support for complex use cases is a strength of the platform, but SAS references rate both overallease of use and business benefits delivered as below the overall average. This could be becauseadoption of Visual Analytics, while higher than other traditional market share leaders, is still earlyand has yet to have its full impact on perceived ease of use; also, the most recent release of EBI,which offers usability improvements, has not yet been widely deployed. Other data discoveryplatforms are currently doing a better job of executing on the vision of making hard things easy andbeing accessible to a broader range of users, but SAS Visual Analytics is gaining awareness andtraction in the market and has the potential to close the gap.
TableauTableau's intuitive, visualbased data discovery capabilities have transformed business users' expectationsabout what they can discover in data and share without extensive skills or training with a BI platform.Tableau's revenue growth during the past few years has very rapidly passed through the $100 million,$200 million and $300 million revenue thresholds at an extraordinary rate compared with other softwareand technology companies.
Tableau has a strong position on the Ability to Execute axis of the Leaders quadrant, because of thecompany's successful "land and expand" strategy that has driven much of its growth momentum. Manyof Gartner's BI and analytics clients are seeing Tableau usage expand in their organizations and have hadto adapt their strategy. They have had to adjust to incorporate the requirements that new users/usage ofTableau bring into the existing deployment and information governance models and informationinfrastructures. Despite its exceptional growth, which can cause growing pains, Tableau has continued todeliver stellar customer experience and business value. We expect that Tableau will continue to rapidlyexpand its partner network and to improve international presence during the coming years.
Strengths
Tableau has clearly defined the market in terms of data discovery, with a focus on "helping peoplesee and understand their data." It is currently the perceived market leader with most vendorsviewing Tableau as the competitor they most want to be like and to beat. At a minimum, they wantto stop the encroachment of Tableau into their customer accounts.
Tableau rates among the top five vendors for aggregate product score, with particular strengths inthe decentralized and governed data discovery use cases. In particular, analytic dashboards, freeform exploration, businessuser data mashup and cloud deployment are platform strengths.Tableau's direct query access to a broad range of SQL and MDX data sources, as well as a number ofHadoop distributions, native support for Google BigQuery, Salesforce and Google Analytics has beena strength of the platform since the product's inception and often increased its appeal to IT versusinmemoryonly options. As a result, customers report having slightly belowaverage deploymentsizes, in terms of users, but among the highest data volumes (in this Magic Quadrant).
Tableau has managed its growth and momentum well. The company has been able to grow andscale without a significant impact on discounts extended (that is, these are very limited) orcustomer experience. Most technology companies struggle to manage this balance between growthand execution.
Tableau customers report among the highest scores in terms of breadth and ease of use along withhigh business benefits realized. Gartner inquiries and customer conversations reveal that Tableauusers report an enthusiasm for the product as a result of being able to rapidly leverage insights fromTableau that have a significant impact on their business. Customers also report fasterthanaveragereport development times.
Tableau is an R&Ddriven company. It continues to invest in R&D at a higher pace (in terms ofpercentage of revenue — 29% in 2014) than most other BI vendors.
Cautions
Tableau has a limited product line focused on data discovery. Organizations like to buy and managefewer software assets and vendors. At some point many of the new generation of visualization anddiscovery tools that are bundled with other (competitor) applications may gain traction, particularlyas they roll out smart data discovery and selfservice data preparation differentiators.
ITdeveloped reports and dashboards, traditional styles of analysis, metadata management,development and integration, BI platform administration, embedded BI and collaboration are ratedas weaker capabilities of the platform, making it less well suited for centralized and embedded usecases. When Tableau customers have advanced data preparation, production reporting, advancedanalytics, distribution and alerting as requirements, they have to turn to thirdparty products andpartner capabilities. This may also limit its ability for largescale displacements, but not for largescale surrounding and marginalizing of IT and reportcentric incumbents.
Tableau is the competitive target of most other vendors in this market. It faces competitive threatsfrom every other vendor in the market that is also focused on delivering selfservice data discoveryand visualization capabilities, in an attempt to slow down Tableau's momentum.
Tableau offers limited advanced analytics capabilities. R integration has been recently added and is amajor improvement for users needing more statistical and advanced capabilities. Other vendors,such as SAS, SAP and Tibco, have more advanced native capabilities.
Tableau's enterprise features around data modeling and reuse, scalability and embeddability — thatenable companies to use the platform in a more pervasive and governed way — are evolving witheach release, but are still more limited than ITcentric systemofrecord platforms.
TargitTargit's Decision Suite offers a single, integrated and comprehensive BI and analytics platform. DecisionSuite focuses on meeting IT demand with respect to data management and data governance, whileattracting a wide range of end users with an emphasis on ease of use and a consistent user experience.
2/26/2015 Magic Quadrant for Business Intelligence and Analytics Platforms
http://www.gartner.com/technology/reprints.do?id=12AH4Q85&ct=150224&st=sb 21/38
Targit is headquartered in Denmark with offices in 12 countries, including the U.S., Brazil, Australia andIndia.
Targit is positioned as a Niche Player with its Decision Suite platform. Its primary market is the Microsoftcustomer base, with about 80% of its customers using Microsoft SQL server, ERP or CRM. Targit furtherstrengthened its position in this market segment by enhancing its integration with Microsoft SharePoint,AX and CRM and building verticalspecific solutions together with its partner base.
Strengths
Survey responses indicate that the main reasons for selecting Targit continue to be ease of use fordevelopers and end users, functionality as well as data access and integrations. This is in line withTargit's approach to deliver a single, integrated BI platform to meet IT as well as business users'needs.
Targit is predominately used as the centralized, largely ITcontrolled BI platform. The product israted highly for metadata management and traditional styles of analysis — it achieved the highestpercentage of users (84% of respondents) deploying the platform for this use case.
Aboveaverage scores for overall customer experience (see Note 3) and sales experience showimprovements from Targit in meeting its clients' expectations. Another positive sign is an overallproduct quality score that is above average, placing Targit in the top third in that respect. Inaddition, Targit customers rated it as above average regarding business benefits achieved.Consequently, in comparison with last year, the number of customers considering discontinuingdropped from about 15% to 10% (although this is still slightly above average).
Targit has continued to invest in verticalspecific BI applications, addressing 14 different verticals.This is largely done through partners, leveraging the Targit Framework to build data models, ETLand business content for verticalspecific BI and analytic applications. Together with Targit's deepintegration into Microsoft applications, this is a key differentiator for Targit. Approximately 60% of itscustomer base already uses these predefined verticalspecific solutions.
Targit continues to invest in the comprehensiveness of the Decision Suite platform. Targit nowsupports big data sources through native connections to the Microsoft Analytics Platform System. In2014, Targit's data discovery module was extended with the introduction of some businessuserdata mashup capabilities through the new Targit Data Service, which includes external data sourcessuch as Azure Data Market, OData and Quandl. A new Java thin client addresses the need forembedded BI, in particular for IoT scenarios such as deployments on Internetenabled devices likeSmart TVs, manufacturing equipment and machinery. Moreover, in contrast to last year's results,performance was only indicated to be a problem by about 5% of Targit's survey respondents. This isa sign that the newer versions of Decision Suite addressed previously known performance issues.
Cautions
Despite its investment in new capabilities, survey respondents continued to score Targit as belowaverage for overall market understanding. Although the product supports interactive analysis, and israted easy to use, customers deploy Targit in more narrow basic reporting and analysis scenarios,which has led to Targit being placed in the bottom quartile for breadth of use and below average incomplexity of analysis.
Targit's strong focus on Microsoft customers continues to be a key differentiator, but also a risk.Microsoft's continued investment in its BI portfolio, in particular with respect to selfservice BI anddata discovery capabilities such as Power BI, can threaten Targit's future opportunities to grow.
Targit's main customer base is within the SMB market. About 82% of survey respondents reportedTargit as their enterprise BI standard, and the deployment sizes remain very small. The averagedata volume accessed is less than 10% of the survey average of 14.2TB, and the average numberof users is, at 87, significantly lower than the overall average of 1,554.
Tibco SoftwareTibco's BI platform consists of two distinct products covering a wide range of analytic capabilities. Spotfireis a leading data discovery and interactive visualization product that offers business users and analyststhe ability to access, combine, prepare and visualize data in the form of highly interactive analyticdashboards. Spotfire also offers advanced analytic capabilities through integration with Tibco's EnterpriseRuntime for R (TERR), and is a leader in geospatial, location analytics, and realtime use cases. Tibco'ssecond product, Jaspersoft, was acquired in April 2014, to expand the platform's range of analyticcapabilities beyond data discovery to include key strengths of the Jaspersoft product — embeddedanalytics and production reporting.
Tibco has two products that are both highly rated by customers, but continued poor execution of Spotfirein a datadiscoveryled market is the primary driver of Tibco's downward move from the Leaders toVisionaries quadrant this year. While other data discovery leaders have enjoyed recent success andgrowth using a "land and expand" businessfocused sales model, Tibco has continued to try to sellSpotfire to IT using the same enterprise sales model it has for middleware, which has so far resulted in amissed opportunity to be a major player in the data discovery space.
Strengths
Tibco delivers capabilities that cover a wide range of analytic use cases through its two primaryproducts, Spotfire and Jaspersoft, as indicated by its positioning in the top quartile of vendors forcomplexity of analysis performed by users — which assesses how the platform is used by surveyreference organizations with higher weight assigned to interactive and advanced analysis and lowerweight assigned to static or parameterized reporting (see Note 3). This was also a factor drivingcustomer buying decisions, with 16% of references reporting that platform functionality was the topreason for buying Tibco.
Tibco earned one of the highest aggregate product scores, largely because the assessment crossedboth Spotfire and Jaspersoft — which combined have strong capabilities for both centralized anddecentralized use cases, from ITcentric reporting and embedded BI through data discovery,although the platforms are not yet integrated.
Tibco, with Jaspersoft, is used to deliver analytic content to the highest percentage of external usersof all vendors included in this Magic Quadrant, and has the sixthhighest percentage of referencesreporting that they use the platform in support of an OEM/embedded use case. This strength is alsoreflected in the fact that Tibco ranks among the highest in average deployment size, at 7,852 users(well above the overall average of 1,554).
2/26/2015 Magic Quadrant for Business Intelligence and Analytics Platforms
http://www.gartner.com/technology/reprints.do?id=12AH4Q85&ct=150224&st=sb 22/38
Over 25% of customers report that combined ease of use for developers and end users is a primaryreason for buying Tibco products. Once implemented, customers report that combined ease of usefor Tibco is slightly above the overall average for this Magic Quadrant, driven largely by favorablescores for Spotfire. Spotfire scores in the top quartile for ease of use, while Jaspersoft scores in thebottom quartile.
Cautions
Tibco is composed of two separate product offerings that support very different users and use caseswith little integration, but the task of bringing Spotfire and Jaspersoft together remains a workinprogress that will take time to fully materialize. While the overall portfolio does cover a wide range ofanalytic capabilities, it is not clear how or when the product road maps will converge — which maycause confusion for existing customers and potential buyers. Metadata management and traditionalstyles of analysis were rated as weaker capabilities across the platforms.
The future of Tibco itself is uncertain, following the acquisition of the company by Vista EquityPartners (which closed in December 2014). In the near term, Tibco will operate as a privately heldsingle entity, as it did when it was publicly traded, but the longerterm intentions of Vista are notyet clear. The ingredients for a leading BI and analytics platform are present with Tibco's manystrategic acquisitions; however, Vista will need to implement major changes to address the salesmodel and execution issues, which have plagued Tibco historically, in order to regain traction andonce again be recognized as a market leader.
Tibco has struggled with the market positioning and sales execution of Spotfire since it was acquired,which is reflected in Tibco's sixthfrombottom ranking (across the vendors in this Magic Quadrant)in sales experience, and also a sharp decline in buyer interest as indicated by the lack of inquiriesand contract reviews for both Spotfire and Jaspersoft.
Customer support and user enablement were both rated poorly by Tibco's references, which rankedthem below the average overall and for the individual components within each category. Userenablement is of particular concern, being ranked fourth from the bottom; this is in stark contrastto its data discovery competitors, Tableau and Qlik, which were both ranked in the top five in thiscategory.
YellowfinYellowfin delivers a set of innovative capabilities in collaboration features, storytelling and mobile, and atightly integrated set of tools — from data integration to dashboards. Founded in Australia in 2003,Yellowfin is a BI vendor that continues to invest in a userfriendly interface to empower business users.
Yellowfin is positioned in the Niche Players Quadrant of the Magic Quadrant. Collaboration and social BI,mobile and location intelligence have been successful ways to differentiate its platform from competitors.
Strengths
Customers report the thirdhighest percentage of cloud deployments in a public cloud (after the twocloud specialists in this Magic Quadrant — Birst and GoodData) for this vendor, and the highest fordeployment on a private cloud. Organizations planning to adopt a cloudbased BI strategy shouldconsider Yellowfin as an option.
Embedded BI represents an important share of its revenue and customer base, with the productbeing incorporated by partners as part of their own applications. A tightly integrated platform andextensive APIs support this line of business for the vendor. As a result, Yellowfin receives high scoresfor the OEM use case. Collaboration and mobile capabilities are rated as particular platformstrengths.
The average report development time is 3.2 days, faster than the overall average of 4.0 days for thevendors in this Magic Quadrant — a positive outcome for a vendor trying to empower businessusers. This is consistent with its aboveaverage ratings for ease of use.
Yellowfin has the highest number of business users for each IT content author — a ratio of 44:1,while the average in the Magic Quadrant is 15:1. This strong result represents reduced operationcosts for customers and should be factoredin when comparing the total cost of ownership ofdifferent BI and analytics platforms. This result also confirms that the product is used extensively forcentralized deployments that serve report and dashboard consumers.
Cautions
Customers report that problems with product quality is an ongoing concern. This is even morerelevant knowing that Yellowfin often deals with business units and SMBs that may lack the ITresources necessary to solve software problems.
Yellowfin is pursuing a product strategy of empowering business users through easytouse tools.This market positioning will be enhanced, going forward, with the release of data discoverycapabilities to complement the existing dashboard's capabilities. This gap in the platform impactsnegatively on the scores for decentralized use of BI, compared with the results of other vendors.
Customer reference scores put Yellowfin in the bottom five vendors in this Magic Quadrant for theaverage number of users (at 323) and the bottom three for average data volumes (with 652GB),per customer deployment. It also earned performance scores that are near the bottom. Whencombined, these three metrics raise concerns about the platform's scalability. Prospective customersshould run proofofconcept processes to validate whether Yellowfin can deliver in line with theirrequirements. It should be mentioned though, that the company is able to present references ofvery large deployments — showing us that under the right infrastructure and workload scenarios,the solution can scale adequately,
Yellowfin still has a limited geographic presence compared with other established vendors and needsto expand if it aspires to move beyond the Niche Players quadrant. To address this challenge, thecompany continues to invest to grow its direct presence and partner network — it currently hasmore than 250 partners worldwide. Moreover, it has now direct or indirect representation is Asia,Europe, the U.S., Latin America and Africa.
Vendors Added and DroppedWe review and adjust our inclusion criteria for Magic Quadrants and MarketScopes as markets change. Asa result of these adjustments, the mix of vendors in any Magic Quadrant or MarketScope may changeover time. A vendor's appearance in a Magic Quadrant or MarketScope one year and not the next does
2/26/2015 Magic Quadrant for Business Intelligence and Analytics Platforms
http://www.gartner.com/technology/reprints.do?id=12AH4Q85&ct=150224&st=sb 23/38
not necessarily indicate that we have changed our opinion of that vendor. It may be a reflection of achange in the market and, therefore, changed evaluation criteria, or of a change of focus by that vendor.
AddedDatawatch was added to the Magic Quadrant this year. It met all of the inclusion criteria and wasranked in the top 24 of assessed vendors because of its differentiation in supporting emergingrequirements for data discovery on streaming and multistructured data.
DroppedArcplan, Bitam and Infor were excluded from the Magic Quadrant this year because they did notmeet all of the inclusion requirements. Exclusion this year does not mean they will not beconsidered in future years.
Jaspersoft was acquired by Tibco. The position of the Tibco dot on this year's Magic Quadrant reflectsan assessment of both Spotfire and Jaspersoft.
Other Vendors to Consider That Did Not Qualify for InclusionA number of interesting vendors participated in the Magic Quadrant process (with most identifyingreference customers and providing information), but did not meet the criteria for inclusion in the MagicQuadrant itself. These vendors fall into the following categories:
Realtime process and operations intelligence
Hadoopbased data discovery
Collaborative decision making, collaborative BI and collaborative performance management
Integrated BI and corporate performance management
Cloud BI
New approaches to big data
Smart data discovery and naturallanguage generation
Searchbased data discovery
Link/graphbased data discovery
Data discovery
Selfservice data preparation
Other BI platform vendors worth considering
RealTime Process and Operations IntelligenceAnalytics for data of different velocities (realtime and batch) are an increasingly important driver of valuefrom big data, particularly as demand for analytics applications that require combining streaming datawith historical data — for a range of highvalue applications (including operational intelligence,cybersecurity analytics, process intelligence and Internet of Things applications, such as preventivemaintenance and asset optimization) — becomes more mainstream. Kofax and Splunk (mentioned here)as well as Datawatch and Tibco (Spotfire) support these emerging requirements.
Kofax (Altosoft)
Kofax acquired Altosoft in February 2013 to add process intelligence and embedded analytics to itsapplication stack. While Altosoft's code is packaged as Kofax Analytics, the vendor continues to operate asa wholly owned subsidiary, directly selling its Insight 5.0 platform. Insight provides a single integratedplatform from data integration, to inmemory data storage, to dashboard delivery with no coding orscripting required. Unlike most BI tools, Altosoft Insight is processaware. Insight provides anunderstanding of an entire business process to pinpoint process steps in which waste, loss andinefficiencies are taking place. This includes processes that span multiple systems of record. No businessprocess management, workflow or process modeling tools are required. During the past year, Kofax grewfrom 500 to 700 customer organizations with strong practices in the healthcare and financial servicesverticals. In Insight 5.0 (its latest release) Kofax has added continuous simulation predictive analytics forprocess intelligence and has rewritten the platform to entirely support HTML5, eliminating previousMicrosoft Silverlight dependencies. Another innovation is Kofax's patentpending MapAggregate distributedinmemory architecture that overcomes the problem of being limited to the RAM of a single physicalserver. Now, Altosoft Insight can distribute inmemory data across multiple servers.
Splunk
Splunk has a unique set of capabilities and differentiators compared with other BI/analytics platformvendors in the market. The focus for Splunk is the management and realtime (as well as historical)analysis associated with highvolume, highvelocity and highly variable data that are typical of machinedatasets/streams. It has the ability to collect, index, model, store and explore/analyze/visualize data frommultiple machinegenerated data sources as well as network data. Splunk enables correlation acrossmultiple data sources including mobile data, supports schemas on the fly and has universal dataforwarding capabilities. There's no backend relational database management system and no need to filterthen forward data. Splunk also supports the ability to perform data mashups across structured data inrelational databases and machinegenerated data. Support for an Open Database Connectivity (ODBC)interface enables delivery of machine data from Splunk to visualization tools.
Typical Splunk customers span multiple segments, such as healthcare, finance, government, onlinegaming and media, and use its products for a variety of use cases: security analytics, IT operationsanalytics, IoT analytics along with business analytics. Splunk has a unique pricing model, in the businessanalytics market anyhow, based on daily index volume. Splunk does not price bynodes/CPUs/users/servers; these elements are unlimited in the Splunk pricing model. As a part of theupcoming Hunk 6.2 release, Splunk's analytics product for data stored in Hadoop or NoSQL data stores,customers can purchase Hunk on an hourly consumption basis (running in AWS). Because of its realtimecapabilities and ability to integrate a unique class of data with structured data sources, Splunk is oftenalready deployed in an organization for operational use cases and used alongside to complement, ratherthan replace, existing BI and analytics platform investments.
HadoopBased Data DiscoveryThe everincreasing amount and diversity of data has given rise to the need for and use of NoSQL
2/26/2015 Magic Quadrant for Business Intelligence and Analytics Platforms
http://www.gartner.com/technology/reprints.do?id=12AH4Q85&ct=150224&st=sb 24/38
databases, such as Hadoop (increasingly leveraging Spark) to store, manage and query large amounts ofdata economically. However, the rarity and the specialized nature of the skills needed to manage Hadoopclusters, generate MapReduce queries and find insights in these new sources of data have inhibitedmainstream adoption, particularly among business users. Hadoopbased data discovery enables businessusers to explore and find insights across diverse data (such as clickstreams, social, sensor and transactiondata) that is stored, managed and processed in Hadoop, increasingly with Spark. It enables users todirectly query the Hadoop Distributed File System (HDFS) without the extensive modeling required bytraditional SQLbased approaches, the specialized skills to generate custom MapReduce, Hive or Pigqueries, or the performance penalty and lack of interactivity of querying Hadoop through Hive. Platfora,Datameer, FICO (which acquired Karmasphere) L3 and the Eligotech are Hadoopcentric data discoveryvendors whose tools are designed to address this challenge. These companies are banking on Hadoop withSpark increasingly supplanting the data warehouse as the primary data management repository andplatform within enterprises. We believe that, for the foreseeable future, Hadoop and other NoSQL datastores are more likely to complement the systemsofrecord data warehouse. A range of vendors areemerging to address requirements for data exploration on Hadoop. These include database and datawarehouse suppliers (such as IBM, Microsoft and Oracle, which just released is Oracle Big Data Discoveryplatform); BI companies accessing Hadoop through Hive and HBase or though native integration withHDFS (like Pentaho and MicroStrategy); and Hadoop distribution vendors themselves (like ClouderaImpala) that are attempting to make SQL more accessible and "performant" against Hadoop. Emergingstandards and vendor support for Spark are also enhancing platform capabilities for interactiveexploration.
Datameer
Datameer provides a big data analytics platform. Built to work natively within Hadoop, Datameer providesintegration, data preparation, analytics and visualization capabilities with the promise of no coding and afamiliar spreadsheet interface. Datameer optimizes analytical computations based on the analytics tasks,available system resources, and attributes of the datasets. The company provides an integratedenvironment designed to work with a Hadoop repository (customers can pick their own distribution);pointandclick data integration; a spreadsheet interface with prebuilt functions for data cleansing,transformation and analysis; a visual draganddrop environment to build and deliver dashboards andinfographics; prebuilt applications capable of performing automated analytic processes (such as building acustomer segmentation or finding correlated products); and draganddrop data mining algorithms. Byusing a native Hadoop engine instead of translating SQL through Hive, the product is able to handle largedata volumes and use unstructured and semistructured information from data sources such asmainframes, databases, file systems, cloud services, social media and log files. Although relatively young,the company has strong reference customers and has built an interesting network of technologypartners. With Datameer 5.0, the vendor introduces a more intelligent execution engine that leveragesHadoop's Yarn and inmemory processing to dynamically select the optimal compute framework for eachstep in the analytic process.
Eligotech
Eligotech released its Hadoopbased data integration and searchbased data discovery platform in 2Q13.Its core product, Harpoon, hides the complexity of Hadoop by enabling users to search, navigate andanalyze data directly via a Googlelike interface. Data can be imported from any relational database andfrom data sources of any structure. While the platform offers a set of visualizations, the extensibleplatform is built on top of Hadoop APIs and provides a full set of REST APIs to support integration withexternal applications, such as the workflow management systems and BI tools on which organizationsmay have standardized. Although relatively new code base, Eligotech produced two significant releasesthis year: Harpoon 2.5 (released in July 2014) bolstered Eligotech' security by enabling betterauthorization on data and operations; and Harpoon 2.6 (released in October 2014) provides a visual datalineage capability, job scheduler, onchart drill down, and ensures that the underlying HDFS permissionswill be used in all Harpoon sessions.
FICO
FICO is a wellknown provider of advanced analytics software and services. It acquired Karmasphere inApril 2014, and is bringing it to market as FICO Big Data Analyzer, a product that is part of its DecisionManagement Suite. This native Hadoop application for analysts and business users, provides access to bigdata and enables data transformation, exploration, analysis and discovery of insights. The inclusion ofdata management, visualization capabilities and advanced analytics features creates an integratedanalytics environment that will appeal to regular business users looking for selfservice capabilities inanalytics, but may also be used by data scientists for firstlevel insight generation. The outputs of the toolcan also be embedded in business applications through the capabilities of FICO Decision ManagementSuite. Use cases for this technology range from credit scoring, banking originations, new customeronboarding and fraud detection, among others. In its first releases, Big Data Analyzer is helping FICOexpand the types of decision management solution to include a broader set of use cases. Over time, itplans to help extend access, transformation, analysis and visualization of big data sources to a broaderrange of business users — beyond FICO's traditional customer base of statisticians and highend datascientists.
L3
L3 acquired Data Tactics in 2014. Its Big Data Ecosystem (BDE) is a cloud, Hadoopbased data discoveryplatform that enables users to quickly and efficiently fuse vast amounts of data from disparate structured,unstructured and semistructured sources. Its businessanalyst and datascientistoriented user interfaceallows users to conduct geospatial analytics, interactive visualization and data exploration, and predictiveand prescriptive analysis leveraging its R integration. BDE currently provides federal governmentcustomers, including intelligence agencies, with data fusion and intelligence in a secure platform featuringNational Security Agency (NSA)grade security. It also has customers in the energy and oil, financialservices and telecom industries.
Platfora
Platfora, is a wellfunded startup that made its big data analytics platform generally available in March2013. The platform enables business analysts to conduct multistructured data exploration on very largedatasets in Hadoop. Platfora directly accesses the Hadoop file system without needing specialized skills towrite custom MapReduce, Hive, Pig or SQL queries, and then exposes the raw data in memory "lenses" sothat users can identify and interactively explore the data in their Hadoop clusters. Platfora leverages bothMapReduce and Spark to execute processing of raw data in Hadoop and its own columnar data store andengine to execute realtime queries inmemory. The ability to access nonHadoop data sources usingconnectors is new in 2014. Platfora also provides business user tools for visualizing and interacting with
2/26/2015 Magic Quadrant for Business Intelligence and Analytics Platforms
http://www.gartner.com/technology/reprints.do?id=12AH4Q85&ct=150224&st=sb 25/38
data in dashboards and in autorecommended bestfit interactive charts for data discovery with a focus oncustomer analytics, security analytics and the IoT use cases. Platfora continues to extend the platformwith additional embedded advanced analytics capabilities (such as advanced segment, behavioral,geospatial and graph analysis), including enabling users to identify entities of interest and theirrelationships (such as which customers bought product X and then product Y) within a certain timeperiod, and then to iteratively segment them in order to find further patterns in their behavior. Platfora isenhancing its native onHadoop selfservice data discovery and smart data preparation to reduce the timeto insight for the analyst and data scientist accessing data in Hadoop.
Collaborative Decision Making, Collaborative BI and Collaborative PerformanceManagementCollaborative decision making and collaborative and social BI offers potential to finally close the gapbetween BI and decision making by facilitating intelligent collaboration, sharing and capture of theinteractive decision process to enable more transparent, highquality decisions. Many BI vendors in thisMagic Quadrant (such as Panorama, Qlik, Tableau and Yellowfin) include collaboration and storytelling askey features of their products. Decisyon offers a collaborative decisionmaking platform that was builtfrom the ground up, along with integrated BI and performance management. As a result, it is taking aninnovative approach.
Decisyon
With recent funding and an expanding team of seasoned BI executives and professionals, Decisyon isexpanding beyond its traditional European customer base, with a focus on North America. Its coreproduct, Decisyon 360 unifies collaboration, social, analytics, planning and execution in a uniquecollaborative and social BI and analytics platform. Underpinning its differentiated approach is a smartsocial and data environment known as the "social workspace," where users collaborate on data, tasks,decisions and analytic content, with native and integrated mobile workflow, planning and execution aspart of the BI and analytics and performance management process. It also features embedded dataintegration (supporting structured, unstructured and streaming data). Decisyon offers its Decisyon 360platform for the development of custom collaborative BI and performance management applications. Italso sells packaged solutions for operational BI and process intelligence, planning and intelligentmanufacturing operations, and supply chain. Its social CRM product provides social media intelligence andis extensible into enterprise social customer care and marketing. It is also wellsuited for IoT applications.Partners have also built solutions for the banking and financial services, telecom, life sciences,pharmaceutical, retail and automotive industries using the platform and it is expanding its relationshipswith system integrators. Decisyon's multitenant architecture can be deployed on customers' premises orin the cloud — as a complement to enterprise BI and performance management platforms, whenanalytics and performance managementcentric collaboration and social capabilities are required; or as acomplete endtoend solution for enterprise collaborative BI and performance management.
Integrated BI and Corporate Performance ManagementAdaptive Insights
Adaptive Insights offers a 100% cloudbased platform combining BI and CPM capabilities through itscomprehensive Adaptive Suite platform consisting of five key elements: planning, discovery,consolidation, reporting and integration. Adaptive Insights targets the suite at business users and hasleveraged a "land and expand" approach to sales execution that has grown its customer base by 32%since 2013 (to greater than 2,500 in 2014). In October 2014, Adaptive Insights announced the additionof Adaptive Revenue which extends the capabilities of the suite to include revenue planning and salesanalytics. The addition of Adaptive Revenue, with its integration with Salesforce and ERP systems,enhances the ability of the suite to deliver a 360degree view of business performance that enablescustomers to manage the entire revenue life cycle.
arcplan
arcplan's unified BI and performance management platform incorporates a complete set of BI platformcapabilities, along with budgeting, planning and forecasting. arcplan has two major support centers in theU.S. and Germany. The arcplan 8 platform is composed of three components: arcplan Enterprise forreporting, dashboards and scorecards; arcplan Edge for budgeting, planning and forecasting; and arcplanEngage for ad hoc analysis and interactive exploration — which includes arcplan Excel Analytics. With theintroduction of HTML5 to the platform, arcplan applications are available on mobile devices too. arcplanstarted to offer support for R in 2014, to address the growing demand for embedded advanced analytics.It is expanding beyond its deep heritage as a BI provider within the SAP installed base by extending itsnative support to other data sources. The platform provides native APIs for SAP BW and SAP Hana, as wellas IBM Cognos TM1 and Oracle Essbase, to exploit the information in megavendors' systems (with thepotential for a lower total cost of ownership). Positioned as a complementary frontend for informationdelivery, arcplan's offering also supports systems such as Microsoft SQL Server and Microsoft SQL ServerAnalysis Services, plus those from Teradata and Kognitio, among others. The company has extended itssupport for data sources during 2014 by adding Salesforce (for CRM) and LucaNet.
Bitam
Bitam offers an integrated enterprise performance management platform that spans traditional BIcapabilities (Artus), financial planning (Ektos), and strategic planning (Stratego) in a unified solution suite.Customers choose Bitam because of its integrated BI and performance management capabilities and itsease of use. Bitam's cloud offering, KPI Online represents the vast majority of new business opportunitiesfor Bitam versus its onpremises offering. Bitam continues to invest in cloud computing initiatives,including the creation of prebuilt verticalmarket solutions that appeal primarily to the small or midsizebusiness (SMB) market, which is most receptive to cloud deployment options. Bitam's customer base isheavily concentrated in Latin America, though expansion into Western Europe (particularly Spain), NorthAmerica and Asia continued in 2014. However, the vendor is not well known outside Mexico and SouthAmerica, where most of its customers are concentrated.
Jedox
Jedox offers an integrated platform (Jedox 5.1) for reporting, planning, and analysis. With offices inGermany (Freiburg, Frankfurt and Düsseldorf), France (Paris) and the U.S. (Boston), Jedox is now runningin over 1,200 organizations and used by over 100,000 users. The Jedox platform is based on an inmemory OLAP database for reporting and planning. Data is loaded into the OLAP engine fromtransactional systems using the Jedox integration offering. The platform is architected to support threefront ends: Microsoft Excel, Web and Mobile. The Microsoft Excel addin front end is the most widely usedbut all three support writeback. Only 15% of Jedox customer references mention poor performance as
2/26/2015 Magic Quadrant for Business Intelligence and Analytics Platforms
http://www.gartner.com/technology/reprints.do?id=12AH4Q85&ct=150224&st=sb 26/38
an issue. To bolster performance with high volumes of data Jedox supports Nvidia Graphic Processing Unit(GPU) technology for ultrafast aggregations. In addition to the blending of planning and analysis with truewriteback functionality and the inmemory engine, another differentiator of the Jedox platform is itsintegration with Microsoft Office — in particular its ability to convert Microsoft Excel workbooks intomultidimensional OLAP data cubes with reusable ETL processes (datadriven modelling). Overall, Jedox isused fairly narrowly within organizations against small data volumes, which suggests that it is usuallydeployed departmentally in larger organizations. To spark greater adoption and user growth Jedoxreleased a managed cloud service in July 2014.
Cloud BICloud BI is an emerging trend that will likely be accelerated by the entrance of Salesforce into the marketand greater investment by traditional onpremises vendors. Vendors such as Chartio, DataHero and thewellfunded startup Domo also offer solutions to address this growing requirement.
Chartio
Startup Chartio offers a cloudbased solution targeted at business users. It tries to address the need foreasytouse tools capable of blending data from multiple data sources and producing dashboards withoutIT support. The range of data sources includes options such as: Amazon Redshift, Google BigQuery andWindows Azure Cloud, for cloudbased data; as well as databases such as Microsoft SQL, Oracle, MySQLand PostgreSQL, for onpremises data. It also offers connectivity to data sources such as Google Analytics,Salesforce, Stripe, Twilio and Zendesk. The software hides the complexity of integration with datasources, creating what the company calls a metadata warehouse and allowing the use of a simple draganddrop interface to produce dashboards. Although growing fast, Chartio is still a small vendor withlimited geographic reach, but the cloud nature of its offering may help overcome this limitation andexpand faster than traditional onpremises vendors.
DataHero
DataHero launched its selfservice cloudbased analytics platform for cloudbased data sources in 2013. Itis designed specifically to empower business users to be able to import and combine data and createcharts without any prior technical background. The platform's builtin Data Decoder automatically detectsthe data structure and suggests optimal visualizations for the user based on the data. DataHero hasprebuilt connectors to many enterprise cloud services and technology that automatically normalizes thedata across those services, eliminating the need for custom ETL. Using DataHero, users can createvisualizations, pin them into dashboards and do advanced analytics (initially cohort analysis) using dragand drop. Charts include icons that indicate the lineage of each chart. DataHero is mostly used bydepartments and SMBs, with an average deployment size of 10 users and largest deployment size ofaround 100 users.
Domo
Guided by a group of seasoned executives mostly from Omniture, Domo is using its substantial funding($250 million to date) to build a cloud BI platform with a focus on dashboards targeted at making it easierfor business users to find insights in their data and share and collaborate on findings, particularly onmobile devices. The company primarily sells to LOBs, where it offers LOBspecific packaged dashboardcomponents and applications. The platform features pointandclick data mashup capabilities andconnectors for more than 100 data sources, with native integration to a broad set of applications and toSalesforce, which is one of its most popular connectors. The company has been very secretive, with initialreleases of the product to date requiring customers to sign nondisclosure agreements to view and try theproduct. This should change in April 2015 when the company has its official public launch. Domo islaunching its product into an increasingly crowded cloud BI market that now includes Salesforce, earlystartups and now onpremises vendors that are investing heavily in the cloud. Selling into the Salesforceinstalled base has been a strong opportunity for this company.
Salesforce
Salesforce entered the BI platform market in October 2014 with its launch of Salesforce Analytics Cloud(Wave). The introduction follows Salesforce's acquisition of EdgeSpring, two years of development, andseveral earlier analytics initiatives. The platform offers an alternative to traditional BI platforms forcustomers willing to consider cloud deployment. It is most likely to appeal to customers who have most oftheir data in the cloud and want to augment it with onpremises data, including unstructured andsemistructured data such as log data for customercentric applications. The new platform's search indexarchitecture enables customers to integrate Salesforce with nonSalesfore cloud and onpremises datafrom multistructured sources, although customers must still load data into the cloud rather thanaccessing it in place (which may be an inhibitor for enterprise buyers). Some of the cloud BI vendors —Birst and GoodData in particular — have a more robust and mature set of product capabilities thanSalesforce's initial offering. The first release lacks certain features of data discovery and some traditionalBI platforms — such as advanced data exploration for the business analyst, and geospatial and selfservice data preparation, among others. Wave does, however, offer standard pointandclick interactivevisualizations, dashboards and analysis that form the basis of packaged, closedloop, frontoffice analyticapplications. The platform is natively mobile, with an emphasis on smartphones (rather than tablets) andcollaboration, which should appeal to a frontoffice LOB buyer. Salesforce Analytics Cloud has a robustpartner ecosystem, that includes many ETL, predictive analytics vendors, and system integrators, and isalso natively integrated with Salesforce security, metadata and collaboration, which should appeal tocustomers in the Salesforce installed base.
New Approaches to Large Data VolumesHandling an exponentially growing volume of data is not a new problem for BI professionals, but it hasbecome a significant hindrance to deriving insights for all relevant data assets as the type and number ofsources available for analysis grow exponentially. Vendors such as Sisense are trying to find new ways toaddress this challenge.
Sisense
Sisense offers an integrated, performance optimized endtoend platform that empowers business usersto join and analyze large datasets and share insights via interactive dashboards through a draganddropbrowserbased interface. Sisense uses its InChip and ElastiCube technologies to deliver scalability andperformance that exceeds inmemory technology capabilities. Sisense has gained traction in the marketthrough rapid expansion both in terms of new clients and increased utilization in existing accounts. Thishas resulted in the tripling of its revenue for the fourth consecutive year in 2014. Version 5, released inApril 2014, accelerated adoption within the Sisense customer base and generated significant net new
2/26/2015 Magic Quadrant for Business Intelligence and Analytics Platforms
http://www.gartner.com/technology/reprints.do?id=12AH4Q85&ct=150224&st=sb 27/38
business with the introduction of inbrowser authoring, a new user experience, realtime collaborationand improved mobile capabilities. Sisense released version 5.5 in August 2014, to bolster the platform'senterprise features around security, load balancing and high availability, to satisfy IT requirements andpromote more widespread adoption and acceptance as an enterprise standard BI platform. In order toaccommodate the rapid growth it has experienced in recent years, Sisense moved its North Americanheadquarters to a new Wall Street location and doubled the size of its R&D center in Israel. Sisensereceived $30 million in Series C venture funding during June 2014. This should help the company buildon its success, and expand its awareness and presence in the BI and analytics market.
Smart Data Discovery and NaturalLanguage GenerationSmart data discovery facilitates the discovery of hidden patterns in large, complex datasets, withoutbuilding models or writing algorithms or queries and helps users focus on what insights are mostimportant. It goes beyond data discovery because lessskilled data scientists (citizen data scientists) canbenefit from advanced analytics (to highlight and visualize important findings, correlations, clusters, linksor trends in data that are relevant to the user), with user interaction and exploration via interactivevisualizations, search and naturallanguage query technologies. Naturallanguage generation is also beingused by Automated Insights, BeyondCore and DataRPM to assist business users in focusing on relevantinsights and interpreting the results for them in their context. The combination of smart data discoveryand natural language query and generation is likely to have a significant impact on the next generationBI user experience and the market in general.
Automated Insights
Automated Insights' product, Wordsmith, is a patented naturallanguage generation engine fortransforming structured data into a narrative with actionable insights. Automated Insights believes thatdata visualizations don't tell the full story. Wordsmith dynamically identifies the most relevant insights,patterns, context and trends in large multistructured datasets, prioritizes them based on value, anddelivers a personalized narrative for each user that can be used in combination with visualizations. Style,format and even tone are configurable. Instead of creating one story for a million readers, AutomatedInsights can create 1,000,000 stories, each customized for an audience of one. Automated Insights has anumber of highprofile clients including Comcast, Samsung, and Edmunds.com. Wordsmith publishesmillions of fantasy football stories each week of the Yahoo Fantasy Football season. The Associated Press,also an investor in the company, has automated more than 4,000 earnings reports using the engine.Within a BI context, companies use Wordsmith's custom narratives to highlight the most importantinsights for each user, who can then access the underlying reports for more detail. Customers report thatthe engine makes users more efficient at finding relevant insights, as an alternative to manual analysisand as a complement to data discovery. The company reports that most of its BI customers use theproduct to create narratives on top of analysis done in either Tableau or SAS. Automated Insights is acloudbased solution hosted in AWS, requiring some upfront configuration. The company has a team ofdata scientists that assists users with the initial tuning.
BeyondCore
BeyondCore offers highly innovative and differentiated analytics software that combines smart patterndiscovery, automated insight detection and prescriptive recommendations to business users and analysts.Since it entered the market with its first product release in 2013, following eight years of R&D,BeyondCore has sought to address the shortage of data scientists in organizations — by automating theupfront analysis required to find meaning and relevance in data and allowing business users to focus onthe most appropriate and actionable information. The software analyzes every intersection of dataautomatically, grays out statistically insignificant findings displayed in interactive visualizations and usesan animated narrative to report key findings and insights to the business user. This concept of being the"zeroth step" in analysis is a key differentiator and offers unique product positioning for BeyondCore as itseeks to build awareness and mainstream adoption in a very crowded BI and analytics landscape.Throughout 2014, BeyondCore has aggressively developed and released several product iterations,further demonstrating its understanding of the BI and analytics market and its trajectory. Most significantof these product enhancements is the addition of prescriptive recommendations based on the analysis ofdatasets optimizing for the outcome that a business user wants to improve. The innovative way in whichthe product translates analysis and insight into recommendations for action — through identification ofopportunities for new revenue generation, cost reduction and risk mitigation — to deliver clear andmeasurable value to customers, positions BeyondCore as an extremely disruptive force in the BI andanalytics market.
DataRPM
DataRPM's Smart Machine Insights data discovery platform automatically models and performs statisticalanalysis on data in its Hadoop infrastructure. The platform's machinelearning algorithms automaticallyfind and deliver the most important findings and insights to users in optimized visualizations andnarratives. This reduces the time, effort and skill needed for manual data discovery and accelerates timeto actionable insight for a broader range of users. The system also allows business users to initiate queriesand explore results using natural language. The Instant Answers computational search enginesignificantly reduces the need for traditional data modeling by automatically discovering and inferringsemantics and entity relationships in diverse data. Any user can use Googlelike naturallanguage queryto discover and analyze the indexed data visually. Results can be shared with other users or embedded inother business applications and websites. DataRPM is aggressively updating its platform to establish anearly presence in the smart data discovery space. The platform can be deployed onpremises or in thecloud.
SearchBased Data DiscoveryNaturallanguage query technology will become an increasingly important means of delivering analytics tomainstream business users. A search index architecture is also an alternative approach to ingesting andmodeling data for analysis, that reduces the time and complexity of traditional approaches. MicrosoftPower BI (Q&A) and IBM Watson Analytics offer natural language query capabilities while new vendorsDataRPM (featured in the smart data discovery section), Incorta and ThoughtSpot also hope to reducetime to deployment and expand user access to analysis.
Incorta
Incorta (founded by Oracle BI and Endeca product development executives), offers a searchbased datadiscovery platform that enables business users to create analytic content from data access, mashup andaggregation to dashboard development and interactivity from an iPad or from a Webbased (HTML5) userinterface. The platform supports rapid time to deployment by removing the time and complexity of
2/26/2015 Magic Quadrant for Business Intelligence and Analytics Platforms
http://www.gartner.com/technology/reprints.do?id=12AH4Q85&ct=150224&st=sb 28/38
traditional data integration and modeling. Its search index architecture and data ingestion technologyrapidly loads large and diverse datasets by removing the need for complex ETL and data warehouseindexes, aggregate tables and star schemas — with calculations running, instead, directly againstnormalized data. Users build queries and refine analysis using search. Users can also upload MicrosoftExcel and CSV files from email as data sources in the Incorta iPad application. The search architecturealso supports the combination of structured, unstructured and semistructured data for analysis. Incortaemphasizes its enterprise features around security subsetting, scalability (customers claim they can runcalculations on millions of records with subsecond performance), and governance (every action by a useris recorded). The platform also supports embeddability with a rich set of APIs. Incorta can be deployed onpremises or in the cloud running on AWS. The company has a small number of early customers thatreport positive results using the platform as an alternative to reduce time to insight to traditional BIplatforms.
ThoughtSpot
ThoughtSpot (founded by a team of executives and engineers from Google, Nutanix, Oracle and Yahoo)introduced its searchbased BI onpremises appliance product in October 2014, to make it easy forbusiness users (not just analysts) to build reports using a Googlelike search experience. In the initialversion, previously modeled data is loaded and indexed in ThoughtSpot's search engine, which it calls"relational search" for access by business users. It offers users consumer experiences like pinboards(think Pinterest) to create stories with data. It also gives the user a summary of data lineage informationwithin the business user views, including information about data sources, calculations and filters thatmake up the views. Customers often use the product for businessuserdriven reporting as a complementto more analystoriented data discovery tools such as Tableau. The road map includes enhancements fordata access and integration as well as to the visualization capabilities.
Link/GraphBased Data DiscoveryLarge datasets have structure and relationships between entities of interest (for example, people, places,things, interactions) in the data that can be inferred algorithmically. All data within and often external toan enterprise is related in some way, but these relationships are often obscured when data is separated indifferent data repositories. Vendors that visually represent the links or relationships in highly dense data(link or graphbased data discovery) are addressing this challenge by providing new ways for users toeasily find hidden and relevant patterns in data. Centrifuge Systems, Palantir Technologies andSynerScope are three such vendors.
Centrifuge Systems
Centrifuge provides a linkbased data discovery platform that is particularly useful for finding hiddenpatterns in large, multistructured, complex and often seemingly unrelated datasets. Its fully browserbased platform has the ability to ingest and unify structured and unstructured data (such as Hadoop data,documents, Webbased data and machine data), perform interactive link analysis and visualization (pathidentification, linkups, bundling, animated temporal views and geospatial views), as well as capabilitiesthat let users share and publish findings. Centrifuge grew out of the intelligence and defensecommunities and has expanded into federal civilian agencies and law enforcement. It is also building acommercial customer base in the financial services, life sciences (pharmaceutical), healthcare,cybersecurity and supply chain sectors. It often competes with Palantir Technologies and IBM i2, and isplanning to double in size during the next year. Partners include Splunk, YarcData, MarkLogic and anumber of major Hadoop distributions.
Palantir Technologies
Palantir offers a nextgeneration analytical platform that blends machine learning with human intuition,enabling end users to intuitively ask questions of the data using their own mental model. While it isevolving its frontend presentation skills, most of the Palantir code base is focused on solving backendproblems — integrating massive amounts of structured and unstructured data. Palantir's architectureuses several modules that complement each other. For example, Raptor is used to store hundreds ofmillions to billions of records of structured and unstructured data such as large repositories of articles andreports. Phoenix stores billions to trillions of records of mostly structured data such as network logs.Hercules pushes Palantir more in the direction of smart data discovery, using machine learning toinvestigate vast amounts of data to find unknown anomalies and associations within that data. Indeed,the variety of technology used by Palantir makes it possible to classify the vendor in one of a number ofcategories including Graph, Search, Hadoop, and Smart Data Discovery. Also, given that most customerengagements include approximately four weeks of implementation by a small team of engineers, Palantircould be classified as a business analytic service provider. The vendor has grown from its roots in frauddetection and national security/intelligence work to a broader array of vertical industries. This has resultedin significant growth for the company in the past few years. Palantir really isn't a competitor to most ofthe vendors on this Magic Quadrant; instead it is a complement and focuses on more complex analyticsolutions and is therefore not seen as a mainstream analytic provider like the first generation of datadiscovery vendors.
SynerScope
SynerScope released its two core products, Marcato and Legato, in 2012. Marcato is a visual analysisplatform that represents networks and relationships between entities in data, so that users can identifyhidden patterns across structured and unstructured data without specialized skills. Entities are thingssuch as people, places, products, transactions, events, companies, claims, policies, emails, socialinteractions, sentiment and files. Legato ingests data, generates metadata from both structured andunstructured files, and loads data into an inmemory database for fast interactive analysis. SynerScopecan work with many leading databases; notably, it is an SAP partner and integrates with SAP's Hana inmemory database. SynerScope's initial customers are using the product for claims analysis and frauddetection in the insurance industry, as well as for analytics of mobile phone calls and cyber security. Thenew server version of the product (added in 2014) can be deployed onpremises or in the cloud.
Data DiscoveryAdvizor Solutions
A Bell Labs spinoff, Advizor specializes in interactive data visualization and predictive modeling andprovides a fully inmemory data discovery engine for advanced information blending and exploration. Bymaking extensive use of color and regression algorithms to identify information items, and employing alibrary of sophisticated visualizations, the tool delivers highly interactive dashboards that appeal tobusiness users looking to find correlations, spot trends and uncover insights hidden in their data. Advizorhas long been in partnership with Information Builders and HP ArcSight, both of which offer its products
2/26/2015 Magic Quadrant for Business Intelligence and Analytics Platforms
http://www.gartner.com/technology/reprints.do?id=12AH4Q85&ct=150224&st=sb 29/38
on an OEM basis. Advizor's direct business specializes in the fundraising, healthcare, higher educationand manufacturing sectors. Advizor is repositioning its product as a highend discovery tool, bridging thegap between basic information exploration and advanced analytics.
SelfService Data PreparationSelfservice data preparation platforms enable business users to reduce the time and complexity ofpreparing data for analysis in a governed and reusable way. They feature capabilities like visual data flowbuilding and automation, semantic autodiscovery, intelligent joins, intelligent profiling, hierarchygeneration, data lineage and data blending on varied data sources, including multistructured data. Manyof these platforms also offer automated machinelearning algorithms that visually highlight the structure,distribution, anomalies and repetitive patterns in data — with guided businessuseroriented tools toresolve issues and enhance data. In addition to Alteryx and an increasing number of BI vendors focusingon this highvalue capability, ClearStory Data, Lavastorm Analytics and Zoomdata offer alternatives.
ClearStory Data
ClearStory targets nontechnical, LOB users that need fast answers, which ClearStory enables via itssystemdriven data blending capabilities that "infer and harmonize" disparate data to generate fast, visualanalysis. Companies combining private and external data can see holistic insights about their customers,their market, and their competitors. ClearStory offers interactive and collaborative data story telling withdiscoverybased visualizations that are enriched by automatically harmonizing external/subscription andinternal data sources. For internal data, ClearStory's data Inference capabilities speed data access andpreparation from enterprise data warehouses, relational database management systems, Hadoop, cloudapplications, and files. ClearStory has partnerships with data providers such as pointofsale dataproviders, Kantar Media, D&B, Nielsen, Weather Analytics and DataSift, and is working with IMS Health inthe pharmaceuticals industry. Native availability of this content provides users with easy access to thesethirdparty data sources. New data sources can be added via ClearStory's external data API. ClearStoryoffers data preparation and automated data blending capabilities called Intelligent Data Harmonization(built on Spark for speed and scale) as an integrated part of the platform and a user's analytic workflow.This capability uses data mining techniques to identify data relationships across many different datasources. It also suggests to the user relevant data sources that could be used to either improve thequality of the data and/or enrich the analysis in ClearStory applications/stories. ClearStory's exportcapabilities can also be used to export raw or harmonized datasets for integration into most datadiscovery, BI, and data science platforms. .
Lavastorm Analytics
Lavastorm Analytics specializes in operational analytics where ad hoc information exploration andautomation of continuous analysis are key requirements. The company provides a tool that enablesbusiness users to work, in a graphical interface, on building analytic workflows that connect to multipledata sources, integrate and transform data, apply analytic models, output reports and integrate withexternal tools such as Tableau, QlikView and Tibco Spotfire for further information visualization. Theworkflows built are similar to visual ETL scripts, but instead of IT experts working in structured processesto load the corporate data warehouse, it is handled by business users and can be used for ad hoc analysisof disparate data sources — from spreadsheets to data warehouses. The company has deep experience inthe telco and financial services industries, supporting large data volumes, performing complex analysisand operating in demanding operational environments. The product is offered in different editions, withdesktop and server options — ranging from a free version for an individual user analyzing filebased datato a corporate setup for handling terabytes of information.
Note that Lavastorm has met most of the MQ inclusion criteria but is more narrowly focused on datapreparation than other MQ vendors.
Zoomdata
Zoomdata offers innovative capabilities for the exploration of data sources — in particular for realtimeand streaming data. It has connectors typically used for big data, such as Hadoop HDFS, Spark, MongoDB,Amazon Redshift and Cloudera Impala; searchbased services such as Solr and Cloudera Search;streaming data such as Twitter or Amazon Kinesis; as well as support for traditional data repositories suchas Microsoft SQL, Oracle and PostgreSQL. Zoomdata delivers a unique microquery approach to largedatasets that improves the sharpness of results with time — just like a picture being downloaded fromthe Web is rendered in multiple steps that add additional detail. This allows business users to have animmediate approximation of the results, so they can proceed with their exploration process without delay,while the platform retrieves additional information in the background to sharpen the results. Anotherinteresting feature is what Zoomdata calls "data DVR" — which allows reporting on realtime streamingdata with comparisons with historic data, and the ability to rewind or fastforward the information beingrendered. All the information is rendered using a broad range of visually compelling D3based datavisualizations that business users can handle without IT support.
Other BI Platform VendorsA number of other small vendors may be worthy of consideration, depending on requirements, althoughthey did not meet the criteria for inclusion in this year's Magic Quadrant.
AFS Technologies
AFS Technologies offers Discovery G2, an endtoend data visualization and data discovery solution thatdelivers tailored, individual insights and analytics targeted at business users in the field such as sales repsor customer service personnel, or in aggregate for decision makers in the consumer goods industry. Theplatform can extract information from ERP systems, industry data sources including Nielsen, tradepromotion management systems, warehouse management systems and various budgeting tools andspreadsheets, and use this data for a range of management analysis including sales, posttrade spending,warehouse efficiency and general financial. AFS has more than 200 customers that leverage theplatform's preconfigured starting templates to deliver customized results reports for sales analyses, posttrade spend analyses, standard warehouse management and financial reports to reduce time todeployment.
Antivia
Antivia is a privately held company that began with an emphasis on collaboration across BI tools and laterfocused more on the SAP BusinessObjects platform, where its products helped overcome many of thelimitations in SAP's dashboard product (Xcelsius, rebranded as Dashboards in SAP BI 4.0). In 2013, thecompany released DecisionPoint, which is datasourceagnostic, positioning itself as a dashboard and
2/26/2015 Magic Quadrant for Business Intelligence and Analytics Platforms
http://www.gartner.com/technology/reprints.do?id=12AH4Q85&ct=150224&st=sb 30/38
mobile solution beyond the SAP customer base. DecisionPoint has its own clientside microcube engine toprovide drilldown and pivot within a dashboard; it also supports multiple universe formats (UNV andUNX) as data sources, along with other relational sources such as Teradata, Oracle, SQL Server, Netezza,big data databases (such as Hadoop), and flat files. In contrast to the SAP dashboard tools, which requirescripting, DecisionPoint is an all draganddrop dashboard design. It also offers native iPad support.
Dimensional Insight
Dimensional Insight delivers a wide range of BI capabilities through its Diver Solution, spanning datacollection, data assembly and information delivery deployed either onpremises, through an appliance oras a cloud based SaaS solution. Diver Solution's data collection tier enables connection to a wide range ofsource systems and the ability to integrate with the ETL capabilities of the platform. The data assemblytier is the core of Diver Solution, where its multidimensional data model is built and enhanced withbusiness rules in preparation for analysis. Information delivery capabilities offered within the platforminclude reporting and dashboarding, data discovery and visualization, and MS Office integration withmobile capabilities delivered through DiveTab. Dimensional Insight has leveraged its deep vertical industryand domain expertise to offer several prebuilt "Advisor" solutions built upon the Diver Solution platform.Dimensional Insight's extensive expertise in the healthcare provider vertical is evident in its support forthree such purposebuilt applications aimed at organizations in the segment: DI Surgery Advisor, DIPhysician Performance Advisor and DI Meaningful Use Compliance Advisor. DI Sales Advisor and DIProgram Advisor are used to deliver information and key metrics to sales and support teams. DI GeneralLedger (GL) Advisor allows for analysis and interaction with financial data and the DI Pricing Advisor isused by CPG providers to effectively manage price and maximize revenue, margin and profitability.
Dundas Data Visualization
Privately owned, Dundas Data Visualization started out as a chartingengine technologies company whoseOLAP, chart, map and gauge components for ASP.NET, SSRS, SharePoint and Windows Forms werepurchased by Microsoft in 2007. Dundas then evolved into a dashboard vendor with its first release ofDundas Dashboard in 2009, which provides interactive visualization functions, a rich set of APIs and abuiltin C# scripting engine for data presentation customization and extensibility. To expand its marketopportunity, in October/November 2014, Dundas introduced Dundas BI, an endtoend BI platformfocused on selfservice. It is Webbased and includes a data warehouse and ETL, data discovery, reports,dashboards, and mobile capabilities. Customers report choosing Dundas for its functionality and ease ofuse for end users, with most using Dundas's dashboard and interactive visualization capabilities. Dundasalso offers a design Professional Services offering to assist customers in implementing BI anddashboarding best practices.
eQ Technologic
eQ Technologic (eQ) delivers BI capabilities through eQube Business Intelligence (eQubeBI), a componentof its eQube enterprise software information infrastructure platform. Primarily, eQubeBI providesenterprise "visibility" leading to actionable insight in the product life cycle management (PLM) domainextending across the enterprise to ERP/supplychain, Management Execution Systems (MESs), AssetLifecycle Management (ALM), planning systems, warranty systems, often combining streaming sensordata with product requirements, product engineering data, warranty systems, and manufacturing data.EQ's customers are predominantly in the aerospace and defense, automotive and machinery,shipbuilding, hightech and consumer goods industries — often combining streaming sensor data withproduct, warranty, systems and data. The platform offers over 100 BI templates and cubes "out of thebox" that are specific to industrial companies. It is sold both directly to customers and via partnerships,such as those with Siemens PLM Software, which markets and resells eQubeBI as Teamcenter Reportingand Analytics. EQubeBI is used primarily for rapid prototyping and iterative development of inmemorycubes that can be developed without the need for a data warehouse or datamart. Customers have theoption of using the eQubeBI cubes developed during the prototyping process to build a data warehouse, ifneeded, for other applications. The company introduced its eQube 3D Insight module to allow customer tovisualize the 3D model of their product, with color coding (red/yellow/green) based on differentparameters such as number of changes, velocity of change, inventory levels, supply chain bottlenecksand warranty claims. Reference customers identified data access and integration, integration withenterprise applications, and integration with information infrastructure as their main reasons for choosingeQubeBI. Data integration and the ability to create a single view of data — combining several disparatedata sources inmemory and honoring the security of the underlying applications — is a clear strength ofeQubeBI, but responses to our survey indicated that the product is difficult to use for developers,administrators and endusers alike, with these identified as factors limiting wider deployment. Revampingthe user interface, expanding advanced analytics and creating a big data solution for the IoT are on thecompany's road map.
iDashboards
iDashboards delivers capabilities used to build and consume highly interactive dashboards that can bedeployed either onpremises or in the cloud. The platform offers an easytouse, codefree interface foraccessing cloud and enterprise data, and displaying analytic content and KPIs on intuitive dashboards forenduser consumption. The iDashboards content can be consumed via mobile devices using any HTML5compliant browser with mobile application options for Android tablet and iPad/iPhone users. Special displaysolution licensing is available for rendering of dashboards on screens in common areas such as offices,production facilities or boardrooms for shared KPI consumption and monitoring. The iDashboards productline also offers various predefined packaged solutions for popular cloudbased sources, such as Salesforce,Google Analytics, Facebook and Twitter, with prebuilt connectors, transformation logic and a suite ofprebuilt dashboards displaying common metrics typically tracked and analyzed for each source. In additionto enduser organizations that use iDashboards to create and deliver dashboards to internal and externalusers, a growing number of independent software vendors have formed OEM partnerships withiDashboards to embed content in analytic solutions.
InetSoft
InetSoft is a U.S.based company that specializes in easytouse interactive dashboards targeted atexpanding enduser adoption plus pixelperfect report generation, scheduling, and bursting. Business userdata mashup is also a core feature of the platform. InetSoft has a large number of OEM customers andalso serves enterprises in different geographies with support centers in the U.S. and China (the product islocalized to Mandarin in addition to English). In 2014, InetSoft announced native mobile applications forAndroid and iOS and improved its support for big data sources. Through its product enhancements,InetSoft is trying to address a wide range of capabilities — from traditional reporting to OLAPbasedanalysis, to ad hoc information exploration and analytic dashboards.
2/26/2015 Magic Quadrant for Business Intelligence and Analytics Platforms
http://www.gartner.com/technology/reprints.do?id=12AH4Q85&ct=150224&st=sb 31/38
Infor
Infor Business Intelligence (BI) is the basis of an endtoend platform that encompasses BI, analytics andperformance management capabilities. Infor has a global presence and major support centers in EMEA,the U.S. and Asia/Pacific. Infor BI includes an inmemory multidimensional OLAP database; Web frontends, such as Infor BI Dashboards/Motion Dashboards for data presentation and analysis; a featurerichMicrosoft Excelbased interface; a data integration tool; and a modeling tool. Infor BI offers outoftheboxintegration and packaged industry and domainspecific analytic solutions for Infor ERP applications. Inaddition, it is frequently deployed in the SAP ERP installed base, primarily as a result of the former MISAlea's relationship with SAP. Infor continues to enhance the Infor BI platform. In 2014, Infor introduceda metalayer, embedded in the platform, now combining multidimensional and relational ad hoc analysisand reporting capabilities. It continues to invest in improving the mobile app and the inmemoryprocessing performance.
Jinfonet Software
Jinfonet Software delivers JReport — a Javabased BI platform originally developed for embedding in thirdparty applications by OEMs. Over time, the product has evolved into a generalpurpose platform intendedfor use by enduser companies. However, according to the company, 86% of customers still use theproduct for embedded BI and 62% of customers are OEMs. It is also optimized to be scalable and faulttolerant. The current version (JReport 13) features improvements to geospatial, performance andvisualizations. JReport 12 enhanced dashboards, interactive visualization and mobile capabilities, andsupport for big data sources — MongoDB, Hadoop (through Hive), and Amazon Redshift. Jinfonet's productstrengths are its embedding capability, through its customizable architecture for integration with hostapplications, and a highperformance reporting engine (JReport). Enhancements to usability andinvestment in the cloud are on the company's nearterm road map.
Looker
Looker offers tools for businessuserdriven data transformation and exploration. Its purpose is not tocompete with traditional BI tools, but to facilitate analytic processes between data analysts and endusers. Looker is invested in making their customers successful with using the product. It providesexperienced data analysts that help their customers with unlimited support in the use of the tool. Theplatform's key differentiator is LookML — Looker's data modeling language — which lets techsavvybusiness users generate indatabase queries, with optimized performance, without depending on IT.Repositories such as Teradata Aster, Microsoft SQL Server, Oracle, Amazon Redshift, SAP Hana, GoogleBigQuery, Apache Spark and Hadoop (through Cloudera Impala), can thus be queried, through LookML, togenerate insights. A number of customizable visualizations can also be applied to the informationextracted from the data sources and be used to create reports. The sales focus of the company has beendriven by an internal team and partner sales team and has been centered in the U.S. Looker recentlyopened its operations in Europe with an office in London and has customers across Europe, Asia and LatinAmerica. Looker has plans to continue to expand its reach through its partner network, with companiessuch as Amazon, IBM, Cloudera, Snowplow Analytics and Teradata.
Manthan
Manthan offers a comprehensive BI and advanced analytics cloudbased platform focused on retail. TheManthan Analytics Platform, which offers from data integration through to reporting, dashboards,interactive visualizations and predictive and prescriptive analytics (optimization engines and decisionframeworks), is the foundation for its packaged retail analytics applications for merchandise, customersand supplier/wholesaler analytics. Making insights from advanced analytics accessible to business users inretail is a differentiator for Manthan. According to its customer references, customers choose Manthanbecause of its functionality and ease of use and for its specialized vertical expertise.
Manthan met all of the inclusion criteria for a dot position in the MQ, but was excluded from the top 24because of its focus on packaged applications versus a platform, which is the main focus on this MQ.However, Retail customers looking for unified set of packaged applications supporting range of descriptive,diagnostic, predictive and prescriptive analytics should consider Manthan.
Phocas
Phocas currently offers a subscriptionbased BI product and is migrating to a SaaS model with a cloudfirstapproach to development. Multitenancy, the ability to blend data from cloud and onpremises datasources, and a full Web user experience make it particularly suited to a cloud BI environment, althoughmost many of its customers still prefer use their traditional onpremises offering. Phocas offers a range ofcapabilities, including dashboards, basic data discovery and collaboration features, geospatial rendering ofinformation, advanced analytics models (such as shopping basket analysis and profit optimization) andmobile BI — with desktoplike data exploration capabilities through an HTML5 interface. The company isinvesting in simplifying its customer experience, which is paying off in terms of customers rating Phocashighly for ease of use and achievement of business benefits. Phocas is also concentrated in the delivery ofvertical solutions for different industries and roles, providing an extensive list of data connectors tobusiness applications that help simplify deployments. The product is localized in several languages andcurrently used by over 1,000 customers.
SpagoBI Competency Center
SpagoBI is a totally opensource BI solution offered as a single version that should ease deployment andsupport in comparison with similar solutions. Its core markets go beyond Western Europe (where itoriginated in an IT consultancy firm) to include regions where OEM solutions and opensource are popular— such as the U.S., Latin America, and Central and Eastern Europe. The company is headquartered inItaly, but has offices in the U.S., Brazil, Argentina, the Republic of Serbia and Belgium, as well as anetwork of more than 100 partners. The product is now on version 5.1 (released in January 2015) andhas expanded data connectivity toward big data and analytic capabilities, with new solutions for OLAPanalysis, selfservice inmemory cockpits, data mining with R, social listening and whatif analysis.SpagoBI's reference customers report a breadth of use that is slightly above average, but claim that theproduct's ease of use, and the complexity of analysis that can be achieved with it, are below the average(for this Magic Quadrant survey). There is also feedback from customers that the product is difficult toimplement, but this is inline with what the opensource market has offered over the years. It is still tooearly to understand to what extent the new version, 5.1 will impact these assessments.
Strategy Companion
Strategy Companion's Analyzer platform is a selfservice BI solution ideally suited for Microsoft SQL ServerAnalysis Services (SSAS)based solution development, with several deployment options available:
2/26/2015 Magic Quadrant for Business Intelligence and Analytics Platforms
http://www.gartner.com/technology/reprints.do?id=12AH4Q85&ct=150224&st=sb 32/38
Analyzer Enterprise for internal BI delivery through onpremises deployment; Analyzer SaaS, which is amultitenant option used by cloud and SaaS application providers to build and host external solutions; andAnalyzer OEM, which is used by customers to embed content in applications using open standards offeredby the Analyzer platform. Analyzer Mobile is based on HTML5 and can render content on most mobiledevices including iPads, iPhones, BlackBerry, Android and Windows phones using rolebased securityprofiles defined within Analyzer. Strategy Companion leverages a unique data analysis feature in Analyzercalled "Recombinant BI," which is named from the combination of Recombinant DNA and GeneticRecombination. This patentpending functionality extends the capabilities beyond traditional OLAP, byallowing users to combine new data as needed and answer new questions on their own without a relianceon IT to curate the data needed for analysis. Customers report using Analyzer for relatively complexanalytic tasks to achieve business benefits that exceed the overall survey average.
Zucchetti
Zucchetti first launched a BI platform offering (Infinity) in 2007, to complement its broad array ofbusiness applications (for HR, CRM, and document management). Zucchetti now delivers BI capabilitiesthrough its InfoBusiness platform to approximately 6,000 customers, many of which also use its ERP andHR solutions. In fact, 80% of customers using Zucchetti for BI are integrating it with either Zucchetti ERPor Zucchetti HR; 20% are using it as a standalone BI platform. Based on Gartner's other research, it isevident that the InfoBusiness platform is targeted at descriptive use cases, offering reporting andparameterized dashboards, and some ad hoc analysis capabilities to consumers. Zucchetti plans a productlaunch of Infinity Analytics during 2H15. The platform also integrates collaboration capabilities, enablingusers to share BI content. Other recent improvements to the platform include the ability to modelmultiple data views and the support of 64bit platforms. Zucchetti is using a business model of 55%indirect, 45% direct to grow its BI business beyond its current business application focus.
Inclusion and Exclusion CriteriaThe number of vendors on this year's Magic Quadrant is limited to 24. We ranked vendors that met allthe inclusion criteria based on a combination of the criteria listed below.
Generated at least $20 million in total BIrelated software license revenue annually,1 or at least$17 million in total BIrelated software license revenue annually, plus 15% yearoveryear in newlicense growth.
In the case of vendors that also supply transactional applications, show that its BI platform is usedroutinely by organizations that do not use its transactional applications.
How well vendors address the 13 productspecific critical capabilities defined in the Market Definitionsection (OEM components from other vendors were counted). This is demonstrated by filling out theGartner supplied RFP and Vendor Questionnaire and through the vendor briefing. Gartner analystsdetermine, based on the documentation provided, how well a vendor meets this inclusion criteria.
Had a minimum of 35 customer survey responses from companies that use the vendor's BIplatform in productions.
The vendor must have participated in all data collection activities, including:
1. Providing a product list and mapping to critical capabilities
2. Providing verification of revenue
3. Providing customer survey references
4. Completing the critical capabilities RFP
5. Providing up to a onehour video demo highlighting how the BI platform supports as manyof the 13 product capabilities as possible
6. Completing the vendor questionnaire
7. Conducting a Magic Quadrant briefing with the authors
Vendors that offer specific industry or domain analytic applications only are excluded from considerationbecause this Magic Quadrant highlights BI and analytics platforms that are used to build analyticapplications for any industry or domain.
Evaluation CriteriaAbility to ExecuteVendors are judged on their ability and success in making their vision a market reality that customersbelieve is differentiated and that they purchase. Delivering a positive customer experience, including salesexperience, support, product quality, user enablement, availability of skills, upgrade/migration difficulty,also determines a vendor's Ability to Execute. In addition to the opinions of Gartner's analysts, the ratingsand commentary in this report are based on a number of sources: customers' perceptions of eachvendor's strengths and challenges, as gleaned from their BIrelated inquiries to Gartner; an online surveyof vendors' customers conducted during October 2014 (which yielded 2,083 responses); a questionnairecompleted by the vendors; vendors' briefings, including product demonstrations, strategy and operations;an extensive RFP questionnaire inquiring how each vendor delivers specific features that make up the 13critical capabilities (a toolkit with the RFP template will be published soon after this Magic Quadrant); aprepared video demonstration of how well vendor BI platforms address the 13 critical capabilities; andbiscorecard.com research.
Ability to Execute CriteriaProduct/Service*: How competitive and successful are the goods and services (the 13capabilities) offered by the vendor in this market, and how extensively are they used?
Overall Viability: What is the likelihood of the vendor continuing to invest in products and servicesfor its customers? Viability includes an assessment of the overall organization's financial health, thefinancial and practical success of the business unit, and the likelihood of the individual business unitcontinuing to invest in the product, offer the product and advance the state of the art within itsproduct portfolio.
Sales Execution/Pricing*: Does the vendor provide costeffective licensing and maintenanceoptions? This covers the vendor's capabilities in all presales activities and the structure that supportsthem. It also includes deal management, pricing, negotiation and contracting, presales support and
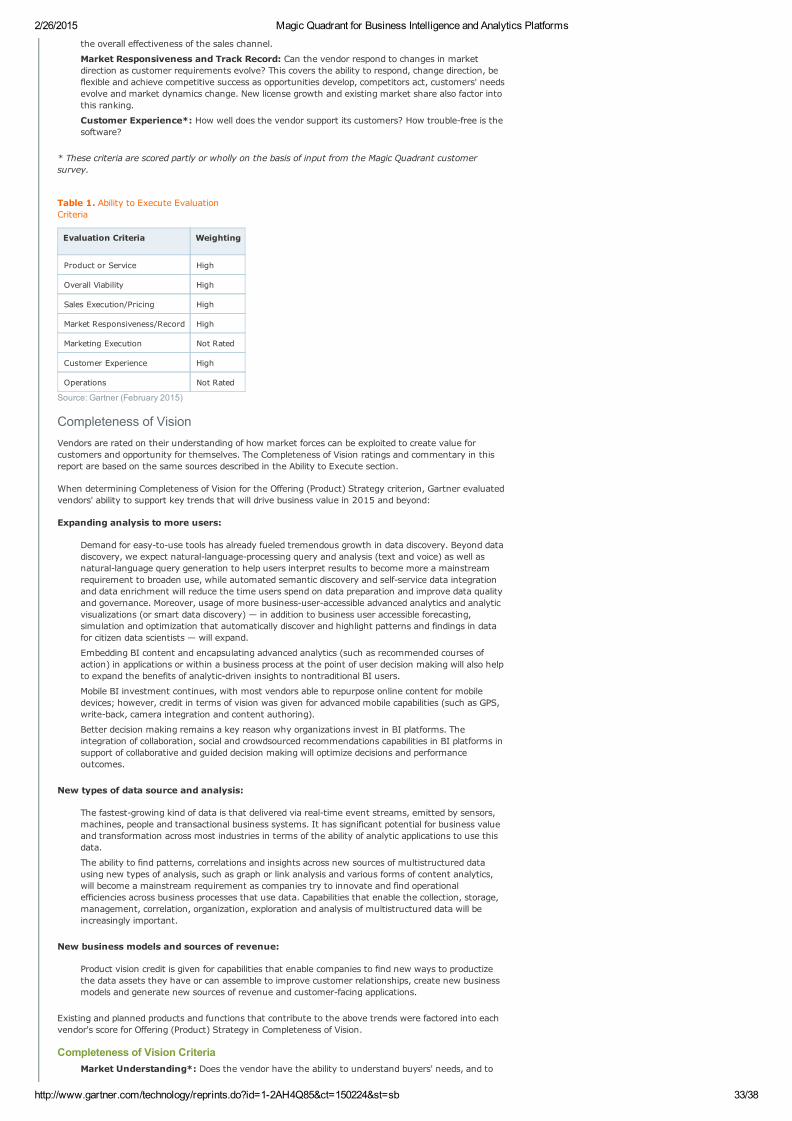
2/26/2015 Magic Quadrant for Business Intelligence and Analytics Platforms
http://www.gartner.com/technology/reprints.do?id=12AH4Q85&ct=150224&st=sb 33/38
the overall effectiveness of the sales channel.
Market Responsiveness and Track Record: Can the vendor respond to changes in marketdirection as customer requirements evolve? This covers the ability to respond, change direction, beflexible and achieve competitive success as opportunities develop, competitors act, customers' needsevolve and market dynamics change. New license growth and existing market share also factor intothis ranking.
Customer Experience*: How well does the vendor support its customers? How troublefree is thesoftware?
* These criteria are scored partly or wholly on the basis of input from the Magic Quadrant customersurvey.
Table 1. Ability to Execute EvaluationCriteria
Evaluation Criteria Weighting
Product or Service High
Overall Viability High
Sales Execution/Pricing High
Market Responsiveness/Record High
Marketing Execution Not Rated
Customer Experience High
Operations Not Rated
Source: Gartner (February 2015)
Completeness of VisionVendors are rated on their understanding of how market forces can be exploited to create value forcustomers and opportunity for themselves. The Completeness of Vision ratings and commentary in thisreport are based on the same sources described in the Ability to Execute section.
When determining Completeness of Vision for the Offering (Product) Strategy criterion, Gartner evaluatedvendors' ability to support key trends that will drive business value in 2015 and beyond:
Expanding analysis to more users:
Demand for easytouse tools has already fueled tremendous growth in data discovery. Beyond datadiscovery, we expect naturallanguageprocessing query and analysis (text and voice) as well asnaturallanguage query generation to help users interpret results to become more a mainstreamrequirement to broaden use, while automated semantic discovery and selfservice data integrationand data enrichment will reduce the time users spend on data preparation and improve data qualityand governance. Moreover, usage of more businessuseraccessible advanced analytics and analyticvisualizations (or smart data discovery) — in addition to business user accessible forecasting,simulation and optimization that automatically discover and highlight patterns and findings in datafor citizen data scientists — will expand.
Embedding BI content and encapsulating advanced analytics (such as recommended courses ofaction) in applications or within a business process at the point of user decision making will also helpto expand the benefits of analyticdriven insights to nontraditional BI users.
Mobile BI investment continues, with most vendors able to repurpose online content for mobiledevices; however, credit in terms of vision was given for advanced mobile capabilities (such as GPS,writeback, camera integration and content authoring).
Better decision making remains a key reason why organizations invest in BI platforms. Theintegration of collaboration, social and crowdsourced recommendations capabilities in BI platforms insupport of collaborative and guided decision making will optimize decisions and performanceoutcomes.
New types of data source and analysis:
The fastestgrowing kind of data is that delivered via realtime event streams, emitted by sensors,machines, people and transactional business systems. It has significant potential for business valueand transformation across most industries in terms of the ability of analytic applications to use thisdata.
The ability to find patterns, correlations and insights across new sources of multistructured datausing new types of analysis, such as graph or link analysis and various forms of content analytics,will become a mainstream requirement as companies try to innovate and find operationalefficiencies across business processes that use data. Capabilities that enable the collection, storage,management, correlation, organization, exploration and analysis of multistructured data will beincreasingly important.
New business models and sources of revenue:
Product vision credit is given for capabilities that enable companies to find new ways to productizethe data assets they have or can assemble to improve customer relationships, create new businessmodels and generate new sources of revenue and customerfacing applications.
Existing and planned products and functions that contribute to the above trends were factored into eachvendor's score for Offering (Product) Strategy in Completeness of Vision.
Completeness of Vision CriteriaMarket Understanding*: Does the vendor have the ability to understand buyers' needs, and to
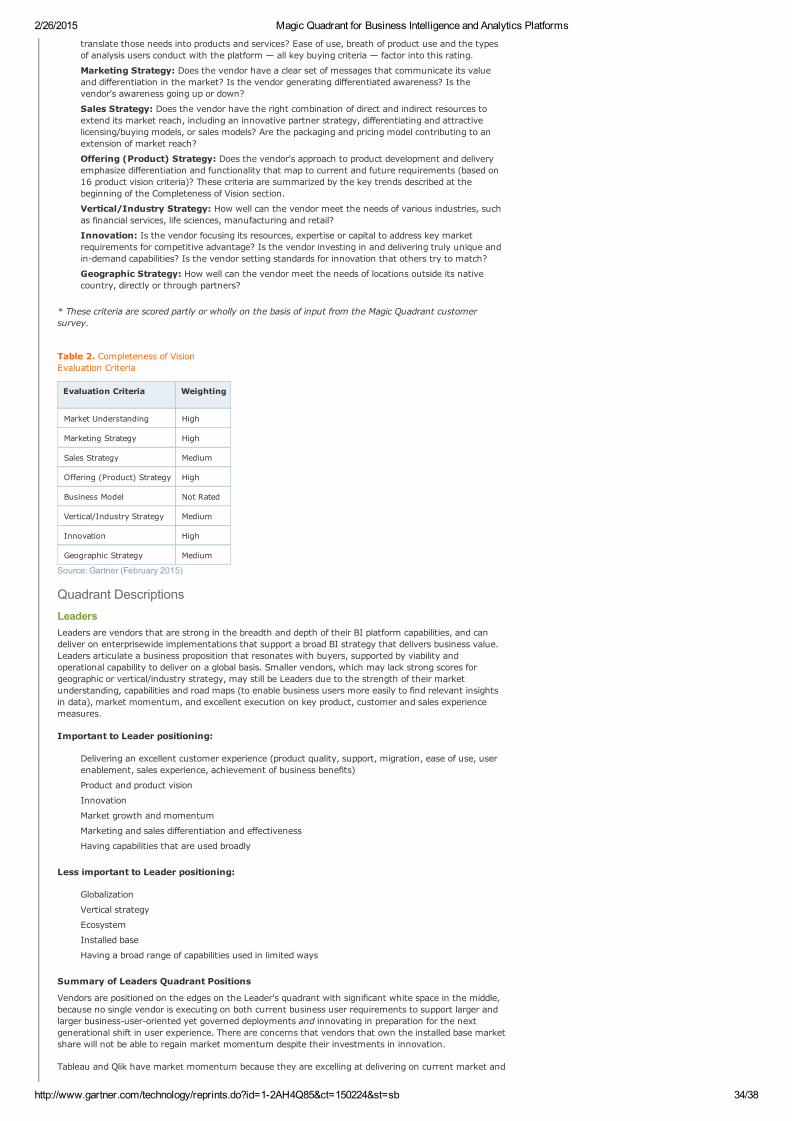
2/26/2015 Magic Quadrant for Business Intelligence and Analytics Platforms
http://www.gartner.com/technology/reprints.do?id=12AH4Q85&ct=150224&st=sb 34/38
translate those needs into products and services? Ease of use, breath of product use and the typesof analysis users conduct with the platform — all key buying criteria — factor into this rating.
Marketing Strategy: Does the vendor have a clear set of messages that communicate its valueand differentiation in the market? Is the vendor generating differentiated awareness? Is thevendor's awareness going up or down?
Sales Strategy: Does the vendor have the right combination of direct and indirect resources toextend its market reach, including an innovative partner strategy, differentiating and attractivelicensing/buying models, or sales models? Are the packaging and pricing model contributing to anextension of market reach?
Offering (Product) Strategy: Does the vendor's approach to product development and deliveryemphasize differentiation and functionality that map to current and future requirements (based on16 product vision criteria)? These criteria are summarized by the key trends described at thebeginning of the Completeness of Vision section.
Vertical/Industry Strategy: How well can the vendor meet the needs of various industries, suchas financial services, life sciences, manufacturing and retail?
Innovation: Is the vendor focusing its resources, expertise or capital to address key marketrequirements for competitive advantage? Is the vendor investing in and delivering truly unique andindemand capabilities? Is the vendor setting standards for innovation that others try to match?
Geographic Strategy: How well can the vendor meet the needs of locations outside its nativecountry, directly or through partners?
* These criteria are scored partly or wholly on the basis of input from the Magic Quadrant customersurvey.
Table 2. Completeness of VisionEvaluation Criteria
Evaluation Criteria Weighting
Market Understanding High
Marketing Strategy High
Sales Strategy Medium
Offering (Product) Strategy High
Business Model Not Rated
Vertical/Industry Strategy Medium
Innovation High
Geographic Strategy Medium
Source: Gartner (February 2015)
Quadrant DescriptionsLeadersLeaders are vendors that are strong in the breadth and depth of their BI platform capabilities, and candeliver on enterprisewide implementations that support a broad BI strategy that delivers business value.Leaders articulate a business proposition that resonates with buyers, supported by viability andoperational capability to deliver on a global basis. Smaller vendors, which may lack strong scores forgeographic or vertical/industry strategy, may still be Leaders due to the strength of their marketunderstanding, capabilities and road maps (to enable business users more easily to find relevant insightsin data), market momentum, and excellent execution on key product, customer and sales experiencemeasures.
Important to Leader positioning:
Delivering an excellent customer experience (product quality, support, migration, ease of use, userenablement, sales experience, achievement of business benefits)
Product and product vision
Innovation
Market growth and momentum
Marketing and sales differentiation and effectiveness
Having capabilities that are used broadly
Less important to Leader positioning:
Globalization
Vertical strategy
Ecosystem
Installed base
Having a broad range of capabilities used in limited ways
Summary of Leaders Quadrant Positions
Vendors are positioned on the edges on the Leader's quadrant with significant white space in the middle,because no single vendor is executing on both current business user requirements to support larger andlarger businessuseroriented yet governed deployments and innovating in preparation for the nextgenerational shift in user experience. There are concerns that vendors that own the installed base marketshare will not be able to regain market momentum despite their investments in innovation.
Tableau and Qlik have market momentum because they are excelling at delivering on current market and
2/26/2015 Magic Quadrant for Business Intelligence and Analytics Platforms
http://www.gartner.com/technology/reprints.do?id=12AH4Q85&ct=150224&st=sb 35/38
customer experience requirements. They are satisfying customers for data discovery, are enabling easy,broader use, and are growing.
Customers place high value on ease of use, satisfaction with product features, sales experience, support,product quality, upgrade experience, user enablement, achievement of business benefits and supporting arange of analysis for all users. These vendors with the majority of the market momentum are focused onmaking it easier and simpler for more users to author content and explore and discover patterns in datawherever they are. They are executing on all or most requirements customers care most about and aregrowing from new analytics project investments, although enterprise features for governance,administration, embeddability and scalability are a work in progress (Qlik has introduced these in its newQlik Sense platform, while Tableau is adding these incrementally with each new release to address thislimitation).
From a vision standpoint, both Tableau and Qlik are largely evolving their capabilities by continuing toinvest in making their platforms easier to use for a broader range of users, but have placed less emphasison emerging growth areas like smart data discovery to further democratize access to analytics (see theMarket Overview section for more detail on these emerging capabilities and trends) or on selfservice datapreparation (Tableau is planning limited capabilities as part of Tableau 9; Qlik is also planning to introducesome capabilities in a future release).
SAP, SAS and IBM are meeting most Completeness of Vision requirements and own a large portion of theinstalled base market share. They are investing aggressively to close gaps and regain momentum anddifferentiation through a nextgeneration, smart data discovery experience featuring selfservice datapreparation and automated pattern detection with naturallanguage query and generation for smart datadiscovery. They are also positioning their integration with their enterprise platforms to support governeddata discovery as key differentiators. These vendors must translate their vision into renewed marketmomentum, including outside their installed bases, and improve their customer experience and deliveryof business value to remain in the Leaders' quadrant in the future.
SAS has had better traction, adoption and customer experience than IBM and SAP as a result of itsmajor commitment to SAS Visual Analytics, its data discovery capabilities, as its goforward BIplatform. SAS has leveraged its advanced analytics strengths into compelling differentiators aroundsmart data discovery in Visual Analytics.
SAP has invested aggressively in Lumira with forwardlooking capabilities around smart datadiscovery leveraging its KXEN acquisition and selfservice data preparation. It also has a clearer roadmap than IBM on how Lumira integrates with the rest of its BI stack (Hana, SAP BusinessObjects).
IBM has a compelling vision for Watson Analytics — combining selfservice data preparation, naturallanguage query generation and exploration, automatic pattern detection and prediction, and visualstorytelling — that will likely drive future market requirements. However, its road map for how thiscapability will integrate with and breathe momentum back into IBM Cognos is less clear.
Microsoft, MicroStrategy, Oracle and Information Builders have many elements of Completeness of Vision,but are hampered by execution challenges.
Microsoft has delivered data discovery capabilities in Excel that have had some level of adoption,particularly in its own installed base. It has a strong product vision (particularly with naturallanguage query and selfservice data preparation), and offers a better customer experience than theother megavendors. However, mediocre product scores and the lack of a strong BI and analyticsmarketing and sales focus — combined with the complexity of onpremises deployments and therelatively limited functionality currently delivered through the Office 365 cloud — has limitedMicrosoft's market traction and position to date. Its new updated Power BI product offering(currently in preview), which can be deployed as a standalone solution for business users to authorand share analytic content without the need for Excel 2013 or an Office 365 subscription, maychange this trajectory in the future.
Oracle has gained momentum in the cloud through embedded SaaS analytics in its Fusionapplications and has introduced a BI Cloud Service. Oracle also is credited with product vision aroundmultistructured and big data analytics. However, it has been late to invest in businessuserorientedcapabilities. While Oracle continues to grow BI revenue into its installed base, these customers haverated it near the bottom across customer experience measures.
MicroStrategy offers a compelling product and vision for governed data discovery and has made anumber of positive business changes, particularly around pricing, but recent disruptions fromexecutive turnover and layoffs may have negatively impacted its customer experience and salesmomentum. It has also impeded marketing efforts to competitively reposition the platform formainstream businessuser buying requirements where product investments have resulted indifferentiation.
Information Builders is a longtime player with a strong enterprise platform for deliveringinformationcentric applications targeted at a large number of business user consumers, bothinternal and customerfacing. While it has invested in governed data discovery, it is late to themarket. Information Builders has visionary elements on the road map and has introduced earlyinnovations to the market, but has achieved limited adoption outside of its core informationcentricapplications sweet spot. Like the most other ITcentric Leaders, growth and momentum has beenlimited and largely from expanding within its installed base.
ChallengersChallengers are wellpositioned to succeed in the market. However, they may be limited to specific usecases, technical environments or application domains. Their vision may be hampered by a lack ofcoordinated strategy across the various products in their platform portfolios, or they may lack themarketing efforts, sales channel, geographic presence, industryspecific content and awareness of thevendors in the Leaders quadrant.
Summary of Challenger PositionsThe large number of vendors in the Challenger, Visionary, and Niche quadrants with specialized strengthssuggests opportunities for customers to find a match for their requirements beyond the largest vendors.Most of these vendors offer differentiated capabilities for addressing business user driven and emergingrequirements.
Birst is in the Challengers quadrant because it has been successful at delivering on most customer
2/26/2015 Magic Quadrant for Business Intelligence and Analytics Platforms
http://www.gartner.com/technology/reprints.do?id=12AH4Q85&ct=150224&st=sb 36/38
requirements for centralized BI deployments in the cloud, but it lacks the market presence, gotomarket machine, and some vision elements of a Leader. Birst was pioneer in the market for cloud BIand is, therefore, wellpositioned to take advantage of the market as cloud BI adoption expands.
Logi Analytics offers an easytouse ITcentric platform that is wellsuited to embedded use cases;customers are satisfied with all aspects of their experience. With evolving capabilities Logi Analyticshas gained vision and innovation credit for its introduction of a unique social and crowdsourcedinterface for data discovery.
VisionariesVisionaries have a strong and unique vision for delivering a BI platform. They offer depth of functionalityin the areas they address. However, they may have gaps relating to broader functionality requirements.Visionaries are thoughtleaders and innovators, but they may be lacking in scale, or there may beconcerns about their ability to grow and provide consistent execution.
Summary of Visionary PositionsThe large number of vendors in the Challengers, Visionaries, and Niche Players quadrants with specializedstrengths suggests opportunities for customers to find a match for their requirements beyond the largestvendors. Most of these vendors offer differentiated capabilities for addressing businessuserdriven andemerging requirements.
Tibco Software moved to the Visionaries quadrant this year. Tibco has a strong product and goodproduct vision that spans businessuserdriven data discovery, geospatial, advanced analytics(Spotfire), ITcentric reporting and embedded BI (Jaspersoft). The company has also introduceddifferentiated pricing models in the cloud for AWS. However, the acquisition of Tibco by VistaPartners, combined with poor sales execution, introduced uncertainty among customers andprospects regarding the future of Spotfire and Jaspersoft. Existing customers also appeared to beaffected by the transition and rated Tibco below average across most customer experiencemeasures, which is a significant change from last year.
Alteryx and Panorama Software earn places in the Visionaries quadrant because each delivers aunique set of capabilities targeted at key buying requirements.
Alteryx offers strong selfservice data preparation, geospatial intelligence and embeddedadvanced analytics.
Panorama delivers a unique user experience for social and smart BI and data discovery.
Niche PlayersNiche Players do well in a specific segment of the BI platform and analytics market, such as reporting,dashboarding, collaboration, embeddability or big data integration, or have a limited capability to innovateor outperform other vendors. They may focus on a specific domain or aspect of BI, but are likely to lackdepth of functionality elsewhere. They may also have gaps relating to broader platform functionality orhave lessthanstellar customer feedback. Alternatively, Niche Players may have a reasonably broad BIplatform, but limited implementation and support capabilities; or relatively limited customer bases, suchas in a specific geography or industry. In addition, they may not yet have achieved the necessary scale tosolidify their market positions.
Summary of Niche PositionsThe large number of vendors in the Challenger, Visionaries, and Niche Players quadrants with specializedstrengths suggests opportunities for customers to find a match for their requirements beyond the largestvendors. Most of these vendors offer differentiated capabilities for addressing businessuserdriven andemerging requirements.
Board International offers integrated BI and planning with a main focus in Europe, but is expandingin the Americas and the Asia/Pacific region.
Datawatch is a new entrant to the Magic Quadrant that offers data discovery capabilities for a rangeof structured, streaming and multistructured data — which are emerging requirements. This makesit particularly wellsuited to analytic applications for the emerging requirements or the IoT.
GoodData is the other cloud BI vendor, in addition to Birst, that was early to the cloud BI marketand has gained market traction. It is differentiated by its integrated endtoend portfolio (from datarepository to dashboards), frequent deployment for embedded and digital marketing use cases aswell as integration of social media data sources.
OpenText (Actuate) offers largescale systemsofrecord reporting and has recently refocused onsupporting embedded BI — selling to application developers as well as BI teams. It has had a difficultyear in terms of execution across all customer and performance measures. While its acquisition byOpenText creates some uncertainty, OpenText has announced it will continue to run Actuate as adedicated analytics group. In addition, it will leverage Actuate for common analytics across allOpenText solutions. The acquisition has the potential to provide Actuate with a new direction,stability, and access to sales and channel resources necessary for improvement.
Pentaho is to the right in the Niche Players quadrant because of its product vision and innovationaround big data and selfservice data preparation. On 10 February 2015, Hitachi Data Systemsannounced its intention to acquire Pentaho. Hitachi Data Systems plans to continue to operatePentaho as a separate business unit and to embed Pentaho into its portfolio of big data and analyticsproducts and services, with a particular emphasis on solutions for the IoT. The acquisition isexpected to close by June 2015.
Prognoz is a regionally dominant platform in Eastern Europe, addressing a full range of BI andanalytics requirements. It has been investing to expand beyond its traditional regional strong hold.
Pyramid Analytics offers a governed, yet easytouse, Microsoftcentric platform focused ontraditional styles of interactive analysis. It is also expanding beyond its Microsoftcentric approach.
Salient Management Company offers inmemory interactive exploration and analysis capabilitiesthat customers find easy to use. Salient has a strong focus in healthcare and CPG.
Targit is an intuitive and integrated data discovery and systemsofrecord reporting, Microsoftcentricplatform with a strong presence in Europe and growing momentum in the U.S.
Yellowfin offers a businessuserfriendly systemofrecord BI platform with differentiation aroundstorytelling, mobile and collaboration and a strong presence in Asia/Pacific.
2/26/2015 Magic Quadrant for Business Intelligence and Analytics Platforms
http://www.gartner.com/technology/reprints.do?id=12AH4Q85&ct=150224&st=sb 37/38
ContextReaders should not use this Magic Quadrant in isolation as a tool for vendor selection. Gartner has definedthe BI and analytics market broadly. We include a variety of products that span a range of buyers and usecases. Consider this Magic Quadrant to be more of a summary of Gartner's research on this market.When making specific tool selection decisions, use it in combination with our Critical Capabilities, SurveyAnalysis research, and Strengths, Weaknesses, Opportunities and Threats (SWOT) publications, as well asour analyst inquiry service. Moreover, readers should be careful not to ascribe their own definitions ofCompleteness of Vision or Ability to Execute to this Magic Quadrant, which often map narrowly to productvision and market share, respectively. The Magic Quadrant methodology factors in a range of criteria indetermining position, as defined in the Evaluation Criteria section.
Market OverviewGartner's view is that the market for BI and analytics platforms will remain one of the fastestgrowingsoftware markets. The market (for BI platforms) grew 9% in 2013, and is projected to grow at acompound annual growth rate of 8.7% through 2018 (seeForecast: Enterprise Software Markets,Worldwide, 20112018, 4Q14 Update"), driven by the following market activity:
Expansion of data discovery dominates new investment. Continued investments in datadiscovery and large governed data discovery deployments are expected to continue. Since a greaterpercentage of purchasing and usage within organizations will be driven primarily by businessuseroriented data discovery requirements (in order to compete and remain relevant to customers), themajority of current ITcentric vendors will continue to shift the focus of their new productinvestment and platform emphasis from ITauthored production reporting to governed, businessuserdriven data discovery and analysis tools — or risk being marginalized by data discovery vendorsthat are investing to become more enterprisecapable. As a result, data discovery will continue todisplace ITauthored static reporting as the dominant BI and analytics user interaction paradigm fornew implementations in 2015 and beyond. ITauthored, systemsofrecord reporting will notdisappear, but it will continue to account for a smaller percentage of overall analytics use. At thesame time, a larger percentage of data discovery deployments will expand overall user adoption as akey driver of market growth.
Selfservice data preparation and enrichment addresses a highvalue data discoverychallenge. The shift toward businessuserdriven data discovery has highlighted the need toaddress the significant challenges of data preparation to enable broader and more governed use.Selfservice data preparation capabilities are emerging that extend beyond the current capabilities ofmost data discovery tools, which offer basic data mashup to help users prepare their data foranalysis and can be very timeconsuming. Selfservice data preparation platforms enable businessusers to reduce the time and complexity of preparing data for analysis in a governed and reusableway. They feature capabilities like visual data flow building and automation, semantic autodiscovery,intelligent joins, intelligent profiling, hierarchy generation, data lineage and data blending on varieddata sources, including multistructured data and enrichment. Many of these platforms also featureautomated machinelearning algorithms in the background that visually highlight the structure,distribution, anomalies and repetitive patterns in data, with guided businessuseroriented tools tosuggest how to resolve issues and enhance data. The intent of these tools is to make the dataintegration process accessible to business analysts, in addition to traditional IT users, to address theongoing and highvalue problem of data preparation.
Smart data discovery will extend data discovery to a wider range of users and enhanceinsights and interpretation. These emerging capabilities facilitate discovery of hidden patterns inlarge, complex and, increasingly, multistructured datasets, without building models or writingalgorithms or queries. It goes beyond data discovery, because business users and business analystscan benefit from advanced analytics (to highlight and visualize important findings, correlations,clusters, predictions, outliers, anomalies, linkages or trends in data that are relevant to the user),with user interaction and exploration via interactive visualizations, search and naturallanguagequery technologies. Some tools also interpret results for the user with naturallanguage generationof text to highlight patterns and explain insights. This will also reduce the time to insight, as well asthe time and expertise needed for the manual data exploration and modeling. Smart data discoverydoes not replace advanced analytics or the data scientist; it complements them, by adding a class ofcitizen data scientists that can develop hypotheses that can be explored in more detail and validatedby the data scientist.
Cloud BI will continue to grow in LOBs and beyond as data gravity (where the majorityof data resides) shifts to the cloud. Adoption intentions have been constant with those of lastyear. About 41% of respondents to Gartner's BI and analytics platform Magic Quadrant survey(compared with 45% last year) said they either are putting, or plan to put, their BI in either aprivate, public or hybrid cloud during the next 12 months. BI vendors with cloud offerings aremoving toward meeting critical market requirements for governed businessuserfriendly platformsand to deliver strong product functionality, positive customer experiences and high business value tocustomers. Increasingly, traditional onpremises vendors are also prepared to support cloud BI.Moreover, Salesforce entered the BI and analytics platform market in October 2014. Its marketentry could increase cloud BI adoption, particularly for customercentric use cases where Salesforcedata is critical.
Streaming data. The past 10 years of analytics investment and value were driven primarily bycustomeroriented companies or the "Internet of People." The next 10 years will be driven byinvestments in applications that use the IoT. The fastestgrowing kind of data is realtime eventstreams, sensors and machine data, and events generated by devices. These new applications,combined with insights from other new (multistructured) data types (together with new types ofanalysis) will generate the next major wave of analytics investment and business transformation.This will enable companies that have historically competed on physical assets to compete oninformation assets.
Multistructured data analytics. Expanded investment in new types of analysis on a variety ofstructured and unstructured data will deliver new insights that drive business value andtransformation.
Embedded BI. Organizations will invest in embedding traditional BI content (reports anddashboards), interactive analysis, predictive and prescriptive analytics in applications and businessprocesses — that deliver optimized recommendations and courses of action to nontraditional BIusers at the point of decision or action (increasingly mobile) — to further extend the pervasivenessand benefits of BI and analytics.
Customerfacing analytics and data monetization. Companies will increasingly invest in
2/26/2015 Magic Quadrant for Business Intelligence and Analytics Platforms
http://www.gartner.com/technology/reprints.do?id=12AH4Q85&ct=150224&st=sb 38/38
capabilities that transform analytics from a cost center to a profit center as they find new ways toproductize the data assets they have, or can assemble, to improve customer relationships, createnew business models and generate new sources of revenue.
Collaboration and social capabilities. Together with the crowd sourcing and sharing of BIcontent and analysis, these will also drive a more pervasive use and higher business value from BIinvestments.
© 2015 Gartner, Inc. and/or its affiliates. All rights reserved. Gartner is a registered trademark of Gartner, Inc. or its affiliates. This publication may not bereproduced or distributed in any form without Gartner’s prior written permission. If you are authorized to access this publication, your use of it is subject to theUsage Guidelines for Gartner Services posted on gartner.com. The information contained in this publication has been obtained from sources believed to be reliable.Gartner disclaims all warranties as to the accuracy, completeness or adequacy of such information and shall have no liability for errors, omissions or inadequaciesin such information. This publication consists of the opinions of Gartner’s research organization and should not be construed as statements of fact. The opinionsexpressed herein are subject to change without notice. Although Gartner research may include a discussion of related legal issues, Gartner does not provide legaladvice or services and its research should not be construed or used as such. Gartner is a public company, and its shareholders may include firms and funds thathave financial interests in entities covered in Gartner research. Gartner’s Board of Directors may include senior managers of these firms or funds. Gartner researchis produced independently by its research organization without input or influence from these firms, funds or their managers. For further information on theindependence and integrity of Gartner research, see “Guiding Principles on Independence and Objectivity.”
About Gartner | Careers | Newsroom | Policies | Site Index | IT Glossary | Contact Gartner


![Magic Quadrant for Business Intelligence and Analytics ... · Gartner Reprint 10:43:58]](https://img.pdfslide.net/doc/110x75/5fbff6451f09cb7ffe7677e3/magic-quadrant-for-business-intelligence-and-analytics-gartner-reprint-104358.jpg)