Embed Size (px)
Citation preview
ARTICLE
Magmatic-dominated fluid evolution in the Jurassic Nambijagold skarn deposits (southeastern Ecuador)
Jean Vallance & Lluís Fontboté & Massimo Chiaradia &
Agnès Markowski & Susanne Schmidt &Torsten Vennemann
Received: 3 January 2009 /Accepted: 11 March 2009 /Published online: 31 March 2009# Springer-Verlag 2009
Abstract The Jurassic (approximately 145 Ma) Nambijaoxidized gold skarns are hosted by the Triassic volcanosedi-mentary Piuntza unit in the sub-Andean zone of southeasternEcuador. The skarns consist dominantly of granditic garnet(Ad20–98) with subordinate pyroxene (Di46–92Hd17–42Jo0–19)and epidote and are spatially associated with porphyriticquartz-diorite to granodiorite intrusions. Endoskarn isdeveloped at the intrusion margins and grades inwards intoa potassic alteration zone. Exoskarn has an outer K- andNa-enriched zone in the volcanosedimentary unit. Goldmineralization is associated with the weakly developedretrograde alteration of the exoskarn and occurs mainly insulfide-poor vugs and milky quartz veins and veinlets inassociation with hematite. Fluid inclusion data for the main
part of the prograde stage indicate the coexistence of high-temperature (500°C to >600°C), high-salinity (up to 65 wt.% eq. NaCl), and moderate- to low-salinity aqueous-carbonic fluids interpreted to have been trapped at pressuresaround 100–120 MPa, corresponding to about 4-km depth.Lower-temperature (510–300°C) and moderate- to low-salinity (23–2 wt.% eq. NaCl) aqueous fluids are recordedin garnet and epidote of the end of the prograde stage. Themicrothermometric data (Th from 513°C to 318°C andsalinity from 1.0 to 23 wt.% eq. NaCl) and δ18O valuesbetween 6.2‰ and 11.5‰ for gold-bearing milky quartzfrom the retrograde stage suggest that the ore-forming fluidwas dominantly magmatic. Pressures during the earlyretrograde stage were in the range of 50–100 MPa, in linewith the evidence for CO2 effervescence and probable localboiling. The dominance of magmatic low-saline to moder-ately saline oxidizing fluids during the retrograde stage isconsistent with the depth of the skarn system, which couldhave delayed the ingression of external fluids untilrelatively low temperatures were reached. The resultinglow water-to-rock ratios explain the weak retrogradealteration and the compositional variability of chlorite,essentially controlled by host rock compositions. Gold wasprecipitated at this stage as a result of cooling and pHincrease related to CO2 effervescence, which both result indestabilization of gold-bearing chloride complexes. Signif-icant ingression of external fluids took place after golddeposition only, as recorded by δ18O values of 0.4‰ to6.2‰ for fluids depositing quartz (below 350°C) in sulfide-rich barren veins. Low-temperature (<300°C) meteoricfluids (δ18Owater between −10.0‰ and −2.0‰) are respon-sible for the precipitation of late comb quartz and calcite incavities and veins and indicate mixing with cooler fluids ofhigher salinities (about 100°C and 25 wt.% eq. NaCl). Thelatter are similar to low-temperature fluids (202–74.5°C)
Miner Deposita (2009) 44:389–413DOI 10.1007/s00126-009-0238-2
Editorial handling: B. Lehmann
J. Vallance (*) : L. Fontboté :M. Chiaradia : S. SchmidtSection des Sciences de la Terre et de l’Environnement,Université de Genève,Rue des Maraîchers 13, 1205,Geneva, Switzerlande-mail: [email protected]
J. VallancePan American Silver Peru SAC,Av. La Floresta 497, Of. 301, Chacarilla del Estanque, San Borja,Lima, Peru
A. MarkowskiIsotopengeologie und Mineralische Rohstoffe, ETH-Zentrum,C61.1, Sonneggstrasse 5, 8092,Zurich, Switzerland
T. VennemannInstitut de Minéralogie et Géochimie, Université de Lausanne,L’Anthropôle,1015 Lausanne, Switzerland
with δ18O values of −0.5‰ to 3.1‰ and salinities in therange of 21.1 to 17.3 wt.% eq. CaCl2, trapped in calcite oflate veins and interpreted as basinal brines. Nambijarepresents a deep equivalent of the oxidized gold skarnclass, the presence of CO2 in the fluids being partly aconsequence of the relatively deep setting at about 4-kmdepth. As in other Au-bearing skarn deposits, not only theprograde stage but also the gold-precipitating retrogradestage is dominated by fluids of magmatic origin.
Keywords Gold . Skarn . Aqueous-carbonic fluids .
Oxygen isotope . Chlorite . Nambija . Ecuador
Introduction
Skarns are an important source of gold either as the maincommodity or as a by-product. Skarns from which gold isextracted as the unique or main commodity are known asgold skarns (e.g., Meinert 2000) and have been subdividedinto reduced, oxidized, magnesian, and metamorphic typesaccording to the mineralogy of the dominant silicate phase(characterized either by Fe2+, Fe3+, or Mg2+) or thegeological context (e.g., metamorphism-related for meta-morphic gold skarns). The majority of gold productionfrom skarns is derived from oxidized skarns in which goldis mined as a by-product of copper. Most of these skarnscontain <1 g/t Au, although in Cu-rich ores Au can reachhigher grades (Meinert 2000). Few detailed fluid inclusionsstudies on the fluid evolution in oxidized gold skarn depositsare, however, available in the literature (e.g., Mc Coy andWabu gold skarns, Brooks et al. 1991; Brooks 1994; Allenand Aslund 1998).
The Nambija oxidized gold skarn district is one of themain gold producers of Ecuador (see Chiaradia et al. 2009)and is economically and scientifically interesting because ofa high average gold grade of 15 g/t Au, with some orezones having grades as high as 300 g/t Au. These featuresset Nambija apart from most oxidized gold skarns and haveprompted this detailed study of the physicochemicalevolution of the ore fluids in the skarns.
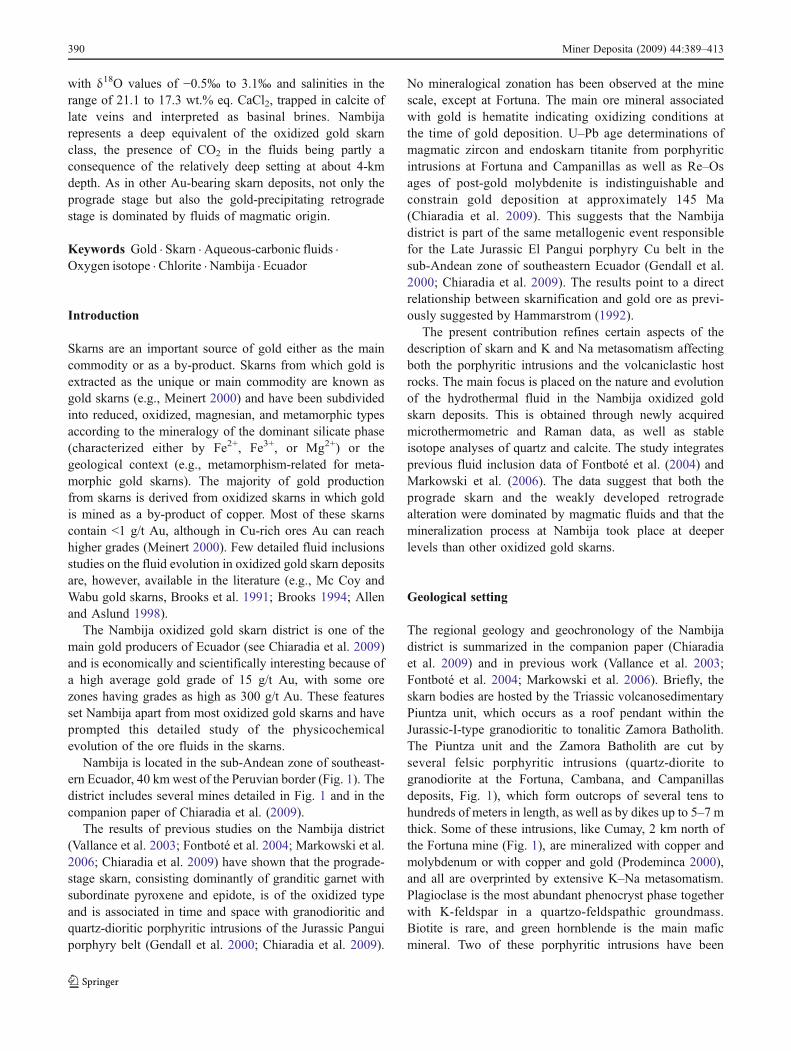
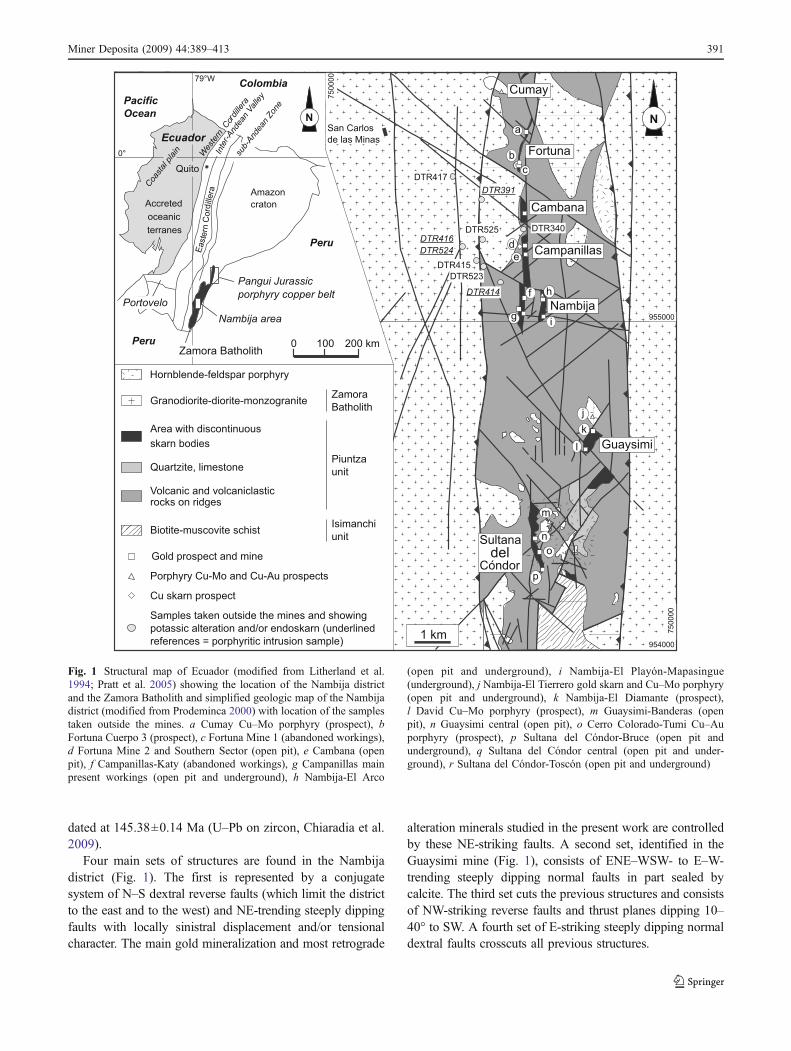
Nambija is located in the sub-Andean zone of southeast-ern Ecuador, 40 km west of the Peruvian border (Fig. 1). Thedistrict includes several mines detailed in Fig. 1 and in thecompanion paper of Chiaradia et al. (2009).
The results of previous studies on the Nambija district(Vallance et al. 2003; Fontboté et al. 2004; Markowski et al.2006; Chiaradia et al. 2009) have shown that the prograde-stage skarn, consisting dominantly of granditic garnet withsubordinate pyroxene and epidote, is of the oxidized typeand is associated in time and space with granodioritic andquartz-dioritic porphyritic intrusions of the Jurassic Panguiporphyry belt (Gendall et al. 2000; Chiaradia et al. 2009).
No mineralogical zonation has been observed at the minescale, except at Fortuna. The main ore mineral associatedwith gold is hematite indicating oxidizing conditions atthe time of gold deposition. U–Pb age determinations ofmagmatic zircon and endoskarn titanite from porphyriticintrusions at Fortuna and Campanillas as well as Re–Osages of post-gold molybdenite is indistinguishable andconstrain gold deposition at approximately 145 Ma(Chiaradia et al. 2009). This suggests that the Nambijadistrict is part of the same metallogenic event responsiblefor the Late Jurassic El Pangui porphyry Cu belt in thesub-Andean zone of southeastern Ecuador (Gendall et al.2000; Chiaradia et al. 2009). The results point to a directrelationship between skarnification and gold ore as previ-ously suggested by Hammarstrom (1992).
The present contribution refines certain aspects of thedescription of skarn and K and Na metasomatism affectingboth the porphyritic intrusions and the volcaniclastic hostrocks. The main focus is placed on the nature and evolutionof the hydrothermal fluid in the Nambija oxidized goldskarn deposits. This is obtained through newly acquiredmicrothermometric and Raman data, as well as stableisotope analyses of quartz and calcite. The study integratesprevious fluid inclusion data of Fontboté et al. (2004) andMarkowski et al. (2006). The data suggest that both theprograde skarn and the weakly developed retrogradealteration were dominated by magmatic fluids and that themineralization process at Nambija took place at deeperlevels than other oxidized gold skarns.
Geological setting
The regional geology and geochronology of the Nambijadistrict is summarized in the companion paper (Chiaradiaet al. 2009) and in previous work (Vallance et al. 2003;Fontboté et al. 2004; Markowski et al. 2006). Briefly, theskarn bodies are hosted by the Triassic volcanosedimentaryPiuntza unit, which occurs as a roof pendant within theJurassic-I-type granodioritic to tonalitic Zamora Batholith.The Piuntza unit and the Zamora Batholith are cut byseveral felsic porphyritic intrusions (quartz-diorite togranodiorite at the Fortuna, Cambana, and Campanillasdeposits, Fig. 1), which form outcrops of several tens tohundreds of meters in length, as well as by dikes up to 5–7 mthick. Some of these intrusions, like Cumay, 2 km north ofthe Fortuna mine (Fig. 1), are mineralized with copper andmolybdenum or with copper and gold (Prodeminca 2000),and all are overprinted by extensive K–Na metasomatism.Plagioclase is the most abundant phenocryst phase togetherwith K-feldspar in a quartzo-feldspathic groundmass.Biotite is rare, and green hornblende is the main maficmineral. Two of these porphyritic intrusions have been
390 Miner Deposita (2009) 44:389–413
dated at 145.38±0.14 Ma (U–Pb on zircon, Chiaradia et al.2009).
Four main sets of structures are found in the Nambijadistrict (Fig. 1). The first is represented by a conjugatesystem of N–S dextral reverse faults (which limit the districtto the east and to the west) and NE-trending steeply dippingfaults with locally sinistral displacement and/or tensionalcharacter. The main gold mineralization and most retrograde
alteration minerals studied in the present work are controlledby these NE-striking faults. A second set, identified in theGuaysimi mine (Fig. 1), consists of ENE–WSW- to E–W-trending steeply dipping normal faults in part sealed bycalcite. The third set cuts the previous structures and consistsof NW-striking reverse faults and thrust planes dipping 10–40° to SW. A fourth set of E-striking steeply dipping normaldextral faults crosscuts all previous structures.
1 km
Campanillas
Nambija
Guaysimi
Cambana
NSan Carlosde las Minas
a
bc
de
f
j
k
l
m
n
Cumay
Fortuna
DTR414
DTR415
DTR416
DTR391
DTR417
DTR340
h
o
p
Hornblende-feldspar porphyry
Area with discontinuous
skarn bodies
Quartzite, limestone
Volcanic and volcaniclasticrocks on ridges
Piuntzaunit
Biotite-muscovite schistIsimanchiunit
Gold prospect and mine
ZamoraBatholith
Granodiorite-diorite-monzogranite
Porphyry Cu-Mo and Cu-Au prospects
Samples taken outside the mines and showingpotassic alteration and/or endoskarn (underlinedreferences = porphyritic intrusion sample)
955000
954000
75
00
00
75
00
00
DTR523
DTR525
DTR524
0 100 200 km
PiÒon
Zamora Batholith
Amazoncraton
Nambija area
Pangui Jurassic
porphyry copper belt
Accreted
oceanic
terranes
Quito
Wes
tern
Cor
dille
ra
Inte
r-And
ean
Val
ley
Colombia
Ecuador
Peru
Peru
Pacific
Ocean N
Coa
stal
pla
in sub-
And
ean
Zon
e
Portovelo
ig
0°
79°W
Eas
tern
Cor
d ille
ra
Cu skarn prospect
Condor`
Sultanadel
Fig. 1 Structural map of Ecuador (modified from Litherland et al.1994; Pratt et al. 2005) showing the location of the Nambija districtand the Zamora Batholith and simplified geologic map of the Nambijadistrict (modified from Prodeminca 2000) with location of the samplestaken outside the mines. a Cumay Cu–Mo porphyry (prospect), bFortuna Cuerpo 3 (prospect), c Fortuna Mine 1 (abandoned workings),d Fortuna Mine 2 and Southern Sector (open pit), e Cambana (openpit), f Campanillas-Katy (abandoned workings), g Campanillas mainpresent workings (open pit and underground), h Nambija-El Arco
(open pit and underground), i Nambija-El Playón-Mapasingue(underground), j Nambija-El Tierrero gold skarn and Cu–Mo porphyry(open pit and underground), k Nambija-El Diamante (prospect),l David Cu–Mo porphyry (prospect), m Guaysimi-Banderas (openpit), n Guaysimi central (open pit), o Cerro Colorado-Tumi Cu–Auporphyry (prospect), p Sultana del Cóndor-Bruce (open pit andunderground), q Sultana del Cóndor central (open pit and under-ground), r Sultana del Cóndor-Toscón (open pit and underground)
Miner Deposita (2009) 44:389–413 391
Analytical methods
Microthermometric analyses were made on 70- to 100-µm-thick doubly polished rock sections. A Linkam THMSG600heating and freezing stage mounted on a DMLB Leicamicroscope equipped with a Nikon ×100 long-working-distance lens was used for the microthermometric measure-ments, as described by Shepherd (1981). The system wascalibrated with synthetic fluid inclusions at −56.6°C, 0.0°C,and 374.1°C (Sterner and Bodnar 1984). Low-temperaturemeasurements have an uncertainty of ±0.1°C, whereashigh-temperature measurements have a precision of ±1°C.Salinities were calculated in the NaCl–H2O system fromfinal ice melting temperatures between 0.0°C and −21.1°C,using equations published in Bodnar and Vityk (1994) andin the CaCl2–H2O system for ice melting temperaturesbelow −21.1°C with a eutectic around −52°C, using theequation of Oakes et al. (1990). Salinities of halite-bearing(±sylvite-bearing) inclusions were calculated using theequation of Sterner et al. (1988) and the computer programAqSo1e of Bakker and Brown (2003). Bulk compositionsand isochores of aqueous-carbonic fluid inclusions weremodeled with the ICE, Q2, NOSALT, BULK, and ISOCcomputer programs of Bakker and Brown (2003).
Raman measurements were conducted using a Jobin-Yvon Labram Raman microprobe with a modified Olympusmicroscope. Raman spectra were recorded using an incidentlaser wavelength of 532 nm from a Coherent DPSS 534neodymium-doped yttrium aluminum garnet laser followingthe procedures of Dubessy et al. (1989) and Burke (2001).
Chlorites were analyzed at the Institute of Mineralogyand Geochemistry of Lausanne (Switzerland) on a CamecaCamebax SX 50 electron microprobe using a 15-nA beamcurrent and a 15-kV acceleration voltage.
Oxygen isotope analyses were made at the Institute ofMineralogy and Geochemistry of Lausanne in Switzerland.The oxygen isotope composition (16O, 18O) of the quartzsamples were measured using a method similar to thatdescribed by Sharp (1990) and Rumble and Hoering (1994)and that is described in more detail in Kasemann et al.(2001). Between 0.5 and 2 mg of sample was loaded onto asmall Pt sample holder and pumped out to a vacuum ofabout 10−6 mbar. After prefluorination of the samplechamber overnight, the samples were heated with a CO2
laser in 50 mbar of pure F2. Excess F2 was separated fromthe O2 produced by conversion to Cl2 using KCl held at150°C. The extracted O2 was collected on a molecular sieve(13×) and subsequently expanded into the inlet of a FinniganMAT 253 isotope ratio mass spectrometer. Oxygen isotopecompositions are given in the standard δ notation, expressedrelative to the Vienna Standard Mean Ocean Water in permill (‰). Replicate oxygen isotope analyses of the standardused (Ls-1 Qtz, n=6) had an average precision of ±0.08‰
(one sigma) for δ18O. The accuracy of δ18O values iscommonly better than 0.2‰ compared to accepted δ18Ovalues for NBS-28 of 9.64‰ and UWG-2 of 5.8‰ (Valleyet al. 1995). The C– and O– isotope composition of thecarbonates was measured with a GasBench II connected to aFinnigan MAT DeltaPlus XL mass spectrometer, using a He-carrier gas system according to a method adapted after Spoetland Vennemann (2003). Sample values were normalizedusing an in-house standard calibrated against δ13C and δ18Ovalues of NBS-19 (+1.95‰ and −2.20‰, relative to ViennaPeeDee Belemnite (VPDB)). External reproducibility for theanalyses estimated from replicate analyses of the in-housestandard (n=6) is ±0.07‰ for δ13C and 0.08‰ for δ18O.
Skarns and gold quartz veins in the Nambija district
Exoskarn and endoskarn have replaced the Piuntza unitlithologies and the outer parts of the porphyritic intrusions,respectively. The endoskarn shows a gradual transition toan inner potassic alteration zone within the porphyriticintrusions, whereas the garnet-pyroxene exoskarn gradesinto an outer zone of K and Na metasomatism affecting thePiuntza unit volcanosedimentary rocks.
Endoskarn in porphyritic intrusion and inner potassicalteration
An endoskarn consisting of K-feldspar, actinolite, diopside,Na-rich plagioclase, titanite, quartz, apatite, and pyrite occursat the margins of the porphyritic quartz-diorite intrusion atFortuna (Markowski et al. 2006). Na-rich plagioclase andpotassium feldspar have replaced the groundmass (up to5.3 wt.% Na2O and 3.6 wt.% K2O) and the cores of the Ca-rich plagioclase phenocrysts. Hornblende has generally notbeen replaced except very locally where it is replaced byactinolite and very minor diopside. The best-studied examplewith inner potassic alteration occurs at Fortuna, where themain alteration assemblage consists of K-feldspar + titaniteand subordinate biotite + magnetite. K2O concentrationscan be as high as 4.8 wt.%. Potassic feldspar typically hasreplaced most of the groundmass and forms overgrowthson the plagioclase phenocrysts, occasionally completelyreplacing it. Hornblende is mostly unaltered, only locallyhaving been replaced by K-feldspar + titanite and sub-ordinately by biotite + magnetite and/or titanite.
Quartz ± K-feldspar veins up to 1 cm thick occur in theporphyritic quartz-diorite intrusion at Fortuna (Fig. 3) andhave a low sulfide (pyrite only) content (<1%). These veinsshow similar features to the “B veins” of porphyry systems(nomenclature of Gustafson and Hunt 1975) but are morecontinuous because they can be followed for several metersalong an average NE–SW orientation with steep dips. The
392 Miner Deposita (2009) 44:389–413
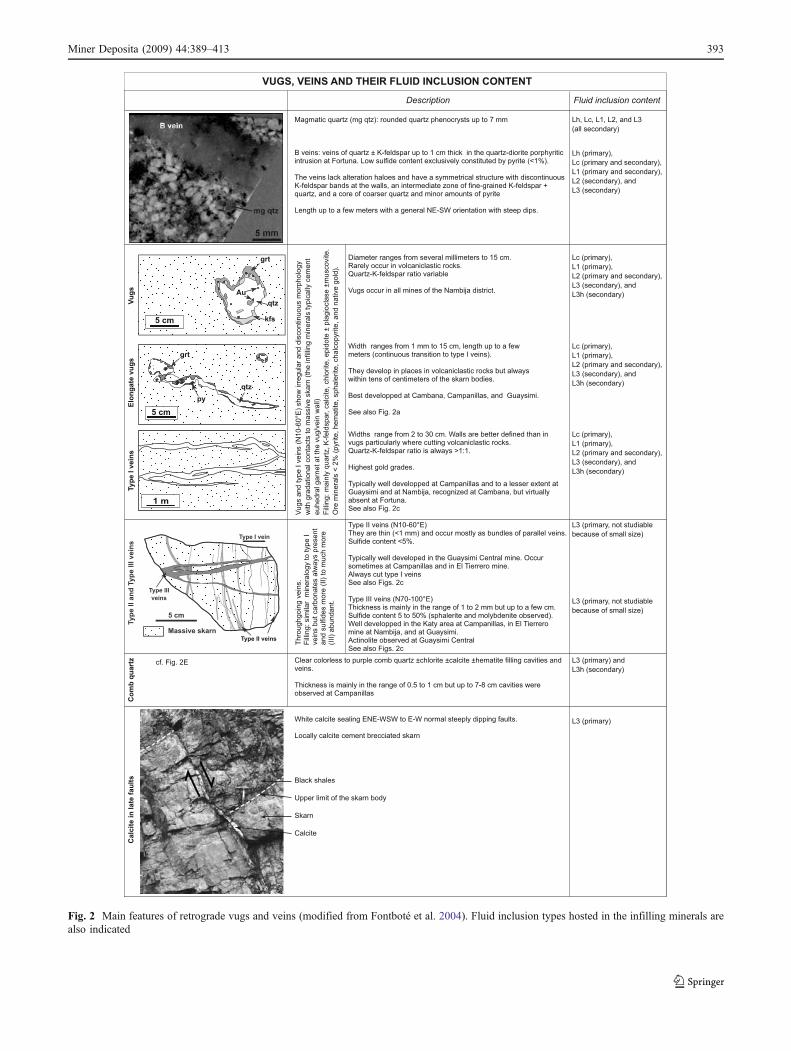
Diameter ranges from several millimeters to 15 cm.Rarely occur in volcaniclastic rocks.Quartz-K-feldspar ratio variable
Vugs occur in all mines of the Nambija district.
Width ranges from 1 mm to 15 cm, length up to a fewmeters (continuous transition to type I veins).
They develop in places in volcaniclastic rocks but alwayswithin tens of centimeters of the skarn bodies.
Best developped at Cambana, Campanillas, and Guaysimi.
See also Fig. 2a
Widths range from 2 to 30 cm. Walls are better defined than invugs particularly where cutting volcaniclastic rocks.Quartz-K-feldspar ratio is always >1:1.
Highest gold grades.
Typically well developped at Campanillas and to a lesser extent atGuaysimi and at Nambija, recognized at Cambana, but virtuallyabsent at Fortuna.See also Fig. 2c
Ty
pe
I v
ein
s
1 m
Vu
gs
Au
5 cm
grt
qtz
kfs
Elo
ng
ate
vu
gs
5 cm
py
grt
qtz
Vu
gs
an
d t
ype
I v
ein
s (N
10
-60
°E)
sho
w ir
reg
ula
r a
nd
dis
con
tinu
ou
s m
orp
ho
log
yw
ith g
rad
atio
na
l co
nta
cts
to m
ass
ive
ska
rn (
the
infil
ling
min
era
ls t
ypic
ally
ce
me
nt
eu
he
dra
l ga
rne
t a
t th
e v
ug
/ve
in w
all)
Fill
ing
: m
ain
ly q
ua
rtz,
K-f
eld
spa
r, c
alc
ite,
chlo
rite
, e
pid
ote
± p
lag
iocl
ase
±m
usc
ovi
te.
Ore
min
era
ls <
2%
(p
yrite
, h
em
atit
e,
sph
ale
rite
, ch
alc
op
yrite
, a
nd
na
tive
go
ld).
Fluid inclusion content
Magmatic quartz (mg qtz): rounded quartz phenocrysts up to 7 mm
B veins: veins of quartz ± K-feldspar up to 1 cm thick in the quartz-diorite porphyriticintrusion at Fortuna. Low sulfide content exclusively constituted by pyrite (<1%).
The veins lack alteration haloes and have a symmetrical structure with discontinuousK-feldspar bands at the walls, an intermediate zone of fine-grained K-feldspar + quartz, and a core of coarser quartz and minor amounts of pyrite
Length up to a few meters with a general NE-SW orientation with steep dips.
Description
Lh, Lc, L1, L2, and L3(all secondary)
Lc (primary),L1 (primary),L2 (primary and secondary),L3 (secondary), andL3h (secondary)
Lh (primary),Lc (primary and secondary),L1 (primary and secondary),L2 (secondary), andL3 (secondary)
Lc (primary),L1 (primary),L2 (primary and secondary),L3 (secondary), andL3h (secondary)
Lc (primary),L1 (primary),L2 (primary and secondary),L3 (secondary), andL3h (secondary)
Type II veins (N10-60°E)They are thin (<1 mm) and occur mostly as bundles of parallel veins.Sulfide content <5%.
Typically well developed in the Guaysimi Central mine. Occursometimes at Campanillas and in El Tierrero mine.Always cut type I veinsSee also Figs. 2c
Type III veins (N70-100°E)Thickness is mainly in the range of 1 to 2 mm but up to a few cm.Sulfide content 5 to 50% (sphalerite and molybdenite observed).Well developped in the Katy area at Campanillas, in El Tierreromine at Nambija, and at Guaysimi. Actinolite observed at Guaysimi CentralSee also Figs. 2c
Type II veins
Th
rou
gh
go
ing
ve
ins.
Fill
ing
: si
mila
r m
ine
ralo
gy
to t
ype
Ive
ins
bu
t ca
rbo
na
tes
alw
ays
pre
sen
ta
nd
su
lfid
es
mo
re (
II)
to m
uch
mo
re(I
II)
ab
un
da
nt.
Ca
lcit
e i
n l
ate
fa
ult
s
Clear colorless to purple comb quartz ±chlorite ±calcite ±hematite filling cavities andveins.
Thickness is mainly in the range of 0.5 to 1 cm but up to 7-8 cm cavities wereobserved at Campanillas
Co
mb
qu
art
z
1 cm
White calcite sealing ENE-WSW to E-W normal steeply dipping faults.
Locally calcite cement brecciated skarn
Skarn
Calcite
Black shales
Upper limit of the skarn body
L3 (primary, not studiablebecause of small size)
L3 (primary, not studiablebecause of small size)
L3 (primary) andL3h (secondary)
L3 (primary)
VUGS, VEINS AND THEIR FLUID INCLUSION CONTENT
cf. Fig. 2E
Fig. 2 Main features of retrograde vugs and veins (modified from Fontboté et al. 2004). Fluid inclusion types hosted in the infilling minerals arealso indicated
Miner Deposita (2009) 44:389–413 393
veins lack alteration haloes and have a symmetricalstructure with discontinuous K-feldspar bands at the walls,an intermediate zone of fine-grained K-feldspar + quartz,and a core of coarser quartz and minor amounts of pyrite.
At Campanillas, the endoskarn (although not completelyobliterating the original rock texture) is more developed,with hornblende replaced by diopside and titanite (euhedraland twinned grains up to 7 mm in size) and diopside thathas, in turn, been replaced by actinolite.
Garnet-pyroxene exoskarn and outer potassic-sodic alteration
The exoskarn occurs as massive, coarse-grained, andusually concordant bands that replaces mainly fine-grainedvolcaniclastic rocks (Fig. 2a). Less reactive or less permeablerock units such as quartzite, shale, and black shale aregenerally not skarnified. Carbonate rocks have only beenrecognized in drill core at the Nambija-El Diamante prospectand as a 30-cm-long and 5-cm-thick lens in massive garnetskarn at Guaysimi. At Fortuna, Markowski et al. (2006)recognized rare bioclasts.
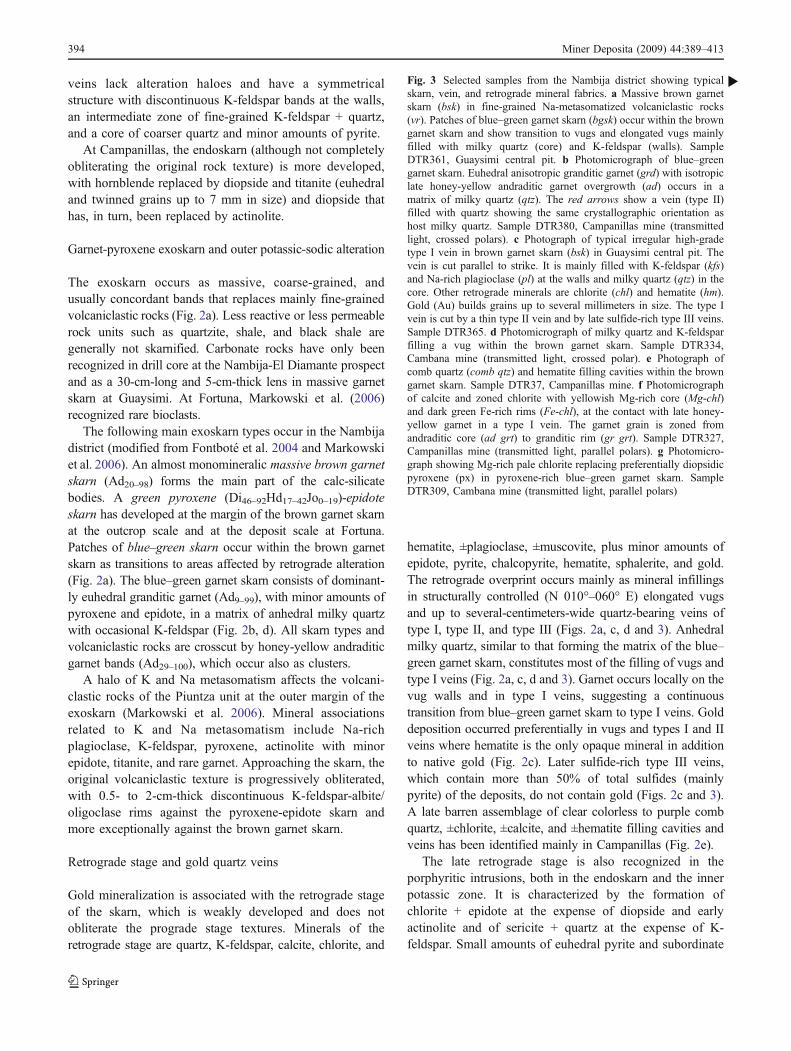
The following main exoskarn types occur in the Nambijadistrict (modified from Fontboté et al. 2004 and Markowskiet al. 2006). An almost monomineralic massive brown garnetskarn (Ad20–98) forms the main part of the calc-silicatebodies. A green pyroxene (Di46–92Hd17–42Jo0–19)-epidoteskarn has developed at the margin of the brown garnet skarnat the outcrop scale and at the deposit scale at Fortuna.Patches of blue–green skarn occur within the brown garnetskarn as transitions to areas affected by retrograde alteration(Fig. 2a). The blue–green garnet skarn consists of dominant-ly euhedral granditic garnet (Ad9–99), with minor amounts ofpyroxene and epidote, in a matrix of anhedral milky quartzwith occasional K-feldspar (Fig. 2b, d). All skarn types andvolcaniclastic rocks are crosscut by honey-yellow andraditicgarnet bands (Ad29–100), which occur also as clusters.
A halo of K and Na metasomatism affects the volcani-clastic rocks of the Piuntza unit at the outer margin of theexoskarn (Markowski et al. 2006). Mineral associationsrelated to K and Na metasomatism include Na-richplagioclase, K-feldspar, pyroxene, actinolite with minorepidote, titanite, and rare garnet. Approaching the skarn, theoriginal volcaniclastic texture is progressively obliterated,with 0.5- to 2-cm-thick discontinuous K-feldspar-albite/oligoclase rims against the pyroxene-epidote skarn andmore exceptionally against the brown garnet skarn.
Retrograde stage and gold quartz veins
Gold mineralization is associated with the retrograde stageof the skarn, which is weakly developed and does notobliterate the prograde stage textures. Minerals of theretrograde stage are quartz, K-feldspar, calcite, chlorite, and
hematite, ±plagioclase, ±muscovite, plus minor amounts ofepidote, pyrite, chalcopyrite, hematite, sphalerite, and gold.The retrograde overprint occurs mainly as mineral infillingsin structurally controlled (N 010°–060° E) elongated vugsand up to several-centimeters-wide quartz-bearing veins oftype I, type II, and type III (Figs. 2a, c, d and 3). Anhedralmilky quartz, similar to that forming the matrix of the blue–green garnet skarn, constitutes most of the filling of vugs andtype I veins (Fig. 2a, c, d and 3). Garnet occurs locally on thevug walls and in type I veins, suggesting a continuoustransition from blue–green garnet skarn to type I veins. Golddeposition occurred preferentially in vugs and types I and IIveins where hematite is the only opaque mineral in additionto native gold (Fig. 2c). Later sulfide-rich type III veins,which contain more than 50% of total sulfides (mainlypyrite) of the deposits, do not contain gold (Figs. 2c and 3).A late barren assemblage of clear colorless to purple combquartz, ±chlorite, ±calcite, and ±hematite filling cavities andveins has been identified mainly in Campanillas (Fig. 2e).
The late retrograde stage is also recognized in theporphyritic intrusions, both in the endoskarn and the innerpotassic zone. It is characterized by the formation ofchlorite + epidote at the expense of diopside and earlyactinolite and of sericite + quartz at the expense of K-feldspar. Small amounts of euhedral pyrite and subordinate
Fig. 3 Selected samples from the Nambija district showing typicalskarn, vein, and retrograde mineral fabrics. a Massive brown garnetskarn (bsk) in fine-grained Na-metasomatized volcaniclastic rocks(vr). Patches of blue–green garnet skarn (bgsk) occur within the browngarnet skarn and show transition to vugs and elongated vugs mainlyfilled with milky quartz (core) and K-feldspar (walls). SampleDTR361, Guaysimi central pit. b Photomicrograph of blue–greengarnet skarn. Euhedral anisotropic granditic garnet (grd) with isotropiclate honey-yellow andraditic garnet overgrowth (ad) occurs in amatrix of milky quartz (qtz). The red arrows show a vein (type II)filled with quartz showing the same crystallographic orientation ashost milky quartz. Sample DTR380, Campanillas mine (transmittedlight, crossed polars). c Photograph of typical irregular high-gradetype I vein in brown garnet skarn (bsk) in Guaysimi central pit. Thevein is cut parallel to strike. It is mainly filled with K-feldspar (kfs)and Na-rich plagioclase (pl) at the walls and milky quartz (qtz) in thecore. Other retrograde minerals are chlorite (chl) and hematite (hm).Gold (Au) builds grains up to several millimeters in size. The type Ivein is cut by a thin type II vein and by late sulfide-rich type III veins.Sample DTR365. d Photomicrograph of milky quartz and K-feldsparfilling a vug within the brown garnet skarn. Sample DTR334,Cambana mine (transmitted light, crossed polar). e Photograph ofcomb quartz (comb qtz) and hematite filling cavities within the browngarnet skarn. Sample DTR37, Campanillas mine. f Photomicrographof calcite and zoned chlorite with yellowish Mg-rich core (Mg-chl)and dark green Fe-rich rims (Fe-chl), at the contact with late honey-yellow garnet in a type I vein. The garnet grain is zoned fromandraditic core (ad grt) to granditic rim (gr grt). Sample DTR327,Campanillas mine (transmitted light, parallel polars). g Photomicro-graph showing Mg-rich pale chlorite replacing preferentially diopsidicpyroxene (px) in pyroxene-rich blue–green garnet skarn. SampleDTR309, Cambana mine (transmitted light, parallel polars)
b
394 Miner Deposita (2009) 44:389–413
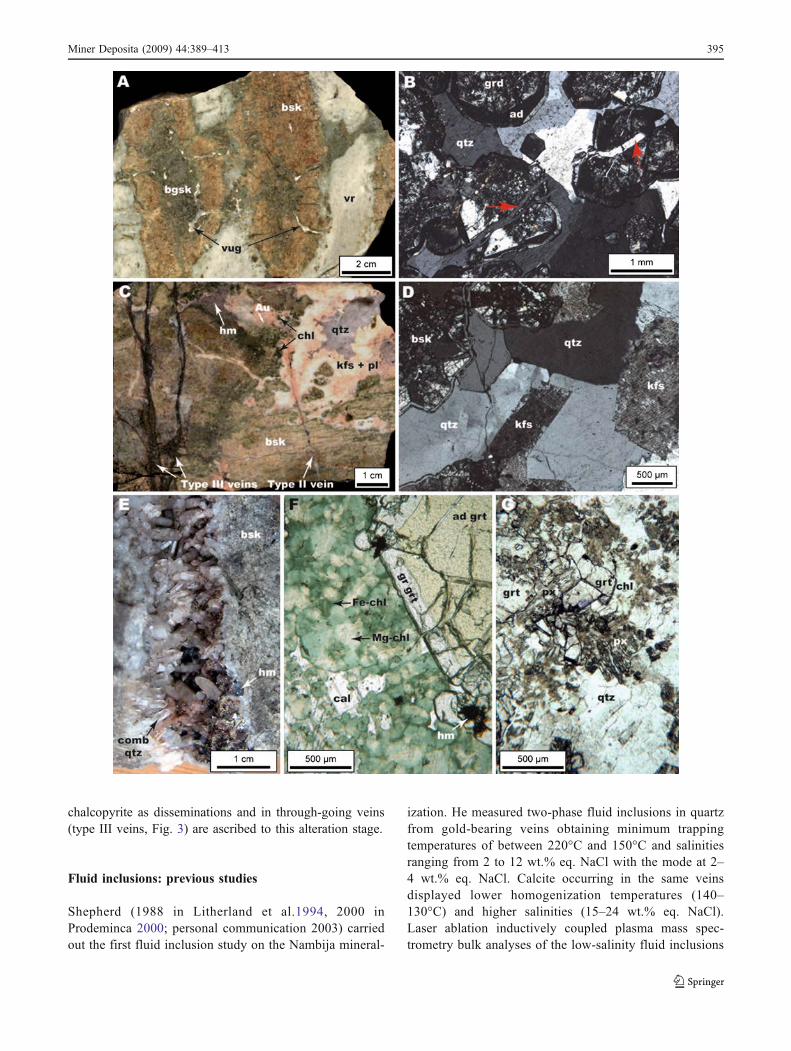
chalcopyrite as disseminations and in through-going veins(type III veins, Fig. 3) are ascribed to this alteration stage.
Fluid inclusions: previous studies
Shepherd (1988 in Litherland et al.1994, 2000 inProdeminca 2000; personal communication 2003) carriedout the first fluid inclusion study on the Nambija mineral-
ization. He measured two-phase fluid inclusions in quartzfrom gold-bearing veins obtaining minimum trappingtemperatures of between 220°C and 150°C and salinitiesranging from 2 to 12 wt.% eq. NaCl with the mode at 2–4 wt.% eq. NaCl. Calcite occurring in the same veinsdisplayed lower homogenization temperatures (140–130°C) and higher salinities (15–24 wt.% eq. NaCl).Laser ablation inductively coupled plasma mass spec-trometry bulk analyses of the low-salinity fluid inclusions
Miner Deposita (2009) 44:389–413 395
from molybdenite-bearing quartz veins (our type III veins)of El Tierrero mine indicate low Fe, Pb, and Zn contentswith, in places, presence of chalcopyrite grains (Shepherd2000 in Prodeminca 2000).
Fluid inclusions: results from this study
Data of 355 fluid inclusions are presented and discussed, ofwhich 85 are from the study of Markowski et al. (2006).Data were collected on fluid inclusions from skarn samples(n=244) and from magmatic quartz of the potassic alterationzone and/or endoskarn in the Campanillas (n=51) andFortuna (n=44) porphyritic intrusion, as well as from B veinsrelated to K-alteration at Fortuna (n=16). Part of the data sethas been preliminarily discussed by Fontboté et al. (2004).
Fluid inclusions of the skarn samples were investigatedin skarn minerals (pyroxene, garnet, epidote, quartz), incalcite from vugs and type I veins, and in calcite from latefaults of samples collected at Fortuna (n=85), Cambana (n=34), Campanillas (n=44), Nambija (n=19), and Guaysimi(n=62). Garnet of the dominant brown skarn is too opaque(in part due to the presence of titanium oxide needles) forfluid inclusion studies. No fluid inclusions could beanalyzed from type II and type III veins due to their smallsize (<3 µm).
In general, the fluid inclusions were difficult to characterizebecause they are both rare and small. An approach based on“Fluid inclusion assemblages” (Goldstein and Reynolds1994) could not be applied. In addition, aberrant minimaltemperature and trapping pressures and certain shapes (seebelow) suggest compositional and density re-equilibration.Despite these limitations, consistent fluid inclusion popula-tions could be identified by selecting the most reliable data,on which the present study is based.
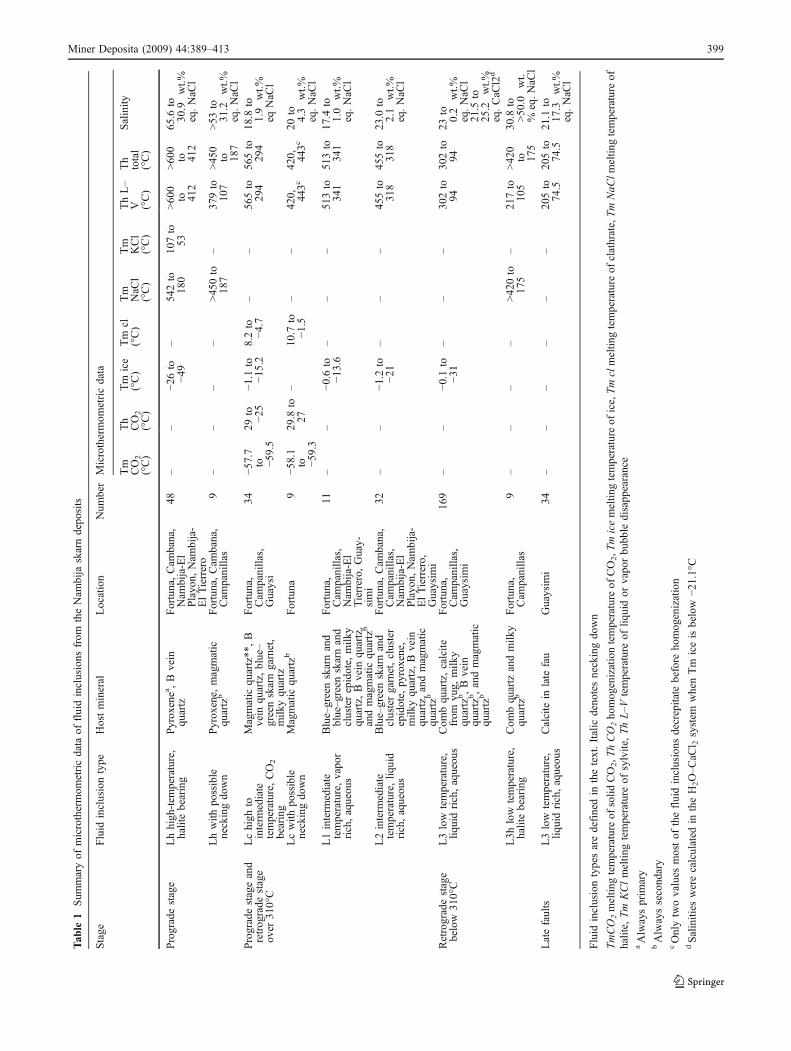
Fluid inclusions have been divided into five populations(Lh, Lc, L1, L2, and L3h) on the basis of host mineral,number of phases at room temperature, and microthermomet-ric and Raman analysis (Figs. 4 and 5 and Tables 1 and 2).Below, a detailed description of each one of these popula-tions is given.
Type Lh fluid inclusions
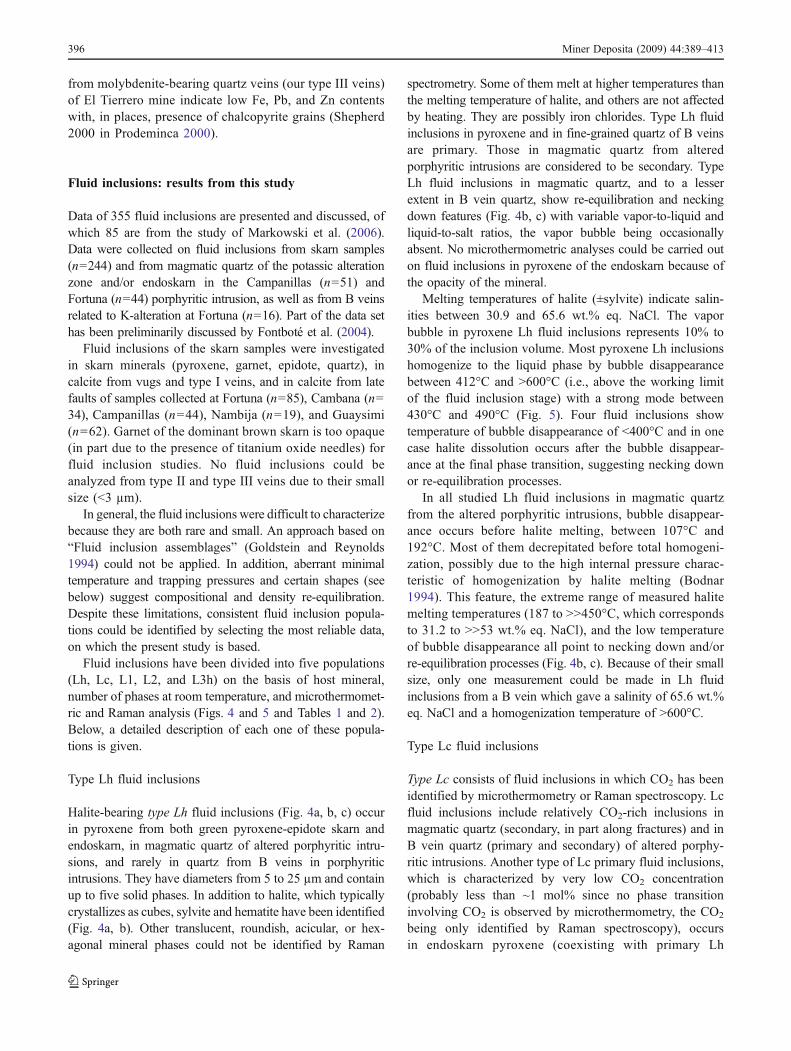
Halite-bearing type Lh fluid inclusions (Fig. 4a, b, c) occurin pyroxene from both green pyroxene-epidote skarn andendoskarn, in magmatic quartz of altered porphyritic intru-sions, and rarely in quartz from B veins in porphyriticintrusions. They have diameters from 5 to 25 µm and containup to five solid phases. In addition to halite, which typicallycrystallizes as cubes, sylvite and hematite have been identified(Fig. 4a, b). Other translucent, roundish, acicular, or hex-agonal mineral phases could not be identified by Raman
spectrometry. Some of them melt at higher temperatures thanthe melting temperature of halite, and others are not affectedby heating. They are possibly iron chlorides. Type Lh fluidinclusions in pyroxene and in fine-grained quartz of B veinsare primary. Those in magmatic quartz from alteredporphyritic intrusions are considered to be secondary. TypeLh fluid inclusions in magmatic quartz, and to a lesserextent in B vein quartz, show re-equilibration and neckingdown features (Fig. 4b, c) with variable vapor-to-liquid andliquid-to-salt ratios, the vapor bubble being occasionallyabsent. No microthermometric analyses could be carried outon fluid inclusions in pyroxene of the endoskarn because ofthe opacity of the mineral.
Melting temperatures of halite (±sylvite) indicate salin-ities between 30.9 and 65.6 wt.% eq. NaCl. The vaporbubble in pyroxene Lh fluid inclusions represents 10% to30% of the inclusion volume. Most pyroxene Lh inclusionshomogenize to the liquid phase by bubble disappearancebetween 412°C and >600°C (i.e., above the working limitof the fluid inclusion stage) with a strong mode between430°C and 490°C (Fig. 5). Four fluid inclusions showtemperature of bubble disappearance of <400°C and in onecase halite dissolution occurs after the bubble disappear-ance at the final phase transition, suggesting necking downor re-equilibration processes.
In all studied Lh fluid inclusions in magmatic quartzfrom the altered porphyritic intrusions, bubble disappear-ance occurs before halite melting, between 107°C and192°C. Most of them decrepitated before total homogeni-zation, possibly due to the high internal pressure charac-teristic of homogenization by halite melting (Bodnar1994). This feature, the extreme range of measured halitemelting temperatures (187 to >>450°C, which correspondsto 31.2 to >>53 wt.% eq. NaCl), and the low temperatureof bubble disappearance all point to necking down and/orre-equilibration processes (Fig. 4b, c). Because of their smallsize, only one measurement could be made in Lh fluidinclusions from a B vein which gave a salinity of 65.6 wt.%eq. NaCl and a homogenization temperature of >600°C.
Type Lc fluid inclusions
Type Lc consists of fluid inclusions in which CO2 has beenidentified by microthermometry or Raman spectroscopy. Lcfluid inclusions include relatively CO2-rich inclusions inmagmatic quartz (secondary, in part along fractures) and inB vein quartz (primary and secondary) of altered porphy-ritic intrusions. Another type of Lc primary fluid inclusions,which is characterized by very low CO2 concentration(probably less than ~1 mol% since no phase transitioninvolving CO2 is observed by microthermometry, the CO2
being only identified by Raman spectroscopy), occursin endoskarn pyroxene (coexisting with primary Lh
396 Miner Deposita (2009) 44:389–413
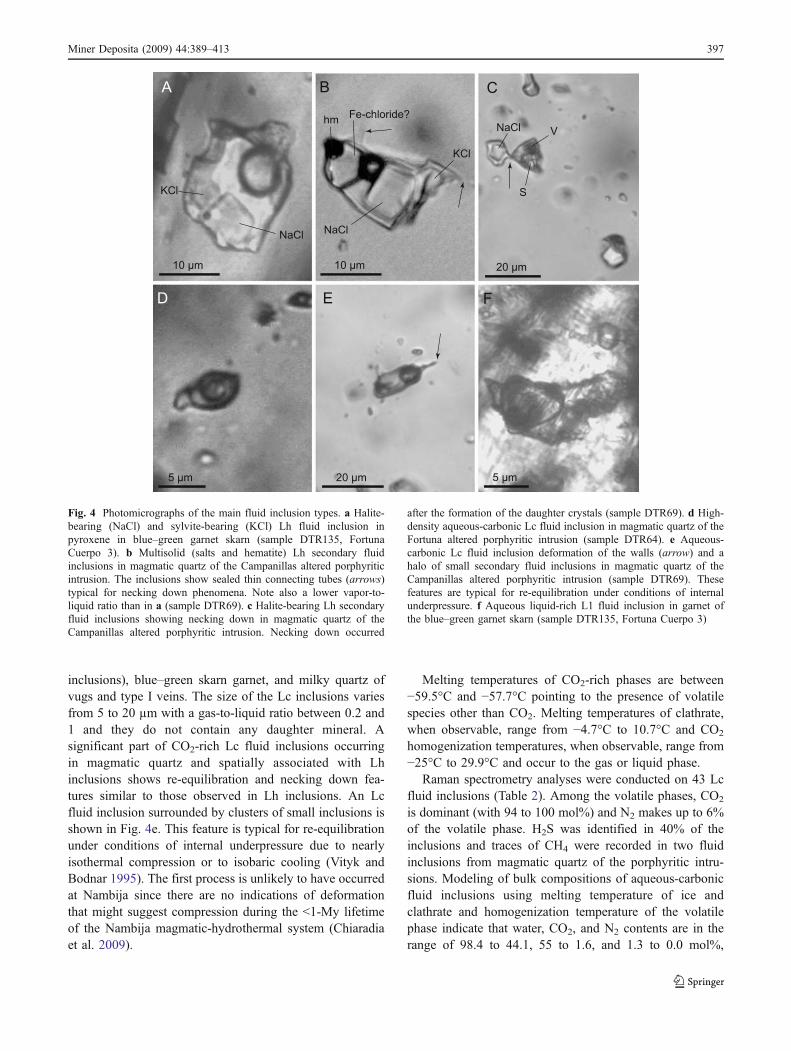
inclusions), blue–green skarn garnet, and milky quartz ofvugs and type I veins. The size of the Lc inclusions variesfrom 5 to 20 µm with a gas-to-liquid ratio between 0.2 and1 and they do not contain any daughter mineral. Asignificant part of CO2-rich Lc fluid inclusions occurringin magmatic quartz and spatially associated with Lhinclusions shows re-equilibration and necking down fea-tures similar to those observed in Lh inclusions. An Lcfluid inclusion surrounded by clusters of small inclusions isshown in Fig. 4e. This feature is typical for re-equilibrationunder conditions of internal underpressure due to nearlyisothermal compression or to isobaric cooling (Vityk andBodnar 1995). The first process is unlikely to have occurredat Nambija since there are no indications of deformationthat might suggest compression during the <1-My lifetimeof the Nambija magmatic-hydrothermal system (Chiaradiaet al. 2009).
Melting temperatures of CO2-rich phases are between−59.5°C and −57.7°C pointing to the presence of volatilespecies other than CO2. Melting temperatures of clathrate,when observable, range from −4.7°C to 10.7°C and CO2
homogenization temperatures, when observable, range from−25°C to 29.9°C and occur to the gas or liquid phase.
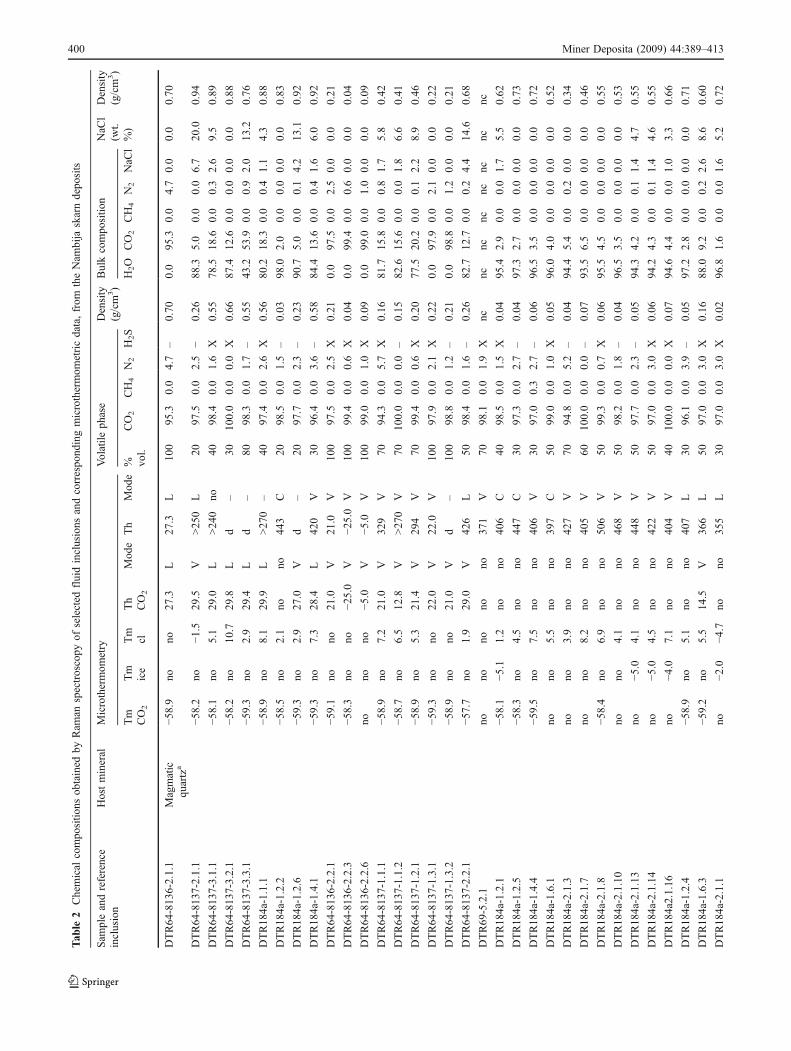
Raman spectrometry analyses were conducted on 43 Lcfluid inclusions (Table 2). Among the volatile phases, CO2
is dominant (with 94 to 100 mol%) and N2 makes up to 6%of the volatile phase. H2S was identified in 40% of theinclusions and traces of CH4 were recorded in two fluidinclusions from magmatic quartz of the porphyritic intru-sions. Modeling of bulk compositions of aqueous-carbonicfluid inclusions using melting temperature of ice andclathrate and homogenization temperature of the volatilephase indicate that water, CO2, and N2 contents are in therange of 98.4 to 44.1, 55 to 1.6, and 1.3 to 0.0 mol%,
10 µm
A
10 µm
B
20 µm
C
5 µm
D
20 µm
E
5 µm
F
NaCl
KCl
NaCl
KCl
Fe-chloride?hmNaCl
S
V
Fig. 4 Photomicrographs of the main fluid inclusion types. a Halite-bearing (NaCl) and sylvite-bearing (KCl) Lh fluid inclusion inpyroxene in blue–green garnet skarn (sample DTR135, FortunaCuerpo 3). b Multisolid (salts and hematite) Lh secondary fluidinclusions in magmatic quartz of the Campanillas altered porphyriticintrusion. The inclusions show sealed thin connecting tubes (arrows)typical for necking down phenomena. Note also a lower vapor-to-liquid ratio than in a (sample DTR69). c Halite-bearing Lh secondaryfluid inclusions showing necking down in magmatic quartz of theCampanillas altered porphyritic intrusion. Necking down occurred
after the formation of the daughter crystals (sample DTR69). d High-density aqueous-carbonic Lc fluid inclusion in magmatic quartz of theFortuna altered porphyritic intrusion (sample DTR64). e Aqueous-carbonic Lc fluid inclusion deformation of the walls (arrow) and ahalo of small secondary fluid inclusions in magmatic quartz of theCampanillas altered porphyritic intrusion (sample DTR69). Thesefeatures are typical for re-equilibration under conditions of internalunderpressure. f Aqueous liquid-rich L1 fluid inclusion in garnet ofthe blue–green garnet skarn (sample DTR135, Fortuna Cuerpo 3)
Miner Deposita (2009) 44:389–413 397
respectively, with salinities between 20 and 1.9 wt.% eq.NaCl. The bulk composition of type Lc fluid inclusions, forwhich not all microthermometric parameters could bemeasured because of low volatile content or poor con-ditions of observation, was calculated ignoring salts. TypeLc fluid inclusions affected by necking down in themagmatic quartz of the altered porphyritic intrusions showstrong dispersion of densities and CO2 contents, and mostof them decrepitate before homogenization. Total homog-enization occurs to the liquid, critical, or vapor phasebetween 565°C and 294°C. Fluid inclusions showing thehighest temperature homogenize to the vapor phase andoccur in magmatic quartz of the altered porphyritic
intrusions and in B veins. It should be noted that fluidinclusions showing re-equilibration features were ob-served only in the magmatic quartz and to a lesser extentin B veins and in pyroxene of the pyroxene-epidote skarn,i.e., re-equilibrated fluid inclusions appear to be the“oldest” and trapped at the highest temperatures.
Some Lc inclusions have CO2 contents so low that it wasonly identified by Raman spectroscopy. These CO2-poorinclusions do not show re-equilibration or necking downfeatures and frequently occur together with two-phaseaqueous fluid inclusions, in particular in garnet of the blue–green skarn, suggesting that there is a transition between Lcand L1/L2 fluid inclusions.
0
100
200
300
400
500
600
0 10 20 30 40 50 60
Salinity (wt% eq. NaCl)
Th
(°C
) Magmatic qtz (secondary)
qtz-kfs B vein
Pyroxene
Blue-green skarngarnet and epidote
honey-yellow clustergrt + ep
Milky quartz
Calcite in vugsand type I veins
Calcite in late faults
0
100
200
300
400
500
600
Th
(°C
)
L3 (low temperature,homogenization to vapor)
L3h (low temperature,halite-bearing)
Lh (halite-bearing)
Lc (CO2-bearing)
L1 (homogenization to liquid)
L2 (homogenization to vapor)
A
B
Comb quartz
Late honey-yellowgarnet
Blue-greenskarn garnet
*
wt% eq. CaCl2
Fig. 5 Binary plots of tempera-ture of liquid or vapor disap-pearance (Th) vs. salinity. aData ordered by fluid inclusionstype (nomenclature is explainedin the text). b Same data orderedby host mineral. Earlieraqueous-carbonic fluid inclu-sions are not presented as theirhigh internal density resultingfrom necking down leads todecrepitation before totalhomogenization. Asterisk, forthis field, the CaCl2 equivalentinstead of NaCl equivalent hasbeen plotted for fluid inclusionsin calcite, comb quartz, andsecondary fluid inclusions inmagmatic quartz of this field
398 Miner Deposita (2009) 44:389–413
Tab
le1
Sum
maryof
microthermom
etricdata
offluidinclusions
from
theNam
bija
skarndepo
sits
Stage
Fluid
inclusiontype
Hostmineral
Location
Num
ber
Microthermom
etricdata
Tm
CO2
(°C)
Th
CO2
(°C)
Tm
ice
(°C)
Tm
cl(°C)
Tm
NaC
l(°C)
Tm
KCl
(°C)
ThL–
V (°C)
Th
total
(°C)
Salinity
Progradestage
Lhhigh
-tem
perature,
halitebearing
Pyrox
enea,Bvein
quartz
Fortuna,Cam
bana,
Nam
bija-El
Playo
n,Nam
bija-
ElTierrero
48–
–−2
6to
−49
–54
2to
180
107to
53>60
0to 41
2
>60
0to 41
2
65.6
to30
.9wt.%
eq.NaC
l
Lhwith
possible
neckingdo
wn
Pyrox
ene,
magmatic
quartzb
Fortuna,Cam
bana,
Cam
panillas
9–
––
–>45
0to
187
–37
9to
107
>45
0to 18
7
>53
to31
.2wt.%
eq.NaC
lProgradestageand
retrog
rade
stage
over
310°C
Lchigh
tointerm
ediate
temperature,CO2
bearing
Magmatic
quartz**
,B
vein
quartz,blue–
greenskarngarnet,
milk
yqu
artz
Fortuna,
Cam
panillas,
Guaysi
34−5
7.7
to −59.5
29to −25
−1.1
to−1
5.2
8.2to
−4.7
––
565to
294
565to
294
18.8
to1.9
wt.%
eqNaC
l
Lcwith
possible
neckingdo
wn
Magmatic
quartzb
Fortuna
9−5
8.1
to −59.3
29.8
to27
–10
.7to
−1.5
––
420, 443c
420, 443c
20to
4.3
wt.%
eq.NaC
lL1interm
ediate
temperature,vapo
rrich,aqueou
s
Blue–greenskarnand
blue–g
reen
skarnand
clusterepidote,
milk
yqu
artz,Bvein
quartz,
andmagmatic
quartzb
Fortuna,
Cam
panillas,
Nam
bija-El
Tierrero,
Guay-
simi
11–
–−0
.6to
−13.6
––
–51
3to
341
513to
341
17.4
to1.0
wt.%
eq.NaC
l
L2interm
ediate
temperature,liq
uid
rich,aqueou
s
Blue–greenskarnand
clustergarnet,cluster
epidote,
pyroxene,
milk
yqu
artz,Bvein
quartz,andmagmatic
quartzb
Fortuna,Cam
bana,
Cam
panillas,
Nam
bija-El
Playo
n,Nam
bija-
ElTierrero,
Guaysim
i
32–
–−1
.2to
−21
––
–45
5to
318
455to
318
23.0
to2.1
wt.%
eq.NaC
l
Retrogradestage
below
310°C
L3low
temperature,
liquidrich,aqueou
sCom
bqu
artz,calcite
from
vug,
milk
yqu
artzb,Bvein
quartzb,andmagmatic
quartzb
Fortuna,
Cam
panillas,
Guaysim
i
169
––
−0.1
to−3
1–
––
302to
9430
2to
9423
to0.2
wt.%
eq.NaC
l21
.5to
25.2
wt.%
eq.CaC
l2d
L3h
low
temperature,
halitebearing
Com
bqu
artz
andmilk
yqu
artzb
Fortuna,
Cam
panillas
9–
––
–>42
0to
175
–21
7to
105
>42
0to 17
5
30.8
to>50
.0wt.
%eq.N
aCl
Latefaults
L3low
temperature,
liquidrich,aqueou
sCalcite
inlate
fau
Guaysim
i34
––
––
––
205to
74.5
205to
74.5
21.1
to17
.3wt.%
eq.NaC
l
Fluid
inclusiontypesaredefinedin
thetext.Italic
deno
tesneckingdo
wn
TmCO2meltin
gtemperature
ofsolid
CO2,T
hCO2ho
mog
enizationtemperature
ofCO2,T
micemeltin
gtemperature
ofice,Tmclmeltin
gtemperature
ofclathrate,TmNaC
lmeltin
gtemperature
ofhalite,
Tm
KClmeltin
gtemperature
ofsylvite,ThL–V
temperature
ofliq
uidor
vapo
rbu
bble
disapp
earance
aAlwaysprim
ary
bAlwayssecond
ary
cOnlytwovalues
mostof
thefluidinclusions
decrepitate
before
homog
enization
dSalinities
werecalculated
intheH2O–C
aCl 2system
whenTm
iceisbelow
−21.1°C
Miner Deposita (2009) 44:389–413 399
Tab
le2
Chemical
compo
sitio
nsob
tained
byRam
anspectroscopy
ofselected
fluidinclusions
andcorrespo
ndingmicrothermom
etricdata,from
theNam
bija
skarndepo
sits
Sam
pleandreference
inclusion
Hostmineral
Microthermom
etry
Volatile
phase
Density
(g/cm
3)
Bulkcompo
sitio
nNaC
l(w
t.%)
Density
(g/cm
3)
Tm
CO2
Tm
ice
Tm
clTh
CO2
Mod
eTh
Mod
e% vol.
CO2
CH4
N2
H2S
H2O
CO2
CH4
N2
NaC
l
DTR64
-813
6-2.1.1
Magmatic
quartza
−58.9
nono
27.3
L27
.3L
100
95.3
0.0
4.7
–0.70
0.0
95.3
0.0
4.7
0.0
0.0
0.70
DTR64
-813
7-2.1.1
−58.2
no−1
.529
.5V
>25
0L
2097
.50.0
2.5
−0.26
88.3
5.0
0.0
0.0
6.7
20.0
0.94
DTR64
-813
7-3.1.1
−58.1
no5.1
29.0
L>24
0no
4098
.40.0
1.6
X0.55
78.5
18.6
0.0
0.3
2.6
9.5
0.89
DTR64
-813
7-3.2.1
−58.2
no10
.729
.8L
d–
3010
0.0
0.0
0.0
X0.66
87.4
12.6
0.0
0.0
0.0
0.0
0.88
DTR64
-813
7-3.3.1
−59.3
no2.9
29.4
Ld
–80
98.3
0.0
1.7
–0.55
43.2
53.9
0.0
0.9
2.0
13.2
0.76
DTR18
4a-1.1.1
−58.9
no8.1
29.9
L>27
0–
4097
.40.0
2.6
X0.56
80.2
18.3
0.0
0.4
1.1
4.3
0.88
DTR18
4a-1.2.2
−58.5
no2.1
nono
443
C20
98.5
0.0
1.5
–0.03
98.0
2.0
0.0
0.0
0.0
0.0
0.83
DTR18
4a-1.2.6
−59.3
no2.9
27.0
Vd
–20
97.7
0.0
2.3
–0.23
90.7
5.0
0.0
0.1
4.2
13.1
0.92
DTR18
4a-1.4.1
−59.3
no7.3
28.4
L42
0V
3096
.40.0
3.6
–0.58
84.4
13.6
0.0
0.4
1.6
6.0
0.92
DTR64
-813
6-2.2.1
−59.1
nono
21.0
V21
.0V
100
97.5
0.0
2.5
X0.21
0.0
97.5
0.0
2.5
0.0
0.0
0.21
DTR64
-813
6-2.2.3
−58.3
nono
−25.0
V−2
5.0
V10
099
.40.0
0.6
X0.04
0.0
99.4
0.0
0.6
0.0
0.0
0.04
DTR64
-813
6-2.2.6
nono
no−5
.0V
−5.0
V10
099
.00.0
1.0
X0.09
0.0
99.0
0.0
1.0
0.0
0.0
0.09
DTR64
-813
7-1.1.1
−58.9
no7.2
21.0
V32
9V
7094
.30.0
5.7
X0.16
81.7
15.8
0.0
0.8
1.7
5.8
0.42
DTR64
-813
7-1.1.2
−58.7
no6.5
12.8
V>27
0V
7010
0.0
0.0
0.0
–0.15
82.6
15.6
0.0
0.0
1.8
6.6
0.41
DTR64
-813
7-1.2.1
−58.9
no5.3
21.4
V29
4V
7099
.40.0
0.6
X0.20
77.5
20.2
0.0
0.1
2.2
8.9
0.46
DTR64
-813
7-1.3.1
−59.3
nono
22.0
V22
.0V
100
97.9
0.0
2.1
X0.22
0.0
97.9
0.0
2.1
0.0
0.0
0.22
DTR64
-813
7-1.3.2
−58.9
nono
21.0
Vd
–10
098
.80.0
1.2
–0.21
0.0
98.8
0.0
1.2
0.0
0.0
0.21
DTR64
-813
7-2.2.1
−57.7
no1.9
29.0
V42
6L
5098
.40.0
1.6
–0.26
82.7
12.7
0.0
0.2
4.4
14.6
0.68
DTR69
-5.2.1
nono
nono
no37
1V
7098
.10.0
1.9
Xnc
ncnc
ncnc
ncnc
nc
DTR18
4a-1.2.1
−58.1
−5.1
1.2
nono
406
C40
98.5
0.0
1.5
X0.04
95.4
2.9
0.0
0.0
1.7
5.5
0.62
DTR18
4a-1.2.5
−58.3
no4.5
nono
447
C30
97.3
0.0
2.7
–0.04
97.3
2.7
0.0
0.0
0.0
0.0
0.73
DTR18
4a-1.4.4
− 59.5
no7.5
nono
406
V30
97.0
0.3
2.7
–0.06
96.5
3.5
0.0
0.0
0.0
0.0
0.72
DTR18
4a-1.6.1
nono
5.5
nono
397
C50
99.0
0.0
1.0
X0.05
96.0
4.0
0.0
0.0
0.0
0.0
0.52
DTR18
4a-2.1.3
nono
3.9
nono
427
V70
94.8
0.0
5.2
–0.04
94.4
5.4
0.0
0.2
0.0
0.0
0.34
DTR18
4a-2.1.7
nono
8.2
nono
405
V60
100.0
0.0
0.0
–0.07
93.5
6.5
0.0
0.0
0.0
0.0
0.46
DTR18
4a-2.1.8
−58.4
no6.9
nono
506
V50
99.3
0.0
0.7
X0.06
95.5
4.5
0.0
0.0
0.0
0.0
0.55
DTR18
4a-2.1.10
nono
4.1
nono
468
V50
98.2
0.0
1.8
–0.04
96.5
3.5
0.0
0.0
0.0
0.0
0.53
DTR18
4a-2.1.13
no−5
.04.1
nono
448
V50
97.7
0.0
2.3
–0.05
94.3
4.2
0.0
0.1
1.4
4.7
0.55
DTR18
4a-2.1.14
no−5
.04.5
nono
422
V50
97.0
0.0
3.0
X0.06
94.2
4.3
0.0
0.1
1.4
4.6
0.55
DTR18
4a2.1.16
no−4
.07.1
nono
404
V40
100.0
0.0
0.0
X0.07
94.6
4.4
0.0
0.0
1.0
3.3
0.66
DTR18
4a-1.2.4
−58.9
no5.1
nono
407
L30
96.1
0.0
3.9
–0.05
97.2
2.8
0.0
0.0
0.0
0.0
0.71
DTR18
4a-1.6.3
−59.2
no5.5
14.5
V36
6L
5097
.00.0
3.0
X0.16
88.0
9.2
0.0
0.2
2.6
8.6
0.60
DTR18
4a-2.1.1
no−2
.0−4
.7no
no35
5L
3097
.00.0
3.0
X0.02
96.8
1.6
0.0
0.0
1.6
5.2
0.72
400 Miner Deposita (2009) 44:389–413
Type L1 fluid inclusions
Type L1 fluid inclusions are vapor-rich two-phase aqueousfluid inclusions that homogenize to the vapor or critical phasebetween 513°C and 341°C. They occur in magmatic quartz ofthe altered porphyritic intrusions, in endoskarn pyroxene, inquartz of the B veins, in garnet and epidote from clusters andblue–green skarn, and in milky quartz of vugs and type Iveins. They are primary in garnet, epidote, and milky quartz ofvugs and type I veins and secondary in magmatic quartz of thealtered porphyritic intrusions. Salinities range from 17.4 to1.0 wt.% eq. NaCl and initial melting of ice below −21.1°Cindicates the presence of significant amounts of cations otherthan Na+. The highest homogenization temperatures andsalinities were encountered in blue–green skarn garnet.
Type L2 fluid inclusions
Type L2 fluid inclusions are two-phase liquid-rich aqueousfluid inclusions with vapor-to-liquid ratio between 0.2 and0.5 having homogenization temperatures to the liquid phasein the range of 455°C to 318°C and salinities in the range of23 to 2.1 wt.% eq. NaCl. They occur in magmatic quartz ofthe altered porphyritic intrusions, in B vein quartz, inpyroxene, in late garnet and epidote from clusters (Fig. 4f)and blue–green skarn, and in milky quartz of vugs and typeI veins. Type L2 fluid inclusions are primary in pyroxene,late garnet, and epidote from clusters (Fig. 4f) and blue–green skarn and in part in milky quartz of vugs and type Iveins. Type L2 fluid inclusions in magmatic quartz of thealtered porphyritic intrusions and most of those occurring inmilky quartz of vugs and type I veins are secondary.Occasionally, L2 fluid inclusions contain a translucent solidthat does not melt during heating and was identified ascalcite by Raman spectroscopy. Initial melting of ice below−21.1°C indicates the presence of significant amounts ofcations other than Na+.
Type L3 fluid inclusions
Type L3 are two-phase liquid-rich aqueous fluid inclusionswith low vapor content (vapor-to-liquid ratio around 0.05)and homogenization temperatures below 300°C. Theyconstitute the most abundant fluid inclusion type and occurin all fluid-inclusion-bearing minerals except calc-silicates.They are primary only in late comb quartz and in cavities-and vein-filling calcite as well as in calcite sealing latenormal faults. Type L3 fluid inclusions show initial meltingtemperature of ice below −21.1°C and up to −52°C, which isthe eutectic of the H2O–NaCl–CaCl2 system. Final meltingtemperatures of ice are between −31°C and −0.1°C.Salinities of fluid inclusions having melting temperatureof ice between −21.1°C and −31°C have been calculated inD
TR18
4b-1.4.1
no−7
.43.1
nono
413
V40
97.6
0.0
2.4
–0.06
93.8
3.7
0.0
0.1
2.4
7.8
0.66
DTR18
4b-1.4.2
no−4
.5−4
.7no
no41
4V
5098
.60.0
1.4
–0.02
96.3
2.1
0.0
0.0
1.6
5.2
0.52
DTR18
4b-1.4.3
no−5
.4−1
.4no
no>52
0V
4098
.20.0
1.8
–0.03
95.7
2.5
0.0
0.0
1.8
5.9
0.62
DTR18
4b-1.4.4
no3.5
nono
399
C40
100.0
0.0
0.0
–0.04
97.2
2.8
0.0
0.0
0.0
0.0
0.63
DTR18
4b-2.2.2
Bvein
quartz
−58.1
nono
nono
d–
100
96.4
0.0
3.6
–nc
0.0
96.4
0.0
3.6
0.0
0.0
nc
DTR18
4b-2.2.4
−58.0
nono
nono
d–
100
96.2
0.0
3.8
–nc
0.0
96.2
0.0
3.8
0.0
0.0
nc
DTR18
4b-2.2.5
−58.0
no3.7
5.0
V56
5V
5098
.40.0
1.6
–0.11
89.1
7.3
0.0
0.0
3.6
11.6
0.60
DTR13
6-3.1.3
BGSK
garnet
**no
−15.2
nono
no45
4L
3092
.70.0
7.3
–nc
ncnc
ncnc
nc18
.80.71
DTR36
5-2-2.1.11
milk
yqu
artz
no−1
.1no
nono
417
V60
94.0
0.0
6.0
–nc
ncnc
ncnc
nc1.9
0.48
DTR36
5-2-2.1.13
no−4
.2no
nono
400
V70
94.9
0.0
5.1
Xnc
ncnc
ncnc
nc.
6.7
0.57
Com
positio
nsaregivenin
molepercent.Allvalues
arein
degree
Celsius.C
O2detected
only
byRam
anspectroscopy.F
luid
inclusions
where
both
Tm
iceandThC
O2couldno
tbemeasuredhadto
bemod
eled
with
outelectrolytes
(i.e.,0wt.%
eq.NaC
l)
TmCO2meltin
gtemperature
ofsolid
CO2,T
hCO2ho
mog
enizationtemperature
ofCO2,T
micemeltin
gtemperature
ofice,Tmclmeltin
gtemperature
ofclathrate,Thho
mog
enizationtemperature,
Lliq
uid,
Ccritical,Vvapo
r.ItalicThvalues
decrepitatio
n,dno
n-ob
served
dueto
decrepitatio
n,no
notob
served,X
presence
ofH2S,n
cno
tcompu
tableandconsidered
asaqueou
sfluidinclusion
aAlwayssecond
ary
bBlue–greenskarngarnet
Miner Deposita (2009) 44:389–413 401
the H2O–CaCl2 system. Thus, salinities range from 23.5 to0.2 wt.% eq. NaCl and from 25.2 to 21.3 wt.% eq. CaCl2.Type L3 fluid inclusions homogenize to the liquid phase inthe range of 302°C to 74.5°C, the lowest Th and highestsalinities typically being found in calcite from late faults(Figs. 5 and 6). These L3 fluid inclusions are similar tothose analyzed by Shepherd (1988 in Litherland et al.,1994; 2000 in Prodeminca 2000; personal communication2003).
Halite-bearing (up to 30% in volume) two-phase liquid-rich aqueous fluid inclusions have been defined as subtypeL3h. They are recognized only at Fortuna and Campanillas,where they occur as primary fluid inclusions in comb quartzand in fractures together with L3 fluid inclusions, inmagmatic quartz of the altered porphyritic intrusions, and
in milky quartz of vugs and type I veins. Vapor-to-liquidratio is the same as in the L3 fluid inclusions (around 0.05).On heating, the vapor bubble disappears between 95°C and217°C and total homogenization occurs by halite dissolu-tion between 175°C and >420°C, which corresponds tosalinities between 30.8 and >50 wt.% eq. NaCl. Similar toLh inclusions in magmatic quartz of the altered porphyriticintrusions, most of the L3h fluid inclusions decrepitatebefore total halite dissolution due to internal overpressures.
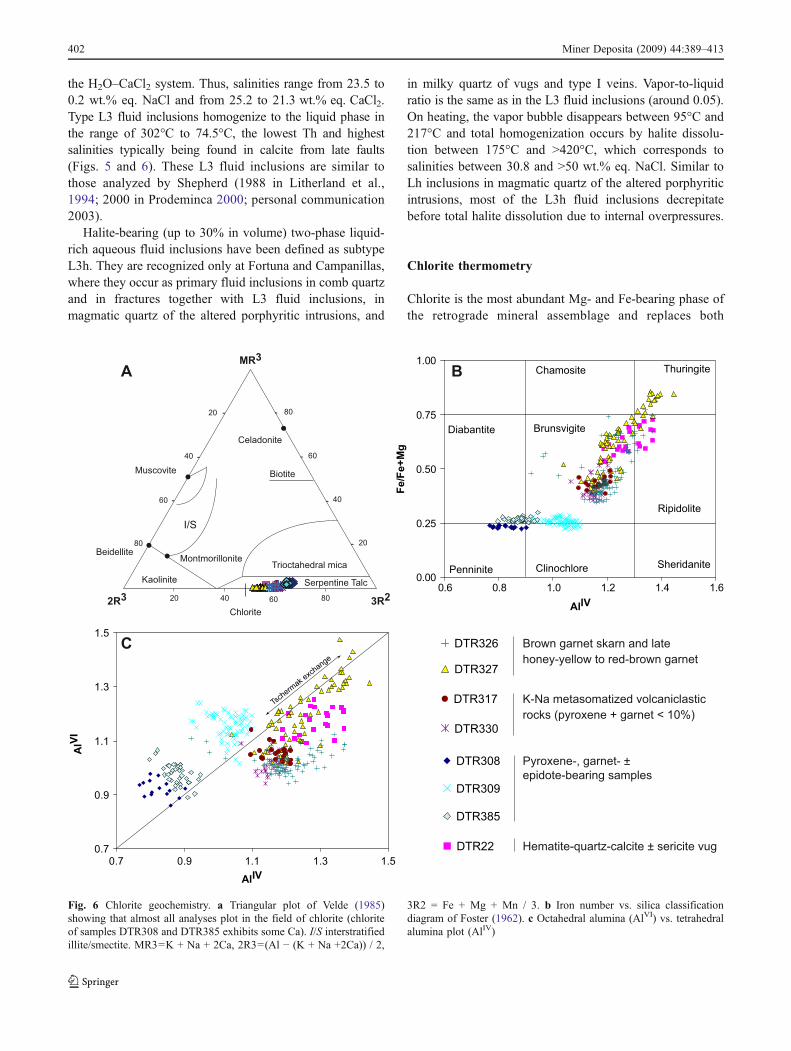
Chlorite thermometry
Chlorite is the most abundant Mg- and Fe-bearing phase ofthe retrograde mineral assemblage and replaces both
DTR327
DTR330
DTR317
DTR326 Brown garnet skarn and latehoney-yellow to red-brown garnet
K-Na metasomatized volcaniclasticrocks (pyroxene + garnet < 10%)
DTR308
DTR309
DTR385
Pyroxene-, garnet- ±epidote-bearing samples
DTR22 Hematite-quartz-calcite ± sericite vug
AlIV
Fe
/Fe
+M
g
ThuringiteChamosite
Ripidolite
SheridaniteClinochlorePenninite
BrunsvigiteDiabantite
B
0.00
0.25
0.75
1.00
0.6 0.8 1.0 1.4 1.61.2
0.50
0.7
0.9
1.1
1.3
1.5
0.7 0.9 1.1 1.3 1.5
AlIV
AlV
I
C
20
40
60
80 20
40
60
80
20 40 60 802R3 3R2
MR3
BeidelliteMontmorillonite
Celadonite
Chlorite
Serpentine Talc
BiotiteMuscovite
Kaolinite
Trioctahedral mica
I/S
A
Tsch
ermak e
xchange
Fig. 6 Chlorite geochemistry. a Triangular plot of Velde (1985)showing that almost all analyses plot in the field of chlorite (chloriteof samples DTR308 and DTR385 exhibits some Ca). I/S interstratifiedillite/smectite. MR3=K + Na + 2Ca, 2R3=(Al − (K + Na +2Ca)) / 2,
3R2 = Fe + Mg + Mn / 3. b Iron number vs. silica classificationdiagram of Foster (1962). c Octahedral alumina (AlVI) vs. tetrahedralalumina plot (AlIV)
402 Miner Deposita (2009) 44:389–413
pyroxene and garnet. It is finely intergrown with gold andcalcite, suggesting a coeval formation with the latter. Underthe optical microscope, the color of chlorite ranges frompale yellow to dark green reflecting variations in the Fecontent, as previously noted at Fortuna (Markowski et al.2006). Microprobe analyses were carried out on retrogradechlorite to calculate formation temperatures using chloritegeothermometers (Cathelineau 1988, Jowett 1991). To avoidcalcite contamination, only samples with relatively coarse-grained chlorite were selected from Cambana (DTR308,DTR309) and Campanillas (DTR22, DTR327, and DTR330;see Fig. 7 and Table 3). Chlorite structural formulae werecalculated on the basis of 14 oxygens.
In Velde’s (1985) diagram (Fig. 7a), all samples plots inthe chlorite field, except samples DTR308 and DTR385, inwhich Ca contents are up to 0.04 cations point to a smectitecomponent. In Foster’s (1962) diagram, two chlorite groupscan be distinguished on the basis of chlorite Fe number andthe occurrence of chlorite in association or not with pyroxene(Fig. 7):
– Chlorite in pyroxene-bearing samples (DTR308,DTR309, and DTR385) has low Fe numbers (0.22 to0.3) and relatively high silica content with no correla-
tion between Fe number and Si. Manganese contentvaries from 0.13 to 0.26 cations. Chlorite from samplesDTR308 and DTR385 contains up to 0.4 wt.% CaOindicating the presence of a smectite component.
– Chlorite in pyroxene-free samples with variable garnetcontents (DTR22, DTR317, DTR326, DTR327, andDTR330) has Fe numbers ranging from 0.35 to 0.86,with variations also within single grains (samplesDTR326 and DTR327; Figs. 2f and 7). The Fe numberscorrelate positively with tetrahedral alumina (AlIV).Manganese cation numbers vary from 0.62 to 3.10 andcorrelate weakly with iron and total alumina.
The same two groups are distinguished on the basis of theratio of AlVI to AlIV. In chlorite of pyroxene-free samples,Al distribution (Fig. 7c) is governed by the “Tschermakexchange” (MgVISiIV ⬄ AlVIAlIV). The pyroxene-bearingsamples DTR308 and DTR309, however, show a negativecorrelation between the tetrahedral and octahedral alumina(Fig. 7c), and tetrahedral Al distribution is a function ofvacancies in the octahedral site.
Cathelineau’s (1988) and Jowett’s (1991) geothermom-eters are based on the tetrahedral alumina content, which,in principle, increases with temperature. The chlorite
-10
-5
0
5
0 5 10 15 20 25 30
Igneous
calcite
Marine
limestone
Calcite in comb quartz cavities and veins
Late faults calcite
B
-15 -10 -5 0 5 10 15
Milky quartz of gold-rich type I veins
Milky quartz of other vugs and type I veins
Type III veins
Comb quartz
Calcite of comb qtz cavities
Late fault calcite
400±50°C
300±50°C
175±25°C
175±25°C
140±20°C
A
400±50°C
Primarymagmatic water
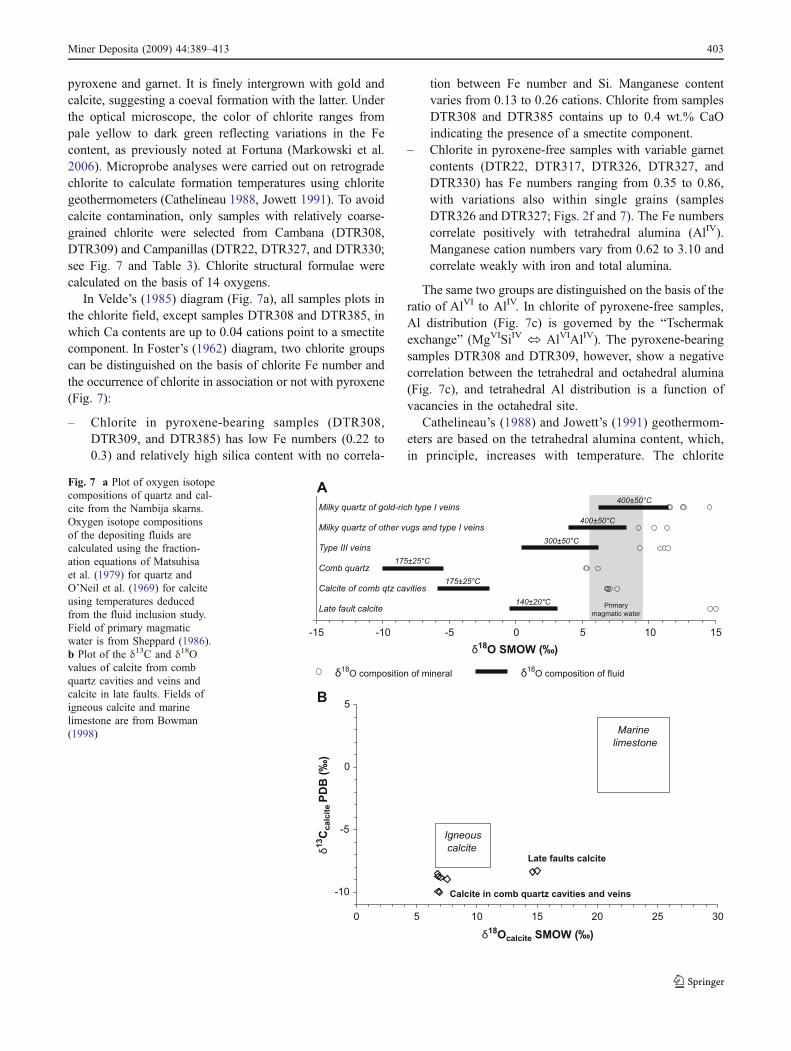
Fig. 7 a Plot of oxygen isotopecompositions of quartz and cal-cite from the Nambija skarns.Oxygen isotope compositionsof the depositing fluids arecalculated using the fraction-ation equations of Matsuhisaet al. (1979) for quartz andO’Neil et al. (1969) for calciteusing temperatures deducedfrom the fluid inclusion study.Field of primary magmaticwater is from Sheppard (1986).b Plot of the δ13C and δ18Ovalues of calcite from combquartz cavities and veins andcalcite in late faults. Fields ofigneous calcite and marinelimestone are from Bowman(1998)
Miner Deposita (2009) 44:389–413 403
geothermometer can be applied only if no smectite layersare intergrown with chlorite and for chlorite with Fenumbers <0.6. The chlorite of samples DTR308 and DTR385contains smectite layers and is, therefore, unsuitable forgeothermometry. Likewise, chlorite from pyroxene-free sam-ples cannot be used as a geothermometer because its Aldistribution is governed by the Tschermak exchange and doesnot reflect the formation temperature (Cathelineau personalcommunication 2007). Sample DTR309 is the only samplemeeting the criteria for chlorite geothermometry. However,correlation between tetrahedral and octahedral alumina is poor(Fig. 7c) casting doubts on the calculated temperatures.Chlorite analyzed by Markowski et al. (2006) at Fortunashows a similar pattern, with increasing Fe number and with
increasing tetrahedral alumina and Al distribution governedby the Tschermak exchange. The same concerns on thevalidity of the chlorite geothermometer may apply for thetemperatures published by Hammarstrom (1992) on Nambijasamples.
Stable isotope geochemistry
Samples and analytical techniques
Oxygen isotope compositions were measured for milkyquartz from vugs and type I veins, for quartz of type IIIveins, and for comb quartz of cavities and veins. Carbon
Table 3 Microprobe analyses and calculated formation temperature of representative various chlorite parageneses from the Nambija district
Sample label location DTR 327 DTR 327 DTR 22 DTR 22 DTR 317 DTR 330 DTR 385 DTR 309 DTR 3084_16 6_11 3_3 1b_2 1_4 3_4 3_10 4_12 3_4Campanillas mine Cambana mine
Strongly zonedchlorite in vugs frombrown garnet skarn
Vug filled bychlorite, quartz,hematite, calcite,and sericite
Chlorite replacinggrt in KNametasomatizedvolcaniclastic rocks
Chloritereplacing px inblue–greengarnet skarn
Chlorite in typeII vein in thegreen pyroxene-epidote skarn
Chlorite in post-ore veinlets ingreen pxep skarn
SiO2 23.53 28.32 25.95 24.07 27.04 27.86 30.71 30.55 32.17
Al2O3 20.51 19.41 18.24 18.76 18.17 18.33 15.62 19.43 15.07
FeO 39.17 21.35 29.65 29.95 21.40 19.15 15.15 13.70 13.79
MgO 3.73 18.32 11.63 11.57 16.90 19.60 23.15 23.60 25.25
MnO 3.60 3.24 3.28 3.48 4.03 4.13 2.35 2.41 1.72
CaO 0.03 0.04 0.05 nd 0.09 nd 0.14 0.10 0.26
Na2O nd nd 0.05 nd nd nd 0.01 nd nd
K2O 0.02 nd 0.11 0.02 0.02 0.01 0.01 nd 0.01
TiO2 0.02 0.03 nd 0.11 0.04 nd nd nd 0.01
H2Oa 9.4 9.3 11.1 12.1 12.3 10.9 12.9 10.2 11.7
Total 100.0 100.0 100.0 100.0 100.0 100.0 100.0 100.0 100.0
Structural formula on the basis of 14 oxygens
Si 2.64 2.85 2.81 2.66 2.85 2.85 3.11 2.97 3.17
AlIV 1.36 1.15 1.19 1.34 1.15 1.15 0.89 1.03 0.83
Al 2.71 2.31 2.33 2.44 2.26 2.21 1.86 2.22 1.75
AlVI 1.35 1.16 1.14 1.10 1.11 1.06 0.97 1.19 0.93
Fe 3.68 1.80 2.69 2.77 1.89 1.64 1.28 1.11 1.14
Mg 0.62 2.75 1.88 1.90 2.65 2.99 3.49 3.41 3.71
Mn 0.34 0.28 0.30 0.33 0.36 0.36 0.20 0.20 0.14
Ca 0.00 0.00 0.01 0.00 0.01 0.00 0.01 0.01 0.03
Na 0.00 0.00 0.01 0.00 0.00 0.00 0.00 0.00 0.00
K 0.00 0.00 0.01 0.00 0.00 0.00 0.00 0.00 0.00
Ti 0.00 0.00 0.00 0.01 0.00 0.00 0.00 0.00 0.00
Fe/(Fe + Mg) 0.86 0.40 0.59 0.59 0.42 0.35 0.27 0.25 0.23
Conditions of probe analyses are 15 nA for beam current and 15 kV for acceleration voltage. All iron is calculated as ferrous
nd not detecteda H2O calculated by difference from 100%
404 Miner Deposita (2009) 44:389–413
and oxygen isotope compositions of calcite from combquartz cavities and veins and calcite in late faults were alsomeasured.
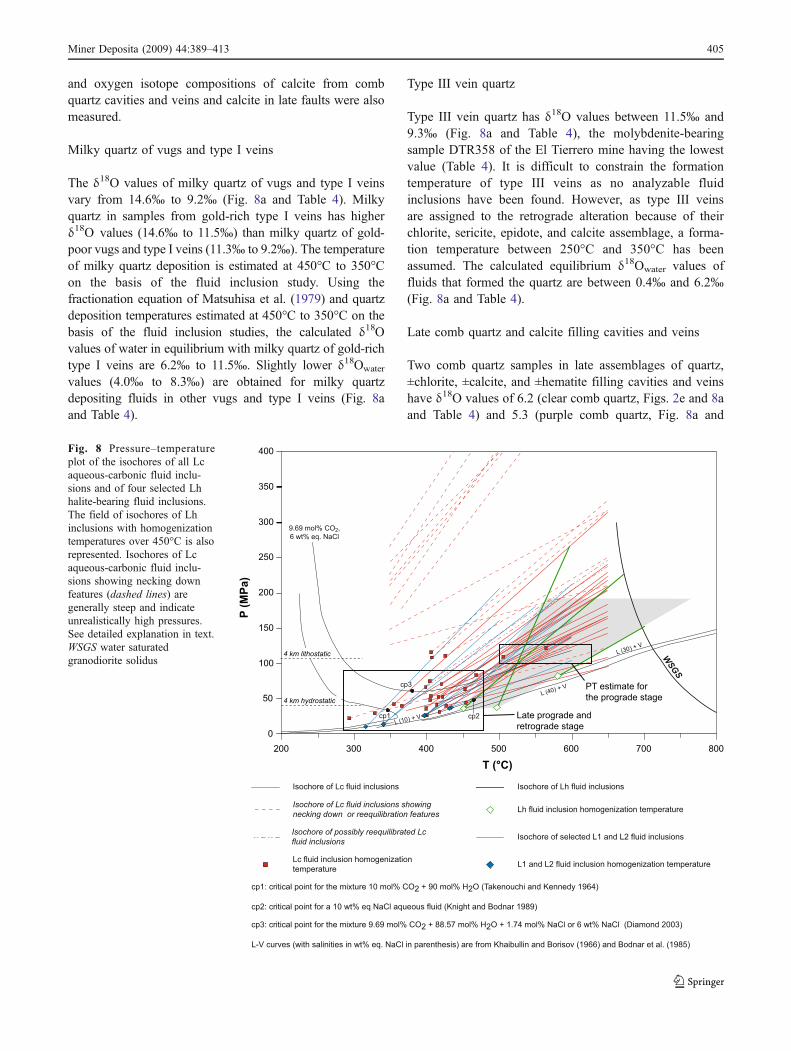
Milky quartz of vugs and type I veins
The δ18O values of milky quartz of vugs and type I veinsvary from 14.6‰ to 9.2‰ (Fig. 8a and Table 4). Milkyquartz in samples from gold-rich type I veins has higherδ18O values (14.6‰ to 11.5‰) than milky quartz of gold-poor vugs and type I veins (11.3‰ to 9.2‰). The temperatureof milky quartz deposition is estimated at 450°C to 350°Con the basis of the fluid inclusion study. Using thefractionation equation of Matsuhisa et al. (1979) and quartzdeposition temperatures estimated at 450°C to 350°C on thebasis of the fluid inclusion studies, the calculated δ18Ovalues of water in equilibrium with milky quartz of gold-richtype I veins are 6.2‰ to 11.5‰. Slightly lower δ18Owater
values (4.0‰ to 8.3‰) are obtained for milky quartzdepositing fluids in other vugs and type I veins (Fig. 8aand Table 4).
Type III vein quartz
Type III vein quartz has δ18O values between 11.5‰ and9.3‰ (Fig. 8a and Table 4), the molybdenite-bearingsample DTR358 of the El Tierrero mine having the lowestvalue (Table 4). It is difficult to constrain the formationtemperature of type III veins as no analyzable fluidinclusions have been found. However, as type III veinsare assigned to the retrograde alteration because of theirchlorite, sericite, epidote, and calcite assemblage, a forma-tion temperature between 250°C and 350°C has beenassumed. The calculated equilibrium δ18Owater values offluids that formed the quartz are between 0.4‰ and 6.2‰(Fig. 8a and Table 4).
Late comb quartz and calcite filling cavities and veins
Two comb quartz samples in late assemblages of quartz,±chlorite, ±calcite, and ±hematite filling cavities and veinshave δ18O values of 6.2 (clear comb quartz, Figs. 2e and 8aand Table 4) and 5.3 (purple comb quartz, Fig. 8a and
T (°C)
P (
MP
a)
0
50
100
150
200
250
300
350
400
200 300 400 500 600 700 800
WSG
S
L (40) + V
4 km lithostatic
cp1
4 km hydrostatic
cp2
L (30) + V
9.69 mol% CO2,6 wt% eq. NaCl
PT estimate forthe prograde stage
cp3
cp1: critical point for the mixture 10 mol% CO2 + 90 mol% H2O (Takenouchi and Kennedy 1964)
cp2: critical point for a 10 wt% eq NaCl aqueous fluid (Knight and Bodnar 1989)
cp3: critical point for the mixture 9.69 mol% CO2 + 88.57 mol% H2O + 1.74 mol% NaCl or 6 wt% NaCl (Diamond 2003)
L-V curves (with salinities in wt% eq. NaCl in parenthesis) are from Khaibullin and Borisov (1966) and Bodnar et al. (1985)
Isochore of Lc fluid inclusions Isochore of Lh fluid inclusions
Isochore of Lc fluid inclusions showing
necking down or reequilibration featuresLh fluid inclusion homogenization temperature
Isochore of possibly reequilibrated Lc
fluid inclusions Isochore of selected L1 and L2 fluid inclusions
Lc fluid inclusion homogenizationtemperature
L1 and L2 fluid inclusion homogenization temperature
L (10) + V Late prograde andretrograde stage
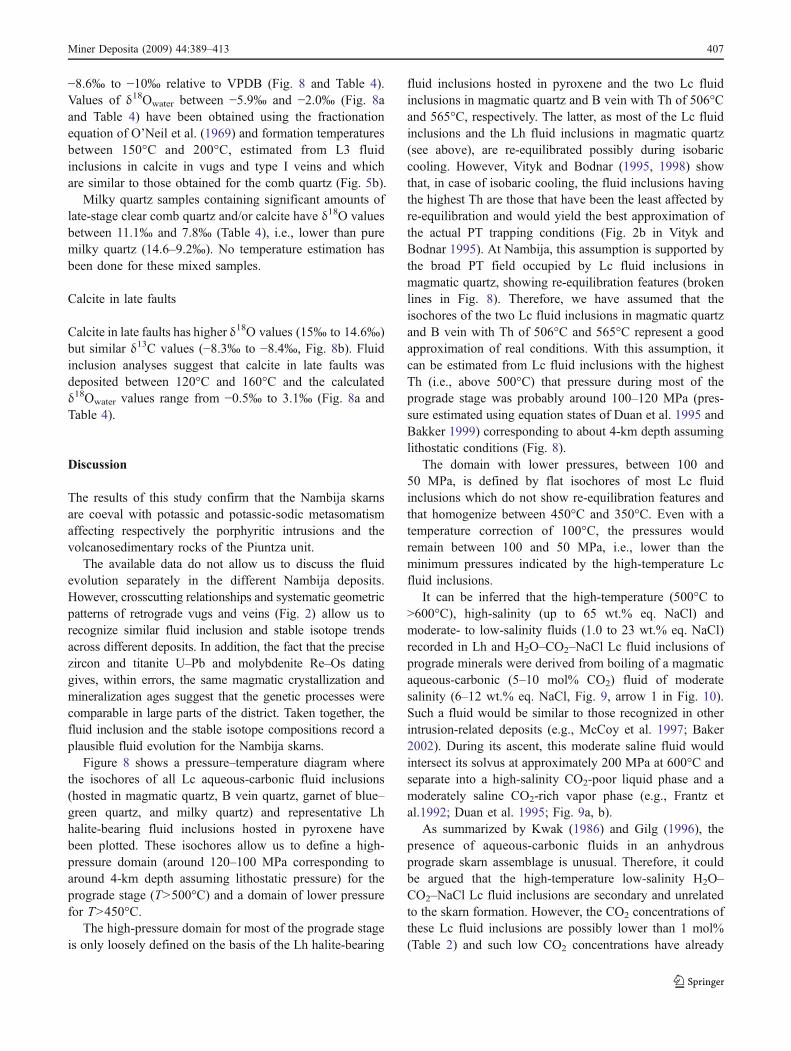
Fig. 8 Pressure–temperatureplot of the isochores of all Lcaqueous-carbonic fluid inclu-sions and of four selected Lhhalite-bearing fluid inclusions.The field of isochores of Lhinclusions with homogenizationtemperatures over 450°C is alsorepresented. Isochores of Lcaqueous-carbonic fluid inclu-sions showing necking downfeatures (dashed lines) aregenerally steep and indicateunrealistically high pressures.See detailed explanation in text.WSGS water saturatedgranodiorite solidus
Miner Deposita (2009) 44:389–413 405
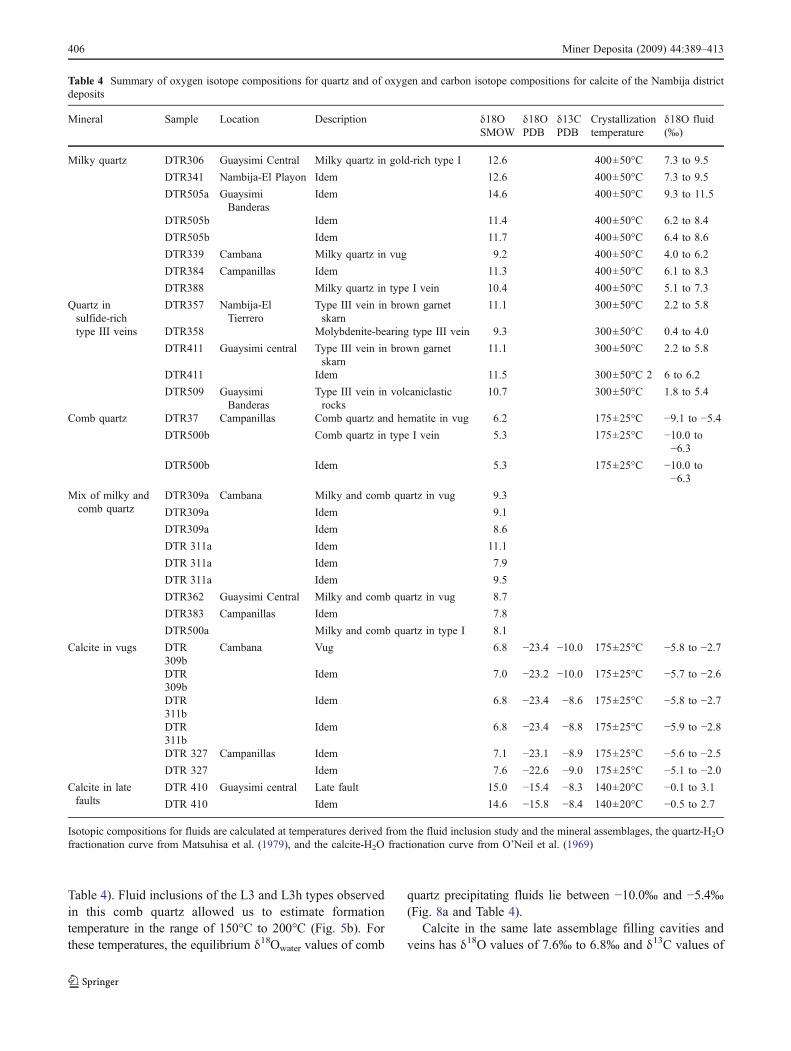
Table 4). Fluid inclusions of the L3 and L3h types observedin this comb quartz allowed us to estimate formationtemperature in the range of 150°C to 200°C (Fig. 5b). Forthese temperatures, the equilibrium δ18Owater values of comb
quartz precipitating fluids lie between −10.0‰ and −5.4‰(Fig. 8a and Table 4).
Calcite in the same late assemblage filling cavities andveins has δ18O values of 7.6‰ to 6.8‰ and δ13C values of
Table 4 Summary of oxygen isotope compositions for quartz and of oxygen and carbon isotope compositions for calcite of the Nambija districtdeposits
Mineral Sample Location Description δ18O δ18O δ13C Crystallization δ18O fluidSMOW PDB PDB temperature (‰)
Milky quartz DTR306 Guaysimi Central Milky quartz in gold-rich type I 12.6 400±50°C 7.3 to 9.5
DTR341 Nambija-El Playon Idem 12.6 400±50°C 7.3 to 9.5
DTR505a GuaysimiBanderas
Idem 14.6 400±50°C 9.3 to 11.5
DTR505b Idem 11.4 400±50°C 6.2 to 8.4
DTR505b Idem 11.7 400±50°C 6.4 to 8.6
DTR339 Cambana Milky quartz in vug 9.2 400±50°C 4.0 to 6.2
DTR384 Campanillas Idem 11.3 400±50°C 6.1 to 8.3
DTR388 Milky quartz in type I vein 10.4 400±50°C 5.1 to 7.3
Quartz insulfide-richtype III veins
DTR357 Nambija-ElTierrero
Type III vein in brown garnetskarn
11.1 300±50°C 2.2 to 5.8
DTR358 Molybdenite-bearing type III vein 9.3 300±50°C 0.4 to 4.0
DTR411 Guaysimi central Type III vein in brown garnetskarn
11.1 300±50°C 2.2 to 5.8
DTR411 Idem 11.5 300±50°C 2 6 to 6.2
DTR509 GuaysimiBanderas
Type III vein in volcaniclasticrocks
10.7 300±50°C 1.8 to 5.4
Comb quartz DTR37 Campanillas Comb quartz and hematite in vug 6.2 175±25°C −9.1 to −5.4DTR500b Comb quartz in type I vein 5.3 175±25°C −10.0 to
−6.3DTR500b Idem 5.3 175±25°C −10.0 to
−6.3Mix of milky andcomb quartz
DTR309a Cambana Milky and comb quartz in vug 9.3
DTR309a Idem 9.1
DTR309a Idem 8.6
DTR 311a Idem 11.1
DTR 311a Idem 7.9
DTR 311a Idem 9.5
DTR362 Guaysimi Central Milky and comb quartz in vug 8.7
DTR383 Campanillas Idem 7.8
DTR500a Milky and comb quartz in type I 8.1
Calcite in vugs DTR309b
Cambana Vug 6.8 −23.4 −10.0 175±25°C −5.8 to −2.7
DTR309b
Idem 7.0 −23.2 −10.0 175±25°C −5.7 to −2.6
DTR311b
Idem 6.8 −23.4 −8.6 175±25°C −5.8 to −2.7
DTR311b
Idem 6.8 −23.4 −8.8 175±25°C −5.9 to −2.8
DTR 327 Campanillas Idem 7.1 −23.1 −8.9 175±25°C −5.6 to −2.5DTR 327 Idem 7.6 −22.6 −9.0 175±25°C −5.1 to −2.0
Calcite in latefaults
DTR 410 Guaysimi central Late fault 15.0 −15.4 −8.3 140±20°C −0.1 to 3.1
DTR 410 Idem 14.6 −15.8 −8.4 140±20°C −0.5 to 2.7
Isotopic compositions for fluids are calculated at temperatures derived from the fluid inclusion study and the mineral assemblages, the quartz-H2Ofractionation curve from Matsuhisa et al. (1979), and the calcite-H2O fractionation curve from O’Neil et al. (1969)
406 Miner Deposita (2009) 44:389–413
−8.6‰ to −10‰ relative to VPDB (Fig. 8 and Table 4).Values of δ18Owater between −5.9‰ and −2.0‰ (Fig. 8aand Table 4) have been obtained using the fractionationequation of O’Neil et al. (1969) and formation temperaturesbetween 150°C and 200°C, estimated from L3 fluidinclusions in calcite in vugs and type I veins and whichare similar to those obtained for the comb quartz (Fig. 5b).
Milky quartz samples containing significant amounts oflate-stage clear comb quartz and/or calcite have δ18O valuesbetween 11.1‰ and 7.8‰ (Table 4), i.e., lower than puremilky quartz (14.6–9.2‰). No temperature estimation hasbeen done for these mixed samples.
Calcite in late faults
Calcite in late faults has higher δ18O values (15‰ to 14.6‰)but similar δ13C values (−8.3‰ to −8.4‰, Fig. 8b). Fluidinclusion analyses suggest that calcite in late faults wasdeposited between 120°C and 160°C and the calculatedδ18Owater values range from −0.5‰ to 3.1‰ (Fig. 8a andTable 4).
Discussion
The results of this study confirm that the Nambija skarnsare coeval with potassic and potassic-sodic metasomatismaffecting respectively the porphyritic intrusions and thevolcanosedimentary rocks of the Piuntza unit.
The available data do not allow us to discuss the fluidevolution separately in the different Nambija deposits.However, crosscutting relationships and systematic geometricpatterns of retrograde vugs and veins (Fig. 2) allow us torecognize similar fluid inclusion and stable isotope trendsacross different deposits. In addition, the fact that the precisezircon and titanite U–Pb and molybdenite Re–Os datinggives, within errors, the same magmatic crystallization andmineralization ages suggest that the genetic processes werecomparable in large parts of the district. Taken together, thefluid inclusion and the stable isotope compositions record aplausible fluid evolution for the Nambija skarns.
Figure 8 shows a pressure–temperature diagram wherethe isochores of all Lc aqueous-carbonic fluid inclusions(hosted in magmatic quartz, B vein quartz, garnet of blue–green quartz, and milky quartz) and representative Lhhalite-bearing fluid inclusions hosted in pyroxene havebeen plotted. These isochores allow us to define a high-pressure domain (around 120–100 MPa corresponding toaround 4-km depth assuming lithostatic pressure) for theprograde stage (T>500°C) and a domain of lower pressurefor T>450°C.
The high-pressure domain for most of the prograde stageis only loosely defined on the basis of the Lh halite-bearing
fluid inclusions hosted in pyroxene and the two Lc fluidinclusions in magmatic quartz and B vein with Th of 506°Cand 565°C, respectively. The latter, as most of the Lc fluidinclusions and the Lh fluid inclusions in magmatic quartz(see above), are re-equilibrated possibly during isobariccooling. However, Vityk and Bodnar (1995, 1998) showthat, in case of isobaric cooling, the fluid inclusions havingthe highest Th are those that have been the least affected byre-equilibration and would yield the best approximation ofthe actual PT trapping conditions (Fig. 2b in Vityk andBodnar 1995). At Nambija, this assumption is supported bythe broad PT field occupied by Lc fluid inclusions inmagmatic quartz, showing re-equilibration features (brokenlines in Fig. 8). Therefore, we have assumed that theisochores of the two Lc fluid inclusions in magmatic quartzand B vein with Th of 506°C and 565°C represent a goodapproximation of real conditions. With this assumption, itcan be estimated from Lc fluid inclusions with the highestTh (i.e., above 500°C) that pressure during most of theprograde stage was probably around 100–120 MPa (pres-sure estimated using equation states of Duan et al. 1995 andBakker 1999) corresponding to about 4-km depth assuminglithostatic conditions (Fig. 8).
The domain with lower pressures, between 100 and50 MPa, is defined by flat isochores of most Lc fluidinclusions which do not show re-equilibration features andthat homogenize between 450°C and 350°C. Even with atemperature correction of 100°C, the pressures wouldremain between 100 and 50 MPa, i.e., lower than theminimum pressures indicated by the high-temperature Lcfluid inclusions.
It can be inferred that the high-temperature (500°C to>600°C), high-salinity (up to 65 wt.% eq. NaCl) andmoderate- to low-salinity fluids (1.0 to 23 wt.% eq. NaCl)recorded in Lh and H2O–CO2–NaCl Lc fluid inclusions ofprograde minerals were derived from boiling of a magmaticaqueous-carbonic (5–10 mol% CO2) fluid of moderatesalinity (6–12 wt.% eq. NaCl, Fig. 9, arrow 1 in Fig. 10).Such a fluid would be similar to those recognized in otherintrusion-related deposits (e.g., McCoy et al. 1997; Baker2002). During its ascent, this moderate saline fluid wouldintersect its solvus at approximately 200 MPa at 600°C andseparate into a high-salinity CO2-poor liquid phase and amoderately saline CO2-rich vapor phase (e.g., Frantz etal.1992; Duan et al. 1995; Fig. 9a, b).
As summarized by Kwak (1986) and Gilg (1996), thepresence of aqueous-carbonic fluids in an anhydrousprograde skarn assemblage is unusual. Therefore, it couldbe argued that the high-temperature low-salinity H2O–CO2–NaCl Lc fluid inclusions are secondary and unrelatedto the skarn formation. However, the CO2 concentrations ofthese Lc fluid inclusions are possibly lower than 1 mol%(Table 2) and such low CO2 concentrations have already
Miner Deposita (2009) 44:389–413 407
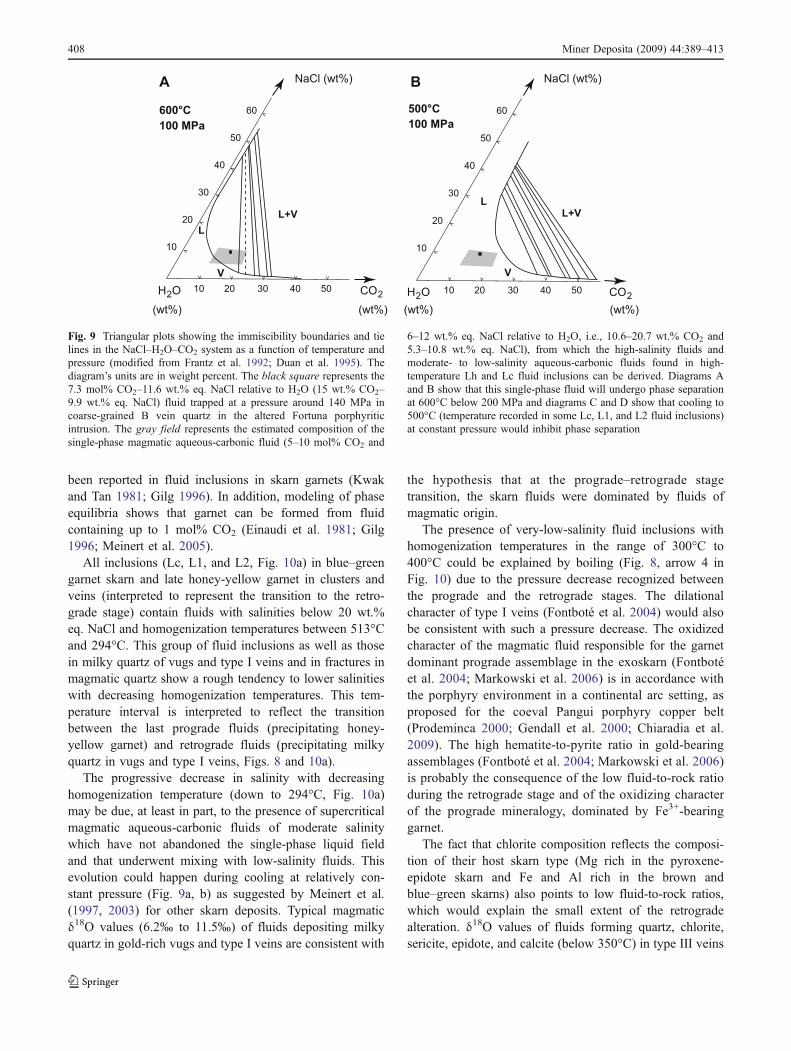
been reported in fluid inclusions in skarn garnets (Kwakand Tan 1981; Gilg 1996). In addition, modeling of phaseequilibria shows that garnet can be formed from fluidcontaining up to 1 mol% CO2 (Einaudi et al. 1981; Gilg1996; Meinert et al. 2005).
All inclusions (Lc, L1, and L2, Fig. 10a) in blue–greengarnet skarn and late honey-yellow garnet in clusters andveins (interpreted to represent the transition to the retro-grade stage) contain fluids with salinities below 20 wt.%eq. NaCl and homogenization temperatures between 513°Cand 294°C. This group of fluid inclusions as well as thosein milky quartz of vugs and type I veins and in fractures inmagmatic quartz show a rough tendency to lower salinitieswith decreasing homogenization temperatures. This tem-perature interval is interpreted to reflect the transitionbetween the last prograde fluids (precipitating honey-yellow garnet) and retrograde fluids (precipitating milkyquartz in vugs and type I veins, Figs. 8 and 10a).
The progressive decrease in salinity with decreasinghomogenization temperature (down to 294°C, Fig. 10a)may be due, at least in part, to the presence of supercriticalmagmatic aqueous-carbonic fluids of moderate salinitywhich have not abandoned the single-phase liquid fieldand that underwent mixing with low-salinity fluids. Thisevolution could happen during cooling at relatively con-stant pressure (Fig. 9a, b) as suggested by Meinert et al.(1997, 2003) for other skarn deposits. Typical magmaticδ18O values (6.2‰ to 11.5‰) of fluids depositing milkyquartz in gold-rich vugs and type I veins are consistent with
the hypothesis that at the prograde–retrograde stagetransition, the skarn fluids were dominated by fluids ofmagmatic origin.
The presence of very-low-salinity fluid inclusions withhomogenization temperatures in the range of 300°C to400°C could be explained by boiling (Fig. 8, arrow 4 inFig. 10) due to the pressure decrease recognized betweenthe prograde and the retrograde stages. The dilationalcharacter of type I veins (Fontboté et al. 2004) would alsobe consistent with such a pressure decrease. The oxidizedcharacter of the magmatic fluid responsible for the garnetdominant prograde assemblage in the exoskarn (Fontbotéet al. 2004; Markowski et al. 2006) is in accordance withthe porphyry environment in a continental arc setting, asproposed for the coeval Pangui porphyry copper belt(Prodeminca 2000; Gendall et al. 2000; Chiaradia et al.2009). The high hematite-to-pyrite ratio in gold-bearingassemblages (Fontboté et al. 2004; Markowski et al. 2006)is probably the consequence of the low fluid-to-rock ratioduring the retrograde stage and of the oxidizing characterof the prograde mineralogy, dominated by Fe3+-bearinggarnet.
The fact that chlorite composition reflects the composi-tion of their host skarn type (Mg rich in the pyroxene-epidote skarn and Fe and Al rich in the brown andblue–green skarns) also points to low fluid-to-rock ratios,which would explain the small extent of the retrogradealteration. δ18O values of fluids forming quartz, chlorite,sericite, epidote, and calcite (below 350°C) in type III veins
600°C
100 MPa
v v v v v
v
v
v
v
v
v
10 20 30 40 50
10
20
30
40
50
60
NaCl (wt%)
CO2H2O
L
V
L+V
(wt%) (wt%)
A
v v v v v
v
v
v
v
v
v
10 20 30 40 50
10
20
30
40
50
60
NaCl (wt%)
CO2H2O
500°C
100 MPa
L
V
L+V
(wt%) (wt%)
B
Fig. 9 Triangular plots showing the immiscibility boundaries and tielines in the NaCl–H2O–CO2 system as a function of temperature andpressure (modified from Frantz et al. 1992; Duan et al. 1995). Thediagram’s units are in weight percent. The black square represents the7.3 mol% CO2–11.6 wt.% eq. NaCl relative to H2O (15 wt.% CO2–9.9 wt.% eq. NaCl) fluid trapped at a pressure around 140 MPa incoarse-grained B vein quartz in the altered Fortuna porphyriticintrusion. The gray field represents the estimated composition of thesingle-phase magmatic aqueous-carbonic fluid (5–10 mol% CO2 and
6–12 wt.% eq. NaCl relative to H2O, i.e., 10.6–20.7 wt.% CO2 and5.3–10.8 wt.% eq. NaCl), from which the high-salinity fluids andmoderate- to low-salinity aqueous-carbonic fluids found in high-temperature Lh and Lc fluid inclusions can be derived. Diagrams Aand B show that this single-phase fluid will undergo phase separationat 600°C below 200 MPa and diagrams C and D show that cooling to500°C (temperature recorded in some Lc, L1, and L2 fluid inclusions)at constant pressure would inhibit phase separation
408 Miner Deposita (2009) 44:389–413
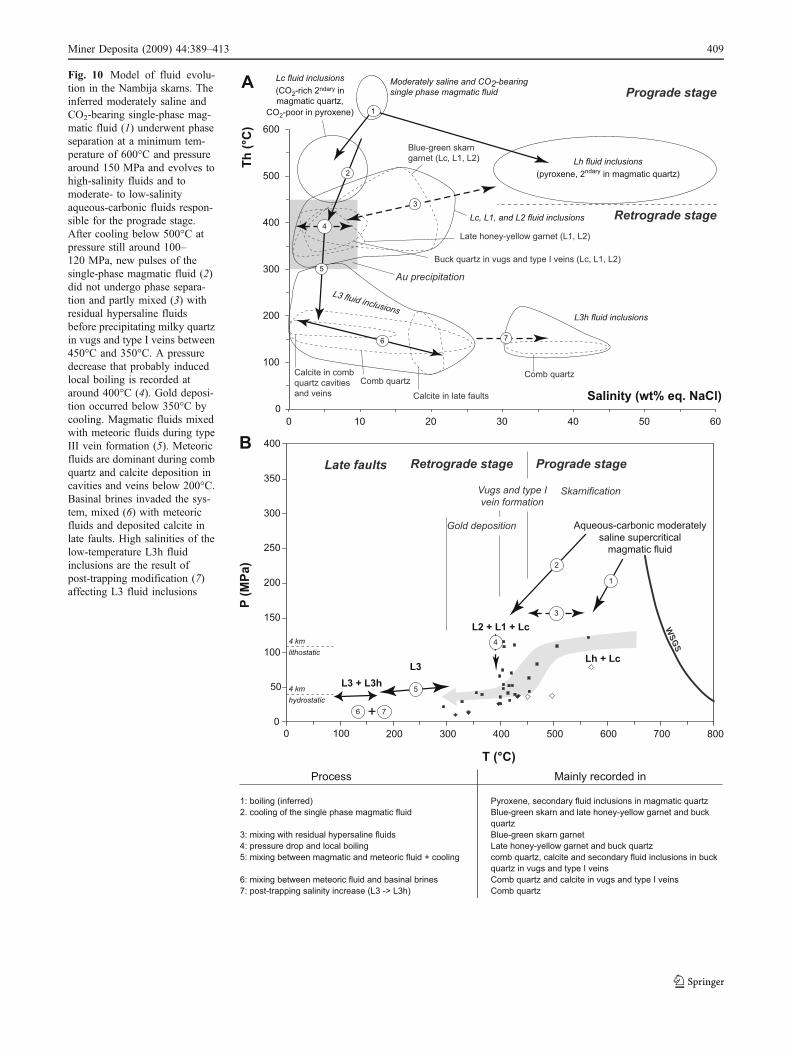
1: boiling (inferred)2. cooling of the single phase magmatic fluid
3: mixing with residual hypersaline fluids4: pressure drop and local boiling5: mixing between magmatic and meteoric fluid + cooling
6: mixing between meteoric fluid and basinal brines7: post-trapping salinity increase (L3 -> L3h)
Process Mainly recorded in
Pyroxene, secondary fluid inclusions in magmatic quartz Blue-green skarn and late honey-yellow garnet and buckquartzBlue-green skarn garnetLate honey-yellow garnet and buck quartzcomb quartz, calcite and secondary fluid inclusions in buckquartz in vugs and type I veins Comb quartz and calcite in vugs and type I veins Comb quartz
0
100
200
300
400
500
600
0 10 20 30 40 50 60
Salinity (wt% eq. NaCl)
Th
(°C
)
Moderately saline and CO2-bearing
single phase magmatic fluid
Lh fluid inclusions
(pyroxene, 2ndary in magmatic quartz)
Lc fluid inclusions
(CO2-rich 2ndary inmagmatic quartz,
CO2-poor in pyroxene)
2
3
5
L3 fluid inclusionsL3h fluid inclusions
Prograde stage
Retrograde stage
A
1
Late honey-yellow garnet (L1, L2)
Blue-green skarngarnet (Lc, L1, L2)
Calcite in combquartz cavitiesand veins
Comb quartz
Calcite in late faults
Buck quartz in vugs and type I veins (Lc, L1, L2)
Comb quartz
Lc, L1, and L2 fluid inclusions
6
Au precipitation
B
P (
MP
a)
0
50
100
150
200
250
300
350
400
200 300 400 500 600 700 800
4 km
hydrostatic
Vugs and type I
vein formationSkarnification
Prograde stageRetrograde stage
WS
GS
T (°C)
0 100
Lh + Lc
L2 + L1 + Lc
L3 + L3h
L3
1
2
5
6 7+
Aqueous-carbonic moderatelysaline supercritical
magmatic fluid
4
3
4 km
lithostatic
Late faults
4
7
Gold deposition
Fig. 10 Model of fluid evolu-tion in the Nambija skarns. Theinferred moderately saline andCO2-bearing single-phase mag-matic fluid (1) underwent phaseseparation at a minimum tem-perature of 600°C and pressurearound 150 MPa and evolves tohigh-salinity fluids and tomoderate- to low-salinityaqueous-carbonic fluids respon-sible for the prograde stage.After cooling below 500°C atpressure still around 100–120 MPa, new pulses of thesingle-phase magmatic fluid (2)did not undergo phase separa-tion and partly mixed (3) withresidual hypersaline fluidsbefore precipitating milky quartzin vugs and type I veins between450°C and 350°C. A pressuredecrease that probably inducedlocal boiling is recorded ataround 400°C (4). Gold deposi-tion occurred below 350°C bycooling. Magmatic fluids mixedwith meteoric fluids during typeIII vein formation (5). Meteoricfluids are dominant during combquartz and calcite deposition incavities and veins below 200°C.Basinal brines invaded the sys-tem, mixed (6) with meteoricfluids and deposited calcite inlate faults. High salinities of thelow-temperature L3h fluidinclusions are the result ofpost-trapping modification (7)affecting L3 fluid inclusions
Miner Deposita (2009) 44:389–413 409
(no fluid inclusions available) ranging from 0.4‰ to 6.2‰(Fig. 7a and Table 4) suggest mixing between late pulses ofmagmatic fluids and meteoric fluids invading the system(arrow 5 in Fig. 10).
The transition from Lc to CO2-free L1/L2 fluidinclusions during cooling is consistent with the fact that atlow temperature calcite precipitates instead of milky quartz.This evolution may be due to CO2 effervescence (Drummondand Ohmoto 1985; Fournier 1985a; Fournier 1985b) becauseof pressure decrease. The pH increase that results from CO2
effervescence together with decreasing temperature are twopowerful mechanisms to destabilize gold-transporting chlo-ride complexes below 400°C (Gammons and Williams-Jones1997) and explain the common association of native goldgrains and calcite. The hypothesis of gold transport bychloride complexes is favored because of the high hematite-to-pyrite ratio of gold-bearing samples and the general lowsulfide content in all the deposits of the Nambija district.
Post-ore veins
Low-temperature (<300°C) fluids responsible for theprecipitation of comb quartz and calcite in cavities andveins are recorded in aqueous L3 fluid inclusions. Theirtendency of having higher salinities with decreasing homog-enization temperatures (Figs. 5, 10) can be explained in termsof mixing (arrow 6 in Fig. 10) with low-temperaturemoderately saline fluids (in the range of about 100°C and25 wt.% eq. NaCl).
The high-salinity values measured in L3h fluid inclusions,which homogenize by halite melting (Fig. 5a and Table 1),are interpreted as the result of post-trapping modification(arrow 7 in Fig. 10) according to the mechanism proposed byAudetat and Günther (1999). An alternative explanation by aboiling process would imply unrealistically low pressures(<1.5 MPa, i.e., <150-m depth under hydrostatic conditions,following data of LV curves of Khaibullin and Borisov1966) for temperatures below 200°C.
Ingression of meteoric fluids is recorded by O isotopecompositions of comb quartz (δ18Owater between −10.0‰and −5.4‰) and associated calcite (δ18Owater between−5.9‰ and −2.0‰) in cavities and veins (Fig. 7a andTable 4). Discrepancies between δ18Owater calculated fromcomb quartz and associated calcite could be the result ofisotopic re-equilibration of calcite associated with combquartz during deposition of calcite in late faults from fluidswith higher δ18Owater values (see below). Sample DTR327for example shows locally late calcite veins crosscuttingcomb quartz and associated calcite.
Carbon isotope compositions of calcite associated withcomb quartz are those typical for magmatic calcites (Fig. 7aand Table 4), although a fluid equilibrated with magmaticrocks cannot be excluded simply on the basis of the δ13C
values. Carbon isotope analysis of the calcite in late faultsgives similar results (Fig. 7a and Table 4). The low-temperature moderate- to high-salinity fluids trapped as L3fluid inclusions in calcite in late faults have similarmicrothermometric characteristics as the low-temperaturemoderate-salinity fluids involved in the mixing processproposed above to explain the salinity range of fluidinclusions in comb quartz and calcite in cavities and veins(Fig. 5b). Taking into account their δ18O values (−0.5‰ to3.1‰) and their salinities, these fluids can be interpreted tobe basinal brines (Fig. 7 and Table 4). Ingression of basinalbrines is probably related to the formation of the EarlyCretaceous basin hosting the marine Hollín Formation priorto uplifting of the sub-Andean zone during Late Cretaceousto Paleocene (Spikings et al. 2000; Hughes and Pilatasig2002; Jaillard et al. 2005; Pratt et al. 2005).
Comparison with other gold skarn system
At the oxidized gold skarn of McCoy (Brooks et al. 1991;Brooks, 1994), the obtained isochores, the absence of CO2-bearing fluids, and the occurrence of breccias indicate ashallower level of formation (depth of about 2 km)compared to the Nambija district (depths of about 4 km).The temperatures and salinities of fluid from the progradeand retrograde stage at Big Gossan (Meinert et al. 1997)have a similar evolution as at Nambija. However, at BigGossan, mineralization, mainly occurring in the matrix of abreccia, is of the copper–gold type and skarns were alsoformed at shallower levels (around 2 km). Moreover, noCO2-bearing fluid inclusions were reported at Big Gossan.In contrast, the Nambija deposits are devoid of breccias andhave veins (type I, II) comparable to those formed in theearly evolution stages of porphyry systems (Fontboté et al.2004; Chiaradia et al. 2009), all features being consistentwith the depths of about 4 km derived from the fluidinclusion results.
Carbon-dioxide-bearing fluids in gold skarn systemswere observed in the reduced gold skarn deposits of the RioNarcea Gold belt in Spain (Arcos et al. 1995; Arcos 1996;Martin-Izard et al. 2000). In these deposits, carbon-dioxide-bearing fluids were observed in gold-bearing quartz thatpost-dates prograde calc-silicates and are interpreted tobe the low-density phases coexisting with an immisciblehigh-density and high-salinity phase. Fluid evolution inthe Rio Narcea gold skarn shows similarities with thatof Nambija. A main difference compared to Nambija isthe presence of fluids with higher amounts of CO2 attemperatures below 400°C. This could be explained by adeeper level of skarn formation (5–6 km after Arcos et al.1995 and Arcos 1996) because increasing pressure favorshigher CO2 solubility in H2O–NaCl fluids (e.g., Gehrig1980; Baker 2002).
410 Miner Deposita (2009) 44:389–413
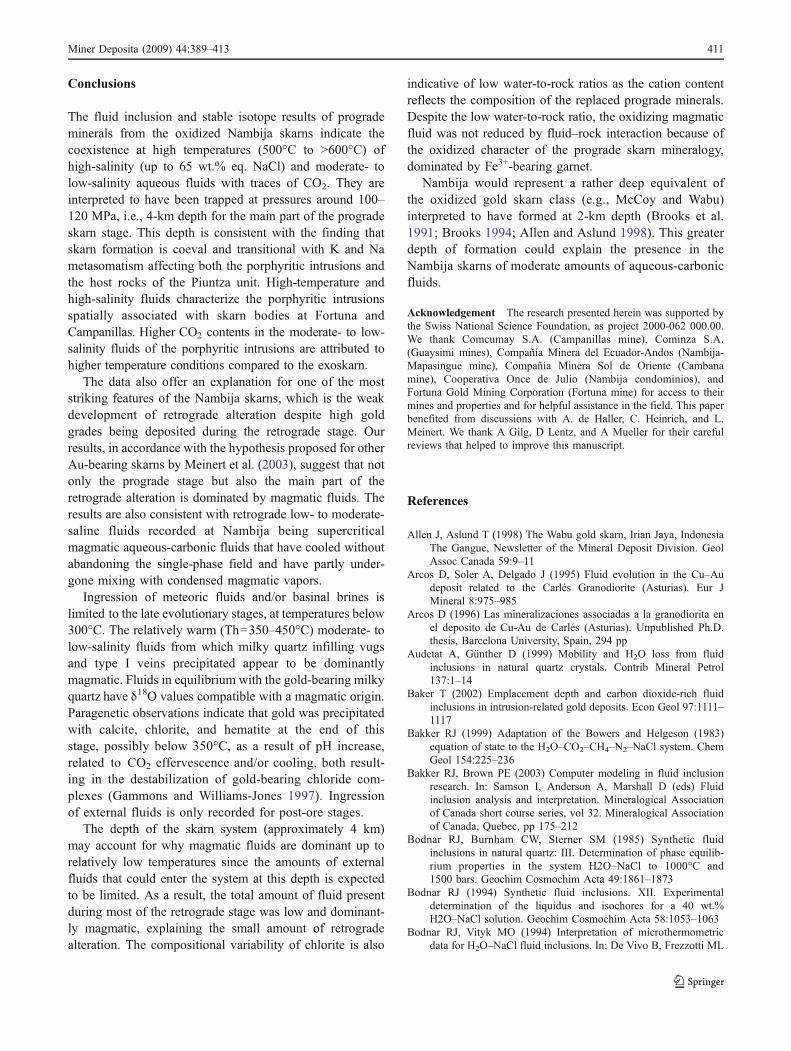
Conclusions
The fluid inclusion and stable isotope results of progrademinerals from the oxidized Nambija skarns indicate thecoexistence at high temperatures (500°C to >600°C) ofhigh-salinity (up to 65 wt.% eq. NaCl) and moderate- tolow-salinity aqueous fluids with traces of CO2. They areinterpreted to have been trapped at pressures around 100–120 MPa, i.e., 4-km depth for the main part of the progradeskarn stage. This depth is consistent with the finding thatskarn formation is coeval and transitional with K and Nametasomatism affecting both the porphyritic intrusions andthe host rocks of the Piuntza unit. High-temperature andhigh-salinity fluids characterize the porphyritic intrusionsspatially associated with skarn bodies at Fortuna andCampanillas. Higher CO2 contents in the moderate- to low-salinity fluids of the porphyritic intrusions are attributed tohigher temperature conditions compared to the exoskarn.
The data also offer an explanation for one of the moststriking features of the Nambija skarns, which is the weakdevelopment of retrograde alteration despite high goldgrades being deposited during the retrograde stage. Ourresults, in accordance with the hypothesis proposed for otherAu-bearing skarns by Meinert et al. (2003), suggest that notonly the prograde stage but also the main part of theretrograde alteration is dominated by magmatic fluids. Theresults are also consistent with retrograde low- to moderate-saline fluids recorded at Nambija being supercriticalmagmatic aqueous-carbonic fluids that have cooled withoutabandoning the single-phase field and have partly under-gone mixing with condensed magmatic vapors.
Ingression of meteoric fluids and/or basinal brines islimited to the late evolutionary stages, at temperatures below300°C. The relatively warm (Th=350–450°C) moderate- tolow-salinity fluids from which milky quartz infilling vugsand type I veins precipitated appear to be dominantlymagmatic. Fluids in equilibrium with the gold-bearing milkyquartz have δ18O values compatible with a magmatic origin.Paragenetic observations indicate that gold was precipitatedwith calcite, chlorite, and hematite at the end of thisstage, possibly below 350°C, as a result of pH increase,related to CO2 effervescence and/or cooling, both result-ing in the destabilization of gold-bearing chloride com-plexes (Gammons and Williams-Jones 1997). Ingressionof external fluids is only recorded for post-ore stages.
The depth of the skarn system (approximately 4 km)may account for why magmatic fluids are dominant up torelatively low temperatures since the amounts of externalfluids that could enter the system at this depth is expectedto be limited. As a result, the total amount of fluid presentduring most of the retrograde stage was low and dominant-ly magmatic, explaining the small amount of retrogradealteration. The compositional variability of chlorite is also
indicative of low water-to-rock ratios as the cation contentreflects the composition of the replaced prograde minerals.Despite the low water-to-rock ratio, the oxidizing magmaticfluid was not reduced by fluid–rock interaction because ofthe oxidized character of the prograde skarn mineralogy,dominated by Fe3+-bearing garnet.
Nambija would represent a rather deep equivalent ofthe oxidized gold skarn class (e.g., McCoy and Wabu)interpreted to have formed at 2-km depth (Brooks et al.1991; Brooks 1994; Allen and Aslund 1998). This greaterdepth of formation could explain the presence in theNambija skarns of moderate amounts of aqueous-carbonicfluids.
Acknowledgement The research presented herein was supported bythe Swiss National Science Foundation, as project 2000-062 000.00.We thank Comcumay S.A. (Campanillas mine), Cominza S.A.(Guaysimi mines), Compañía Minera del Ecuador-Andos (Nambija-Mapasingue mine), Compañía Minera Sol de Oriente (Cambanamine), Cooperativa Once de Julio (Nambija condominios), andFortuna Gold Mining Corporation (Fortuna mine) for access to theirmines and properties and for helpful assistance in the field. This paperbenefited from discussions with A. de Haller, C. Heinrich, and L.Meinert. We thank A Gilg, D Lentz, and A Mueller for their carefulreviews that helped to improve this manuscript.
References
Allen J, Aslund T (1998) The Wabu gold skarn, Irian Jaya, IndonesiaThe Gangue, Newsletter of the Mineral Deposit Division. GeolAssoc Canada 59:9–11
Arcos D, Soler A, Delgado J (1995) Fluid evolution in the Cu–Audeposit related to the Carlés Granodiorite (Asturias). Eur JMineral 8:975–985
Arcos D (1996) Las mineralizaciones associadas a la granodiorita enel deposito de Cu-Au de Carlés (Asturias). Unpublished Ph.D.thesis, Barcelona University, Spain, 294 pp
Audetat A, Günther D (1999) Mobility and H2O loss from fluidinclusions in natural quartz crystals. Contrib Mineral Petrol137:1–14
Baker T (2002) Emplacement depth and carbon dioxide-rich fluidinclusions in intrusion-related gold deposits. Econ Geol 97:1111–1117
Bakker RJ (1999) Adaptation of the Bowers and Helgeson (1983)equation of state to the H2O–CO2–CH4–N2–NaCl system. ChemGeol 154:225–236
Bakker RJ, Brown PE (2003) Computer modeling in fluid inclusionresearch. In: Samson I, Anderson A, Marshall D (eds) Fluidinclusion analysis and interpretation. Mineralogical Associationof Canada short course series, vol 32. Mineralogical Associationof Canada, Quebec, pp 175–212
Bodnar RJ, Burnham CW, Sterner SM (1985) Synthetic fluidinclusions in natural quartz: III. Determination of phase equilib-rium properties in the system H2O–NaCl to 1000°C and1500 bars. Geochim Cosmochim Acta 49:1861–1873
Bodnar RJ (1994) Synthetic fluid inclusions. XII. Experimentaldetermination of the liquidus and isochores for a 40 wt.%H2O–NaCl solution. Geochim Cosmochim Acta 58:1053–1063
Bodnar RJ, Vityk MO (1994) Interpretation of microthermometricdata for H2O–NaCl fluid inclusions. In: De Vivo B, Frezzotti ML
Miner Deposita (2009) 44:389–413 411
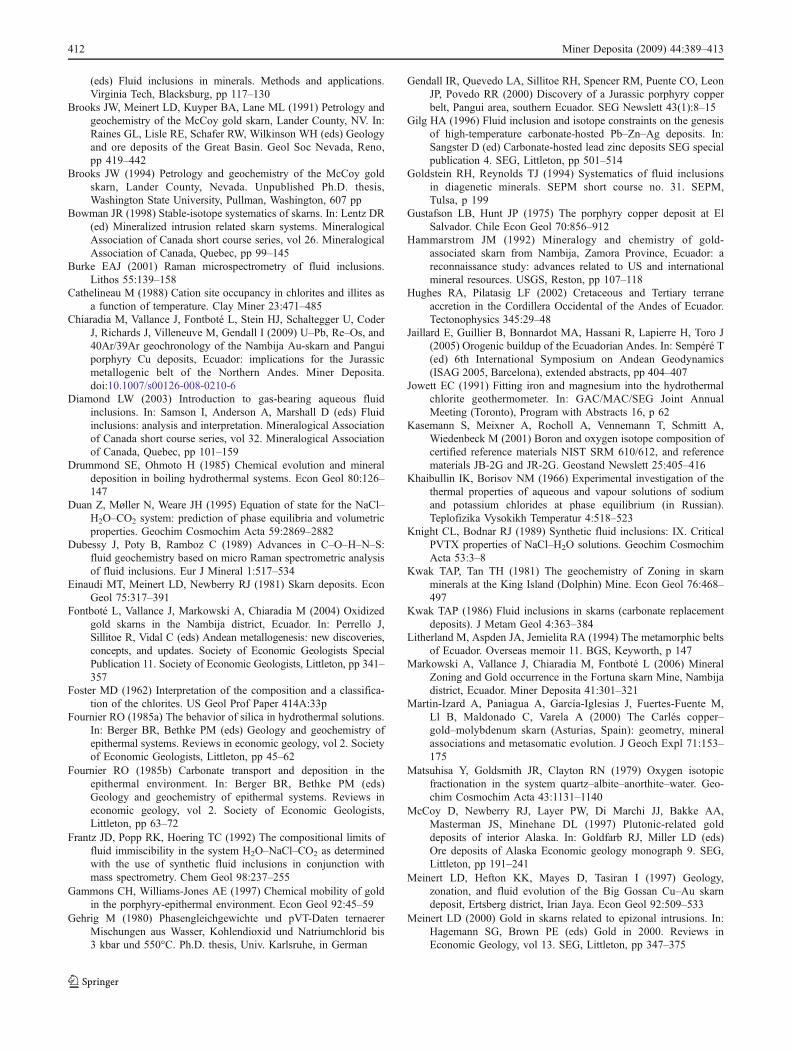
(eds) Fluid inclusions in minerals. Methods and applications.Virginia Tech, Blacksburg, pp 117–130
Brooks JW, Meinert LD, Kuyper BA, Lane ML (1991) Petrology andgeochemistry of the McCoy gold skarn, Lander County, NV. In:Raines GL, Lisle RE, Schafer RW, Wilkinson WH (eds) Geologyand ore deposits of the Great Basin. Geol Soc Nevada, Reno,pp 419–442
Brooks JW (1994) Petrology and geochemistry of the McCoy goldskarn, Lander County, Nevada. Unpublished Ph.D. thesis,Washington State University, Pullman, Washington, 607 pp
Bowman JR (1998) Stable-isotope systematics of skarns. In: Lentz DR(ed) Mineralized intrusion related skarn systems. MineralogicalAssociation of Canada short course series, vol 26. MineralogicalAssociation of Canada, Quebec, pp 99–145
Burke EAJ (2001) Raman microspectrometry of fluid inclusions.Lithos 55:139–158
Cathelineau M (1988) Cation site occupancy in chlorites and illites asa function of temperature. Clay Miner 23:471–485
Chiaradia M, Vallance J, Fontboté L, Stein HJ, Schaltegger U, CoderJ, Richards J, Villeneuve M, Gendall I (2009) U–Pb, Re–Os, and40Ar/39Ar geochronology of the Nambija Au-skarn and Panguiporphyry Cu deposits, Ecuador: implications for the Jurassicmetallogenic belt of the Northern Andes. Miner Deposita.doi:10.1007/s00126-008-0210-6
Diamond LW (2003) Introduction to gas-bearing aqueous fluidinclusions. In: Samson I, Anderson A, Marshall D (eds) Fluidinclusions: analysis and interpretation. Mineralogical Associationof Canada short course series, vol 32. Mineralogical Associationof Canada, Quebec, pp 101–159
Drummond SE, Ohmoto H (1985) Chemical evolution and mineraldeposition in boiling hydrothermal systems. Econ Geol 80:126–147
Duan Z, Møller N, Weare JH (1995) Equation of state for the NaCl–H2O–CO2 system: prediction of phase equilibria and volumetricproperties. Geochim Cosmochim Acta 59:2869–2882
Dubessy J, Poty B, Ramboz C (1989) Advances in C–O–H–N–S:fluid geochemistry based on micro Raman spectrometric analysisof fluid inclusions. Eur J Mineral 1:517–534
Einaudi MT, Meinert LD, Newberry RJ (1981) Skarn deposits. EconGeol 75:317–391
Fontboté L, Vallance J, Markowski A, Chiaradia M (2004) Oxidizedgold skarns in the Nambija district, Ecuador. In: Perrello J,Sillitoe R, Vidal C (eds) Andean metallogenesis: new discoveries,concepts, and updates. Society of Economic Geologists SpecialPublication 11. Society of Economic Geologists, Littleton, pp 341–357
Foster MD (1962) Interpretation of the composition and a classifica-tion of the chlorites. US Geol Prof Paper 414A:33p
Fournier RO (1985a) The behavior of silica in hydrothermal solutions.In: Berger BR, Bethke PM (eds) Geology and geochemistry ofepithermal systems. Reviews in economic geology, vol 2. Societyof Economic Geologists, Littleton, pp 45–62
Fournier RO (1985b) Carbonate transport and deposition in theepithermal environment. In: Berger BR, Bethke PM (eds)Geology and geochemistry of epithermal systems. Reviews ineconomic geology, vol 2. Society of Economic Geologists,Littleton, pp 63–72
Frantz JD, Popp RK, Hoering TC (1992) The compositional limits offluid immiscibility in the system H2O–NaCl–CO2 as determinedwith the use of synthetic fluid inclusions in conjunction withmass spectrometry. Chem Geol 98:237–255
Gammons CH, Williams-Jones AE (1997) Chemical mobility of goldin the porphyry-epithermal environment. Econ Geol 92:45–59
Gehrig M (1980) Phasengleichgewichte und pVT-Daten ternaererMischungen aus Wasser, Kohlendioxid und Natriumchlorid bis3 kbar und 550°C. Ph.D. thesis, Univ. Karlsruhe, in German
Gendall IR, Quevedo LA, Sillitoe RH, Spencer RM, Puente CO, LeonJP, Povedo RR (2000) Discovery of a Jurassic porphyry copperbelt, Pangui area, southern Ecuador. SEG Newslett 43(1):8–15
Gilg HA (1996) Fluid inclusion and isotope constraints on the genesisof high-temperature carbonate-hosted Pb–Zn–Ag deposits. In:Sangster D (ed) Carbonate-hosted lead zinc deposits SEG specialpublication 4. SEG, Littleton, pp 501–514
Goldstein RH, Reynolds TJ (1994) Systematics of fluid inclusionsin diagenetic minerals. SEPM short course no. 31. SEPM,Tulsa, p 199
Gustafson LB, Hunt JP (1975) The porphyry copper deposit at ElSalvador. Chile Econ Geol 70:856–912
Hammarstrom JM (1992) Mineralogy and chemistry of gold-associated skarn from Nambija, Zamora Province, Ecuador: areconnaissance study: advances related to US and internationalmineral resources. USGS, Reston, pp 107–118
Hughes RA, Pilatasig LF (2002) Cretaceous and Tertiary terraneaccretion in the Cordillera Occidental of the Andes of Ecuador.Tectonophysics 345:29–48
Jaillard E, Guillier B, Bonnardot MA, Hassani R, Lapierre H, Toro J(2005) Orogenic buildup of the Ecuadorian Andes. In: Sempéré T(ed) 6th International Symposium on Andean Geodynamics(ISAG 2005, Barcelona), extended abstracts, pp 404–407
Jowett EC (1991) Fitting iron and magnesium into the hydrothermalchlorite geothermometer. In: GAC/MAC/SEG Joint AnnualMeeting (Toronto), Program with Abstracts 16, p 62
Kasemann S, Meixner A, Rocholl A, Vennemann T, Schmitt A,Wiedenbeck M (2001) Boron and oxygen isotope composition ofcertified reference materials NIST SRM 610/612, and referencematerials JB-2G and JR-2G. Geostand Newslett 25:405–416
Khaibullin IK, Borisov NM (1966) Experimental investigation of thethermal properties of aqueous and vapour solutions of sodiumand potassium chlorides at phase equilibrium (in Russian).Teplofizika Vysokikh Temperatur 4:518–523
Knight CL, Bodnar RJ (1989) Synthetic fluid inclusions: IX. CriticalPVTX properties of NaCl–H2O solutions. Geochim CosmochimActa 53:3–8
Kwak TAP, Tan TH (1981) The geochemistry of Zoning in skarnminerals at the King Island (Dolphin) Mine. Econ Geol 76:468–497
Kwak TAP (1986) Fluid inclusions in skarns (carbonate replacementdeposits). J Metam Geol 4:363–384
Litherland M, Aspden JA, Jemielita RA (1994) The metamorphic beltsof Ecuador. Overseas memoir 11. BGS, Keyworth, p 147
Markowski A, Vallance J, Chiaradia M, Fontboté L (2006) MineralZoning and Gold occurrence in the Fortuna skarn Mine, Nambijadistrict, Ecuador. Miner Deposita 41:301–321
Martin-Izard A, Paniagua A, García-Iglesias J, Fuertes-Fuente M,Ll B, Maldonado C, Varela A (2000) The Carlés copper–gold–molybdenum skarn (Asturias, Spain): geometry, mineralassociations and metasomatic evolution. J Geoch Expl 71:153–175
Matsuhisa Y, Goldsmith JR, Clayton RN (1979) Oxygen isotopicfractionation in the system quartz–albite–anorthite–water. Geo-chim Cosmochim Acta 43:1131–1140
McCoy D, Newberry RJ, Layer PW, Di Marchi JJ, Bakke AA,Masterman JS, Minehane DL (1997) Plutonic-related golddeposits of interior Alaska. In: Goldfarb RJ, Miller LD (eds)Ore deposits of Alaska Economic geology monograph 9. SEG,Littleton, pp 191–241
Meinert LD, Hefton KK, Mayes D, Tasiran I (1997) Geology,zonation, and fluid evolution of the Big Gossan Cu–Au skarndeposit, Ertsberg district, Irian Jaya. Econ Geol 92:509–533
Meinert LD (2000) Gold in skarns related to epizonal intrusions. In:Hagemann SG, Brown PE (eds) Gold in 2000. Reviews inEconomic Geology, vol 13. SEG, Littleton, pp 347–375
412 Miner Deposita (2009) 44:389–413
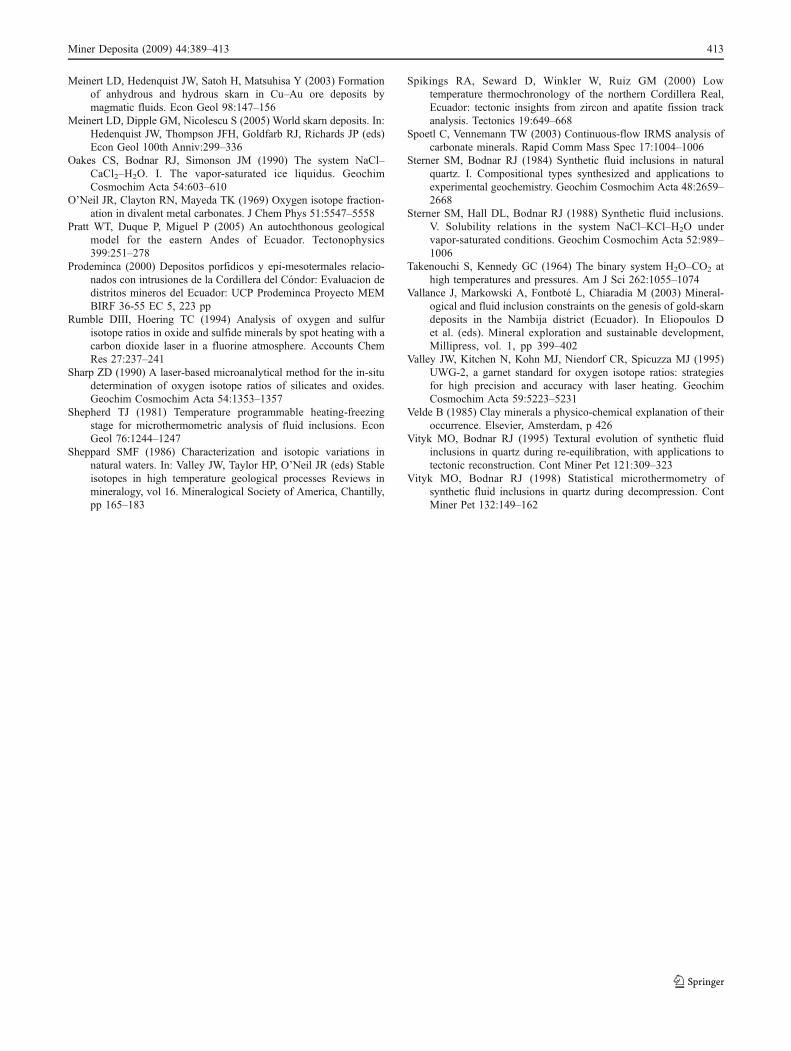
Meinert LD, Hedenquist JW, Satoh H, Matsuhisa Y (2003) Formationof anhydrous and hydrous skarn in Cu–Au ore deposits bymagmatic fluids. Econ Geol 98:147–156
Meinert LD, Dipple GM, Nicolescu S (2005) World skarn deposits. In:Hedenquist JW, Thompson JFH, Goldfarb RJ, Richards JP (eds)Econ Geol 100th Anniv:299–336
Oakes CS, Bodnar RJ, Simonson JM (1990) The system NaCl–CaCl2–H2O. I. The vapor-saturated ice liquidus. GeochimCosmochim Acta 54:603–610
O’Neil JR, Clayton RN, Mayeda TK (1969) Oxygen isotope fraction-ation in divalent metal carbonates. J Chem Phys 51:5547–5558
Pratt WT, Duque P, Miguel P (2005) An autochthonous geologicalmodel for the eastern Andes of Ecuador. Tectonophysics399:251–278
Prodeminca (2000) Depositos porfidicos y epi-mesotermales relacio-nados con intrusiones de la Cordillera del Cóndor: Evaluacion dedistritos mineros del Ecuador: UCP Prodeminca Proyecto MEMBIRF 36-55 EC 5, 223 pp
Rumble DIII, Hoering TC (1994) Analysis of oxygen and sulfurisotope ratios in oxide and sulfide minerals by spot heating with acarbon dioxide laser in a fluorine atmosphere. Accounts ChemRes 27:237–241
Sharp ZD (1990) A laser-based microanalytical method for the in-situdetermination of oxygen isotope ratios of silicates and oxides.Geochim Cosmochim Acta 54:1353–1357
Shepherd TJ (1981) Temperature programmable heating-freezingstage for microthermometric analysis of fluid inclusions. EconGeol 76:1244–1247
Sheppard SMF (1986) Characterization and isotopic variations innatural waters. In: Valley JW, Taylor HP, O’Neil JR (eds) Stableisotopes in high temperature geological processes Reviews inmineralogy, vol 16. Mineralogical Society of America, Chantilly,pp 165–183
Spikings RA, Seward D, Winkler W, Ruiz GM (2000) Lowtemperature thermochronology of the northern Cordillera Real,Ecuador: tectonic insights from zircon and apatite fission trackanalysis. Tectonics 19:649–668
Spoetl C, Vennemann TW (2003) Continuous-flow IRMS analysis ofcarbonate minerals. Rapid Comm Mass Spec 17:1004–1006
Sterner SM, Bodnar RJ (1984) Synthetic fluid inclusions in naturalquartz. I. Compositional types synthesized and applications toexperimental geochemistry. Geochim Cosmochim Acta 48:2659–2668
Sterner SM, Hall DL, Bodnar RJ (1988) Synthetic fluid inclusions.V. Solubility relations in the system NaCl–KCl–H2O undervapor-saturated conditions. Geochim Cosmochim Acta 52:989–1006
Takenouchi S, Kennedy GC (1964) The binary system H2O–CO2 athigh temperatures and pressures. Am J Sci 262:1055–1074
Vallance J, Markowski A, Fontboté L, Chiaradia M (2003) Mineral-ogical and fluid inclusion constraints on the genesis of gold-skarndeposits in the Nambija district (Ecuador). In Eliopoulos Det al. (eds). Mineral exploration and sustainable development,Millipress, vol. 1, pp 399–402
Valley JW, Kitchen N, Kohn MJ, Niendorf CR, Spicuzza MJ (1995)UWG-2, a garnet standard for oxygen isotope ratios: strategiesfor high precision and accuracy with laser heating. GeochimCosmochim Acta 59:5223–5231
Velde B (1985) Clay minerals a physico-chemical explanation of theiroccurrence. Elsevier, Amsterdam, p 426
Vityk MO, Bodnar RJ (1995) Textural evolution of synthetic fluidinclusions in quartz during re-equilibration, with applications totectonic reconstruction. Cont Miner Pet 121:309–323
Vityk MO, Bodnar RJ (1998) Statistical microthermometry ofsynthetic fluid inclusions in quartz during decompression. ContMiner Pet 132:149–162
Miner Deposita (2009) 44:389–413 413