Embed Size (px)
Citation preview
MAGNETIC CHARACTERISTICS OF CARBONIFEROUS
CONTINENTAL DEPOSITIONAL SYSTEMS: IMPLICATIONS FOR THE
RECOGNITION OF DEPOSITIONAL HIATUSES
Frank B. Evans
Thesis submitted to the Graduate Faculty of
Virginia Polytechnic Institute and State University
in partial fulfillment of the requirements of the degree of
MASTER OF SCIENCE
in
GEOSCIENCES
Kenneth A. Eriksson, Chair
Richard D. Law
Michal Kowalewski
April 13, 2006
Blacksburg, Virginia
Keywords: Carboniferous, Paleosols, Sandstone, Diagenesis, Rock magnetism, Magnetic
hysteresis, Appalachian Basin
Copyright 2006, Frank B. Evans

MAGNETIC CHARACTERISTICS OF CARBONIFEROUS CONTINENTAL
DEPOSITIONAL SYSTEMS: IMPLICATIONS FOR THE RECOGNITION OF
DEPOSITIONAL HIATUSES
by
Frank B. Evans
Abstract
Quaternary magnetic studies have provided the conceptual framework to bridge magnetic studies into ancient systems. In cases where environmental materials have been subjected to diagenetic alteration two questions come to mind: 1) What part of the magnetic signal is preserved in the rocks; and 2) can the preserved signal be used to infer/identify magnetic patterns that are characteristic of the depositional, post-depositional, and/or diagenetic environment. Analyses of multi-parameter magnetic experiments conducted on upper Mississippian and lower Pennsylvanian continental successions reveal that distinct depositional, pedogenic, and diagenetic magnetic patterns can be separated and identified. Evidence for a primary depositional signal in several of the upper Mississippian lithofacies is identified by a detrital remanence component attributed to source-area-derived magnetite/titanomagnetite. Red and gray vertisols preserve a Mississippian pedogenic signal characterized by magnetic enrichment, depletion, and amalgamation patterns that are associated with the removal and transport of Fe-rich clays as well as vertical mixing by shrink-swell mechanisms. These well-developed vertisols are interpreted to reflect significant hiatuses in sedimentation associated with prolonged exposure on interfluve/floodplain surfaces that may be correlative with incised valleys (lowstand surface of erosion). Similarly, in lower Pennsylvanian quartz arenite facies, early siderite cementation zones as well as conglomerate lags with distinctive magnetic characteristics are thought to reflect periods of prolonged exposure and to define unconformities within compound valley fills.

Acknowledgements Completing a M.S. in Geology is truly a marathon event, and I would not have been able
to complete this journey without the aid and support of countless people over the past three years. My foremost thank goes to my thesis adviser Dr. Kenneth A. Eriksson. His leadership, support, attention to detail, hard work, and scholarship have set an example I hope to match some day. Without him, this dissertation would not have been possible. I thank him for his patience and encouragement that carried me on through difficult times, and for his insights and suggestions that helped to shape my research skills. His valuable feedback contributed greatly to this dissertation.
I thank the rest of my thesis committee members: Dr. Richard D. Law and Dr. Michal Kowalewski. Their valuable feedback helped me to improve the dissertation in many ways. I am also grateful to my former undergraduate adviser Dr. Whitney J. Autin, who greatly influenced my research tract and encouraged me to pursue a graduate degree in Geology. His visionary thoughts and energetic working style have influenced me greatly as a geologist. Furthermore, he made necessary laboratory and field equipment available to me, and for that I am very grateful. I would also like thank Dr. Kenneth L. Verosub and Dr. Gary Acton, who advised me and helped me with various aspects of my research but notably the acquisition and interpretation of magnetic data collected at the UC Davis Paleomagnetism Laboratory.
I thank all the students and staff in the Virginia Tech Geosciences department, whose presences and fun-loving spirits made the grueling times tolerable. I enjoyed all the vivid discussions we had on various topics and had lots of fun being a member of this fantastic group. I wish to thank Robert J. Bodek in particular: as my friend and collegue, his insights and comments were invaluable over the years, and I look forward to a continuing collaboration with him in the future. Last but not least, I thank my parents Cecilia and Mark, for always being there when I needed them most, and for supporting me through all these years. Partial funding for my research was provided by a grant from the Geological Society of America.
iii
Contents
Abstract……………………………………………………….……………………………........ ii Acknowledgements………………………………………………………….…………………. iii Introduction…………………………………………………..…………………………………. 1
Appalachian Basin: Geologic Setting………………………………………………………... 2 Analytical Methods…………………………………………………………………………... 6
Upper Mississippian Continental Facies………………………..…………….……………... 10 Geological Background…………………………………………………………………….. 10 Lithofacies A: Sandstone Facies…………………………………………………...……….. 11 Lithofacies B: Gray Mudstone Facies…………………………………………………….… 12 Lithofacies C: Gray Vertisol Facies……………………………………………………….... 13 Lithofacies D: Red Vertisol Facies…………………………………………………………. 14 Lithofacies E: Limestone Facies……………………………………………………………. 15
Lower Pennsylvanian Incised-Valley-Fill Facies………….……………………………….... 16 Geological Background………………………………………………………………….…. 16
Lithofacies F: Quartz Arenite Facies…………………………………………………..…… 16 Lithofacies G: Heterolithic Facies………………………………………………………….. 17 Lithofacies H: Dark Mudstone-Sandstone Facies…...….…………………………….…….. 18
Magnetic Characteristics…………………………………………………………………….... 18 Lithofacies A: Sandstone Facies…………………………………………………...……….. 18
Lithofacies B: Gray Mudstone Facies…………………………………………………….… 23 Lithofacies C: Gray Vertisol Facies……………………………………………………….... 24 Lithofacies D: Red Vertisol Facies…………………………………………………………. 25
Lithofacies E: Limestone Facies……………………………………………………………. 26 Lithofacies F: Quartz Arenite Facies…………………………………………………..…… 27 Lithofacies G: Heterolithic Facies………………………………………………………….. 32 Lithofacies H: Dark Mudstone-Sandstone Facies…...….…………………………….…….. 32 Correlation of χh and χferri with MS…………………………………………………………. 34 Temperature Dependent Magnetic Results……………………………………….………… 35
Interpretation of Magnetic Facies………………………………….………………………… 40 Upper Mississippian Magnetic Signals……………………………………………………... 40 Lower Pennsylvanian Magnetic Signals: Core WVGS-4…………………………………... 45 Lower Pennsylvanian Magnetic Signals: Core MM-1……………...………….……….….. 47
Discussion…………………………………………………………………………………….... 48 Upper Mississippian………………………………….…………………………………....... 48 Lower Pennsylvanian…………………………………………………………..…………… 50
Conclusion……………………………………..………………………………………….…… 51 References………………………………………………………………………….………….. 54 Appendix Contents ...………………………………………………………………………..…. 61 Appendix A…………………………………………………………………………………...... 62 Appendix B…………………………………………………………………………………….. 78 Appendix C………………………………………………………………………...…………. 100 Appendix D…………………………………………………………..……………………….. 117 Appendix E………………………………………………………..………………………….. 138 Appendix F………………………………………………………………………………..….. 157
iv

List of Figures
Figure 1 Regional Appalachian Basin map..................................................................................Figure 2 Stratigraphic column of the upper Mississippian Mauch Chunk Group........................4 Figure 3 Generalized lithostratigraphic chart for the lower and middle Pennsylvanian record....Figure 4 Regional map of West Virginia and Virginia showing the study area...........................7Figure 5 Lithologies and magnetic susceptibility measuements from upper Mississippian
Figure 6 Hysteresis loop examples.............................................................................................10 Figure 7 Upper Mississippian Facies Coercivity of remanence (BCR) vs. Low-frequency
magnetic susceptibility (χlf).........................................................................................19 Figure 8 Upper Mississippian Facies Day Plot..........................................................................20 Figure 9 Upper Mississippian Facies Ferrimagnetic susceptibility (χferri) vs. High-field
susceptibility (χh).........................................................................................................21 Figure 10 Paramagnetic MS vs. Ferri/antiferromagnetic MS for upper Mississippian samples....22 Figure 11 Lower Pennsylvanian Facies Coercivity of remanence (BCR) vs. Low-frequency
magnetic susceptibility (χlf).................................................................................…... 27 Figure 12 Lower Pennsylvanian Facies Day Plot........................................................................29 Figure 13 Lower Pennsylvanian Facies Ferrimagnetic susceptibility (χferri) vs. Paramagnetic
susceptibility (χh).........................................................................................................30Figure 14 Figure 15 High-field susceptibility (χh) vs. Paramagnetic MS for upper Mississippian and
lower Pennsylvanian Facies.........................................................................................34 Figure 16 Upper Mississippian Temperature-dependent susceptibility.......................................36 Figure 17 Lower Pennsylvanian stepwise thermal hysteresis acquisitions..................................38 Figure 18 Lower Pennsylvanian Temperature-dependent susceptibility.....................................39
v
3
5
outcrops and lower Pennsylvanian cores.......................................................................
Paramagnetic MS vs. Ferri/antiferromagnetic MS for lower Pennsylvanian samples...31
8

Introduction Extension of Quaternary environmental magnetic techniques (e.g. Verosub and Roberts,
1995; Maher, 1998; Geiss and Banerjee, 1997; Florindo et al., 1999) to the ancient rock record
(e.g. Channel and McCabe, 1994; Rankey and Farr, 1997; Soreghan et al., 1997, 2002; Ellwood
et al., 2000, 2001; Retallack et al., 2003) has demonstrated that these methods are capable of
identifying climatologic, pedologic and diagenetic processes in lithified sedimentary rocks. The
above researchers have shown that unique relationships exist between the magnetic properties of
detrital grains and authigenic/ post-depositional minerals within alluvial sediments. In well-
drained sediments and soils, magnetic patterns primarily arise in response to the mineralogy,
concentration, and grain size of iron oxide complexes. In contrast, hydromorphic conditions
promote iron reduction and mobilization in which cases iron sulfides and/or other reduced iron
complexes may dominate. However, in cases where post-depositional and/or diagenetic
conditions occur, the primary magnetic properties (mineralogy, concentration, and/or grain size)
may change such that a completely different combination of such properties exists within the
altered materials.
Over the past 30 years, magnetic investigations of sedimentary sequences have been used
largely to correlate climatic changes with pedogenic modification of sedimentary units. Recent
studies (e.g. Beget et al, 1990; Verosub et al., 1993; Maher and Thompson, 1995; Geiss, 1997;
Maher, 1998; Florindo et al, 1999; Virina et al, 2000; Evans, 2001; Evans and Heller, 2001;
Porter, 2001) have demonstrated the usefulness of magnetic properties of sediments as proxy
indicators for paleoclimate. Studies on Quaternary sediments of the Chinese Loess Plateau
concluded that magnetic susceptibility maxima occur in intercalated paleosols (associated with
warm interglacials) and susceptibility minima occur in unaltered loess (associated with dry cool
glacial times) (Heller and Liu, 1984; Kukla et al., 1988; Liu et al., 1992). Many authors have
attributed this enhancement to the in situ production of very fine magnetite and/or maghemite
grains under oxidizing conditions (e.g. Liu et al., 1992; Verosub et al., 1993; Evans and Heller,
1994; Heller and Evans, 1995). However, studies in Alaska (Begét et al., 1990) and Siberia
(Chlachula et al., 1998) found the opposite relationship; during glacial times, wind-vigor was
able to entrain dense magnetic particles into the atmosphere resulting in susceptibility maxima
within unaltered loess sections. Studies in Russia and the Ukraine (e.g. Tsatskin et al., 1998)
documented magnetic depletions within some reduced paleosol profiles where hydromorphic
- 1 -

conditions caused chemical degradation (and eventual removal) of magnetite leading to a
decrease in magnetic susceptibility, which has been termed the “gleying” model.
Whereas a multitude of studies and techniques associated with natural and synthetic
magnetic materials exist, the great majority are related to unlithified Quaternary strata. In
comparison to present day cases, little work has been conducted on ancient sedimentary systems,
and even less on ancient continental fluvial/ alluvial strata, to determine the processes and
pathways that a magnetic material follows from the time it is deposited through its burial and
exhumation (e.g. Channel and McCabe, 1994; Rankey and Farr, 1997). Quaternary magnetic
studies have provided the conceptual framework to advance magnetic studies into ancient
systems. In cases where environmental materials have been subjected to diagenetic alteration two
questions arise: 1) What part of the magnetic signal is preserved in the rocks; and 2) can the
preserved signal be used to infer/identify magnetic patterns that are characteristic of the
depositional, post-depositional, and/or diagenetic environments. These fundamental questions
need to be addressed in sedimentary rocks where the influence of burial compaction,
temperature, and pore fluid chemistry may have modified the magnetic properties present at the
time of deposition.
This study is concerned with identifying distinct syndepositional and diagenetic magnetic
patterns in Carboniferous fluvial/ alluvial strata in the Central Appalachian Basin (Fig. 1).
Unique diagenetic changes preserved in these rocks arise as a product of the initial
environmental conditions present at the time of deposition. The hypothesis of the study is that
diagenetic overprinting alters the primary magnetic characteristics present at the time of
deposition within continental fluvial/ alluvial strata. In unique circumstances, the magnetic
character of the diagenetically altered magnetic material can be used to identify primary
magnetic patterns, and in certain situations, be used to identify diagenetically-modified,
subaerially-exposed facies. By combining field observations in Carboniferous fluvial and alluvial
facies with multi-parameter magnetic techniques, the identification and characterization of
lithofacies in ancient continental fluvial strata can be magnetically linked to modern analogs.
Appalachian Basin: Geologic Setting
Multiple episodes of Paleozoic tectonic collisions resulted in development of the
Appalachian Foreland Basin (Dewey, 1981). In response to subsidence and deposition related to
- 2 -

thrust loading in the hinterland, as much as 7 km of Middle Ordovician to Lower Permian strata
were deposited in the Central Appalachian Basin (Quinlan and Beaumont, 1984) that is bounded
to the southeast by the Appalachian fold and thrust-belt and to the west by the Cincinnati Arch
(Fig. 1).
This study focuses on the upper Mississippian Mauch Chunk Group and the lower
Pennsylvanian New River Formation. The Mauch Chunk Group in West Virginia consists of the
Hinton, Princeton, and Bluestone formations (Fig. 2) that comprise an east-southeastward-
thickening clastic wedge that reaches a maximum thickness of ~600 meters in Mercer County
- 3 -
Figure 1 - Location map of the Appalachian Basin (shaded). Study area is shown by the shaded box. Aerial extent
of the Appalachian Basin, Swezey (2002). The western Appalachian Basin boundary (the Cincinnati Arch), Greb et al.
(2000 and 2004). The eastern Appalachian Basin boundary (the fold-thrust front), Englund and Thomas (1989).

(Miller and Eriksson, 1999). Biostratigraphic data compiled by Miller (1998) indicate that th
base of the study interval correlates with the lower Namurian A (Pendleian), and that the top is
no younger than the middle/late Namurian A (middle Arnsbergian). The Carboniferous time
scale provided by Davydov et al. (2004) give estimates of 326.4 ? 1.6 Ma for the lower boundar
e
y
and ~ 321 Ma for the upper boundary. Therefore, the terval is ~ 5.6 Myr.
ubsurface correlation of the Mauch Chunk Group shows that these facies extend over some
of
duration of the study in
S
15,000 km2 into adjacent parts of Virginia and Kentucky (Miller and Eriksson, 2000). Tectonic
highlands along the southeastern margin of the central Appalachian basin provided the source
sediments for the Mauch Chunk terrigenous units (Englund and Thomas, 1990; Miller and
Eriksson, 2000). During the Late Mississippian, the region moved northward into sub-equatorial
- 4 -
Figure 2 - Stratigraphic column of the upperMississippian Mauch Chunk Group in the CentralAppalachian Basin showing typical gamma-raysignature from west Mercer County W.V. (Millerand Eriksson, 2000). Age constraints are based onbiostratigraphic data compiled by Miller (1998)and the Carboniferous Time Scale of Davydov etal. (2004).

latitudes, in which a semiarid to seasonal climate prevailed (Cecil, 1990; Beauthin and Blak
2002).
The lower Pennsylvanian New River Formation in West Virginia consists of ~300 mete
of pred
e,
rs
ominantly nonmarine siliciclastics (Klein and Willard, 1989) that onlap to the northwest
and th
(
icken towards the southeast of the basin (Englund and Thomas, 1990). In West Virginia,
the New River Formation is dominated by several quartz-rich sandstone bodies that are named
from bottom to top) the Pineville, Lower Raleigh, Upper Raleigh, Guyandot, Lower Nuttall, and
Upper Nuttall sandstones (Fig. 3). New River Formation sandstone bodies are part of the distal
foreland basin deposits that interfinger towards the thrust front (Fig. 1) with marginal marine and
subordinate nonmarine strata (Englund and Tomas, 1990; Korus, 2002). Studies indicate (e.g.
Figure 3 - Generalized lithostratigraphic chart for the lower and middle Pennsylvanian record of the Central
Appalachian Basin from Korus (2002). Detailed column shows typical lithologies of the New River Formation. The
es of
the New River Formation.
names of major sandstone bodies and mineable coal seams are given. Age estimates are based on megafloral
biostratigraphy by Blake (1997) and correlation with western European stages (Riley and Turner, 1995). The
Carboniferous time scales provided by Davydov et al. (2004) give estimates for the lower and upper boundari
- 5 -
Blake, 1997; Riley and Turner, 1995) that the interval between the base of the New River
Formation and the base of the Kanawha Formation (Fig. 3) corresponds to the Namurian B/C
Westphalian A/B. The Carboniferous times scales provided by Davydov et al. (2004) give
estimates of 311.7 ? 1.1 Ma for the upper boundary and 318.1 ? 1.3 Ma for the upper boundary
of this stage. Therefore, the duration of the study interval is ~ 6 Myr.
Analytical Methods Three upper Mississippian outcrops were studied: PWV-1 and PHS-1 are exposed road-
cuts along Highway 460 east of Prin le SSWV-1 is located along I-64
near Sandstone, West Virginia (Fig. 4). Two Lower Pennsylvanian cores that spanned the Upper
and Lower Raleigh sandstones were obtained from
Retallack (1988). By the use of a portable gas-powered drill, 50 upper Mississipian outcrop
ples were collected f
nd
? ?
representative samples were chosen from the core for detailed magnetic characterization.
ceton, West Virginia, whi
coal-bed methane exploration test wells. The
first, WVGS-4, is located ~15 miles northeast of Beckely near I-64 and the second, MM-9 is
located ~10 miles west of Beckely near Bolt, W.Va. off of Rt. 99 (Fig. 4). The three upper
Mississippian outcrops were logged at 10 cm intervals (Fig. 5a to c). In WVGS-4, specific
intervals were measured that were previously analyzed for thin-section, microprobe, and fluid
inclusion studies by Reed et al. (2005) (Fig. 5d). The second core, MM-9 was logged at 10 cm
intervals (Fig. 5e). Using a Bartington MS2 susceptibility meter with surface scanning sensor
(MS2K), volume magnetic susceptibility (? ) data were collected on outcrop from the Mauch
Chunk Formation and from core for the Upper and Lower Raleigh sandstones. In order to obtain
representative ? values, care was taken to avoid siderite and quartz clasts within conglomeratic
intervals in core WVGS-4.
Upper Mississippian paleosols were analyzed in the field using the methods described by
sam rom the three outcrops for magnetic characterization. Representative
samples from each lithofacies were collected, as well as samples with anomalous ? values. A
total of 56 samples from core WVGS-4 were selected, categorized by lithofacies, and ?
measured. Selected samples studied by Reed et al. (2005) from this core were also described a
used for magnetic analysis. A total of 908 continuous samples from core MM-9 samples were
described, categorized by lithofacies, and measured. Based on lithology and patterns,
- 6 -

Fo
Da
su
m
46
co
pr
alt
no
su
fu
ex
tem
sa
O2
m
Figure 4 - Regional map of West Virginiaand Virginia showing the study area. Theenlarged map shows the location of upperMississippian outcrops (black squares) andlower Pennsylvanian cores (black stars).
r magnetic analysis, all representative outcrop and core samples were measured at the UC
vis Paleomagnetism Laboratory in Davis, CA for: (1) frequency-dependent magnetic
sceptibility (χfd%) using a Bartington Instruments MS2B Dual Frequency Sensor with an AC
agnetic field amplitude of 80 Am-1 at low frequency (χlf, 465 Hz) and high frequency (χhf,
tic
steresis
he
y in
50 Hz) (χfd% for all the samples measured was less than 1% and, therefore, superparamagne
ntributions are considered to be negligible for all of the samples measured); and (2) hy
operties (MS, MRS, BC, BCR, χd and χh; Fig. 6) using a Princeton Instruments MicroMag 2900
ernating gradient magnetometer. The hysteresis properties obtained for each sample were
rmalized on a per mass [kg] basis. For selected samples, additional temperature-dependent
sceptibility measurements (TDS) were conducted on a Kappabridge KLY-3S with CS-3
rnace apparatus from room-temperature to 700oC and then back. Sequential step-wise heating
periments were conducted on selected samples by measuring hysteresis properties at room-
perature after each heating step. Prior to the first heating step, the hysteresis properties of t
mples were measured. After the initial measurement, the samples were heated sequentiall
using a non-magnetic furnace at temperatures of 300, 400, 500, 550, and 600oC. The various
agnetic parameters used in this study are explained in Appendix A.
- 7 -

Figure 5
(a)
(b)
(c)
- 8 -

(d)
(e)
Figure 5
- 9 -

Figure 5 - ogies and magnetic susceptibility measurements from upper Mississippian outcrops (a-c) and
r Pennsylvanian cores (d and e). Bulls-eyed circles
Lithol
lowe ( ) demarcate samples selected for detailed magnetic
analysis. Cement types determined by Reed et al. (2005) are shown in Figure 5d.
Upper Mississippian Continental Facies Geological Background
Upper Mississippian strata in the study area consist of red and green mudrocks and
interbedded sandstones that were deposited in terrestrial and coastal environments (Miller and
Eriksson, 2000; Beuthin and Blake, 2002). Miller and Eriksson (2000) recognized five sequence
types in the upper Mississippian Mauch Chunk Group outcrop belt in West Virginia: (1) major
incised valley fill to coastal plain, (2) major incised valley fill to deltaic, (3) minor incised valley
fill, (4) coastal plain/flood plain, and (5) marine-dominated sequences. These authors attribute
- 10 -
Figure 6

Figure 6 - Examples of hysteresis loops uncorrected (to left) and corrected for paramagnetic or diamagnetic
influence (to the right) for upper Mississippian and lower ennsylvanian facies. (a) paramagnetic, ferrimagnetic
antiferromagnetic; (b) wasp-waisted ferrimagnetic and antiferromagnetic; (c) param
P , and
agnetic and ferrimagnetic; (c)
aramagnetic and ferrimagnetic; (d) ferrimagnetic; (e) antiferromagnetic and paramagnetic; (f) antiferromagnetic;
(g) diamagnetic and ferrimag f ) and the diamagnetic
χ nt to the slope of the closed uncorrected hysteresis loops above 0.8 T. Inset shows the
in the study.
paleoso d coaly zones that developed as floodplain sediments became water-logged due to a
relatively high water table (Miller and Eriksson, 1999; Miller and Eriksson, 2000).
Of particular interest to this study are coastal plain/flood plain sequences consisting of
sandstones, mudstones, red and gray vertisols, inclined heterolithic units, and lacustrine
carbonates. Figures 5a, b, and c illustrate the vertical succession of lithofacies in the three
measured sections, together with volume magnetic susceptibility (? ) profiles. It is clear from
these profiles that magnetic patterns and anomalies exist within and between lithofacies.
Individual lithofacies shown of the Figures 5a, b and c are discussed below.
Lithofacies A: Sandstone Facies
Sandstone facies consist of fine- to medium-grained lithic arenites. These sandstones
occur as lenticular channel-shaped bodies (C), inclined, lateral accretion, point-bar deposits (PB),
and non-channelized sheet-like bodies (S). Channel bodies range from 1 to 3.5 m thick and from
several to 50 m wide and erosionally truncate underlying floodplain facies. Channel fills are
typically thin laminated (1-5 cm) with plane bedding and rare low-angle trough cross-beds.
Internal fill patterns are typically upward-fining with rare occurrences of basal conglomerates
that consist of locally derived siltstone and mudstone clasts (Miller and Eriksson, 2000).
Inclined, lateral-accretion point-bar deposits consist of a ~10 cm basal conglomeratic channel lag
that truncates underlying red vertisol facies. The basal conglomerate consists of small pebbles of
p
netic; (h) ferrimagnetic loop. The high-field susceptibility (χ
susceptibility ( d) are equivale
key hysteresis parameters used
the cyclostratigraphy of these strata to fourth-order glacio-eustasy. Lowstand and transgressive
systems tracts consist of incised valleys infilled dominantly by tidal rhythmites. Highstand
systems tracts are dominated by floodplain siltstones and mudstones that have been in part
pedogenically transformed into red vertisols and rare calcisols (cf. Kraus and Bown, 1988). Tops
of some of the highstand systems tract deposits are characterized by thinner, gray to gray-white
ls an
- 11 -
dark gray, rounded, pedogenic calcareous nodules, minor red mudstone and siltstone intracla
Fe-oxide-rich argillaceous nodules, black rolled vertebrate bones, plant material and feldspar
grains in a fine-grained sandstone matrix (Turner and Eriksson, 1999). Overlying point-bar
deposits are 3-4 m thick and consist of alternating sandstone and mudstone facies. The sandstone
facies occur in beds up to 8 cm thick and consist of maroon-red, very fine- to fine-grained sand-
size particles. Sedimentary structures include sm
sts,
all-scale current ripple cross lamination and
carbonaceous plant debris (Turner and Eriksson, 1999). Mudstone beds up to 25 cm thick, are
ed
k and
tributar
ting,
se
events
ge deposition of silt
nd clay. The non-channelized sandstone bodies are comparable to the early Carboniferous
that were interpreted by Wright and Robinson (1988) as
crevass
m
typically silty and structureless but form weakly developed soil structures with shallow root
structures near the top of the deposit. Nonchannelized, sheet-like deposits are dark gray to r
with rare red siltstone/mudstone intraclasts incorporated along the base. These deposits are
tabular and range from 1 to 3 m in thickness and are continuous laterally for hundreds of meters.
Where outcrop conditions permit, these tabular sandstone facies can be traced laterally into
channel bodies.
Miller and Eriksson (2000) interpret the channelized sandstone bodies as trun
y channel deposits of low-sinuosity fluvial systems. They suggest that fluctuations in
relative seal-level may have triggered channel incision into flood-plain facies. Turner and
Eriksson (1999) interpret the lateral accretion facies as the deposits of small laterally migra
relatively shallow, meandering channels that occupied part of a dry coastal alluvial plain. The
authors also indicate that the sandstone-mudstone couplets formed during individual flood
where each couplet records rising-flood-stage erosion followed by falling-sta
a
floodplain deposits of South Wales
e splay deposits related to over-bank flooding.
Lithofacies B: Gray Mudstone Facies
Gray mudstone facies consist of clay- to silt-sized particles within tabular units up to 4
thick. Beds range in thickness from less than 1 cm to 3 cm and are typically tabular. Rare,
localized calcic zones are defined by irregular to concentric shaped siderite nodules that are
parallel to bedding planes (Miller and Eriksson, 2000).
The gray mudstones are thought to be relicts of seasonal suspension sedimentation on
overbank flood-plains on a low-relief landscape (Miller and Eriksson, 2000). Siderite nodules are
- 12 -

thought to reflect either evolving chemical conditions during progressive burial diagenesis (e.g.
Bailey et al., 1998) or the reduction of ferric oxyhydroxides by organic matter (e.g. Postma,
1982) under hydromorphic conditions.
Lithofacies C: Gray Vertisol Facies
Gray vertisol facies consist of clay and silt-rich mudstones that occur as single and
stacked tabular paleosols in beds up to 6 m thick. Pedogenic fabrics include platy to angular
blocky textures, clay coatings, and well-developed randomly oriented slickensides. Drab-halo
root traces are preserved in platy and blocky textured ped fabrics, and display single and
bifurcating patterns. Lycopod impressions occur in the upper section of one gray vertisol. Th
discontinuous calcite zones (~2 cm) defined by irregularly shaped carbonate nodules up to 3 cm
in length occur along the base of some gray paleosol facies (Miller and Eriksson, 1997, 2000
Pedogenic
ed
in
).
slickensides are the most prominent diagnostic feature in vertic paleosols in
the Ap
,
er
ssociated with periods of eustatic fall and
wstand. The shift to more hydromorphic (everwet) conditions was considered to be a response
lted in a narrowing of the inter-tropical convergence
zone an
ls to a
palachian Basin (Driese and Mora, 1993). These authors suggest that vertic structures
developed in the upper clay-rich parts of fining-upward sequences deposited by high sinuosity
single-channel forms in coastal alluvial plain settings. Field characteristics indicate that the
slickensides are randomly oriented, suggesting that they are of non-tectonic origin. Driese and
Mora (1993) also suggest that the peds developed by differential shearing to form angular blocky
aggregates that are attributed to frequent wetting and drying cycles.
The origin and significance of the gray gleyed to gray-white paleosols and associated
coaly zones in the upper Mississippian of southern West Virginia is a subject of debate. Mill
and Eriksson (1999) argued that the leached paleosols and coals that cap terrestrial highstand
facies developed during wetter, less seasonal climates a
lo
to increases in global ice cover that resu
d weakening of the monsoonal circulation systems to produce warmer and wetter
climatic conditions. In contrast, Beuthin and Blake (2002) attributed gleying in the paleoso
rising water table and proposed that the development of thin coal beds was fostered by the
accumulation of organic material in localized wet areas.
- 13 -

Lithofacies D: Red Vertisol Facies
Red vertisol facies are developed in clayey to sandy mudstone deposits that occur as
single and stacked tabular paleosols in beds up to 4 m thick. Pedogenic fabrics include angular
locky textures, clay coatings, and well-developed randomly oriented slickensides. Downward-
the upper sections in many of the red paleosols. Some root
n
:
rals in
and
sported and incorporated into sediments
as detrital grains; (4) inheritance from pre-existing red-beds and re-deposition as second-cycle
articles; and (5) precipitation directly from sea water during the initial stages of evaporation.
b
branching root traces are preserved in
traces exhibit either drab reduction haloes or completely reduced rhizoliths. Pedogenic
slickensides decrease in size as grain-size increases from clayey to sandy mudstones. In most
cases, soil development has disrupted the primary depositional fabrics such that bedding planes
cannot be identified.
Retallack (1988) suggests that red coloration, blocky soil textures, clay coatings and
pedogenic slickensides reflect seasonal wetting and drying of a well-drained clay-rich soil. These
characteristics are ubiquitous throughout the red vertisol facies and likely represent a similar
mode of formation to those suggested by Retallack (1988). The stacked nature of these red
paleosol facies suggest that repeated episodes of soil development occurred. This interpretatio
is analogous to that of Kraus and Bown (1988) in which stacked paleosols indicate prolonged
periods of pedogenesis on a distal floodplain.
The origin of hematite within the red vertisol facies remains problematic. Dunlop and
Ozdemir (1997) argue that hematite pigment in red beds may form via the dehydration of
goethite, the inversion of maghemite, or by the oxidation of magnetite
2αFeOOH αFe2O3 + H2O
γFe2O3 αFe2O3
2Fe3O4 + O2 3αFe2O3
Friedman and Sanders (1978) identified five modes of formation of hematite in red-beds: (1)
transport and re-deposition of detrital hematite formed in lateritic, humid-tropical climates by the
oxidation of ferrous iron derived from ferromagnesian silicate minerals (e.g. pyroxene,
hornblende, biotite, and chlorite); (2) in situ oxidation of ferrous iron in iron-bearing mine
previously deposited non-red sediments (e.g. ferromagnesian silicates and magnetite) to
brownish hydrated iron oxides that transform to hematite; (3) recrystallization of yellowish
brownish hydrated ferric oxides to hematite that was tran
p
- 14 -

Lateritic soils form as a result of intense subaerial chemical weathering under humid-
rals
eds are floodplain sediments that were deposited on a low-lying coastal
tone
rich sediments is promoted by seasonal lowering
of wate n
Lithofa
Limestone facies consist of yellow to gray laminated (1 to 3 cm) lime mudstones that
occur in 1.5 m thick tabular beds. This facies is intercalated with terrigenous red mudrocks and
its that
tropical and subtropical climates. As a result of intense weathering, most of the primary mine
are dissolved and transformed into secondary mineral assemblages, mainly kaolinite, gibbsite,
goethite, hematite, and quartz (Theveniaut and Freyssinet, 1999; Price et al., 1997). Upper
Mississippian strata in the central Appalachians generally developed under semi-arid to seasonal
conditions (Cecil, 1990; Beauthin and Blake, 2002). Therefore, conditions necessary for
development of lateritic soil profiles were unlikely to have existed. The fifth proposed
mechanism of hematite, precipitating from sea water, is not applicable to these rocks for the
reason that these red b
plain devoid of marine influence.
The second, third and fourth modes of formation for hematite in red-beds are favored
here for the reason that the upper Mississippian climate was seasonally wet and could likely
produce and oxidize ferric oxides and hydroxides to hematite. Moreover, recycled red muds
and siltstone clasts present in many lag deposits (e.g. basal point-bar deposits) have been
interpreted as second-cycle hematite-rich sediments. Similar studies indicate that in situ
reddening of detrital ferric hydroxides in clay-
r tables and development of well-drained oxygenated conditions that allow the oxidatio
of organic matter and eventual development of hematite (Burley et al., 1985).
cies E: Limestone Facies
persists laterally for hundreds of meters. Dense micrite with a weak laminar or peloidal fabric
and sparse ostracods and bivalves have been identified in thin section (Miller and Eriksson,
2000). Platt and Wright (1991) interpret similar carbonate beds as coastal or playa depos
developed during shallow floodplain inundation.
- 15 -
Lower Pennsylvanian Incised-Valley-Fill Facies
Geological Background
The New River Formation has been grouped into two main facies belts: a western be
dominated by thick (~70 meters) tabular (up to 90 km wide, ~500 km long) quartz arenites
grading upwards into heterolithic facies and dark mudstone-sandstone, and an eastern bel
dominated by shale, siltstone, coal, and discontinuous lithic sandstone bodies (Korus, 2
Lithologies in the eastern facies belt are interpreted as fluvio-deltaic deposits derived from th
fold-and-thrust belt to the southeast (Englund and Thomas, 1990). In contrast, lithologies in the
western facies belt are interpreted a
lt
t
002).
e
s the deposits of braided-alluvial trunk river systems that
flowed
lts
trends
oundary
Of particular interest to this study are the quartz arenites and associated heterolithic facies
e illustrate the associations of lithofacies and volume
agnet
malgamated sandstones up to 40 m thick.
Typical facies consist of coarse- to fine-grained sandstone with local quartz- and siderite-pebble
conglomerate lags that define reactivation surfaces indicative of multi-story channel fills. In
outcrop, Korus (2002) recognized a four-fold hierarchy of bounding surfaces within these
sandstone bodies in which upward-thinning, medium- to large-scale tabular and trough cross-bed
sets, plane bed, sand ripple cross strata are superimposed on gently inclined surfaces. This author
down the axis of the foreland basin (Korus, 2002). Furthermore, outcrop analyses of
equivalent facies in Kentucky and southwest Virgina reveal that the western quartz arenite be
consist of multistory, sheet-form, and channel-from elements (Greb et al., 2004). These authors
point out that pairs of composite sandstones in each quartz arenite belt occur along similar
and are separated by a mid-formation shale that possibly represents a genetic-sequence b
at its base. Heterolithic and dark mudstone facies that cap the major sandstone bodies are
interpreted as tidal estuarine deposits related to transgressive drowning of the braid plain (Korus,
2002).
of the western belt. Figures 5d and
m ic susceptibility (κ) profiles. It is clear from the magnetic patterns that anomalies exist
within and between lithofacies. Individual lithofacies shown on Figures 5d and e are discussed
below.
Lithofacies F: Quartz Arenite Facies
Quartz arenite facies make up intervals of a
- 16 -

also suggests that d tream accreting
acroforms and, to a lesser extent, laterally accreting macroforms.
generally well sorted and well rounded mono- and polycrystalline
quartz. ).
less
oxides
at
d
as a
ndicate that Fe-dolomite and ankerite cements formed during deep burial after the
formati
Fe in
ies G: Heterolithic Facies
eterolithic facies consist of a 4 m-thick interval of thinly interlaminated shale, siltstone
sedimentary structures consist of lenticular, wavy, and
,
n,
eposition occurred via bedform migration over sandy, downs
m
Detrital grains are
Detailed diagenetic studies have been conducted on core WVGS-4 by Reed et al. (2005
Quartz is the most common cement and generally occurs as syntaxial overgrowths; however
abundant prismatic quartz crystals protrude into secondary pore spaces. Fe-oxides/oxyhydr
are common and occur as thin, early coatings on primary grains. Reed et al. (2005) propose th
the presence of oxidized Fe-bearing minerals implies communication with atmospheric oxygen.
Calcite is the second most common cement type and occurs as large inter-granular crystals in
compositionally mature coarse-grained samples (Reed et al., 2005). Siderite (FeCO3), the thir
most common cement type, is an authigenic iron-bearing carbonate common in many diverse
sedimentary settings (Pan et al., 2000). This cement occurs as small (< 20 µm) euhedral crystals
surrounding detrital grains (predominantly quartz) and as “wheat-seed” siderite (Reed et al.,
2005). In contrast to the early Fe-oxide grain coats in the quartz-cemented arenites, siderite
cements are indicative of reducing pore fluids.
Fe-dolomite and ankerite cements are present in some samples and generally occur
replacement of earlier calcite cements (Reed et al., 2005). Based on textural evidence, these
authors i
on of secondary porosity. Fe-rich fluids introduced from tectonic highlands and clay
mineral transformations in surrounding shales are two proposed sources for late diagenetic
the Appalachian Basin (Reed et al., 2005).
Lithofac
H
and fine-grained sandstone. In outcrop,
flaser bedding, ripple cross laminae, and trough cross bedding (Korus, 2002). In core samples
wavy and ripple laminated bed sets become more apparent up section. Rhythmic bundles are
crude near the base of the succession, but become more obvious and distinguishable up sectio
and occur as 1-2 cm-thick interlayered sandstone-rich and mudstone-rich beds in which
sandstone laminations display thickening and thinning trends.
- 17 -

The thickening and thinning patterns are commonly interpreted as the result of variations
in tidal velocities from spring to neap tides (Kvale et al., 1989; Kvale et al., 1995; Miller and
Eriksso
,
f
ove
e
m) upward-coarsening units. This author
sugges
h
ere
c Characteristics ithofacies A: Sandstone Facies
per Mississippian outcrops consist of multiple magnetic
inera
d
erally
n, 1997). Moreover, the occurrence of wavy and ripple laminated beds up section are
suggestive of alternating current flow and slack water periods (Reineck and Wunderlich, 1968;
cf. Korus, 2002).
Lithofacies H: Dark Mudstone-Sandstone Facies
These facies largely consist of upward-coarsening, 1.5 to 12 m-thick units of mudstone,
siltstone, and very-fine sandstone. Sedimentary structures include lenticular and wavy bedding
and ripple cross-laminae. In general, bedding changes upwards from planar to rippled within a
single coarsening upward interval. Cross-bedded sandstone lenses are common near the tops o
these units. Korus (2002) found that the average thickness of individual upward-coarsening units
varies with geographic location and stratigraphic position. In the northwestern areas, units ab
the Upper Raleigh Sandstone are relatively thin (1.5 – 2 m), whereas in southeastern areas th
same stratigraphic interval contains thicker (6 – 9
ts that these facies represent progradational deltaic complexes and argues that the thin
coarsening-upward successions were formed by prograding bayhead deltas and estuary mout
bars during the early infilling of estuaries, whereas thicker coarsening-upward successions w
formed as prograding deltaic complexes.
MagnetiL
Sandstones sampled from up
m l types. The SSWV-1 sheet-like sandstones (Fig. 5a) primarily contain paramagnetic (e.g.
siderite), antiferromagnetic (e.g. hematite) and ferrimagnetic (e.g. magnetite) minerals as
indicated by hysteresis loop shapes (Figs. 6a and b). Antiferromagnetic signatures are indicated
by high BCR values (Fig. 7). The Day Plot (Fig. 8) shows that these samples are also associate
with high magnetization ratios (MRS/Ms) compared to other upper Mississippian sandstone
samples. This is attributed to the influence of hematite, an antiferromagnetic mineral gen
- 18 -

Figure 7 - Coercivity of remanence (BCR) vs. low-frequency mass magnetic susceptibility (χlf) for upper
Mississippian samples. High BCR values (>300 mT) correspond to samples with hematite whereas low BCR values
(<60 mT) correspond to samples with magnetite. Samples falling between these values contain titanomagnetite or
represent complex mixtures of magnetite/titanomagnetite and hematite.
associated with much higher magnetization ratios, compared to ferrimagnetic minerals like
magnetite, titanomagnetite and m 003). Mean high-field
m3 kg-1) and ferrimagnetic susceptibility (χferri mean = 3.8 ×
10-8 m3 s
aghemite (Peters and Dekkers, 2
susceptibility (χh mean = 3.9 × 10⁻⁸
kg-1) values (Fig. 9) indicate that χlf values represent virtually equivalent contribution
from the ferrimagnetic and additive antiferromagnetic + paramagnetic mineral phases. MS data
(Fig. 10) indicate that paramagnetic minerals are higher in concentration compared to
ferrimagnetic and antiferromagnetic minerals. In order to have equivalent χh and χferri values, the
antiferromagnetic concentration must be greater than the ferrimagnetic concentration, or the
paramagnetic mineral type and concentration are sufficient to raise χh in conjunction with the
antiferromagnetic mineral phase influences. Magnetic characteristics of the sheet-like
- 19 -

sandstones, particularly wasp-waisted loops trends, imply the presence of both
magnetite/titanomagnetite and hematite in these sandstones.
Figure 8 - Day Plot illustrating the effects of mineralogy and grain-size variations as a function f hysteresis
ratios for upper Mississippian samples. Hematite in enced samples are associated with high agnetization ratios
(M
o
flu er m
n
d
0-8 m3 kg-
1). The low χlf values imply that magnetite exists in limited concentration. The Day plot (Fig. 8)
RS/MS). Si gle domain (SD), pseudo-single domain (PSD), and multidomain (MD) fields after Dunlop and
Ozdemir (1997) apply only to samples in which magnetite has been identified
In contrast to the SSWV-1 sheet-like sandstones, the PWV-1 channelized sandstones
(Fig. 5b) primarily consist of paramagnetic and ferrimagnetic (magnetite) minerals as indicate
by hysteresis loop shapes (Figs. 6c and d) and low BCR values (Fig. 7). Figure 7 indicates that
these samples are also characterized by low magnetic susceptibility (χlf mean = 5.0 × 1
- 20 -
indicates that these samples have low magnetization ratios compared to the othe
Mississippian sandstone samples, and fall in the PSD field for m
r upper
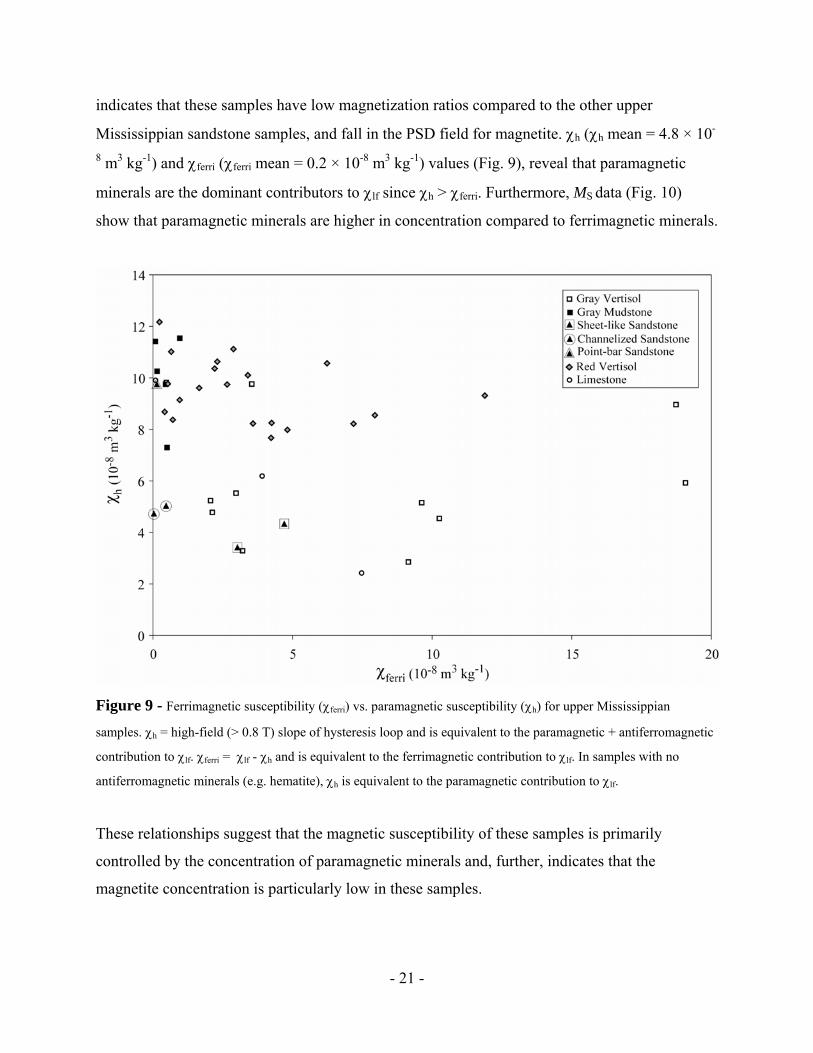
agnetite. χh (χh mean = 4.8 × 10-
3 kg-1) and χferri (χferri mean = 0.2 × 10⁻⁸ m3 kg-1) values (Fig. 9), reveal that paramagnetic
minerals are the dominant contributors to χlf since χh > χferri. Furthermore, MS data (Fig. 10)
show that paramagnetic minerals are higher in concentration compared to ferrimagnetic minerals.
8 m
Figure 9 - Ferrimagnetic susceptibility (χferri) vs. paramagnetic susceptibility (χh) for upper Mississippian
samples. χh = high-field (> 0.8 T) slope of hysteresis loop and is equivalent to the paramagnetic + antiferromagnet
contribution to χ
ic
tion to χlf. In samples with no
ntiferromagnetic minerals (e.g. hematite), χh is equivalent to the paramagnetic contribution to χlf.
lf. χferri = χlf - χh and is equivalent to the ferrimagnetic contribu
a
These relationships suggest that the magnetic susceptibility of these samples is primarily
controlled by the concentration of paramagnetic minerals and, further, indicates that the
magnetite concentration is particularly low in these samples.
- 21 -
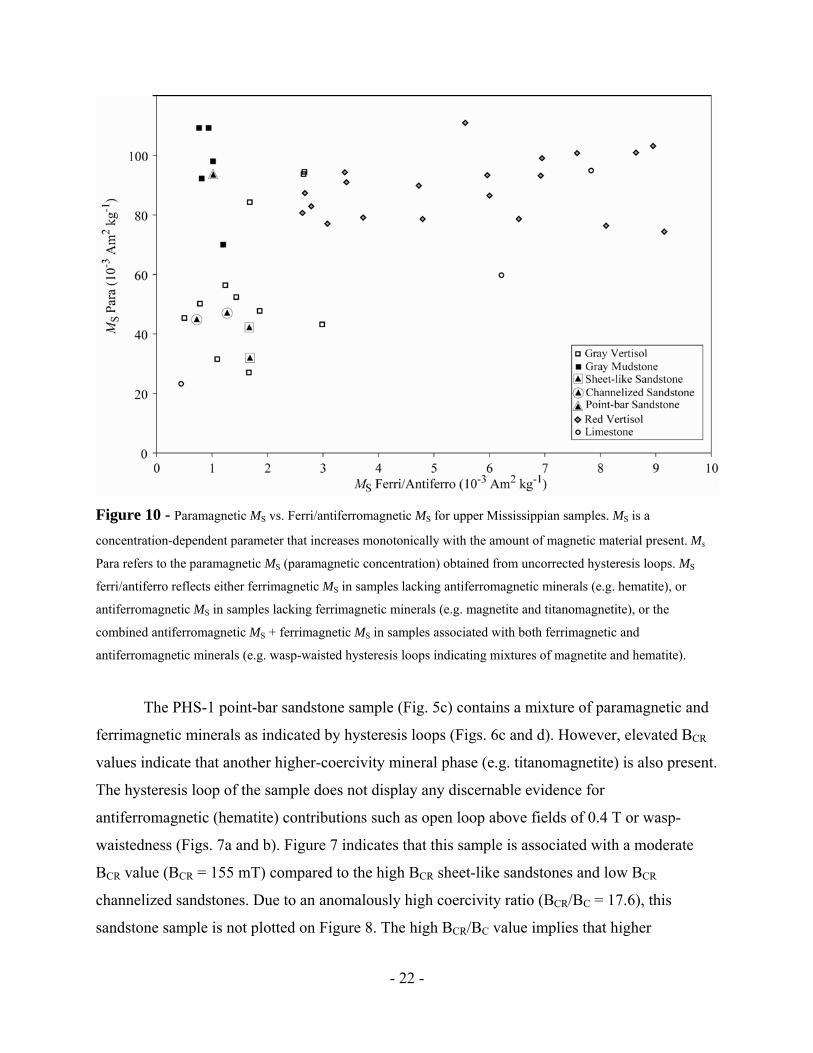
Figure 10 - Paramagnetic MS vs. Ferri/antiferromagnetic MS for upper Mississippian samples. MS is a
concentration-dependent parameter that increases monotonically with the amount of magnetic material present. Ms
Para refers to the paramagnetic MS (paramagnetic concentration) obtained from uncorrected hysteresis loops. MS
ferri/antiferro reflects either ferrimagnetic MS in samples lacking antiferromagnetic minerals (e.g. hematite), or
antiferromagnetic MS in samples lacking ferrimagnetic minerals (e.g. magnetite and titanomagnetite), or the
combined antiferromagnetic MS + ferrimagnetic MS in samples associated with both ferrimagnetic and
antiferromagnetic minerals (e.g. wasp-waisted hysteresis loops indicating mixtures of magnetite and hematite).
and
sent.
agnetic (hematite) contributions such as open loop above fields of 0.4 T or wasp-
CR
CR/BC = 17.6), this
otted on Figure 8. The high BCR/BC value implies that higher
The PHS-1 point-bar sandstone sample (Fig. 5c) contains a mixture of paramagnetic
ferrimagnetic minerals as indicated by hysteresis loops (Figs. 6c and d). However, elevated BCR
values indicate that another higher-coercivity mineral phase (e.g. titanomagnetite) is also pre
The hysteresis loop of the sample does not display any discernable evidence for
antiferrom
waistedness (Figs. 7a and b). Figure 7 indicates that this sample is associated with a moderate
BCR value (BCR = 155 mT) compared to the high BCR sheet-like sandstones and low B
channelized sandstones. Due to an anomalously high coercivity ratio (B
sandstone sample is not pl
- 22 -

coercivity minerals (e.g. SD magnetite or titanomagnetite) are contributing to the remanence of
the sample. The associated low MRS/MS ratio (MRS/MS = 0.13) suggests that SD grains are not
responsible for the higher coercivity phase. SD influence would be expected to have a higher
MRS/MS ratio for the reason that SD grains are too small to reduce their magnetostatic energy
(see Appendix A) by forming domain walls. As a result, SD grains have higher MRS values since
they are harder to demagnetize. Therefore, coarse PSD and possibly MD titanomagnetite
particles are a likely source for the high BCR/BC and low MRS/MS ratios.
Peters and Dekkers (2003) compiled a data set of magnetic parameters from a number of
publications for several common iron oxide phases. Values for our sample (BCR = 155 mT,
BCR/BC = 17.6, and MRS/MS = 0.14) best match titanomagnetite for which Peters and Dekkers
(2003) list BCR values ranging from 8.5 to 213 mT, BCR/BC values from 1.2 to 6.9, and MRS/MS
values from 0.01 to 0.53. Therefore, titanomagnetite is probably the dominant remanence carrier
in the point-bar sandstones. High-field susceptibility (χh = 9.8 × 10⁻⁸ m3 kg-1) and ferrimagnetic
susceptibility (χferri = 0.2 × 10⁻⁸ m3 kg-1) values for the point-bar sandstone indicate that
paramagnetic minerals are the dominant contributors to χlf since χh > χferri (Fig. 9). MS data (Fig.
etic
inerals as indicated by hysteresis loop shapes (Figs. 6c and d). Figure 7 indicates that these
sample
ysteresis loop
BCR
and
RS S
10) show that paramagnetic minerals are higher in concentration compared to ferrimagn
minerals (titanomagnetite). These relationships suggest that the magnetic susceptibility of this
sample is primarily controlled by paramagnetic minerals and to a lesser titanomagnetite.
Lithofacies B: Gray Mudstone Facies
Gray mudstones (Fig. 5a and b) primarily consist of paramagnetic and ferrimagnetic
m
s are characterized by low mean χlf (10.5 × 10⁻⁸ m3 kg-1) and low mean BCR (47.7 mT)
values indicative of the mineral magnetite. One sample displays an elevated BCR value (98 mT)
that suggests the presence of a higher coercivity mineral phase (e.g. titanomagnetite or hematite).
In either case, antiferromagnetic contributions are assumed negligible since the h
for the sample does not display any discernable evidence for antiferromagnetic contributions
(e.g. open loop above fields of 0.4 T or wasp-waistedness; Figs. 6a and b). This suggests that
titanomagnetite, or some other ferrimagnetic mineral may be responsible for the elevated
values. Furthermore, the hysteresis parameters for this sample (BCR = 98 mT, BCR/BC = 3.9,
M /M = 0.14) best match the Peters and Dekkers (2003) values for titanomagnetite. The Day
- 23 -
Plot (Fig. 8) indicates that the magnetic grain-sizes for these samples primarily fall in the PSD
field for magnetite. One sample associated with a lower BCR/BC ratio falls below the PSD
boundary and likely indicates that a bimodal grain-size distribution exists between SD and PSD
magnetite grains. Mean χ
the magnetic
sent in a
the
e
resence of higher coercivity mineral phases (e.g. titanomagnetite or hematite). The two higher-
that are open above fields of 0.4 T and display wasp-
waisted
ics
ed
o-
h (10.0 × 10⁻⁸ m3 kg-1) and χferri (0.4 × 10⁻⁸ m3 kg-1) values (Fig. 9)
imply that paramagnetic minerals are the dominant contributors to χlf since χh > χferri.
Furthermore, the paramagnetic mineral concentration is greater than the ferrimagnetic
concentration as illustrated in Figure 10. These relationships suggest that
susceptibility of these samples is primarily controlled by paramagnetic minerals, and in
particular their concentration.
Lithofacies C: Gray Vertisol Facies
The gray vertisol samples (Figs. 5a and b) primarily consist of paramagnetic and
ferrimagnetic minerals as illustrated by hysteresis loop shapes (Fig. 6c and d). However,
antiferromagnetic characteristics, attributed to either hematite or titanomagnetite, are pre
few of the gray vertisol samples as indicated by elevated BCR values (Fig. 7). χlf values (Fig. 7)
display a wide range from 6.5 to 27.7 × 10⁻⁸ m3 kg-1 (χlf mean = 13.4 × 10⁻⁸ m3 kg-1). Most of
samples have low BCR values (ranging from 28 to 46 mT; Fig. 7) indicative of magnetite.
However, three samples display elevated BCR values (82, 182, and 330 mT) that suggest th
p
coercivity samples have hysteresis loops
characteristics indicative of mixtures of hematite and magnetite (e.g. Fig. 6a and b).
However, the lowest of these high-coercivity samples displays ferrimagnetic loop characterist
(e.g. Figs. 6c and d) that suggest the presence of titanomagnetite. This interpretation is support
by the hysteresis parameters (BCR = 82 mT, BCR/BC = 4.7, and MRS/MS = 0.24) that best match
the Peters and Dekkers (2003) values for titanomagnetite. The Day Plot (Fig. 8) indicates that the
magnetic grain size for the magnetite interpreted samples largely fall in the PSD region. One
magnetite sample falls above the upper MRS/MS = 0.5 boundary and may indicate that finer
remanence carrying magnetite grains (SD) are mixed with PSD grains. In samples where
hematite is identified, high BCR/BC values (> 6) are observed and indicate that complex grain-t
grain interactions between magnetite and hematite and high-coercivity phases (hematite) are
contributing to the remanence of the samples.
- 24 -
Mean χh (6.0 × 10⁻⁸ m3 kg-1) and χferri (7.4 × 10⁻⁸ m3 kg-1) values (Fig. 9) indicate that,
overall, ferrimagnetic minerals are the dominant contributors to χlf since χferri > χh. MS data
10) indicate that paramagnetic minerals are higher in concentration compared to ferrimagnetic
minerals. These relationships show that the magnetic susceptibility for most of the samples is
controlled by low concentrations of PSD magnetite and high concentrations of parama
minerals. However, for one sample, χ
(Fig.
gnetic
d 3.5 ×
cies
The vertisol samples (Figs. 5a, b, and c) primarily consist of paramagnetic,
inerals as indicated by hysteresis loop shapes (Figs. 6a, b,
e and f T)3 kg-
.
are
les
lf is dominated by hematite since χh > χferri (9.8 an
10-8 m3 kg-1, respectively).
Lithofacies D: Red Vertisol Fa
antiferromagnetic, and ferrimagnetic m
). Figure 7 shows that large variations in BCR (104 to 600 mT, BCR mean = 475.6 m
occur over a narrow range of χlf values (9.1 to 21.2 × 10⁻⁸ m3 kg-1, χlf mean = 12.9 × 10⁻⁸ m 1
indicating the strong influence of concentrat ion and grain size on magnetic susceptibility. B
values in these samples are among the highest observed in the upper Mississippian sample set
and indicate the presence of hematite. Furthermore, hysteresis loops for the red vertisols remain
open at fields above 0.4 T and largely display wasp-waisted loop patterns (e.g. Fig. 6b)
suggesting the presence of both hematite and magnetite. The Day Plot (Fig. 8) indicates that
these samples have the highest M /M ratios (0.33 to 0.99, M /M mean = 0.58) observed in the
upper Mississippian sample set. Mean B /B ratios are relatively low (2.76) but range from
1.38 to 5.70. High M /M and low B /B ratios are characteristic of hematite dominated
samples (Peters and Dekkers, 2003).
χ and χ values indicate that overall antiferromagnetic and, to a lesser extent,
paramagnetic minerals are the dominant contributors to χ since χ > χ (Fig. 9). M data (Fig
10) indicate that paramagnetic minerals are higher in concentration compared to
antiferromagnetic minerals. However, the antiferromagnetic concentrations for these samples
among the highest observed in the upper Mississippian sample set. Furthermore, these samp
encompass a wide range of antiferromagnetic concentrations in conjunction with high
paramagnetic concentrations.
CR
R S R S
CR C
R S CR C
h ferri
lf h ferri S
- 25 -
)
Lithofa
1
phases (e.g. titanomagnetite and hematite) are present in the
amples. Hysteresis loops (e.g. Fig. 6a) display the characteristic antiferromagnetic loop patterns
for the two higher coercivity samples (Fig. 7). These
sample ce of a lower
amples
h a
y
ns are
ity phases.
es
agnetic and, to
10) show
higher in concentration compared to antiferromagnetic and
errimagnetic minerals. Collectively, these samples encompass a wide range of paramagnetic,
ntiferromagnetic, and ferrimagnetic concentrations as illustrated in Figure 10.
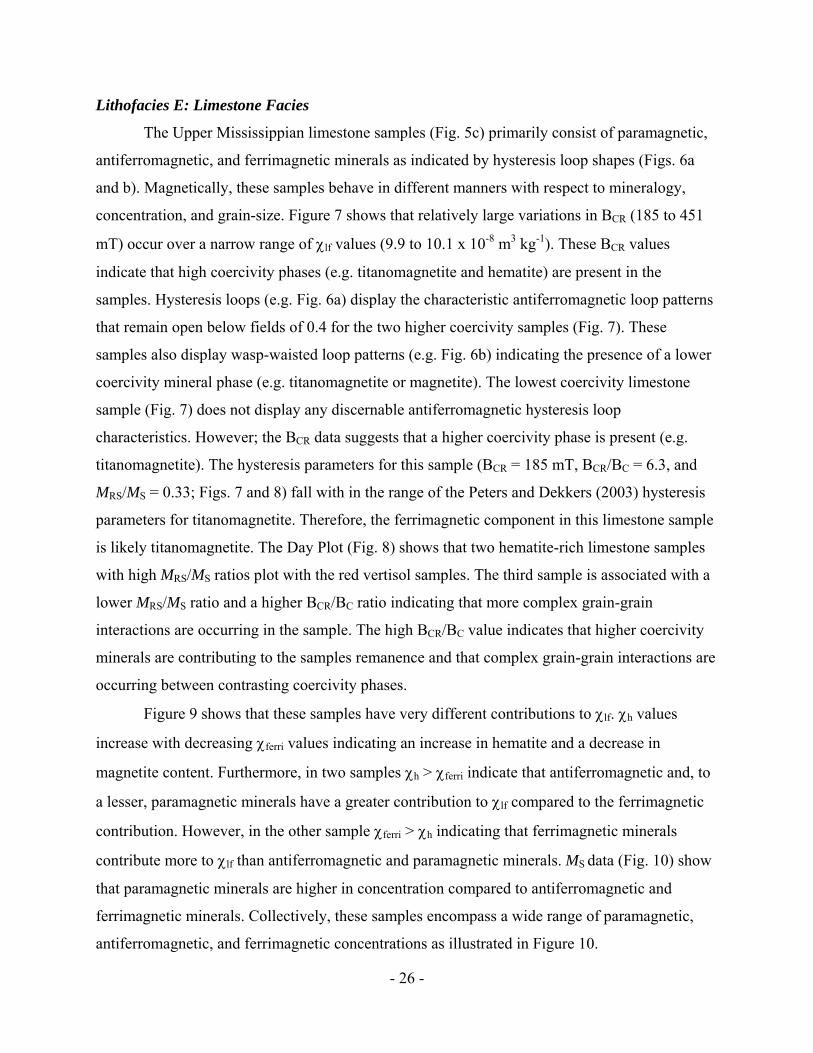
cies E: Limestone Facies
The Upper Mississippian limestone samples (Fig. 5c) primarily consist of paramagnetic,
antiferromagnetic, and ferrimagnetic minerals as indicated by hysteresis loop shapes (Figs. 6a
and b). Magnetically, these samples behave in different manners with respect to mineralogy,
concentration, and grain-size. Figure 7 shows that relatively large variations in BCR (185 to 45
mT) occur over a narrow range of χlf values (9.9 to 10.1 x 10⁻⁸ m3 kg-1). These BCR values
indicate that high coercivity
s
that remain open below fields of 0.4
s also display wasp-waisted loop patterns (e.g. Fig. 6b) indicating the presen
coercivity mineral phase (e.g. titanomagnetite or magnetite). The lowest coercivity limestone
sample (Fig. 7) does not display any discernable antiferromagnetic hysteresis loop
characteristics. However; the BCR data suggests that a higher coercivity phase is present (e.g.
titanomagnetite). The hysteresis parameters for this sample (BCR = 185 mT, BCR/BC = 6.3, and
MRS/MS = 0.33; Figs. 7 and 8) fall with in the range of the Peters and Dekkers (2003) hysteresis
parameters for titanomagnetite. Therefore, the ferrimagnetic component in this limestone sample
is likely titanomagnetite. The Day Plot (Fig. 8) shows that two hematite-rich limestone s
with high MRS/MS ratios plot with the red vertisol samples. The third sample is associated wit
lower MRS/MS ratio and a higher BCR/BC ratio indicating that more complex grain-grain
interactions are occurring in the sample. The high BCR/BC value indicates that higher coercivit
minerals are contributing to the samples remanence and that complex grain-grain interactio
occurring between contrasting coerciv
Figure 9 shows that these samples have very different contributions to χlf. χh valu
increase with decreasing χferri values indicating an increase in hematite and a decrease in
magnetite content. Furthermore, in two samples χh > χferri indicate that antiferrom
a lesser, paramagnetic minerals have a greater contribution to χlf compared to the ferrimagnetic
contribution. However, in the other sample χferri > χh indicating that ferrimagnetic minerals
contribute more to χlf than antiferromagnetic and paramagnetic minerals. MS data (Fig.
that paramagnetic minerals are
f
a
- 26 -

Lithofacies F: Quartz Arenite Facies
ed
arily
k
× 10-5
rimagnetic
WVGS-4 Samples
Sandstones sampled from WVGS-4 (Figs. 5d) have been separated into quartz-cement
sandstones and Fe-carbonate cemented sandstones based on microprobe analysis (Reed et al.,
2005) and multi-parameter magnetic analysis (this study). Quartz-cemented sandstones prim
consist of diamagnetic and ferrimagnetic minerals. Hysteresis loops generally display wea
ferrimagnetic loop characteristics below 0.2 mT and diamagnetic loop characteristics above 0.2
mT and (e.g. Fig. 6g). Figure 5d shows that these samples display low κ values (0.9 to 2.6
SI) characteristic of quartz-dominated samples. Figure 11 indicates that these samples are
associated with relatively low BCR values (47.7 to 76.3 mT) and weak (mostly negative) χlf
values (-0.3 to 1.2 × 10⁻⁸ m3 kg-1). Low BCR values suggest that magnetite is the fer
Figure 11 - Coercivity of remanence (BCR) vs. low-frequency mass magnetic susceptibility (χlf) for lower
Pennsylvanian samples. High BCR values (>300 mT) correspond to samples with hematite whereas low BCR values
- 27 -
(<60 mT) correspond to samples with magnetite. Samples falling between these values contain titanomagnetite or
present complex mixtures of magnetite/titanomagnetite and hematite.
ot
ot
(BCR
RS
χferri values (Fig. 13) and low paramagnetic MS and ferrimagnetic MS values (Fig. 14) indicating
that paramagnetic and ferrimagnetic minerals have a minimal contribution to χlf as a result of
their low concentration. Furthermore, diamagnetic minerals are high enough in concentration to
effectively dilute and minimize the paramagnetic and ferrimagnetic minerals as indicated by
weak to negative χlf values.
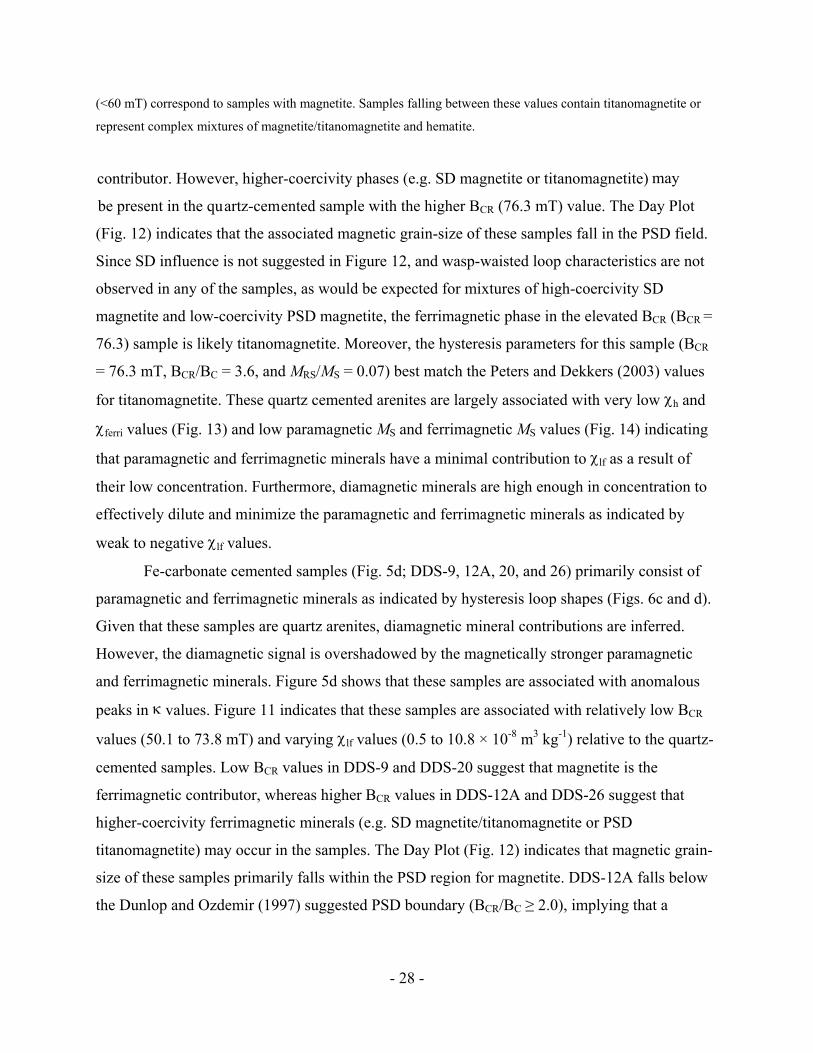
Fe-carbonate cemented samples (Fig. 5d; DDS-9, 12A, 20, and 26) primarily consist of
paramagnetic and ferrimagnetic minerals as indicated by hysteresis loop shapes (Figs. 6c and d).
Given that these samples are quartz arenites, diamagnetic mineral contributions are inferred.
However, the diamagnetic signal is overshadowed by the magnetically stronger paramagnetic
and ferrimagnetic minerals. Figure 5d shows that these samples are associated with anomalous
peaks in κ values. Figure 11 indicates that these samples are associated with relatively low BCR
values (50.1 to 73.8 mT) and varying χlf values (0.5 to 10.8 × 10⁻⁸ m3 kg-1) relative to the quartz-
cemented samples. Low BCR values in DDS-9 and DDS-20 suggest that magnetite is the
ferrimagnetic contributor, whereas higher BCR values in DDS-12A and DDS-26 suggest that
higher-coercivity ferrimagnetic minerals (e.g. SD magnetite/titanomagnetite or PSD
titanomagnetite) may occur in the samples. The Day Plot (Fig. 12) indicates that magnetic grain-
size of these samples primarily falls within the PSD region for magnetite. DDS-12A falls below
re
contributor. However, higher-coercivity phases (e.g. SD magnetite or titanomagnetite) may
be present in the quartz-cemented sample with the higher BCR (76.3 mT) value. The Day Pl
(Fig. 12) indicates that the associated magnetic grain-size of these samples fall in the PSD field.
Since SD influence is not suggested in Figure 12, and wasp-waisted loop characteristics are n
observed in any of the samples, as would be expected for mixtures of high-coercivity SD
magnetite and low-coercivity PSD magnetite, the ferrimagnetic phase in the elevated BCR (BCR =
76.3) sample is likely titanomagnetite. Moreover, the hysteresis parameters for this sample
= 76.3 mT, BCR/BC = 3.6, and M /MS = 0.07) best match the Peters and Dekkers (2003) values
for titanomagnetite. These quartz cemented arenites are largely associated with very low χh and
the Dunlop and Ozdemir (1997) suggested PSD boundary (BCR/BC ≥ 2.0), implying that a
- 28 -

bimodal grain-size distribution is occurring between SD and PSD grains. Therefore, the high-
coercivity phase in DDS-12A is likely attributed to SD magnetite/titanomagnetite.
Figure 12 - Day Plot illustrating the effects of mineralogy and grain-size variations as a function of hysteresis
ratios for lower Pennsylvanian samples. Single domain (SD), pseudo-single domain (PSD), and multidomain (MD)
fields modeled after Dunlop and Ozdemir (1997) are shown.
Figure 13 shows that χ
strated
d samples
s is
primarily controlled by paramagnetic minerals, and in particular their concentration.
h > χferri for the Fe-carbonate cemented sandstones, indicating that
paramagnetic minerals are the dominant contributors to χlf. DDS-9 displays very low χh and χferri
values that can be explained by the low paramagnetic and ferrimagnetic concentration illu
in Figure 14. Low magnetic concentrations in DDS-9 are likely responsible for the correlative
lower susceptibility observed in the sample relative to the other Fe-carbonate cemente
(Figs. 5d, 11, and 13). The paramagnetic mineral concentration is greater than the ferrimagnetic
concentration for all of the Fe-carbonate cemented samples as illustrated in Figure 13. These
relationships suggest that the magnetic susceptibility of the Fe-carbonate cemented sample
- 29 -

Figure 13 - Ferrimagnetic susceptibility (χferri) vs. paramagnetic susceptibility (χh) for lower Pennsylvanian
samples. χh = high-field (> 0.8 T) slope of hysteresis loop and is equivalent to the paramagnetic contribution to χlf
since no antiferromagnetic minerals are present in these samples. χferri = χlf - χh and is equivalent to the
ferrimagnetic contribution to χlf.
The MM-1 sandstone facies display similar κ trends compared to WVGS-4 sandstones
(Figs. 5 d
r
ve fields
MM-1 Samples
d and e) and are attributed to iamagnetic, paramagnetic and ferrimagnetic mineral
phases as indicated by hysteresis loop shapes (Figs. 6c and g). Samples with low χlf values are
largely associated with higher BCR values (Fig. 11) and display strong diamagnetic and weak
ferrimagnetic loop trends (e.g. Fig. 6c). In contrast, samples with higher χlf values have lower
BCR values and display strong paramagnetic and weak ferrimagnetic loop trends (e.g. Fig. 6c).
Differences in BCR and χlf values for these samples imply that a range of coercive phases are
present (e.g. low-coercivity PSD and MD magnetite and higher-coercivity SD magnetite and/o
titanomagnetite) suggesting that differences in mineral content, concentration, and grain-size
occur between the samples. Antiferromagnetic loop characteristics (e.g. open loop abo
- 30 -
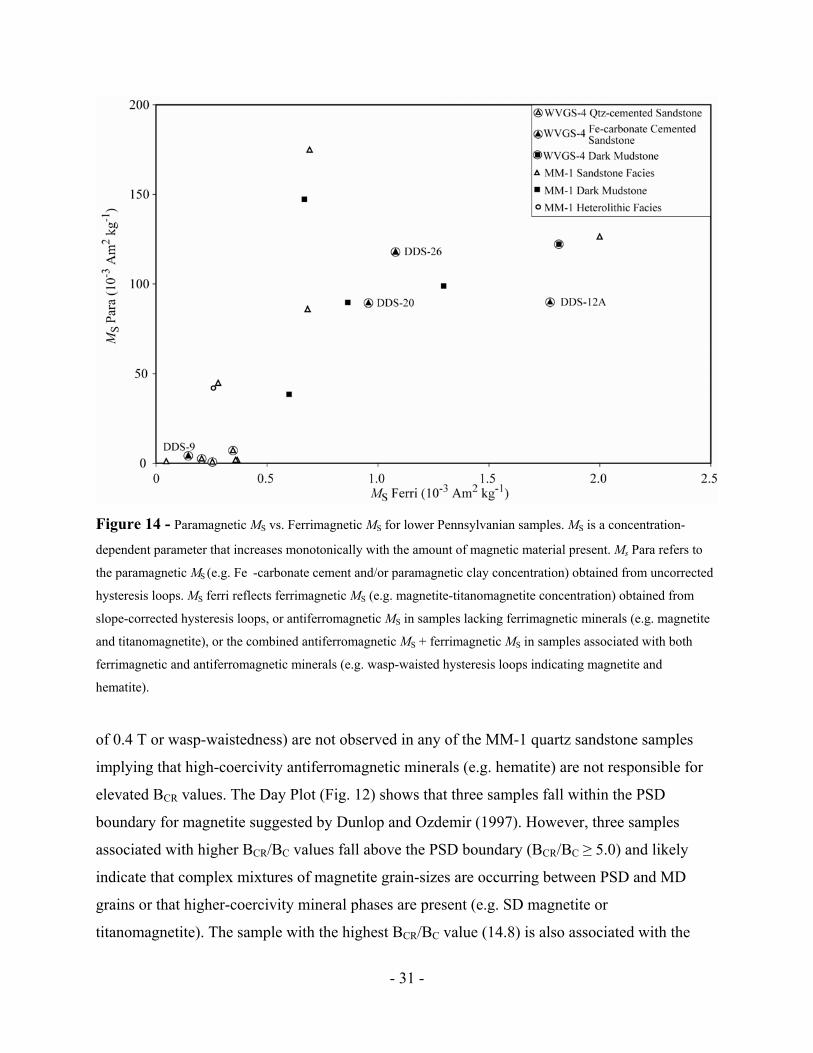
Figure 14 - Paramagnetic MS vs. Ferrimagnetic MS for lower Pennsylvanian samples. MS is a concentration-
dependent parameter that increases monotonically with the amount of magnetic material present. Ms Para refers to
the paramagnetic M (e.g. Fe -carbonate cement and/or paramagnetic clay concentration) obtained from u
hysteresis loops. M
ncorrected
errimagnetic MS (e.g. magnetite-titanomagnetite concentration) obtained from
ope-corrected hysteresis loops, or antiferromagnetic MS in samples lacking ferrimagnetic minerals (e.g. magnetite
), or the combined antiferromagnetic MS + ferrimagnetic MS in samples associated with both
tiferromagnetic minerals (e.g. wasp-waisted hysteresis loops indicating magnetite and
ematite
r
S ferri reflects f
sl
and titanomagnetite
ferrimagnetic and an
h ).
of 0.4 T or wasp-waistedness) are not observed in any of the MM-1 quartz sandstone samples
implying that high-coercivity antiferromagnetic minerals (e.g. hematite) are not responsible fo
elevated BCR values. The Day Plot (Fig. 12) shows that three samples fall within the PSD
boundary for magnetite suggested by Dunlop and Ozdemir (1997). However, three samples
associated with higher BCR/BC values fall above the PSD boundary (BCR/BC ≥ 5.0) and likely
indicate that complex mixtures of magnetite grain-sizes are occurring between PSD and MD
grains or that higher-coercivity mineral phases are present (e.g. SD magnetite or
titanomagnetite). The sample with the highest BCR/BC value (14.8) is also associated with the
- 31 -
S

highest BCR value (116.2 mT; Fig. 11) and suggests that titanomagnetite may be the
ferrimagnetic mineral present. Two samples that fall below the PSD boundary (BCR/BC ≥ 2.0)
suggested by Dunlop and Ozdemir (1997) and are interpreted to reflect a bimodal grain-size
distribution between SD and PSD magnetite grains within the sample.
Figure 13 shows that three MM-1 samples are associated with very low χh and χferri values.
These samples are also associated with diamagnetic loop characteristics and weak to negative χlf
values. This indicates that diamagnetic minerals are effectively diluting the ferrimagnetic signal
similar to that of the WVGS-4 quartz-cemented samples. Furthermore, concentration data (Fig.
14) show that these samples are also associated with very low paramagnetic and ferrimagnetic
concentrations. This suggests that diamagnetic cements (e.g. quartz and calcite) are present in
these samples. In comparison, the other MM-1 quartz-sandstone samples display high χh values
and are associated with paramagnetic loop characteristics (e.g. Fig. 6c). MS data also indicate
that high concentrations of paramagnetic minerals occur in these samples (Fig. 14). High χh and
paramagnetic MS values imply that paramagnetic cements (e.g. siderite, ankerite, Fe-dolomite)
are present in these samples in common with the WVGS-4 Fe-carbonate cemented samples.
te,
grain-size falls in the PSD region for magnetite.
χ (4.4 × 10⁻⁸ m3 kg-1) and χ (0.06 × 10⁻⁸ m3 kg-1) values indicate that paramagnetic
κ value (Fig.
5d) attributed to paramagnetic and ferrimagnetic minerals as indicated by hysteresis loop shapes
Lithofacies G: Heterolithic Facies
The MM-1 tidal rhythmite sample is associated with a moderate κ value (Fig. 5e) and
hysteresis loops indicate the presence of paramagnetic and ferrimagnetic minerals (Figs. 6c and
d). This sample is associated with a low BCR value (28.9 mT) indicative of the mineral magneti
and a low χlf value (4.5 × 10⁻⁸ m3 kg-1; Fig. 10). The Day Plot (F ig. 12) indicates that the
magnetic
h ferri
minerals are the dominant contributors to χlf since χh > χferri (Fig. 13). The paramagnetic mineral
concentration is greater than the ferrimagnetic concentration as illustrated in Figure 14. These
relationships suggest that the magnetic susceptibility of these samples is primarily controlled by
paramagnetic minerals (e.g. Fe-rich clays and cements), and in particular their concentration.
Lithofacies H: Dark Mudstone-Sandstone Facies
The WVGS-4 dark mudstone sample is associated with the highest observed
- 32 -

(Figs. 6c and d). Figure 11 shows that the ferrimagnetic phase is related to higher-coe
minerals (e.g. SD magnetite and titanomagnetite) since B
rcivity
esponsible for the
D
is
ops indicate that paramagnetic and ferrimagnetic minerals occur in the samples as indicated by
d). Figure 11 indicates that these samples are characterized
y mod
ains
y
aramagnetic minerals (e.g. Fe-rich clays and/or cements) and their concentration, in common
CR values are relatively high for this
sample. Low MRS/MS and high BCR/BC values depicted on the Day Plot (Fig. 12) suggest that
titanomagnetite (or mixtures of titanomagnetite and magnetite) may be r
higher-coercivity phases and not mixtures of high-coercivity SD and low-coercivity PSD or M
magnetite. This interpretation is favored because mixtures of SD and coarser magnetite grains
should produce lower BCR/BC and higher MRS/MS values as well as display notable wasp-waisted
loop trends, none of which are observed in this sample.
χh and χferri values indicate that paramagnetic minerals are the dominant contributors to
χlf since χh > χferri (Fig. 13). Figure 14 indicates that the paramagnetic concentration is much
greater that the ferrimagnetic concentration and suggest that the χh > χferri relationship is largely a
function of the paramagnetic concentration. These relationships suggest that the magnetic
susceptibility of these samples is primarily controlled by paramagnetic minerals (e.g. Fe-rich
clays and/or cements), and in particular their concentration.
The MM-1 dark mudstone facies display moderate to high κ values (Fig. 5e). Hysteres
lo
hysteresis loop shapes (Figs. 6c and
b erate χlf and low BCR values. Low BCR values and ferrimagnetic hysteresis loop
characteristics suggest that magnetite is present. The Day Plot (Fig. 12) indicates that the
magnetic grain-size of magnetite in these samples falls below the PSD boundary (BCR/BC ≥ 2.0)
implying that a bimodal grain-size distribution exists between SD and coarser magnetite gr
within the sample.
χh and χferri values indicate that paramagnetic minerals are the dominant contributors to
χlf for the MM-1 dark mudstone facies since χh > χferri (Fig. 13). Figure 14 shows that the
paramagnetic concentration is much greater that the ferrimagnetic concentration and imply that
the χh > χferri relationship is largely a function of the paramagnetic concentration. These
relationships suggest that the magnetic susceptibility of these samples is primarily controlled b
p
with the WVGS-4 dark mudstone sample.
- 33 -
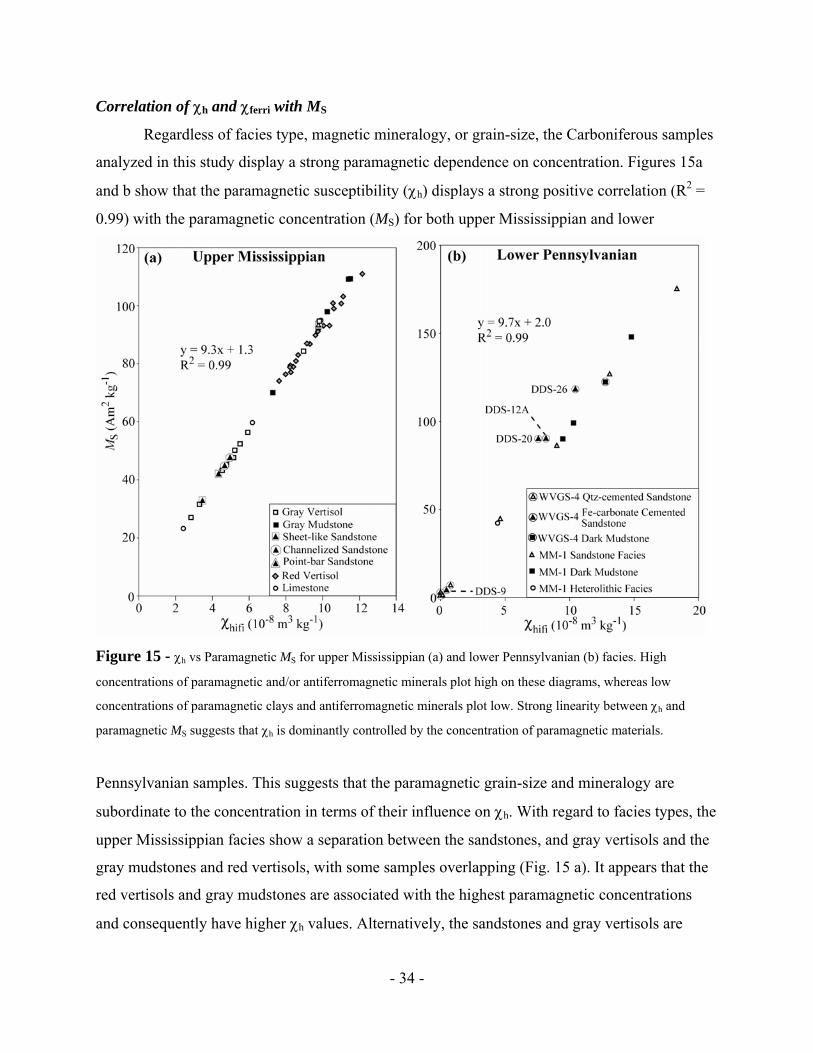
Correlation of χh and χferri with MS
Regardless of facies type, magnetic mineralogy, or grain-size, the Carboniferous sampl
analyzed in this study display a strong paramagnetic dependence on concentration. Figures 15
and b show that the paramagnetic susceptibility (χ
es
a 2 = h) displays a strong positive correlation (R
0.99) with the paramagnetic concentration (MS) for both upper Mississippian and lower
Figure 15 - χh vs Paramagnetic MS for upper Mississippian (a) and lower Pennsylvanian (b) facies. High
concentrations of param
concentrations of param
agnetic and/or antiferromagnetic minerals plot high on these diagrams, whereas low
agnetic clays and antiferromagnetic minerals plot low. Strong linearity between χ and
paramag
pes, the
ated with the highest paramagnetic concentrations
nd consequently have higher χh values. Alternatively, the sandstones and gray vertisols are
h
netic MS suggests that χh is dominantly controlled by the concentration of paramagnetic materials.
Pennsylvanian samples. This suggests that the paramagnetic grain-size and mineralogy are
subordinate to the concentration in terms of their influence on χh. With regard to facies ty
upper Mississippian facies show a separation between the sandstones, and gray vertisols and the
gray mudstones and red vertisols, with some samples overlapping (Fig. 15 a). It appears that the
red vertisols and gray mudstones are associ
a
- 34 -

associated with lower paramagnetic concentrations and consequently lower χh values. The
limesto
Temperature Dependent Magnetic Results
TDS data (Figs. 16a and b) shows mineral magnetic phase transitions that are likely
associated with iron-sulfide minerals (e.g. pyrrhotite or greigite) converting to magnetite in the
upper section of the PWV-1 gray vertisol (Fig. 5b; 6.7m). The heating curve (Figs. 16a and b) is
flat from room temperature to 260oC, suggesting that greigite is not present since there is no
susceptibility loss due to its decomposition at ~200oC (e.g. Torii et al., 1996). The increase at
260oC could correspond to the λ-transition of pyrrhotite from antiferromagnetic to ferrimagnetic
phase (Rochette et al., 1990; c.f. Kontny et al., 2000.) However, antiferromagnetic loop trends
(e.g. open loops above ~ 0.4 T; Fig. 6a) are not observed on initial room temperature loops. At
315oC, susceptibility drops, possibly indicating that ferrimagnetic pyrrhotite (TC = 320oC) was
formed. At 530oC another susceptibility peak arises, possibly due to the conversion of some iron
sulfide phase to magnetite and/or the transformation from iron-bearing silicates and clays to
magnetite (Zhu et al., 2001). The newly formed mineral phase is magnetite, as suggested by its
drop in κ at 580oC. The cooling curve (Fig. 16a) displays a sharp susceptibility rise at 580oC, due
o
wever,
eir identity cannot be discerned by the TDS data. Susceptibility decreases with continued
s not
mineral phase transitions observed in the TDS data for this sample.
ne samples overlap both the high and low paramagnetic MS and χh samples. In contrast to
the paramagnetic MS vs. χh, the ferrimagnetic concentration vs. χferri (not shown) are very poorly
correlated (< <1%), suggesting that the magnetic mineralogy, and grain-size may have a greater
influence on χferri.
to the formation of magnetite upon heating, and peaks at 455oC. Susceptibility continues t
decrease until 230oC where it sharply increases and peaks at 165oC. The peak at 165oC suggests
that some other remanence carrying mineral phases were formed during initial heating. Ho
th
cooling from 165oC back to room-temperature. Overall, the TDS data indicate that greigite i
likely present in the sample. However, due to the complexity of the heating-cooling TDS curve,
the conversion of some iron sulfide phase to magnetite and/or the transformation from iron-
bearing silicates and clays to magnetite are the best interpretation of the TDS patterns observed
in the gray vertisol sample. Although not conducted here, step-wise heating and cooling TDS
experiments (e.g. Hrouda et al., 2003; Liu et al., 2005) may provide additional insight into the
- 35 -

- 36 -
Figure 16

Figure 16 - Temperature-dependent susceptibility (TDS) for upper Mississippian PWV-1 gray vertisol sample
showing iron sulfide/Fe-clay transformation to magnetite. (a) Heating curve showing the formation of a new
ferrimagnetic mineral phase with a peak at 530oC. The loss of susceptibility at 580oC indicates that the newly
formed mineral phase is magnetite. Cooling curve shows characteristic magnetite increase at 580oC; however with
continued cooling another susceptibility peak appears at 165oC implying that complex unidentified ferrimagnetic
iron sulfide phases were formed during heating. (b) Enhanced heating-curve from above illustration indicates that a
new iron sulfide mineral phase was formed at 260oC with a Curie temperature of ~320oC similar to pyrrhotite.
Figure 17 shows the temperature dependent ferrimagnetic component of magnetization as
a percentage of the total temperature dependent MS for three different cement types (siderite,
ankerite, and Fe-dolomite) within the lower Pennsylvanian WVGS-4 quartz arenite facies. Below
300oC all three cement types have a similar low percentage of ferrimagnetic minerals. Between
300 and 400oC slight increases in ferrimagnetic minerals are observed in the three samples with
siderite having the greatest percent gain. Between 400 and 500oC the siderite-cemented sample
shows a marked increase in the percent of ferrimagnetic minerals in the sample. This occurrence
is consistent with a siderite to magnetite transformation obtained by TDS measurements in other
studies (e.g. Ellwood et al., 1989; Pan et al., 2000). The ankerite and Fe-dolomite samples also
suggest that a mineral phase transition is occurring between 400 and 500oC. However, the
amount of ferrimagnetic minerals transformed from these two cement types is much less than
that of siderite. This is likely due to ankerite and Fe-dolomite transforming into some spinel
structure similar to magnetite (e.g. maghemite) with less Fe in the crystal lattice. TDS data (Figs.
18a, b, and c) also show the mineral magnetic phase transitions for siderite and ankerite cements.
Upon heating the siderite-cemented sample, κ decreases before reaching 250oC (Fig. 18a inset),
indicating the dominant contribution of paramagnetic siderite (Pan et al., 2000). After ~ 365oC,
however, κ increases sharply indicating the generation of a new ferrimagnetic mineral phase.
The drop in κ between 540 – 590oC indicates that the Curie point of magnetite has been reached
(TC = ~ 580oC) and ferrimagnetism is lost. Upon cooling, the susceptibility remains low until ~
580oC where a sharp increase in κ occurs forming a peak also characteristic of magnetite.
Susceptibilities on heating the ankerite sample decrease before reaching 200oC, and likely
indicate the dominant contribution of paramagnetic ankerite (Fig. 18b). Continued heating shows
n increase in κ from ~ 410 to 500oC indicating that a new ferrimagnetic phase has been
generated (Fig. 18 b).
a
- 37 -
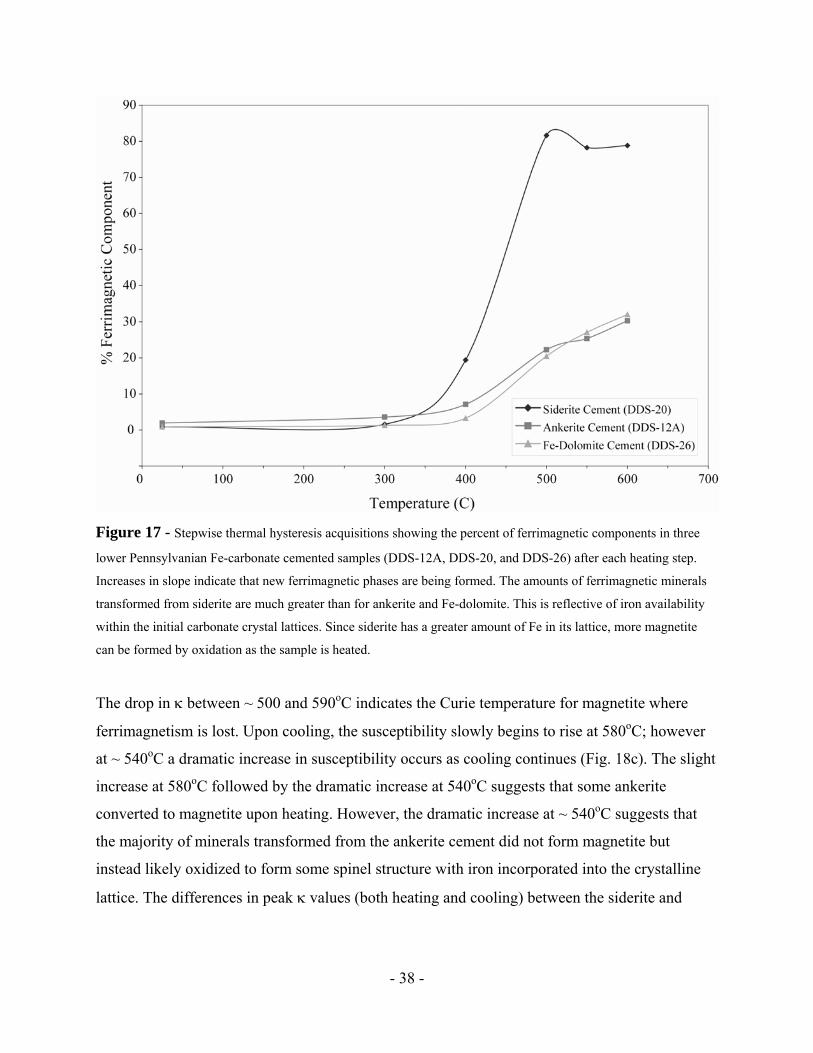
Figure 17 - Stepwise thermal hysteresis acquisitions showing the percent of ferrimagnetic components in th
lower Pennsylvanian Fe-carbonate cemented samples (DDS-12A, DDS-20, and DDS-26) after each heating st
Increases in slope indicate that new ferrimagnetic phases are being formed. The amounts of ferrimagnetic mineral
transformed from siderite are much greater than for ankerite and Fe-dolomite. This is reflective of iron availabil
within the initial carbonate crystal lattices. Since siderite has a greater amount of Fe in its lattice, more magnetite
can be formed by oxidation as the sample is heated.
The drop in κ between ~ 500 and 590
ree
ep.
s
ity
r
converted to magnetite upon heating. However, the dramatic increase at ~ 540 C suggests that
the majority of minerals transformed from the ankerite cement did not form magnetite but
lattice. The differences in peak κ values (both heating and cooling) between the siderite and
oC indicates the Curie temperature for magnetite where
ferrimagnetism is lost. Upon cooling, the susceptibility slowly begins to rise at 580oC; howeve
at ~ 540oC a dramatic increase in susceptibility occurs as cooling continues (Fig. 18c). The slight
increase at 580oC followed by the dramatic increase at 540oC suggests that some ankerite o
instead likely oxidized to form some spinel structure with iron incorporated into the crystalline
- 38 -

- 39 -
Figure 18

Figure 18 - Temperature-dependent susceptibility (TDS) curves for lower Pennsylvanian siderite (DDS-20) and
ankerite (DDS-12A) cemented quartz arenite samples. (a) Heating-cooling curve indicates that the siderite sample
produces a greater amount of strong ferrimagnetic minerals on heating compared to ankerite. Inset shows the decay
in susceptibility on heating to ~250oC indicating that the sample was dominantly paramagnetic. (b) Ankerite heating
curve showing similar decay in susceptibility to ~190oC and the generation of new ferrimagnetic phases at ~500oC.
(c) Ankerite cooling curve showing slight increase in susceptibility at 580oC attributed to low concentrations of
magnetite formed by heating, and a sharp susceptibility increase at 540oC indicating that a high concentration of an
unidentified ferrimagnetic phase resulted from heating.
ankerite cement is attributed to Fe availability. Siderite has more Fe available in the crystal
lattice to transform; therefore it produces more magnetite and higher susceptibilities.
Interpretation of Magnetic Facies Mineral magnetic results from Carboniferous fluvial/alluvial strata in the Central
Appalachian Basin are interpreted to reflect variations in parent material, pedogenic alteration,
and/or diagenetic modification of the original magnetic signal.
Upper Mississippian Magnetic Signals
Primary depositional signals as well as pedogenic and early diagenetic signals are
preserved in the upper Mississippian samples including: (1) detrital magnetite-titanomagnetite in
channelized and point-bar sandstones and gray mudstones, and detrital magnetite-titanomagnetite
and hematite in sheet-like sandstones and limestones; (2) early diagenetic signals in sheet-like
sandstones; and (3) pedogenic signals in red and gray vertisols.
Depositional Signals
Detrital Magnetite-titanomagnetite
Magnetite-titanomagnetite identified in the channelized and point-bar sandstones, as well
as in the gray mudstone and limestone facies is, on the basis of hysteresis behavior (e.g. Figs. 6c
and d; Figs. 7 and 8), interpreted as detrital rather than authigenic. The most plausible non-
pedogenic, post-depositional modes of magnetite formation documented in the literature include
the dehydration of goethite to hematite (Ozdemir and Dunlop, 2000; and references therein), and
the oxidation of siderite to hematite (Ellwood et al., 1986, 1988, 1989; Pan et al., 2000).
- 40 -
Magnetite is produced as an intermediate phase in these reactions. However, source area
provenance is the most likely explanation for the occurrence of magnetite in these samples
because it occurs in channel sandstones as well as in clay-rich sediments deposited by overbank
flooding of river channels. Similarity in ferrimagnetic mineralogy, concentration, and grain-size
between the channelized sandstone and gray mudstone (Figs. 7, 8, 9, and 10) suggests that the
magnetite-titanomagnetite was not produced authigenically because it seems unlikely that nearly
identical mineralogies, concentrations, and grai
n-sizes would be produced by the authigenic
lteration of goethite or siderite to magnetite in two mineralogically and granulometrically
positions
recycling of detritus from the Appalachian orogenic province to the southeast of the
depositional basin (Housek son et al., 1985;
McDow e
nes and associated grey
mudstones of floodplain origin (Miller and Eriksson, 2000).
Detrita
a
different facies (lithic sandstone vs. gray mudstone).
Most workers have attributed Appalachian Basin Carboniferous sandstone com
to
necht, 1980; Dickinson et al., 1983; Donald
ell, 1986; Reed at al., 2005). Magnetite/titanomagnetite was likely derived from th
orogenic province and incorporated into incised valley trunk-tributary drainage networks
represented by the channelized, point-bar and sheet-like sandsto
l Hematite
Most of the hematite in the sheet-like sandstones, identified on the basis of hysteresis
characteristics and high BCR values (e.g. Figs. 6a and b; Fig. 7), is also interpreted as detrital.
Red mudstone and siltstone intraclasts are the likely source of the detrital high-coercivity
(hematite) mineral phases in these sandstones. These intraclasts were derived locally in response
sheet flooding across oxidized floodplain sediments.
nd Hematite
to
Detrital Magnetite-titanomagnetite a
Magnetic characteristics of the limestone facies, reveal a two-component magnetic
system between mixtures of magnetite/titanomagnetite and hematite in two samples, as indicated
by wasp-waistedness (e.g. Figs. 6a and b), and exclusively titanomagnetite in another, as
indicated by a lower BCR value (Fig. 7). A detrital origin for these magnetic constituents is based
on the same criteria used above. Changes in sediment influx are the simplest explanation for the
mineralogic and concentration differences (Figs. 7 and 10) observed in these samples. Wetter
- 41 -

times would likely have promoted increased discharge into the playa. As a result, increas
overland runoff that incorporated red sediments from surrounding red upland soils would ha
carried hematite-rich silts and clays into the playa. Therefore, magnetite/titanomagnetite influx
from source streams likely mixed with the hematite-rich sediments. These limestone samples
lack red coloration and do not display SP hysteresis behavior (e.g. closed loops at all fields)
suggesting that hematite was not formed in situ by the dehydration of goethite. Furthermore,
hematite formed by the in situ oxidation of magnetite/titanomagnetite would require that the l
sediments were subaerially exposed. This would likely result in the formation of a calcic pro
(sensu Mack et al., 1993) and/or development of red p
ed
ve
ake
tosol
igmentation, neither of which are observed
in these
ays
iven
ical that both the incorporation of
ematitic siltstone/mudstone interclasts and the oxidation of primary magnetite/titanomagnetite
the high-coercivity antiferromagnetic mineral (hematite) phases (e.g. Figs. 6a
and b;
ed Vertisols
samples.
Early Diagenetic Signals
Another source of hematite in the sheet-like sandstones is through the oxidation of
detrital magnetite/titanomagnetite, and possibly the conversion of some ferromagnesian cl
(e.g. illite, smectite, and chlorite), as the sediment dewatered on an exposed floodplain. G
the nature of these sandy crevasse splay deposits, it seems log
h
are responsible for
Fig. 7). This indicates that the sources of hematite include both primary depositional (red
mudstone and siltstone interclasts) and post depositional (the oxidation of
magnetite/titanomagnetite and possibly the alteration of ferromagnesian clays) processes.
Pedogenic Signals
R
magnetic enrichment, depletion, and vertical
amalga
Red vertisols display κ profiles that reflect
mation. Magnetic enrichment is demarcated by high κ values within many of the red
vertisols (Fig. 5c). Enrichment in κ coincides with high χh and paramagnetic MS (Fig. 15a)
suggesting that the magnetic susceptibility patterns are related to illuvial increases in
paramagnetic clays such as smectites and illites.
Magnetic depletion in κ profiles occurs in the upper and lower parts of some red vertisol
profiles (Fig. 5c). Depletion in κ in the upper parts of soil profiles coincides with lower χh and
- 42 -

paramagnetic MS values (Fig. 15a), suggesting that elluviation of paramagnetic clays occurred
the upper B horizons. The wasp-waisted trends in the upper elluvially depleted horizons (e.g.
Fig. 6b) indicate the presence of mixed magnetite and hematite. Magnetic depletion in the lower
parts of soil profiles (Fig. 5b and c) is also associated with decreases in paramagnetic
concentrations. However, elluviation is not the likely cause. Instead, decreases in magnetite
coincide with increases in hematite as indicated by the decrease and eventual disappearance o
ferrimagnetic phases in wasp-waisted loops (e.g. the loop in Fig. 6b becomes the loop in Fig. 6f).
Downward increases in hematite at the expense of magnetite can be explained by long sustained
periods of oxidation of magnetite to hematite. Magnetite was completely oxidized to hematite in
the lower, older pa
in
f
rts of the soil profile resulting in the lower magnetic susceptibility values.
ertical magnetic amalgamation is recorded by alternating low and high κ values in middle
iles (Fig. 5c). Amalgamation is attributed to vertic shear mechanisms
that eff
oxidized shortly after
ng
exhum udstone facies would be expected to contain and to have acquired
is the case for the red vertisols.
Gray V
V
parts of thick vertisol prof
ectively mixed the magnetic minerals.
Hematite in the red vertisol facies was likely formed by the oxidation of primary
magnetite-titanomagnetite and Fe-bearing silicates prior to burial, and not from the dehydration
of goethite or oxidation of siderite. The dehydration of goethite generally produces crystals <
0.03 µm in size (Dunlop and Ozdemir, 1997), making them superparamagnetic (SP) and will not
acquire remanence. Hematite identified in all of the upper Mississippian facies caries a strong
remanence magnetization (e.g. Fig. 6b and f). Therefore, magnetite-titanomagnetite and possibly
Fe-bearing silicates present in original flood-plain sediments was partially
deposition. If hematite formed by the near-surface oxidation of diagenetic siderite followi
ation, then the gray m
red pigmentation as
ertisols:
In gray vertisols thick enough to show discernable trends, κ profiles show evidence o
magnetic depletion and enrichment (Figs. 5a and b). The most obvious zone of magnetic
enrichment occurs in the ~7.5 m thick PWV-1 stacked, gray vertisol profile that displa
increase in κ over the 9 to 10 m interval (Fig. 5b).
f
ys an
This enrichment coincides with increases in
χferri (F ig. 9; 2 to 19 × 10-8 m3 kg-1), ferrimagnetic MS (Fig. 10; 0.8 to 1.7 × 10⁻³ Am2 kg-1), and in
paramagnetic parameters MS (Fig. 10; 50 to 84 × 10-3 Am2 kg-1) and χh (Fig. 9; 5 to 9 × 10⁻⁸ m3
- 43 -
kg-1). Increases in the paramagnetic parameters imply that paramagnetic clays were transported
and concentrated by illuviation whereas increases in the ferrimagnetic parameters suggest that
iron became reduced, mobilized, transported downward in the soil profile and subsequently re-
oxidized as magnetite/titanomagnetite. The presence of magnetite/titanomagnetite is in
to the ferrimagnetic loop trends (Fig. 6c and d) and low B
ferred due
ion
of
te) may be responsible for the ferrimagnetic
hystere ron
ts
agnetic character of the red and gray
ertisols primarily reflects Mississippian pedogenic signals related to magnetic enrichment,
algamation. Undoubtedly, factors controlling the preserved pedogenic and
diagene
detrital
s,
CR values (Fig. 7). Magnetic deplet
due to removal and translocation of iron species at the 9m depth interval for the PWV-1 gray
vertisol (Fig. 5b) is likely responsible for the lower κ values observed in this part of the profile.
Mobilization of Fe most likely occurred during wetter times when an elevated water-table
promoted Fe+3 reduction. A subsequent drop in the water-table would have lowered the reduction
front and allowed the mobilized iron to re-oxidize and precipitate.
The upper section of this gray vertisol (Fig. 5b, 6.7 to 7.4 m) displays similar patterns
depletion and enrichment. However, temperature dependent susceptibility data (Figs. 17a and b)
indicate that iron sulfide minerals (e.g. pyrrhoti
sis components observed in the hysteresis data (Figs. 7, 9, and 10). The origin of i
sulfides may be a result of active reduction of magnetite in an organic-rich anaerobic soil or may
be later during diagenetic sulfate reduction. The location of these samples below a coal sugges
that primary, detrital magnetite-titanomagnetite may have been reduced as the soil became
water-logged. Associated organic and sulfuric acids derived from the overlying coal may have
reduced Fe+3 phases to complex and form iron sulfide phases. In diagenetic environments
involving sulfate reduction, dissolved ferrous ions react with H2S to form iron sulfide phases
(Liu et al., 2004). Therefore, in addition to early iron reduction from organic acids, later
diagenetic modes of sulfide formation (e.g. sulfate reduction) cannot be disregarded.
The above observations imply that the preserved m
v
depletion, and am
tic signals are complex and require careful consideration of environmental factors
responsible for oxidation and reduction of magnetic particles, such as climatic variability,
mineralogy, available organic matter, post-depositional alteration of clays and primary detritu
pore fluid chemistry, and the duration and intensity of oxidation.
- 44 -
Lower Pennsylvanian Magnetic Signals: Core WVGS-4
Early and late diagenetic signals are preserved in lower Pennsylvanian sandstones from
core WVGS-4 including: (1) an early diagenetic magnetite-titanomagnetite signal in the quartz-
cemented sandstones (Fig. 5d); (2) early diagenetic paramagnetic signal in siderite cemented
sandstones (Fig. 5d); and (3) near surface oxidation of deep burial ankerite and Fe-dolomite
cements (Fig. 5d). In addition, the dark mudstone sample (Fig. 5d) is associated with high
concentrations of paramagnetic minerals thought to reflect contributions from Fe-rich clays and
diagenetic Fe-carbonate cements.
Early Diagenetic Magnetite-titanomagnetite
Reed et al. (2005) demonstrated petrographically that iron oxides developed as thin
coatings on primary grains early in the diagenetic history of quartz-cemented sandstones
implying communication with an oxygenated atmosphere. Subsequent deeper burial resulted
late-stage cements that are typically quartz and occur as syntaxial overgrowths and/or prismatic
crystals that protrude into secondary pores. Magnetic analysis shows that these samples are
dominated by weak (often negative) κ and χ
in
ve lowered
the init
al
lly enhanced relative to the
uartz-cemented sandstones. Hysteresis results (Fig. 13 and 14) indicate that this enhancement is
rgely attributed to increased paramagnetic influence (e.g. siderite cement) on the basis of χh >>
lf values (Figs. 5d and Fig. 11) that are characteristic
of diamagnetic mineral assemblages with little ferrimagnetic or paramagnetic influence.
Hysteresis data suggests that the iron oxide coatings are magnetite/titanomagnetite identified on
the basis of low saturation fields (< 0.3 T, e.g. Fig. 6d) and low BCR values (Fig. 11).
Furthermore, low χferri and ferrimagnetic MS (Figs. 13 and 14) values indicate that
magnetite/titanomagnetite occurs in a very limited quantity as suggested by the weak and
negative κ and χlf values. The addition of late-stage diagenetic quartz cements may ha
ial magnetite/titanomagnetite signal by volume dilution (e.g. Soregan et al., 2002).
Early Diagenetic Siderite
As previously discussed, Reed et al. (2005) have shown that wheat-seed and euhedr
siderite cements developed as primary pore filling cements early in the diagenetic history of the
sandstones and reflect reducing pore-fluid conditions. Profiles of κ (Fig. 5e) show that the
siderite-cemented sandstones (DDS-9 and DDS-20) are magnetica
q
la
- 45 -

χferri and elevated paramagnetic MS values. Microprobe results from Reed et al. (2005) confirm
that sid
ater,
sms for siderite formation: (1) the replacement of CaCO3; and
) the reduction of ferric oxides by organic matter. The replacement of CaCO3 is unlikely in the
005) indicate that these cements formed from
meteor
ucing
t that
) and the
te samples
b, and
ent in
DS-12A and DDS-26. Room-temperature hysteresis characteristics (saturation field < 0.3 T
magnetic MS values) reveal that magnetite and/or titanomagnetite is
present
Fe-
erite is the paramagnetic mineral phase present these samples, as also suggested by
temperature-dependent hysteresis and TDS data (Figs. 17 and 18a).
Depleted δ18O values (-12 to -13‰ PDB) from siderite rims indicate a meteoric water
influence and support petrographic evidence that siderite formed relatively early (Reed et al.,
2005). Furthermore, Mozely (1989) indicates that since sulfate activity is low in meteoric w
pyrite precipitation is inhibited resulting in more Fe+2 available for siderite formation. Postma
(1982) lists two proposed mechani
(2
siderite cemented samples since Reed et al. (2
ic pore fluids. In addition, these authors suggest that the main source of Fe+3 was
transported in by terrestrial soils and streams and likely reduced to form siderite by Fe-red
microbes under ever-wet climatic conditions.
Late Diagenetic Ankerite and Fe-Dolomite
Petrographic observations show that ankerite and Fe-dolomite formed during deep burial
and after formation of secondary porosity (Reed et al., 2005). These authors also point ou
later oxidation of the deep burial Fe-carbonate cements occurred in near-surface environments
following exhumation. κ profiles (Fig. 5d) indicate that the ankerite sample (DDS-12A
Fe-dolomite sample (DDS-26) display elevated values similar to those of the sideri
(DDS-9 and DDS-20). Temperature-dependent hysteresis and TDS data (Figs. 17 and 18a,
c), together with microprobe analysis (Reed et al., 2005), confirm that ankerite and Fe-dolomite
are the paramagnetic minerals largely responsible for the magnetic susceptibility enhancem
D
and moderate BCR and ferri
in DDS-12A and DDS-26 (e.g. Figs. 6h; Figs. 11, and 14). Therefore, the Fe-oxides
identified in DDS-12A and DDS-26 by Reed et al. (2005) are likely magnetite and/or
titanomanetite. Based on the diagenetic interpretation of Reed et al. (2005), the ankerite and
dolomite cemented samples are considered to reflect a near-surface ferrimagnetic signal where
magnetite/titanomagnetite formed by partial oxidation of late burial Fe-carbonate cements
following exhumation. This signal is superimposed on a paramagnetic deep-burial signal where
- 46 -

late ankerite and Fe-dolomite cements formed by the introduction of Fe-rich fluids.
Magnetite/titanomagnetite identified in the early siderite samples (DDS-9 and DDS-20) on
basis of ferrimagnetic loop shapes and low to moderate B
the
igs. 6h and 11) may also
have fo to
ts.
nd
also
. 6h; Figs. 11, and 14).
ore MM-1
-
.
m,
uently, it
CR values (F
rmed by near-surface oxidation of Fe-carbonate cements following exhumation similar
DDS-12A and DDS-26.
Thin-section analysis of the WVGS-4 dark mudstone sample reveals that it is dominated
by depositional clay minerals with lesser amounts of Fe-carbonate, quartz and Fe-oxide cemen
The high κ value (Fig. 5d) is largely attributed to high concentrations of paramagnetic clays and
Fe-carbonate cements. Hysteresis data confirm that increased paramagnetic contributions are
responsible for the susceptibility enhancement on the basis of high χh and paramagnetic MS a
low χferri values (Figs. 13 and 14). Low concentrations of magnetite/titanomagnetite have
been identified in these samples by low ferrimagnetic saturation (< 0.3 T) characteristics, low
BCR, and low ferrimagnetic MS values (e.g. Fig
Lower Pennsylvanian Magnetic Signals: C
Diagenetic inferences can be made for core MM-1 by comparing the combined diagenetic
and magnetic interpretations of core WVGS-4 with the magnetic results from MM-1. Three MM
1 quartz arenite samples display weak negative κ values (27.3, 45.7, and 63.6 m, Fig. 5e)
characteristic of quartz-dominated sandstones. These samples are associated with strong
diamagnetic signals attributed to detrital quartz grains and diagnetic cements. This is suggested
by weak negative χlf values, negligible χh and χferri values, and low paramagnetic and
ferrimagnetic MS values, all of which are characteristic of the WVGS-4 quartz-cemented
sandstones (Figs. 11, 13, and 14). Magnetite/titanomagnetite identified on the basis of hysteresis
loop shape and low to moderate BCR values (Figs. 6h and 11) in these quartz-dominated MM-1
sandstone samples are likely of similar origin to the early Fe-oxide coats identified by Reed at al
(2005) in WVGS-4. The magnetic characteristics of the MM-1 samples (27.3, 45.7, and 63.6
Fig. 5e) largely agree with those of the WVGS-4 quartz-cemented sandstones. Conseq
seems reasonable to assume that a similar diagenetic history existed in the three MM-1 quartz
dominated samples. Therefore, low concentrations of magnetite/titanomagnetite identified in
these MM-1 sandstone samples likely developed as early coats on primary grains, implying
- 47 -

communication with an oxygenated atmosphere whereas subsequent deeper burial li
in the addition of late-stage diamagnetic cements that preserve the original detrital quartz signal
Four MM-1 quartz arenite samples (10.8, 45.3, 47.5, and 74.7 m; Fig. 5e) display
elevated κ peaks within quartz and siderite conglomeratic lag deposits. These samples are also
associated with higher χ
kely resulted
.
pared to three low χlf MM-1 sandstone samples (Fig. 11).
Hyster
e
timing of these cements
annot be discerned from the data. Nevertheless, the addition of post-depositional Fe-rich
cause of the increased κ and χlf values
observe
to
data
.
lf values com
esis data indicate that increased κ and χlf observed in these samples is largely associated
with increased paramagnetic contributions similar to the WVGS-4 Fe-carbonate cemented
samples (Figs. 13 and 14). Magnetite/titanomagnetite identified in the four high κ MM-1 quartz
arenite samples (10.8, 45.3, 47.5, and 74.7 m; Fig. 5e) on the basis of ferrimagnetic loop shape
and low to moderate BCR values (e.g. Figs. 6c and d; Fig. 11), likely formed by near-surface
oxidation of Fe-carbonate cements following exhumation similar to DDS-12A and DDS-26. Th
magnetic characteristics of these MM-1 samples also largely agree with those of the WVGS-4
Fe-carbonate cemented sandstones. However, the exact mineralogy and
c
paramagnetic cements can be inferred and are likely the
d in these samples.
MM-1 dark mudstone and heterolithic facies are associated with higher κ values than the
quartz-arenite facies (Fig, 5e). Elevated values and anomalous peaks are largely attributed
high concentrations of Fe-rich paramagnetic clays and cements as indicated by hysteresis
(Figs. 13 and 14). Low concentrations of magnetite have also been identified in these samples by
ferrimagnetic loop characteristics and low BCR values (e.g. Fig. 6c; Fig. 11).
Discussion Upper Mississippian
Magnetic signals identified in upper Mississippian facies of the Central Appalachian
Basin include primary source-area- derived detrital magnetite-titanomagnetite, locally-derived
detrital hematite, early diagenetic hematite, and pedogenic enrichment, depletion, amalgamation
Controls on the occurrence of each signal include one or a combination of provenance, climate,
landscape position, sediment accumulation or bypass, relative position of base-level, exposure
time, water table fluctuations, and redox changes.
- 48 -

Primary detrital magnetite-titanomagnetite identified in the channelized and point-bar
sandstones, gray mudstones, and limestones was derived from the Appalachian orogenic
provinc m
eying
tanomagnetite and/or Fe-silicates. However, due to the short length of the dry season, complete
oxidation to hematite was inhibited. In co red vertisols reflect a shift to a longer
dry season in which the water-table remained agnetite-titanomagnetite and/or Fe-
atite. Thicker red and gray paleosols reflect prolonged periods of
Fe-silicates to hematite, and was followed by a
e. Its preservation suggests that the sediments were not sufficiently oxidized to for
hematite or water-logged to form reduced iron complexes. Detrital hematite identified in the
sheet-like sandstone and limestone facies was likely derived from local sources. In the sheet-like
sandstone facies, local red siltstone and mudstone intraclasts were incorporated in response to
sheet flooding across oxidized floodplain sediments. In these deposits, detrital
magnetite/titanomagnetite likely became oxidized as the sediment dewatered on an exposed
floodplain.
The magnetic patterns associated with the red and gray vertisol facies largely reflect
pedogenic depletion, enrichment, and amalgamation processes attributed to a seasonally wet and
dry climate. These magnetic patterns were promoted by the elluviation and illuviation of
magnetic species in the surface horizons, as well as vertical mixing in the soil profile by shrink-
swell mechanisms. Gray paleosols have been attributed to a high water table resulting in gl
(Retallack et al., 2003) whereas red vertisols indicate highly oxidizing conditions (Retallack,
1988).
Thin intercalated red and gray vertisols (< 2 m) likely reflect short exposure times with a
fluctuating water table. During wetter times, thin gray vertisols developed under a seasonal
climate in which the wet season was long enough to maintain an elevated water table promoting
reduction and mobilization of iron. The ensuing dry season was likely brief and the resulting
water-table drop lowered the reduction front enough to allow for some oxidation of magnetite-
ti
ntrast, the thin
low allowing m
silicates to oxidize to hem
exposure and landscape stability, coupled with a fluctuating water table, that resulted in the
development stacked paleosol profiles. Similar to the thin gray vertisols, the thick gray vertisols
developed during long wet seasons followed by brief dry seasons that inhibited the oxidation of
magnetite-titanomagnetite and/or Fe-silicates to hematite. The thick, stacked red vertisols were
produced by similar processes to their thinner counterparts, where a long dry season promoted
the oxidation of magnetite-titanomagnetite and/or
- 49 -

brief wet season. Miller and Eriksson (1999 and 2000) have inferred that high-amplitude base
level changes driven by fourth-order eustatic fluctuations controlled sequence developmen
These fluctuations were associated with high-frequency climate changes related to global
circulation patterns related to waxing and waning of the Gondwanan glaciation. Therefore,
changes from wetter to drier times recorded, respectively, in the thick gray and red vertisols may
reflect changes in climatic patterns related to glacio-eustacy.
The presence of well-developed paleosols that reflect prolonged exposu
stability are indicative of significant depositional hiatuses and missing intervals of time. Thic
paleosols pre
t.
re and landscape
k
served in highstand deposits and reflecting prolonged exposure may represent
-
ennsylvanian
Fe-
d
tz-
-
interfluves correlative with the low-stand surfaces of erosion (Weimer, 1992). Therefore, by
recognizing magnetic patterns of enrichment, depletion, and/or amalgamation in diagenetically
altered ancient soil profiles lacking obvious pedogenic horizonation, identification of high
frequency climatic-eustatic changes may help in the recognition and interpretion of complex
continental successions and assist in sequence stratigraphic analysis.
Lower P
The primary signals identified in the lower Pennsylvanian quartz arenite facies include
early diagenetic magnetite-tiatanomagnetite and siderite, late diagenetic quartz, ankerite, and
dolomite. Signals preserved in the dark mudstone and heterolithic facies are paramagnetically
enhanced relative to the quartz arenite facies.
The early and late diagenetic magnetic signals recognized in these facies either preserve
or mask the original detrital signals. In the quartz arenite facies, the original depositional signal
was diamagnetic as a result of homogeneity within the quartz-rich sediments. Low
concentrations of early magnetite-titanomagnetite are insufficient to significantly affect the
quartz-dominated magnetic signal. Therefore, the diamagnetic detrital signal is preserved an
with progressive burial was amplified by the addition of late stage quartz-cement. Some quar
rich samples display strong paramagnetic trends that overshadow the diamagnetic effects of the
quartz grains. These relationships are attributed to early diagenetic additions of siderite cement
and late additions of ankerite, and Fe-dolomite cements. The dark mudstone and heterolithic
facies are associated with increases in paramagnetic components largely related to increased Fe
rich clay concentrations.
- 50 -

In fluvial successions like the Raleigh Sandstone, where evidence of pedogenic
modification is absent, depositional hiatuses may be identified by evidence of vadose diagene
Evidence of vadose diagenesis include: (1) abundant cement, and (2) a loose grain framew
indicating cementation prior to burial compaction (Miall and Arush, 2001). Petrographic and
magnetic analyses reveal that siderite cementation occurred early and prior to burial compaction
and that siderite cement maintains the open-grain framework
sis.
ork,
in the quartz-rich detrital
sedime
ns
he
nel
In
early siderite cementation
zones m y reflect periods of prolonged exposure and define unconformities that may be
oodplain paleosols indicative of low-stand surfaces of erosion (sequence
bounda
s.
ultistory valley-fill successions is important in
order to
ic
aluated by susceptibility alone. Therefore, a multi-parameter approach
nts. Therefore, early siderite cemented zones in the lower Pennsylvanian quartz arenite
facies are interpreted to reflect hiatuses in sedimentation.
Identifying surfaces of exposure in multi-story channel-fills has important implicatio
for sequence stratigraphy. Conglomerate lags define multiple episodes of channel incision in t
lower Pennsylvanian quartz arenite facies. Blum and Price (1998) have demonstrated that
unconformities within Quaternary composite valley-fill sequences represent periods of chan
incision and/or sediment bypass along which paleosols developed on abandoned floodplains.
the lower Pennsylvanian quartz arenites, conglomerate lags as well as
a
correlative with thick fl
ry).
In complex incised valley systems where obvious evidence of erosion and exposure are
lacking, magnetic characteristics may be used to identify and characterize stratigraphic surface
Recognizing these surfaces within complex, m
develop a sequence stratigraphic framework. Therefore, applying magnetic techniques to
these complex systems may help reveal cryptic surfaces that have regional significance.
Conclusion Mineral magnetic measurements have helped provide a detailed characterization of magnet
properties within select Carboniferous samples. The results of these analyses suggest that
magnetic properties provide useful insights towards identifying the depositional and post-
depositional processes and provide a means for recognizing cryptic surfaces that may represent
intervals of missing time. Magnetic susceptibility profiles provide a quick and easy means for
identifying magnetic patterns. However, there are numerous factors that give rise to the various
patterns that cannot be ev
- 51 -

is essential in order to obtain reliable information pertinent to the argument in question.
results, combined with a review of previous work, indicate that the magnetic properties of
Carboniferous strata can be used to identify depositional, pedogenic, and diagenetic magnetic
signals. Furthermore, the results indicate that there are several environmental conditions that g
rise to the unique magnetic patterns represented in the study.
1. Mineral magnetic parameters identify primary detrital remanence components in upper
Mississippian channelized sandstone, gray mudston
Our
ive
e, pointbar sandstone, and limestone
tic
e horizons, as well as vertical mixing in the soil profile by shrink-swell
nder a
long dry season that promoted the oxidation of magnetite-titanomagnetite and/or Fe-
silicates to hematite and that was ort wet season. The presence of well-
oped
osure
facies. Channelized sandstone, gray mudstone, and pointbar sandstone facies contain
source-area-derived detrital magnetite/titanomagnetite as the only remanence carrier.
Limestone facies contain a mixture of detrital titanomagnetite and hematite largely
controlled by sediment influx in response to wet-dry climatic conditions.
2. Magnetic enrichment, depletion, and amalgamation patterns within upper Mississippian
red and gray vertisols are indicative of preserved pedogenic signals. These magne
patterns were produced by the elluviation and illuviation of magnetic species in the
surfac
mechanisms. During wetter times, gray vertisols developed under seasonal climates in
which the wet season was long enough to maintain an elevated water table to promote
reduction and mobilization of iron. The ensuing dry season was likely brief and the
resulting water-table drop lowered the reduction front enough to allow for some oxidation
of magnetite-titanomagnetite and/or Fe-silicates. Red vertisols likely developed u
followed by a sh
developed paleosols that reflect prolonged exposure and landscape stability are indicative
of significant depositional hiatuses and missing intervals of time. These well-devel
vertisols reflect significant hiatuses in sedimentation associated with prolonged exp
on interfluve/floodplain surfaces that may correlative with incised valleys.
3. Early and late diagenetic signals are preserved in the lower Pennsylvanian strata. Early
diagnenetic signals are preserved in the quartz arenite facies as magnetite and siderite
- 52 -

coatings on detrital grains reflecting early diagenesis under, oxidizing and reducing
conditions, respectively. Low concentrations of ferrimagnetic minerals phases are d
by late burial quartz cements producing dominant diamagnetic hysteresis behavior. The
siderite cements record overprinting of the primary detrital signal (diamagnetic) by early
paramagnetic cements. Ankerite and Fe-dolomite ceme
iluted
nts imparted a dominant
paramagnetic signal on primary diamagnetic quartz grains during deep burial
n
e of
sandstones.
The early siderite cements may reflect prolonged subaerial exposure and, together with
i-
diagnenesis. These arenites preserve a near-surface ferrimagnetic signal superimposed o
a late, deep-burial diagenetic signal. Exhumation likely resulted in near-surface oxidation
of these Fe-carbonate cements to form the ferric oxides identified in these samples.
In fluvial successions such as the Raleigh Sandstone, where evidence of
pedogenic modification is absent, depositional hiatuses may be identified by evidenc
vadose diagenesis preserved in the siderite-cemented, early Pennsylvanian
magnetically distinctive siderite-pebble conglomerate lags, are thought to define
unconformities within compound valley fills. Identifying surfaces of exposure in mult
story channel-fills has important implications for developing sequence stratigraphic
models for terrigenous siliciclastic sedimentary successions.
- 53 -
References
wkins, 1990, Paleoclimatic forcing of magnetic susceptibility variations in Alaskan loess during the late Quaternary: Geology, v. 18, p. 40-43.
, J. D., and M. B. Blake, 2002, Scrutiny of a global climate model for Upper Mississippian depositional sequences in the Central Appalachian foreland basiJournal of Geology, v. 110, p. 739-747.
M. B., 1997, Revised lithostratigraphy and megafloral biostratigraphy of the New River and Kanawha Formations (Pottsville Group: Lower and Middle Pennsylvanian) in southern West Virginia: M.S. thesis, University of West Virginia, Morgantown, WV
Begét, J. E., D. B. Stone, and D. B. Ha
Beuthin
n, U.S.A:
Blake,
, 159 p.
Blum,
.
Burley, S. D., J. D. Kantorowicz,
Cecil, C f chemical and silicicalstic
rocks: Geology, v. 18, p. 533-536.
hannell, J. E. T., and C. McCabe, 1994, Comparison of magnetic hysteresis parameters of unremagnetized and remagnetized limestones: Journal of Geophysical Research, v. 99, p. 4613-4623.
tter, 1998, A magnetic investigation of a Late Quaternary loess/paleosol record in Siberia: Geophysical Journal International, v. 132, p. 128-132.
avydov, V., B. R. Wardlaw, and F. M. Gradstein, 2004, The Carboniferous Period, in F. M. Gradstein, J. G. Ogg, and A. G. Smith, eds., A Geologic Time Scale 2004: Cambridge, UK, Cambridge University Press, p. 222-248.
ewey, J.F. 1981. Episodicity, sequence and style at convergent plate boundaries. In The Continental Crust and its Mineral Deposits. Geological Association of Canada, Special Paper 20, 553-572.
J. L. Erjavec, R. C. Ferguson, K. F. Inman, R. A. Knepp, F. A. Lindberg, and P. T. Ryberg, 1983, Provenance of North American Phanerozoic sandstones in relation to tectonic setting: Geological Society of America
M. D., and D. M. Price, 1998, Quaternary alluvial plain construction in responce to glacio-eustatic and climatic controls, Texas Gulf Coastal Plain, in K. W. Shanley, and PJ. McCabe, eds., Relative Role of Eustacy, Climate, and Tectonism in Continental Rocks, SEPM Special Publication No. 59, p. 31-48.
and B. Waugh, 1985, Clastic Diagenesis, in P. J. Brenchley, and B. P. J. Williams, eds., Sedimentology: recent developments and applied aspects, v.18, Geological Society Special Publication, p. 189-226.
. B., 1990, Paleoclimate controls on stratigraphic repetition o
C
Chlachula, J., M. E. Evans, and N. W. Ru
D
D
Dickinson, W. R., L. S. Beard, G. R. Brakenridge,
- 54 -

Bulletin, v. 94, p. 222-235.
nd
onate
Ellwood, B. B., W. Balsam, and B. Burkart, 1986, Anomalous magnetic properties in rocks
containing the mineral siderite: paleomagnetic implications: Journal of Geophysical
Ellwoo
e iron carbonate minerals, ankerite and ferroan dolomite, like siderite, important in paleomagnetism?: Journal of Geophysical
Ellwoo . L. Buhl, 1988, Siderite
formation in anoxic deep-sea sediments: a synergetic bacterially controlled process with
llwood, B. B., R. E. Crick, A. El Hassani, S. Benoist, and R. Young, 2000,
nglund, K. J., and R. E. Thomas, 1990, Late Paleozoic Depositional Trends in the Central
Evans, M. E., 2001, Magnetoclimatology of aeolian sediments: Geophysical Journal
International, v. 144, p. 495-497.
Evans, of China: Geophysical Journal
International, v. 117, p. 257-264.
Evans, s: ws, v. 54, p. 129-144.
s
Donaldson, A. C., J. J. Renton, and M. W. Presley, 1985, Pennsylvanian deposystems a
paleoclimates of the Appalachians: International Journal of Coal Geology, v. 5, p. 167-193.
Driese, S. G., and C. I. Mora, 1993, Physico-chemical environment of pedogenic carb
formation in Devonian vertic paleosols, central Appalachians, USA: Sedimentology, v. 40, p. 199-216.
Dunlop, D. J., and O. Ozdemir, 1997, Rock Magnetism: Cambridge, UK, Cambridge University
Press, 573 p.
Research, v. 91, p. 12779-12790.
d, B. B., B. Burkart, K. Rajeshwar, R. L. Darwin, R. A. Neeley, A. B. McCall, G. J. Long, M. L. Buhl, and C. W. Hickcox, 1989, Are th
Research, v. 94, p. 7321-7331.
d, B. B., T. H. Chrzanowski, F. Hrouda, G. J. Long, and M
important implications in paleomagnetism: Geology, v. 16, p. 980-982.
EMagnetosusceptibility event and cyclostratigraphy method applied to marine rocks: Detrital input versus carbonate productivity: Geology, v. 28, p. 1135-1138.
EAppalachian Basin: U.S. Geological Survey Bulletin1839-F, p. 19.
M. E., and F. Heller, 1994, Magnetic enhancement and paleoclimate: Study of loess/paleosol couplet across the Loess Plateau
M. E., and F. Heller, 2001, Magnetism of loess/ paleosol sequences: recent developmentEarth-Science Revie
Florindo, F., R. Zhu, B. Guo, L. Yue, Y. Pan, and F. Speranza, 1999, Magnetic proxy climate
results from the Duanjiapo loess section, southernmost extremity of the Chinese loesplateau: Journal of Geophysical Research, v. 104, p. 645-659.
- 55 -

riedman, G. M., and J. E. Sanders, 1978, Principles of Sedimentolgy, John Wiley and Sons, 792
Geiss, C. E., and S. K. Banerjee, 1997, A multi-parameter magnetic record of the last glacial-
interglacial paleoclimate from south-central Illinois, USA: Earth and Planetary Science
Greb, S. F., D. R. Chesnut, and C. F. Eble, 2004, Temporal changes in coal-vearing depositional
sequences (Lower and Middle Pennsylvanian) of the Central Appalachian Basin, U.S.A.,
al-bearing strata, AAPG Studies in Geology 51, p. 89-120.
40. Heller, F., and T. S. Liu, 1984, Magnetism of Chinese loess deposits: Geophysical Journal of the
Royal Astronomical Society, v. 77, p. 125-141.
Housek ite
al of Sedimentary Petrology, v. 50, p. 3-20.
.
earing cyclothems
ontny, A., H. De Wall, T. G. Sharp, and M. Posfai, 2000, Mineralogy and magnetic behavior of
ecord of M.S. thesis, Virginia Polytechnic Institute and State
University, Blacksburg, VA, 54 p.
Kraus, cting nhardt, and W. R. Sigleo, eds., Paleosols and
Weathering Through Geologic Time: Principles and Applications, Geological Society of
ukla, G., F. Heller, X. M. Liu, T. C. Xu, T. S. Liu, and Z. S. An, 1988, Pleistocene climates in
Kvale, sociated with low-sulfur
Fp.
Letters, v. 152, p. 203-216.
in J. C. Pashin, and R. A. Gastaldo, eds., Sequence stratigraphy, paleoclimate, and tectonics of co
Heller, F., and M. E. Evans, 1995, Loess Magnetism: Reviews of Geophysics, v. 33, p. 211-2
necht, D. W., 1980, Comparative anatomy of a Pottsville lithic arenite and quartz arenof the Pocahontas Basin, southern West Virginia: petrogenetic, depositional, and stratigraphic implications: Journ
Hrouda, F., P. Muller, and J. Hanak, 2003, Repeated progressive heating in susceptibility vs
temperature investigation: a new paleotemperature indicator?: Physics and Chemistry of the Earth, v. 28, p. 653-657.
Klein, G. d., and D. A. Willard, 1989, The origin of the Pennsylvanian coal-b
of North America: Geology, v. 17, p. 152-155.
Kpyrrhotite from a 260oC section at the KTB drilling site, Germany: American Mineralogist, v. 85, p. 1416-1427.
Korus, J. T., 2002, The Lower Pennsylvanian New River Formation: A Nonmarine R
Glacioeustasy in a Forland Basin:
M. J., and T. M. Bown, 1988, Pedofacies Analysis; a new approach to reconstruancient fluvial sequences, in J. Rei
America Special Paper 216, p. 143-152.
KChina dated by magnetic susceptibility: Geology, v. 16, p. 811-814.
E. P., A. W. Archer, and H. R. Johnson, 1989, Tidal deposits as
- 56 -

coals, Brazil Fm. (Lower Pennsylvanian), Indiana: Journal of Sedimentary Petrology, v.
vale, E. P., J. Cutright, D. Bilodea, A. W. Archer, H. R. Johnson, and B. Pickett, 1995,
iu, J., R. Zhu, A. Roberts, S. Li, and J.-H. Chang, 2004, High-resolution analysis of early
Liu, Q. emperature
dependence of magnetic susceptibility in an argon environment: implications for
102-112.
Liu, X. M., J. Shaw, T. S. Liu, F. Heller, and Y. Baoyin, 1992, Magnetic mineralogy of Chinese loess and its significance: Geophysical Journal International, v. 108, p. 301-308.
Mack, al
paleosols: Quaternary Research, v. 44, p. 383-391.
McDow for ate, provenance, and tectonics: Compass of Sigma
Gamma Epsilon, v. 63, p. 161-190.
Miall, A
ytechnic
iller, D. J., and K. A. Eriksson, 1999, Linked sequence development and global climate
60, p. 563-574.
KAnalysis of modern tides and implications for ancient tidalites: Continental Shelf Research, v. 15, p. 1921-1943.
Ldiagenetic effects on magnetic minerals in post-middle-Holocene continental shelf sediments from the Korea Strait: Journal of Geophysical Research, v. 109, p. B03103.
, C. Deng, Y. Yu, J. Torrent, M. Jackson, S. Banerjee, and R. Zhu, 2005, T
pedogenesis of Chinese loess/paleosols: Geophysical Journal International, v. 161, p.
G. H., W. C. James, and H. C. Monger, 1993, Classification of paleosols: GeologicSociety of America Bulletin, v. 105, p. 129-136.
Maher, B. A., 1998, Magnetic properties of modern soils and Quaternary loessic paleosols:
paleoclimatic implications: Paleogeography, Paleoclimatology, Paleoecology, v. 137, p. 25-54.
Maher, B. A., and R. Thompson, 1995, Paleoainfall reconstructions from pedogenic magnetic
susceptibility variations in the Chinese loess and
ell, R. J., 1986, An interpretation of the Grafton sandstone and its implications
Pennsylvanian paleohydraulics, clim
. D., and M. Arush, 2001, Cryptic sequence boundaries in braided fluvial successions:
Sedimentology, v. 48, p. 971-985. Miller, D. J., 1998, Depositional Environments and Sequence Stratigraphy of Upper
Mississippian Strata in the Central Appalachian Basin: Ph.D. thesis, Virginia PolInstitute and State University, Blacksburg, VA, 87 p.
Mchange: The Upper Mississippian record in the Appalachian basin: Geology, v. 27, p. 35-38.
Miller, D. J., and K. A. Eriksson, 2000, Sequence stratigraphy of Upper Mississippian strata in
- 57 -
the Central Appalachians: A record of glacioeustasy and tectonoeustasy in a foreland basin setting: AAPG Bulletin, v. 84, p. 210-233.
sition
zdemir, O., and D. J. Dunlop, 2000, Intermediate magnetite formation during dehydration of
Pan, Y. ed
to thermal treatment of siderite: Behavior and interpretation: Journal of Geophysical
Peters,
f mineralogy, concentration and grain size: Physics and Chemistry of the Earth, v. 28, p. 659-667.
Platt, N K. Kelts, eds., Lacustrine Facies Analysis, Special Publication 13, International Association
ostma, D., 1982, Pyrite and siderite formation on brackish and freshwater swamp sediments:
Price, G. D., P. J. Valdes, and B. W. Sellwood, 1997, Prediction of modern bauxite occurrence:
implications for climate reconstruction: Paleogeography, Paleoclimatology,
Quinlan, G. M., and C. Beaumont, 1984, Appalachian thrusting, lithospheric flexure, and
Paleozoic stratigraphy of eastern North America: Canadian Journal of Earth Sciences, v.
Rankey, E. C., and M. R. Farr, 1997, Preserved pedogenic mineral magnetic signature,
pedogenesis, and paleoclimate change: Pennsylvanian Roca Shale (Virgilian, Asselian),
eed, J. S., K. A. Eriksson, and M. Kowalewski, 2005, Climate, depositional and burial controls
itative
eineck, H.-E., and F. Wunderlich, 1968, Classification and origin of flaser and lenticular
Retallack, G. J., 1988, Field Recognition of Paleosols, in J. Reinhardt, and W. R. Sigleo, eds.,
Paleosols ans Weathering Through Geologic Time, Geological Society of America
Mozely, P. S., 1989, Relation between depositional environment and the elemental compo
of early diagenetic siderite: Geology, v. 17, p. 704-706.
Ogoethite: Earth and Planetary Science Letters, v. 177, p. 59-67.
, R. Zhu, S. K. Banerjee, J. Gill, and Q. Williams, 2000, Rock magnetic properties relat
Research, v. 105, p. 783-794.
C., and M. J. Dekkers, 2003, Selected room temperature magnetic parameters as a function o
. H., and V. P. Wright, 1991, Lacustrine carbonates, in P. Anason, L. Cabrera, and
of Sedimentologists, Blackwell Scientific Publications, Oxford, p. 57-74.
PAmerican Journal of Science, v. 282, p. 1151-1183.
Paleoecology, v. 131, p. 1-13.
21, p. 973-976.
central Kansas, USA: Sedimentary Geology, v. 114, p. 11-32.
Ron diagenesis of Appalachian Carboniferous sandstones: qualitative and quantmethods: Sedimentary Geology, v. 176, p. 225-246.
Rbedding: Sedimentology, v. 11, p. 99-104.
Special Paper 216, p. 1-20.
- 58 -
Retalla more, 2003, Magnetic susceptibility of
early Paleozoic and Precambrian paleosols: Paleogeography, Paleoclimatology,
iley, N., and N. Turner, 1995, The correlation of mid-Westphalian marine bands between the
rth v. 98, p. 319-328.
estigation Series Map I-2768.
file (Frnch oclimatology, Paleoecology, v. 148, p. 209-231.
oite-
ri, and
y, Paleoclimatology, Paleoecology, v. 143, p. 111-133.
Turnerinia, USA: Special Publication of
the International Association of Sedimentologits, v. 28, p. 363-379.
Verosu s, 1993, Pedogenesis and paleoclimate: Interpretation of the magnetic susceptibility record of Chinese loess-paleosol sequences:
Verosub, K. L., and A. Roberts, 1995, Environmental magnetism: Past, present, and future:
ck, G. J., N. D. Sheldon, M. Cogoini, and R. D. El
Paleoecology, v. 198, p. 373-380.
Rcentral Appalachian Basin (USA) and the United Kingdom: XIII International Congressof Carboniferous-Permian, Krakhow, Poland, p. 122.
Rochette, P., G. Fillio, J. L. Mattei, and M. J. Dekkers, 1990, Magnetic transitions at 30-40
Kelvin in pyrrhotite: insight into a widespread occurrence of this mineral in rocks: Eaand Planetary Science Letters,
Soregan, G. S., R. D. Elmore, B. Klatz, M. Cogoini, and S. Banerjee, 1997, Pedogenically
enhanced magnetic susceptibility variations in Paleozoic loessite: Geology, v. 25, p. 1003-1006.
Soreghan, G. S., R. D. Elmore, and M. T. Lewchuk, 2002, Sedimentologic-magnetic record of
western Pangean climate in Paleozoic loessite (lower Cutler beds, Utah): GSA Bulletin, v. 114, p. 1019-1035.
Swezey, C. S., 2002, Regional stratigraphy and petroleum systems of the Appalachian Basin,
North America: U.S. Geological Survey Geologic Inv
Theveniaut, H., and P. Freyssinet, 1999, Paleomagnetism applied to lateritic profiles to assess saprolite and duricrust formation processes: the example of Mont Baduel proGuiana): Paleogeography, Pale
Torii, M., K. Fukuma, C.-S. Horng, and T.-Q. Lee, 1996, Magnetic discrimination of pyrrh
and greigite-bearing sediment samples: Geophysical Research Letters, v. 23, p. 1813-1816.
Tsatskin, A., F. Heller, E. A. Hailwood, T. S. Gendler, J. Hus, P. Montgomery, M. Sarto
E. I. Virina, 1998, Pedosedimentary division, rock magnetism and chronology of the loess/paleosol sequence at Roxolany (Ukraine): Paleogeograph
, B. R., and K. A. Eriksson, 1999, Meander bend reconstruction from an Upper Mississippian point bar at Possum Hollow, West Virg
b, K. L., P. Fine, M. J. Singer, and J. TenPa
Geology, v. 21, p. 1011-1014.
- 59 -

Journal of Geophysical Research, v. 100, p. 2175-2192.
Virina, in ntary processes: Physics and Chemistry of the Earth,
v. 25, p. 475-478.
Weime
E. I., S. S. Faustov, and F. Heller, 2000, Magnetism of loess-paleosol formationsrelation to soil-forming and sedime
r, R. J., 1992, Developments in sequence stratigraphy: forland and cratonic basins: AAPGBulletin, v. 76, p. 965-982.
Zhu, R., C. Shi, V. Suchy, A. Zeman, B. Guo, and Y. Pan, 2001, Magnetic properties and
paleoclimatic implications of loess-paleosol sequences of Czech Republic: Science in China (Series D), v. 44, p. 385-394.
- 60 -

Appendix Contents
Appendix A – Magnetic Theory and Background………………………………………………62 Magnetic Susceptibility…...…………………………………………………………………62
Hysteresis Parameters..............................................................................................................63 Magnetic Mineral Types..........................................................................................................64 Magnetic Grain Size…………………………………………………………………………67 Interpretting Hysteresis Loops and Parameters……………………………………………...68 Thermal Magnetic Analyses…………………………………………...…………………….71 Figures………………………………………………………………………………………..73 Figure Captions…………………………………………………………………….………...75 References…………………………………………………………………………………....76 Appendix B – WVGS-4 Magnetic Characterization (Upper and Lower Raleigh Sandstones)....78
Figures………………………………………………………………………………………..86 Figure Captions……………………………………………………………….……………...98 References…………………………………………………………………………….……...99 Appendix C – MM-1 Magnetic Characterization (Lower Pennsylvanian New River Fm.)…...100
Figures………………………………………………………………………………………107 Figure Captions……………………………………………………………………………..116 References…………………………………………………………………………………..116 Appendix D – SSWV-1 Magnetic Characterization (Lower Hinton Fm. Stony Gap Mem.)….117
Figures………………………………………………………………………………………126 Figure Captions……………………………………………………………………………..137 References…………………………………………………………………………………..137 Appendix E – PWV-1 Magnetic Characterization (Upper Hinton Fm.)…………………...….138
Figures………………………………………………………………………………………144 Figure Captions……………………………………………………………………………..156 References…………………………………………………………………………………..156 Appendix F – PHS-1 Magnetic Characterization (Upper Mississippian Hinton Fm.)……..….157
Figures………………………………………………………………………………………162 Figure Captions……………………………………………………………………………..170 References…………………………………………………………………………………..170
- 61 -