Embed Size (px)
Citation preview
Magnetic Memory of Rocks: the Kazakhstan Orocline and Climatic Record of the Indian Monsoon
by
Alexandra Abrajevitch
A dissertation submitted in partial fulfillment of the requirements for the degree of
Doctor of Philosophy (Geology)
in The University of Michigan 2008
Doctoral committee:
Professor Rob Van der Voo, Chair Professor Charles R. Cowley Professor Ben A. van der Pluijm Adjunct Associate Professor Josep M. Pares
© Alexandra Abrajevitch
2008

ii
AcknowledgementsIt is a pleasure to acknowledge the invaluable help of many people, without whom
this thesis would not have been possible. I would like to express my gratitude to my
advisor Rob Van der Voo for many helpful discussions and constant encouragement he
provided during my study. His patience as well as his kindness in curing the injures I had
inflicted on the English language are sincerely appreciated.
I would like to thank my dissertation committee members Josep Maria Pares, Ben
van der Pluijm and Charles Cowley for managing to read the whole thesis so thoroughly.
Kirill Degtyarev, Mikhail Bazhenov, Natalia Levashova and Phil McCausland are
acknowledged for their constructive discussions on the geology of Kazakhstan, assistance
in field research and for many memories, some of which still bring a smile to my face. I
am also grateful to David Rea for his encouragement and assistance in the Bengal Fan
study. Jim Hnat is gratefully acknowledged for his help in editing the final draft of the
dissertation.
This study was supported by the U.S. National Science Foundation, grant EAR
0335882, by a Schlanger Ocean Drilling Fellowship and by an Institute of Rock
Magnetism Visiting Fellowship.
It is impossible to name all the people who have contributed to the dissertation in
some way; my sincere gratitude goes to all of them:
thank you all!
iii
Table of Contents Acknowledgements.................................................................................... ii List of Figures........................................................................................... vii
List of Tables ............................................................................................. xi
List of Appendices ....................................................................................xii
Chapter
1. Introduction ............................................................................................1
Kazakhstan orocline and amalgamation of Eurasia................................ 2
Rock magnetic study of the Bengal Fan sediments ............................... 7
References.................................................................................................. 8
2. Paleomagnetic constraints on the paleogeography and oroclinal bending of the Devonian volcanic arc in Kazakhstan ...............................................................................................12
Abstract .................................................................................................... 12
Introduction .............................................................................................. 14
Geological setting .................................................................................... 16
Field and laboratory methods ................................................................. 19
Results ...................................................................................................... 20
The a- and b- components................................................................. 21
The c-component............................................................................... 23
Anomalous directions of magnetization ............................................. 29
Discussion ................................................................................................ 31
Results summary and ages of magnetization .................................... 31
General pre-amble to an analysis of rotations in the Devonian volcanic arc........................................................................ 34
Previously published Silurian and Devonian paleomagnetic data and their corrected pre-Late Permian declinations .................... 35
Unbending the orocline................................................……………….41
iv
Conclusions ............................................................................................. 43
Acknowledgements ................................................................................. 44
References................................................................................................ 44
3. Paleomagnetism of mid-Paleozoic subduction-related volcanics from the Chingiz Range in NE Kazakhstan: The evolving paleogeography of the amalgamating Eurasian composite continent ............................................................................... 48
Abstract .................................................................................................... 48
Introduction .............................................................................................. 50
Geological Setting and Sampling ........................................................... 55
Locality AY (=Ayaguz; 48.0°N, 80.7°E).............................................. 57
Localities KN & DG (Kaynar-Dogolan; 49.5°N, 77.0°E) ..................... 57
Locality KU (Kurbakanas; 48.3°N, 78.3°E) ........................................ 57
Methods .................................................................................................... 58
Results ...................................................................................................... 59
Mid-Silurian volcanics (locality AY) .................................................... 59
Lower to lower-Middle Devonian rocks of KN&DG locality ................ 60
Givetian basalts (locality KU)............................................................. 69
Discussion ................................................................................................ 70
Overview of results from the Chingiz area deemed of primary origin..................................................................................... 70
Overprint data.................................................................................... 77
Polarity choice ................................................................................... 78
Declinations and rotations ................................................................. 81
Paleolatitudes .................................................................................... 83
Comparison with published paleogeographic models........................ 89
Conclusions ............................................................................................. 92
Acknowledgements ................................................................................. 92
References................................................................................................ 93
4. The role of the Kazakhstan orocline in the late Paleozoic amalgamation of Eurasia.........................................................................99
Abstract .................................................................................................... 99
Introduction ............................................................................................ 101
v
The tectonics of Kazakhstan and adjacent areas................................ 103
Sampling and laboratory methods ....................................................... 105
Results .................................................................................................... 107
Tokrau-A.......................................................................................... 107
Tokrau-B.......................................................................................... 111
Ayaguz-A ......................................................................................... 116
Ayaguz-B ......................................................................................... 120
Ages of magnetization ........................................................................... 120
Tokrau ............................................................................................. 124
Ayaguz............................................................................................. 128
Discussion .......................................................................................131
Rotations ......................................................................................... 131
Geodynamic implications................................................................. 133
Conclusions ........................................................................................... 139
Acknowledgements ............................................................................... 140
References.............................................................................................. 140
5. Variations in relative abundances of goethite and hematite in the Bengal Fan sediments: climatic vs. diagenetic signal.............146
Introduction ............................................................................................ 146
Geological background ......................................................................... 149
Climate change in the region ........................................................... 149
Himalayan foreland basin ................................................................ 151
The Bengal Fan ............................................................................... 152
Sampling ................................................................................................. 153
Methods for identification of magnetic minerals in samples ............. 154
Results .................................................................................................... 160
Identity of the components............................................................... 160
Reliability of the IRM acquisition analysis in quantifying goethite and hematite ...................................................................... 171
Results summary............................................................................. 171
Discussion .............................................................................................. 175
Climatic signal vs. diagenetic changes ............................................ 175
Stability of the iron (oxyhydr)oxides in marine environments........... 178
vi
Environmental significance of biogenic magnetite ........................... 180
Evidence for reductive dissolution ................................................... 182
Summary and Conclusions ................................................................... 185
Acknowlegements.................................................................................. 186
References.............................................................................................. 187
6. Conclusions ........................................................................................195
Kazakhstan orocline .............................................................................. 195
Rock magnetic study of the Bengal Fan sediments ........................... 198
References.............................................................................................. 200
Appendices .............................................................................................202
vii
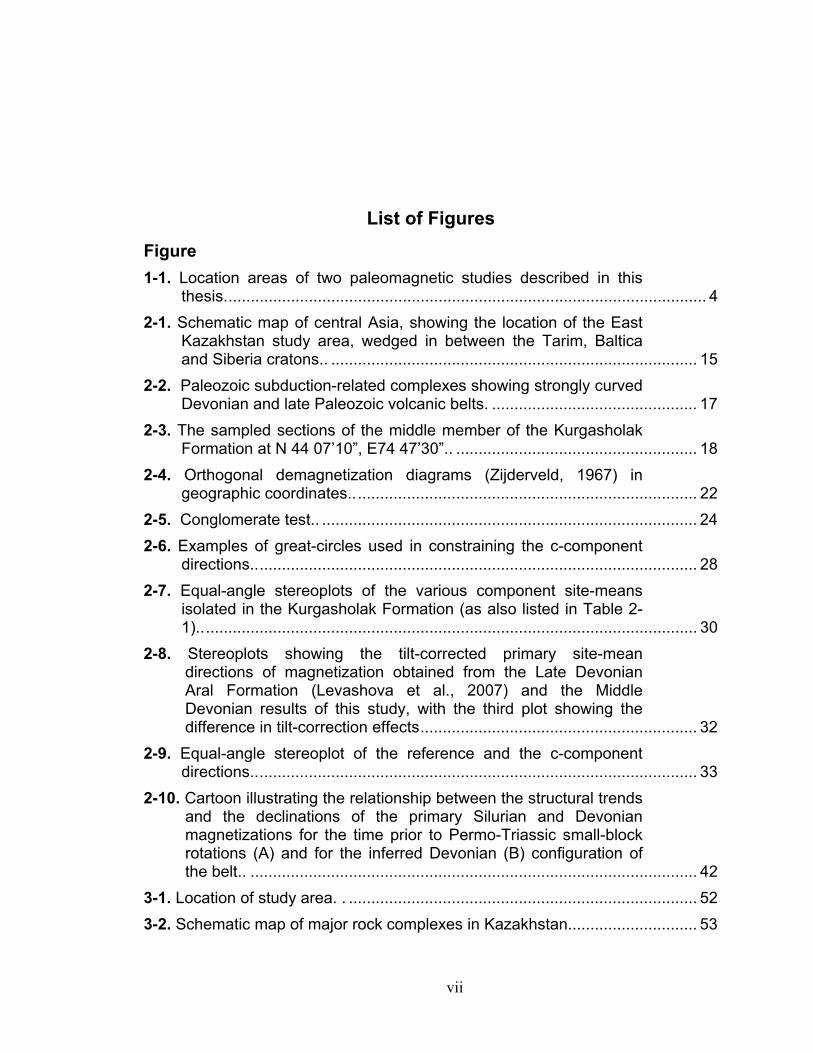
List of Figures Figure 1-1. Location areas of two paleomagnetic studies described in this
thesis............................................................................................................ 4
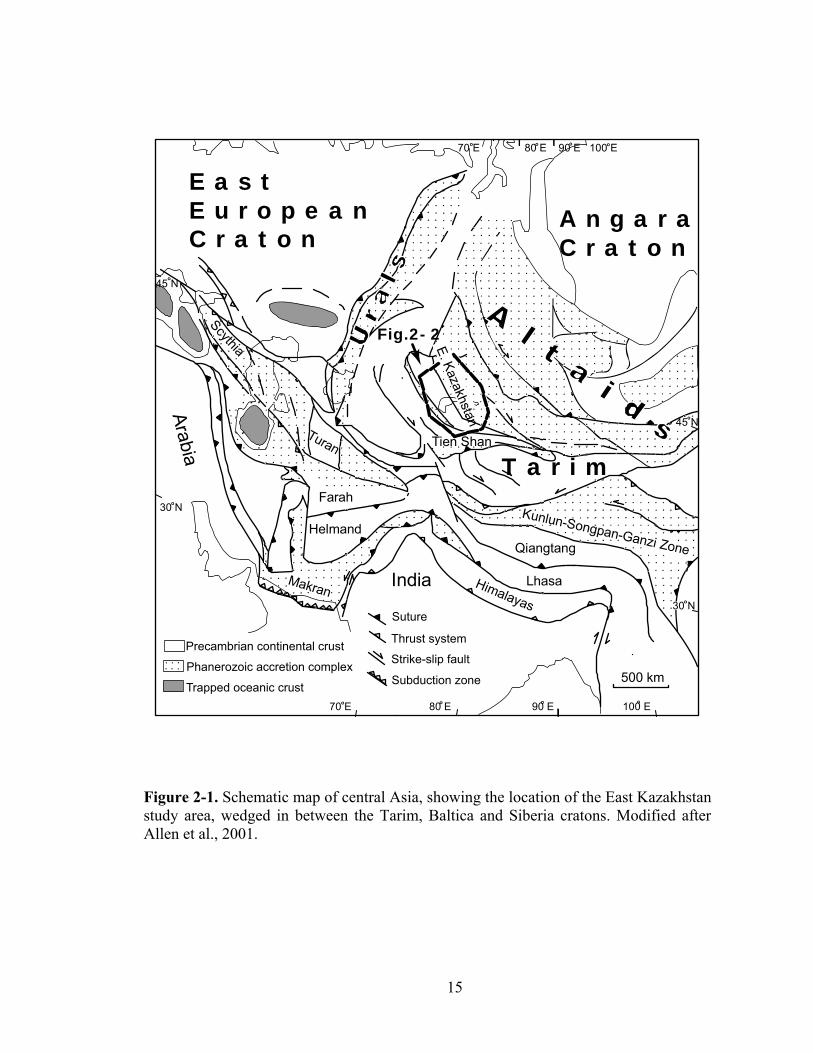
2-1. Schematic map of central Asia, showing the location of the East Kazakhstan study area, wedged in between the Tarim, Baltica and Siberia cratons.. .................................................................................. 15
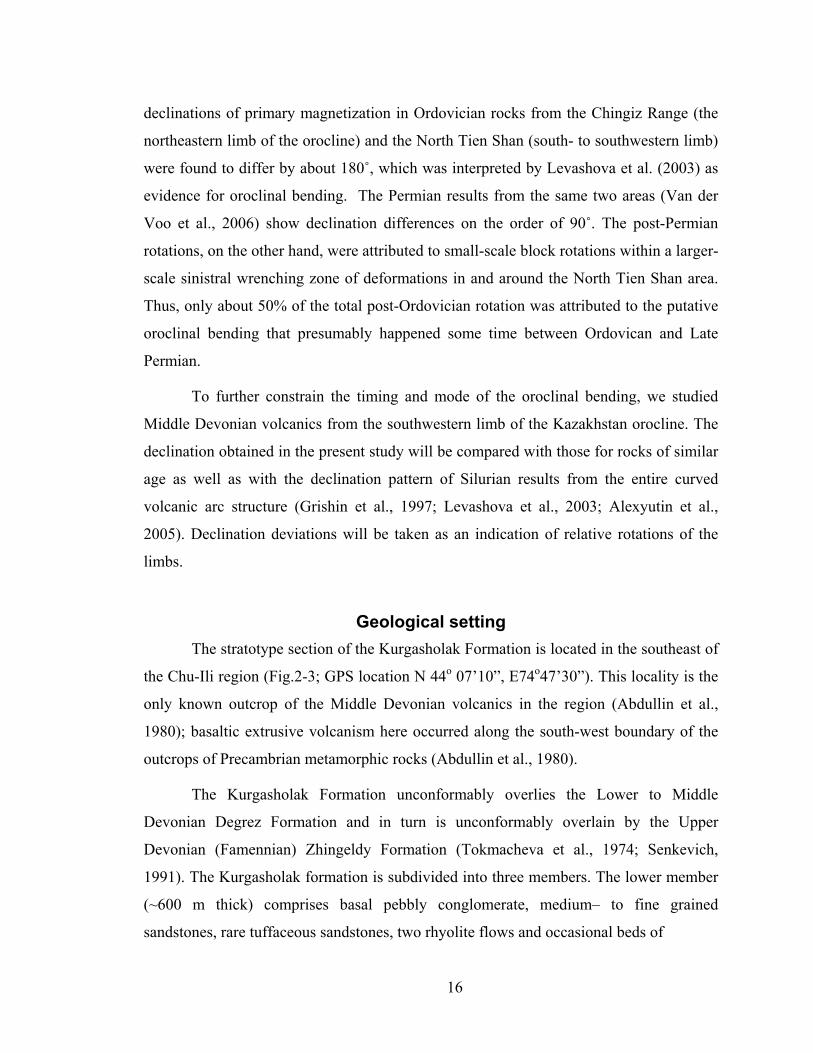
2-2. Paleozoic subduction-related complexes showing strongly curved Devonian and late Paleozoic volcanic belts. .............................................. 17
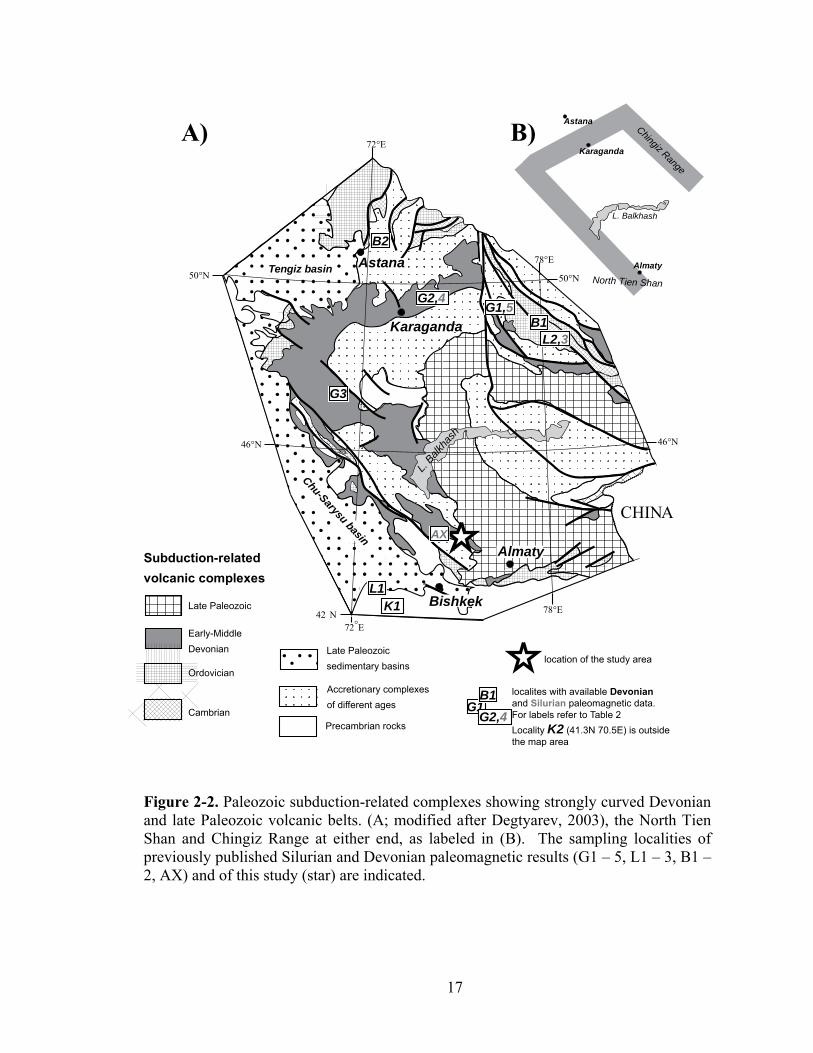
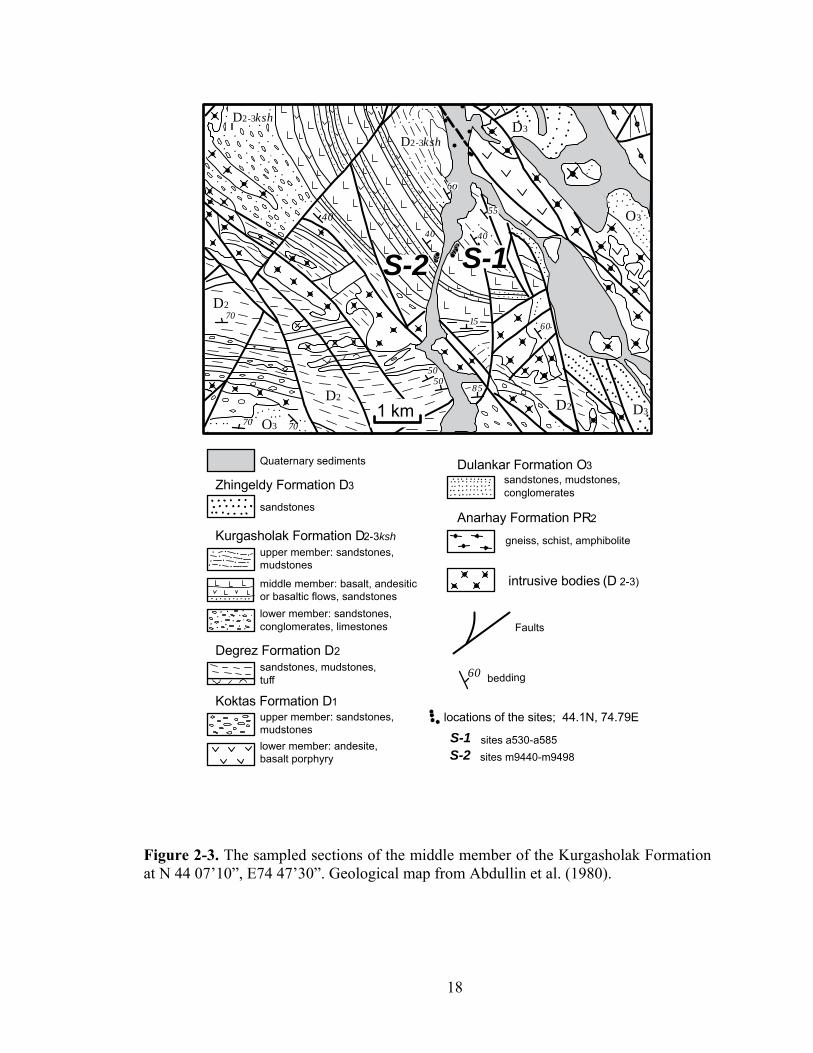
2-3. The sampled sections of the middle member of the Kurgasholak Formation at N 44 07’10”, E74 47’30”.. ...................................................... 18
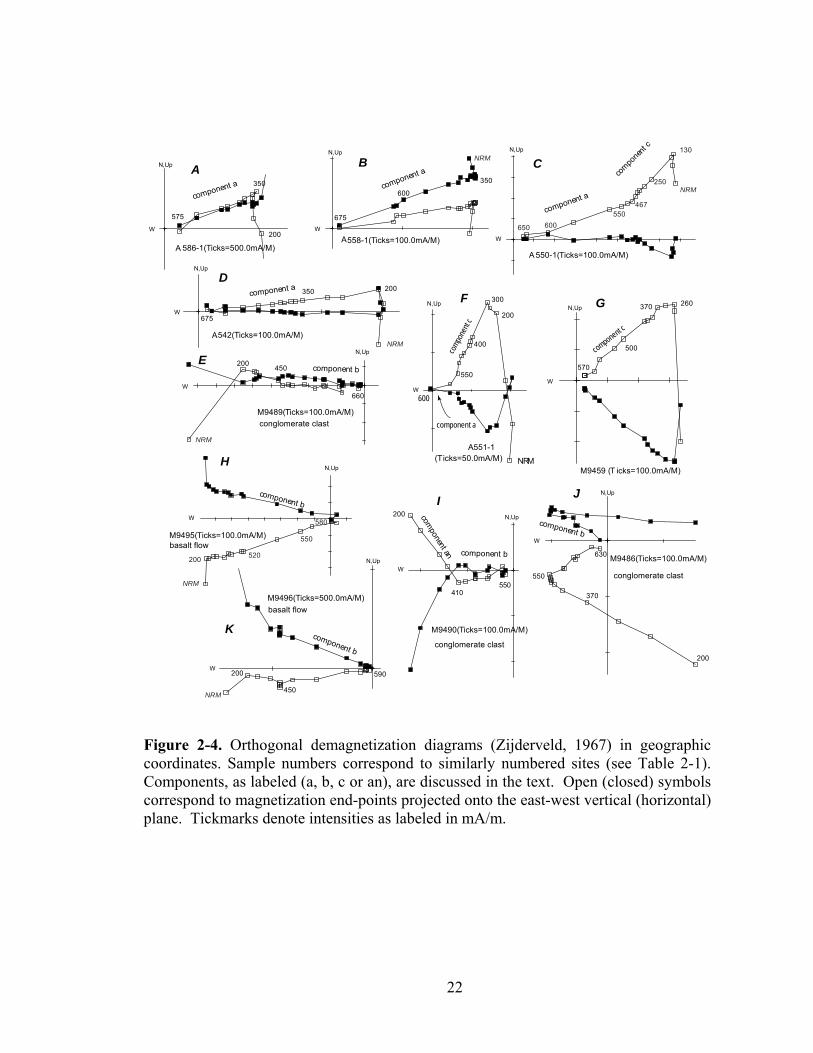
2-4. Orthogonal demagnetization diagrams (Zijderveld, 1967) in geographic coordinates.............................................................................. 22
2-5. Conglomerate test.. .................................................................................... 24
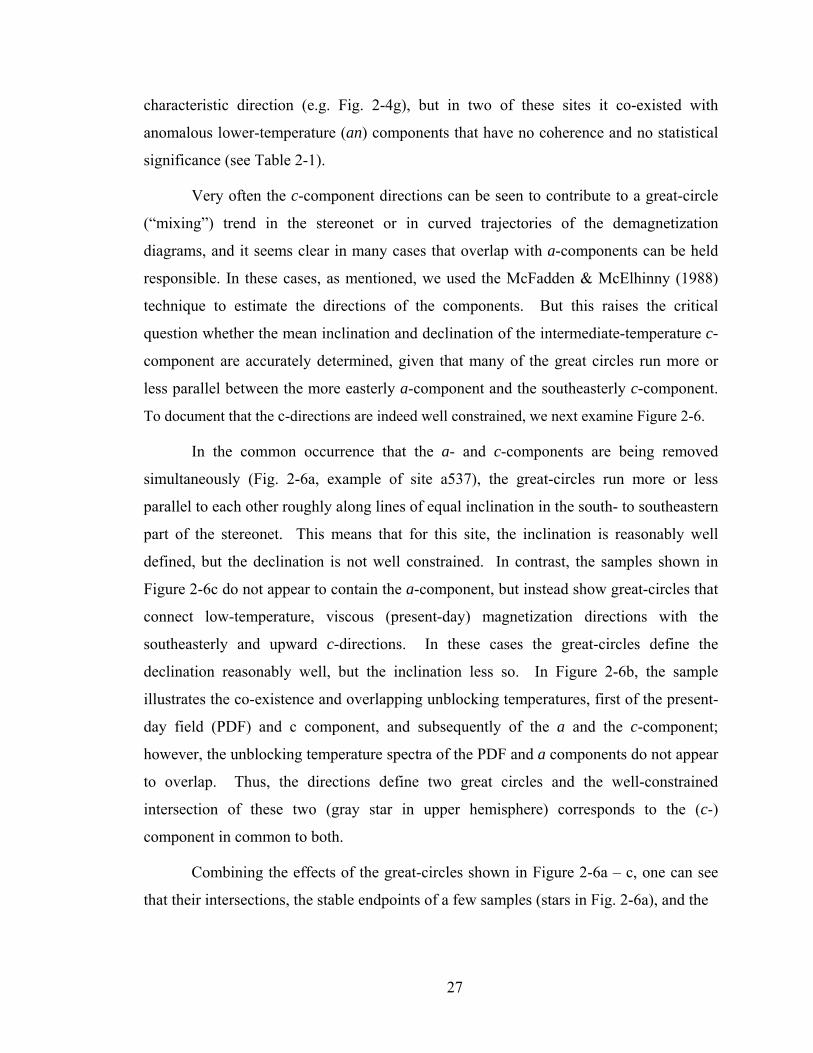
2-6. Examples of great-circles used in constraining the c-component directions.................................................................................................... 28
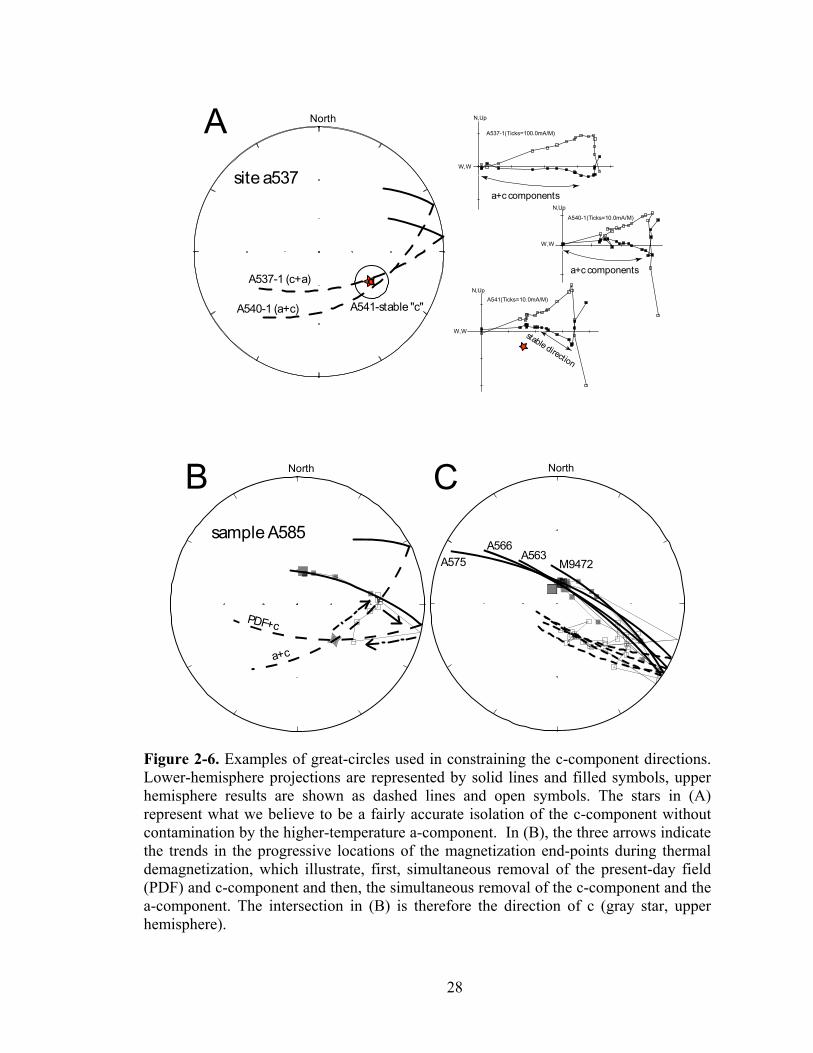
2-7. Equal-angle stereoplots of the various component site-means isolated in the Kurgasholak Formation (as also listed in Table 2-1)................................................................................................................ 30
2-8. Stereoplots showing the tilt-corrected primary site-mean directions of magnetization obtained from the Late Devonian Aral Formation (Levashova et al., 2007) and the Middle Devonian results of this study, with the third plot showing the difference in tilt-correction effects.............................................................. 32
2-9. Equal-angle stereoplot of the reference and the c-component directions.................................................................................................... 33
2-10. Cartoon illustrating the relationship between the structural trends and the declinations of the primary Silurian and Devonian magnetizations for the time prior to Permo-Triassic small-block rotations (A) and for the inferred Devonian (B) configuration of the belt.. .................................................................................................... 42
3-1. Location of study area. . .............................................................................. 52
3-2. Schematic map of major rock complexes in Kazakhstan............................. 53
viii
3-3. Representative thermal demagnetization plots of Silurian rocks from locality AY, in stratigraphic coordinates.. ........................................... 61
3-4. Stereoplots of site-mean directions of the high-temperature components (HTC) with associated confidence circles (thin lines) of Silurian volcanic rocks from locality AY, (a) in situ (IS) and (b) after tilt correction (TC).. ............................................................................ 62
3-5. Thermal demagnetization diagrams from the Lower-Middle Devonian volcanics from locality KN&DG in geographic coordinates. ............................................................................................... 65
3-6. Stereoplots showing site-mean directions of the A and B components isolated from Lower to lower-Middle Devonian rocks at locality KN&DG.. .................................................................................... 66
3-7. Representative thermal demagnetization plots and stereonets of vector end-points and isolated components in Givetian volcanics from locality KU in stratigraphic coordinates (a-d)...................................... 71
3-8. Site-mean directions of locality KU magnetizations..................................... 72
3-9. Stereonet of locality-mean overprint directions with confidence circles (thin lines): squares, locality-means in situ; oblique cross, the result for locality KN&DG after 35% unfolding...................................... 79
3-10. Schematic outline of the Devonian volcanic belt (gray; simplified from Figure 3-2) with Silurian and Devonian paleomagnetic declinations (arrows).. ................................................................................ 84
3-11. Plots of paleolatitude versus age for reference and observed data.. .......................................................................................................... 88
3-12. Reconstruction of the Ural-Mongol belt and the major cratons of Baltica and Siberia (cross-hatched) for mid-Silurian time........................... 91
4-1. Location of the study area.. ....................................................................... 102
4-2. (a) Geologic sketch of the Tokrau-A sampling locality. (b-j) orthogonal demagnetization diagrams (Zijderveld, 1967) in tilt-corrected coordinates for representative samples of the Tokrau-A collection.. ................................................................................................ 109
4-3. (a) Geologic sketch of the Tokrau-B sampling locality. (b-i) orthogonal demagnetization diagrams in tilt-corrected coordinates for representative samples of the Tokrau-B collection. Conventions as in Figure 4-2. (j) examples of angular separation between site-mean magnetizations defined by “hematite” (labeled HTC) and “magnetite” (ITC) unblocking temperature ranges.................................................................................. 112
4-4. Equal-area stereoplots of site-mean magnetization directions of the Tokrau locality.. .................................................................................. 115
ix
4-5. (a) Geologic sketch of the Ayaguz-A sampling locality. (b-e) orthogonal demagnetization diagrams in tilt-corrected coordinates for representative samples of the Ayaguz-A collection. (f-i) Examples of demagnetization diagrams (in situ) of conglomerate clasts.. ............................................................................... 118
4-6. (a) Geologic sketch of the Ayaguz-B sampling locality, (b-g) orthogonal demagnetization diagrams (Zijderveld, 1967) in in situ coordinates for representative samples of the Ayaguz-B collection.. ................................................................................................ 121
4-7. Equal-area stereoplots of site-means magnetization directions of the Ayaguz locality.. ................................................................................. 123
4-8. Age-correlation diagram for the Tokrau magnetizations.. .......................... 1274-9. Baltica reference directions (black squares, plotted in 10 m.y.
intervals, confidence limits are omitted for clarity) and directions of magnetization of the studied rocks....................................................... 129
4-10. Tectonic scenario for the bending of the Kazakhstan orocline.. .............. 136
5-1. Location map of Himalayan foreland and Bengal Fan showing ODP leg 116 drill sites.............................................................................. 148
5-2. Summary of sites 717,718,719 (leg 116), showing lithostratigraphic units and correlations. ................................................... 155
5-3. Basic principles of the IRM acquisition curves analysis, from Kruiver et al. (2001).................................................................................. 158
5-4. Low-temperature behavior of pedogenic iron oxides................................. 159
5-5. Examples of IRM acquisition plotted as GAP (gradient acquisition plot) and SAP (standardized acquisition plot).. ........................................ 162
5-6. Thermomagnetic runs for representative samples.. .................................. 163
5-7. The stepwise thermomagnetic runs on the sample 7-54-7-0..................... 1655-8. TEM micrographs of small grains from magnetic extract of sample
7-68-2-88, which shows a prominent “biogenic magnetite” peak.. ........... 168
5-9. Low temperature cycling runs (Carter-Stiglitz et al., 2006) for representative samples.. .......................................................................... 170
5-10. The difference in definition of the “high coercivity fraction” employed in the IRM analysis and in the low temperature cycling. .......... 172
5-11. Values of the goethite to hematite ratio identified by two methods based on different physical principles.. .................................................... 173
5-12. The variation in relative abundance of goethite vs. hematite and presence of the biogenic component in the studied sections of Holes 717 and 718. . ............................................................................... 177
x
5-13. Variations in biogenic and detrital magnetite, hematite and goethite components obtained in present study as well as the total organic carbon (TOC) and documented presence of pyrite (purple stars) in the sediments of the studied interval of Hole 717 (Shipboard scientific party, 1989. ODP Leg 116 initial report)..................................................................................................... 184
A1. Examples of Ar release spectra and element ratios for several samples from the paleomagnetic site A493............................................ 212
A2. Micrographs of plagioclase grains............................................................. 213
xi
List of Tables Table 2-1. Site-mean and formation-mean directions of the components
isolated from the Kurgasholak Formation................................................... 26
2-2. Summary of published Siluro-Devonian paleomagnetic data from the Devonian volcanic belt of the Kazakhstan orocline. ............................. 38
2-3. Analysis of reliability criteria for the results of Grishin et al. (1997) ............. 39
3-1. Site-mean paleomagnetic directions for the Silurian rocks from locality AY .................................................................................................. 63
3-2. Component A data from Lower-Middle Devonian rocks from localities KN and DG.................................................................................. 68
3-3. Component B data from Lower-Middle Devonian rocks from localities KN and DG.................................................................................. 73
3-4. Paleomagnetic data from Givetian (Middle Devonian) volcanics (locality KU)................................................................................................ 74
3-5. Summary of primary paleomagnetic results from northeastern Kazakhstan ................................................................................................ 76
3-6. Summary of overprint directions from northeastern Kazakhstan ................. 80
3-7. Paleozoic paleomagnetic poles of Siberia ................................................... 87
4-1. High temperature component, Tokrau-A ................................................... 110
4-2. Intermediate temperature component, Tokrau .......................................... 113
4-3. High temperature, Tokrau-B...................................................................... 114
4-4. High temperature component, Ayaguz-A .................................................. 119
4-5. High temperature component, Ayaguz-B .................................................. 122
4-6. Summary of paleomagnetic results ........................................................... 130
4-7. Rotation angles deduced for the Devonian results from the three limbs of the Kazakhstan Orocline............................................................. 134
A1. 40Ar/39Ar analytical data.............................................................................. 206
xii
List of Appendices
Appendix
A. Ar-Ar dating of the Tokrau-A rocks .........................................203 Ar-Ar analytical method ............................................................203 Results of Ar-Ar dating .............................................................204 References ...............................................................................214
B. Overview of previous studies on stability of iron (oxyhydr)oxides towards reductive dissolution .........................215
References ...............................................................................216
1
Chapter 1
Introduction
Natural magnetic minerals, iron (oxyhydr)oxides and iron sulfides, can provide a
wealth of information on the formation, subsequent deformation and alteration of a rock.
Although all minerals exhibit some form of magnetic behavior, the magnetic properties
of rocks are mostly defined by their ferromagnetic content; the general term
ferromagnetism, as used here, includes antiferromagnetism and ferrimagnetism,
following Batler (1993). When a rock forms, the magnetic moments of ferromagnetic
grains align themselves with the ambient magnetic field, thus recording the intensity and
orientation of the Earth's magnetic field. Information on the past configuration of the
field can be quantified as paleo–location of the rock unit, as well as any post-formational
rotation or tilting. This ability to quantify displacements has made paleomagnetism, the
study of remanent magnetization in ancient rocks, an important tool in tectonic studies.
Since the mid-1950’s, paleomagnetism has been used to identify the paleogeographic
positions of major continental and oceanic lithospheric plates, to document motion
histories of displaced terranes and to trace rotation and tilting of individual thrust-sheets
in orogenic belts. These studies continue to provide insights into the processes by which
continents grow and break-up, mountain belts form and change their shapes, etc.
During the past twenty years, a different approach has emerged concerning the
interpretation of the magnetic record preserved in rocks. The various fractions of
ferromagnetic grains that contribute to the total magnetization of a sedimentary rock may
have different histories. The grains that were formed elsewhere were then eroded,
transported by wind or water and then deposited in a new setting. In this new
environment, the initial detrital assemblage can be modified by post-depositional
processes, such as reductive dissolution of primary magnetic minerals and authigenic
precipitation of new ferromagnetic phases. Both processes, dissolution and precipitation,
2
can be either abiotic or biologically controlled. Erosion, transport, deposition and
diagenetic modification of the ferromagnetic grains are influenced by a complex interplay
of atmospheric, hydrologic and lithoslogic factors. The climatic/physical conditions
prevailing during the formation of a sedimentary rock can be deduced from the resulting
ferromagnetic assemblage of the rock. The detailed information on mineralogy and grain-
size distribution of a ferromagnetic fraction of sedimentary rocks has been used in
environmental magnetism studies to deduce provenance of the sediments, mode of
transport (aeolian, fluvial, or glaciogenic), climatic conditions in weathering
environments, among others.
These two applications of paleomagnetism (tectonic and environmental) are used
in the studies that constitute this thesis. Chapters 2, 3 and 4 of the thesis describe a
tectonic study of Kazakhstan. The main objective of the study was to resolve the
sequence of deformation that resulted in the creation of a strongly curved structure
(Fig.1-1a). The second part of the thesis, Chapter 5, discusses the use of a rock magnetic
parameter (the ratio of two magnetic minerals, goethite and hematite) in the sediments of
the Bengal Fan to detect the changes in precipitation associated with the postulated
change in the Indian monsoon system at ~ 7-8 Ma.
Kazakhstan orocline and amalgamation of Eurasia Oroclines, or map-view bends of the tectonic elements, are common features of
continental crust (Van der Voo, 2004). Curvature of initially straighter linear elements
can develop in response to a variety of boundary conditions, ranging from local variations
in configuration of the colliding terranes to regional changes in the stress-field (Weil and
Sussman 2004). A particular mechanism, and accordingly, the boundary conditions
responsible for the bending can be deduced from the kinematics of the curvature
formation.
The Kazakhstan orocline - a pair of concentric horseshoe-shaped volcanic belts in
Central Kazakhstan (Fig.1-1a), formed during the amalgamation of Eurasia. The ultimate
cause of bending is thought to be the convergence of the large cratonic blocks of Baltica,
3
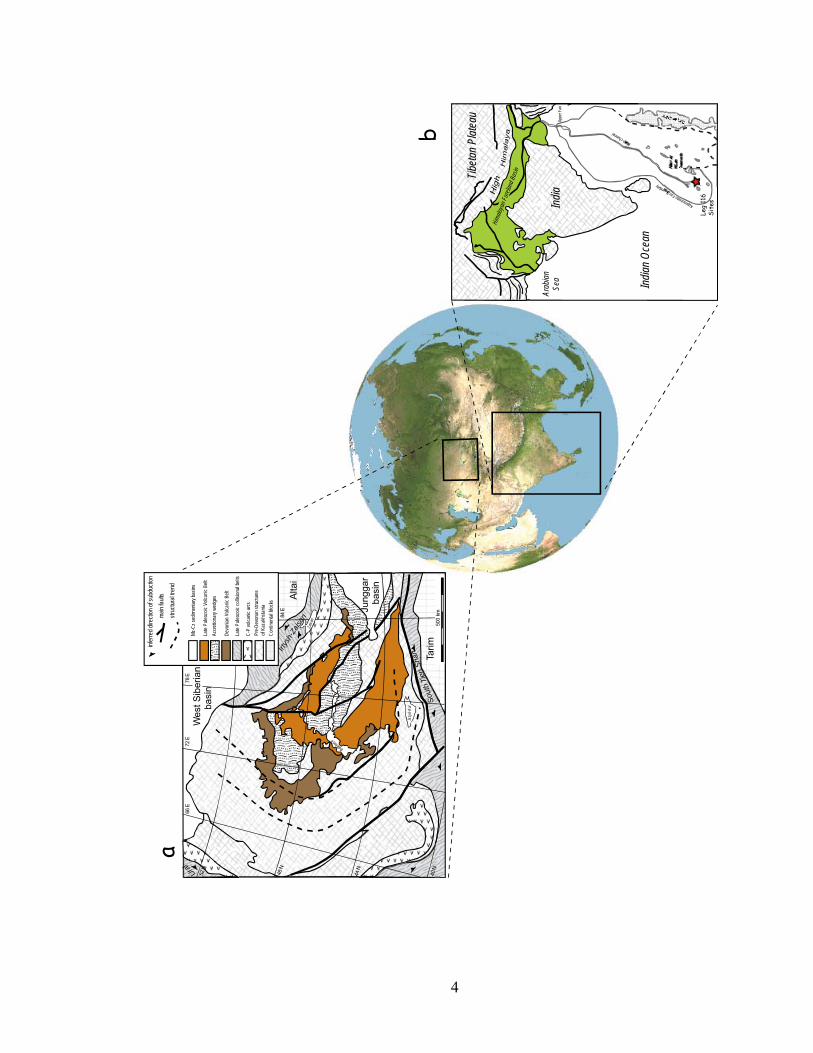
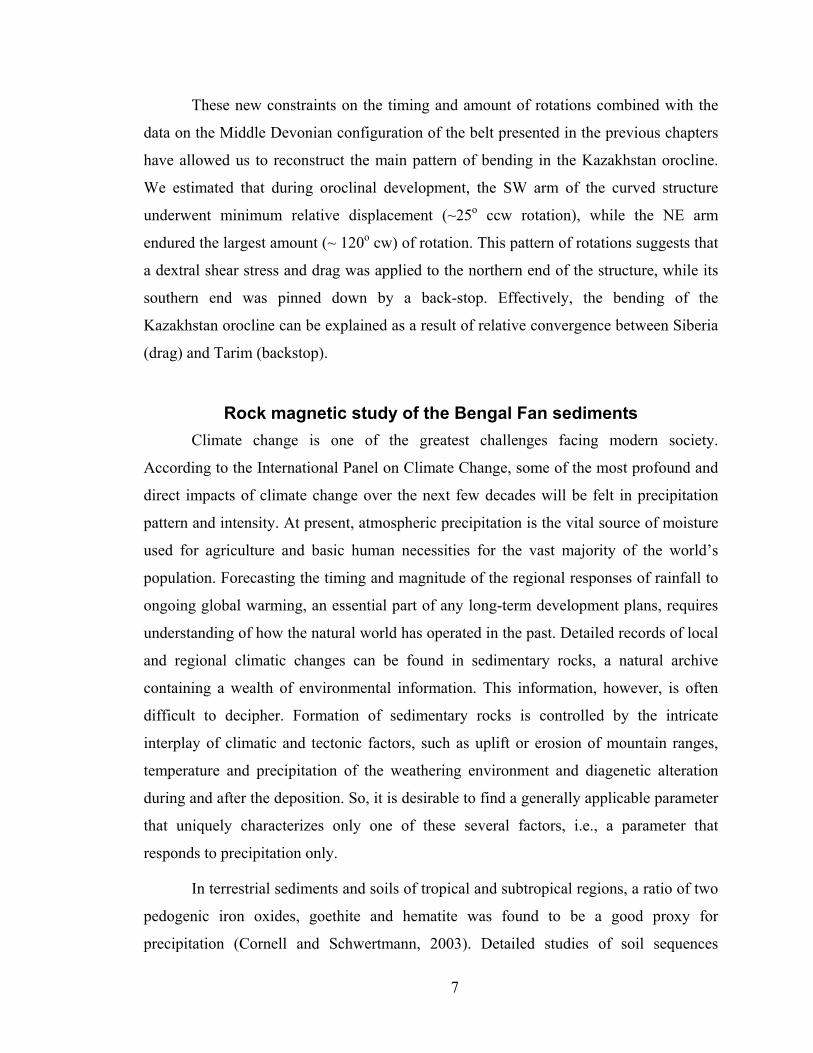
Figure 1-1. Location areas of two paleomagnetic studies described in this thesis. a) Central Kazakhstan. A couple of subduction-related volcanic belts in Central Kazakhstan has an unusual, i.e. strongly curved, shape. A paleomagnetic study described in Chapters 2, 3 and 4 of this thesis was focused on understanding processes that led to the formation of the curvature. b) The Bengal Fan. Sediments of the Bengal Fan contain iron-bearing minerals that formed in weathering environments of the Himalayan Foreland Basin. As processes of chemical weathering are climate-dependent, the resulting assemblage of iron-bearing minerals in sedimentary rocks is often interpreted as reflecting climatic conditions prevailing during the formation of the sediments. When the mineral grains are transported from terrestrial into marine conditions, an initial assemblage of the grains might be modified by diagenetic dissolution and neo-mineralization. A rock magnetic study of a sedimentary sequence recovered by the ODP Leg 116 at the distal part of the Bengal Fan (described in Chapter 5 of this thesis) investigated the applicability of a terrestrial climatic proxy (i.e., relative abundances of goethite and hematite) to studies of marine sediments.
4
40 N
44 N
48 N
52 N
66 E
72 E
78 E
84 E
500
kmTa
rim
Alta
i
Wes
t Sib
eria
n
ba
sin
Jung
gar
ba
sin
Issy
k-Ku
l
Zaisa
n
Balkhas
h
Irtys
h-Za
isan
Ural
Sout
hTi
en S
han
Mz-C
z sed
imen
tary
basin
s
Late
Pale
ozoic
Volca
nic B
eltAc
cretio
nary
wedg
es
Devo
nian
Volca
nic B
elt
Late
Pale
ozoic
collis
ional
belts
C-P
volca
nic ar
csPr
e-De
vona
n str
uctu
resof
Kaza
khsta
niaCo
ntine
ntal
block
s
infer
red d
irecti
on of
subd
uctio
nma
in fau
ltsstr
uctur
al tre
nd
India
main channel
Indian
Oce
an
Arab
ian S
eaUp
per F
an
Approximate Fan Boundary
Afan
asiy
Nikit
inSe
amon
ts
Ninetyeast Ridge
Leg
116
Sit
es
Tibeta
n Pl
atea
u
Hima
layan
Fore
land B
asin
a
b
5
Siberia and Tarim (e.g. Zonenshain et al., 1990; Şengör et al., 1993; Van der Voo, 2004).
Hence, both the pattern and timing of oroclinal rotations in Kazakhstan contain clues
toward understanding the relative movements of these cratons prior to their final
amalgamation.
The volcanic belts of the Kazakhstan orocline represent the remains of a
subduction-related, Andean-type volcanic arc (Zonenshain et al., 1990; Bakhtiev, 1987,
Kurchavov, 1994; Skrinnik and Horst, 1995). The area internal to the volcanic structures
is dominated by rocks indicative of deeper marine environments, whereas the regions
surrounding it were either non-depositional highlands or epicontinental shallow marine
and non-marine basins (Zonenshain et al., 1990). Taken at face value, such a distribution
implies that subduction was directed outwards from the inner part of the curved structure.
In plate tectonic terms, this configuration of a plate boundary is considered unstable. The
alternative explanation for the curved shape of the volcanic belts, that is of the oroclinal
bending of an originally straighter arc, has been suggested by several authors (e.g.,
Zonenshain et al., 1990; Sengor and Natal’in, 1996; Grishin et al., 1997; Levashova et al.,
2003; Van der Voo, 2004). Yet, while united in the recognition of the oroclinal nature of
the curvature, the models cited above differ significantly in their estimates for the timing
of the orogeny, the initial configuration of the arc and the magnitude of the relative
rotation between the arms of the curved structure.
The discrepancies between the proposed oroclinal scenarios have two main
reasons; a dearth of data and a multiphase deformational history of the area. Primary
paleomagnetic results of suitable age (which can provide a quantitative measure of the
oroclinal rotations) remain sparse in the geographical area of interest. Even when some
results are available, their unambiguous interpretation is hampered by the multiple
episodes of rotations. The repeated episodes of strike strip motions along the abundant
east-west and northwest-southeast fault systems are well documented in the region (Allen
et al., 2001; Natal’in and Şengör, 2005; Van der Voo et al., 2006). Such strike-slip
faulting is frequently associated with vertical-axis rotations which cause a deviation in
paleomagnetic declinations. A complex pattern of both counterclockwise and clockwise
rotations (associated with sinistral east-west strike-slip faults, and dextral northwest-
6
southeast strike-slip faults, respectively) occurred in the region during the latest
Paleozoic, after the main phase of oroclinal bending (Van der Voo et al., 2006). In
making tectonic reconstructions for earlier times, a correction must be made for these late
orogenic rotations.
Chapter 2 of this thesis presents new results of a paleomagnetic study of the
middle Devonian formation from the southern arm of the orocline and describes the use
of a Late Permian overprint to correct the primary mid-Devonian declination for the late-
orogenic rotations. Declinations from other published Silurian and Devonian
paleomagnetic results in the subduction-related Devonian volcanic arc of Kazakhstan
have been similarly corrected for such rotations wherever the overprint directions are
reasonably well documented. Using the corrected declinations as passive markers has
allowed us to restore the trend of the volcanic belt to its Devonian configuration. Our
analysis indicates that in the middle Devonian, the volcanic arc was nearly straight and
northwest-southeast trending. This chapter has been published (as Abrajevitch et al.,
2007).
Chapter 3 of this thesis presents new paleomagnetic results from three volcanic
formations of mid-Silurian, Lower-to- Middle Devonian and Middle Devonian age from
the Chingiz Range (the NE arm of the orocline). These new results improve the data-
coverage in this part of the structure and allow us to substantiate the paleogeographic
reconstructions proposed in the previous chapter. Our results also demonstrated the
similarities between the northward motion of the Chingiz unit and that of Siberia,
suggesting that these tectonic units were in close proximity to each other. This study has
been submitted and is now in revision after review (as Levashova et al., 2008).
Chapter 4 describes a paleomagnetic study of Late Carboniferous to Late Permian
subduction-related volcanics from the middle (NW) and north-eastern (NE) limbs of the
orocline. Results of this study indicate that the rotation of the middle arm of the orocline
was essentially complete by the earliest Permian, while the NE arm probably was still ~
30º short of its final orientation with respect to Baltica. The rotation of, or rotation within,
the NE arm was completed by the Late Permian. This study has been accepted for
publication (as Abrajevitch et al., 2008).
7
These new constraints on the timing and amount of rotations combined with the
data on the Middle Devonian configuration of the belt presented in the previous chapters
have allowed us to reconstruct the main pattern of bending in the Kazakhstan orocline.
We estimated that during oroclinal development, the SW arm of the curved structure
underwent minimum relative displacement (~25o ccw rotation), while the NE arm
endured the largest amount (~ 120o cw) of rotation. This pattern of rotations suggests that
a dextral shear stress and drag was applied to the northern end of the structure, while its
southern end was pinned down by a back-stop. Effectively, the bending of the
Kazakhstan orocline can be explained as a result of relative convergence between Siberia
(drag) and Tarim (backstop).
Rock magnetic study of the Bengal Fan sediments Climate change is one of the greatest challenges facing modern society.
According to the International Panel on Climate Change, some of the most profound and
direct impacts of climate change over the next few decades will be felt in precipitation
pattern and intensity. At present, atmospheric precipitation is the vital source of moisture
used for agriculture and basic human necessities for the vast majority of the world’s
population. Forecasting the timing and magnitude of the regional responses of rainfall to
ongoing global warming, an essential part of any long-term development plans, requires
understanding of how the natural world has operated in the past. Detailed records of local
and regional climatic changes can be found in sedimentary rocks, a natural archive
containing a wealth of environmental information. This information, however, is often
difficult to decipher. Formation of sedimentary rocks is controlled by the intricate
interplay of climatic and tectonic factors, such as uplift or erosion of mountain ranges,
temperature and precipitation of the weathering environment and diagenetic alteration
during and after the deposition. So, it is desirable to find a generally applicable parameter
that uniquely characterizes only one of these several factors, i.e., a parameter that
responds to precipitation only.
In terrestrial sediments and soils of tropical and subtropical regions, a ratio of two
pedogenic iron oxides, goethite and hematite was found to be a good proxy for
precipitation (Cornell and Schwertmann, 2003). Detailed studies of soil sequences
8
showed that this ratio is very sensitive to moisture availability (e.g., Curi and Franzmeier,
1984; da Motta and Kampf, 1992) and does not depend on the parental rock composition
(Kampf and Schwertmann, 1984). A relative abundance of goethite (high G/(G+H)) can
be used as an indicator of higher precipitation, whereas low values imply dryer/warmer
conditions. Similar climatic interpretation of the relative abundances of goethite and
hematite has been increasingly applied to marine sediments (e.g. Harris and Mix, 1999;
2002; Clift, 2006; Zhang at al., 2007), i.e., the variations in the G/(G+H) parameter are
thought to reflect the precipitation regime in the source area of the sediments. The
validity of this approach, however, is contingent on the assumption, yet to be confirmed,
that post-depositional diagenetic changes in marine environment do not modify the initial
detrital ratio of these minerals.
Marine sediments of the Bengal Fan (Fig. 1-1b) provide an opportunity to test the
utility of the G/(G+H) ratio in climatic studies. Various geological proxies indicate that a
significant climatic change occurred in the source area of the fan (the Himalayan
foreland) at ~ 7-8 Ma, yet the nature and cause of this change remain unclear. The
proposed scenarios range from increased aridity (Gupta et al., 2004; Stern et al. 1997;
Derry and France-Lanord, 1996) to intensification of the monsoon (e.g., Prell et al., 1992;
Quade et al., 1989; Ding et al., 2001). Both options imply a significant change, albeit of
opposite sense, in the average amount of precipitation in the Himalayan foreland.
Consequently, the relative abundances of goethite and hematite in sediments derived
from the foreland are expected to show a systematic change; the G/(G+H) parameter
should increase with the intensification of the monsoon and decrease with aridification.
In an attempt to identify the nature of the climatic change in the Himalayan region
and to better understand the applicability of the G/(G+H) parameter as a precipitation
proxy to the studies of marine sediments, we have conducted a rock-magnetic study of
Bengal Fan sediments. Results of the study are presented in Chapter 5 of this thesis.
References Abrajevitch, A.V., Van der Voo, R., Levashova, N.M., Bazhenov, M.L. 2007.
Paleomagnetism of the mid-Devonian Kurgasholak Formation, Southern
9
Kazakhstan: Constraints on the Devonian paleogeography and oroclinal bending of the Kazakhstan volcanic arc. Tectonophysics, v. 441, 67–84.
Abrajevitch, A., Van der Voo, R., Bazhenov, M. L., Levashova, N. M., McCausland, P. J. A. 2008. The role of the Kazakhstan orocline in the late Paleozoic amalgamation of Eurasia, Tectonophysics, in review.
Allen, M.B., Alsop, G.I., Zhemchuzhnikov, V.G. 2001. Dome and basin refolding and transpressive inversion along the Karatau fault system, southern Kazakhstan. Journal of Geological Society of London, 158, 83-95.
Bakhtiev, M.K. 1987. Paleozoic orogenic magmatic belts. Nauka, Moscow 168 p. (In Russian)
Clift, P.D. 2006. Controls on the erosion of Cenozoic Asia and the flux of clastic sediment to the ocean. Earth and Planetary Science Letters, 241, 571-580.
Cornell, R. M., Schwertmann, U. 2003. The iron oxides: structure, properties, reactions, occurrences, and uses. Weinheim Wiley-VCH, 664 pp.
Curi, N., Franzmeier, D.P. 1984. Toposequence of Oxisols from the Central Plateau of Brazil, Soil Scientists Society America Journal, 48(2), 341–346.
da Motta, P.E.F., Kampf, N. 1992. Iron oxide properties as support to soil morphological features for prediction of moisture regimes in oxisols of central Brazil. Pflanzenernahrung und Bodenkunde 155, 385-90.
Derry, L.A., France-Lanord, C. 1996. Neogene Himalayan weathering history and river (super 87) Sr/ (super 86) Sr; impact on the marine Sr record. Earth and Planetary Science Letters, 142(1-2), 59-74.
Ding, Z.L., Yang, S.L., Sun, J.M., Liu, T.S. 2001. Iron geochemistry of loess and red clay deposits in the Chinese Loess Plateau and implications for long-term Asian monsoon evolution in the last 7.0 Ma. Earth and Planetary Science Letters, 185(1-2), 99-109.
Grishin, D.V., Pechersky, D.M., Degtyarev, K.E. 1997. Paleomagnetism and reconstruction of Middle Paleozoic structure of Central Kazakhstan. Geotectonics, 1, 71– 81.
Gupta, A.K., Singh, R.K., Joseph, S., Thomas, E. 2004. Indian Ocean high-productivity event (10-8 Ma); linked to global cooling or to the initiation of the Indian monsoons? Geology, 32(9), 753-756.
Harris, S.E., Mix, A.C. 1999. Pleistocene precipitation balance in the Amazon Basin recorded in deep sea sediments. Quaternary Research, 51, 14-26.
Harris, S.E., Mix, A.C. 2002. Climate and tectonic influences on continental erosion of tropical South America, 0-13 Ma. Geology, 30(5), 447-450.
Kampf, N., Schwertmann, U. 1984. Goethite and hematite in a climosequence in southern Brazil and their application in classification of kaolinitic soils. Geoderma, 29, 27-39.
10
Kurchavov, A.M. 1994. The lateral variability and evolution of orogenic volcanism in the fold belts. Geotectonics, 28, 3-18.
Levashova, N.M., Degtyarev, K.E., M.L. Bazhenov, M.L., Collins, A.Q., Van der Voo, R. 2003. Permian Paleomagnetism of East Kazakhstan and the Amalgamation of Eurasia: Geophysical Journal International, v. 152, p. 677-687.
Levashova, N.M., Van der Voo, R., Abrajevitch, A.V., and Bazhenov, M.L. 2008. Paleomagnetism of mid-Paleozoic subduction-related volcanics from the Chingiz Range in NE Kazakhstan: The evolving paleogeography of an amalgamating Eurasian continent. Geological Society of America Bulletin, in revision.
Natal’in, B. A., Şengör, A. M. C. 2005. Late Palaeozoic to Triassic evolution of the Turan and Scythian platforms: the pre-history of the palaeo-Tethyan closure, Tectonophysics, 404, 175-202.
Prell, W.L., Murray, D.W., Clemens, S.C., Anderson, D.M. 1992. Evolution and variability of the Indian Ocean summer monsoon: Evidence from the western Arabian Sea drilling program, In Duncan, R.A., Rea, D.K., Kidd, R.B., von Rad, U., and Weissel, J.K. (eds.), Synthesis of Results from Scientific Drilling in the Indian Ocean, American Geophysical Union Geophysical Monograph 70, Washington, D.C., 447-469.
Quade, J., Cerling, T.E., Bowman, J.R. 1989. Development of Asian monsoon revealed by marked ecological shift during the latest Miocene in northern Pakistan. Nature, 342(6246), 163-166.
Şengör, A M C; Natal'in, B. A., Burtman, V. S. 1993. Evolution of the Altaid tectonic collage and Palaeozoic crustal growth in Eurasia. Nature (London), vol.364, pp.299-307.
Şengör, A.M.C., Natal’in, B.A. 1996. Paleotectonics of Asia: fragments of a synthesis. In: Yin, A., Harrison, M. (Eds.), The Tectonic Evolution of Asia. Cambridge Univ. Press, Cambridge, pp. 486– 640.
Skrinnik, L.I., Horst, V.E. 1995. Devonian island arc volcanic complexes in the Junggar Alatau. Geology and exploration of Kazakhstan, 4, 6-10.
Stern, L.A., Chamberlain, C.P., Reynolds, R.C., Johnson, G.D. 1997. Oxygen isotope evidence of climate change from pedogenic clay minerals in the Himalayan molasse. Geochimica et Cosmochimica Acta, 61(4), 731-744.
Van der Voo, R. 2004. Paleomagnetism, oroclines and the growth of the continental crust. GSA Today, 14 (12), 4-9.
Van der Voo, R., Levashova, N. M., Skrinnik, L. I., Kara, T. V., Bazhenov, M. L. 2006. Late orogenic, large-scale rotations in the Tien Shan and adjacent mobile belts in Kyrgyzstan and Kazakhstan, Tectonophysics, 426, 335-360.
Weil, A.B., Sussman, A.J. (eds.) 2004. Orogenic curvature: Integrating paleomagnetic and structural analyses. Geological Society of America Special Paper, 383, p. 271.
Zhang., Y.G., Ji, J., Balsam, W., Liu, L., Chen, J. 2007. High resolution hematite and goethite records from ODP 1143, South China Sea: Co-evolution of monsoonal
11
precipitation and El-Nino over the past 600,000 years. Earth and Planetary Science Letters, 264, 136-150.
Zonenshain, L.P., Kuzmin, M.I., Natapov, L.M. 1990. Geology of the USSR: a plate tectonic synthesis. Ed. Page, B.M. AGU, Geodynamic series, volume 21. Washington, D.C., 250p.
12
Chapter 2
Paleomagnetic constraints on the paleogeography and oroclinal bending of the Devonian volcanic arc in Kazakhstan
Abstract A prominent feature of the central part of the Ural-Mongol orogenic belt is a
series of concentric horse-shoe shaped volcanic arcs, with the youngest arc on the inside.
This structure was long-suspected to be an orocline, but unequivocal evidence for this
was lacking, mainly because paleomagnetic results of suitable age from this area
remained sparse, but also because their interpretation was not straightforward due to a
long history of deformations associated with the protracted late Paleozoic assembly of
Asia.
Our paleomagnetic study of Middle Devonian basaltic and andesitic flows in
southeastern Kazakhstan revealed two main components of magnetization. The primary
nature of a high temperature magnetization (tilt corrected Dec=286.5, Inc=46.4, α95=7.8,
k=29.2, N=13 sites) is supported by the presence of antipodal directions and a baked-
contact test. We also isolated a post-folding overprint with an in situ mean direction
Dec=134.9, Inc=-43.0 (α95=4.9, k=71.6, N=13 sites). The age of this overprint can be
estimated as Early Permian with a high degree of confidence. The declination of the
overprint is seen to be deflected counter-clockwise by 100±6o relative to the 290-Ma
reference direction, indicating that the studied locality, similar to many other localities in
the region, was affected by late-orogenic rotations. We use the overprint’s deflection to
correct the declination of the primary Devonian magnetization for these late-orogenic
block-rotations.
Declinations from other Silurian and Devonian paleomagnetic results in the
subduction-related Devonian volcanic arc of Kazakhstan have been corrected for such
13
rotations wherever the latter are reasonably well documented. Using corrected
declinations as passive markers we restored the trend of the volcanic belt to its Devonian
configuration. Our analysis indicates that the presently curved belt was nearly straight
and NW-SE trending. This ~1500 km long volcanic belt characterized the northeastern
margin of a landmass in today’s central Kazakhstan where subduction occurred towards
the southwest. Oroclinal bending of this arc took place in the interval between the Middle
Devonian and the Late Permian.
14
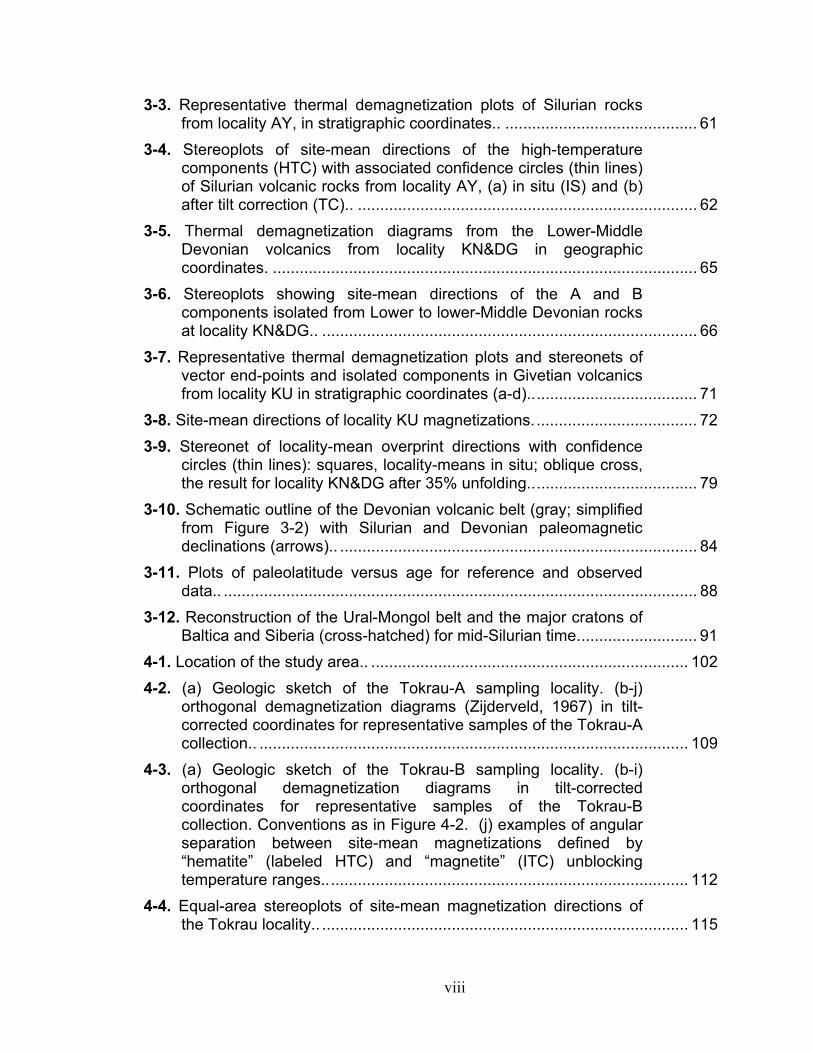
Introduction It is now widely recognized that Central Asia is a composite realm assembled
during the Phanerozoic by accretion of various continental blocks, island arc fragments,
and accretionary complexes (Fig. 2-1). The assembly mechanism is still disputed for the
early Paleozoic, however. Regardless whether authors favored collision of
microcontinents that were originally separated by oceanic basins and multiple island arcs
(Mossakovsky, et al., 1993; Didenko et al., 1994; Dobretsov et al., 1995; Filippova et al.,
2001; Windley et al., 2007), or forearc accretion and oroclinal bending of a single, long-
lived subduction system (Şengör and Natal’in, 1996), most scientists agree that by the
middle Paleozoic several relatively small terranes had amalgamated into a single tectonic
unit (often referred to as “Kazakhstania”, but the definition of this concept may differ
from author to author). Possibly from Early Silurian onwards (Degtyarev and
Ryazantsev, 1993) and certainly from Late Silurian to Early Permian time, volcanic arc
structures marked one of the margins of the amalgamated block (Zonenshain et al., 1990;
Bakhtiev, 1987, Kurchavov, 1994; Skrinnik and Horst, 1995). In their present-day
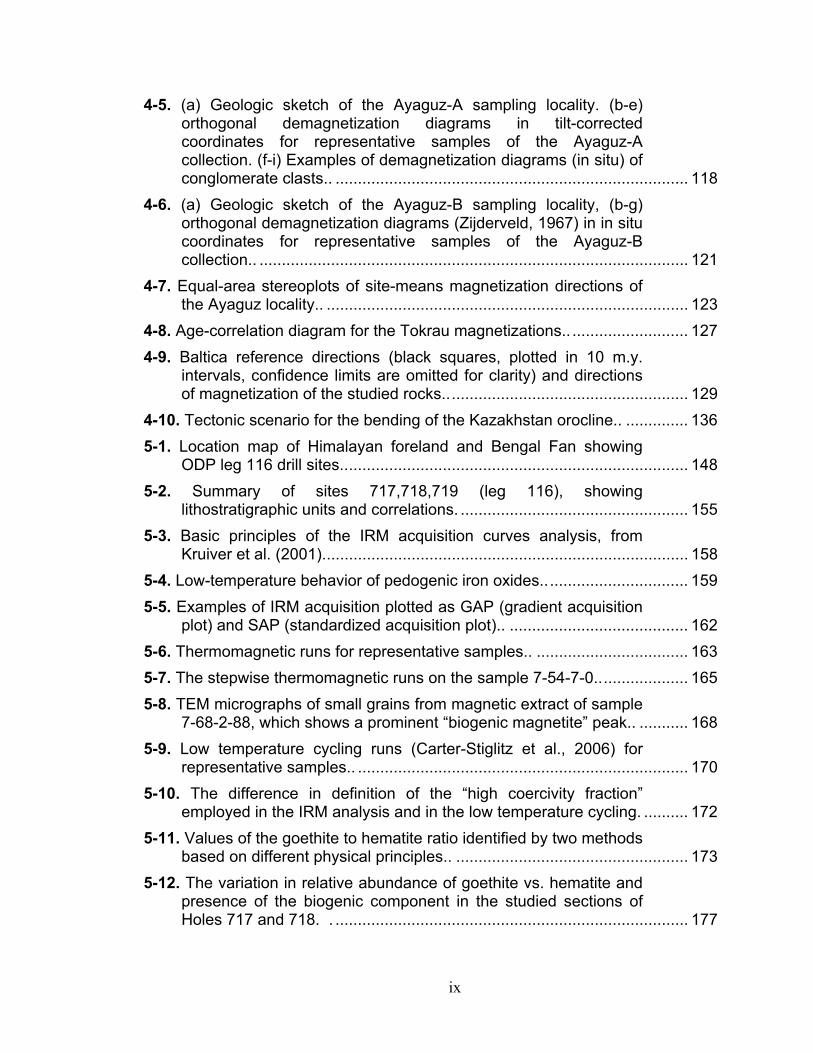
configuration, the Devonian and late Paleozoic volcanic belts are horse-shoe shaped (Fig.
2-2). The area internal to the strongly curved volcanic structures is dominated by rocks
indicative of deeper marine environments, whereas the regions surrounding it were either
non-depositional highlands or epicontinental shallow marine and non-marine basins
(Zonenshain et al., 1990). Taken at face value, such a distribution implies that subduction
was directed outwards from the inner part of the curved structure. This scenario,
however, is difficult to reconcile with plate tectonic theory; oroclinal bending of an
originally straighter arc was therefore suggested as a possible explanation for the shape of
the volcanic belts (Zonenshain et al., 1990; Şengör and Natal’in, 1996; Grishin et al.,
1997; Levashova et al., 2003; Van der Voo, 2004).
Currently several paleomagnetic efforts are underway to improve our
understanding of the tectonic history of Central Asia, and especially that of the
“Kazakhstan orocline” (e.g., Bazhenov et al., 2003; Collins et al., 2003; Levashova et al.,
2003; Alexyutin et al., 2005; Van der Voo et al., 2006; Levashova et al., 2007). The
15
T a r i m
Helmand
Farah
Turan
ScythiaMakran Himalayas
Lhasa
Qiangtang
Kunlun-Songpan-Ganzi Zone
E a s tE u r o p e a nC r a t o n
A n g a r aC r a t o n
India
Arabia
70 E 80 E 90 E 100 Eo ooo
45 No
30 No
70 E 80 E 90 E 100 Eo ooo
45 No
30 No
Precambrian continental crust
Phanerozoic accretion complex
Trapped oceanic crust
Suture
Thrust system
Strike-slip fault
Subduction zone 500 km
Tien Shan
E. KazakhstanFig.2- 2
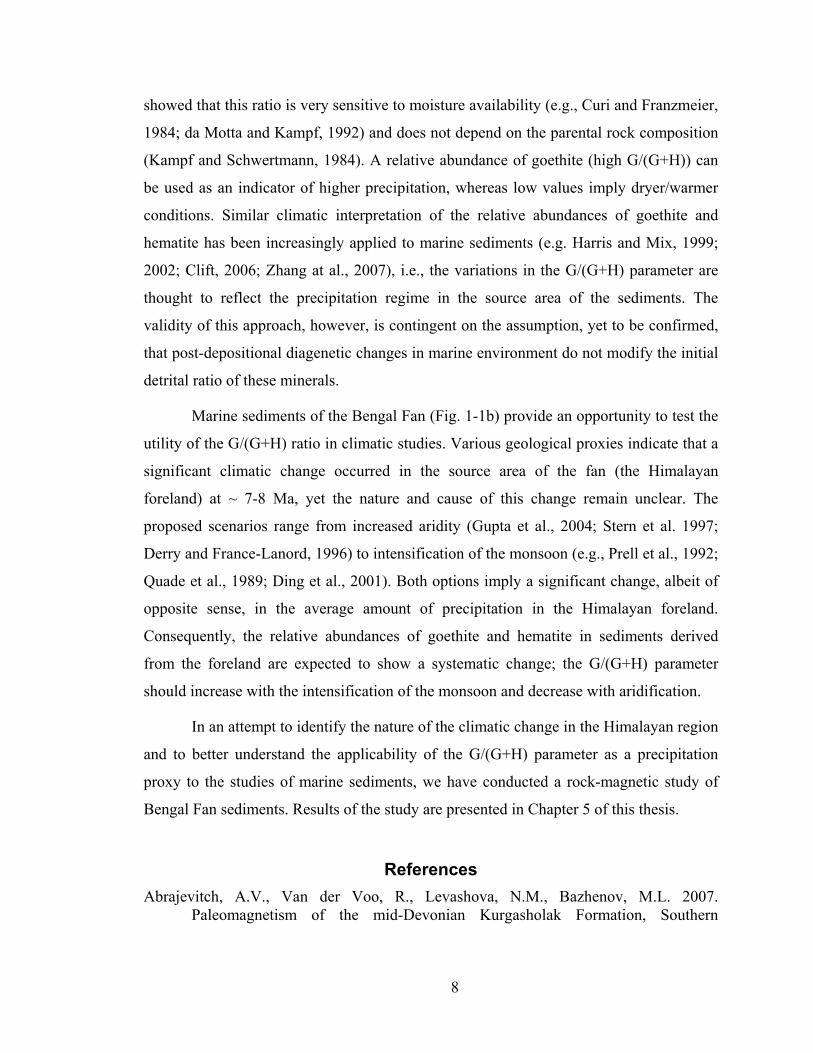
Figure 2-1. Schematic map of central Asia, showing the location of the East Kazakhstan study area, wedged in between the Tarim, Baltica and Siberia cratons. Modified after Allen et al., 2001.
16
declinations of primary magnetization in Ordovician rocks from the Chingiz Range (the
northeastern limb of the orocline) and the North Tien Shan (south- to southwestern limb)
were found to differ by about 180˚, which was interpreted by Levashova et al. (2003) as
evidence for oroclinal bending. The Permian results from the same two areas (Van der
Voo et al., 2006) show declination differences on the order of 90˚. The post-Permian
rotations, on the other hand, were attributed to small-scale block rotations within a larger-
scale sinistral wrenching zone of deformations in and around the North Tien Shan area.
Thus, only about 50% of the total post-Ordovician rotation was attributed to the putative
oroclinal bending that presumably happened some time between Ordovican and Late
Permian.
To further constrain the timing and mode of the oroclinal bending, we studied
Middle Devonian volcanics from the southwestern limb of the Kazakhstan orocline. The
declination obtained in the present study will be compared with those for rocks of similar
age as well as with the declination pattern of Silurian results from the entire curved
volcanic arc structure (Grishin et al., 1997; Levashova et al., 2003; Alexyutin et al.,
2005). Declination deviations will be taken as an indication of relative rotations of the
limbs.
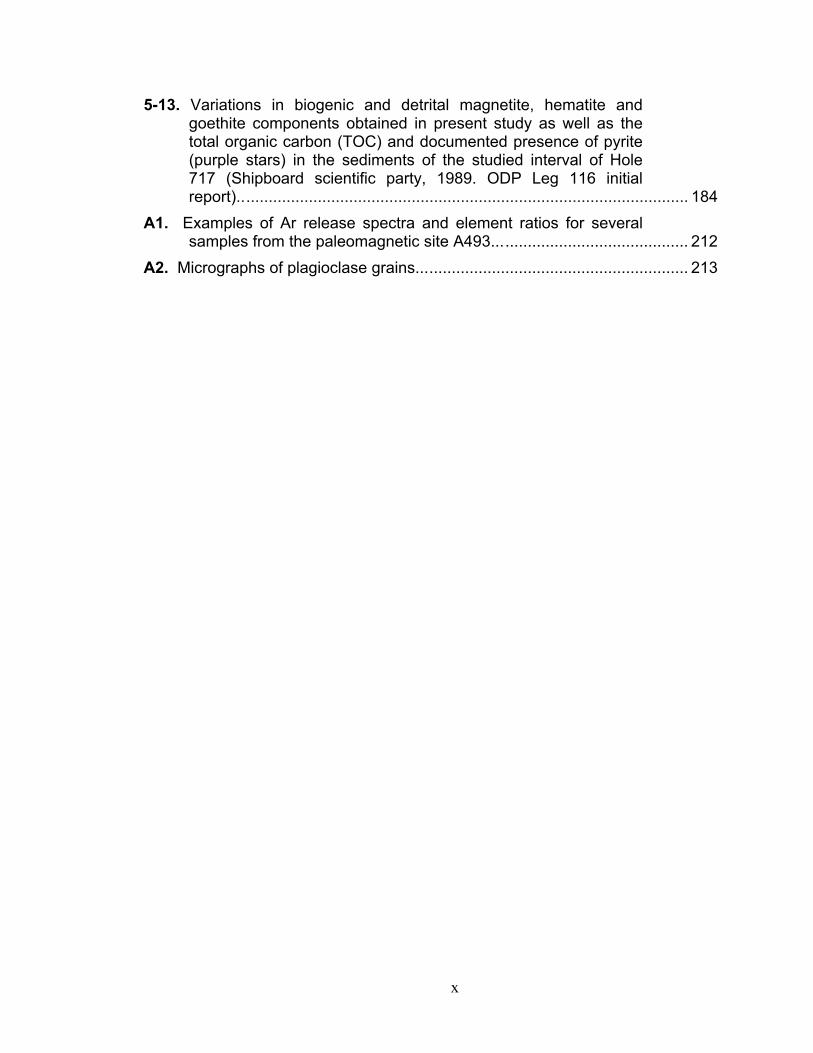
Geological setting The stratotype section of the Kurgasholak Formation is located in the southeast of
the Chu-Ili region (Fig.2-3; GPS location N 44o 07’10”, E74o47’30”). This locality is the
only known outcrop of the Middle Devonian volcanics in the region (Abdullin et al.,
1980); basaltic extrusive volcanism here occurred along the south-west boundary of the
outcrops of Precambrian metamorphic rocks (Abdullin et al., 1980).
The Kurgasholak Formation unconformably overlies the Lower to Middle
Devonian Degrez Formation and in turn is unconformably overlain by the Upper
Devonian (Famennian) Zhingeldy Formation (Tokmacheva et al., 1974; Senkevich,
1991). The Kurgasholak formation is subdivided into three members. The lower member
(~600 m thick) comprises basal pebbly conglomerate, medium– to fine grained
sandstones, rare tuffaceous sandstones, two rhyolite flows and occasional beds of
17
CHINA
L. Balk
hash
Late Paleozoic
Early-MiddleDevonian
Ordovician
46°N
50°N50°N
72°E
78°E
78°E
72°E
Cambrian
Accretionary complexesof different ages
Precambrian rocks
Late Paleozoicsedimentary basins
Subduction-relatedvolcanic complexes
Almaty
Astana
Karaganda
Chingiz Range
North Tien Shan
L. Balkhash
Astana
Almaty
Karaganda
G1,5G2,4
B2
location of the study area
localites with available Devonianand Silurian paleomagnetic data.For labels refer toLocality K2 (41.3N 70.5E) is outsidethe map area
Table 2G1
G3
B1L2,3
46°N
BishkekL1
72°E
Tengiz basin
Chu-Sarysu basin
B1G3
A) B)
AX
G2,4
42 NK1
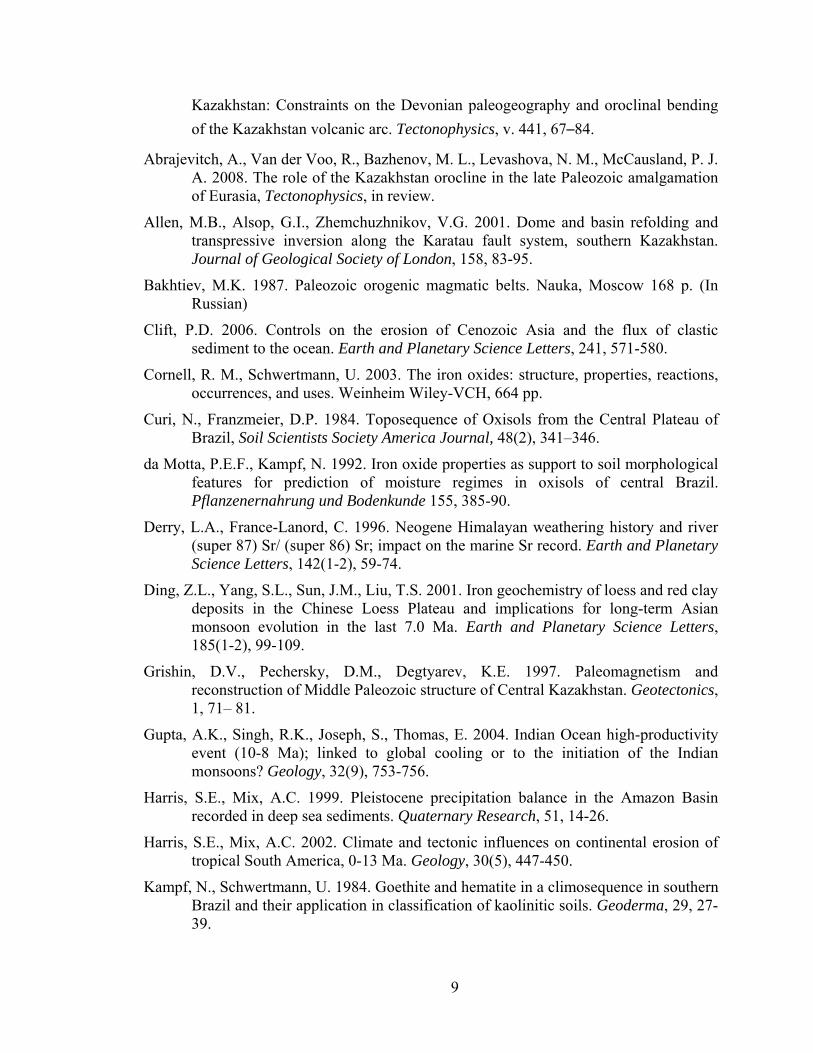
Figure 2-2. Paleozoic subduction-related complexes showing strongly curved Devonian and late Paleozoic volcanic belts. (A; modified after Degtyarev, 2003), the North Tien Shan and Chingiz Range at either end, as labeled in (B). The sampling localities of previously published Silurian and Devonian paleomagnetic results (G1 – 5, L1 – 3, B1 – 2, AX) and of this study (star) are indicated.
18
Quaternary sediments
Zhingeldy Formation D3
Kurgasholak Formation D2-3kshupper member: sandstones,mudstones
middle member: basalt, andesiticor basaltic flows, sandstoneslower member: sandstones,conglomerates, limestones
Degrez Formation D2sandstones, mudstones,tuff
Koktas Formation D1upper member: sandstones,mudstoneslower member: andesite,basalt porphyry
sandstones
Dulankar Formation O3sandstones, mudstones,conglomerates
Anarhay Formation PR2
gneiss, schist, amphibolite
intrusive bodies (D 2-3)
Faults
bedding60
sites a530-a585sites m9440-m9498
locations of the sites; 44.1N, 74.79E
S-1S-2
15
40
55
70
70 70
40
5050
85
60
O3
D3
D3
O3
D2
D2
D2-3ksh
D2-3ksh
40
D2
S-1S-2
1 km
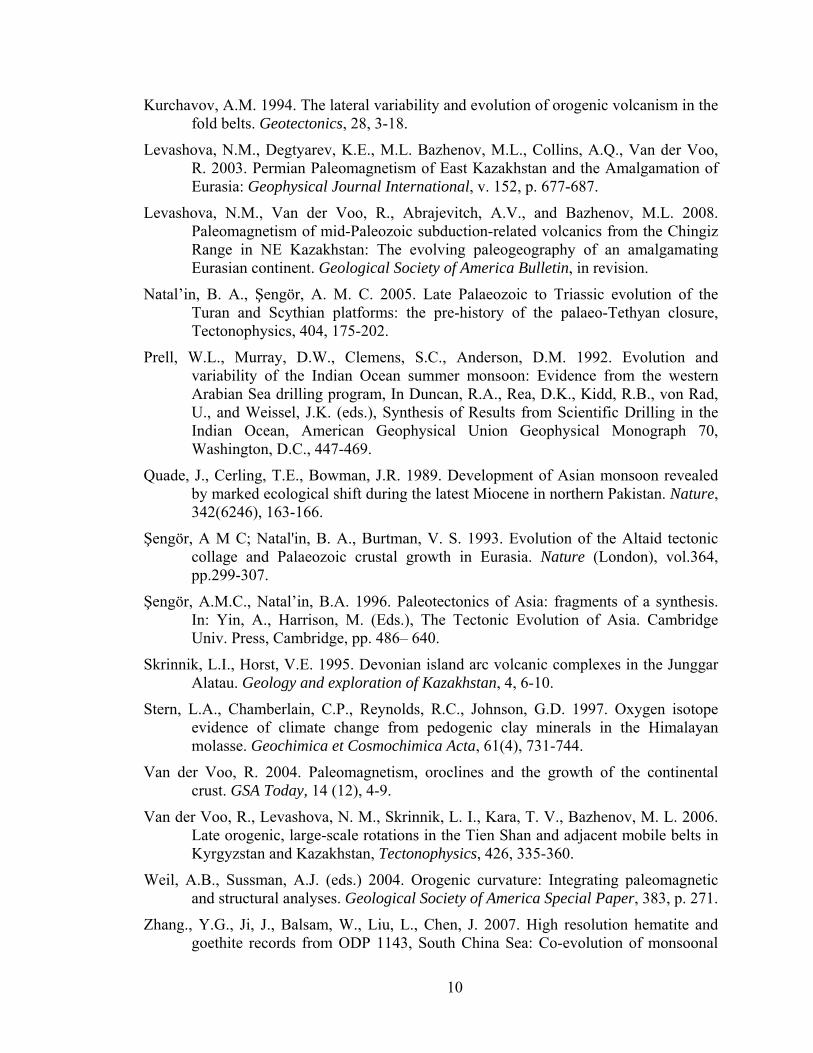
Figure 2-3. The sampled sections of the middle member of the Kurgasholak Formation at N 44 07’10”, E74 47’30”. Geological map from Abdullin et al. (1980).
19
limestone. The middle member (~1100 m thick) consists mostly of massive flows of
purplish-grey, dark green and brown porphyritic basalt and andesitic basalt with rare
feeder-dikes. No occurrence of tuff is known in the sequence. In the majority of the
flows the upper oxidized surface is preserved, suggesting short-lived but nearly
continuous volcanic activity. The flows are inter-bedded with occasional layers of
sandstone and pebbly conglomerates, which contain products of erosion and re-
deposition of the contemporary volcanics. The upper member of the formation (~560 m
thick) comprises poorly exposed fine- to coarse-grained, cross-bedded, red sandstones
and mudstones.
The age assignment of Middle Devonian for the Kurgasholak Formation is based
on stratigraphic position as well as on fossil plants collected from sandstones of the lower
member: Cooksonia (?) degrezensis Senk., Taeniocrada cf. langi Stockm., T. cf. dubia
Kr. et W., Lidasimophyton akkermensis Senk., Protolepidodendron schrianum Kr.,
Protopteridium cf. hostimense Kr. The plant assemblage does not allow for a more
precise age estimate within the Middle Devonian (Tokmacheva et al., 1974).
The sampling area is located in a zone (called Stepnyak-North Tien Shan) that by
Devonian time was incorporated into the Kokchetav – North Tien Shan Domain (KNTD)
according to Windley et al. (2007, fig. 6). This domain is approximately the same as the
“Kazakhstan-Kyrghyz” block of Filippova et al. (2001). These scientists argued that this
block was probably not rigid, but that it did act as a coherent paleogeographic unit in
post-Ordovician times, and that an Early Devonian arc system developed on its eastern
side, as illustrated in Figure 2-2, accommodating west- or southwest-dipping subduction
(in present-day coordinates).
Field and laboratory methods For this study, we collected volcanics of the middle member of the Kurgasholak
Formation at the type locality for this formation (see Fig. 2-3). In total, we sampled 18
volcanic sites, each representing a cooling unit, and one layer of an intra-formational
conglomerate (16 clasts, site m9476 in Table 2-1). Sample labels start with a capital letter
20
(A, or M), followed by sample number, whereas sites are marked with a lower-case letter
and the number of the first sample collected.
Paleo-horizontal of the volcanic flows in the sampled sections and the younging
direction of the section were determined from oxidized flow-tops and the intra-
formational conglomerate bed. Bedding attitudes show some variation from bottom to
top of the sampled section; see Table 2-1, which contains the strikes and dips of the sites,
listed in stratigraphic order. Samples were collected as oriented blocks; a magnetic
compass with inclinometer was used for the orientation of the samples. A lack of
deflection of the magnetic compass needle by the basalts demonstrated that magnetic
intensities did not significantly affect orientation readings.
In the laboratory, cubic specimens with ~20 mm side dimensions were cut from
the block samples, yielding, on average, 2 specimens per sample. Measurements of
natural remanent magnetization (NRM) were performed in the University of Michigan
paleomagnetic laboratory. The remanent intensities and directions were measured with a
three-axis 2G superconducting magnetometer. Alternating field demagnetization of a few
pilot specimens failed to isolate components of magnetization successfully. The bulk of
the specimens were therefore thermally demagnetized in an ASC TD-48 demagnetizer.
Both demagnetization and measurement were done in a magnetically shielded room with
a rest field < 200 nT. Results of the demagnetization treatments have been plotted in
orthogonal vector endpoint diagrams (Zijderveld, 1967) and in stereonets. For calculation
of the magnetization directions, principal component analysis (PCA, Kirschvink, 1980)
was used on linear segments of the Zijderveld plots; in cases where stable endpoints were
not obtained, so that successive endpoints were seen moving as trends along great circle
paths, a combined analysis of remagnetization circles and direct observations (McFadden
& McElhinny, 1988) was used.
Results NRM intensities of the studied samples range from 0.2 to 11 A/m.
Demagnetization diagrams (Fig. 2-4) show a wide range of behavior. Apart from a low-
temperature overprint generally removed at ~ 200oC, specimens revealed a number of
21
discrete directions that have been divided into a-, b-, and c-components. The site-mean
directions of the intermediate- and high-temperature components and their associated
statistical parameters are listed in Table 1 together with the formation mean directions.
The first-removed low-temperature components are tightly clustered (with a mean
of dec/inc = 6.4º/62.7º, k = 42, α95 = 5.4º, N = 18 site means) around the present-day
geomagnetic field direction, which is dec/inc = 5.4º/63.8º in 2005. These components are
readily interpreted as of recent and most likely viscous origin and have no significance
for the tectonics of the area. Even so, the good clustering of these directions testifies to
the accuracy and coherency of the field-orientations of our samples.
The a- and b- components The high temperature a-component, easterly and shallow up in geographic
coordinates, was isolated in 10 out of 18 sampling sites. This component was usually
removed between 500 and 580oC, although in samples collected from the upper oxidized
part of the flows, the magnetization could persist up to 675oC with no significant change
in direction from 350 to 470 oC to >650oC (Fig.2-4a-d), suggesting that magnetite and
hematite contribute similarly to the higher-temperature remanence (a-) directions. In
some samples, the a-component was readily identified even though it appeared to co-
exist with a lower-temperature component (which we will call c), as can be seen for
instance in Figure 2-4c. In yet other samples, a and c appear to co-exist, but an
insufficient number of steps is available to determine the a-component by PCA (e.g., Fig.
2-4f). In several demagnetization experiments the trajectory of the data-points did not
reach a stable direction, indicating overlapping temperature spectra of two or more
components. In these cases, the McFadden & McElhinny (1988) great-circle technique
was used to estimate the directions of the various components.
A high-temperature b-component, westerly and shallow down in geographic
coordinates (Fig. 2-4h, 2-4h), was found in three sites and its remanence unblocks in the
same range as the a-component in the other sites, i.e., between 250 – 475˚C and ~600˚C.
22
A 550-1(Ticks=100.0mA/M)
W
N,Up
NRM
130
467550
600650
250
component a
compo
nent
c
M9495(Ticks=100.0mA/M)
W
N,Up
NRM
200 520
550
580
component b
basalt flow
A542(Ticks=100.0mA/M)
W
N,Up
component a
NRM
200350
675
A558-1(Ticks=100.0mA/M) W
N,Up
component a
NRM
675
350
600
A 586-1(Ticks=500.0mA/M)
W
N,Up
component a
575
200
350
M9490(Ticks=100.0mA/M)
W
N,Up
component b
conglomerate clast
component an
200
M9489(Ticks=100.0mA/M)
W
N,Up
component b
conglomerate clast
NRM
200450
660
M9486(Ticks=100.0mA/M)
W
component b
conglomerate clast
200
630
550
370M9496(Ticks=500.0mA/M)
W
N,Up
basalt flow
component b
NRM
200 590
450
A B C
D
E
F G
H
IN,Up
410550
A551-1(Ticks=50.0mA/M)
W
N,Up
comp
onen
t c
400
component a
NRM
600
200
300
550
M9459 (T icks=100.0mA/M)
W
N,Up
component c
260370
500
570
J
K
Figure 2-4. Orthogonal demagnetization diagrams (Zijderveld, 1967) in geographic coordinates. Sample numbers correspond to similarly numbered sites (see Table 2-1). Components, as labeled (a, b, c or an), are discussed in the text. Open (closed) symbols correspond to magnetization end-points projected onto the east-west vertical (horizontal) plane. Tickmarks denote intensities as labeled in mA/m.
23
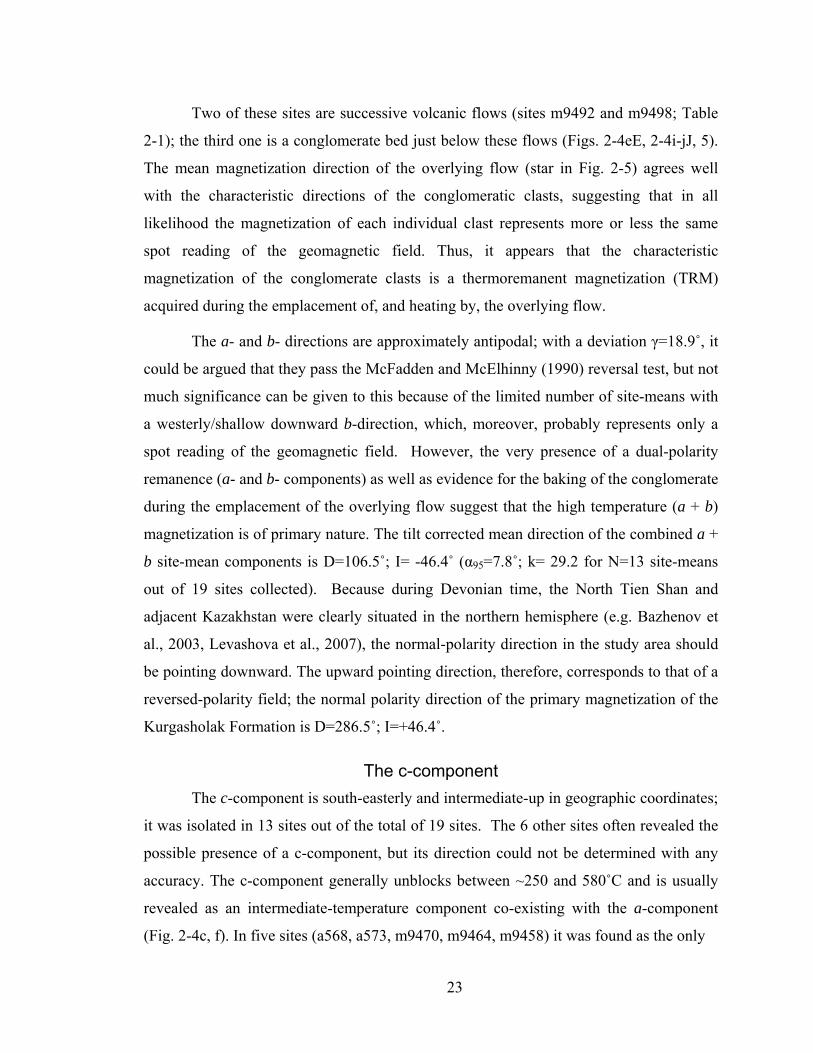
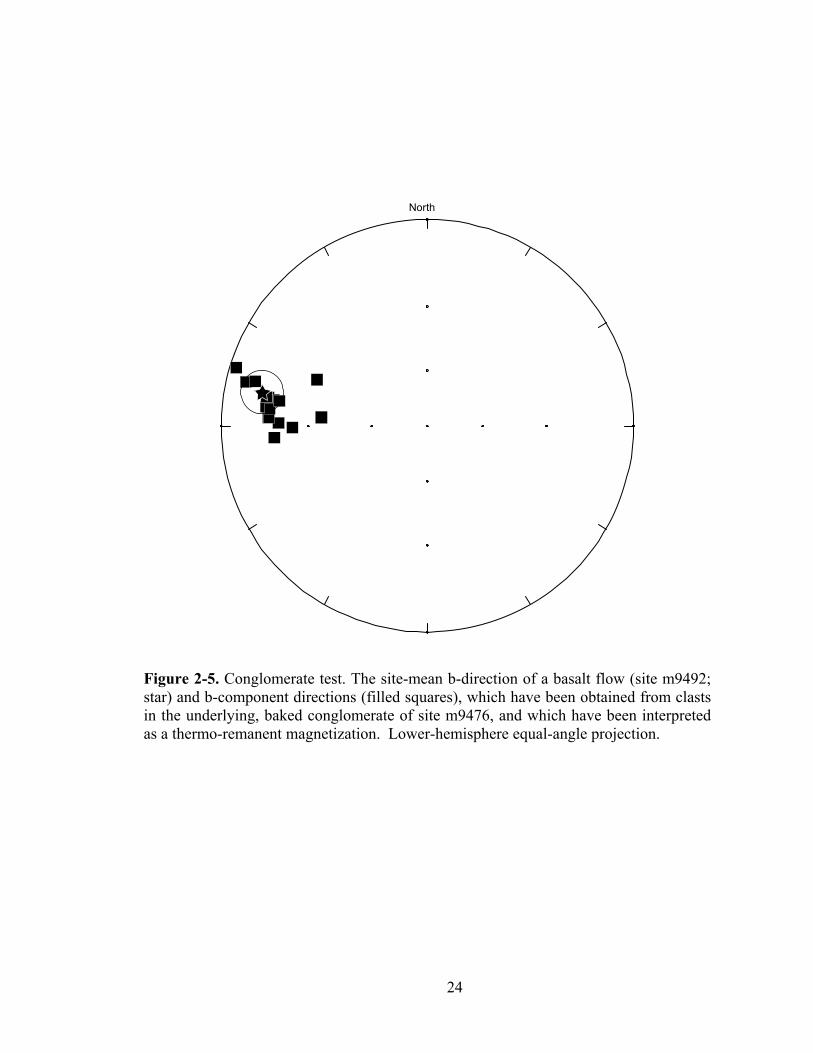
Two of these sites are successive volcanic flows (sites m9492 and m9498; Table
2-1); the third one is a conglomerate bed just below these flows (Figs. 2-4eE, 2-4i-jJ, 5).
The mean magnetization direction of the overlying flow (star in Fig. 2-5) agrees well
with the characteristic directions of the conglomeratic clasts, suggesting that in all
likelihood the magnetization of each individual clast represents more or less the same
spot reading of the geomagnetic field. Thus, it appears that the characteristic
magnetization of the conglomerate clasts is a thermoremanent magnetization (TRM)
acquired during the emplacement of, and heating by, the overlying flow.
The a- and b- directions are approximately antipodal; with a deviation γ=18.9˚, it
could be argued that they pass the McFadden and McElhinny (1990) reversal test, but not
much significance can be given to this because of the limited number of site-means with
a westerly/shallow downward b-direction, which, moreover, probably represents only a
spot reading of the geomagnetic field. However, the very presence of a dual-polarity
remanence (a- and b- components) as well as evidence for the baking of the conglomerate
during the emplacement of the overlying flow suggest that the high temperature (a + b)
magnetization is of primary nature. The tilt corrected mean direction of the combined a +
b site-mean components is D=106.5˚; I= -46.4˚ (α95=7.8˚; k= 29.2 for N=13 site-means
out of 19 sites collected). Because during Devonian time, the North Tien Shan and
adjacent Kazakhstan were clearly situated in the northern hemisphere (e.g. Bazhenov et
al., 2003, Levashova et al., 2007), the normal-polarity direction in the study area should
be pointing downward. The upward pointing direction, therefore, corresponds to that of a
reversed-polarity field; the normal polarity direction of the primary magnetization of the
Kurgasholak Formation is D=286.5˚; I=+46.4˚.
The c-component The c-component is south-easterly and intermediate-up in geographic coordinates;
it was isolated in 13 sites out of the total of 19 sites. The 6 other sites often revealed the
possible presence of a c-component, but its direction could not be determined with any
accuracy. The c-component generally unblocks between ~250 and 580˚C and is usually
revealed as an intermediate-temperature component co-existing with the a-component
(Fig. 2-4c, f). In five sites (a568, a573, m9470, m9464, m9458) it was found as the only
24
North
Figure 2-5. Conglomerate test. The site-mean b-direction of a basalt flow (site m9492; star) and b-component directions (filled squares), which have been obtained from clasts in the underlying, baked conglomerate of site m9476, and which have been interpreted as a thermo-remanent magnetization. Lower-hemisphere equal-angle projection.
25
Legend and explanation for Table 2-1: Bedding measurements are given as the strike and dip angle (down dip to the right (clockwise) of strike). Components (cmp) labeled as in the text. m indicates number of samples used in the statistical analysis: g-great circle, s-stable endpoint, hd-intersection point of two great circles (Hoffman and Day, 1978); n - number of samples demagnetized; N = number of sites. *indicates sites that showed only trends that did not reach a stable endpoint. In such cases, a site-mean direction of the nearest site with a stable endpoint estimate for the particular component was used as an anchor in the great circle analysis. TC = tectonic correction. Dec and Inc are the declination and inclination of the site-mean direction (in ˚); α95 is the radius of the 95% confidence cone about the mean direction in ˚; k is the Fisher (1953) concentration parameter. Directions (Dec/Inc values) in italics are not used in the interpretation of the results
26
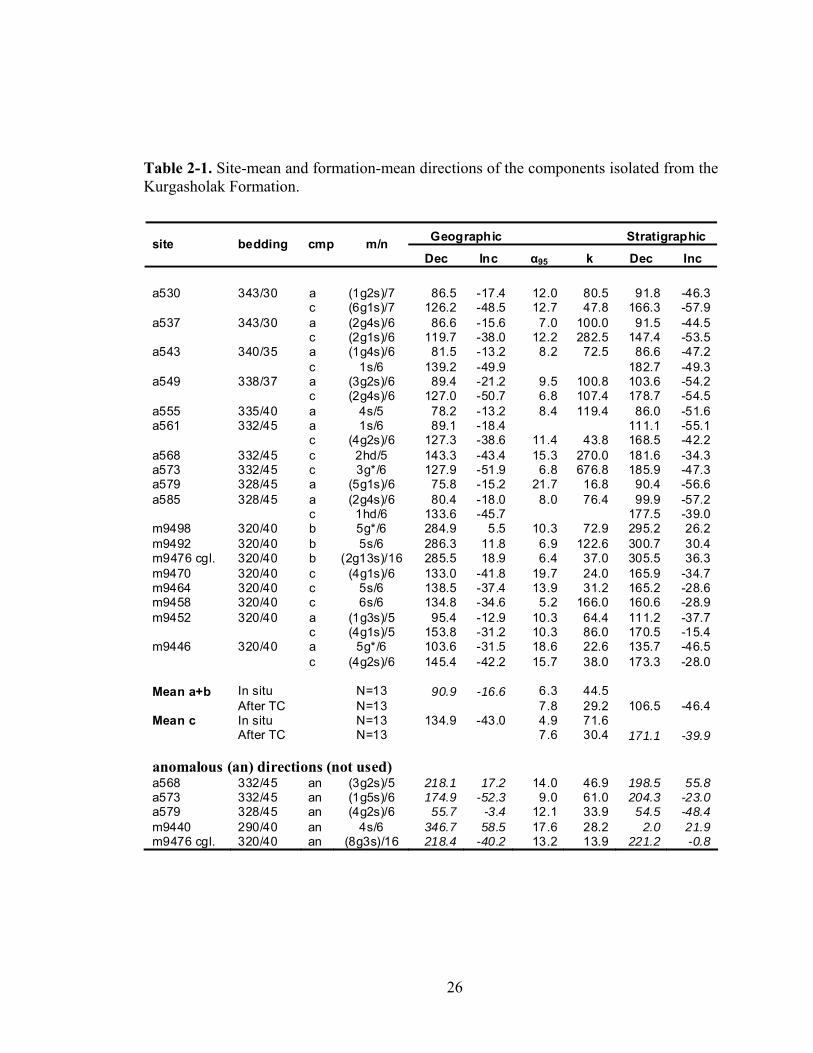
Table 2-1. Site-mean and formation-mean directions of the components isolated from the Kurgasholak Formation.
Geographic Stratigraphic site bedding cmp m/n Dec Inc α95 k Dec Inc
a530 343/30 a (1g2s)/7 86.5 -17.4 12.0 80.5 91.8 -46.3 c (6g1s)/7 126.2 -48.5 12.7 47.8 166.3 -57.9a537 343/30 a (2g4s)/6 86.6 -15.6 7.0 100.0 91.5 -44.5 c (2g1s)/6 119.7 -38.0 12.2 282.5 147.4 -53.5a543 340/35 a (1g4s)/6 81.5 -13.2 8.2 72.5 86.6 -47.2 c 1s/6 139.2 -49.9 182.7 -49.3a549 338/37 a (3g2s)/6 89.4 -21.2 9.5 100.8 103.6 -54.2 c (2g4s)/6 127.0 -50.7 6.8 107.4 178.7 -54.5a555 335/40 a 4s/5 78.2 -13.2 8.4 119.4 86.0 -51.6a561 332/45 a 1s/6 89.1 -18.4 111.1 -55.1 c (4g2s)/6 127.3 -38.6 11.4 43.8 168.5 -42.2a568 332/45 c 2hd/5 143.3 -43.4 15.3 270.0 181.6 -34.3a573 332/45 c 3g*/6 127.9 -51.9 6.8 676.8 185.9 -47.3a579 328/45 a (5g1s)/6 75.8 -15.2 21.7 16.8 90.4 -56.6a585 328/45 a (2g4s)/6 80.4 -18.0 8.0 76.4 99.9 -57.2 c 1hd/6 133.6 -45.7 177.5 -39.0m9498 320/40 b 5g*/6 284.9 5.5 10.3 72.9 295.2 26.2m9492 320/40 b 5s/6 286.3 11.8 6.9 122.6 300.7 30.4m9476 cgl. 320/40 b (2g13s)/16 285.5 18.9 6.4 37.0 305.5 36.3m9470 320/40 c (4g1s)/6 133.0 -41.8 19.7 24.0 165.9 -34.7m9464 320/40 c 5s/6 138.5 -37.4 13.9 31.2 165.2 -28.6m9458 320/40 c 6s/6 134.8 -34.6 5.2 166.0 160.6 -28.9m9452 320/40 a (1g3s)/5 95.4 -12.9 10.3 64.4 111.2 -37.7 c (4g1s)/5 153.8 -31.2 10.3 86.0 170.5 -15.4m9446 320/40 a 5g*/6 103.6 -31.5 18.6 22.6 135.7 -46.5 c (4g2s)/6 145.4 -42.2 15.7 38.0 173.3 -28.0 Mean a+b In situ N=13 90.9 -16.6 6.3 44.5 After TC N=13 7.8 29.2 106.5 -46.4Mean c In situ N=13 134.9 -43.0 4.9 71.6 After TC N=13 7.6 30.4 171.1 -39.9 anomalous (an) directions (not used) a568 332/45 an (3g2s)/5 218.1 17.2 14.0 46.9 198.5 55.8a573 332/45 an (1g5s)/6 174.9 -52.3 9.0 61.0 204.3 -23.0a579 328/45 an (4g2s)/6 55.7 -3.4 12.1 33.9 54.5 -48.4m9440 290/40 an 4s/6 346.7 58.5 17.6 28.2 2.0 21.9m9476 cgl. 320/40 an (8g3s)/16 218.4 -40.2 13.2 13.9 221.2 -0.8
27
characteristic direction (e.g. Fig. 2-4g), but in two of these sites it co-existed with
anomalous lower-temperature (an) components that have no coherence and no statistical
significance (see Table 2-1).
Very often the c-component directions can be seen to contribute to a great-circle
(“mixing”) trend in the stereonet or in curved trajectories of the demagnetization
diagrams, and it seems clear in many cases that overlap with a-components can be held
responsible. In these cases, as mentioned, we used the McFadden & McElhinny (1988)
technique to estimate the directions of the components. But this raises the critical
question whether the mean inclination and declination of the intermediate-temperature c-
component are accurately determined, given that many of the great circles run more or
less parallel between the more easterly a-component and the southeasterly c-component.
To document that the c-directions are indeed well constrained, we next examine Figure 2-6.
In the common occurrence that the a- and c-components are being removed
simultaneously (Fig. 2-6a, example of site a537), the great-circles run more or less
parallel to each other roughly along lines of equal inclination in the south- to southeastern
part of the stereonet. This means that for this site, the inclination is reasonably well
defined, but the declination is not well constrained. In contrast, the samples shown in
Figure 2-6c do not appear to contain the a-component, but instead show great-circles that
connect low-temperature, viscous (present-day) magnetization directions with the
southeasterly and upward c-directions. In these cases the great-circles define the
declination reasonably well, but the inclination less so. In Figure 2-6b, the sample
illustrates the co-existence and overlapping unblocking temperatures, first of the present-
day field (PDF) and c component, and subsequently of the a and the c-component;
however, the unblocking temperature spectra of the PDF and a components do not appear
to overlap. Thus, the directions define two great circles and the well-constrained
intersection of these two (gray star in upper hemisphere) corresponds to the (c-)
component in common to both.
Combining the effects of the great-circles shown in Figure 2-6a – c, one can see
that their intersections, the stable endpoints of a few samples (stars in Fig. 2-6a), and the
28
North
A537-1 (c+a)
A540-1 (a+c) A541-stable "c"
A537-1(Ticks=100.0mA/M)
W,W
N,Up
A540-1(Ticks=10.0mA/M)
W,W
N,Up
A541(Ticks=10.0mA/M)
W,W
N,Up
stable direction
North
PDF+c
a+c
North
M9472A575A566
A563
sample A585
site a537a+c components
a+c components
A
B C
Figure 2-6. Examples of great-circles used in constraining the c-component directions. Lower-hemisphere projections are represented by solid lines and filled symbols, upper hemisphere results are shown as dashed lines and open symbols. The stars in (A) represent what we believe to be a fairly accurate isolation of the c-component without contamination by the higher-temperature a-component. In (B), the three arrows indicate the trends in the progressive locations of the magnetization end-points during thermal demagnetization, which illustrate, first, simultaneous removal of the present-day field (PDF) and c-component and then, the simultaneous removal of the c-component and the a-component. The intersection in (B) is therefore the direction of c (gray star, upper hemisphere).
29
clear vectorial separation of the trends in Figure 2-6b, allow us to state with confidence
that the mean in-situ c-direction with dec/inc = 135º/-43º is well constrained.
Although the small range of variation in the bedding attitudes at our sampling
locality does not allow for a statistically significant fold test for the a + b components,
site-mean directions of the c-component group much better in geographic coordinates
with the concentration parameter k decreasing from 71.6 to 30.4 upon unfolding (Table
2-1, Fig. 2-7b). The k-ratio of 2.36 (N=13) is statistically significant at the 95%
confidence level, indicating a post-folding origin of this magnetization.
Anomalous directions of magnetization Here we discuss briefly the five site-means that have been labeled anomalous in
Table 2-1 and which are shown in Figure 2-7c. These site-means are listed because they
correspond to magnetizations that unblocked at intermediate-to-high temperatures. One
site-mean (m9440) clearly corresponds to the direction of the present-day field (PDF); it
is not anomalous in that sense, but is different from all other sites in that this PDF-
component persists up to higher temperatures. The shallow northeasterly direction of site
a579 can readily be explained as due to simultaneous removal of PDF and an a-
component, whereas the southwesterly and up intermediate-temperature directions of the
conglomerate site (m9476) fall between those of the b- and the c-components. We note,
however, that great-circle trends are lacking to document the suspicions that these
directions are due to simultaneous removal of two directions.
The anomalous components of sites a568 and a573 are removed at intermediate-
temperatures. Although these directions co-exist with c-components (see Table 2-1),
they do not seem to correspond to any mixing trends. We can only speculate as to what
imparted these magnetizations; perhaps these directions reflect transient geomagnetic
fields during excursions.
30
North North
North North
North North
Geographic Tilt-corrected
Geographic Tilt-corrected
Geographic Tilt-corrected
D=90.9; I= -16.6a95 =6.3; k=44.5
D=134.9; I= -43.0a95 =4.9; k=71.6
D=106.5; I= -46.4a95 =7.8; k=29.2
D=171.1; I= -39.9a95 =7.6; k=30.4
c-component
a & b components
anomalous directions
ba
b
a
A
B
C
a579m9440
a573m9476(cgl.)
a568
m9440
a579
a568
a573m9476�(cgl.)
Figure 2-7. Equal-angle stereoplots of the various component site-means isolated in the Kurgasholak Formation (as also listed in Table 2-1). Open (closed) symbols represent upper (lower) hemisphere projections.
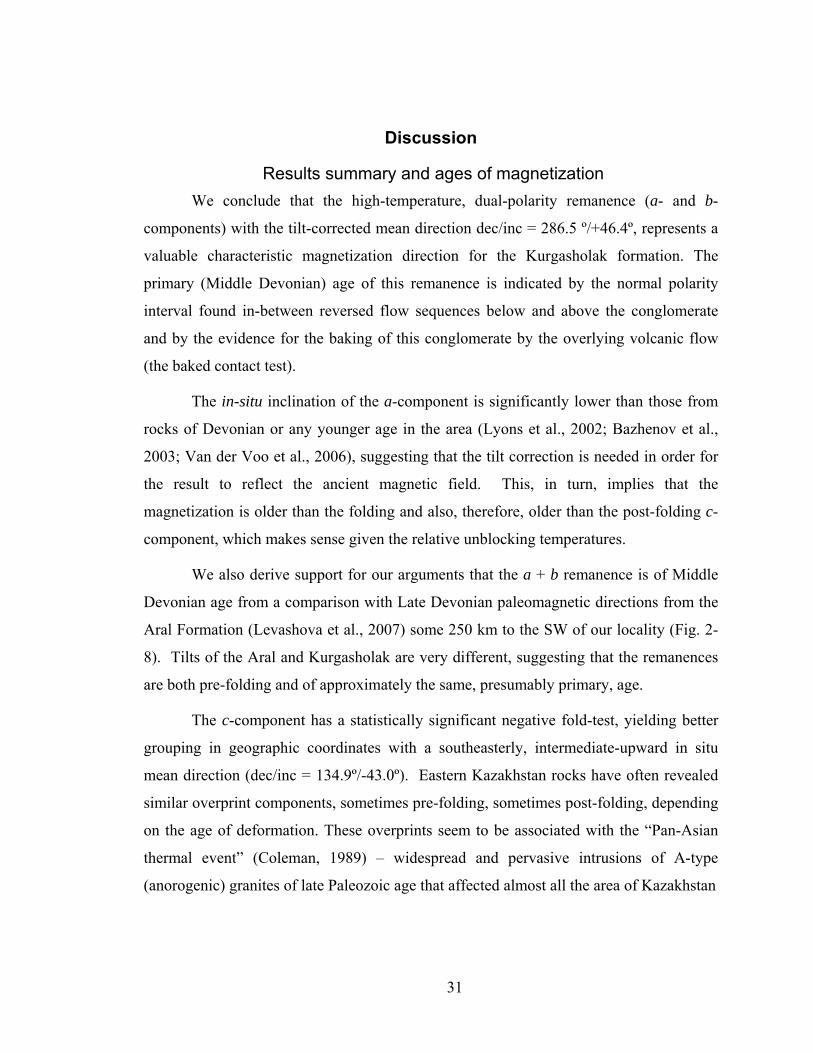
31
Discussion
Results summary and ages of magnetization We conclude that the high-temperature, dual-polarity remanence (a- and b-
components) with the tilt-corrected mean direction dec/inc = 286.5 º/+46.4º, represents a
valuable characteristic magnetization direction for the Kurgasholak formation. The
primary (Middle Devonian) age of this remanence is indicated by the normal polarity
interval found in-between reversed flow sequences below and above the conglomerate
and by the evidence for the baking of this conglomerate by the overlying volcanic flow
(the baked contact test).
The in-situ inclination of the a-component is significantly lower than those from
rocks of Devonian or any younger age in the area (Lyons et al., 2002; Bazhenov et al.,
2003; Van der Voo et al., 2006), suggesting that the tilt correction is needed in order for
the result to reflect the ancient magnetic field. This, in turn, implies that the
magnetization is older than the folding and also, therefore, older than the post-folding c-
component, which makes sense given the relative unblocking temperatures.
We also derive support for our arguments that the a + b remanence is of Middle
Devonian age from a comparison with Late Devonian paleomagnetic directions from the
Aral Formation (Levashova et al., 2007) some 250 km to the SW of our locality (Fig. 2-
8). Tilts of the Aral and Kurgasholak are very different, suggesting that the remanences
are both pre-folding and of approximately the same, presumably primary, age.
The c-component has a statistically significant negative fold-test, yielding better
grouping in geographic coordinates with a southeasterly, intermediate-upward in situ
mean direction (dec/inc = 134.9º/-43.0º). Eastern Kazakhstan rocks have often revealed
similar overprint components, sometimes pre-folding, sometimes post-folding, depending
on the age of deformation. These overprints seem to be associated with the “Pan-Asian
thermal event” (Coleman, 1989) – widespread and pervasive intrusions of A-type
(anorogenic) granites of late Paleozoic age that affected almost all the area of Kazakhstan
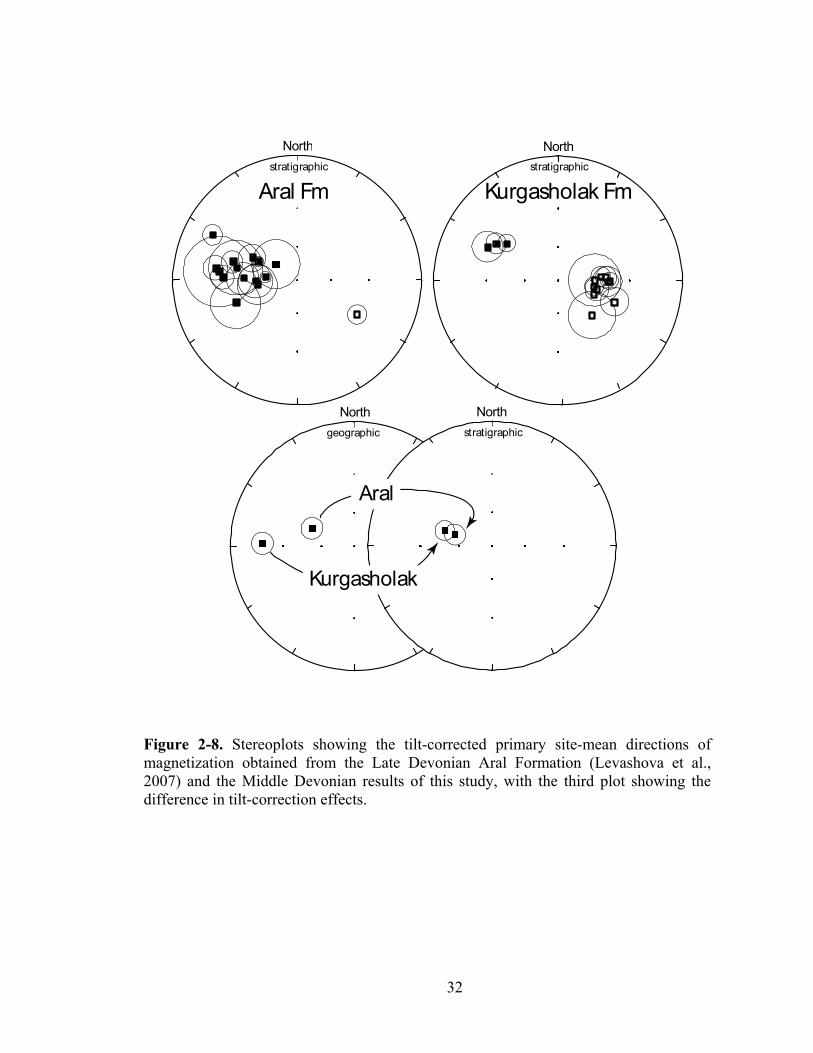
32
North North
Aral Fm Kurgasholak Fmstratigraphic stratigraphic
Northgeographic
Northstratigraphic
Aral
Kurgasholak
Figure 2-8. Stereoplots showing the tilt-corrected primary site-mean directions of magnetization obtained from the Late Devonian Aral Formation (Levashova et al., 2007) and the Middle Devonian results of this study, with the third plot showing the difference in tilt-correction effects.
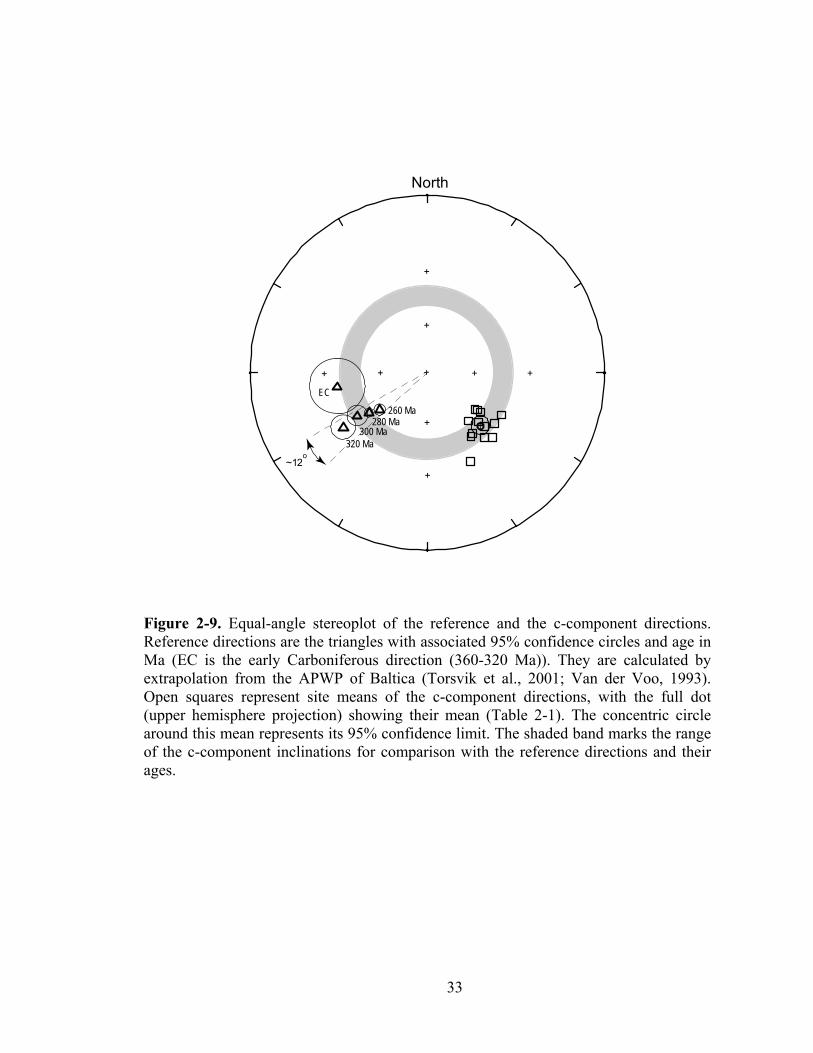
33
North
~12o
EC
320 Ma
260 Ma
300 Ma280 Ma
+
+
++ + +
+
+
+
Figure 2-9. Equal-angle stereoplot of the reference and the c-component directions. Reference directions are the triangles with associated 95% confidence circles and age in Ma (EC is the early Carboniferous direction (360-320 Ma)). They are calculated by extrapolation from the APWP of Baltica (Torsvik et al., 2001; Van der Voo, 1993). Open squares represent site means of the c-component directions, with the full dot (upper hemisphere projection) showing their mean (Table 2-1). The concentric circle around this mean represents its 95% confidence limit. The shaded band marks the range of the c-component inclinations for comparison with the reference directions and their ages.
34
(Yakubchuk, (1997). In almost all cases, the magnetizations are of reversed polarity and
usually show upward inclinations of 40 – 60º. Figure 2-9 illustrates that these
inclinations are characteristic of the late Paleozoic reference directions. In Figure 2-9
these directions are calculated for the area by extrapolation from Baltica, but it must be
noted that using Siberian or Tarim’s late Paleozoic poles as reference poles yields very
similar inclination predictions. It must also be noted that the paleolatitudes of Kazakhstan
are, without exception, higher than 40ºN for the entire Mesozoic and Cenozoic, as can be
seen by examining Scotese’s (2000) paleogeographic maps; this indicates that the
observed paleolatitude of 25±5ºN from the c-component implies a pre-Mesozoic age of
the magnetization. All-in-all, this leads us to argue for a Permian age for the c-
component.
General pre-amble to an analysis of rotations in the Devonian volcanic arc Despite some recent accomplishments, primary paleomagnetic results from
Kazakhstan and Kyrgyzstan remain sparse and frequently defy a unique interpretation.
While the inclination data provide consistent paleolatitude estimates for the area of
interest to this study, such as the Chingiz Range and North Tien Shan limbs of the curved
Devonian orocline illustrated in Figure 2-2b (Bazhenov et al., 2003; Alexyutin et al.,
2005; Collins et al., 2003; Levashova et al., 2007), an unambiguous interpretation of
declination data from this region is hampered by the multiple episodes of wrench faulting
and transpressional deformation during the protracted late Paleozoic assembly of this part
of Asia. The repeated episodes of strike slip motions along the abundant east-west and
northwest-southeast fault systems in the region are well documented (Allen et al., 2001;
Natal’in and Şengör, 2005; Van der Voo et al., 2006). Such strike-slip faulting is
frequently associated with vertical-axis rotations which cause a deviation in
paleomagnetic declinations. Bazhenov et al. (1993) and Van der Voo et al. (2006)
discussed the complex patterns of late-orogenic, Late Permian – Early Triassic rotations
in Kyrgyzstan and eastern Kazakhstan. In the Chingiz Range (the northeastern limb of the
orocline) the rotations are generally clock-wise and small, whereas in the North Tien
Shan and adjacent areas the rotations are usually large, on the order of 90˚, and
predominantly counter-clockwise. But importantly, exceptions to the latter pattern do
35
occur in some restricted localities of the North Tien Shan and vicinity where rotations are
minor (Alexyutin et al., 2005, McCausland et al., 2005). Late orogenic rotations of larger
magnitude, obviously, must be considered in making tectonic reconstructions for earlier
times. In the next section we will briefly discuss the paleomagnetic data available for
Silurian and Devonian volcanic rocks in the oroclinal belt of Kazakhstan, and we will
also describe estimates for the declination corrections that may restore rock units to their
pre-Late Permian orientation.
Previously published Silurian and Devonian paleomagnetic data and their corrected pre-Late Permian declinations
Available paleomagnetic results from rocks of Silurian and Devonian age from
localities in or close to the Devonian volcanic belt are listed in Table 2-2. Primary
magnetizations of Devonian age have been obtained by us from the Aral and
Kurgasholak formations, with westerly and intermediate downward dual-polarity
magnetizations in both formations (dec = 280 - 287º); the localities of these two
formations are shown as L2 and a star in Figure 2-2. Klishevich and Khramov (1993)
presented Devonian results from two localities (K1 and K2) in the North Tien Shan.
Their results passed fold and reversals tests and are considered reliable. Only one other
Devonian and one Silurian result have been derived from this southwestern limb of the
putative orocline: G3 (Grishin et al., 1997) and AX (Alexyutin et al., 2005). The latter is
of Silurian to Early Devonian age and the magnetization is demonstrably pre-Middle
Devonian owing to a positive fold test; this result is clearly reliable. In contrast, the G3
result cannot be qualified as reliable; moreover, the information available in the
publication is not always complete. We have analyzed the three relevant Devonian
paleomagnetic results from the Grishin et al. (1997) study and in Table 2-3 we list the
seven reliability criteria of Van der Voo (1993) and enumerate how well the G1 – G3
results meet these criteria. The G3 result meets only one or two of the seven criteria, and
consequently cannot be considered as reliable. A negative conglomerate test and an
inconclusive foldtest also argue strongly against the use of this result. Thus, we did not
include G3 in our analysis.
The NE limb has yielded five results, two of which (L3, G5) are of Silurian age.
The Devonian L2 result published by some of us in 2003 (Levashova et al., 2003) is in
36
need of substantiation as we have maintained from the beginning, but the formation
seems to have some promise; work in progress has given us some confidence that the
result will eventually meet minimum reliability (i.e., Q > 3). The Silurian G5 result
meets minimum reliability criteria (Q = 3 or perhaps 4), and L3 is of good quality as well.
Both have therefore been included in the analysis, and so has the more marginal (Q > 3?)
Devonian result (G1) from Grishin et al. (1997).
The two results published by Burtman et al. (1998), on the other hand, have not
been included in our analysis. These authors reported a dual polarity, pre-folding
remanence from two Middle Devonian localities (B1, B2, Table 2-2). The directions of
the magnetization, however, match closely the expected Late Paleozoic overprint
direction in both declination and inclination. Thus, we think it likely that these rocks were
remagnetized prior to the Middle Carboniferous to Early Permian folding episode that
affected the sampled localities.
The third (NW) limb of the orocline connects the SW and NE limbs in the pattern
shown in Figure 2-2b. It has yielded two useable results (G2, G4), one each of Devonian
and of Silurian age. These results meet minimum reliability criteria (Q > 3 in both cases),
and have been included in the analysis. The reliability of G4, in particular, is attested to
by a positive fold-test on a syn-sedimentary slump structure.
In summary, Table 2-2 provides us with eleven declinations distributed over all
three limbs of the orocline that can be analyzed for rotations. The Silurian and Devonian
data sets are of mixed quality, but as we will see, the results of the two groups do not
contradict each other. Our next step is to use our knowledge of the sense and magnitude
of Late Permian – Early Triassic rotations to restore the declinations to their pre-Late
Permian orientations.
The deflection of the “c-component” of this study (that we consider to be an
overprint of Permian age) relative to the reference direction indicates that the sampling
locality underwent a counter-clockwise rotation of about 100˚, similar sense rotations are
common in the region (e.g. Van der Voo et al., 2006). The much less plausible choice of
the alternative option, a rotation of 260o clockwise, will, of course, result in the same
corrected value of the Devonian declination. The uncertainties of this and other rotations
37
have been calculated by the method of Debiche and Watson (1995) and are included in
Table 2-2 (labeled ΔR). As a reference direction for the calculation of rotations in the
study area we chose the 290 Ma pole. It should be noted that while the reference
inclinations for the study area steadily increase with younging age during the Late
Paleozoic, the declinations show relatively minor changes (Fig. 2-9). Thus, somewhat
imprecise dating of the c-component will not significantly affect the reference declination
and, consequently, the estimate of the rotations.
Rotating the primary Devonian direction clockwise by 100o (or counter-
clockwise by 260o), we restore the declination of the primary a + b component to its pre-
Late Permian bearing of 27±13º.
For the Aral result no estimate of any late Paleozoic rotation is available from the
rocks themselves, but considering that their locality is within the same shear-zone as our
study area (Van der Voo et al., 2006), it is reasonable to expect that the Aral-Formation
sampling area was also affected by a counterclockwise (ccw) rotation of considerable
magnitude. If this rotation was of the order of 90o ccw (Van der Voo et al., 2006), then
the corrected Devonian declination turns into a northerly direction, not unlike that of the
corrected declination from this study. Even if the rotation was only some 60o ccw, the
restored declination of 340o is northerly.
Klishevich and Khramov (1993) reported the presence of secondary overprints in
some of their samples in addition to the primary Devonian K1 and K2 magnetizations.
The directions of these secondary components are described as being “similar to that of
the primary magnetization of the Permian rocks in the sampling regions”. However, no
explicit information about the direction of this component was provided in the
publication. Thus, we used an average of several published Late Permian results to
correct the declinations for late Paleozoic rotations (Van der Voo et al., 2006). These
results come from localities closest to the K1 and K2 sampling sites. Restored to their
pre-Late Permian bearings, the Devonian declinations of both sites are ~ 20 NE.
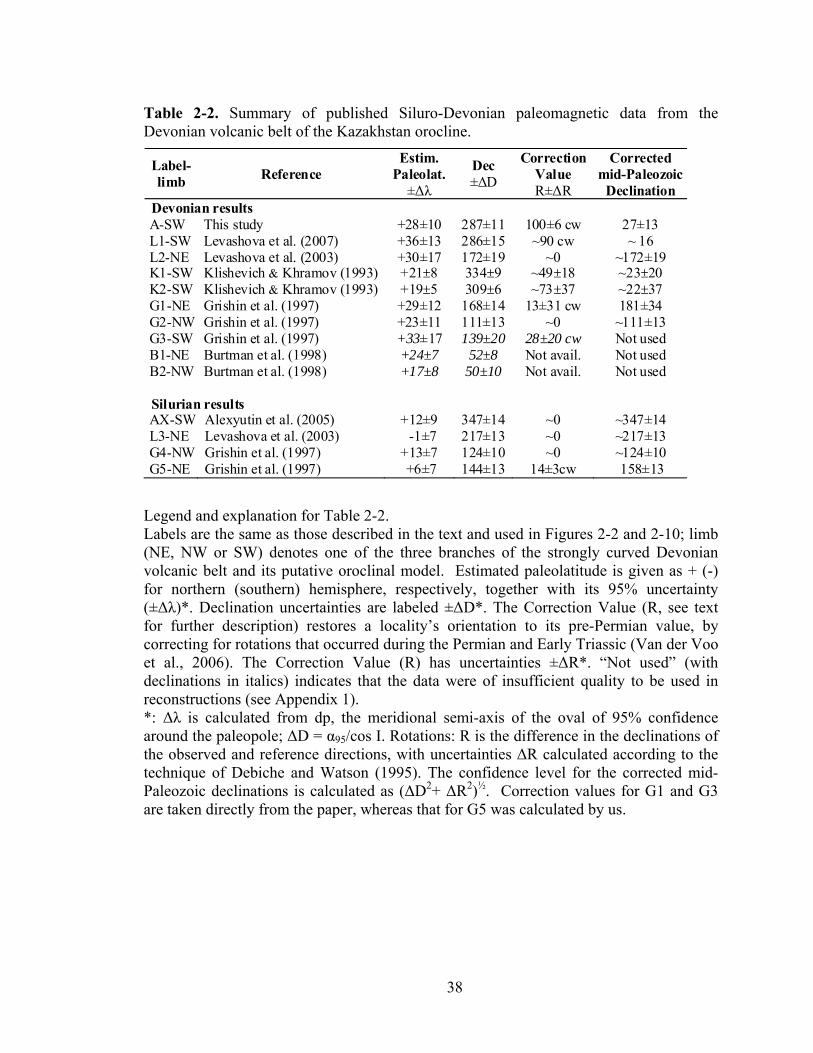
38
Table 2-2. Summary of published Siluro-Devonian paleomagnetic data from the Devonian volcanic belt of the Kazakhstan orocline.
Label-limb Reference
Estim. Paleolat.
±Δλ
Dec ±ΔD
Correction Value R±ΔR
Corrected mid-Paleozoic
Declination Devonian results A-SW This study +28±10 287±11 100±6 cw 27±13 L1-SW Levashova et al. (2007) +36±13 286±15 ~90 cw ~ 16 L2-NE Levashova et al. (2003) +30±17 172±19 ~0 ~172±19 K1-SW Klishevich & Khramov (1993) +21±8 334±9 ~49±18 ~23±20 K2-SW Klishevich & Khramov (1993) +19±5 309±6 ~73±37 ~22±37 G1-NE Grishin et al. (1997) +29±12 168±14 13±31 cw 181±34 G2-NW Grishin et al. (1997) +23±11 111±13 ~0 ~111±13 G3-SW Grishin et al. (1997) +33±17 139±20 28±20 cw Not used B1-NE Burtman et al. (1998) +24±7 52±8 Not avail. Not used B2-NW Burtman et al. (1998) +17±8 50±10 Not avail. Not used Silurian results AX-SW Alexyutin et al. (2005) +12±9 347±14 ~0 ~347±14 L3-NE Levashova et al. (2003) -1±7 217±13 ~0 ~217±13 G4-NW Grishin et al. (1997) +13±7 124±10 ~0 ~124±10 G5-NE Grishin et al. (1997) +6±7 144±13 14±3cw 158±13
Legend and explanation for Table 2-2. Labels are the same as those described in the text and used in Figures 2-2 and 2-10; limb (NE, NW or SW) denotes one of the three branches of the strongly curved Devonian volcanic belt and its putative oroclinal model. Estimated paleolatitude is given as + (-) for northern (southern) hemisphere, respectively, together with its 95% uncertainty (±Δλ)*. Declination uncertainties are labeled ±ΔD*. The Correction Value (R, see text for further description) restores a locality’s orientation to its pre-Permian value, by correcting for rotations that occurred during the Permian and Early Triassic (Van der Voo et al., 2006). The Correction Value (R) has uncertainties ±ΔR*. “Not used” (with declinations in italics) indicates that the data were of insufficient quality to be used in reconstructions (see Appendix 1). *: Δλ is calculated from dp, the meridional semi-axis of the oval of 95% confidence around the paleopole; ΔD = α95/cos I. Rotations: R is the difference in the declinations of the observed and reference directions, with uncertainties ΔR calculated according to the technique of Debiche and Watson (1995). The confidence level for the corrected mid-Paleozoic declinations is calculated as (ΔD2+ ΔR2)½. Correction values for G1 and G3 are taken directly from the paper, whereas that for G5 was calculated by us.
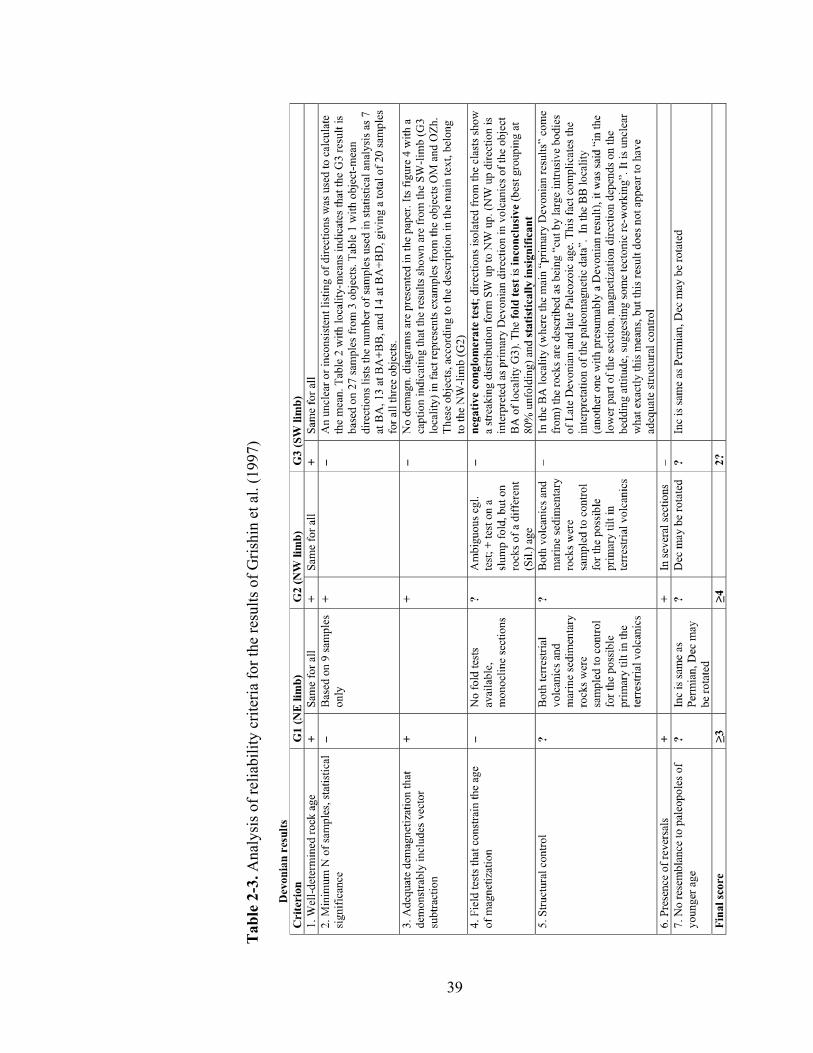
39
Tab
le 2
-3. A
naly
sis o
f rel
iabi
lity
crite
ria fo
r the
resu
lts o
f Gris
hin
et a
l. (1
997)
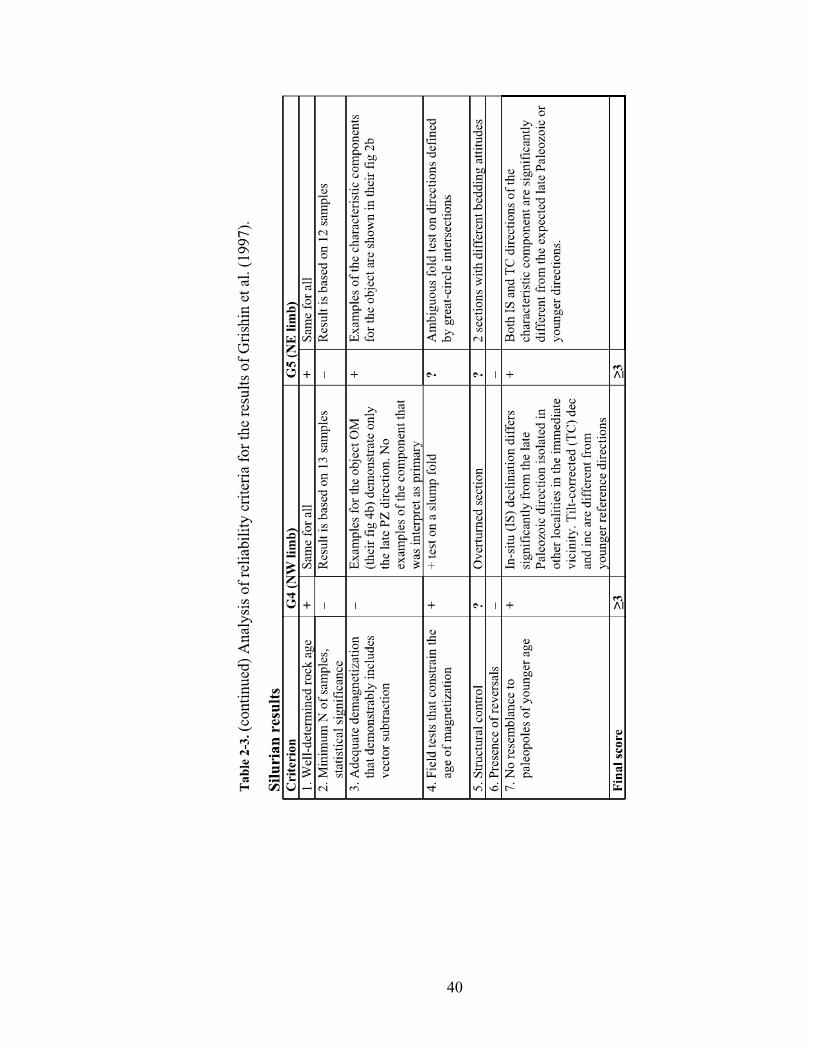
40
41
In the NE and NW limbs of the orocline, the later rotations are generally negligibly small,
which is concluded from overprints of late Paleozoic age that agree well with the coeval
reference declination. The Devonian declinations in the Chingiz Range (NE limb) thus
remain southerly (172 and 181o), whereas the Devonian declination in the NW limb is of
the order of 110o.
The Silurian results show the same pattern as the Devonian (Table 2-2) with a
northerly (347o) declination in the Kendyktas block, where no appreciable late Paleozoic
rotation is observed (Alexyutin et al., 2005; McCausland et al., 2005; Van der Voo,
2006), whereas the declinations are roughly southerly (144o and 217o) in the Chingiz
Range and east-southeasterly (about 124o) in the third (NW) limb.
Unbending the orocline The corrected declinations of the Devonian and Silurian magnetizations are
plotted in Figure 2-10a within the structural trends of the strongly curved Devonian
volcanic belt. In general, there is a good correlation between the change in the structural
trend and the change in declination. This correlation suggests that the present-day
curvature of the belt is, indeed, the result of oroclinal bending of an originally much
straighter belt. One can test, to first approximation, whether the initial Devonian
configuration of the belt was linear, by using the declinations as passive markers and
aligning them all roughly parallel (Fig. 2-10b).
We realize, of course, that Fig. 2-10 reduces an exceedingly complex geological
situation to three straight bands and a set of seemingly precise directions (arrows).
Nevertheless, recognizing that the figure is a simplification, it usefully illustrates that a
~1500 km-long active volcanic arc trended approximately northwest-southeast in
Devonian times. The subduction responsible for the volcanism was towards the
southwest. The consistent inclination data from all segments indicate that the arc, which
delineated the northeastern margin of the KNTD (“Kazakhstania”) landmass, was
situated at a ~ 30˚ northerly paleolatitude (see also Levashova et al., 2007). We note that
the results of Klishevich and Khramov (1993) have shallower inclinations than all the
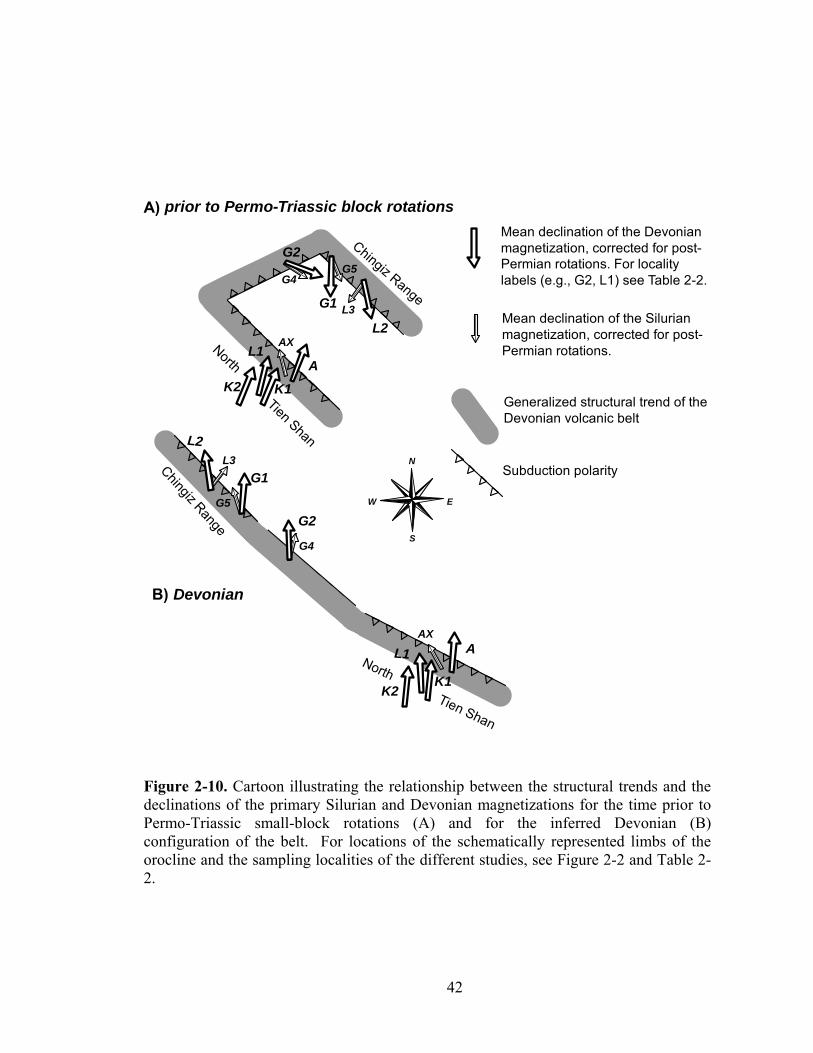
42
Mean declination of the Devonianmagnetization, corrected for post-Permian rotations. For localitylabels (e.g., G2, L1) see Table 2-2.
Generalized structural trend of theDevonian volcanic belt
Subduction polarity
Chingiz Range
North
Tien ShanN
W E
S
B) Devonian
A) prior to Permo-Triassic block rotations
AL1
L2
G1
G2
North
Tien Shan
AL1
G1
Chingiz Range
L2
G2
AX
L3
G4G5
AX
G4
G5
L3
Mean declination of the Silurianmagnetization, corrected for post-Permian rotations.
K1K2
K2K1
Figure 2-10. Cartoon illustrating the relationship between the structural trends and the declinations of the primary Silurian and Devonian magnetizations for the time prior to Permo-Triassic small-block rotations (A) and for the inferred Devonian (B) configuration of the belt. For locations of the schematically represented limbs of the orocline and the sampling localities of the different studies, see Figure 2-2 and Table 2-2.
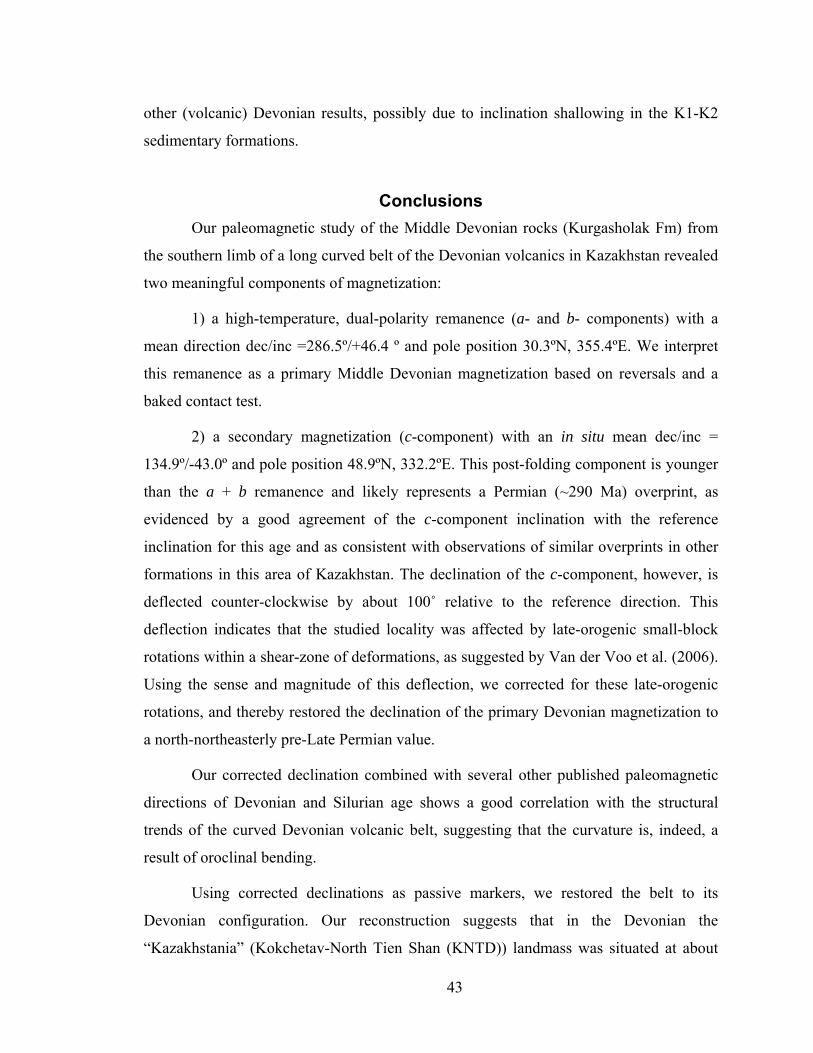
43
other (volcanic) Devonian results, possibly due to inclination shallowing in the K1-K2
sedimentary formations.
Conclusions Our paleomagnetic study of the Middle Devonian rocks (Kurgasholak Fm) from
the southern limb of a long curved belt of the Devonian volcanics in Kazakhstan revealed
two meaningful components of magnetization:
1) a high-temperature, dual-polarity remanence (a- and b- components) with a
mean direction dec/inc =286.5º/+46.4 º and pole position 30.3ºN, 355.4ºE. We interpret
this remanence as a primary Middle Devonian magnetization based on reversals and a
baked contact test.
2) a secondary magnetization (c-component) with an in situ mean dec/inc =
134.9º/-43.0º and pole position 48.9ºN, 332.2ºE. This post-folding component is younger
than the a + b remanence and likely represents a Permian (~290 Ma) overprint, as
evidenced by a good agreement of the c-component inclination with the reference
inclination for this age and as consistent with observations of similar overprints in other
formations in this area of Kazakhstan. The declination of the c-component, however, is
deflected counter-clockwise by about 100˚ relative to the reference direction. This
deflection indicates that the studied locality was affected by late-orogenic small-block
rotations within a shear-zone of deformations, as suggested by Van der Voo et al. (2006).
Using the sense and magnitude of this deflection, we corrected for these late-orogenic
rotations, and thereby restored the declination of the primary Devonian magnetization to
a north-northeasterly pre-Late Permian value.
Our corrected declination combined with several other published paleomagnetic
directions of Devonian and Silurian age shows a good correlation with the structural
trends of the curved Devonian volcanic belt, suggesting that the curvature is, indeed, a
result of oroclinal bending.
Using corrected declinations as passive markers, we restored the belt to its
Devonian configuration. Our reconstruction suggests that in the Devonian the
“Kazakhstania” (Kokchetav-North Tien Shan (KNTD)) landmass was situated at about
44
30˚N paleolatitude. The eastern margin of the landmass was delineated by a nearly
straight, northwest-southeast trending, ~1500 km long volcanic arc. The subduction
responsible for the volcanism was towards the southwest. The bending of this volcanic
arc into its present horse-shoe shape took place sometime between Middle Devonian and
the Late Permian. This ~ 180o post-Devonian bending of Kazakhstania provides
additional geometrical constraints on the changing positions of Baltica, Siberia and Tarim
during final stages of their convergence, which should be taken into consideration by
tectonic models dealing with the amalgamation of Eurasia.
Acknowledgements This study was supported by the Division of Earth Sciences and the Office of
International Science and Engineering's Eastern and Central Europe Program of the U.S.
National Science Foundation, grant EAR 0335882. Support was also derived from the
Russian Foundation of Basic Research, grants 04-05-64050 and 05-05-65105. Critical
reviews by anonymous and B. Natal’in are gratefully acknowledged.
References Abdullin, A.A., Volkov, V.M., Scherba, G.N. 1980. (eds.) Chu-Ili ore belt. Nauka,
Almaata, 503 p. (in Russian).
Alexyutin, M.V., Bachtadse, V., Alexeiev, D.V., Nikitina, O.I. 2005. Palaeomagnetism of Ordovician and Silurian rocks from the Chu-Yili and Kendyktas Mountains, South Kazakhstan . Geophysical Journal International, 162, 321-331.
Allen, M.B., Alsop, G.I., Zhemchuzhnikov, V.G. 2001. Dome and basin refolding and transpressive inversion along the Karatau fault system, southern Kazakstan. Journal of the Geological Society of London, 158, 83-95.
Bakhtiev, M.K. 1987. Paleozoic orogenic magmatic belts. Nauka, Moscow 168 p. (In Russian).
Bazhenov, M. L., Chauvin, A., Audibert, M., Levashova, N. M. 1993. Permian and Triassic paleomagnetism of the south-west Tien Shan: the timing and mode of tectonic rotations, Earth and Planetary Science Letters, 118, 195-212.
Bazhenov, M.L., Collins, A.Q., Degtyarev, K.E., Levashova, N.M., Mikolaichuk, A.V., Pavlov, V.E., Van der Voo, R. 2003. Paleozoic northward drift of the North Tien Shan (Central Asia) as revealed by Ordovician and Carboniferous paleomagnetism. Tectonophysics, 366, 113–141.
45
Burtman, V.S., Gurary, G.Z., Belenky, A.V., Kudasheva, I.A. 1998. Kazakhstan and the Altai in the Devonian: paleomagnetic evidence. Geotectonics, 6, 63–71.
Coleman, R.G. 1989. Continental growth of Northwest China. Tectonics, 8, 621-635.
Collins, A.Q., Degtyarev, K.E., Levashova, N.M., Bazhenov, M.L., Van der Voo, R. 2003. Early Paleozoic paleomagnetism of East Kazakhstan: implications for paleolatitudinal drift of tectonic elements within the Ural–Mongol belt. Tectonophysics, 377, 229– 247.
Debiche, M. G., Watson, G. S. 1995. Confidence limits and bias correction for estimating angles between directions with applications to paleomagnetism. Journal of Geophysical Research, 100, 24,405 – 24,429.
Degtyarev, K. E. 2003. The position of the Aktau-Junggar microcontinent in the Paleozoides of Central Kazakhstan. Geotectonics, 37 (4), 14-34.
Degtyarev, K. E., Ryazantsev, A. V. 1993. Geology of the orogenic Silurian and the structures with continuous sections in the Caledonides of Kazakhstan, in: E. E. Milanovsky (ed.) Geology and metallogeny of central Kazakhstan, Moscow, Nauka, 64-82 (in Russian).
Didenko, A.L., Mossakovsky, A.A., Pechersky, D.M., Ruzhentsev, S.V., Samygin, S.G., Kheraskova, T.N. 1994. Geodynamics of Paleozoic oceans of Central Asia. Geology and Geophysics, 35, 118– 145 (in Russian).
Dobretsov N. L., Berzin N. A., Buslov M. M. 1995. Opening and tectonic evolution of the Paleo-Asian ocean. International Geology Review, 37, 335-360.
Filippova, I.B., Bush, V.A., Didenko, A.N. 2001. Middle Paleozoic subduction belts: The leading factor in the formation of the Central Asian fold-and-thrust belt. Russian Journal of Earth Sciences, 3 (6) 405–426.
Fisher, R.A., 1953. Dispersion on a sphere. Proceedings of the Royal Society of London, A 217, 295– 305.
Grishin, D.V., Pechersky, D.M., and Degtyarev, K.E. 1997. Paleomagnetism and reconstruction of Middle Paleozoic structure of Central Kazakhstan. Geotectonics, 1, 71– 81.
Hoffman, K.A., and Day, R. 1978. Separation of multicomponent NRM: A general method. Earth and Planetary Science Letters, 40, 433-438.
Kirschvink, J.L. 1980. The least-square line and plane and the analysis of palaeomagnetic data. Geophysical Journal of the Royal Astronomical Society, 62, 699– 718.
Kurchavov, A.M. 1994. The lateral variability and evolution of orogenic volcanism in the fold belts. Geotectonics, 28, 3-18.
Levashova, N.M., Degtyarev, K.E., Bazhenov, M.L., Collins, A.Q., Van der Voo, R. 2003. Middle Paleozoic paleomagnetism of east Kazakhstan: post-Middle Devonian rotations in a large-scale orocline in the central Ural–Mongol belt. Tectonophysics, 377, 249–268.
46
Levashova, N.M., Mikolaichuk, A.V., McCausland, P.J.A, Bazhenov, M.L., Van der Voo, R. 2007. Devonian paleomagnetism of the North Tien Shan: Implications for the middle-late Paleozoic paleogeography of Eurasia, Earth and Planetary Science Letters, 257(1-2), 104-120..
Lyons, J.J., Coe, R.S., Zhao, X.-X., Renne, P.R., Kazansky, A.Y., Izokh, A.E., Kungurtsev, L.V., and Mitrokhin, D.V. 2002. Paleomagnetism of the Early Triassic Semeitau igneous series, E. Kazakhstan, Journal of Geophysical Research, 107 (B7), doi: 10.1029/2001JB000521.
McCausland, P.J.A., Bazhenov, M.L., Van der Voo, R., Degtyarev, K. E., and Levashova, N. M. 2005. Carboniferous paleomagnetic study of Zhemanty, Kendyktas block, Kazakhstan (Abstract), EOS – Transactions AGU, GP11A-0002.
McFadden, P.L., McElhinny, M.W. 1988. The combined analysis of remagnetization circles and direct observations in paleomagnetism. Earth and Planetary Science Letters, 87, 161– 172.
McFadden, P.L., McElhinny, M.W. 1990. Classification of the reversal test in paleomagnetism. Geophysical Journal International, 103, 725– 729.
Mossakovsky, A.A., Ruzhentsev, S.V., Samygin, S.G., Kheraskova, T.N. 1993. Central Asian fold belt: geodynamic evolution and formation. Geotectonics, 27 (6), 3– 32.
Natal’in, B.A., Şengör, A.M.C. 2005. Late Palaeozoic to Triassic evolution of the Turan and Scythian platforms: the pre-history of the palaeo-Tethyan closure, Tectonophysics, 404, 175-202.
Scotese, C.R. 2000. Atlas of Earth history, Paleomap Progress Report 90-0497, University of Texas at Arlington, 45 pp.
Şengör, A.M.C., Natal’in, B.A. 1996. Paleotectonics of Asia: fragments of a synthesis. In: Yin, A., Harrison, M. (Eds.), The Tectonic Evolution of Asia. Cambridge Univ. Press, Cambridge, pp. 486– 640.
Senkevich, M.A. 1991. In: Stratigraphic glossary of the USSR. New Paleozoic stratigraphic subdivisions of the USSR. Nedra, Leningrad. (In Russian).
Skrinnik, L.I., Horst, V.E. 1995. Devonian island arc volcanic complexes in the Junggar Alatau. Geology and exploration of Kazakhstan, 4, 6-10.
Tokmacheva, S.G., Paretsky, I.I., Palets, L.M. 1974. Upper Silurian and Devonian of western and southwestern Balkhash area and of south-east Betpak-Dala. In: Stratigraphy of Devonian, Carboniferous and Permian in Kazakhstan. Nauka, Almaty (In Russian).
Torsvik, T.H., Van der Voo, R., Meert, J.G., Mosar, J., Walderhaug, H.J. 2001. Reconstructions of the continents around the North Atlantic at about the 60th parallel. Earth and Planetary Science Letters, 187, 55-69.
Van der Voo, R. 1993. Paleomagnetism of the Atlantic, Tethys and Iapetus Oceans Cambridge Univ. Press, Cambridge. 411 pp.
47
Van der Voo, R. 2004. Paleomagnetism, oroclines and the growth of the continental crust, GSA Today, 14 (12), 4-9.
Van der Voo, R., Levashova, N.M., Skrinnik, L.I., Kara, T.V., Bazhenov, M.L. 2006. Late orogenic, large-scale rotations in the Tien Shan and adjacent mobile belts in Kyrgyzstan and Kazakhstan, Tectonophysics, 426, 335-360.
Windley, B.F., Alexeiev, D., Xiao, W.J., Kröner, A., and Badarch, G. 2007. Tectonic models for accretion of the Central Asian Orogenic Belt, Journal of the Geological Society of London, 164, 31-47.
Yakubchuk, A. 1997. Kazakhstan. In: Moores and Fairbridge (Eds), Encyclopedia of European and Asian regional geology. Chapman and Hall, London, pp. 450-465.
Zijderveld, J.D.A. 1967. AC demagnetization of rocks: analysis of results. In: Collinson, D.W., Creer, K.M. (Eds.), Methods in Paleomagnetism. Elsevier, Amsterdam, pp. 254– 286.
Zonenshain, L.P., Kuzmin, M.I., Natapov, L.M. 1990. Geology of the USSR: a plate tectonic synthesis. Ed. Page, B.M. AGU, Geodynamic series, volume 21. Washington, D.C., 250p.
48
Chapter 3
Paleomagnetism of mid-Paleozoic subduction-related volcanics from the Chingiz Range in NE Kazakhstan: The evolving
paleogeography of the amalgamating Eurasian composite continent
Abstract The tectonic and paleogeographic evolution of the Ural-Mongol belt between the
cratons of Baltica, Siberia, and Tarim is key to the formation of the Eurasian composite
continent during Paleozoic time, but the views on this complicated process remain very
disparate and sometimes controversial. A study of three volcanic formations of mid-
Silurian, Lower-to- Middle Devonian and Middle Devonian age from the southwestern
boundary of the Chingiz Range (NE Kazakhstan) yields what are interpreted as primary
paleomagnetic directions that help clarify the evolution of the belt. A single-polarity
characteristic component in mid-Silurian andesites yields a positive intraformational
conglomerate test, whereas dual-polarity prefolding components are isolated from the
two Devonian collections. Post-folding reversed-polarity overprint directions have also
been isolated, and are likely of Permo-Triassic age. These new data can be evaluated
together with previously published paleomagnetic results from Paleozoic rocks in the
Chingiz Range, and allow us to establish with confidence the polarity of each result, and
hence to determine the hemisphere in which the area was located at a given time. We
conclude that NE Kazakhstan was steadily moving northward, albeit with variable
velocity, crossing the equator in Silurian time. These new paleomagnetic data from the
Chingiz range also agree with and reinforce the hypothesis that the strongly curved
volcanic belts of Kazakhstan underwent oroclinal bending between Middle Devonian and
49
Middle Permian time. A comparison of the Chingiz paleolatitudes with those of Siberia
shows, insofar as the sparse data allow, similarities between the northward motion of the
Chingiz unit and that of Siberia, which imposes important constraints on the evolving
paleogeography of the Ural-Mongol belt.
50
Introduction Palinspastic reconstructions at various scales are a concise way to illustrate the
paleogeographic and tectonic evolution of an area, and a certain degree of consistency
between reconstructions proposed by different researchers can be expected, provided that
the extent of our knowledge is adequate. Unfortunately, this is not the situation for the
Ural-Mongol mobile belt (UMB) in Eurasia (Fig. 3-1). If one examines the different
published reconstructions of the UMB components, it would be difficult indeed (i.e.,
without carefully studying the figure captions), to understand that it is the same area that
is being illustrated. Names and component descriptions of the belt change from one
publication to the other, whereas the spatial relationships between mobile zones and older
Precambrian cratons range in distance over an order of magnitude or more, and may
reveal relative orientations varying by more than a hundred degrees. Thus, one can find a
slowly evolving flotilla of small fragments (Mossakovsky et al., 1993; Didenko et al.,
1994; Filippova et al., 2001), or a gradually coiling serpentine island arc (Şengör and
Natal'in, 1996; Yakubchuk et al., 2001; 2002), or an array of larger blocks that consume
surrounding oceans according to rules that change from author to author (Stampfli and
Borel, 2002; Puchkov, 1997; 2000). The co-existence of so many dissimilar models
strongly indicates that we lack even first-order knowledge about the paleogeography and
kinematics of the UMB constituents. Major cratons like Baltica, Siberia, and Tarim are
often the only recognizable features in these reconstructions, and even their positions
may be quite dissimilar – see the discussion in Cocks and Torsvik (2007) about the
Siberian late Paleozoic paleopoles.
Palinspastic reconstructions at various scales are a concise way to illustrate the
paleogeographic and tectonic evolution of an area, and a certain degree of consistency
between reconstructions proposed by different researchers can be expected.
Unfortunately, the different published reconstructions of the Ural-Mongol mobile belt
(UMB) in Eurasia (Fig. 3-1) are highly controvercial and even mutually exclusive (see,
for example Mossakovsky et al., 1993; Didenko et al., 1994; Filippova et al., 2001;
Şengör and Natal'in, 1996; Yakubchuk et al., 2001; 2002; Stampfli and Borel, 2002;
Puchkov, 1997; 2000).
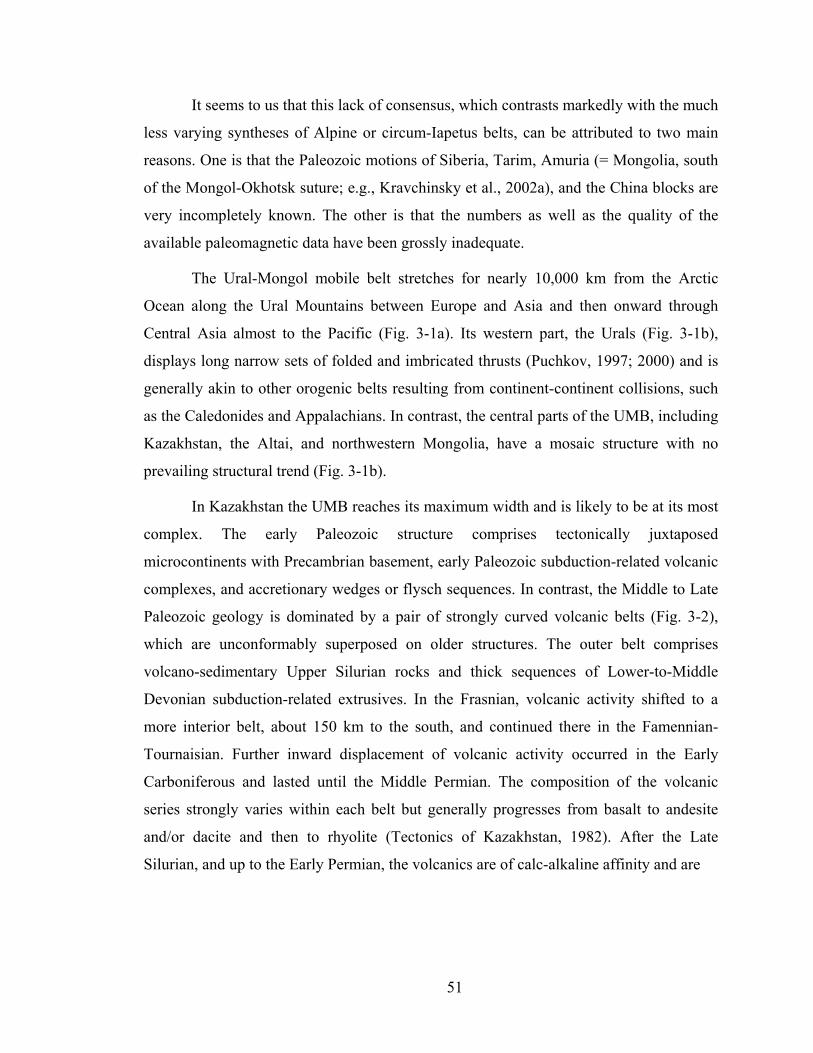
51
It seems to us that this lack of consensus, which contrasts markedly with the much
less varying syntheses of Alpine or circum-Iapetus belts, can be attributed to two main
reasons. One is that the Paleozoic motions of Siberia, Tarim, Amuria (= Mongolia, south
of the Mongol-Okhotsk suture; e.g., Kravchinsky et al., 2002a), and the China blocks are
very incompletely known. The other is that the numbers as well as the quality of the
available paleomagnetic data have been grossly inadequate.
The Ural-Mongol mobile belt stretches for nearly 10,000 km from the Arctic
Ocean along the Ural Mountains between Europe and Asia and then onward through
Central Asia almost to the Pacific (Fig. 3-1a). Its western part, the Urals (Fig. 3-1b),
displays long narrow sets of folded and imbricated thrusts (Puchkov, 1997; 2000) and is
generally akin to other orogenic belts resulting from continent-continent collisions, such
as the Caledonides and Appalachians. In contrast, the central parts of the UMB, including
Kazakhstan, the Altai, and northwestern Mongolia, have a mosaic structure with no
prevailing structural trend (Fig. 3-1b).
In Kazakhstan the UMB reaches its maximum width and is likely to be at its most
complex. The early Paleozoic structure comprises tectonically juxtaposed
microcontinents with Precambrian basement, early Paleozoic subduction-related volcanic
complexes, and accretionary wedges or flysch sequences. In contrast, the Middle to Late
Paleozoic geology is dominated by a pair of strongly curved volcanic belts (Fig. 3-2),
which are unconformably superposed on older structures. The outer belt comprises
volcano-sedimentary Upper Silurian rocks and thick sequences of Lower-to-Middle
Devonian subduction-related extrusives. In the Frasnian, volcanic activity shifted to a
more interior belt, about 150 km to the south, and continued there in the Famennian-
Tournaisian. Further inward displacement of volcanic activity occurred in the Early
Carboniferous and lasted until the Middle Permian. The composition of the volcanic
series strongly varies within each belt but generally progresses from basalt to andesite
and/or dacite and then to rhyolite (Tectonics of Kazakhstan, 1982). After the Late
Silurian, and up to the Early Permian, the volcanics are of calc-alkaline affinity and are
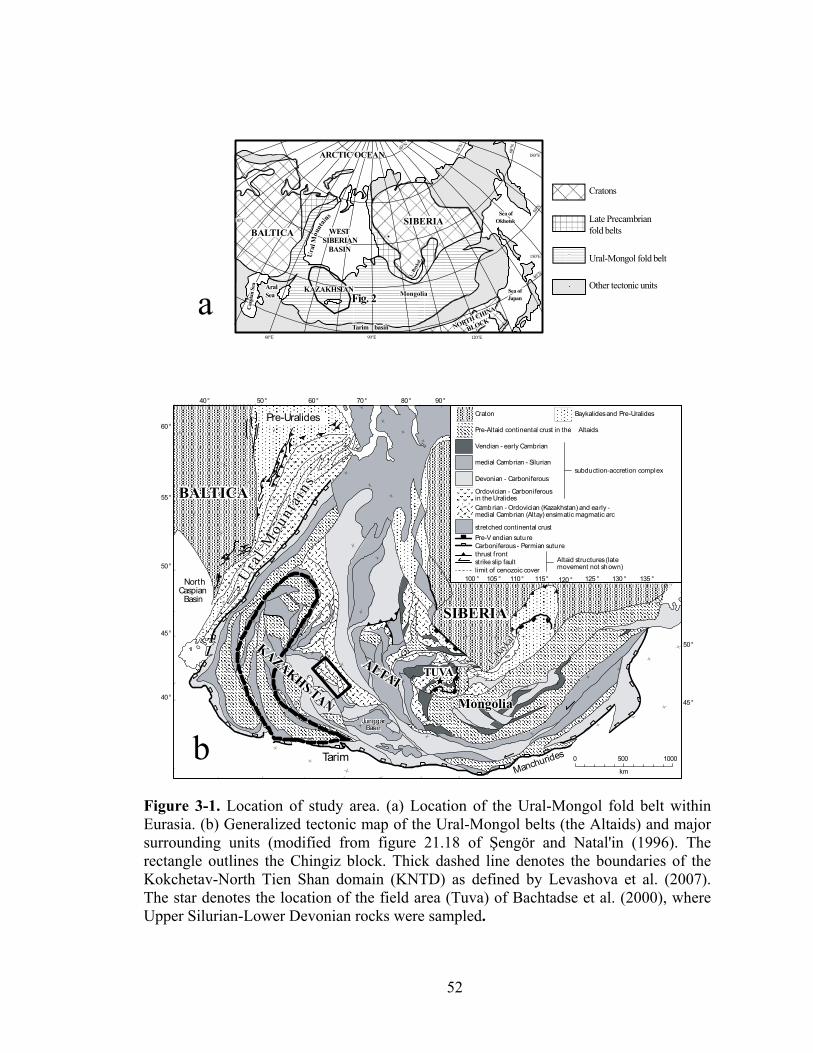
52
60°E 90°E 120°E
150°E
180°E
70°N
60°N
50°N
40°N
Cratons
Late Precambrianfold belts
Ural-Mongol fold belt
Other tectonic units
b
a KAZAKHSTAN
100 ° 105 ° 110° 115° 120 ° 125 ° 130 ° 135 °
Pre-Uralides Craton
Ordovician - Carboniferousin the UralidesCambrian - Ordovician (Kazakhstan) and early -medial Cambrian (Altay) ensimatic magmatic arc
Baykalides and Pre-Uralides
stretched continental crust
Pre-Altaid continental crust in the Altaids
Devonian - Carboniferous
medial Cambrian - Silurian
Vendian - early Cambrian
Pre-V endian sutureCarboniferous - Permian suturethrust f rontstrike slip faultlimit of cenozoic cover
Altaid structures (latemovement not shown)
subduction-accretion complex
km
0 500 1000
ManchuridesTarim
NorthCaspian
Basin
60°
55°
50°
45°
40°
40° 50° 60° 70° 80° 90°
BALTICA
BALTICA
SIBERIA
SIBERIA
ALTAITUVA
Fig. 2
Ura
l Mou
n ta i
ns
Cas
pian
Sea Aral
Sea
L. B
ayka
l
WESTSIBERIAN
BASIN
ARCTIC OCEAN
Sea ofOkhotsk
Sea ofJapan
30°E
80°N
Tarim basin
Mongolia
NORTH CHINA
BLOCK
Mongolia
L. Bayk
al
JunggarBasin
KAZAKHSTAN
50°
45°
Figure 3-1. Location of study area. (a) Location of the Ural-Mongol fold belt within Eurasia. (b) Generalized tectonic map of the Ural-Mongol belts (the Altaids) and major surrounding units (modified from figure 21.18 of Şengör and Natal'in (1996). The rectangle outlines the Chingiz block. Thick dashed line denotes the boundaries of the Kokchetav-North Tien Shan domain (KNTD) as defined by Levashova et al. (2007). The star denotes the location of the field area (Tuva) of Bachtadse et al. (2000), where Upper Silurian-Lower Devonian rocks were sampled.
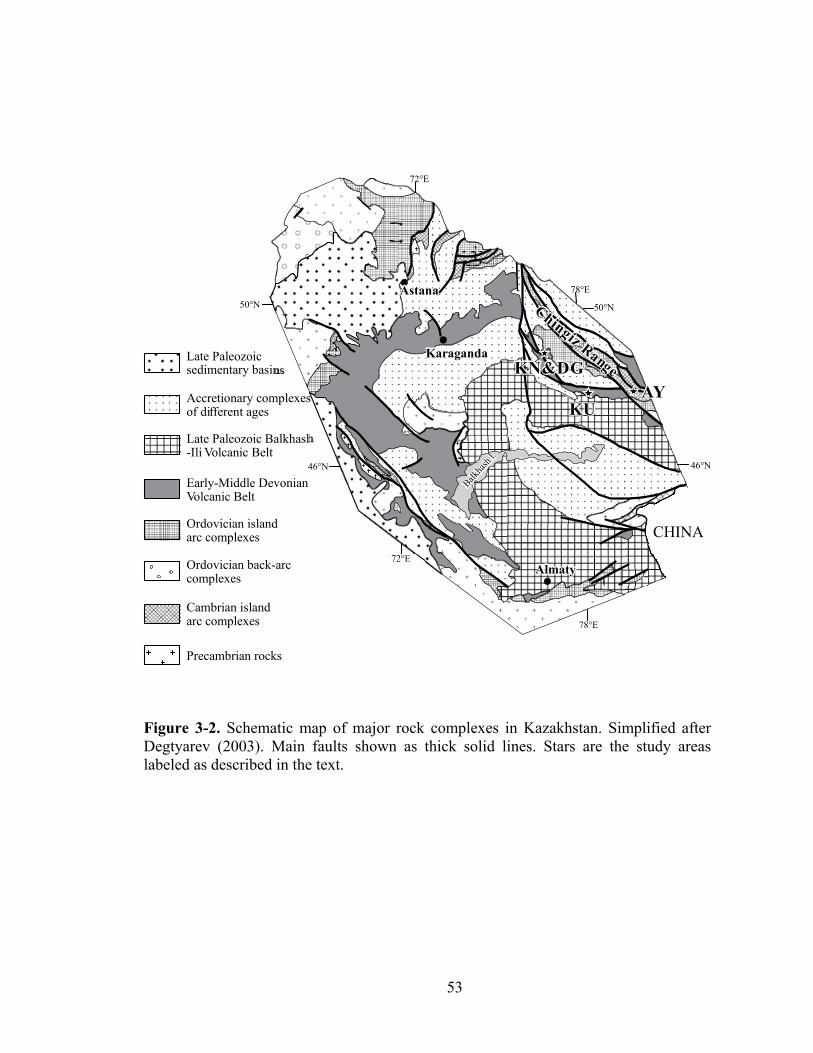
53
34
56
7
8
10
11
Late Paleozoic Balkhash-Ili Volcanic Belt
Early-Middle DevonianVolcanic Belt
Late Paleozoicsedimentary basins
CHINA
Balkha
sh l.
Ordovician islandarc complexes
Almaty
46°N
50°N50°N
46°N
72°E
78°E
78°E
72°E
Cambrian islandarc complexes
Accretionary complexesof different ages
Ordovician back-arccomplexes
Precambrian rocks
Karaganda
Astana
Balkha
sh l.
Almaty
Karaganda
AstanaChingiz Range
Chingiz RangeAY
KU
KN&DGAY
KU
KN&DG
Figure 3-2. Schematic map of major rock complexes in Kazakhstan. Simplified after Degtyarev (2003). Main faults shown as thick solid lines. Stars are the study areas labeled as described in the text.
54
considered to be of subduction-related origin (Kurchavov, 1994; Tevelev, 2001).
Volcanic activity lasted for about 150 Ma, while terrigenous sedimentation continued
more and more to the interior side of the loop-like belts. As a result, Late Devonian to
late Paleozoic volcanics overlie Silurian and Early Devonian flysch series and
accretionary wedges.
To remedy the scarcity of paleomagnetic data, we have initiated a program in the
last seven years to obtain temporal sequences of paleomagnetic results for a significant
time interval for key tectonic units of Kazakhstan’s UMB. This program is not yet
completed, except for one major tectonic unit, which is the Kokchetav-North Tien Shan
domain (KNTD; Levashova et al., 2007). The KNTD stretches from north Tarim to
almost the West Siberian Basin and is outlined by a thick dashed contour in Figure 3-1b.
It comprises several Precambrian microcontinents and numerous remnants of early
Paleozoic island arcs, marginal basins and accretionary wedges. It is thought that in the
Late Ordovician these units had amalgamated into a contiguous domain (Levashova et
al., 2007). Nine paleomagnetic results from the KNTD have been combined to show its
latitudinal motion from the Late Ordovician until the Late Permian; the data support the
concept of a more or less coherent motion of the KNTD and Baltica (Levashova et al.,
2007), and imply that Baltica and the KNTD were never very far apart after the Silurian.
A similar program (Collins et al., 2003; Levashova et al., 2003a, b) was started in
the Chingiz Range, which stretches for more than 600 km in northeast Kazakhstan (Fig.
3-2). These reports noted acceptable, albeit temporally incomplete, agreement of the
observed paleolatitudes with the Siberian reference values for the early Paleozoic,
followed by a disparity in the middle Paleozoic. Although the possibility of coherent
motion of the Chingiz arc and the Siberian craton was discussed in these papers (Collins
et al., 2003; Levashova et al., 2003a), a conclusion remained rather elusive due to large
time gaps between the results, poor quality of the Devonian data (Levashova et al.,
2003a), and the lack of reliable middle and late Paleozoic poles for the Siberian plate,
except for the about 360 Ma old pole of Kravchinsky et al. (2002b). To fill the gap in
temporal coverage in NE Kazakhstan, we present here three new paleomagnetic results
from Middle Silurian and Lower to Middle Devonian rocks of the Chingiz area and
55
compare these with the available data from SW Kazakhstan, Kyrgyzstan, Siberia, and
Baltica. This will allow us to determine the paleolatitudinal movements of the tectonic
units in this area and to place constraints on the tectonic evolution of the UMB.
Geological Setting and Sampling The Chingiz Range sensu stricto is a tectonic unit that extends for about 600 km
in a NW-SE direction in northeastern Kazakhstan (Fig. 3-2). It contains Cambrian to
Early Silurian volcanic series of island-arc affinity (Degtyarev, 1999), some of which
were studied by us earlier (Collins et al., 2003; Levashova et al., 2003a). No accretionary
complexes of Cambrian or Tremadocian age are known in this area. In contrast,
Arenigian to Late Ordovician accretionary complexes and Middle Ordovician to Early
Silurian flysch sequences are widespread and become progressively younger from the
northeast to the southwest. After the Middle Ordovician, the ages of volcanic series also
show a younging trend from NE towards the SW.
The lower Paleozoic rocks of the Chingiz unit do not contain continent-derived
sediments, so that it is regarded as an intra-oceanic arc (Degtyarev, 1999). Most authors
agree that subduction under the Chingiz island arc was from the southwest to the
northeast (in present-day coordinates) since the Middle Ordovician. Recently, detailed
mapping coupled with new age determinations and restoration of displacements along the
abundant strike-slip faults provided evidence that the polarity of the arc has remained the
same since the Cambrian (Degtyarev and Tolmacheva, 2005), although other authors
earlier hypothesized a reversal of subduction in the Early Ordovician (Samygin, 1974;
Zonenshain et al., 1990). By the end of Early Silurian time, volcanism diminished in the
Chingiz Range; the overlying Upper Silurian redbeds only locally and rarely contain lava
flows or tuffaceous members. In a few places, these redbeds reside on older rocks with a
pronounced angular unconformity, although elsewhere this unconformity is absent
(Degtyarev and Ryazantsev, 1993). These authors also note that the pattern of younger
Devonian volcanism generally follows the spatial distribution of the Upper Silurian
sediments.
56
In Early Devonian time, a renewed outburst of volcanism took place in many
areas of Kazakhstan. The most active volcanism is confined to a relatively narrow
horseshoe-shaped band (the Early-Middle Devonian volcanic belt in Fig. 3-2), which was
recognized several decades ago (Bogdanov, 1965). Generally, this belt follows the
boundary between the older (“Caledonian”) structures outside of the horseshoe and the
younger (“Variscan”) fold belt inside it. In the Chingiz area sensu lato, this volcanism is
of mid-Lochkovian age (Schegoleva et al., 1993) and is located generally to the SW of
the early Paleozoic and Silurian island-arc complexes (Fig. 3-2). These Devonian
volcanics of the northeastern arm of the belt partly overlap, and generally parallel the
older Chingiz structures. Volcanic activity in this belt lasted until the Givetian, whereas
Late Devonian and Tournaisian volcanics are scarce or absent altogether in this Range.
In the Visean, volcanism resumed and lasted until the Late Permian (Sal'menova
and Koshkin, 1990); the resulting late Paleozoic volcanic belt (see Fig. 3-2) is called the
Balkhash-Ili belt. Both the Devonian and the Balkhash-Ili belts are usually considered as
Andean-type active margins with subduction under them directed away from the
horseshoe interior; however, the views on the evolution of these belts, their strongly
curved outlines in particular, are controversial (Kurchavov, 2001; Tevelev, 2001).
Judging by numerous angular unconformities in the Chingiz island-arc sequence and
adjacent parts of the volcanic belts, multiple late Paleozoic deformation events affected
the area. For our purposes, we need to mention the post-Early Silurian, post-Givetian,
Visean and Late Permian events. As noted above, however, the magnitude of each
deformation varies laterally, and the deformation pattern is not uniform (Degtyarev and
Ryazantsev, 1993).
On the whole, the Chingiz island arc of intra-oceanic setting was active for more
than 100 million years (Degtyarev, 1999). The clear reduction in the volcanism during
the later Silurian may indicate either greatly diminished subduction, or a major
reorganization of the plate boundary system. Regardless, subduction-related volcanism
resumed at the Andean-type active margin in Early Devonian time and lasted well into
the Permian (Tevelev, 2001, and references therein).
57
Our study concentrated on mid-Silurian volcanic rocks of the Chingiz island arc
and Devonian rocks of the Devonian volcanic belt from the southwestern part of the
Chingiz area. Brief descriptions follow, using the two-letter abbreviations that we use to
identify the sampling areas (see labels in Fig. 3-2).
Locality AY (=Ayaguz; 48.0°N, 80.7°E) Marine sediments are covered by andesite flows at this section. The youngest
fossiliferous sediments, of late Wenlockian- early Ludlovian age, occur below the base of
the volcanic pile, so we can consider the volcanic rocks as of Ludlovian age. We sampled
12 lava flows with clear flow contacts in a SE-dipping monocline; the total true thickness
studied is more than 200 meters. Bedding attitudes were measured on several
sedimentary layers intercalated with the volcanics. Also sampled were 20 lava cobbles
from two conglomerate members between lava flows. We should add that, except for one
strongly weathered flow, we studied all cooling units at this section, and no other Silurian
volcanics are present within a reasonable distance from it.
Localities KN & DG (Kaynar-Dogolan; 49.5°N, 77.0°E) Lower to lower-Middle Devonian volcanics and tuffs of basaltic to rhyolitic
composition were sampled from a bowl-like syncline and from three adjacent but
separate monoclines with different attitudes up to 15 km apart. Lava flows and tuffs were
sampled at 44 sites. Bedding attitudes could usually be measured on stratified tuffs and
sediments, although occasionally bedding had to be obtained from flow contacts.
Locality KU (Kurbakanas; 48.3°N, 78.3°E) Givetian basalts with sparse interbeds of sediments occupy a large area but, due to
low relief, are rather poorly exposed. Earlier, Levashova et al. (2003a) studied five flow
units (sites) from a section distributed about a single sedimentary layer. We re-visited this
area and sampled 13 more sites from basaltic flows with varying attitudes. All sampled
sites are within twenty meters from sedimentary layers.
58
Methods Generally, a set of samples collected from a separate cooling unit was called a
site, wherever practical in terms of numbers and spatial distribution. Paleomagnetic
samples were collected either as fist-sized blocks oriented with a magnetic compass, or
were drilled with a portable drill and oriented with a magnetic or sun compass. Our
convention is to label a site using the letters/numbers of its first sample but with a capital
letter at the beginning; for instance, site N3814 contains samples n3814 through n3819,
followed by site N3820, and so forth.
Cubic specimens of 8 cm3 volume were sawed from hand blocks; cores were
sliced into 22 mm long cylinders. The collection was studied in the paleomagnetic
laboratories of the Geological Institute of the Russian Academy of Sciences in Moscow
and of the University of Michigan in Ann Arbor. In Moscow, specimens were heated in a
homemade oven with internal residual fields of approximately 10 nT and measured with
a JR-4 spinner magnetometer with a noise level of 0.05 mA/m. In Ann Arbor, specimens
were stepwise demagnetized utilizing an Analytical Services TD-48 thermal
demagnetizer with internal residual fields of < 10 nT; magnetizations were measured with
a 2G Enterprises cryogenic magnetometer in a magnetically shielded room. In both
laboratories, the specimens were stepwise demagnetized in 15-20 increments up to
680○C. No systematic difference was found between the samples that were treated in
Moscow or Ann Arbor, and the data have been pooled.
Demagnetization results were plotted in orthogonal vector diagrams (Zijderveld,
1967). Visually identified linear trajectories were used to determine directions of
magnetic components by Principal Component Analysis (PCA), employing a least-
squares fit comprising three or more demagnetization steps (Kirschvink, 1980), anchoring
the fitting lines to the origin where appropriate.
If complete component separation is not achieved during demagnetization, the
common practice is to combine the PCA-calculated sample directions (Kirschvink, 1980)
and remagnetization circles employing the technique of McFadden and McElhinny
(1988). When this was the case, remagnetization circles were combined with direct
observations for computing site-means of both lower- and higher-temperature
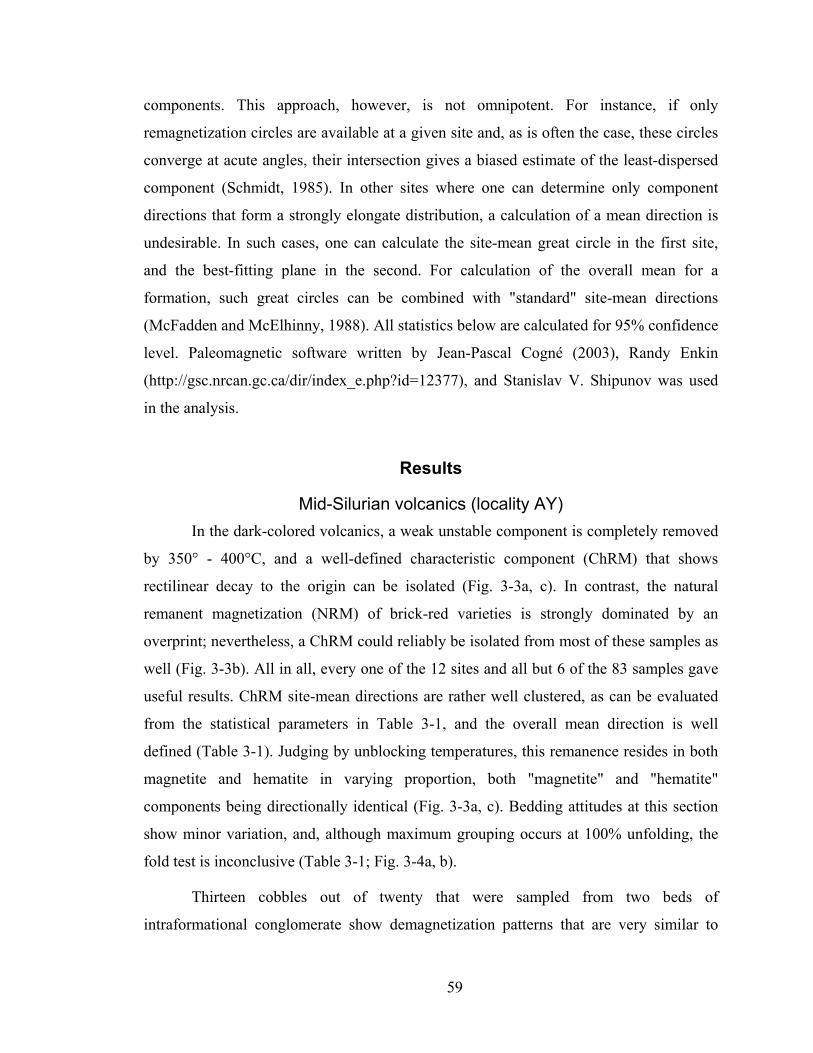
59
components. This approach, however, is not omnipotent. For instance, if only
remagnetization circles are available at a given site and, as is often the case, these circles
converge at acute angles, their intersection gives a biased estimate of the least-dispersed
component (Schmidt, 1985). In other sites where one can determine only component
directions that form a strongly elongate distribution, a calculation of a mean direction is
undesirable. In such cases, one can calculate the site-mean great circle in the first site,
and the best-fitting plane in the second. For calculation of the overall mean for a
formation, such great circles can be combined with "standard" site-mean directions
(McFadden and McElhinny, 1988). All statistics below are calculated for 95% confidence
level. Paleomagnetic software written by Jean-Pascal Cogné (2003), Randy Enkin
(http://gsc.nrcan.gc.ca/dir/index_e.php?id=12377), and Stanislav V. Shipunov was used
in the analysis.
Results
Mid-Silurian volcanics (locality AY) In the dark-colored volcanics, a weak unstable component is completely removed
by 350° - 400°C, and a well-defined characteristic component (ChRM) that shows
rectilinear decay to the origin can be isolated (Fig. 3-3a, c). In contrast, the natural
remanent magnetization (NRM) of brick-red varieties is strongly dominated by an
overprint; nevertheless, a ChRM could reliably be isolated from most of these samples as
well (Fig. 3-3b). All in all, every one of the 12 sites and all but 6 of the 83 samples gave
useful results. ChRM site-mean directions are rather well clustered, as can be evaluated
from the statistical parameters in Table 3-1, and the overall mean direction is well
defined (Table 3-1). Judging by unblocking temperatures, this remanence resides in both
magnetite and hematite in varying proportion, both "magnetite" and "hematite"
components being directionally identical (Fig. 3-3a, c). Bedding attitudes at this section
show minor variation, and, although maximum grouping occurs at 100% unfolding, the
fold test is inconclusive (Table 3-1; Fig. 3-4a, b).
Thirteen cobbles out of twenty that were sampled from two beds of
intraformational conglomerate show demagnetization patterns that are very similar to
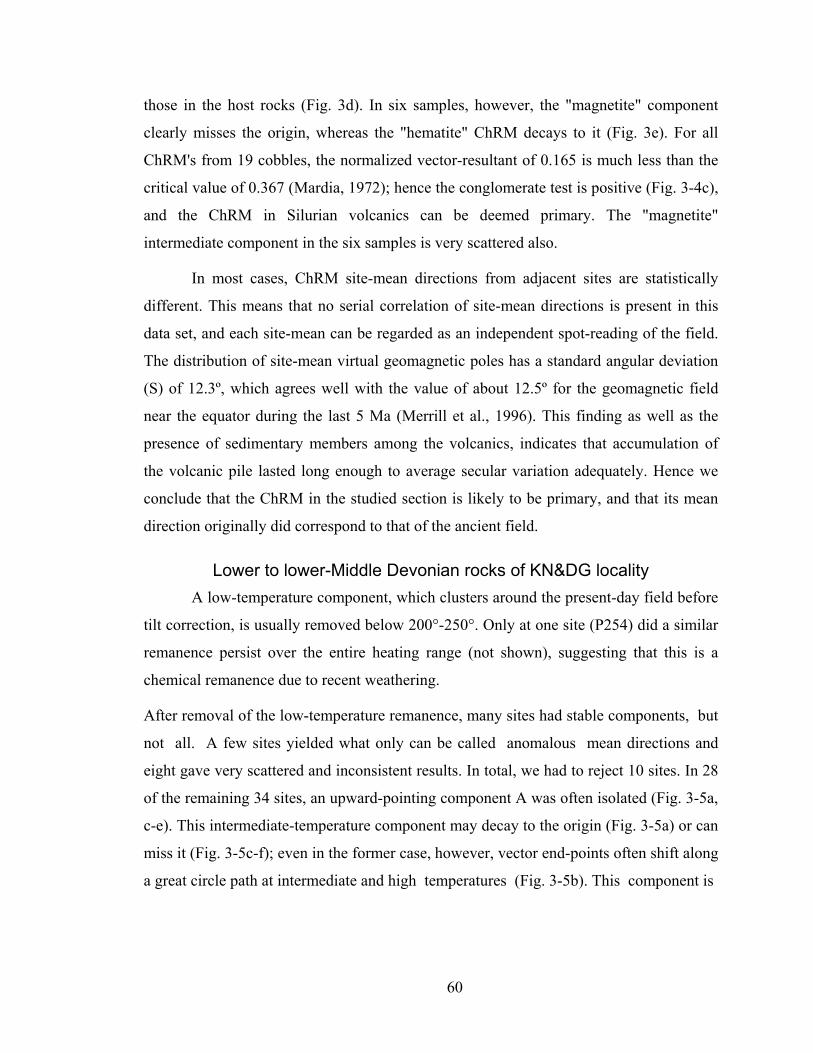
60
those in the host rocks (Fig. 3d). In six samples, however, the "magnetite" component
clearly misses the origin, whereas the "hematite" ChRM decays to it (Fig. 3e). For all
ChRM's from 19 cobbles, the normalized vector-resultant of 0.165 is much less than the
critical value of 0.367 (Mardia, 1972); hence the conglomerate test is positive (Fig. 3-4c),
and the ChRM in Silurian volcanics can be deemed primary. The "magnetite"
intermediate component in the six samples is very scattered also.
In most cases, ChRM site-mean directions from adjacent sites are statistically
different. This means that no serial correlation of site-mean directions is present in this
data set, and each site-mean can be regarded as an independent spot-reading of the field.
The distribution of site-mean virtual geomagnetic poles has a standard angular deviation
(S) of 12.3º, which agrees well with the value of about 12.5º for the geomagnetic field
near the equator during the last 5 Ma (Merrill et al., 1996). This finding as well as the
presence of sedimentary members among the volcanics, indicates that accumulation of
the volcanic pile lasted long enough to average secular variation adequately. Hence we
conclude that the ChRM in the studied section is likely to be primary, and that its mean
direction originally did correspond to that of the ancient field.
Lower to lower-Middle Devonian rocks of KN&DG locality A low-temperature component, which clusters around the present-day field before
tilt correction, is usually removed below 200°-250°. Only at one site (P254) did a similar
remanence persist over the entire heating range (not shown), suggesting that this is a
chemical remanence due to recent weathering.
After removal of the low-temperature remanence, many sites had stable components, but
not all. A few sites yielded what only can be called anomalous mean directions and
eight gave very scattered and inconsistent results. In total, we had to reject 10 sites. In 28
of the remaining 34 sites, an upward-pointing component A was often isolated (Fig. 3-5a,
c-e). This intermediate-temperature component may decay to the origin (Fig. 3-5a) or can
miss it (Fig. 3-5c-f); even in the former case, however, vector end-points often shift along
a great circle path at intermediate and high temperatures (Fig. 3-5b). This component is
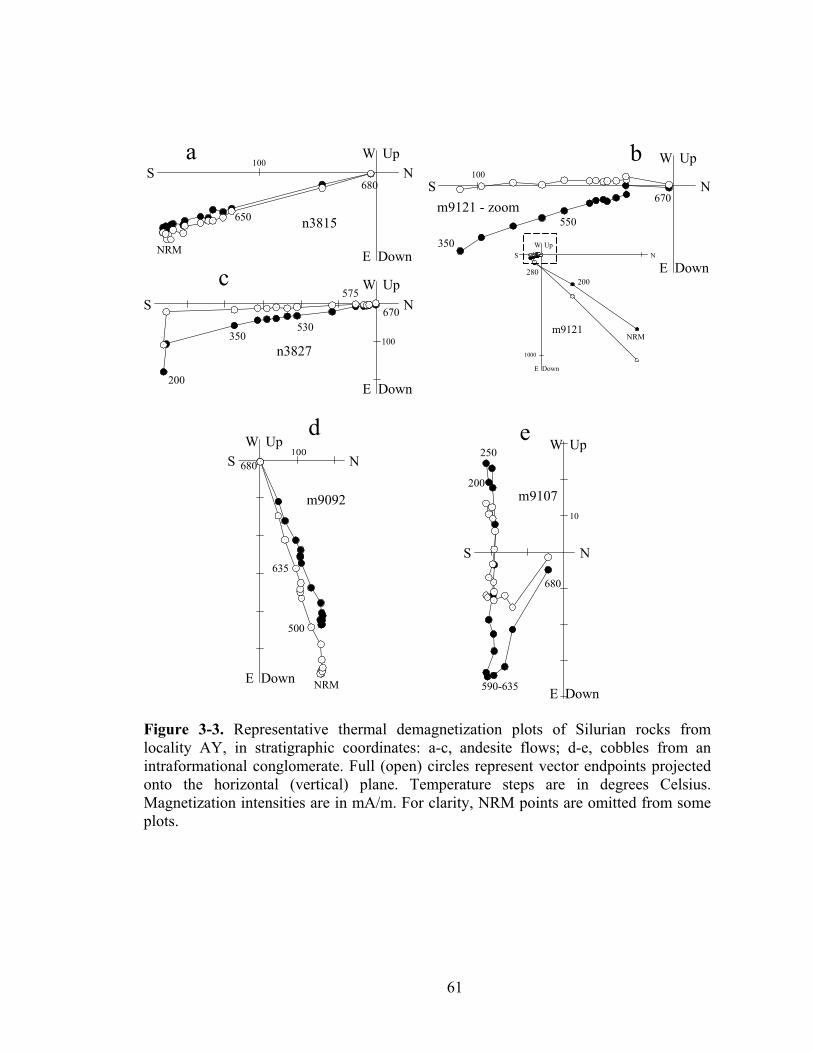
61
W UpN
E Down
S
n3815
W UpN
E Down
S
n3827
W Up
N
E Down
Sm9121 - zoom
W UpN
E Down
S
m9121
100
100 NRM
200280
1000
100
200
350530
575
670
680
650
NRM 350
550
670
W UpN
E Down
S
m9092
W Up
N
E Down
S
m910710
680
635
500
NRM
200
250
590-635
680
a b
c
d e
Figure 3-3. Representative thermal demagnetization plots of Silurian rocks from locality AY, in stratigraphic coordinates: a-c, andesite flows; d-e, cobbles from an intraformational conglomerate. Full (open) circles represent vector endpoints projected onto the horizontal (vertical) plane. Temperature steps are in degrees Celsius. Magnetization intensities are in mA/m. For clarity, NRM points are omitted from some plots.
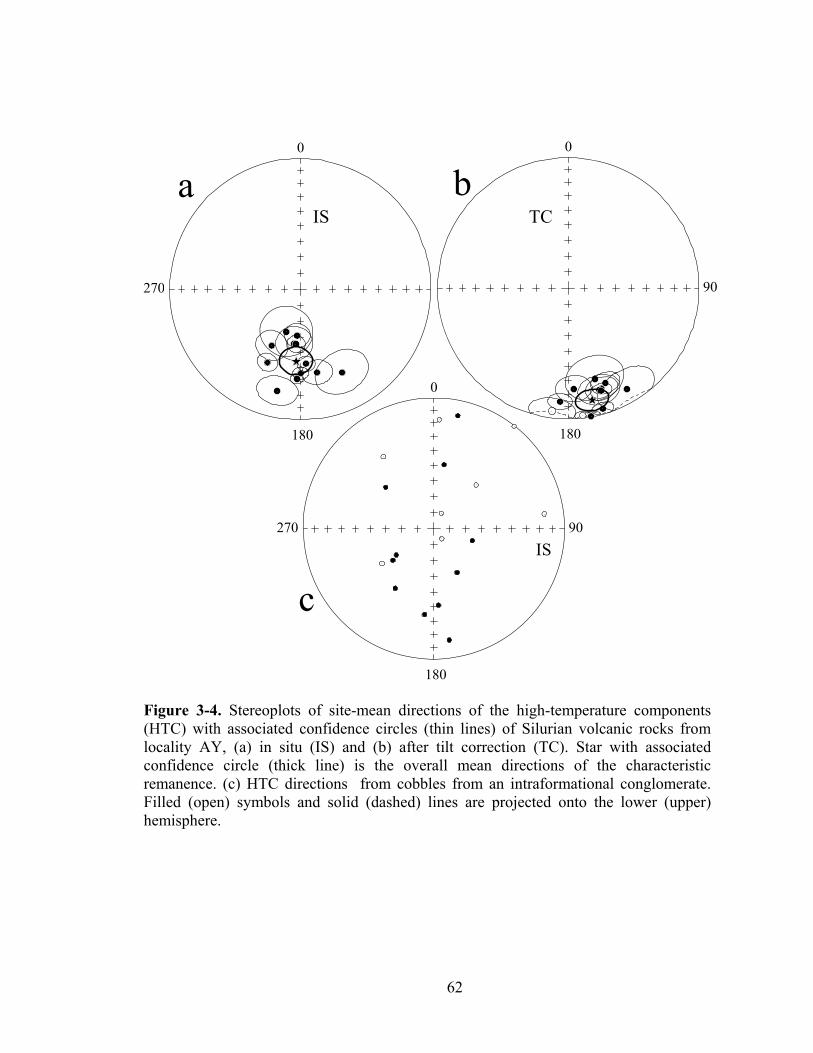
62
0
180
270
0
90
180
IS TCa b
cIS
0
90
180
270
Figure 3-4. Stereoplots of site-mean directions of the high-temperature components (HTC) with associated confidence circles (thin lines) of Silurian volcanic rocks from locality AY, (a) in situ (IS) and (b) after tilt correction (TC). Star with associated confidence circle (thick line) is the overall mean directions of the characteristic remanence. (c) HTC directions from cobbles from an intraformational conglomerate. Filled (open) symbols and solid (dashed) lines are projected onto the lower (upper) hemisphere.
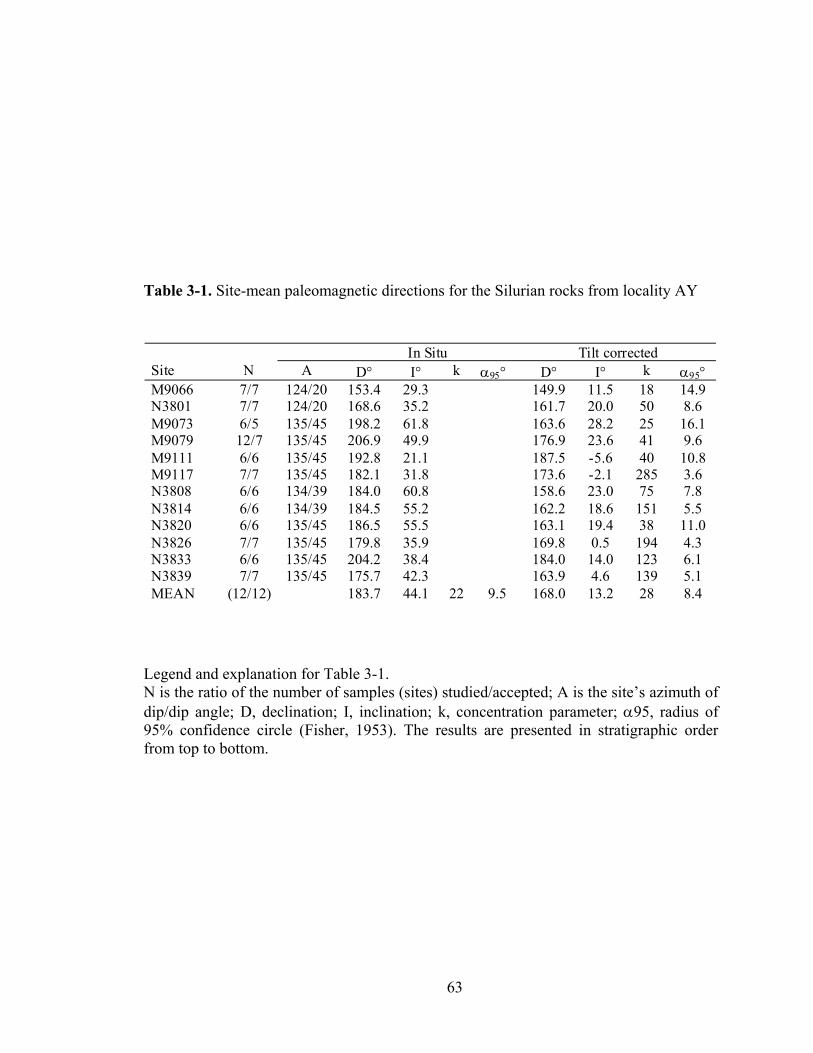
63
Table 3-1. Site-mean paleomagnetic directions for the Silurian rocks from locality AY
In Situ Tilt corrected Site N A D° I° k α95° D° I° k α95° M9066 7/7 124/20 153.4 29.3 149.9 11.5 18 14.9 N3801 7/7 124/20 168.6 35.2 161.7 20.0 50 8.6 M9073 6/5 135/45 198.2 61.8 163.6 28.2 25 16.1 M9079 12/7 135/45 206.9 49.9 176.9 23.6 41 9.6 M9111 6/6 135/45 192.8 21.1 187.5 -5.6 40 10.8 M9117 7/7 135/45 182.1 31.8 173.6 -2.1 285 3.6 N3808 6/6 134/39 184.0 60.8 158.6 23.0 75 7.8 N3814 6/6 134/39 184.5 55.2 162.2 18.6 151 5.5 N3820 6/6 135/45 186.5 55.5 163.1 19.4 38 11.0 N3826 7/7 135/45 179.8 35.9 169.8 0.5 194 4.3 N3833 6/6 135/45 204.2 38.4 184.0 14.0 123 6.1 N3839 7/7 135/45 175.7 42.3 163.9 4.6 139 5.1 MEAN (12/12) 183.7 44.1 22 9.5 168.0 13.2 28 8.4
Legend and explanation for Table 3-1. N is the ratio of the number of samples (sites) studied/accepted; A is the site’s azimuth of dip/dip angle; D, declination; I, inclination; k, concentration parameter; α95, radius of 95% confidence circle (Fisher, 1953). The results are presented in stratigraphic order from top to bottom.
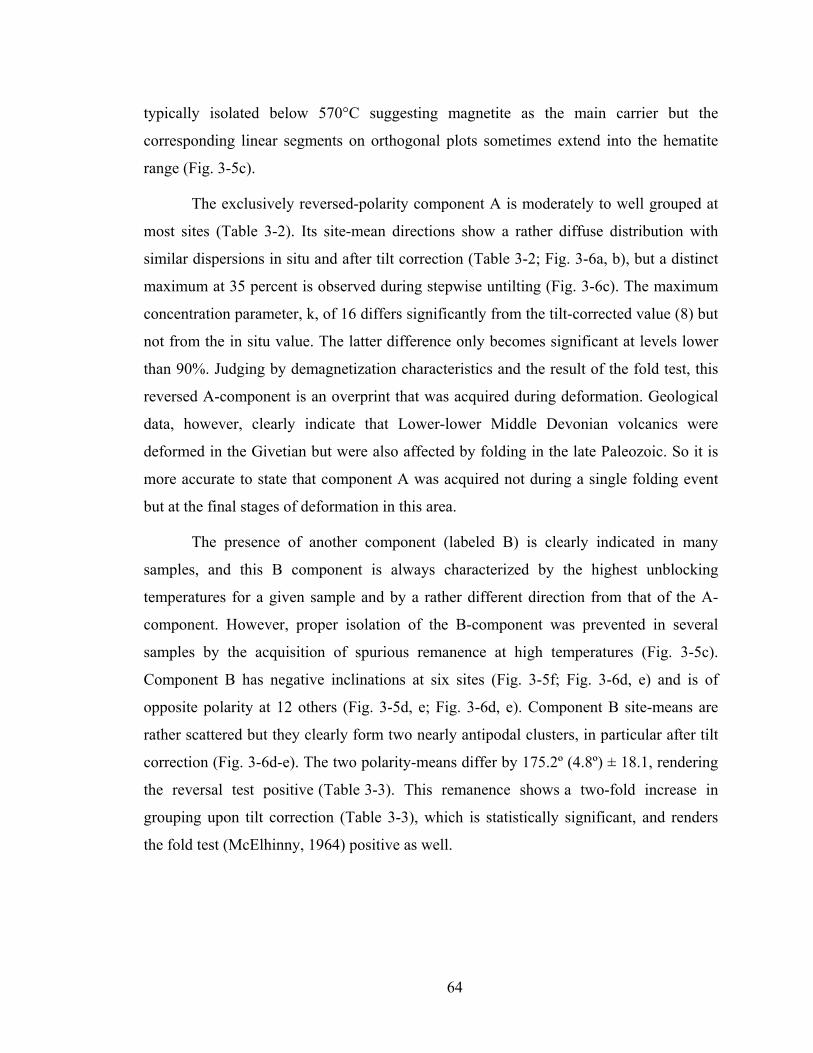
64
typically isolated below 570°C suggesting magnetite as the main carrier but the
corresponding linear segments on orthogonal plots sometimes extend into the hematite
range (Fig. 3-5c).
The exclusively reversed-polarity component A is moderately to well grouped at
most sites (Table 3-2). Its site-mean directions show a rather diffuse distribution with
similar dispersions in situ and after tilt correction (Table 3-2; Fig. 3-6a, b), but a distinct
maximum at 35 percent is observed during stepwise untilting (Fig. 3-6c). The maximum
concentration parameter, k, of 16 differs significantly from the tilt-corrected value (8) but
not from the in situ value. The latter difference only becomes significant at levels lower
than 90%. Judging by demagnetization characteristics and the result of the fold test, this
reversed A-component is an overprint that was acquired during deformation. Geological
data, however, clearly indicate that Lower-lower Middle Devonian volcanics were
deformed in the Givetian but were also affected by folding in the late Paleozoic. So it is
more accurate to state that component A was acquired not during a single folding event
but at the final stages of deformation in this area.
The presence of another component (labeled B) is clearly indicated in many
samples, and this B component is always characterized by the highest unblocking
temperatures for a given sample and by a rather different direction from that of the A-
component. However, proper isolation of the B-component was prevented in several
samples by the acquisition of spurious remanence at high temperatures (Fig. 3-5c).
Component B has negative inclinations at six sites (Fig. 3-5f; Fig. 3-6d, e) and is of
opposite polarity at 12 others (Fig. 3-5d, e; Fig. 3-6d, e). Component B site-means are
rather scattered but they clearly form two nearly antipodal clusters, in particular after tilt
correction (Fig. 3-6d-e). The two polarity-means differ by 175.2º (4.8º) ± 18.1, rendering
the reversal test positive (Table 3-3). This remanence shows a two-fold increase in
grouping upon tilt correction (Table 3-3), which is statistically significant, and renders
the fold test (McElhinny, 1964) positive as well.
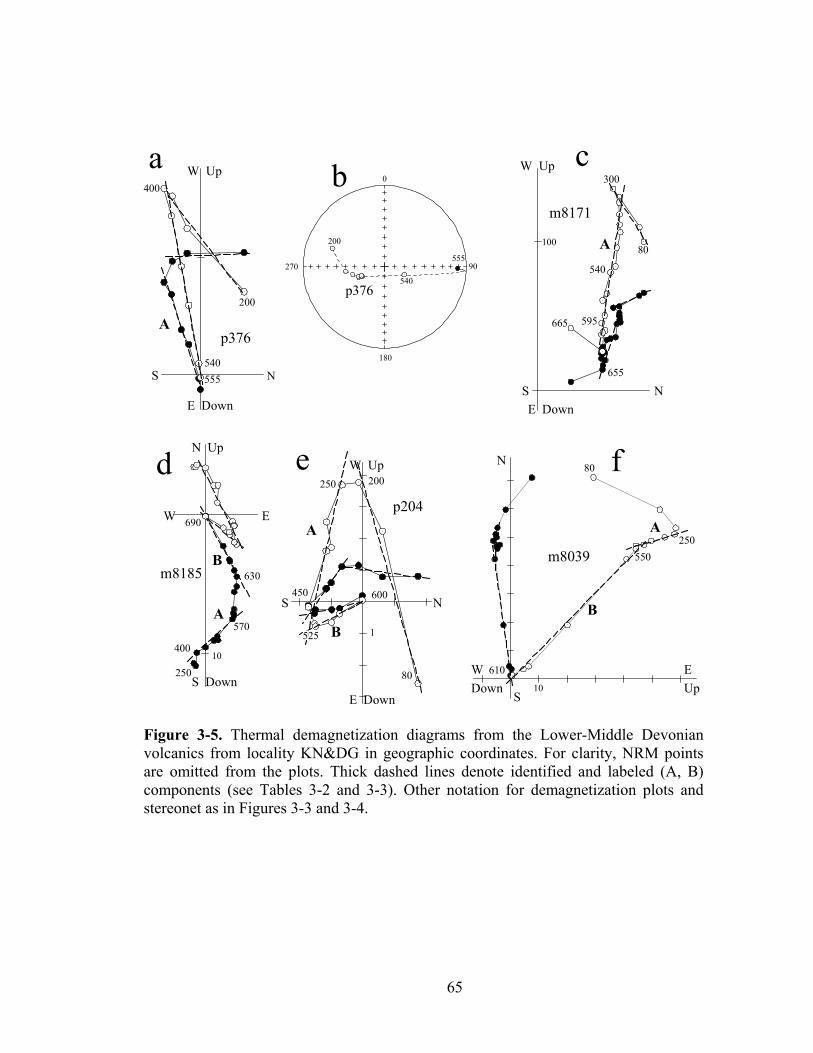
65
W Up
N
E Down
S
p376
0
90
180
m8185
10
10
100
1
W Up
N
E Down
S
p204
A
A
AB
B
B
200
80200
400
540
540
555
555
p376
a b c
d f
80
20025080
450 600
525
250
400
570
690
630
e
W Up
NE Down
S
m8171
300
655
665
540
595
A A
m8039250
550
610
270
N Up
E
S Down
W
N
EUp
S
WDown
Figure 3-5. Thermal demagnetization diagrams from the Lower-Middle Devonian volcanics from locality KN&DG in geographic coordinates. For clarity, NRM points are omitted from the plots. Thick dashed lines denote identified and labeled (A, B) components (see Tables 3-2 and 3-3). Other notation for demagnetization plots and stereonet as in Figures 3-3 and 3-4.
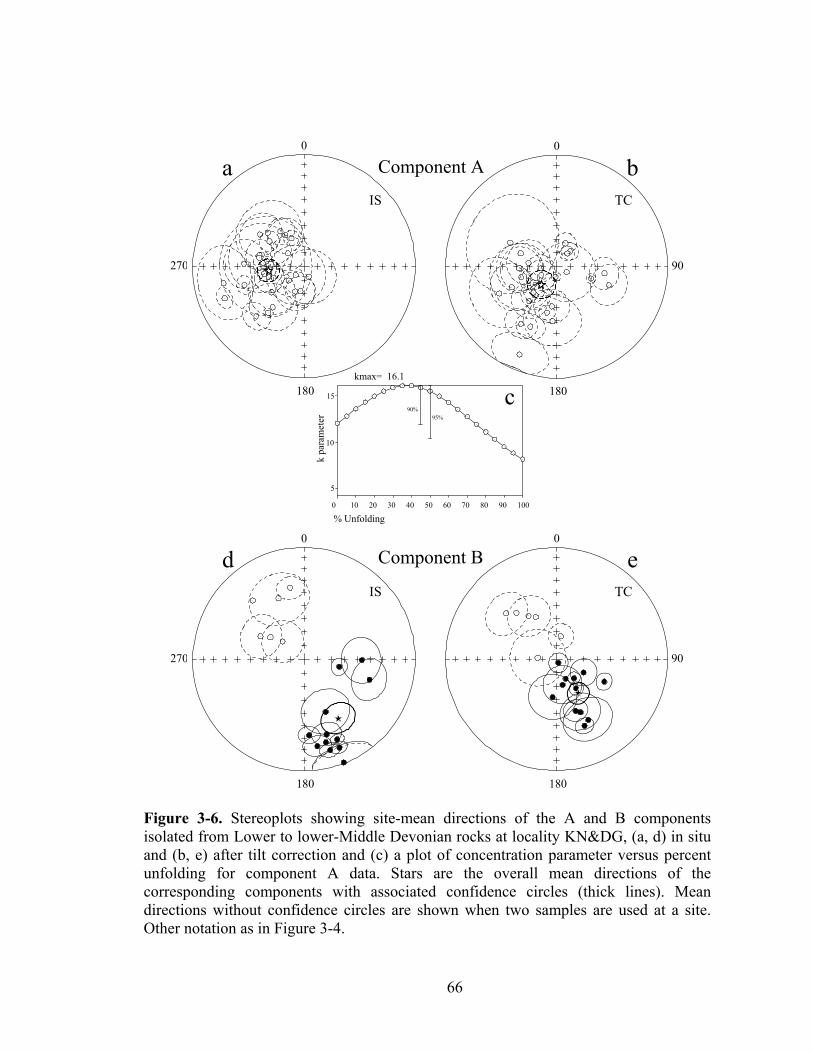
66
0
180
270
0
90
180
10
k pa
ram
eter
kmax= 16.1
0 10 20 30 40 50 60 70 80 90 100
% Unfolding
95%90%
15
5
0
180
270
0
90
180
IS TC
IS TC
a b
d e
c
Component B
Component A
Figure 3-6. Stereoplots showing site-mean directions of the A and B components isolated from Lower to lower-Middle Devonian rocks at locality KN&DG, (a, d) in situ and (b, e) after tilt correction and (c) a plot of concentration parameter versus percent unfolding for component A data. Stars are the overall mean directions of the corresponding components with associated confidence circles (thick lines). Mean directions without confidence circles are shown when two samples are used at a site. Other notation as in Figure 3-4.
67
Legend and explanation for Table 3-2. # – this anomalous site is excluded from computation of the overall mean. Mean1 (Mean2) is the overall mean direction of all sites (sites with more than two samples and α95 < 20°). 35% unfold is the mean direction at 35% incremental unfolding. Other notation is as in Table 3-1.
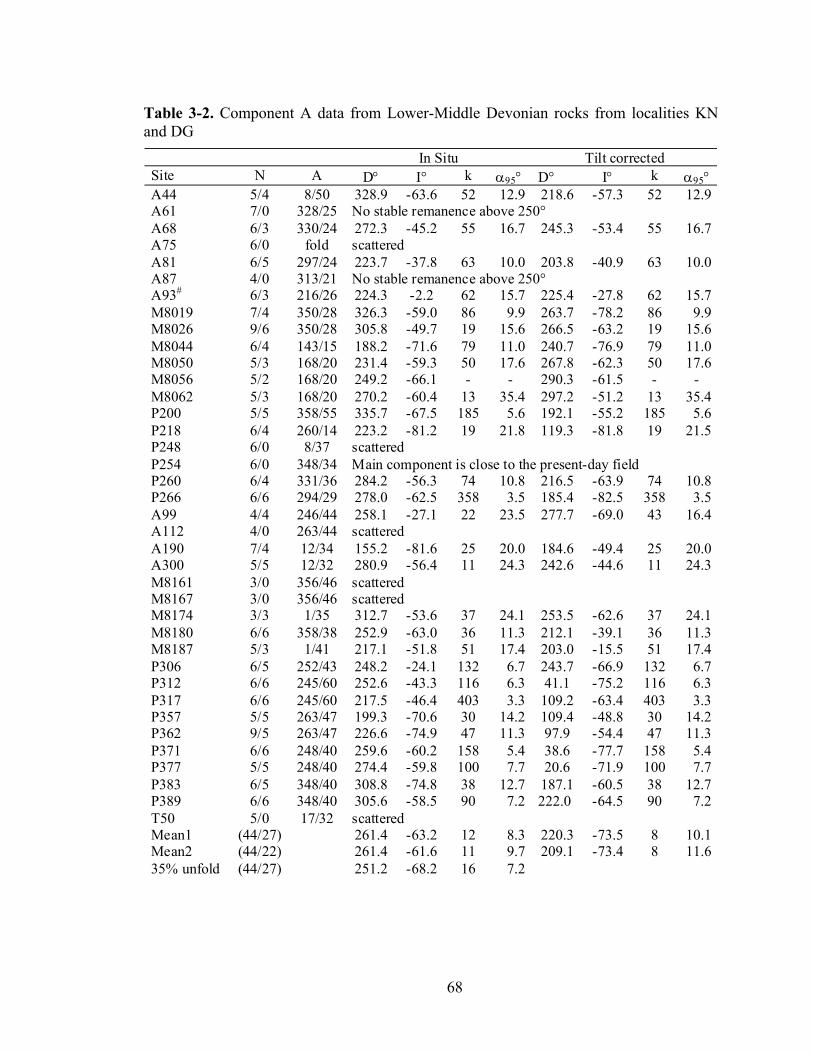
68
Table 3-2. Component A data from Lower-Middle Devonian rocks from localities KN and DG
In Situ Tilt corrected Site N A D° I° k α95° D° I° k α95° A44 5/4 8/50 328.9 -63.6 52 12.9 218.6 -57.3 52 12.9A61 7/0 328/25 No stable remanence above 250° A68 6/3 330/24 272.3 -45.2 55 16.7 245.3 -53.4 55 16.7A75 6/0 fold scattered A81 6/5 297/24 223.7 -37.8 63 10.0 203.8 -40.9 63 10.0A87 4/0 313/21 No stable remanence above 250° A93# 6/3 216/26 224.3 -2.2 62 15.7 225.4 -27.8 62 15.7M8019 7/4 350/28 326.3 -59.0 86 9.9 263.7 -78.2 86 9.9M8026 9/6 350/28 305.8 -49.7 19 15.6 266.5 -63.2 19 15.6M8044 6/4 143/15 188.2 -71.6 79 11.0 240.7 -76.9 79 11.0M8050 5/3 168/20 231.4 -59.3 50 17.6 267.8 -62.3 50 17.6M8056 5/2 168/20 249.2 -66.1 - - 290.3 -61.5 - - M8062 5/3 168/20 270.2 -60.4 13 35.4 297.2 -51.2 13 35.4P200 5/5 358/55 335.7 -67.5 185 5.6 192.1 -55.2 185 5.6P218 6/4 260/14 223.2 -81.2 19 21.8 119.3 -81.8 19 21.5P248 6/0 8/37 scattered P254 6/0 348/34 Main component is close to the present-day field P260 6/4 331/36 284.2 -56.3 74 10.8 216.5 -63.9 74 10.8P266 6/6 294/29 278.0 -62.5 358 3.5 185.4 -82.5 358 3.5A99 4/4 246/44 258.1 -27.1 22 23.5 277.7 -69.0 43 16.4A112 4/0 263/44 scattered A190 7/4 12/34 155.2 -81.6 25 20.0 184.6 -49.4 25 20.0A300 5/5 12/32 280.9 -56.4 11 24.3 242.6 -44.6 11 24.3M8161 3/0 356/46 scattered M8167 3/0 356/46 scattered M8174 3/3 1/35 312.7 -53.6 37 24.1 253.5 -62.6 37 24.1M8180 6/6 358/38 252.9 -63.0 36 11.3 212.1 -39.1 36 11.3M8187 5/3 1/41 217.1 -51.8 51 17.4 203.0 -15.5 51 17.4P306 6/5 252/43 248.2 -24.1 132 6.7 243.7 -66.9 132 6.7P312 6/6 245/60 252.6 -43.3 116 6.3 41.1 -75.2 116 6.3P317 6/6 245/60 217.5 -46.4 403 3.3 109.2 -63.4 403 3.3P357 5/5 263/47 199.3 -70.6 30 14.2 109.4 -48.8 30 14.2P362 9/5 263/47 226.6 -74.9 47 11.3 97.9 -54.4 47 11.3P371 6/6 248/40 259.6 -60.2 158 5.4 38.6 -77.7 158 5.4P377 5/5 248/40 274.4 -59.8 100 7.7 20.6 -71.9 100 7.7P383 6/5 348/40 308.8 -74.8 38 12.7 187.1 -60.5 38 12.7P389 6/6 348/40 305.6 -58.5 90 7.2 222.0 -64.5 90 7.2T50 5/0 17/32 scattered Mean1 (44/27) 261.4 -63.2 12 8.3 220.3 -73.5 8 10.1Mean2 (44/22) 261.4 -61.6 11 9.7 209.1 -73.4 8 11.635% unfold (44/27) 251.2 -68.2 16 7.2
69
The mean B-component direction ends up with acceptable statistical parameters
and is confirmed by positive fold and reversal tests (Table 3-3, Fig. 3-6d, e), despite some
anomalous and inconsistently scattered sites. Also heartening is the gross similarity of
this result with the KU one (discussed next) .
Givetian basalts (locality KU) Low-temperature component directions cluster around the present-day field
before tilt correction, and were usually removed below 200°-250°C. At higher
temperatures, two components (A and B) were isolated from most samples.
Component A persists from about 250°C until above 500° and is sometimes the
only component present in a sample (Fig. 3-7a). In other samples, this remanence does
not decay to the origin and is succeeded by another component (B). This can be seen as
sequential rectilinear segments on orthogonal plots (Fig. 3-7b-d) or in remagnetization
circles in stereonets when the decay of an A component produces a curved trajectory in
the orthogonal demagnetization diagrams. Proper component separation may not always
be reached in such a case, even if two apparently rectilinear segments seem evident. For
instance, component B is unlikely to be fully and reliably isolated in sample n3863 (Fig.
3-7c). It can also happen that the intermediate-temperature (A) component is
contaminated, as suggested by the diagram of sample m9202 (Fig. 3-7d). In this sample,
overlapping of unblocking spectra of components A and B seems responsible. For several
sites, remagnetization circles (Fig. 3-7e) had to be used, and for some six other sites we
could not determine any well-clustered mean A-, B- or anomalous direction with any
confidence. These sites are, of course, not included in Table 3-4.
Despite this occasional problematic aspect of the determination of A or B
component directions, we feel confident that the site-mean directions and
remagnetization circles of Table 3-4 are well enough determined. We have combined our
data with the previous results from five sites of the same formation at this locality
(Levashova et al., 2003a). In this combined set, twelve site-mean directions of the A-
component form a tight cluster in situ (Table 3-4; Fig. 3-8a), excluding two anomalous
outliers (not shown). A three-fold increase in dispersion upon tilt correction (Table 3-4;
Fig. 3-8b) indicates that the A-component is postfolding.
70
The combined component B site-mean directions and remagnetization circle
intersections form two groups on the stereonet (Fig. 3-8c, d): one with four site-means
with north and up directions and another comprising four remagnetization circles and two
site-means; the latter group defines a south and down cluster of directions. The
corresponding polarity-means differ by 168.3° (11.7°) ± 13.8°, rendering the reversal test
positive (Table 3-4; Fig. 3-8c, d). For the ten sites with B-directions, tilt-corrected data
show a better grouping than in-situ directions, but this is not statistically significant; also
insignificant is a slight improvement in data grouping at 80% unfolding. With some
reservation, we conclude that the dual-polarity B-component is primary and of Middle
Devonian age. This view is further supported by general agreement between the Early-
early Middle Devonian KN&DG result and late Middle Devonian KU data (Table 3-5).
Discussion
Overview of results from the Chingiz area deemed of primary origin Several studies reported Paleozoic paleomagnetic results from the Chingiz island
arc and adjacent units and the nearby and younger complexes of the Devonian and late
Paleozoic volcanic belts (Table 3-5).
Collins et al. (2003) reported paleomagnetic data from Upper Cambrian andesites
and Lower Ordovician (Arenigian) redbeds from the central part of the Chingiz Range
(results labeled CL and OE, respectively, in Table 3-5). The ancient nature of both
magnetizations is confirmed by positive fold tests. There is a large scatter of Arenigian
site-mean declinations, however, presumably because of local vertical-axis rotations. The
statistical limits on the Early Ordovician mean inclination are therefore much tighter than
those for the mean declination.
Lower Silurian volcanics (SI) were studied 30-40 km to the southwest from
localities OE and CL. The primary origin of he dual- polarity magnetization in these
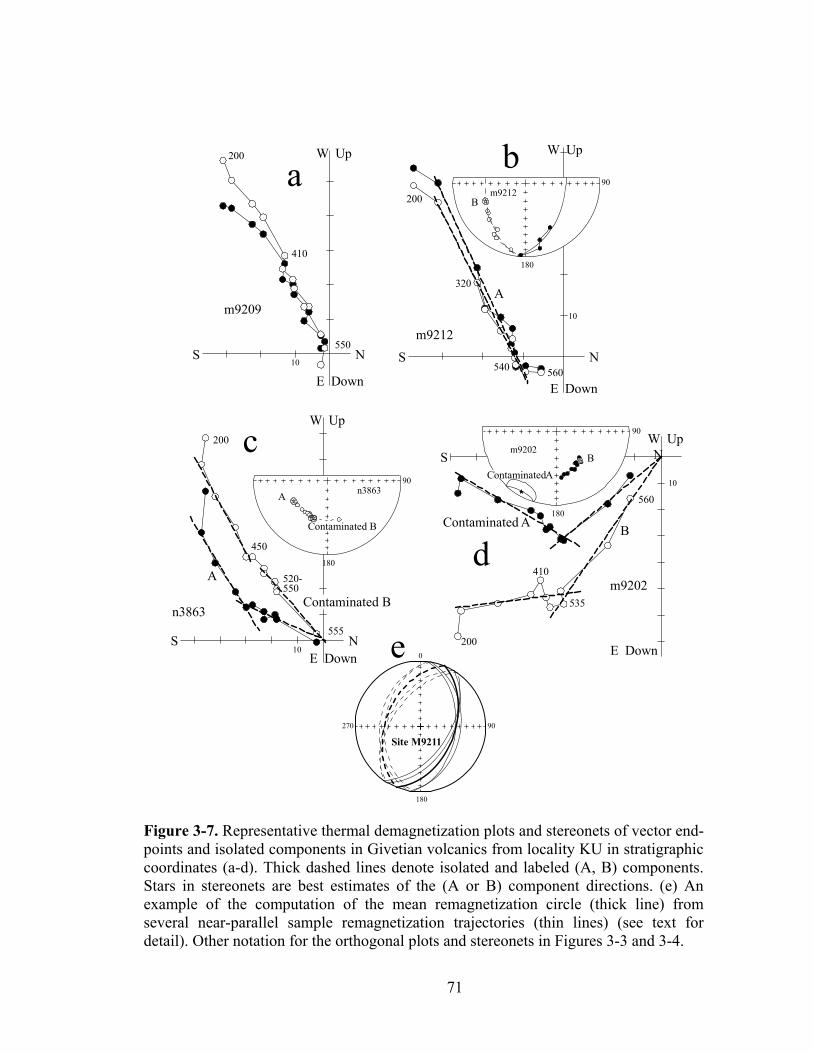
71
W Up
NE Down
S
n3863
W Up
N
E Down
S
m9209
10
10
n386390
180
W UpN
E Down
S
m9202
m9202
90
180
10
550
200
410
560
535
200
410
200
555
450
520-�550
A
Contaminated B
A
BContaminated A
B
Site M9211
0
90
180
270
a b
d
e
W Up
N
E Down
S
m921210
m921290
180
200
560540
320A
B
cContaminated A
Contaminated B
Figure 3-7. Representative thermal demagnetization plots and stereonets of vector end-points and isolated components in Givetian volcanics from locality KU in stratigraphic coordinates (a-d). Thick dashed lines denote isolated and labeled (A, B) components. Stars in stereonets are best estimates of the (A or B) component directions. (e) An example of the computation of the mean remagnetization circle (thick line) from several near-parallel sample remagnetization trajectories (thin lines) (see text for detail). Other notation for the orthogonal plots and stereonets in Figures 3-3 and 3-4.
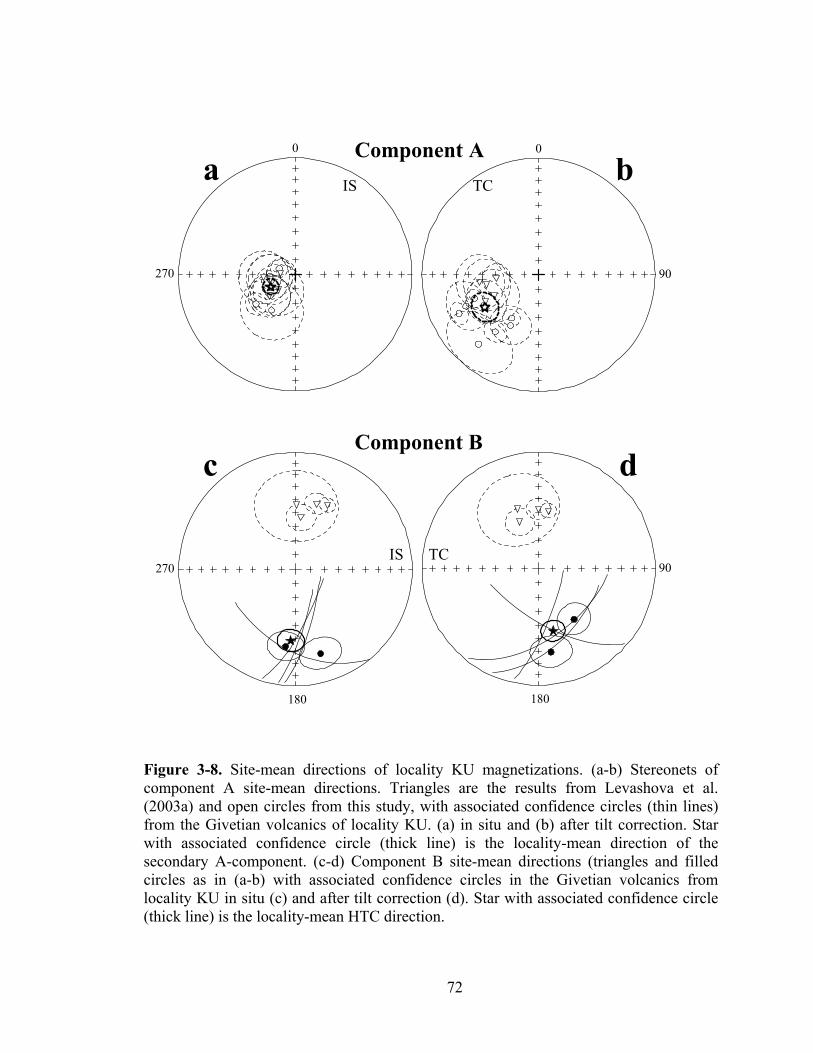
72
0
270
0
90
180
270 90
180
IS TC
IS TC
a b
c dComponent B
Component A
Figure 3-8. Site-mean directions of locality KU magnetizations. (a-b) Stereonets of component A site-mean directions. Triangles are the results from Levashova et al. (2003a) and open circles from this study, with associated confidence circles (thin lines) from the Givetian volcanics of locality KU. (a) in situ and (b) after tilt correction. Star with associated confidence circle (thick line) is the locality-mean direction of the secondary A-component. (c-d) Component B site-mean directions (triangles and filled circles as in (a-b) with associated confidence circles in the Givetian volcanics from locality KU in situ (c) and after tilt correction (d). Star with associated confidence circle (thick line) is the locality-mean HTC direction.
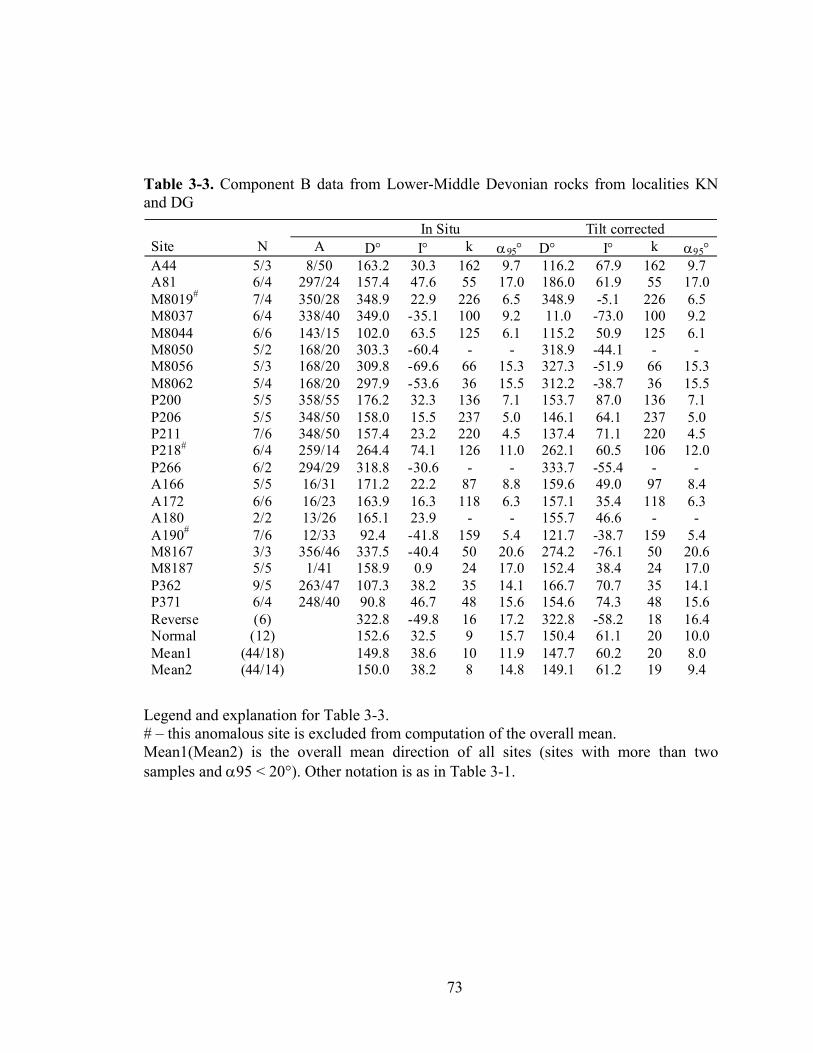
73
Table 3-3. Component B data from Lower-Middle Devonian rocks from localities KN and DG
In Situ Tilt corrected Site N A D° I° k α95° D° I° k α95° A44 5/3 8/50 163.2 30.3 162 9.7 116.2 67.9 162 9.7 A81 6/4 297/24 157.4 47.6 55 17.0 186.0 61.9 55 17.0 M8019# 7/4 350/28 348.9 22.9 226 6.5 348.9 -5.1 226 6.5 M8037 6/4 338/40 349.0 -35.1 100 9.2 11.0 -73.0 100 9.2 M8044 6/6 143/15 102.0 63.5 125 6.1 115.2 50.9 125 6.1 M8050 5/2 168/20 303.3 -60.4 - - 318.9 -44.1 - - M8056 5/3 168/20 309.8 -69.6 66 15.3 327.3 -51.9 66 15.3 M8062 5/4 168/20 297.9 -53.6 36 15.5 312.2 -38.7 36 15.5 P200 5/5 358/55 176.2 32.3 136 7.1 153.7 87.0 136 7.1 P206 5/5 348/50 158.0 15.5 237 5.0 146.1 64.1 237 5.0 P211 7/6 348/50 157.4 23.2 220 4.5 137.4 71.1 220 4.5 P218# 6/4 259/14 264.4 74.1 126 11.0 262.1 60.5 106 12.0 P266 6/2 294/29 318.8 -30.6 - - 333.7 -55.4 - - A166 5/5 16/31 171.2 22.2 87 8.8 159.6 49.0 97 8.4 A172 6/6 16/23 163.9 16.3 118 6.3 157.1 35.4 118 6.3 A180 2/2 13/26 165.1 23.9 - - 155.7 46.6 - - A190# 7/6 12/33 92.4 -41.8 159 5.4 121.7 -38.7 159 5.4 M8167 3/3 356/46 337.5 -40.4 50 20.6 274.2 -76.1 50 20.6 M8187 5/5 1/41 158.9 0.9 24 17.0 152.4 38.4 24 17.0 P362 9/5 263/47 107.3 38.2 35 14.1 166.7 70.7 35 14.1 P371 6/4 248/40 90.8 46.7 48 15.6 154.6 74.3 48 15.6 Reverse (6) 322.8 -49.8 16 17.2 322.8 -58.2 18 16.4 Normal (12) 152.6 32.5 9 15.7 150.4 61.1 20 10.0 Mean1 (44/18) 149.8 38.6 10 11.9 147.7 60.2 20 8.0 Mean2 (44/14) 150.0 38.2 8 14.8 149.1 61.2 19 9.4
Legend and explanation for Table 3-3. # – this anomalous site is excluded from computation of the overall mean. Mean1(Mean2) is the overall mean direction of all sites (sites with more than two samples and α95 < 20°). Other notation is as in Table 3-1.
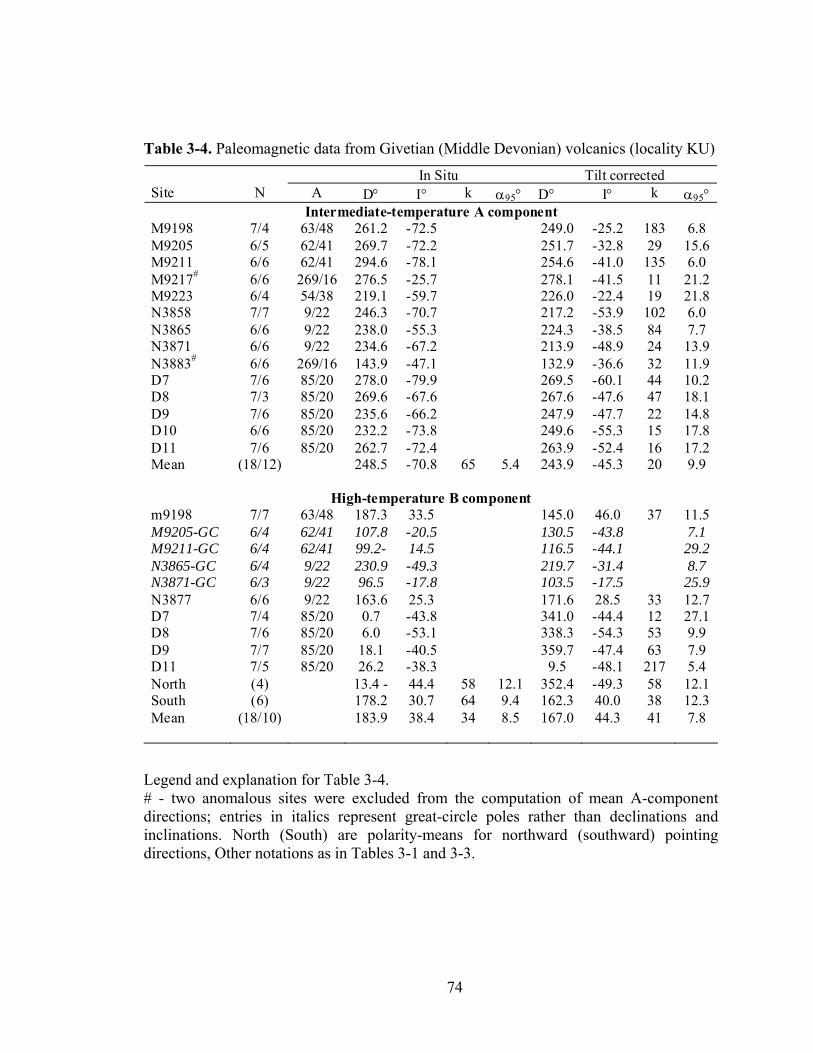
74
Table 3-4. Paleomagnetic data from Givetian (Middle Devonian) volcanics (locality KU)
In Situ Tilt corrected Site N A D° I° k α95° D° I° k α95°
Intermediate-temperature A component M9198 7/4 63/48 261.2 -72.5 249.0 -25.2 183 6.8 M9205 6/5 62/41 269.7 -72.2 251.7 -32.8 29 15.6 M9211 6/6 62/41 294.6 -78.1 254.6 -41.0 135 6.0 M9217# 6/6 269/16 276.5 -25.7 278.1 -41.5 11 21.2 M9223 6/4 54/38 219.1 -59.7 226.0 -22.4 19 21.8 N3858 7/7 9/22 246.3 -70.7 217.2 -53.9 102 6.0 N3865 6/6 9/22 238.0 -55.3 224.3 -38.5 84 7.7 N3871 6/6 9/22 234.6 -67.2 213.9 -48.9 24 13.9 N3883# 6/6 269/16 143.9 -47.1 132.9 -36.6 32 11.9 D7 7/6 85/20 278.0 -79.9 269.5 -60.1 44 10.2 D8 7/3 85/20 269.6 -67.6 267.6 -47.6 47 18.1 D9 7/6 85/20 235.6 -66.2 247.9 -47.7 22 14.8 D10 6/6 85/20 232.2 -73.8 249.6 -55.3 15 17.8 D11 7/6 85/20 262.7 -72.4 263.9 -52.4 16 17.2 Mean (18/12) 248.5 -70.8 65 5.4 243.9 -45.3 20 9.9
High-temperature B component m9198 7/7 63/48 187.3 33.5 145.0 46.0 37 11.5 M9205-GC 6/4 62/41 107.8 -20.5 130.5 -43.8 7.1 M9211-GC 6/4 62/41 99.2- 14.5 116.5 -44.1 29.2 N3865-GC 6/4 9/22 230.9 -49.3 219.7 -31.4 8.7 N3871-GC 6/3 9/22 96.5 -17.8 103.5 -17.5 25.9 N3877 6/6 9/22 163.6 25.3 171.6 28.5 33 12.7 D7 7/4 85/20 0.7 -43.8 341.0 -44.4 12 27.1 D8 7/6 85/20 6.0 -53.1 338.3 -54.3 53 9.9 D9 7/7 85/20 18.1 -40.5 359.7 -47.4 63 7.9 D11 7/5 85/20 26.2 -38.3 9.5 -48.1 217 5.4 North (4) 13.4 - 44.4 58 12.1 352.4 -49.3 58 12.1 South (6) 178.2 30.7 64 9.4 162.3 40.0 38 12.3 Mean (18/10) 183.9 38.4 34 8.5 167.0 44.3 41 7.8
Legend and explanation for Table 3-4. # - two anomalous sites were excluded from the computation of mean A-component directions; entries in italics represent great-circle poles rather than declinations and inclinations. North (South) are polarity-means for northward (southward) pointing directions, Other notations as in Tables 3-1 and 3-3.
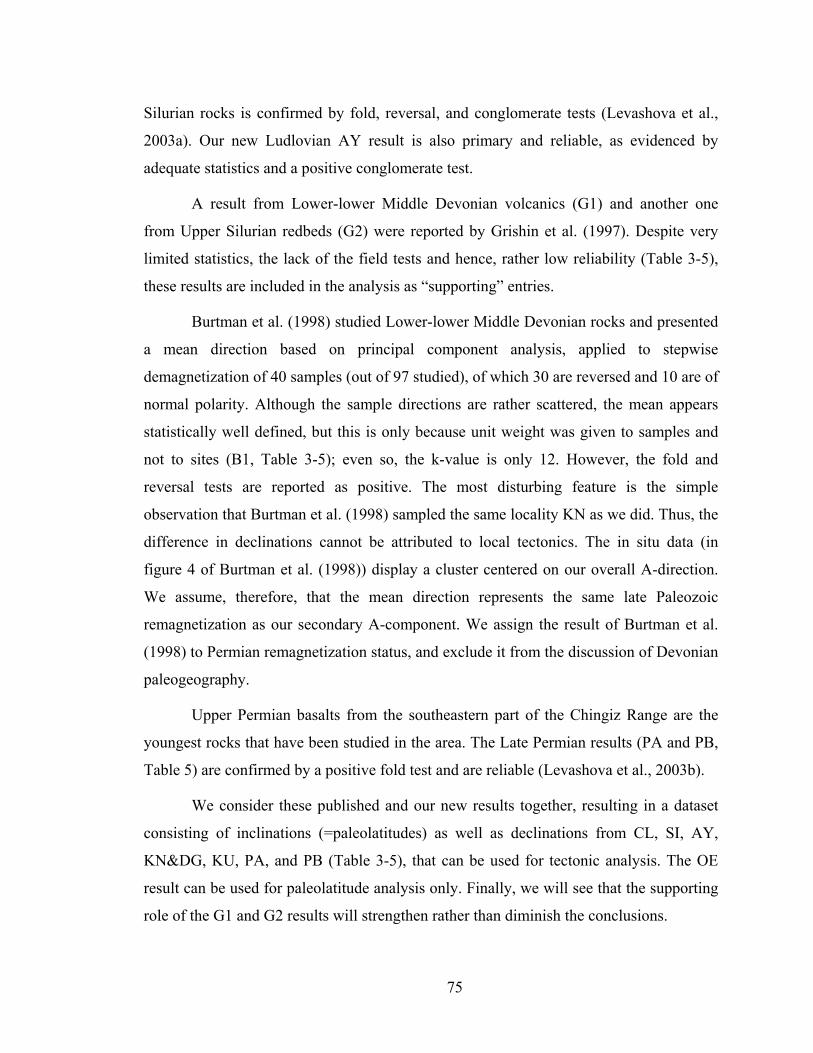
75
Silurian rocks is confirmed by fold, reversal, and conglomerate tests (Levashova et al.,
2003a). Our new Ludlovian AY result is also primary and reliable, as evidenced by
adequate statistics and a positive conglomerate test.
A result from Lower-lower Middle Devonian volcanics (G1) and another one
from Upper Silurian redbeds (G2) were reported by Grishin et al. (1997). Despite very
limited statistics, the lack of the field tests and hence, rather low reliability (Table 3-5),
these results are included in the analysis as “supporting” entries.
Burtman et al. (1998) studied Lower-lower Middle Devonian rocks and presented
a mean direction based on principal component analysis, applied to stepwise
demagnetization of 40 samples (out of 97 studied), of which 30 are reversed and 10 are of
normal polarity. Although the sample directions are rather scattered, the mean appears
statistically well defined, but this is only because unit weight was given to samples and
not to sites (B1, Table 3-5); even so, the k-value is only 12. However, the fold and
reversal tests are reported as positive. The most disturbing feature is the simple
observation that Burtman et al. (1998) sampled the same locality KN as we did. Thus, the
difference in declinations cannot be attributed to local tectonics. The in situ data (in
figure 4 of Burtman et al. (1998)) display a cluster centered on our overall A-direction.
We assume, therefore, that the mean direction represents the same late Paleozoic
remagnetization as our secondary A-component. We assign the result of Burtman et al.
(1998) to Permian remagnetization status, and exclude it from the discussion of Devonian
paleogeography.
Upper Permian basalts from the southeastern part of the Chingiz Range are the
youngest rocks that have been studied in the area. The Late Permian results (PA and PB,
Table 5) are confirmed by a positive fold test and are reliable (Levashova et al., 2003b).
We consider these published and our new results together, resulting in a dataset
consisting of inclinations (=paleolatitudes) as well as declinations from CL, SI, AY,
KN&DG, KU, PA, and PB (Table 3-5), that can be used for tectonic analysis. The OE
result can be used for paleolatitude analysis only. Finally, we will see that the supporting
role of the G1 and G2 results will strengthen rather than diminish the conclusions.
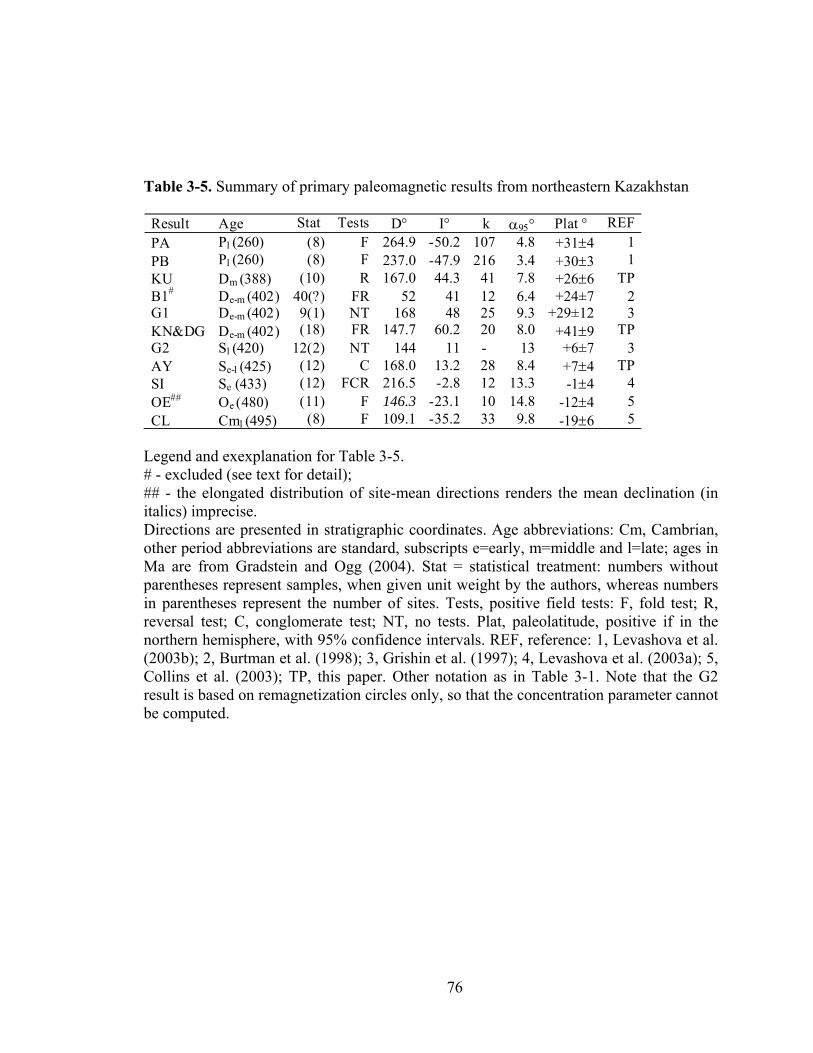
76
Table 3-5. Summary of primary paleomagnetic results from northeastern Kazakhstan
Result Age Stat Tests D° I° k α95° Plat ° REF PA Pl (260) (8) F 264.9 -50.2 107 4.8 +31±4 1 PB Pl (260) (8) F 237.0 -47.9 216 3.4 +30±3 1 KU Dm (388) (10) R 167.0 44.3 41 7.8 +26±6 TP B1# De-m (402) 40(?) FR 52 41 12 6.4 +24±7 2 G1 De-m (402) 9(1) NT 168 48 25 9.3 +29±12 3 KN&DG De-m (402) (18) FR 147.7 60.2 20 8.0 +41±9 TP G2 Sl (420) 12(2) NT 144 11 - 13 +6±7 3 AY Se-l (425) (12) C 168.0 13.2 28 8.4 +7±4 TP SI Se (433) (12) FCR 216.5 -2.8 12 13.3 -1±4 4 OE## Oe (480) (11) F 146.3 -23.1 10 14.8 -12±4 5 CL Cml (495) (8) F 109.1 -35.2 33 9.8 -19±6 5
Legend and exexplanation for Table 3-5. # - excluded (see text for detail); ## - the elongated distribution of site-mean directions renders the mean declination (in italics) imprecise. Directions are presented in stratigraphic coordinates. Age abbreviations: Cm, Cambrian, other period abbreviations are standard, subscripts e=early, m=middle and l=late; ages in Ma are from Gradstein and Ogg (2004). Stat = statistical treatment: numbers without parentheses represent samples, when given unit weight by the authors, whereas numbers in parentheses represent the number of sites. Tests, positive field tests: F, fold test; R, reversal test; C, conglomerate test; NT, no tests. Plat, paleolatitude, positive if in the northern hemisphere, with 95% confidence intervals. REF, reference: 1, Levashova et al. (2003b); 2, Burtman et al. (1998); 3, Grishin et al. (1997); 4, Levashova et al. (2003a); 5, Collins et al. (2003); TP, this paper. Other notation as in Table 3-1. Note that the G2 result is based on remagnetization circles only, so that the concentration parameter cannot be computed.
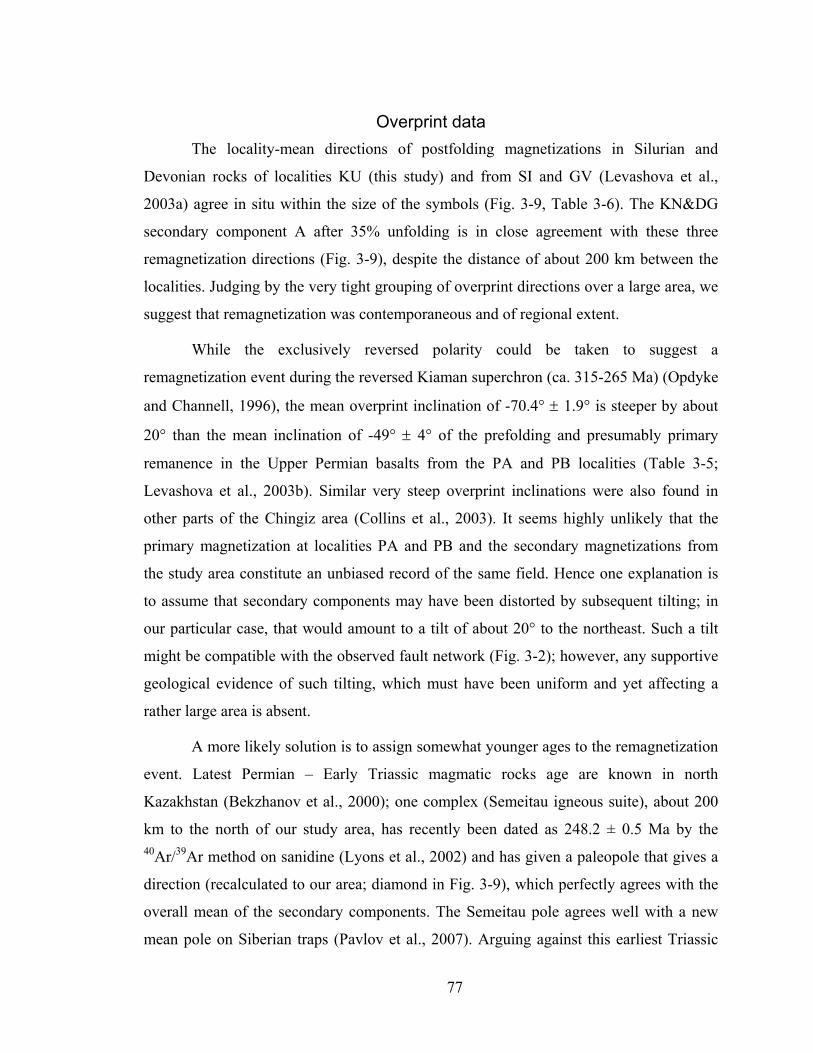
77
Overprint data The locality-mean directions of postfolding magnetizations in Silurian and
Devonian rocks of localities KU (this study) and from SI and GV (Levashova et al.,
2003a) agree in situ within the size of the symbols (Fig. 3-9, Table 3-6). The KN&DG
secondary component A after 35% unfolding is in close agreement with these three
remagnetization directions (Fig. 3-9), despite the distance of about 200 km between the
localities. Judging by the very tight grouping of overprint directions over a large area, we
suggest that remagnetization was contemporaneous and of regional extent.
While the exclusively reversed polarity could be taken to suggest a
remagnetization event during the reversed Kiaman superchron (ca. 315-265 Ma) (Opdyke
and Channell, 1996), the mean overprint inclination of -70.4° ± 1.9° is steeper by about
20° than the mean inclination of -49° ± 4° of the prefolding and presumably primary
remanence in the Upper Permian basalts from the PA and PB localities (Table 3-5;
Levashova et al., 2003b). Similar very steep overprint inclinations were also found in
other parts of the Chingiz area (Collins et al., 2003). It seems highly unlikely that the
primary magnetization at localities PA and PB and the secondary magnetizations from
the study area constitute an unbiased record of the same field. Hence one explanation is
to assume that secondary components may have been distorted by subsequent tilting; in
our particular case, that would amount to a tilt of about 20° to the northeast. Such a tilt
might be compatible with the observed fault network (Fig. 3-2); however, any supportive
geological evidence of such tilting, which must have been uniform and yet affecting a
rather large area is absent.
A more likely solution is to assign somewhat younger ages to the remagnetization
event. Latest Permian – Early Triassic magmatic rocks age are known in north
Kazakhstan (Bekzhanov et al., 2000); one complex (Semeitau igneous suite), about 200
km to the north of our study area, has recently been dated as 248.2 ± 0.5 Ma by the 40Ar/39Ar method on sanidine (Lyons et al., 2002) and has given a paleopole that gives a
direction (recalculated to our area; diamond in Fig. 3-9), which perfectly agrees with the
overall mean of the secondary components. The Semeitau pole agrees well with a new
mean pole on Siberian traps (Pavlov et al., 2007). Arguing against this earliest Triassic

78
age of the overprints, however, is that the reversal frequency close to the Permian-
Triassic boundary was rather high (Opdyke and Channell, 1996), whereas normal polarity
directions have not been observed in the Chingiz Range. We have difficulties imagining
that the remagnetization event was of regional extent and yet very brief.
Thus it remains unclear whether overprint directions were of Kiaman age and
distorted by younger deformation or whether they were acquired during a short
remagnetization event near the Permian-Triassic boundary. Regardless, it is worth noting
that all secondary directions from the Chingiz area concur both in declination and
inclination with directions recalculated from the earliest Triassic APWP of Baltica
(Torsvik et al., 2001), and thus, that they do not indicate any tilting, rotation, or relative
displacements for such an age (Fig. 3-9).
Polarity choice The declinations from the rocks ranging in age from Late Cambrian to Middle
Devonian from the Chingiz area are generally to the southeast or south, while the
inclinations change from older and moderate up to younger, moderate down values
(Table 3-5). In contrast, Permian directions are southwest and up (or rarely, northeast and
downwards). We know that by Permian time, when Siberia, Tarim, Baltica and the
Kazakhstan areas were in the final stages of amalgamation, the study area must have been
in the northern hemisphere, as uniformly agreed upon in the literature (e.g., Van der Voo,
1993; Didenko et al., 1994; Şengör and Natal’in, 1996; Smethurst et al., 1998a; Filippova
et al., 2001; Stampfli and Borel, 2002; Kravchinsky et al., 2002a; Van der Voo et al.,
2006; Cocks and Torsvik, 2007). Thus the NE/downwards Permian directions represent
normal polarity.
Carboniferous data from the Chingiz area are absent, but a dual-polarity result
from Upper Carboniferous-Lower Permian rocks from the central arm of the Balkhash-Ili
volcanic belt (Abrajevitch et al., 2008) has an unambiguously normal polarity represented
by NE and down directions. With respect to these late Paleozoic directions, and keeping
the inclinations (and, hence, paleolatitudes) similar, the Early and Middle Devonian
results display declinations that are rotated clockwise by more than 100° (Table 3-5).
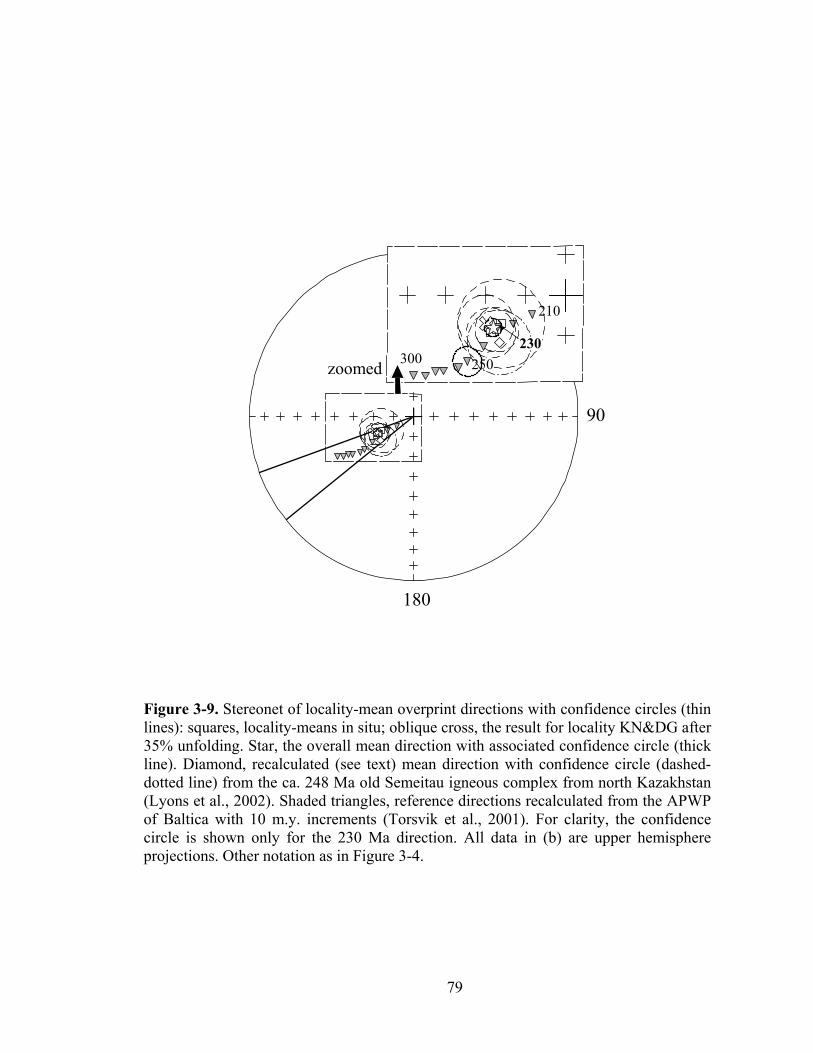
79
90
180
zoomed 300 250
210
230
Figure 3-9. Stereonet of locality-mean overprint directions with confidence circles (thin lines): squares, locality-means in situ; oblique cross, the result for locality KN&DG after 35% unfolding. Star, the overall mean direction with associated confidence circle (thick line). Diamond, recalculated (see text) mean direction with confidence circle (dashed-dotted line) from the ca. 248 Ma old Semeitau igneous complex from north Kazakhstan (Lyons et al., 2002). Shaded triangles, reference directions recalculated from the APWP of Baltica with 10 m.y. increments (Torsvik et al., 2001). For clarity, the confidence circle is shown only for the 230 Ma direction. All data in (b) are upper hemisphere projections. Other notation as in Figure 3-4.
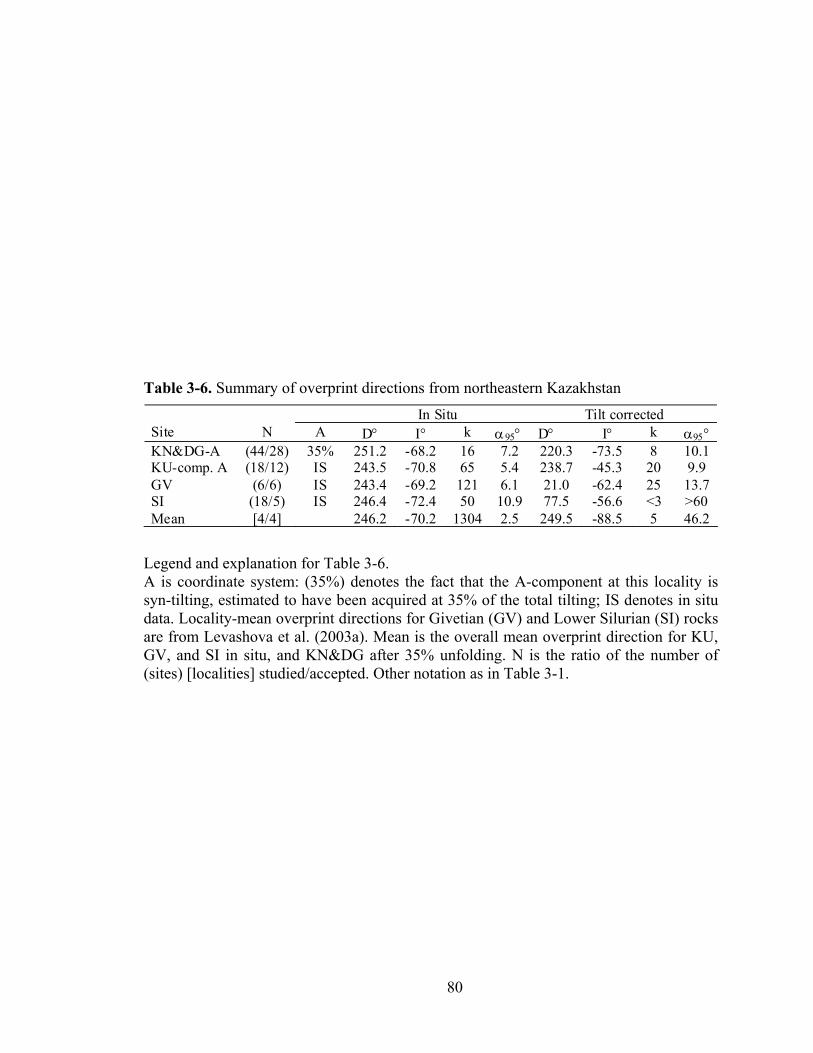
80
Table 3-6. Summary of overprint directions from northeastern Kazakhstan
In Situ Tilt corrected Site N A D° I° k α95° D° I° k α95° KN&DG-A (44/28) 35% 251.2 -68.2 16 7.2 220.3 -73.5 8 10.1 KU-comp. A (18/12) IS 243.5 -70.8 65 5.4 238.7 -45.3 20 9.9 GV (6/6) IS 243.4 -69.2 121 6.1 21.0 -62.4 25 13.7 SI (18/5) IS 246.4 -72.4 50 10.9 77.5 -56.6 <3 >60 Mean [4/4] 246.2 -70.2 1304 2.5 249.5 -88.5 5 46.2
Legend and explanation for Table 3-6. A is coordinate system: (35%) denotes the fact that the A-component at this locality is syn-tilting, estimated to have been acquired at 35% of the total tilting; IS denotes in situ data. Locality-mean overprint directions for Givetian (GV) and Lower Silurian (SI) rocks are from Levashova et al. (2003a). Mean is the overall mean overprint direction for KU, GV, and SI in situ, and KN&DG after 35% unfolding. N is the ratio of the number of (sites) [localities] studied/accepted. Other notation as in Table 3-1.
81
Devonian paleolatitudes were almost certainly in the northern hemisphere (see the above
cited list of paleogeographic syntheses), implying that the Chingiz Range and vicinity
suffered a large CW rotation in the interval between Middle Devonian and Early Permian
time. The opposite polarity option would imply a highly unlikely motion through ca. 60°
of latitude spanning the southern and the northern hemisphere during the above time
interval while all the surrounding tectonic elements stayed in the northern hemisphere.
Silurian declinations generally agree with the Devonian ones (Table 3-5), except
for the SI result, which is likely to have been deflected by local rotation because of
abundant strike-slip faults (Levashova et al., 2003a). It is logical to assume normal
polarity for the southeasterly and upward early Paleozoic directions (Table 3-5) of
Collins et al. (2003), which then imply southern-hemisphere positions and a crossing of
the equator by the Chingiz area in Silurian times. The opposite option would require a
reversal of the steady northward motion of the Chingiz area, as indicated by the Silurian
to Permian data, in addition to another rotation of ~180° in the Middle-Late Ordovician.
Note also that all major cratons like Siberia, Baltica, and Tarim were steadily moving
northward in the Paleozoic, so that a Kazakhstan unit bucking this trend seems
improbable. All in all, we conclude that the Chingiz area was moving northward through
the Paleozoic from low southern to moderate northern latitudes.
Declinations and rotations The structural pattern of Kazakhstan is dominated by the strongly curved
Devonian and late Paleozoic volcanic belts (Fig. 3-2), unconformably overlying older
structures, which have been dismembered but still retain a suggestion of a horseshoe
shape as well, e.g., for Ordovician subduction-related volcanics. Until the mid-Permian,
the volcanics in the belts are of calc-alkaline affinity implying a continuous supra-
subduction setting (Kurchavov, 1994; Tevelev, 2001). The horseshoe shape of the
volcanic belts, marking the former subduction zone, has attracted attention of many
geologists for a long time already. Some of them regarded the curvature of the volcanic
belts as primary features (Zaytsev, 1984; Kurchavov, 2001), while others advocated
oroclinal bending (Zonenshain et al., 1990; Şengör and Natal’in, 1996; Tevelev, 2001).
82
The proponents of oroclinal bending are not so unanimous, however, insofar as the
timing of the rotations is concerned.
After a first attempt to test the hypothesis of oroclinal bending by Grishin et al.
(1997), concluding that about half of the strike contrast was due to vertical-axis rotations,
Levashova et al. (2003a) compared Ordovician and Silurian data from the Chingiz Range
(OE and SI, Table 3-5) with results from the North Tien Shan that revealed a Late
Ordovician paleolatitude of ~8ºS (Bazhenov et al., 2003). They observed that the two
arms of the giant horseshoe had declinations that differed from each other by
approximately 180°, provided that both areas were located in low southerly paleolatitudes
during the Ordovician.
With new paleomagnetic data from the southern limb of the late Paleozoic
volcanic belt, Van der Voo et al. (2006) re-analyzed the problem and concluded that
rotations were ubiquitous but that the pattern and sequence of events are complex. The
two limbs underwent at least two episodes of vertical-axis rotational movements with
respect to each other. Up to some 90° of rotation could be attributed to large-scale east-
west (present day coordinates) sinistral wrenching in an intracontinental setting during
the Permo-Triassic between Siberia and Baltica, as envisioned earlier by Natal’in and
Şengör (2005). Noteworthy is that these rotations are widespread, but not uniform: some
areas near strike-slip faults have rotated, other areas have not (Van der Voo et al., 2006).
The remaining (and equally large) component of the observed declination deviations was
left available for an interpretation in terms of pre-Permian oroclinal bending.
Most recently, Abrajevitch et al. (2007) combined Silurian and Devonian data
from the volcanic belts, and first corrected for the post-Middle Permian rotations due to
the just-described local small-scale block motions within the larger-scale sinistral wrench
zone (Van der Voo et al., 2006). They could carry out such corrections, wherever
(fortunately) Permian primary or overprint directions showed through their declination
deviation what the magnitude of Late Permian – Early Triassic rotations had been. The
mid-Paleozoic declinations, so corrected, now showed a remarkably consistent pattern,
all generally pointing to the north in the southern arm (Fig. 3-10). Using the then-
available Silurian and Devonian results from the Chingiz Range, Abrajevitch et al. (2007)
83
could conclude that the strongly curved Devonian Volcanic Belt was originally a nearly
rectilinear structure. Our current study puts the database from the northeastern arm on a
much firmer footing and reconfirms the oroclinal rotations.
In the Chingiz area, there is no need for a correction for latest Paleozoic rotations,
because the primary Permian and all Permo-Triassic remagnetization directions agree
with each other and the reference paths of Baltica (Fig. 3-9). We can conclude that the
primary Devonian and Silurian declinations reflect pre-Late Permian rotations only. As
already noted, all these directions point to the southwest to (mostly) southeast (Fig. 3-10,
Table 3-5), confirming the preliminary analysis of Abrajevitch et al. (2007) on oroclinal
bending of the Devonian volcanic belt. The timing of this oroclinal bending remains
constrained to the interval between Middle Devonian and Middle Permian in the absence
of reliable Carboniferous paleomagnetic results from the northern and northeastern arms.
Paleolatitudes In this section, we compare the paleolatitudes derived from the entire set of
Paleozoic paleomagnetic data from the Chingiz with those of the major cratons around
the Ural-Mongol mobile belt (UMB). Following paleomagnetic custom for such
comparisons, we calculate reference paleolatitudes by extrapolation from an APWP for
an optimal location in the area of interest; for this study we chose 48.5°N, 78.5°E within
the Chingiz Range. Such a calculation is a prediction of the paleolatitude the Chingiz
Range would have had, if it had stayed rigidly attached to the reference craton since the
time of magnetization acquisition. Any deviation between prediction and an observed
paleolatitude then becomes a measure of the relative displacements, in terms of
latitudinal movements and relative rotations.
Only for Baltica does an adequately determined apparent polar wander path
(APWP) exist for the entire interval of Early Ordovician through Late Permian. For
Siberia, the data are unreliable for most of the middle and late Paleozoic (Cocks and
Torsvik, 2007), with the exception of one good pole for ~360 Ma (Kravchinsky et al.,
2002b), whereas the Tarim dataset is simply too limited for construction of an APWP
before Carboniferous times.
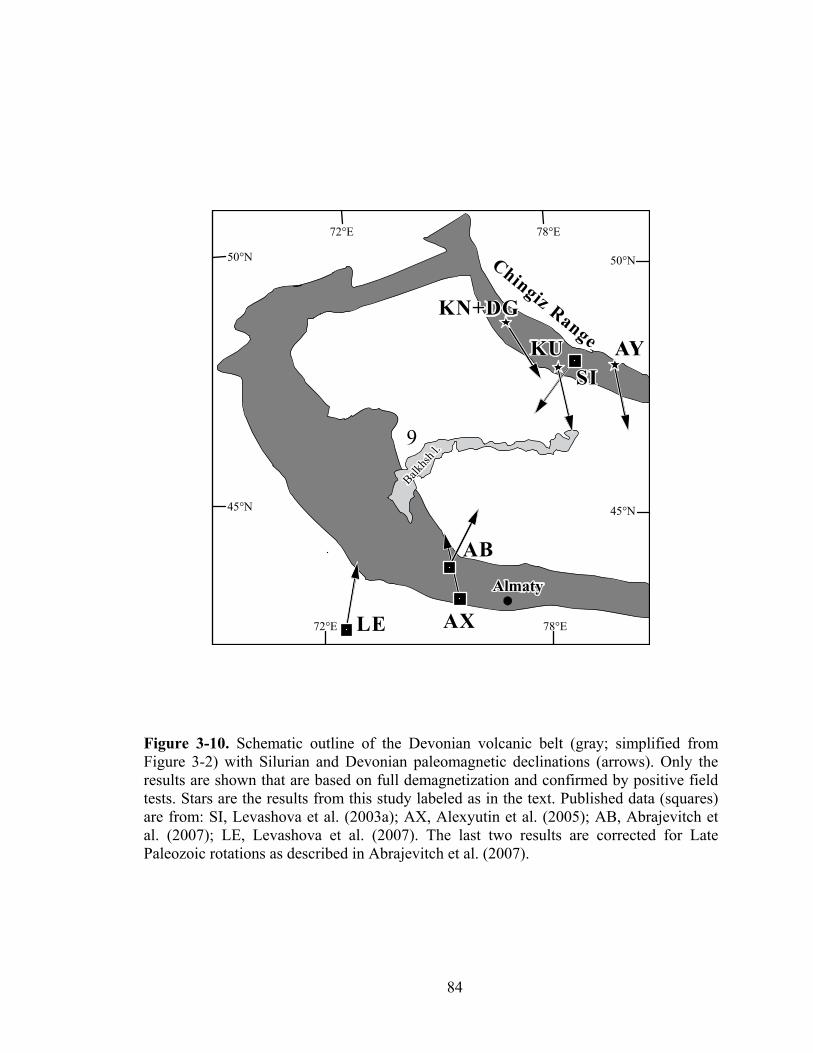
84
9
45°N
50°N50°N
45°N
72°E 78°E
78°E72°E
Almaty
Chingiz Range AY
AX
KU
KN+DG
Balkhsh
l.
AB
LE
SI
Figure 3-10. Schematic outline of the Devonian volcanic belt (gray; simplified from Figure 3-2) with Silurian and Devonian paleomagnetic declinations (arrows). Only the results are shown that are based on full demagnetization and confirmed by positive field tests. Stars are the results from this study labeled as in the text. Published data (squares) are from: SI, Levashova et al. (2003a); AX, Alexyutin et al. (2005); AB, Abrajevitch et al. (2007); LE, Levashova et al. (2007). The last two results are corrected for Late Paleozoic rotations as described in Abrajevitch et al. (2007).
85
For Baltica, we can compute two versions (Fig. 3-11a), using the reference
APWP’s of Van der Voo (1993) and Smethurst et al. (1998b). The two plots concur
reasonably well, despite different selection criteria and smoothing approaches in
constructing the APWP. To first approximation, the Chingiz observations show
reasonable agreement with these plots for the Early Silurian – Late Permian interval. In
contrast, the observed early Paleozoic paleolatitudes differ from the predicted ones, and
show that there is much less poleward motion of Chingiz than what is extrapolated from
Baltica for Cambrian and Ordovician time (Fig. 3-11a).
The reference APWP for Siberia became different after the ~360 Ma pole of
Kravchinsky et al. (2002b) was published, as illustrated in Figure 11b. As our starting
point, we used the APWP of Cocks and Torsvik (2007), who presented it in two options,
CT1 and CT2, depending on whether the Early Permian pole of Pisarevsky et al. (2006)
is included, or excluded, respectively (Fig. 3-11b). This result was presented as the first
well-dated Early Permian pole for Siberia based on fully demagnetized data, but only five
dykes could be studied, which is nowadays considered an inadequate quantity because it
usually fails to average secular variation and other sources of noise. Our comparison of
CT1 predictions with primary Late Permian PA and PB poles shows (Fig. 3-11b) that the
pole of Pisarevsky et al. (2006) would imply that Kazakhstan and Siberia had to converge
by more than 3000 km in the Late Permian, which contradicts most available geological
data. Due to these reasons, we prefer the comparison involving CT-2.
The post-Ordovician APWP of Cocks and Torsvik (2007) is based on very limited
data, and the path strongly depends on the degree of smoothing by spline-fitting, which
may introduce artificial maxima and minima during intervals with few or no data. To
check on such problems we also use individual poles from Siberia instead of Cocks and
Torsvik’s APWP (Table 3-7, Fig. 3-11c). Because the data are abundant for the early
Paleozoic, we included only results based on detailed demagnetization and principal
component analysis.
Recently Shatsillo et al. (2007) published a paleomagnetic result from Early
Silurian sedimentary rocks in Siberia. They isolated high-temperature, presumably
primary components (#6, Table 3-7) as well as intermediate-temperature secondary
86
components (#5, Table 3-7). The latter are inferred to be of Late Silurian – Early-Middle
Devonian age. Their high temperature Early Silurian pole is drastically different from a
roughly coeval pole (#7, Table 3-7) of Torsvik et al. (1995). As the latter result is based
on only nine samples and coincides rather precisely with the remagnetization pole of
Shatsillo et al. (2007), we have excluded #7 from Figure 3-11c.
A paleomagnetic pole of latest Silurian-earliest Devonian age was reported from
the Tuva area to the south of the Siberian craton (see Fig. 3-1 for location) by Bachtadse
et al. (2000). This area belongs to the mobile belt that borders the craton; geological data,
however, indicate that the Tuva area docked to Siberia by Ordovician time (Mossakovsky
et al., 1993; Dobretsov et al., 1995, Cocks and Torsvik, 2007). Of course, some rotations
could occur and, moreover, Bachtadse et al. (2000) did document them. Our calculations
show that the paleolatitude predicted for Chingiz from the Tuva result varied narrowly
(±3º) unless the Tuva area underwent a later vertical-axis rotation >20º, which seems
unlikely. Hence we used the Tuva result (#4) as a proxy for the cratonic pole and
recalculated it to our study area. Additional confirmation of this comes from the fact that
the Tuva pole of Bachtadse et al. (2000) and the overprint pole of Shatsillo et al. (2007)
agree rather well, differing by about 7°.
With the comparison provided by the set of unit poles from Siberia (Fig. 3-11c)
we find that the observed Cambrian, Ordovician, and Silurian paleolatitudes from
Chingiz fall generally within its distribution, and the extrapolated Silurian – earliest
Devonian paleolatitude from Tuva (#4) also agrees well with the average of our new KU
and KN&DG results. Because the Silurian – Permian APWP for Siberia is still so
sparsely populated, any comparison with Siberia’s positions in this interval inevitably
remains speculative. Nevertheless, the possibility is negligible that the data from Chingiz
and Siberia show the good agreement of Figure 3-11c just by chance. This implies that
these two units were moving for more than 100 My in such a way that they retained a
certain paleolatitudinal relationship that precludes large-scale separations (>1500 km or
so) unless followed quickly and dramatically by equally large re-approaches in what must
be regarded as unlikely plate tectonic schemes for the 500 – 390 Ma interval. In other
words, we cannot preclude, but find highly improbable, the notion that subsequent
relative motions completely cancelled each other. To conclude this section, we favor the
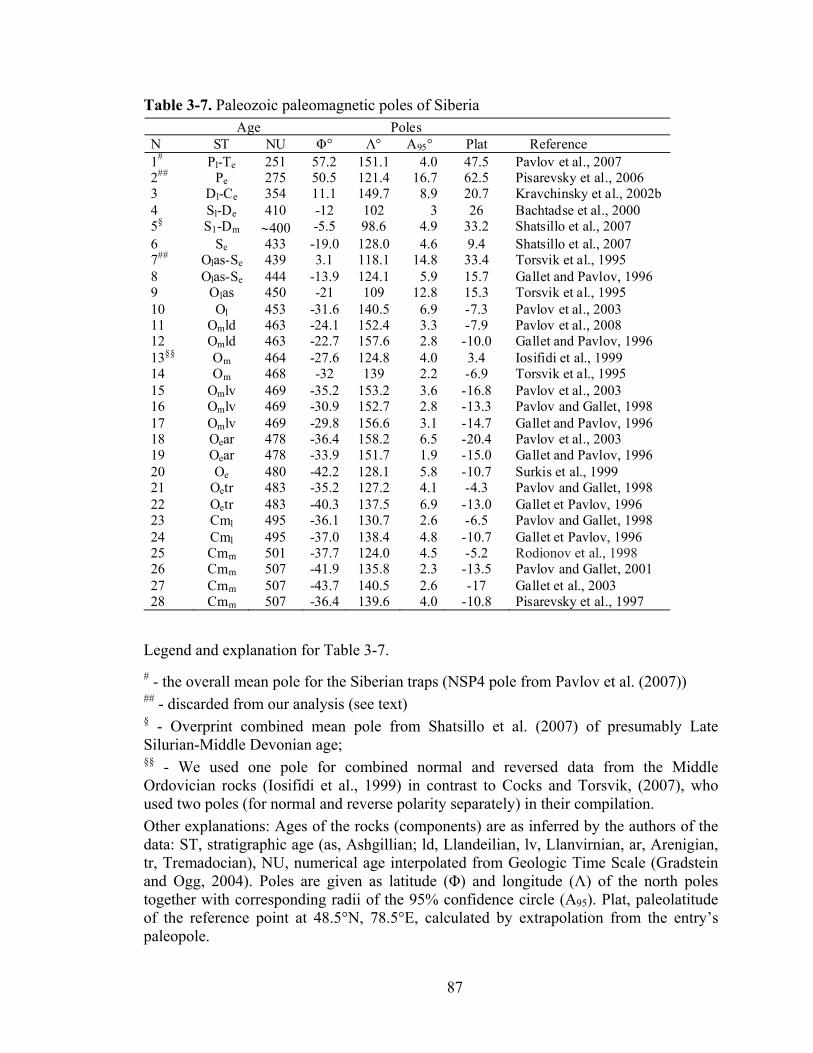
87
Table 3-7. Paleozoic paleomagnetic poles of Siberia Age Poles N ST NU Φ° Λ° A95° Plat Reference 1# Pl-Te 251 57.2 151.1 4.0 47.5 Pavlov et al., 2007 2## Pe 275 50.5 121.4 16.7 62.5 Pisarevsky et al., 2006 3 Dl-Ce 354 11.1 149.7 8.9 20.7 Kravchinsky et al., 2002b 4 Sl-De 410 -12 102 3 26 Bachtadse et al., 2000 5§ S1-Dm ∼400 -5.5 98.6 4.9 33.2 Shatsillo et al., 2007 6 Se 433 -19.0 128.0 4.6 9.4 Shatsillo et al., 2007 7## Olas-Se 439 3.1 118.1 14.8 33.4 Torsvik et al., 1995 8 Olas-Se 444 -13.9 124.1 5.9 15.7 Gallet and Pavlov, 1996 9 Olas 450 -21 109 12.8 15.3 Torsvik et al., 1995 10 Ol 453 -31.6 140.5 6.9 -7.3 Pavlov et al., 2003 11 Omld 463 -24.1 152.4 3.3 -7.9 Pavlov et al., 2008 12 Omld 463 -22.7 157.6 2.8 -10.0 Gallet and Pavlov, 1996 13§§ Om 464 -27.6 124.8 4.0 3.4 Iosifidi et al., 1999 14 Om 468 -32 139 2.2 -6.9 Torsvik et al., 1995 15 Omlv 469 -35.2 153.2 3.6 -16.8 Pavlov et al., 2003 16 Omlv 469 -30.9 152.7 2.8 -13.3 Pavlov and Gallet, 1998 17 Omlv 469 -29.8 156.6 3.1 -14.7 Gallet and Pavlov, 1996 18 Oear 478 -36.4 158.2 6.5 -20.4 Pavlov et al., 2003 19 Oear 478 -33.9 151.7 1.9 -15.0 Gallet and Pavlov, 1996 20 Oe 480 -42.2 128.1 5.8 -10.7 Surkis et al., 1999 21 Oetr 483 -35.2 127.2 4.1 -4.3 Pavlov and Gallet, 1998 22 Oetr 483 -40.3 137.5 6.9 -13.0 Gallet et Pavlov, 1996 23 Cml 495 -36.1 130.7 2.6 -6.5 Pavlov and Gallet, 1998 24 Cml 495 -37.0 138.4 4.8 -10.7 Gallet et Pavlov, 1996 25 Cmm 501 -37.7 124.0 4.5 -5.2 Rodionov et al., 1998 26 Cmm 507 -41.9 135.8 2.3 -13.5 Pavlov and Gallet, 2001 27 Cmm 507 -43.7 140.5 2.6 -17 Gallet et al., 2003 28 Cmm 507 -36.4 139.6 4.0 -10.8 Pisarevsky et al., 1997
Legend and explanation for Table 3-7. # - the overall mean pole for the Siberian traps (NSP4 pole from Pavlov et al. (2007)) ## - discarded from our analysis (see text) § - Overprint combined mean pole from Shatsillo et al. (2007) of presumably Late Silurian-Middle Devonian age; §§ - We used one pole for combined normal and reversed data from the Middle Ordovician rocks (Iosifidi et al., 1999) in contrast to Cocks and Torsvik, (2007), who used two poles (for normal and reverse polarity separately) in their compilation. Other explanations: Ages of the rocks (components) are as inferred by the authors of the data: ST, stratigraphic age (as, Ashgillian; ld, Llandeilian, lv, Llanvirnian, ar, Arenigian, tr, Tremadocian), NU, numerical age interpolated from Geologic Time Scale (Gradstein and Ogg, 2004). Poles are given as latitude (Φ) and longitude (Λ) of the north poles together with corresponding radii of the 95% confidence circle (A95). Plat, paleolatitude of the reference point at 48.5°N, 78.5°E, calculated by extrapolation from the entry’s paleopole.
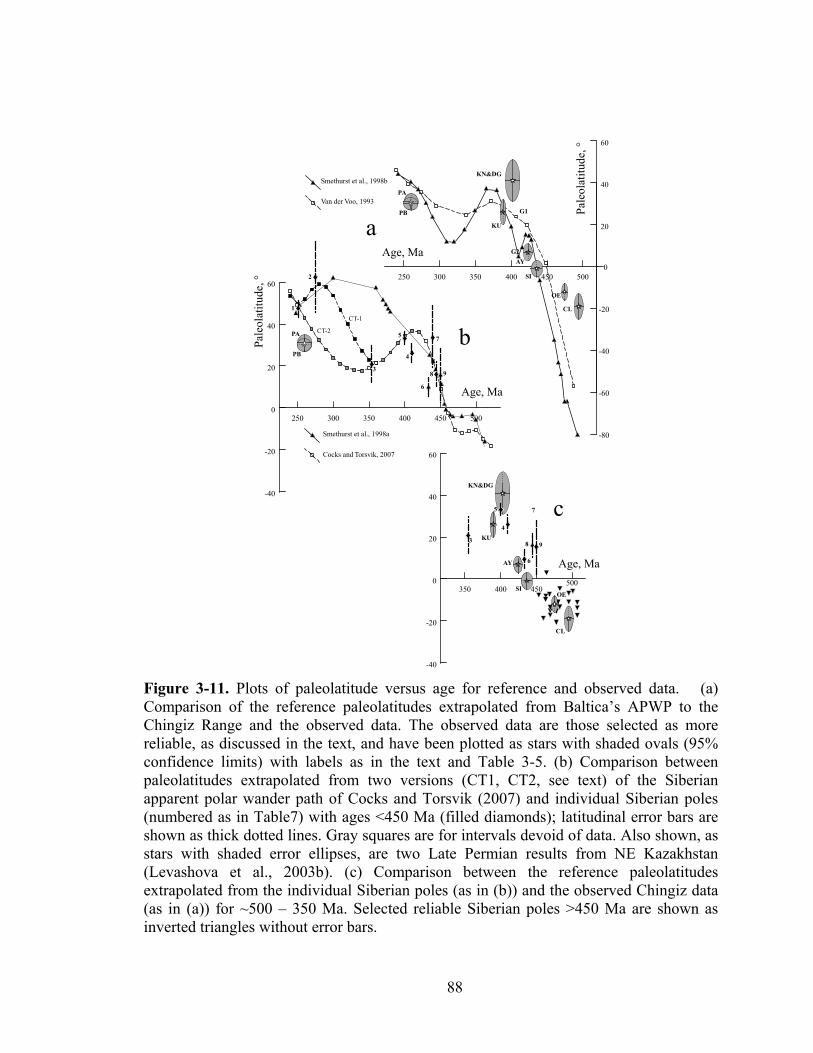
88
250 300 350 400 450 500
-60
-40
-20
0
20
40
60
250 300 350 400 450 500
-40
-20
0
20
40
60
1
2
3
5
4
6
7
9
CT-2
CT-1
350 400 450500
Van der Voo, 1993
Smethurst et al., 1998b
-40
-20
0
20
40
60
KN&DG
KU
AY
SIOE
CL
KN&DG
KU
AY
SI
PA
PB G1
G2
OE
CL
-80
3
5
4
6
7
98
8
Cocks and Torsvik, 2007
Smethurst et al., 1998a
a
b
c
Age, Ma
Age, Ma
Age, MaPa
leol
atitu
de, °
Pale
olat
itude
, °
PA
PB
Figure 3-11. Plots of paleolatitude versus age for reference and observed data. (a) Comparison of the reference paleolatitudes extrapolated from Baltica’s APWP to the Chingiz Range and the observed data. The observed data are those selected as more reliable, as discussed in the text, and have been plotted as stars with shaded ovals (95% confidence limits) with labels as in the text and Table 3-5. (b) Comparison between paleolatitudes extrapolated from two versions (CT1, CT2, see text) of the Siberian apparent polar wander path of Cocks and Torsvik (2007) and individual Siberian poles (numbered as in Table7) with ages <450 Ma (filled diamonds); latitudinal error bars are shown as thick dotted lines. Gray squares are for intervals devoid of data. Also shown, as stars with shaded error ellipses, are two Late Permian results from NE Kazakhstan (Levashova et al., 2003b). (c) Comparison between the reference paleolatitudes extrapolated from the individual Siberian poles (as in (b)) and the observed Chingiz data (as in (a)) for ~500 – 350 Ma. Selected reliable Siberian poles >450 Ma are shown as inverted triangles without error bars.
89
idea that Siberia and the Chingiz moved with a certain coherence after the Late
Cambrian, similar to the conclusion we reached about the Baltica – NTS (= North Tien
Shan) pair in an earlier report (Levashova et al., 2007).
Comparison with published paleogeographic models Not surprisingly, most of the thus far published paleogeographic models do not
assume any kinematic affiliation between Siberia and Chingiz. According to several
Russian authors (Mossakovsky et al., 1993; Didenko et al., 1994; Filippova et al., 2001;
Kheraskova et al., 2003), the UMB was formed by the closure of the Paleoasian Ocean,
in which an archipelago of scattered Precambrian microcontinents, oceanic basins, and
island arc segments existed in the Paleozoic. In their view, the most important role in the
UMB amalgamation is played by diachronous opening and closing of the intervening
oceans and, therefore, by similarly diachronous collisions of microcontinents and island
arcs. The essential concepts of such models are similar, but they vary markedly in their
details. For instance, Mossakovsky et al. (1993) and Didenko et al. (1994) assume that
most microcontinents and island arcs docked to Siberia and formed a composite
Kazakhstanian – Siberian continent in the Silurian, whereas Filippova et al. (2001)
suggested that several of these units collided with each other first, thereby forming an
independently moving mid-Paleozoic Kazakhstanian continent.
A different group of scenarios envisions the existence of a long and prominent
volcanic arc system (Şengör and Natal'in, 1996; Yakubchuk et al., 2001; 2002; Stampfli
and Borel, 2002). Şengör and Natal'in (1996), for instance, assumed that a continuous
Kipchak Arc connected the Siberian and Baltica cratons in the early Paleozoic. In their
views, arc motions are therefore linked to the kinematics of Siberia and Baltica, so that a
certain coherence of the Siberian and Chingiz paleolatitudes, or those between Baltica
and North Tien Shan, is to be expected. As is clear from our previous section, we see
confirmation to some extent for these ideas in the paleomagnetic data (see also
Levashova et al., 2007).
At the same time, much detail in the model of Şengör and Natal'in (1996) remains
to be validated, as it assumes very specific kinematics of the major cratons. For example,
from the Vendian until the end of the Devonian, Siberia would have to have been located
90
about 2000 km to the north from Baltica (Fig. 3-12 b). Such a configuration is necessary
for the existence of a large ocean (called Khanty-Mansi) between Baltica and Siberia that
is thought to have been bounded by the Kipchak Arc as a long-lived subduction feature.
Further discussion of this topic is outside the scope of this paper, not because it is
irrelevant, but because with the paleomagnetic contributions of our studies we cannot
make inroads towards resolution or rejection of several such aspects.
The Early Silurian pole of Shatsillo et al. (2007) places Siberia closer to Baltica
than most other paleogeographic portrayals for Silurian time, and also closer than is
typically shown for Ordovician or Devonian times. Thus, it appears that the relative
positions of Baltica and Siberia in the middle Paleozoic may have varied to some extent.
We make an attempt to show schematically the paleogeography of Baltica, Kazakhstan
and Siberia, while satisfying the following constraints: (1) The Chingiz is moving in
accord with, and remains close to, Siberia (this study); (2) The Kokchetav-North Tien
Shan domain (KNTD) is moving approximately in accord with Baltica (Levashova et al.,
2007); (3) The original Devonian volcanic belt is rectilinear and trends about 135°
(Abrajevitch et al., 2007), and (4) Baltica and Siberia are in the latitudinal positions
mandated by their paleomagnetic data.
Note in particular, that 1) and 2) do not imply an absolutely rigid connection
between the cratons and UMB units, but suggest rather that a limit should be placed on
the possible relative motions between them to a value of 1000 km or less.
With this information and limits in mind, we propose a schematic reconstruction
of Baltica, Kazakhstan and Siberia for mid-Silurian time (Fig. 3-12b). The reconstruction
differs from previous paleogeographic configurations in a more westerly position of
Siberia with respect to Baltica as well as a nearly rectilinear “ribbon” Kazakhstan
continent, that is in sharp contrast to much more complicated predictions of other authors.
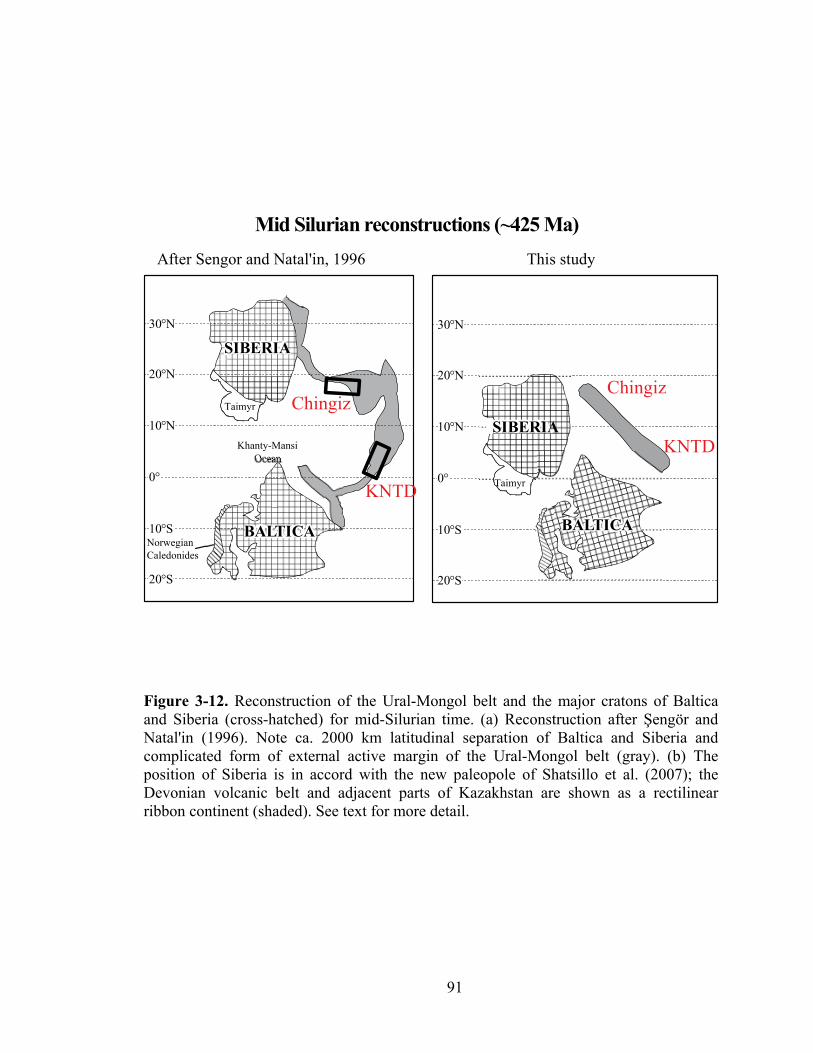
91
Khanty-MansiOcean
NorwegianCaledonides
0°
10°S
20°S
10°N
20°N
30°N
0°
10°S
20°S
10°N
20°N
30°N
SIBERIASIBERIA
BALTICABALTICA
Taimyr
0°
10°S
20°S
10°N
20°N
30°N
0°
10°S
20°S
10°N
20°N
30°N
SIBERIASIBERIA
TaimyrKNTD
KNTD
ChingizChingiz
BALTICABALTICA
After Sengor and Natal'in, 1996 This study
Mid Silurian reconstructions (~425 Ma)
Figure 3-12. Reconstruction of the Ural-Mongol belt and the major cratons of Baltica and Siberia (cross-hatched) for mid-Silurian time. (a) Reconstruction after Şengör and Natal'in (1996). Note ca. 2000 km latitudinal separation of Baltica and Siberia and complicated form of external active margin of the Ural-Mongol belt (gray). (b) The position of Siberia is in accord with the new paleopole of Shatsillo et al. (2007); the Devonian volcanic belt and adjacent parts of Kazakhstan are shown as a rectilinear ribbon continent (shaded). See text for more detail.
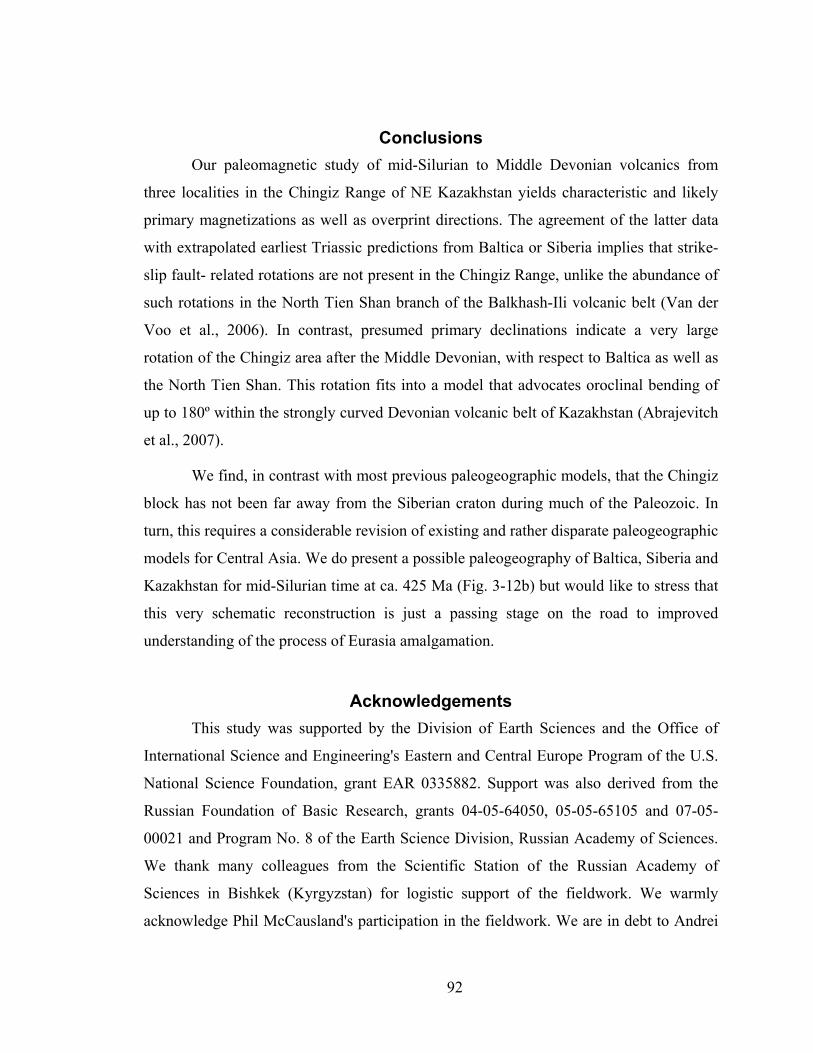
92
Conclusions Our paleomagnetic study of mid-Silurian to Middle Devonian volcanics from
three localities in the Chingiz Range of NE Kazakhstan yields characteristic and likely
primary magnetizations as well as overprint directions. The agreement of the latter data
with extrapolated earliest Triassic predictions from Baltica or Siberia implies that strike-
slip fault- related rotations are not present in the Chingiz Range, unlike the abundance of
such rotations in the North Tien Shan branch of the Balkhash-Ili volcanic belt (Van der
Voo et al., 2006). In contrast, presumed primary declinations indicate a very large
rotation of the Chingiz area after the Middle Devonian, with respect to Baltica as well as
the North Tien Shan. This rotation fits into a model that advocates oroclinal bending of
up to 180º within the strongly curved Devonian volcanic belt of Kazakhstan (Abrajevitch
et al., 2007).
We find, in contrast with most previous paleogeographic models, that the Chingiz
block has not been far away from the Siberian craton during much of the Paleozoic. In
turn, this requires a considerable revision of existing and rather disparate paleogeographic
models for Central Asia. We do present a possible paleogeography of Baltica, Siberia and
Kazakhstan for mid-Silurian time at ca. 425 Ma (Fig. 3-12b) but would like to stress that
this very schematic reconstruction is just a passing stage on the road to improved
understanding of the process of Eurasia amalgamation.
Acknowledgements This study was supported by the Division of Earth Sciences and the Office of
International Science and Engineering's Eastern and Central Europe Program of the U.S.
National Science Foundation, grant EAR 0335882. Support was also derived from the
Russian Foundation of Basic Research, grants 04-05-64050, 05-05-65105 and 07-05-
00021 and Program No. 8 of the Earth Science Division, Russian Academy of Sciences.
We thank many colleagues from the Scientific Station of the Russian Academy of
Sciences in Bishkek (Kyrgyzstan) for logistic support of the fieldwork. We warmly
acknowledge Phil McCausland's participation in the fieldwork. We are in debt to Andrei
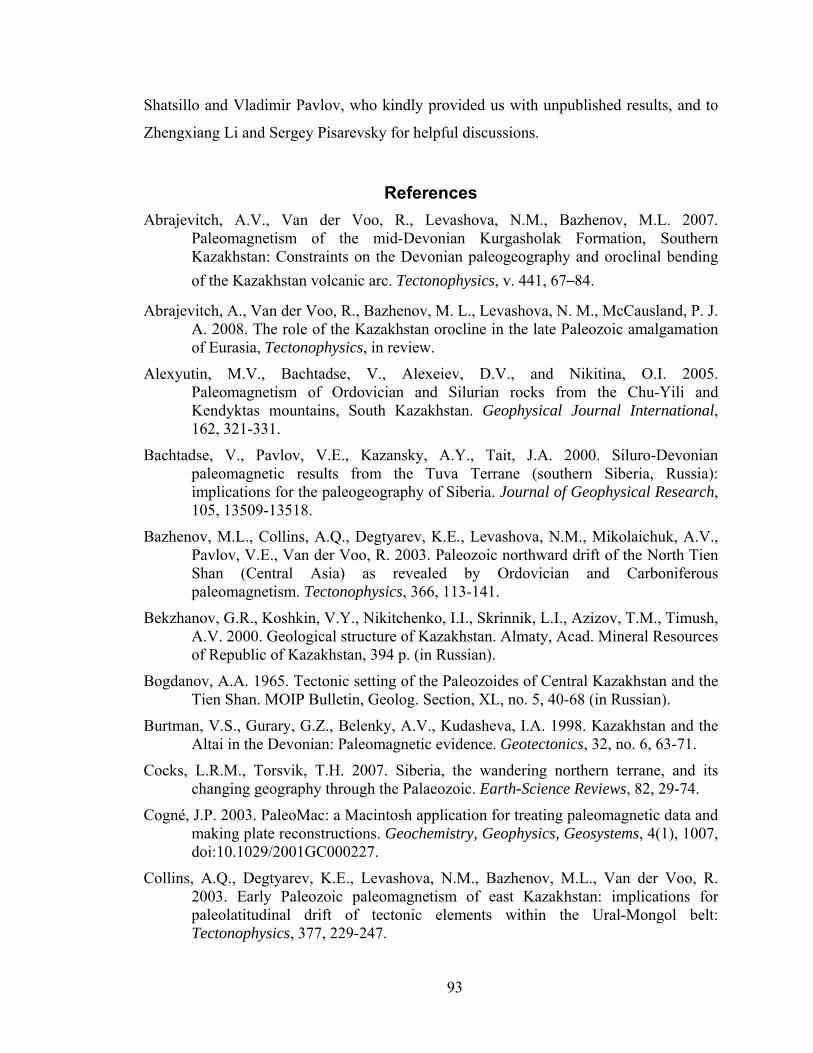
93
Shatsillo and Vladimir Pavlov, who kindly provided us with unpublished results, and to
Zhengxiang Li and Sergey Pisarevsky for helpful discussions.
References Abrajevitch, A.V., Van der Voo, R., Levashova, N.M., Bazhenov, M.L. 2007.
Paleomagnetism of the mid-Devonian Kurgasholak Formation, Southern Kazakhstan: Constraints on the Devonian paleogeography and oroclinal bending of the Kazakhstan volcanic arc. Tectonophysics, v. 441, 67–84.
Abrajevitch, A., Van der Voo, R., Bazhenov, M. L., Levashova, N. M., McCausland, P. J. A. 2008. The role of the Kazakhstan orocline in the late Paleozoic amalgamation of Eurasia, Tectonophysics, in review.
Alexyutin, M.V., Bachtadse, V., Alexeiev, D.V., and Nikitina, O.I. 2005. Paleomagnetism of Ordovician and Silurian rocks from the Chu-Yili and Kendyktas mountains, South Kazakhstan. Geophysical Journal International, 162, 321-331.
Bachtadse, V., Pavlov, V.E., Kazansky, A.Y., Tait, J.A. 2000. Siluro-Devonian paleomagnetic results from the Tuva Terrane (southern Siberia, Russia): implications for the paleogeography of Siberia. Journal of Geophysical Research, 105, 13509-13518.
Bazhenov, M.L., Collins, A.Q., Degtyarev, K.E., Levashova, N.M., Mikolaichuk, A.V., Pavlov, V.E., Van der Voo, R. 2003. Paleozoic northward drift of the North Tien Shan (Central Asia) as revealed by Ordovician and Carboniferous paleomagnetism. Tectonophysics, 366, 113-141.
Bekzhanov, G.R., Koshkin, V.Y., Nikitchenko, I.I., Skrinnik, L.I., Azizov, T.M., Timush, A.V. 2000. Geological structure of Kazakhstan. Almaty, Acad. Mineral Resources of Republic of Kazakhstan, 394 p. (in Russian).
Bogdanov, A.A. 1965. Tectonic setting of the Paleozoides of Central Kazakhstan and the Tien Shan. MOIP Bulletin, Geolog. Section, XL, no. 5, 40-68 (in Russian).
Burtman, V.S., Gurary, G.Z., Belenky, A.V., Kudasheva, I.A. 1998. Kazakhstan and the Altai in the Devonian: Paleomagnetic evidence. Geotectonics, 32, no. 6, 63-71.
Cocks, L.R.M., Torsvik, T.H. 2007. Siberia, the wandering northern terrane, and its changing geography through the Palaeozoic. Earth-Science Reviews, 82, 29-74.
Cogné, J.P. 2003. PaleoMac: a Macintosh application for treating paleomagnetic data and making plate reconstructions. Geochemistry, Geophysics, Geosystems, 4(1), 1007, doi:10.1029/2001GC000227.
Collins, A.Q., Degtyarev, K.E., Levashova, N.M., Bazhenov, M.L., Van der Voo, R. 2003. Early Paleozoic paleomagnetism of east Kazakhstan: implications for paleolatitudinal drift of tectonic elements within the Ural-Mongol belt: Tectonophysics, 377, 229-247.
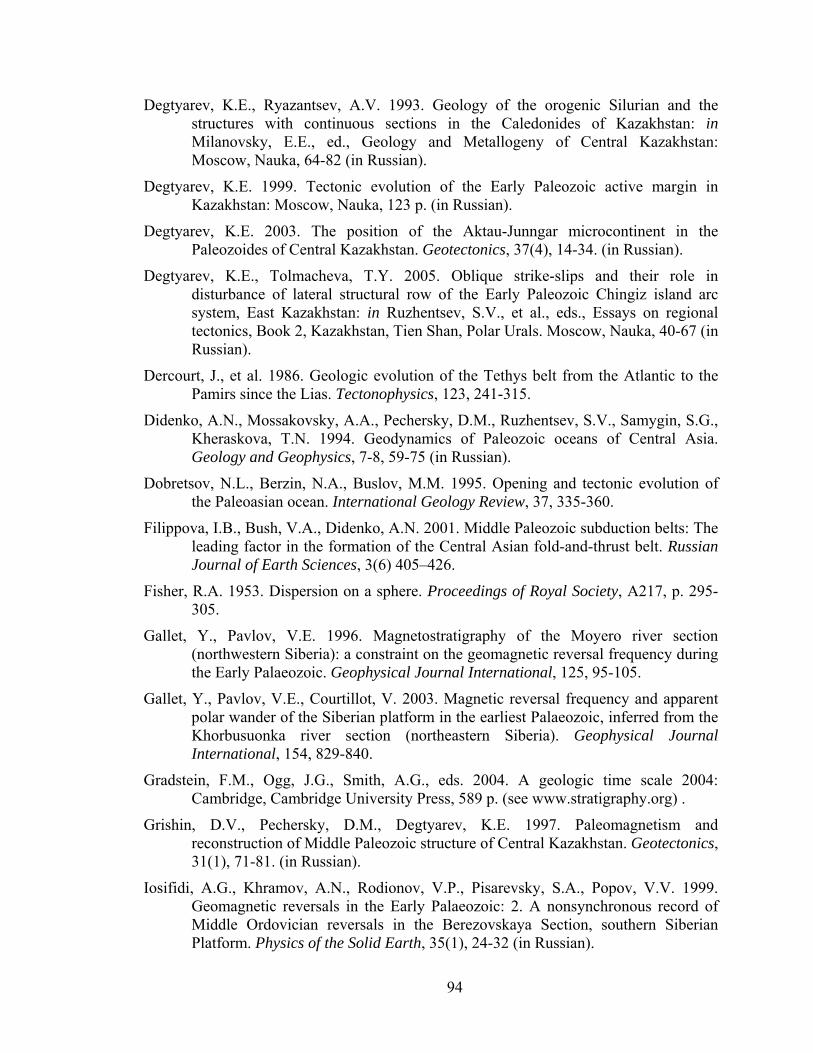
94
Degtyarev, K.E., Ryazantsev, A.V. 1993. Geology of the orogenic Silurian and the structures with continuous sections in the Caledonides of Kazakhstan: in Milanovsky, E.E., ed., Geology and Metallogeny of Central Kazakhstan: Moscow, Nauka, 64-82 (in Russian).
Degtyarev, K.E. 1999. Tectonic evolution of the Early Paleozoic active margin in Kazakhstan: Moscow, Nauka, 123 p. (in Russian).
Degtyarev, K.E. 2003. The position of the Aktau-Junngar microcontinent in the Paleozoides of Central Kazakhstan. Geotectonics, 37(4), 14-34. (in Russian).
Degtyarev, K.E., Tolmacheva, T.Y. 2005. Oblique strike-slips and their role in disturbance of lateral structural row of the Early Paleozoic Chingiz island arc system, East Kazakhstan: in Ruzhentsev, S.V., et al., eds., Essays on regional tectonics, Book 2, Kazakhstan, Tien Shan, Polar Urals. Moscow, Nauka, 40-67 (in Russian).
Dercourt, J., et al. 1986. Geologic evolution of the Tethys belt from the Atlantic to the Pamirs since the Lias. Tectonophysics, 123, 241-315.
Didenko, A.N., Mossakovsky, A.A., Pechersky, D.M., Ruzhentsev, S.V., Samygin, S.G., Kheraskova, T.N. 1994. Geodynamics of Paleozoic oceans of Central Asia. Geology and Geophysics, 7-8, 59-75 (in Russian).
Dobretsov, N.L., Berzin, N.A., Buslov, M.M. 1995. Opening and tectonic evolution of the Paleoasian ocean. International Geology Review, 37, 335-360.
Filippova, I.B., Bush, V.A., Didenko, A.N. 2001. Middle Paleozoic subduction belts: The leading factor in the formation of the Central Asian fold-and-thrust belt. Russian Journal of Earth Sciences, 3(6) 405–426.
Fisher, R.A. 1953. Dispersion on a sphere. Proceedings of Royal Society, A217, p. 295-305.
Gallet, Y., Pavlov, V.E. 1996. Magnetostratigraphy of the Moyero river section (northwestern Siberia): a constraint on the geomagnetic reversal frequency during the Early Palaeozoic. Geophysical Journal International, 125, 95-105.
Gallet, Y., Pavlov, V.E., Courtillot, V. 2003. Magnetic reversal frequency and apparent polar wander of the Siberian platform in the earliest Palaeozoic, inferred from the Khorbusuonka river section (northeastern Siberia). Geophysical Journal International, 154, 829-840.
Gradstein, F.M., Ogg, J.G., Smith, A.G., eds. 2004. A geologic time scale 2004: Cambridge, Cambridge University Press, 589 p. (see www.stratigraphy.org) .
Grishin, D.V., Pechersky, D.M., Degtyarev, K.E. 1997. Paleomagnetism and reconstruction of Middle Paleozoic structure of Central Kazakhstan. Geotectonics, 31(1), 71-81. (in Russian).
Iosifidi, A.G., Khramov, A.N., Rodionov, V.P., Pisarevsky, S.A., Popov, V.V. 1999. Geomagnetic reversals in the Early Palaeozoic: 2. A nonsynchronous record of Middle Ordovician reversals in the Berezovskaya Section, southern Siberian Platform. Physics of the Solid Earth, 35(1), 24-32 (in Russian).
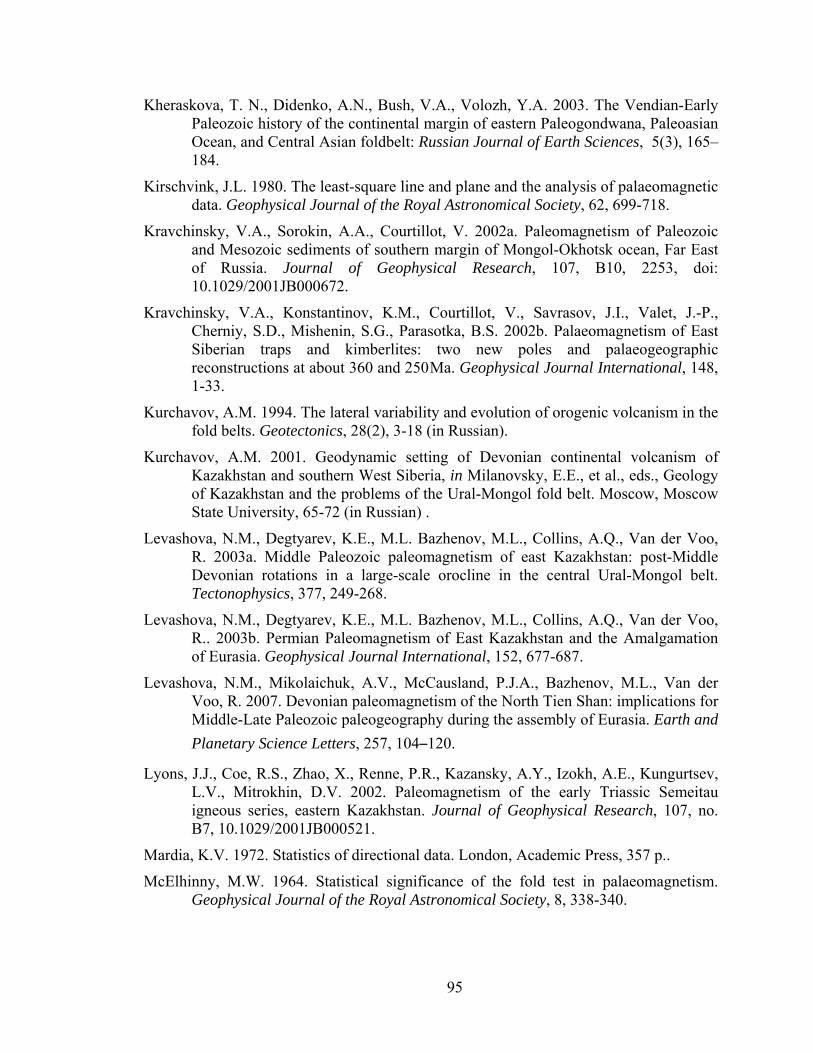
95
Kheraskova, T. N., Didenko, A.N., Bush, V.A., Volozh, Y.A. 2003. The Vendian-Early Paleozoic history of the continental margin of eastern Paleogondwana, Paleoasian Ocean, and Central Asian foldbelt: Russian Journal of Earth Sciences, 5(3), 165–184.
Kirschvink, J.L. 1980. The least-square line and plane and the analysis of palaeomagnetic data. Geophysical Journal of the Royal Astronomical Society, 62, 699-718.
Kravchinsky, V.A., Sorokin, A.A., Courtillot, V. 2002a. Paleomagnetism of Paleozoic and Mesozoic sediments of southern margin of Mongol-Okhotsk ocean, Far East of Russia. Journal of Geophysical Research, 107, B10, 2253, doi: 10.1029/2001JB000672.
Kravchinsky, V.A., Konstantinov, K.M., Courtillot, V., Savrasov, J.I., Valet, J.-P., Cherniy, S.D., Mishenin, S.G., Parasotka, B.S. 2002b. Palaeomagnetism of East Siberian traps and kimberlites: two new poles and palaeogeographic reconstructions at about 360 and 250Ma. Geophysical Journal International, 148, 1-33.
Kurchavov, A.M. 1994. The lateral variability and evolution of orogenic volcanism in the fold belts. Geotectonics, 28(2), 3-18 (in Russian).
Kurchavov, A.M. 2001. Geodynamic setting of Devonian continental volcanism of Kazakhstan and southern West Siberia, in Milanovsky, E.E., et al., eds., Geology of Kazakhstan and the problems of the Ural-Mongol fold belt. Moscow, Moscow State University, 65-72 (in Russian) .
Levashova, N.M., Degtyarev, K.E., M.L. Bazhenov, M.L., Collins, A.Q., Van der Voo, R. 2003a. Middle Paleozoic paleomagnetism of east Kazakhstan: post-Middle Devonian rotations in a large-scale orocline in the central Ural-Mongol belt. Tectonophysics, 377, 249-268.
Levashova, N.M., Degtyarev, K.E., M.L. Bazhenov, M.L., Collins, A.Q., Van der Voo, R.. 2003b. Permian Paleomagnetism of East Kazakhstan and the Amalgamation of Eurasia. Geophysical Journal International, 152, 677-687.
Levashova, N.M., Mikolaichuk, A.V., McCausland, P.J.A., Bazhenov, M.L., Van der Voo, R. 2007. Devonian paleomagnetism of the North Tien Shan: implications for Middle-Late Paleozoic paleogeography during the assembly of Eurasia. Earth and Planetary Science Letters, 257, 104–120.
Lyons, J.J., Coe, R.S., Zhao, X., Renne, P.R., Kazansky, A.Y., Izokh, A.E., Kungurtsev, L.V., Mitrokhin, D.V. 2002. Paleomagnetism of the early Triassic Semeitau igneous series, eastern Kazakhstan. Journal of Geophysical Research, 107, no. B7, 10.1029/2001JB000521.
Mardia, K.V. 1972. Statistics of directional data. London, Academic Press, 357 p..
McElhinny, M.W. 1964. Statistical significance of the fold test in palaeomagnetism. Geophysical Journal of the Royal Astronomical Society, 8, 338-340.
96
McFadden, P.L., McElhinny, M.W. 1988. The combined analysis of remagnetization circles and direct observations in palaeomagnetism. Earth and Planetary Science Letters, 87, 161-172.
McFadden, P.L., Reid, A.B. 1982. Analysis of paleomagnetic inclination data. Geophysical Journal of the Royal Astronomical Society, 69, 307-319.
Merrill, R.T., McElhinny, M.W., McFadden, P.L. 1996. The magnetic field of the Earth: Acad. Press, San Diego, 527 p.
Mossakovsky, A.A., Ruzhentsev, S.V., Samygin, S.G., Kheraskova, T.N. 1993 Central Asian fold belt. Geodynamic evolution and formation: Geotectonics, 27(6), 3-32.
Natal’in, B.A., Şengör, A.M.C. 2005. Late Palaeozoic to Triassic evolution of the Turan and Scythian platforms: the pre-history of the palaeo-Tethyan closure. Tectonophysics, 404, 175-202.
Opdyke, N.D., Channell, J.E.T. 1996. Magnetic stratigraphy. International Geophysics Series, v. 64, London, New York, Academic Press, 346 p.
Pavlov, V.E., Gallet, Y. 1998. Upper Cambrian to Middle Ordovician magnetostratigraphy from the Kulumbe river section (northwestern Siberia). Physics of the Earth and Planetary Interiors, 108, 49-59.
Pavlov, V.E., Gallet, Y. 2001. Middle Cambrian high magnetic reversal frequency (Kulumbe River section, northwestern Siberia) and reversal behavior during the Early Palaeozoic. Earth and Planetary Science Letters, 185, 173-183.
Pavlov, V.E., Shatsillo, A.V., Veselovsky, R.V. 2003. Magnetostratigraphy of the Middle Angara Ordovician section: more evidence in support of the third Phanerozoic superchron, in Gapeev, A.K., ed., Paleomagnetism and rock magnetism: theory, practice and experiment: GEOS, Moscow, p. 57-60 (in Russian).
Pavlov, V.E., Courtillot, V., Bazhenov, M.L., Veselovsky, R.V. 2007. Paleomagnetism of the Siberian traps: new data and a new overall 250 Ma pole for Siberia. Tectonophysics, 443, 72–92.
Pavlov, V., Gallet, Y., Bachtadse, V., Mikhailov, V. 2008. New paleomagnetic data for the Middle Cambrian and Middle Ordovician of the Siberian platform: Llandeilian magnetostratigraphy and the hypothesis of relative rotation between the Aldan and Anabar-Angara blocks. Earth and Planetary Science Letters, (submitted).
Pisarevsky, S.A., Gurevich, E.L., Khramov, A.N. 1997. Paleomagnetism of Lower Cambrian sediments from the Olenek river section (northern Siberia): paleopoles and the problem of magnetic polarity in the Early Cambrian. Geophysical Journal International, 130, 746-756.
Pisarevsky, S. A., Gladkochub, D.P., Donskaya, T.A., De Waele, B., Mazukabzov, A.M. 2006. Palaeomagnetism and geochronology of mafic dykes in south Siberia, Russia: the first precisely dated Early Permian palaeomagnetic pole from the Siberian craton. Geophysical Journal International, 167, p. 649-658.
97
Puchkov, V.N. 1997. Tectonics of the Urals: modern conceptions. Geotectonics, 31, no 4, 30-45.
Puchkov, V.N. 2000. Paleogeodynamics of the Southern and Middle Urals. Ufa, Dauria, 146 p. (in Russian).
Rodionov, V.P., Dekkers, M.J., Khramov, A.N., Gurevich, E.L., Krijgsman, W., Duermeijer, C.E., Heslop, D. 2003. Paleomagnetism and cyclostratigraphy of the Middle Ordovician Krivolutsky Suite, Krivaya Luka section, Southern Siberian platform: record of non-synchronous NRM components or a non-axial geomagnetic field? Studies in Geophysics and Geodesy, 47, 255−274.
Sal’menova, K.Z., Koshkin, V.Y. 1990. Stratigraphy and flora of the Late Paleozoic in the North Balkhash area. Almaty, Nauka, 160 p. (in Russian).
Samygin, S.G. 1974. The Chingiz strike-slip fault and its position in the structure of Central Kazakhstan. Moscow, Nauka, 208 p. (in Russian).
Schegoleva, L.A., Belyaev, O.E., Bilenko, E.A., Zhuravlev, B.Y., Kabanov, Y.F., Malinovskaya, S.P., Yurina, A.L. 1993. New data on correlation of Lower and Middle Devonian volcanic sequences in the central and eastern segments of the Devonian volcanic belt and adjacent parts of Central Kazakhstan: in Milanovsky E.E., ed., Geology and Metallogeny of Central Kazakhstan. Moscow, Nauka, p. 82-99 (in Russian).
Şengör, A.M.C., Natal'in, B.A. 1996. Paleotectonics of Asia: fragments of a synthesis, in Yin, A. et al., eds., The tectonic evolution of Asia. Cambridge, Cambridge University Press, p. 486-640.
Schmidt, P.W. 1985. Bias in converging great circle methods. Earth and Planetary Science Letters, 72, 427-432.
Shatsillo, A.V., Pavlov, V.E., Paverman, V.I. 2007. The Middle Paleozoic segment of the Siberian APWP: Early Silurian paleomagnetic results from the Nyuya-Berezov area. Fizika Zemli, (in press; in Russian).
Smethurst, M.A., Khramov, A.N., Torsvik, T.H. 1998a. The Neoproterozoic and Paleozoic paleomagnetic data for the Siberian platform: from Rodinia to Pangea. Earth-Science Reviews, 43, 1-24.
Smethurst, M.A., Khramov, A.N., Pisarevsky, S.A. 1998b. Palaeomagnetism of the Lower Ordovician Orthoceras Limestone, St. Petersburg, and a revised drift history for Baltica in the Early Palaeozoic. Geophysical Journal International, 133, 44-56.
Stampfli, G.M., Borel, G.D. 2002. A plate tectonic model for the Paleozoic and Mesozoic constrained by dynamic plate boundaries and restored synthetic oceanic isochrones. Earth and Planetary Science Letters, 196, 17-33.
Surkis, Y.F., Westphal, M., Rodionov, V.P., Khramov, A.N., Gurevich, E.L. 1999. Geomagnetic reversals in Early Palaeozoic. 3 - Reversals recorded in Lower Ordovician Redbeds, Mandra section. Fizika Zemli, 5, 3-13 (in Russian).
98
Tectonics of Kazakhstan: Explanatory notes to Tectonic map of East Kazakhstan, 1:2 500 000. 1982. Moscow, Nauka, 139 p. (in Russian).
Tevelev, A.V. 2001. The evolution of the south-eastern margin of the Kazakhstan paleocontinent in the Late Paleozoic, in Milanovsky, E.E., et al., eds., Geology of Kazakhstan and the problems of the Ural-Mongol fold belt. Moscow, Moscow State University, p. 113-125 (in Russian).
Torsvik, T.H., Tait, J., Moralev, V.M., McKerrow, W.S., Sturt, B.A., Roberts, D. 1995. Ordovician paleogeography of Siberia and adjacent continents. Journal of the Geological Society of London, 152, 279-287.
Torsvik, T.H., Van der Voo, R., Meert, J.G., Mosar, J., Walderhaug, H.J. 2001. Reconstruction of the continents around the North Atlantic at about the 60th parallel. Earth and Planetary Science Letters, 187, 55-69.
Van der Voo, R. 1993. Paleomagnetism of the Atlantic, Tethys and Iapetus oceans. Cambridge, Cambridge University Press, 411 p.
Van der Voo, R., Levashova, N.M., Skrinnik, L.I., Kara, T.V., Bazhenov, M.L. 2006. Late orogenic, large-scale rotations in the Tien Shan and adjacent mobile belts in Kyrgyzstan and Kazakhstan. Tectonophysics, 426, 335-360.
Yakubchuk, A.S., Seltmann, R., Shatov, V.V., Cole, A.. 2001. The Altaids: tectonic evolution and metallogeny. Society of Economic Geologists Newsletter, 46, 7-14.
Yakubchuk, A., Cole, A., Seltmann, R., Shatov, V.V. 2002. Tectonic setting, characteristics, and regional exploration criteria for gold mineralization in the Altaid tectonic collage: the Tien Shan province as a key example. Society of Economic Geologists, Special Publications, 9, 177-201.
Zaytsev, Y.A. 1984 Evolution of Geosynclines: oval, concentrically zonal type. Moscow, Nedra, 208 p. (in Russian).
Zonenshain, L.P., Kuzmin, M.I., Natapov, L.M. 1990. Geology of the USSR: a plate-tectonic synthesis. American Geophysical Union, Washington, D.C., Geodynamics Series, v. 21, 242 p.
Zijderveld, J.D.A. 1967. AC demagnetization of rocks: analysis of results: in Collinson, D.W. et al., eds., Methods in Paleomagnetism. Elsevier, Amsterdam, p. 254-286.
99
Chapter 4
The role of the Kazakhstan orocline in the late Paleozoic amalgamation of Eurasia
Abstract The Kazakhstan orocline, a pair of concentric horseshoe-shaped volcanic arcs of
Devonian (external) and late Paleozoic (internal) age, is thought to have formed as a
result of convergence between the cratons of Siberia, Baltica and Tarim leading to the
amalgamation of Eurasia. Paleomagnetic and geologic data indicate that in the Middle
Devonian the arc, which is now strongly curved, was nearly straight near the northwest-
southeast trending volcanic margin of a Kazakhstania continent. To constrain the age of
oroclinal bending we conducted a paleomagnetic study of Late Carboniferous to Late
Permian subduction-related volcanics from the middle (NW) and north-eastern (NE)
limbs of the orocline. Our new results indicate that the rotation of the middle arm of the
orocline was essentially completed by the earliest Permian, while the NE arm probably
was still ~ 30º short of it final orientation with respect to Baltica. The rotation of, or
rotation within, the NE arm was completed by the Late Permian.
The paleomagnetic data constraining the timing and rotation patterns lead us to
propose the following scenario for the bending of the Kazakhstan orocline. The orogenic
deformation scenario began in the Late Devonian when an initial collision with Tarim
pinned Kazakhstania’s southern corner, while a dextral shear motion and a considerable
clockwise rotation of Siberia dragged its northern end. Relative convergence between
Siberia and Tarim caused initial buckling of the Kazakhstania continental element
trapped between them, subdividing the belt into three (SW, NW, NE) segments.
Continued subduction under the established limbs of the orocline with an estimated

100
outward-directed subduction velocity of well less than 1 cm/yr gradually led to closure of
the intervening Junggar-Balkhash oceanic basin and tightening of the orocline.
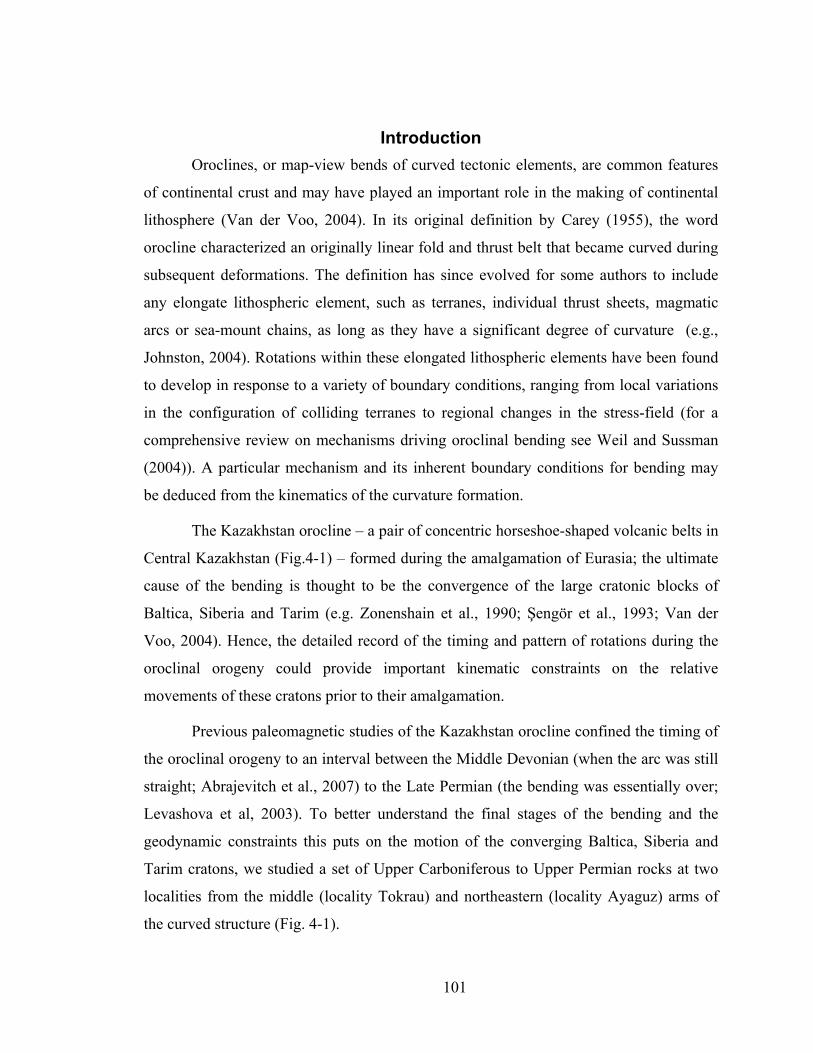
101
Introduction Oroclines, or map-view bends of curved tectonic elements, are common features
of continental crust and may have played an important role in the making of continental
lithosphere (Van der Voo, 2004). In its original definition by Carey (1955), the word
orocline characterized an originally linear fold and thrust belt that became curved during
subsequent deformations. The definition has since evolved for some authors to include
any elongate lithospheric element, such as terranes, individual thrust sheets, magmatic
arcs or sea-mount chains, as long as they have a significant degree of curvature (e.g.,
Johnston, 2004). Rotations within these elongated lithospheric elements have been found
to develop in response to a variety of boundary conditions, ranging from local variations
in the configuration of colliding terranes to regional changes in the stress-field (for a
comprehensive review on mechanisms driving oroclinal bending see Weil and Sussman
(2004)). A particular mechanism and its inherent boundary conditions for bending may
be deduced from the kinematics of the curvature formation.
The Kazakhstan orocline – a pair of concentric horseshoe-shaped volcanic belts in
Central Kazakhstan (Fig.4-1) – formed during the amalgamation of Eurasia; the ultimate
cause of the bending is thought to be the convergence of the large cratonic blocks of
Baltica, Siberia and Tarim (e.g. Zonenshain et al., 1990; Şengör et al., 1993; Van der
Voo, 2004). Hence, the detailed record of the timing and pattern of rotations during the
oroclinal orogeny could provide important kinematic constraints on the relative
movements of these cratons prior to their amalgamation.
Previous paleomagnetic studies of the Kazakhstan orocline confined the timing of
the oroclinal orogeny to an interval between the Middle Devonian (when the arc was still
straight; Abrajevitch et al., 2007) to the Late Permian (the bending was essentially over;
Levashova et al, 2003). To better understand the final stages of the bending and the
geodynamic constraints this puts on the motion of the converging Baltica, Siberia and
Tarim cratons, we studied a set of Upper Carboniferous to Upper Permian rocks at two
localities from the middle (locality Tokrau) and northeastern (locality Ayaguz) arms of
the curved structure (Fig. 4-1).
102
40 N
44 N
48 N
52 N
66 E 72 E 78 E
84 E
500 kmTarim
Altai
West Siberian basin
Pre-Devonan complexesof Kazakhstania
D2-C2 Kazakhstania’s passivemargin
C-P volcanic arcs
Late Paleozoic collisional belts
Continental blocks
Devonian Volcanic Belt
Late Paleozoic Volcanic BeltAccretionary wedgesD3-P2 back-arc basinsassociated with the Devonian Belt
Mz-Cz sedimentary basins
inferred direction of subductionmain faultsstructural trend
Junggar basin
Issyk-Kul
Zaisan
Balkh
ash
Irtysh-Zaisan
Ural
South Tien Shan
Figure 4-1. Location of the study area. Inset: Schematic map of Eurasia, showing the location of the Kazakhstan study area, wedged in between the European craton (“Baltica”) and Siberia. The main map presents a tectonic sketch of the study area, modified from Windley et al. (2007). D = Devonian, C=Carboniferous, P=Permian, Mz =Mesozoic, Cz = Cenozoic. Subscripts 2, 3 refer to Middle, Late. Sampling localities at Ayaguz and Tokrau are shown by large filled circles. The hinge zones of the Devonian volcanic belt, as mentioned in the text, are labeled Sa (Spassk anticlinorium) and ST (Sarysu – Tengiz uplift).
103
The tectonics of Kazakhstan and adjacent areas In the Early and Middle Devonian, the areas to the west and southwest of the
Devonian volcanic belt (Fig. 4-1) were above sea level, as indicated by continental red
beds and subaerial volcanics. Marine sedimentation started in the Late Devonian and
continued for most of Early Carboniferous time. These sediments are represented by
shallow-water limestones and clastic sediments; some marker horizons can sometimes be
traced over hundreds of kilometers. From the end of the Early Carboniferous, clastic
sedimentation, with rare shallow marine and lacustrine interbeds, continued in some
basins until Late Permian time. On the whole, the Early Devonian through Late Permian
geologic record is usually interpreted as resulting from accumulation under subaerial or
shallow-marine conditions. The complete lack of deep-water sediments, ophiolites, or
sutures led most geologists to conclude that this part of Kazakhstan was one large
continental mass during the second half of the Paleozoic.
The situation is less clear to the north and northeast of the Devonian belt, where
Devonian and younger rocks are less common and the record is less complete. Even
there, however, the Devonian is represented by continental red beds of limited thickness,
while deep-sea sediments are absent altogether. Despite numerous faults dissecting this
area, none was ever regarded as a suture of Devonian or younger age.
Hence it looks very likely that the above territories formed a single continent
(Kazakhstan block or microcontinent, also called Kazakhstania) at least since the Early
Devonian. For instance, a single landmass is shown on such different reconstructions as
those of Şengőr and Natal’in (1996) and Filipova et al. (2003). Rather strong and laterally
variable late Paleozoic deformation is agreed to by all scientists discussing the tectonics
of this micro-continent, so Kazakhstania was not a rigid block. The scale and character of
the deformation within Kazakhstan, however, remain rather controversial.
Kazakhstania is located in the center of the Eurasian continent and is made of
crust stabilized during the Paleozoic that is sandwiched between the old cratons of
Siberia, Baltica and Tarim (Fig. 4-1). Kazakhstania was assembled by accretion of
various blocks with Precambrian crust, island arc fragments, and accretionary complexes.
104
The mechanism of the early Paleozoic assembly and paleogeographic origin of the
fragments comprising Kazakhstania are a matter of contention; proposed models range
from collision of microcontinents that were originally separated by oceanic basins and
multiple island arcs (Mossakovsky, et al., 1993; Didenko et al., 1994; Dobretsov et al.,
1995; Filippova et al., 2001; Windley et al., 2007), to forearc accretion and oroclinal
bending of a single, long-lived subduction system (Şengör and Natal’in, 1996). Many
models agree, though, that by middle Paleozoic time, these fragments coalesced into a
single continental block, although the shape and tectonic elements of this block remain
contentious (see for example, Şengőr and Natal’in, 1996; Fillipova et al., 2001; Windley
et al., 2007). From the early Devonian onward, significant subduction of oceanic
(“Junggar-Balkhash”) lithosphere occurred underneath this continental element and led to
the Devonian and younger volcanic arcs of Figure 4-1. Carboniferous-Permian final
collisions with the surrounding Baltica, Siberia and Tarim cratons were probably
preceded by limited subduction in locations at the other three (exterior) sides of the
orocline (Fig. 4-1).
Unlike any other continental interior, the central part of Kazakhstania displays a
pair of concentric horseshoe-shaped volcanic belts (Fig. 4-1), which unconformably
overlie older structures. The area internal to the strongly curved volcanic structures is
dominated by rocks indicative of deeper marine environments, whereas the regions
surrounding it were either non-depositional highlands or epicontinental shallow marine
and non-marine basins (Zonenshain et al., 1990). The outer volcanic belt consists of a
sequence of Upper Silurian to Middle Devonian extrusives. In the Frasnian, volcanic
activity shifted to the more interior belt, about 150 km to the south, and continued there
in the Famennian-Tournaisian. Further inward displacement of volcanic activity occurred
in the Early Carboniferous and lasted until the Middle Permian (Tectonics of Kazakhstan,
1982). The composition of the volcanics, their calc-alkaline affinity and general
progression from basalt to andesite and/or dacite and then to rhyolite in all belts, indicates
that volcanics are subduction-related, and represent an Andean-type volcanic arc
(Zonenshain et al., 1990; Bakhtiev, 1987, Kurchavov, 1994; Skrinnik and Horst, 1995).
Previous paleomagnetic studies have demonstrated that in the Middle Devonian
the volcanic arc demarcated the eastern margin of Kazakhstania; the arc was nearly
105
straight and NW-SE trending (Abrajevitch et al., 2007; chapter 2 of this thesis). Today,
the shape of this Devonian volcanic belt can be approximated by three linear segments:
north-eastern (NE), middle (NW) and south-western (SW). Deviations of the Devonian
paleomagnetic directions in different arms of the orocline show that the SW arm has
experienced only a small net clockwise rotation (~20º) since the Middle Devonian,
whereas the middle arm has rotated clockwise by ~110º, and the NE arm by ~ 160º
(Abrajevitch et al., 2007; Levashova et al., 2008). The rotations are thought to have been
largely completed by the Early Triassic (Van der Voo, 2004; Van der Voo et al., 2006);
thus, the timing of the oroclinal orogeny can be considered as confined to the interval of
about 385 Ma to 240 Ma. To characterize the final stages of the bending, and to constrain
its age-span better, we have studied a set of Upper Carboniferous to Upper Permian rocks
at two localities from the middle (locality Tokrau) and NE (locality Ayaguz) arms of the
curved structure (Fig. 4-1).
Sampling and laboratory methods At all localities we sampled stratified rocks with various bedding attitudes to
permit a fold test. Geological sketches of the sampling areas and the locations of the
sampling sites for individual collections are shown in Figures 4-2a, 4-3a, 4-5a and 4-6a.
At both Tokrau and Ayaguz localities the sampled sections consist of lava flows
and tuffs of dacitic to rhyolitic composition, ignimbrites, and volcaniclastic breccia with
some conglomerates, sandstone and mudstone layers (Myasnikov, 1971). In the Ayaguz
area, this sequence is called the Koldar Formation. In the Tokrau area, we studied the
upper part of the Kalmakemel Formation, which is thought to be of Late Carboniferous –
Early Permian age (Tevelev, 2001; Tevelev, pers. comm. 2005).
The middle member of the Koldar Formation at Ayaguz is characterized by a
thick, laterally persistent sequence of lithoclastic tuffs with sedimentary interbeds. The
age assignment for this formation is based on relatively abundant flora (Noeggerathiopsis
theodori Zal. et Tschirk., Phyllotheca deliquescens (Goepp.) Schm., Paracalamites
frigidus Neub., etc.) found in the middle member (Myasnikov, 1971; Sal’menova and
Koshkin, 1990). The Late Carboniferous-Early Permian Formation age so reported must
106
be evaluated today within the East European stratigraphic scale as previously in use. The
age then corresponds to the Kasimovian-to mid-Kungurian stages (i.e., ~305 to 275 Ma)
of the latest geological time scale (Gradstein et al., 2004; Menning et al., 2006).
At the Tokrau locality, in addition to the Kalmakemel Formation rocks, we
sampled latest Early to Late Permian rocks of the Maitas Formation that overlies older
formations with a dis- or un-conformity marked by a basal conglomerate (Fig. 4-3). The
Maitas Formation consists of laterally varying volcanics of rhyolitic, andesitic and
basaltic composition, associated tuffs and rare tuffaceous sediments. The age of the
formation was determined based on lithologic-stratigraphic relationships and fossil flora
content (Paracalamites angustus Such., Noeggerathopsis concinna Radcz. etc.)
(Koshkin, 1974; Sal’menova and Koshkin, 1990). The previously reported age of the
Upper Permian rocks (again following previous East European conventions) corresponds
to the mid-Kungurian – Guadalupian – Lopingian (273-251 Ma) of the International
stratigraphic scale (Gradstein et al., 2004).
Samples for this study were collected either as oriented blocks or with a gasoline-
powered drill. Whenever weather permitted, both solar and magnetic compasses with an
inclinometer were used for sample orientation. Both methods gave identical readings,
indicating that magnetic intensities of the sampled rocks did not affect orientation
measurements.
In the laboratory, standard specimens were prepared from the collected samples;
cubes with ~20 mm side dimensions were cut from the block samples, and ~2.2 cm long
cylinders from the 2.5 cm diameter drill cores. Measurements of natural remanent
magnetization (NRM) were performed in the University of Michigan paleomagnetic
laboratory. The remanent intensities and directions were measured with a three-axis 2G
superconducting magnetometer. Alternating field demagnetization of a few pilot
specimens failed to isolate components of magnetization successfully. The bulk of the
specimens were therefore thermally demagnetized in an ASC TD-48 demagnetizer. Both
demagnetization and measurement were done in a magnetically shielded room with a
residual field < 200 nT. Results of the demagnetization treatments have been plotted in
orthogonal vector endpoint diagrams (Zijderveld, 1967) and in stereonets. For calculation
107
of the magnetization directions, principal component analysis (PCA, Kirschvink, 1980)
was used on linear segments of the Zijderveld plots; in cases where stable endpoints were
not obtained, as indicated by successive endpoints that could be seen moving as trends
along great circle paths, a combined analysis of remagnetization circles and direct
observations (McFadden & McElhinny, 1988) was used.
Results
Tokrau-A Rocks of the Kalmakemel Formation sampled at Tokrau-A show consistent
demagnetization behavior (Fig 4-2). Apart from a viscous magnetization that is usually
removed by 200-300ºC, all specimens show a well defined (Maximum Angular Deviation
(MAD) angle < 3º) characteristic component which decays to the origin. The typical
unblocking temperature range for this component is 550-675ºC, indicating hematite as
the principal magnetization carrier, although in two sites (a464, m9382) ~80% of NRM
intensity is lost between 533 and 566ºC, suggestive of fine-grained single-/pseudo-single
domain (SD/PSD) magnetite as the main carrier of magnetization. Site-mean directions of
the characteristic high temperature component pass the fold test (Fig. 4-4a; Table 4-1) as
well as the reversal test of McFadden and McElhinny (1990) with observed γ=3.11 being
smaller than the critical γ=9.26, strongly suggesting a pre-folding age of the
magnetization.
In addition to the high temperature component, most of the samples reveal the
presence of a second magnetization in the ~300-550ºC range. Some demagnetization
diagrams show clear separation of the two components (e.g. Fig. 4-2h, i). For the others,
the separation is incomplete due the overlapping temperature spectra of the high
temperature (HTC) and the intermediate temperature component (ITC) components, and
the ITC is revealed as a curved segment, or just a kink (Fig. 4-2f,j). Wherever the curved
segments were long enough, great circles were calculated for these segments. In sites that
had both direct observation of the ITC and the great circles, the McFadden and
McElhinny (1988) technique was used to calculate the site-mean direction of the ITC.
When only the great circles were available, a site-mean great circle was calculated. The
108
Figure 4-2. (a) Geologic sketch of the Tokrau-A sampling locality. (b-j) orthogonal demagnetization diagrams (Zijderveld, 1967) in tilt-corrected coordinates for representative samples of the Tokrau-A collection. Open (closed) symbols correspond to magnetization end-points projected onto the vertical (north-south horizontal) plane. Tick-marks denote intensities as labeled in mA/m.
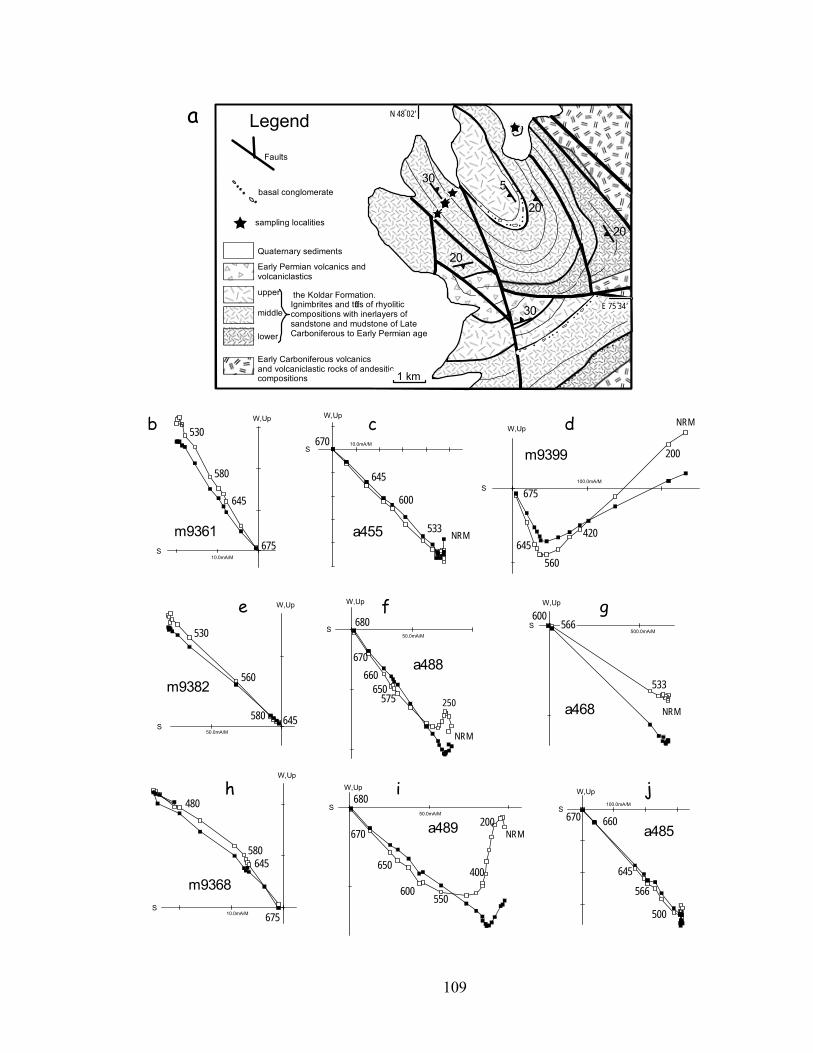
109
30
20
20
30
20
5
upper
middle
lower
Early Carboniferous volcanicsand volcaniclastic rocks of andesiticcompositions
the Koldar Formation.Ignimbrites and tuffs of rhyoliticcompositions with inerlayers ofsandstone and mudstone of LateCarboniferous to Early Permian age
Early Permian volcanics andvolcaniclastics
Faults
basal conglomerate
sampling localities
Quaternary sediments
Legend
m9399100.0mA/M
S
W,Up
675
645560
NRM
200
420
m9368
10.0mA/M S
W,Up
675
645580
480
m936110.0mA/M
S
W,Up
675
645
580
530
500.0mA/M S
W,Up
600
533
NRMa468
10.0mA/M S
W,Up
a455
670
645
600
533 NRM
m9382
50.0mA/M S
W,Up
645580
560
530 50.0mA/M S
W,Up
a488
680
670660
650575
NRM
250
50.0mA/M S
W,Up
a489
680
670
650
600
NRM200
400
550
100.0mA/M S
W,Up
a485660
645
566
500
670
a
c d
e f g
h i j
b
1 km
566
N 48 02’o
E 75 34’o
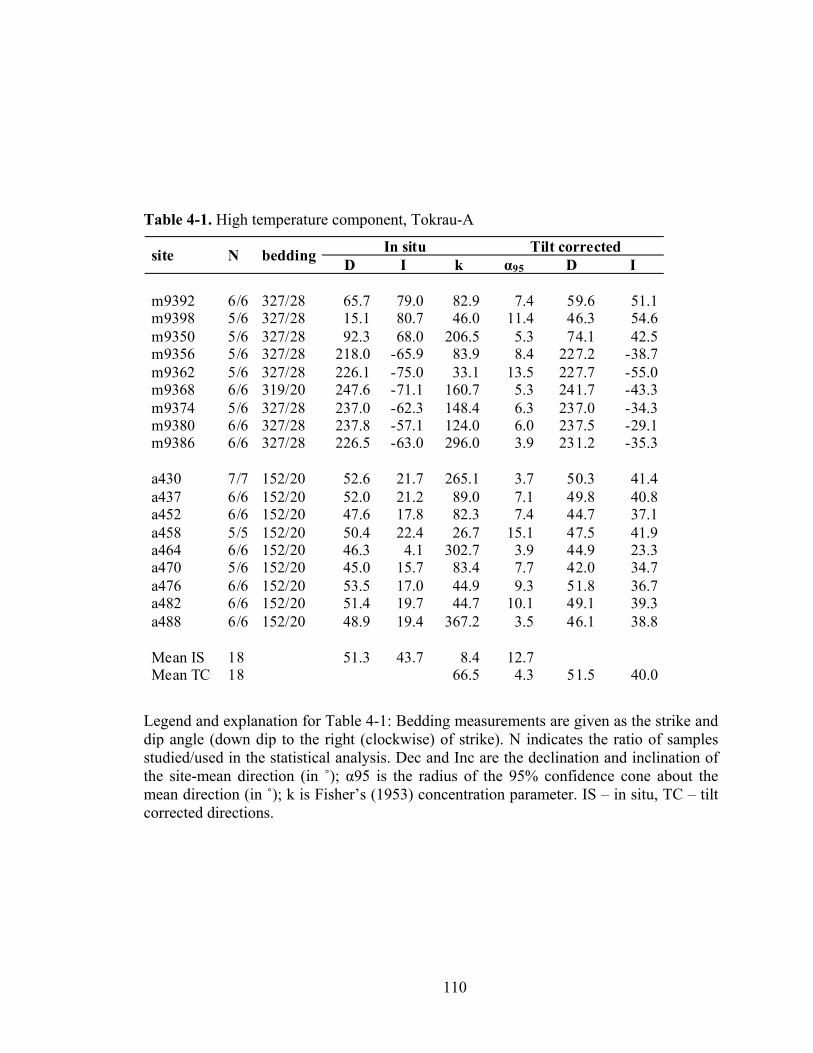
110
Table 4-1. High temperature component, Tokrau-A
In situ Tilt corrected site N bedding D I k α95 D I m9392 6/6 327/28 65.7 79.0 82.9 7.4 59.6 51.1m9398 5/6 327/28 15.1 80.7 46.0 11.4 46.3 54.6m9350 5/6 327/28 92.3 68.0 206.5 5.3 74.1 42.5m9356 5/6 327/28 218.0 -65.9 83.9 8.4 227.2 -38.7m9362 5/6 327/28 226.1 -75.0 33.1 13.5 227.7 -55.0m9368 6/6 319/20 247.6 -71.1 160.7 5.3 241.7 -43.3m9374 5/6 327/28 237.0 -62.3 148.4 6.3 237.0 -34.3m9380 6/6 327/28 237.8 -57.1 124.0 6.0 237.5 -29.1m9386 6/6 327/28 226.5 -63.0 296.0 3.9 231.2 -35.3 a430 7/7 152/20 52.6 21.7 265.1 3.7 50.3 41.4a437 6/6 152/20 52.0 21.2 89.0 7.1 49.8 40.8a452 6/6 152/20 47.6 17.8 82.3 7.4 44.7 37.1a458 5/5 152/20 50.4 22.4 26.7 15.1 47.5 41.9a464 6/6 152/20 46.3 4.1 302.7 3.9 44.9 23.3a470 5/6 152/20 45.0 15.7 83.4 7.7 42.0 34.7a476 6/6 152/20 53.5 17.0 44.9 9.3 51.8 36.7a482 6/6 152/20 51.4 19.7 44.7 10.1 49.1 39.3a488 6/6 152/20 48.9 19.4 367.2 3.5 46.1 38.8 Mean IS 18 51.3 43.7 8.4 12.7 Mean TC 18 66.5 4.3 51.5 40.0
Legend and explanation for Table 4-1: Bedding measurements are given as the strike and dip angle (down dip to the right (clockwise) of strike). N indicates the ratio of samples studied/used in the statistical analysis. Dec and Inc are the declination and inclination of the site-mean direction (in ˚); α95 is the radius of the 95% confidence cone about the mean direction (in ˚); k is Fisher’s (1953) concentration parameter. IS – in situ, TC – tilt corrected directions.
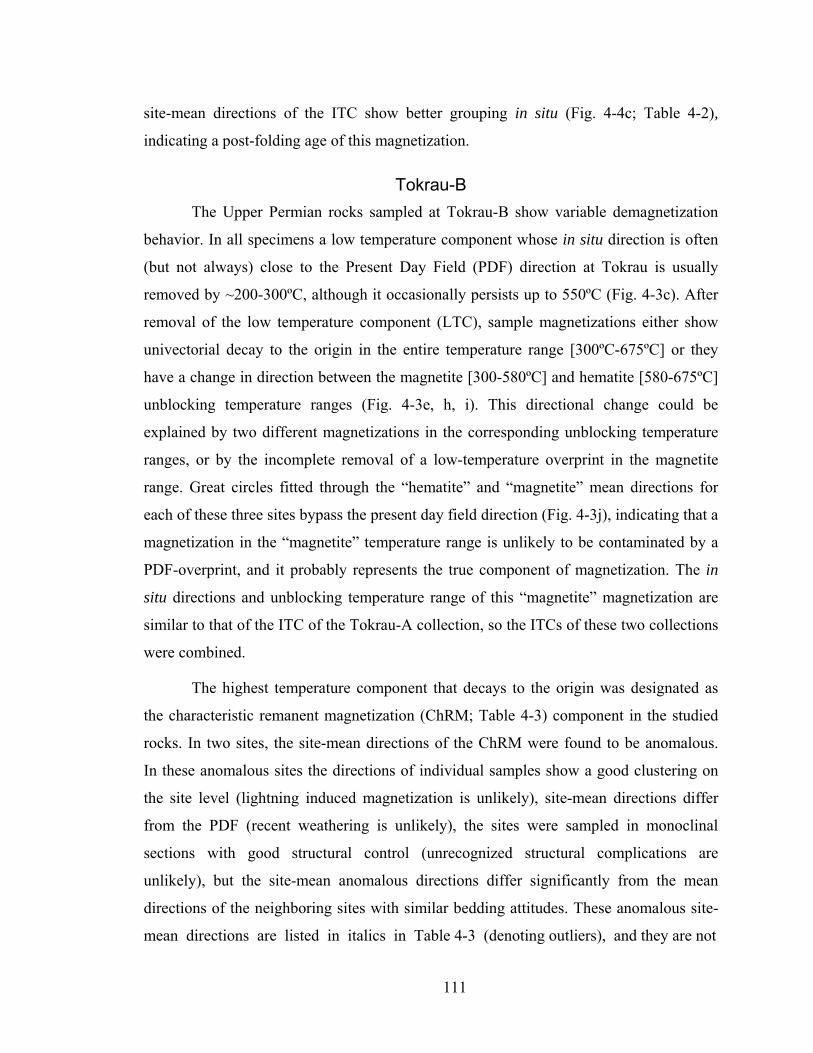
111
site-mean directions of the ITC show better grouping in situ (Fig. 4-4c; Table 4-2),
indicating a post-folding age of this magnetization.
Tokrau-B The Upper Permian rocks sampled at Tokrau-B show variable demagnetization
behavior. In all specimens a low temperature component whose in situ direction is often
(but not always) close to the Present Day Field (PDF) direction at Tokrau is usually
removed by ~200-300ºC, although it occasionally persists up to 550ºC (Fig. 4-3c). After
removal of the low temperature component (LTC), sample magnetizations either show
univectorial decay to the origin in the entire temperature range [300ºC-675ºC] or they
have a change in direction between the magnetite [300-580ºC] and hematite [580-675ºC]
unblocking temperature ranges (Fig. 4-3e, h, i). This directional change could be
explained by two different magnetizations in the corresponding unblocking temperature
ranges, or by the incomplete removal of a low-temperature overprint in the magnetite
range. Great circles fitted through the “hematite” and “magnetite” mean directions for
each of these three sites bypass the present day field direction (Fig. 4-3j), indicating that a
magnetization in the “magnetite” temperature range is unlikely to be contaminated by a
PDF-overprint, and it probably represents the true component of magnetization. The in
situ directions and unblocking temperature range of this “magnetite” magnetization are
similar to that of the ITC of the Tokrau-A collection, so the ITCs of these two collections
were combined.
The highest temperature component that decays to the origin was designated as
the characteristic remanent magnetization (ChRM; Table 4-3) component in the studied
rocks. In two sites, the site-mean directions of the ChRM were found to be anomalous.
In these anomalous sites the directions of individual samples show a good clustering on
the site level (lightning induced magnetization is unlikely), site-mean directions differ
from the PDF (recent weathering is unlikely), the sites were sampled in monoclinal
sections with good structural control (unrecognized structural complications are
unlikely), but the site-mean anomalous directions differ significantly from the mean
directions of the neighboring sites with similar bedding attitudes. These anomalous site-
mean directions are listed in italics in Table 4-3 (denoting outliers), and they are not
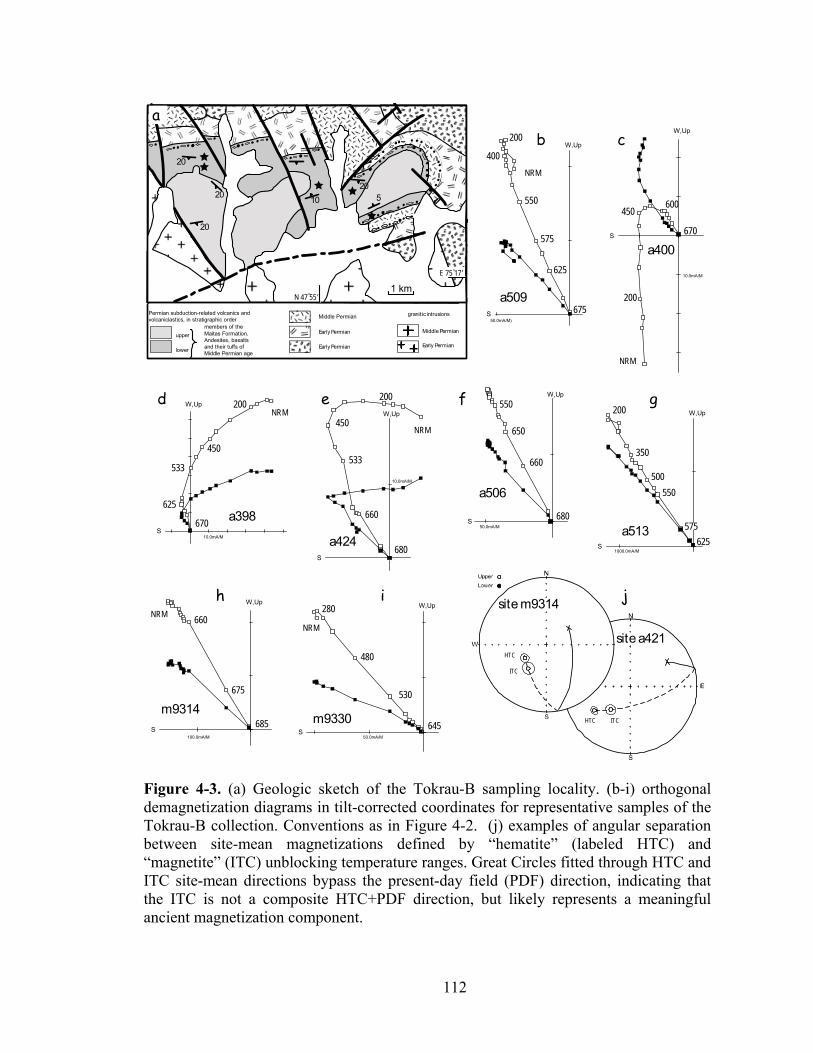
112
site a421
site m9314
10.0mA/M
S
W,Up
a400670
NRM
200
450600
50.0mA/M) S
W,Up
a509
NRM
200
675
625
575
550
400
10.0mA/M S
W,Up
a398670
NRM200
450
625
53310.0mA/M
S
W,Up
a424
NRM
680
660
200
450
533
1000.0mA/M S
W,Up
a513625
575
550500
350
200
50.0mA/M S
W,Up
a506
680
660
650
550
HTC
ITC
HTC ITC
100.0mA/M S
W,Up
m9314685
675
660NRM
50.0mA/M S
W,Up
m9330
NRM
280
480
530
645
b c
d e f g
h i j
members of theMaitas Formation.Andesites, basaltsand their tuffs ofMiddle Permian age
Permian subduction-related volcanics andvolcaniclastics, in stratigraphic order
granitic intrusions
Early Permian
Middle Permian
lower
upper
Middle Permian
Early Permian
Early Permian
20
20 51020
20
a
1 kmN 47 55’
E 75 17’o
o
Figure 4-3. (a) Geologic sketch of the Tokrau-B sampling locality. (b-i) orthogonal demagnetization diagrams in tilt-corrected coordinates for representative samples of the Tokrau-B collection. Conventions as in Figure 4-2. (j) examples of angular separation between site-mean magnetizations defined by “hematite” (labeled HTC) and “magnetite” (ITC) unblocking temperature ranges. Great Circles fitted through HTC and ITC site-mean directions bypass the present-day field (PDF) direction, indicating that the ITC is not a composite HTC+PDF direction, but likely represents a meaningful ancient magnetization component.
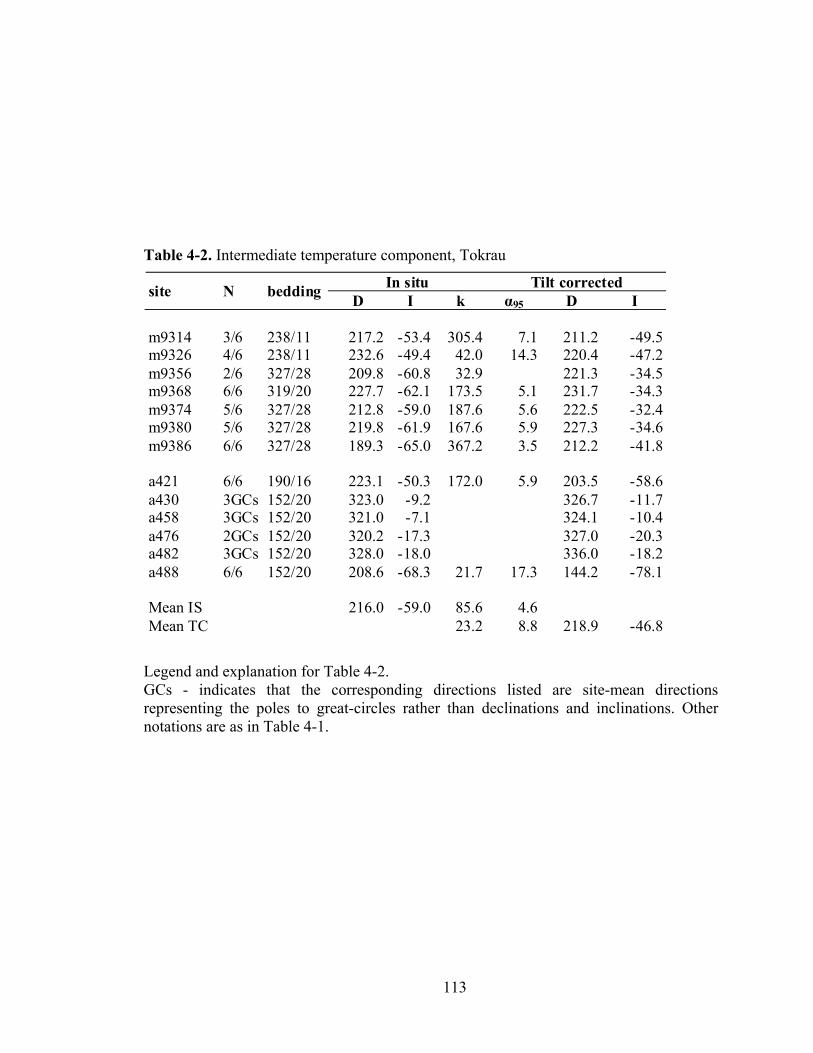
113
Table 4-2. Intermediate temperature component, Tokrau
In situ Tilt corrected site N bedding D I k α95 D I m9314 3/6 238/11 217.2 -53.4 305.4 7.1 211.2 -49.5m9326 4/6 238/11 232.6 -49.4 42.0 14.3 220.4 -47.2m9356 2/6 327/28 209.8 -60.8 32.9 221.3 -34.5m9368 6/6 319/20 227.7 -62.1 173.5 5.1 231.7 -34.3m9374 5/6 327/28 212.8 -59.0 187.6 5.6 222.5 -32.4m9380 5/6 327/28 219.8 -61.9 167.6 5.9 227.3 -34.6m9386 6/6 327/28 189.3 -65.0 367.2 3.5 212.2 -41.8 a421 6/6 190/16 223.1 -50.3 172.0 5.9 203.5 -58.6a430 3GCs 152/20 323.0 -9.2 326.7 -11.7a458 3GCs 152/20 321.0 -7.1 324.1 -10.4a476 2GCs 152/20 320.2 -17.3 327.0 -20.3a482 3GCs 152/20 328.0 -18.0 336.0 -18.2a488 6/6 152/20 208.6 -68.3 21.7 17.3 144.2 -78.1 Mean IS 216.0 -59.0 85.6 4.6 Mean TC 23.2 8.8 218.9 -46.8
Legend and explanation for Table 4-2. GCs - indicates that the corresponding directions listed are site-mean directions representing the poles to great-circles rather than declinations and inclinations. Other notations are as in Table 4-1.
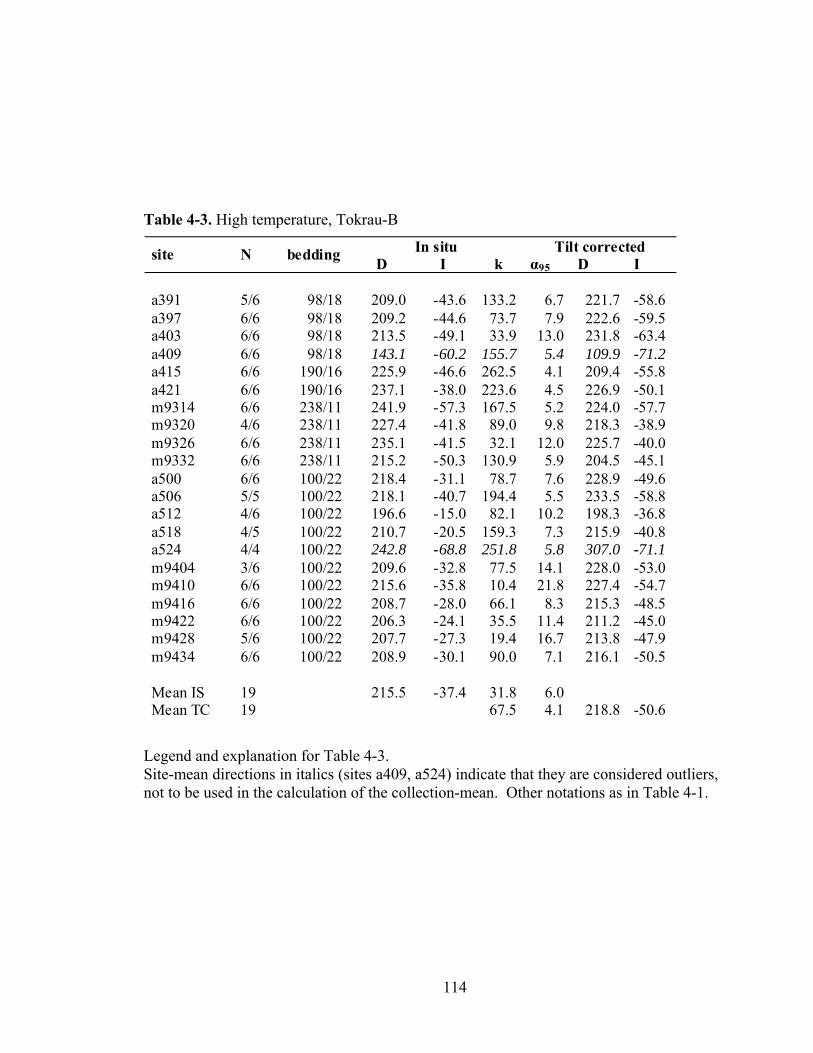
114
Table 4-3. High temperature, Tokrau-B
In situ Tilt corrected site N bedding D I k α95 D I a391 5/6 98/18 209.0 -43.6 133.2 6.7 221.7 -58.6 a397 6/6 98/18 209.2 -44.6 73.7 7.9 222.6 -59.5 a403 6/6 98/18 213.5 -49.1 33.9 13.0 231.8 -63.4 a409 6/6 98/18 143.1 -60.2 155.7 5.4 109.9 -71.2 a415 6/6 190/16 225.9 -46.6 262.5 4.1 209.4 -55.8 a421 6/6 190/16 237.1 -38.0 223.6 4.5 226.9 -50.1 m9314 6/6 238/11 241.9 -57.3 167.5 5.2 224.0 -57.7 m9320 4/6 238/11 227.4 -41.8 89.0 9.8 218.3 -38.9 m9326 6/6 238/11 235.1 -41.5 32.1 12.0 225.7 -40.0 m9332 6/6 238/11 215.2 -50.3 130.9 5.9 204.5 -45.1 a500 6/6 100/22 218.4 -31.1 78.7 7.6 228.9 -49.6 a506 5/5 100/22 218.1 -40.7 194.4 5.5 233.5 -58.8 a512 4/6 100/22 196.6 -15.0 82.1 10.2 198.3 -36.8 a518 4/5 100/22 210.7 -20.5 159.3 7.3 215.9 -40.8 a524 4/4 100/22 242.8 -68.8 251.8 5.8 307.0 -71.1 m9404 3/6 100/22 209.6 -32.8 77.5 14.1 228.0 -53.0 m9410 6/6 100/22 215.6 -35.8 10.4 21.8 227.4 -54.7 m9416 6/6 100/22 208.7 -28.0 66.1 8.3 215.3 -48.5 m9422 6/6 100/22 206.3 -24.1 35.5 11.4 211.2 -45.0 m9428 5/6 100/22 207.7 -27.3 19.4 16.7 213.8 -47.9 m9434 6/6 100/22 208.9 -30.1 90.0 7.1 216.1 -50.5 Mean IS 19 215.5 -37.4 31.8 6.0 Mean TC 19 67.5 4.1 218.8 -50.6
Legend and explanation for Table 4-3. Site-mean directions in italics (sites a409, a524) indicate that they are considered outliers, not to be used in the calculation of the collection-mean. Other notations as in Table 4-1.
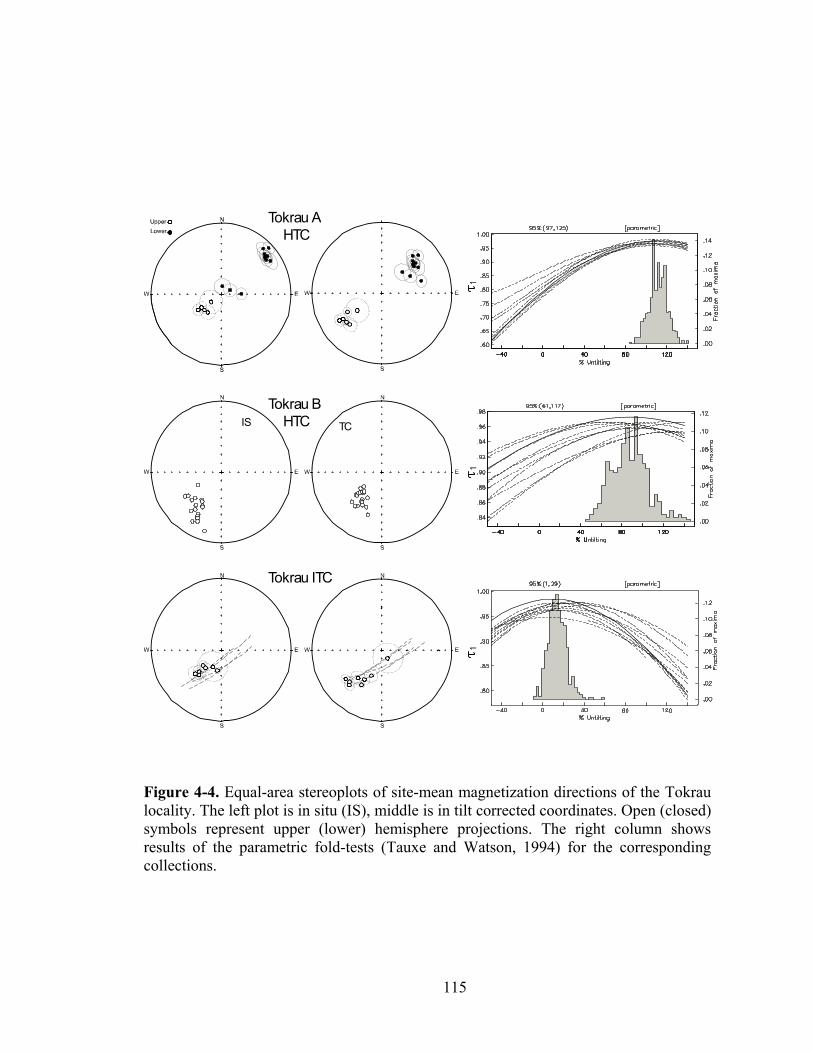
115
IS TC
Tokrau A HTC
Tokrau B HTC
Tokrau ITC
11
1
Figure 4-4. Equal-area stereoplots of site-mean magnetization directions of the Tokrau locality. The left plot is in situ (IS), middle is in tilt corrected coordinates. Open (closed) symbols represent upper (lower) hemisphere projections. The right column shows results of the parametric fold-tests (Tauxe and Watson, 1994) for the corresponding collections.
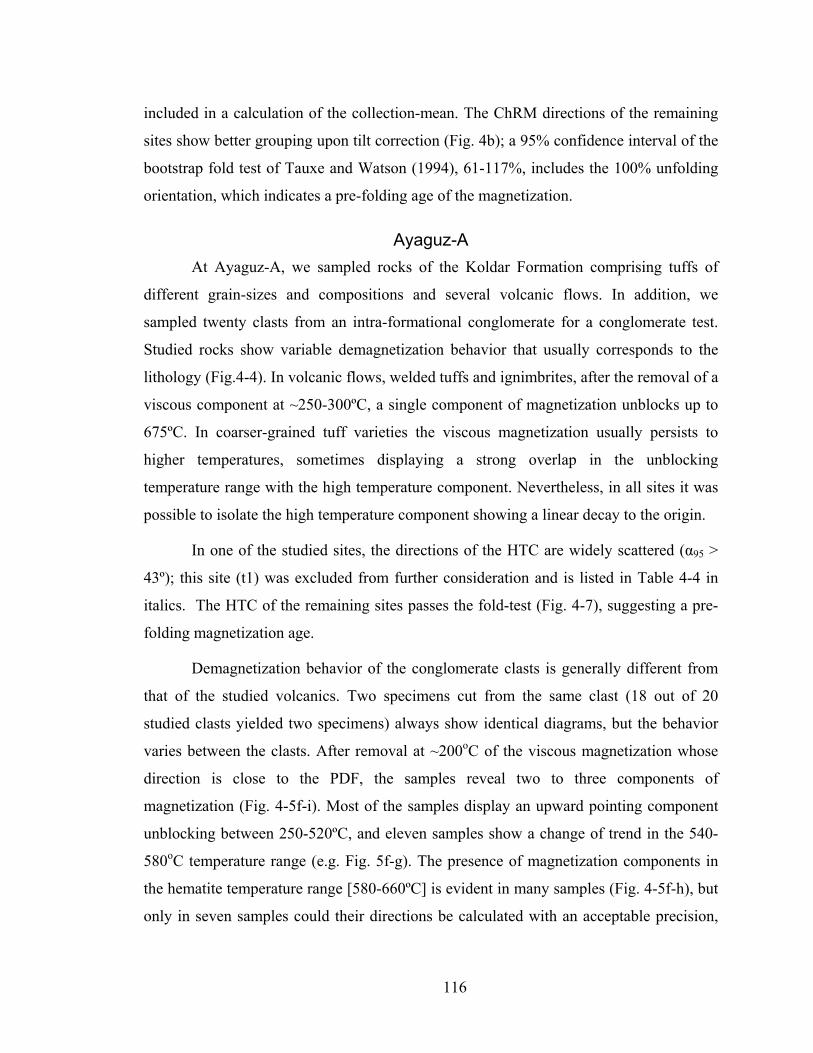
116
included in a calculation of the collection-mean. The ChRM directions of the remaining
sites show better grouping upon tilt correction (Fig. 4b); a 95% confidence interval of the
bootstrap fold test of Tauxe and Watson (1994), 61-117%, includes the 100% unfolding
orientation, which indicates a pre-folding age of the magnetization.
Ayaguz-A At Ayaguz-A, we sampled rocks of the Koldar Formation comprising tuffs of
different grain-sizes and compositions and several volcanic flows. In addition, we
sampled twenty clasts from an intra-formational conglomerate for a conglomerate test.
Studied rocks show variable demagnetization behavior that usually corresponds to the
lithology (Fig.4-4). In volcanic flows, welded tuffs and ignimbrites, after the removal of a
viscous component at ~250-300ºC, a single component of magnetization unblocks up to
675ºC. In coarser-grained tuff varieties the viscous magnetization usually persists to
higher temperatures, sometimes displaying a strong overlap in the unblocking
temperature range with the high temperature component. Nevertheless, in all sites it was
possible to isolate the high temperature component showing a linear decay to the origin.
In one of the studied sites, the directions of the HTC are widely scattered (α95 >
43º); this site (t1) was excluded from further consideration and is listed in Table 4-4 in
italics. The HTC of the remaining sites passes the fold-test (Fig. 4-7), suggesting a pre-
folding magnetization age.
Demagnetization behavior of the conglomerate clasts is generally different from
that of the studied volcanics. Two specimens cut from the same clast (18 out of 20
studied clasts yielded two specimens) always show identical diagrams, but the behavior
varies between the clasts. After removal at ~200oC of the viscous magnetization whose
direction is close to the PDF, the samples reveal two to three components of
magnetization (Fig. 4-5f-i). Most of the samples display an upward pointing component
unblocking between 250-520ºC, and eleven samples show a change of trend in the 540-
580oC temperature range (e.g. Fig. 5f-g). The presence of magnetization components in
the hematite temperature range [580-660ºC] is evident in many samples (Fig. 4-5f-h), but
only in seven samples could their directions be calculated with an acceptable precision,
117
Figure 4-5. (a) Geologic sketch of the Ayaguz-A sampling locality. (b-e) orthogonal demagnetization diagrams in tilt-corrected coordinates for representative samples of the Ayaguz-A collection. (f-i) Examples of demagnetization diagrams (in situ) of conglomerate clasts. Plotting conventions for (b-i) as in Figure 2. (j) Results of the randomness test for the clasts of an intraformational conglomerate. Plotting conventions as in Figure 4. The low temperature (250-520oC) component is not random, whereas randomness could not be disproved at 95% confidence level for the intermediate (540-580oC) and at 99% confidence level for the high temperature (580-660oC) components. Thus, the conglomerate test is positive for the two higher-temperature components.
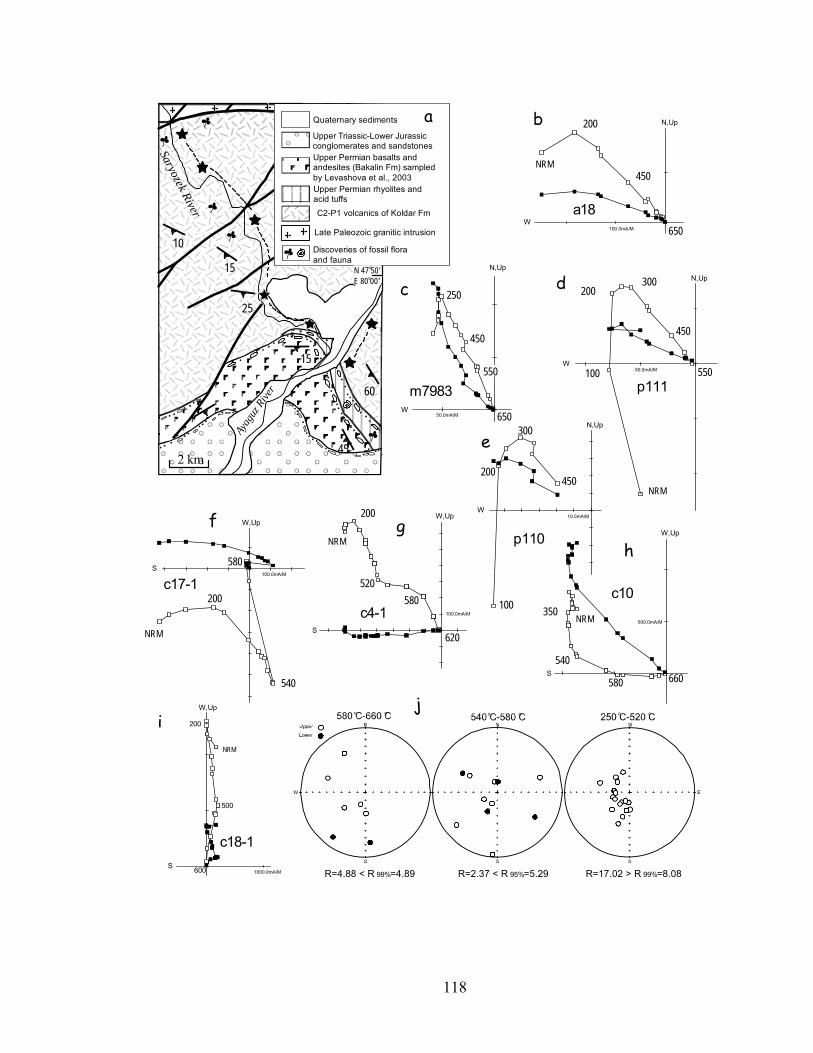
118
o o o o o o
R=4.88 < R 99%=4.89 R=2.37 < R 95%=5.29 R=17.02 > R 99%=8.08
100.0mA/M S
W,Up
NRM
200
540
580
c17-1
NRM
200
520580
100.0mA/M
S
W,Up
620
c4-1500.0mA/M
S
W,Up
660580
540
350NRM
c10
1000.0mA/M S
W,Up
600
500
200
NRM
c18-1
100.0mA/M W
N,Up
a18650
200
450NRM
10.0mA/M W
N,Up
p110
200
300
100
450
50.0mA/M W
N,Up
p111
NRM
200300
450
550100
50.0mA/M W
N,Up
m7983
250
450
650
550
15
10
25
45
15
60
2 km
Ayag
uz R
iver
Saryozek River
Upper Permian basalts andandesites (Bakalin Fm) sampledby Levashova et al., 2003
Upper Triassic-Lower Jurassicconglomerates and sandstones
Quaternary sediments
Late Paleozoic granitic intrusion
C2-P1 volcanics of Koldar Fm
Upper Permian rhyolites andacid tuffs
Discoveries of fossil floraand fauna
a b
c d
e
f gh
ij
N 47 50’E 80 00’
o
o
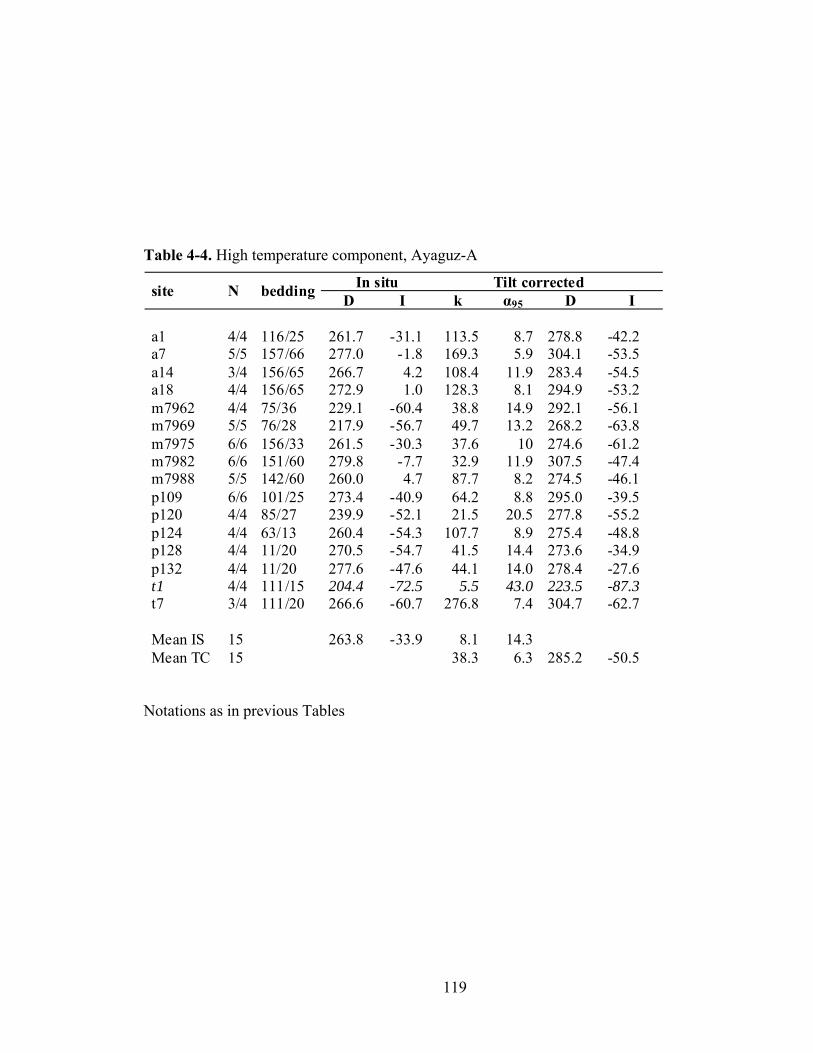
119
Table 4-4. High temperature component, Ayaguz-A
In situ Tilt corrected site N bedding D I k α95 D I a1 4/4 116/25 261.7 -31.1 113.5 8.7 278.8 -42.2 a7 5/5 157/66 277.0 -1.8 169.3 5.9 304.1 -53.5 a14 3/4 156/65 266.7 4.2 108.4 11.9 283.4 -54.5 a18 4/4 156/65 272.9 1.0 128.3 8.1 294.9 -53.2 m7962 4/4 75/36 229.1 -60.4 38.8 14.9 292.1 -56.1 m7969 5/5 76/28 217.9 -56.7 49.7 13.2 268.2 -63.8 m7975 6/6 156/33 261.5 -30.3 37.6 10 274.6 -61.2 m7982 6/6 151/60 279.8 -7.7 32.9 11.9 307.5 -47.4 m7988 5/5 142/60 260.0 4.7 87.7 8.2 274.5 -46.1 p109 6/6 101/25 273.4 -40.9 64.2 8.8 295.0 -39.5 p120 4/4 85/27 239.9 -52.1 21.5 20.5 277.8 -55.2 p124 4/4 63/13 260.4 -54.3 107.7 8.9 275.4 -48.8 p128 4/4 11/20 270.5 -54.7 41.5 14.4 273.6 -34.9 p132 4/4 11/20 277.6 -47.6 44.1 14.0 278.4 -27.6 t1 4/4 111/15 204.4 -72.5 5.5 43.0 223.5 -87.3 t7 3/4 111/20 266.6 -60.7 276.8 7.4 304.7 -62.7 Mean IS 15 263.8 -33.9 8.1 14.3 Mean TC 15 38.3 6.3 285.2 -50.5
Notations as in previous Tables
120
(e.g., MAD ≤10º for a trajectory defined by at least 3 steps). To test for randomness
(Watson, 1956), the components have been separated into three groups according to their
unblocking temperature ranges. The low temperature component [250-520ºC] fails the
randomness test; for the high temperature component [580-660ºC], the randomness
cannot be disproved at 99% confidence level; and the intermediate temperature
component [540-580ºC] is considered random at 95% confidence level. The co-
occurrence of multiple magnetization components with different clustering indicates that
although studied clasts did acquire a secondary magnetization during or after the
conglomerate formation, re-magnetization was likely limited to the temperature range
below 520ºC. The positive conglomerate test for the higher temperature components
suggests that the clasts, and hence the studied volcanic rocks, in the area likely retained
an ancient magnetization as characterized by unblocking > 520ºC.
Ayaguz-B The Koldar Formation rocks sampled at this locality show consistent
demagnetization behavior. After the removal by ~200-300ºC of a viscous overprint
whose in situ direction is similar to the PDF, most of the samples reveal a single
magnetization component decaying to the origin (Fig. 4-6b-g). The bootstrap fold test of
Tauxe and Watson (1994) applied to the site-mean directions of this magnetization
(Fig.4-7) shows that the best grouping is achieved between -34 and 14% unfolding,
indicating a post-folding age of the magnetization.
Ages of magnetization So far, in the studied collections, the age of magnetization has been determined
relative to the folding, either as pre- or post-folding (see Table 4-6). The age of the
folding itself, however, is often imprecisely defined, given that for both our sampling
regions the deformation age is loosely described as “late Paleozoic” or “partly of early
Mesozoic age” by, e.g., Sal’menova and Koshkin (1990) or Tevelev (2001). In such cases
the magnetization age may be additionally constrained by a comparison of the observed
magnetization direction with reference directions that are predicted for the sampling area
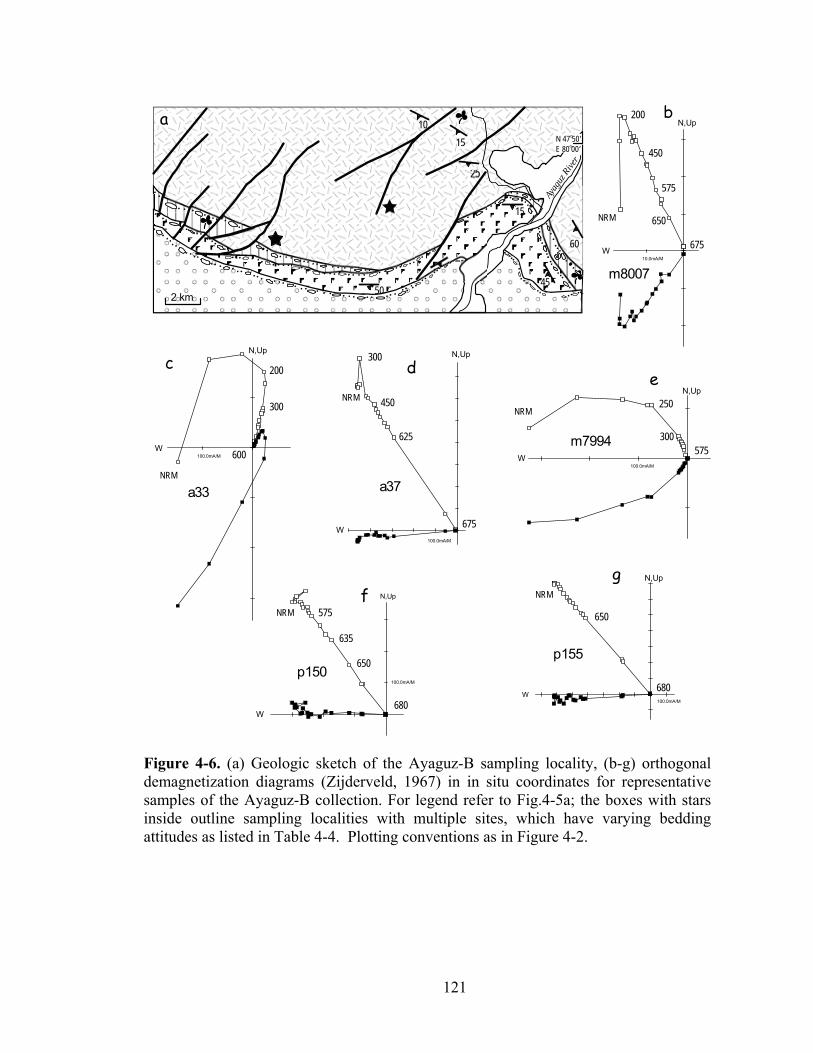
121
100.0mA/M
N,Up
1510
25
45
15
60
50
N 47 50’E 80 00’
o
o
Ayag
uz R
iver
a
2 km
W100.0mA/M
N,Upg
p155
680
650
NRM
W
f
p150
680
650
635
575NRM
10.0mA/MW
N,Upb
m8007
NRM
675
650
575
200
450
100.0mA/M W
N,Upe
m7994
NRM
575
250
300100.0mA/M
W
N,Up
c
a33NRM
600
200
300
100.0mA/M
W
N,Up
d
a37
NRM
675
625
450
300
Figure 4-6. (a) Geologic sketch of the Ayaguz-B sampling locality, (b-g) orthogonal demagnetization diagrams (Zijderveld, 1967) in in situ coordinates for representative samples of the Ayaguz-B collection. For legend refer to Fig.4-5a; the boxes with stars inside outline sampling localities with multiple sites, which have varying bedding attitudes as listed in Table 4-4. Plotting conventions as in Figure 4-2.
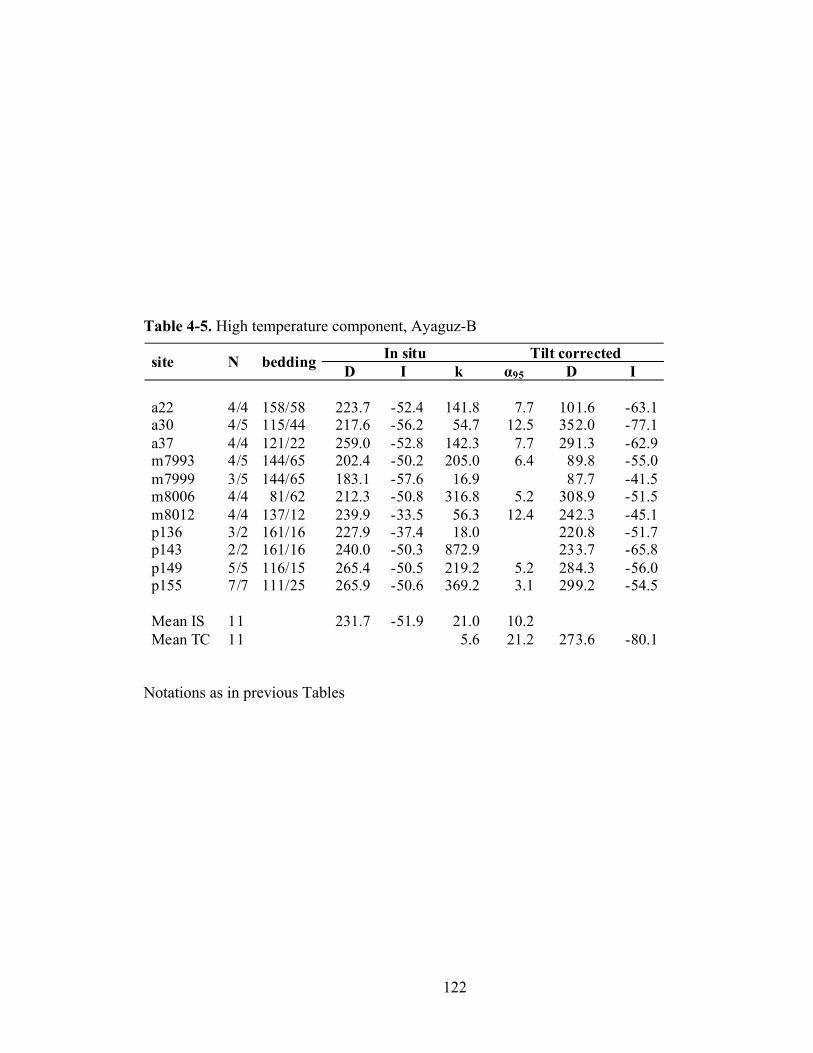
122
Table 4-5. High temperature component, Ayaguz-B
In situ Tilt corrected site N bedding D I k α95 D I a22 4/4 158/58 223.7 -52.4 141.8 7.7 101.6 -63.1a30 4/5 115/44 217.6 -56.2 54.7 12.5 352.0 -77.1a37 4/4 121/22 259.0 -52.8 142.3 7.7 291.3 -62.9m7993 4/5 144/65 202.4 -50.2 205.0 6.4 89.8 -55.0m7999 3/5 144/65 183.1 -57.6 16.9 87.7 -41.5m8006 4/4 81/62 212.3 -50.8 316.8 5.2 308.9 -51.5m8012 4/4 137/12 239.9 -33.5 56.3 12.4 242.3 -45.1p136 3/2 161/16 227.9 -37.4 18.0 220.8 -51.7p143 2/2 161/16 240.0 -50.3 872.9 233.7 -65.8p149 5/5 116/15 265.4 -50.5 219.2 5.2 284.3 -56.0p155 7/7 111/25 265.9 -50.6 369.2 3.1 299.2 -54.5 Mean IS 11 231.7 -51.9 21.0 10.2 Mean TC 11 5.6 21.2 273.6 -80.1
Notations as in previous Tables
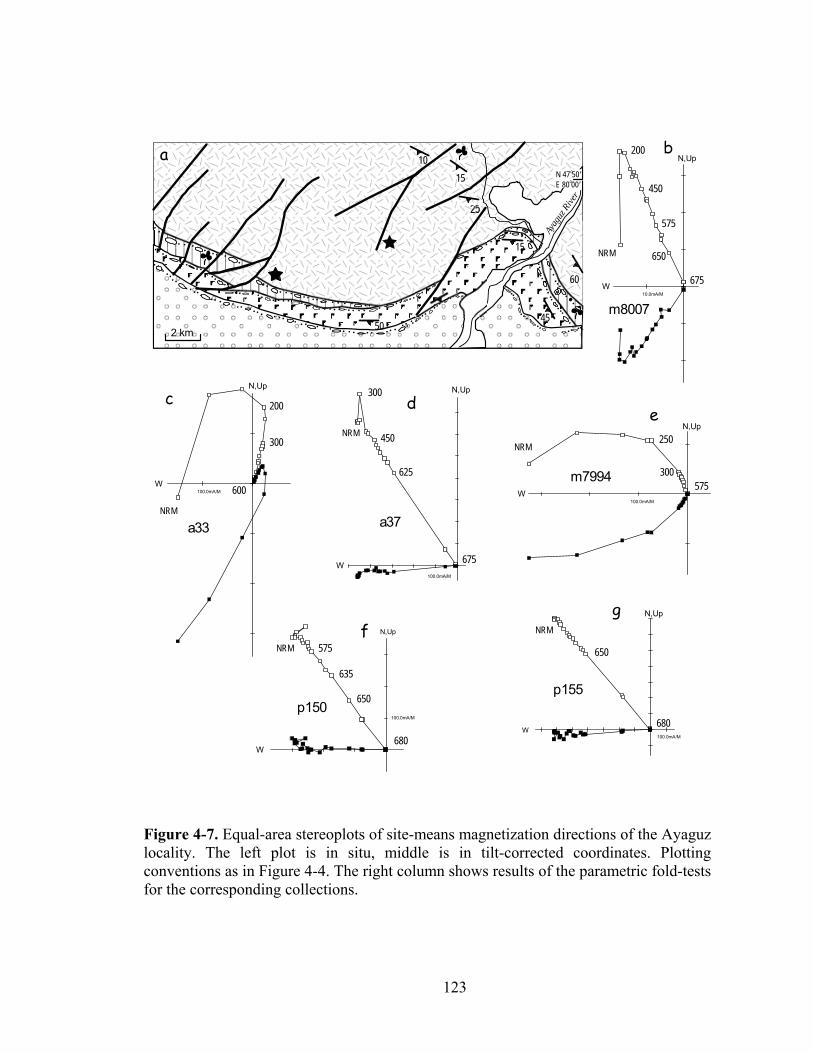
123
100.0mA/M
N,Up
1510
25
45
15
60
50
N 47 50’E 80 00’
o
o
Ayag
uz R
iver
a
2 km
W100.0mA/M
N,Upg
p155
680
650
NRM
W
f
p150
680
650
635
575NRM
10.0mA/MW
N,Upb
m8007
NRM
675
650
575
200
450
100.0mA/M W
N,Upe
m7994
NRM
575
250
300100.0mA/M
W
N,Up
c
a33NRM
600
200
300
100.0mA/M
W
N,Up
d
a37
NRM
675
625
450
300
Figure 4-7. Equal-area stereoplots of site-means magnetization directions of the Ayaguz locality. The left plot is in situ, middle is in tilt-corrected coordinates. Plotting conventions as in Figure 4-4. The right column shows results of the parametric fold-tests for the corresponding collections.
124
for a given time interval (Irving, 1964; Van der Voo, 1993). An internal reference frame
for Kazakhstania is very difficult to construct; large-scale deformations and shear-related
block-rotations cause deviations in paleomagnetic declinations, resulting in an
inconsistent apparent polar wander path (APWP). For the late Paleozoic, however, an
external reference frame can be used. Geological evidence indicates that Kazakhstania
and Baltica were not far away from each other in the late Carboniferous, and were
certainly welded by the Late Permian (Zonenshain et al., 1990; Natal’in and Şengőr,
2005). Thus, the paleolatitudes of our study area should be in general agreement with
those predicted by extrapolation from Baltica, and the degree of conformity should
increase towards the Late Permian as the intervening Uralian Ocean progressively
disappeared. A good agreement of paleolatitudes for Kazakhstan with those predicted
from Baltica paleopoles has previously been demonstrated (Van der Voo et al., 2006).
Thus, in this study we will use the Global APW path in Baltica co-ordinates of Torsvik et
al. (2008) as a reference.
Tokrau The rocks sampled at the Tokrau locality yielded three magnetization directions
(Fig. 4-4): 1) a dual polarity pre-folding component was isolated in the Upper
Carboniferous-Lower Permian rocks of the Tokrau-A collection; 2) an upward pointing
pre-folding magnetization was observed in the Upper Permian rocks of the Tokrau-B
collection; and 3) in addition, the two Tokrau collections yielded a post-folding
magnetization. The results are summarized in Table 4-6.
The positive fold test and especially the presence of reversals in the Tokrau-A
rocks suggest (but do not prove) that the magnetization is primary. However, the main
carrier of magnetization in these rocks, hematite, is known to form as an alteration-
oxidation product (Cornell and Schwertmann, 2003). Also, the presence of both normal
and reversed polarities is rather surprising; the age of the Kalmakemel Formation (Late
Carboniferous-Early Permian) overlaps the Kiaman, a well-known Long Reverse Polarity
Interval of the geomagnetic field. Although the presence of short normal polarity
intervals within the Kiaman has been reported before (Hounslow et. al., 2004; Khramov,
2000; Menning et al., 1988), their age and duration are poorly known. To refine the age
125
of formation for the rocks and define the timing of the normal polarity episode we
attempted to use the 40Ar-39Ar technique to date three separate ignimbrite units containing
normal polarity magnetization. For each unit, two samples of groundmass and seven
individual plagioclase crystals were analyzed. However, our analyses did not yield fully
consistent plateau ages (see Appendix A for results and explanations), although they did
provide indications of the best estimate for the age of magnetization, as will be briefly
summarized next.
40Ar-39Ar release spectra of the groundmass gave consistent Middle Triassic age
estimates for all samples. The characteristic shapes of the spectra suggest clay minerals as
a source of the radiogenic argon; in this case, the age of the groundmass likely reflects
the age of clay formation, i.e. alteration due to devitrification or fluid migration. The
expected geomagnetic inclination at an Early Triassic time of alteration (Fig. 4-8) fits the
observed inclination of the post-folding magnetization (labeled as “secondary
component” in Fig. 4-8), attesting that this overprint was acquired during the early
Triassic alteration event.
The pre-folding dual polarity magnetization isolated in the same (Tokrau-A) rocks
has a significantly lower inclination than that of the overprint (Fig. 4-8). The lower
inclination, according to the reference curve extrapolated from Baltica, clearly
corresponds to an older age for this magnetization. Thus, the hematite-carried remanence
predates the alteration event. This suggests that hematite is not an alteration product; and,
given the fact that it records the reversal, it most likely carries a primary magnetization
that was acquired during the time of ignimbrite emplacement.
The age of the ignimbrite emplacement and magnetization acquisition, however,
remains poorly constrained. 40Ar-39Ar apparent ages of individual plagioclase grains from
the studied units show a wide scatter with a weak clustering at ~300-295 Ma (Fig.4-8).
This wide age distribution likely reflects the combination of a significant xenocrystic
contamination with a different degree of partial alteration of both xenocrysts and
phenocrysts. An analysis of the presumably least contaminated grains suggests a 297-295
Ma time interval as the most likely eruption age. This best 40Ar-39Ar age estimate for the
rock formation (and magnetization age) is, pleasingly, in agreement with the reported age
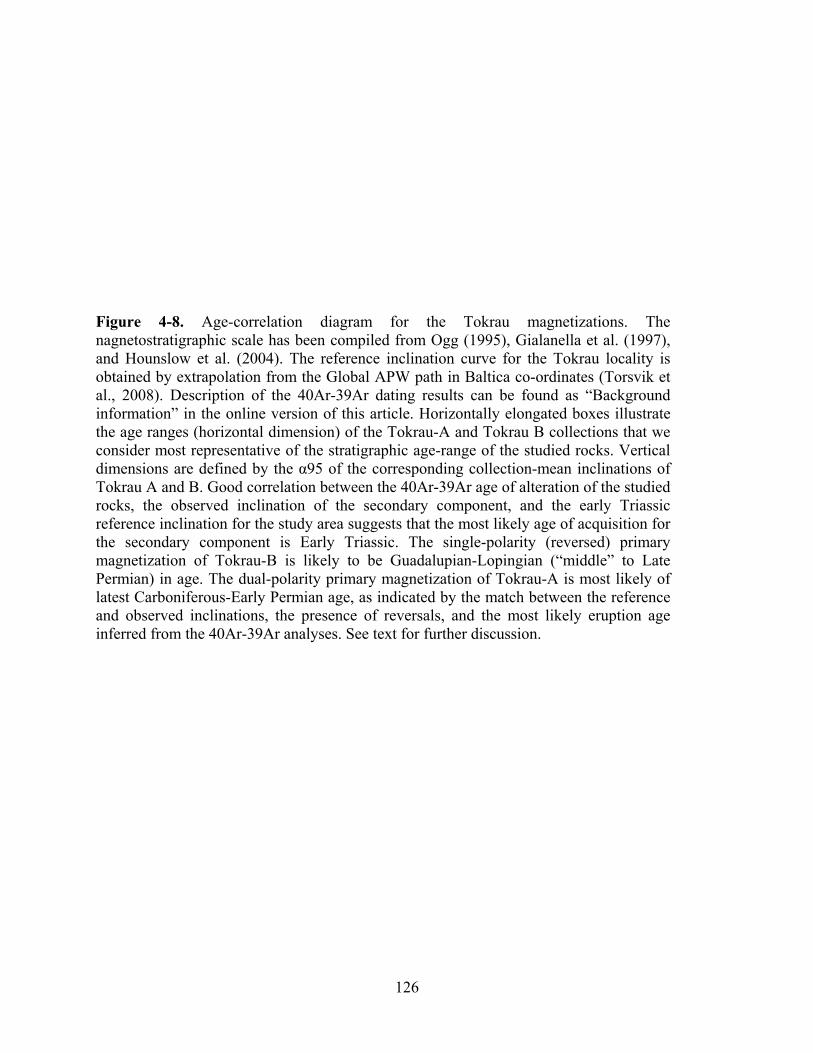
126
Figure 4-8. Age-correlation diagram for the Tokrau magnetizations. The nagnetostratigraphic scale has been compiled from Ogg (1995), Gialanella et al. (1997), and Hounslow et al. (2004). The reference inclination curve for the Tokrau locality is obtained by extrapolation from the Global APW path in Baltica co-ordinates (Torsvik et al., 2008). Description of the 40Ar-39Ar dating results can be found as “Background information” in the online version of this article. Horizontally elongated boxes illustrate the age ranges (horizontal dimension) of the Tokrau-A and Tokrau B collections that we consider most representative of the stratigraphic age-range of the studied rocks. Vertical dimensions are defined by the α95 of the corresponding collection-mean inclinations of Tokrau A and B. Good correlation between the 40Ar-39Ar age of alteration of the studied rocks, the observed inclination of the secondary component, and the early Triassic reference inclination for the study area suggests that the most likely age of acquisition for the secondary component is Early Triassic. The single-polarity (reversed) primary magnetization of Tokrau-B is likely to be Guadalupian-Lopingian (“middle” to Late Permian) in age. The dual-polarity primary magnetization of Tokrau-A is most likely of latest Carboniferous-Early Permian age, as indicated by the match between the reference and observed inclinations, the presence of reversals, and the most likely eruption age inferred from the 40Ar-39Ar analyses. See text for further discussion.
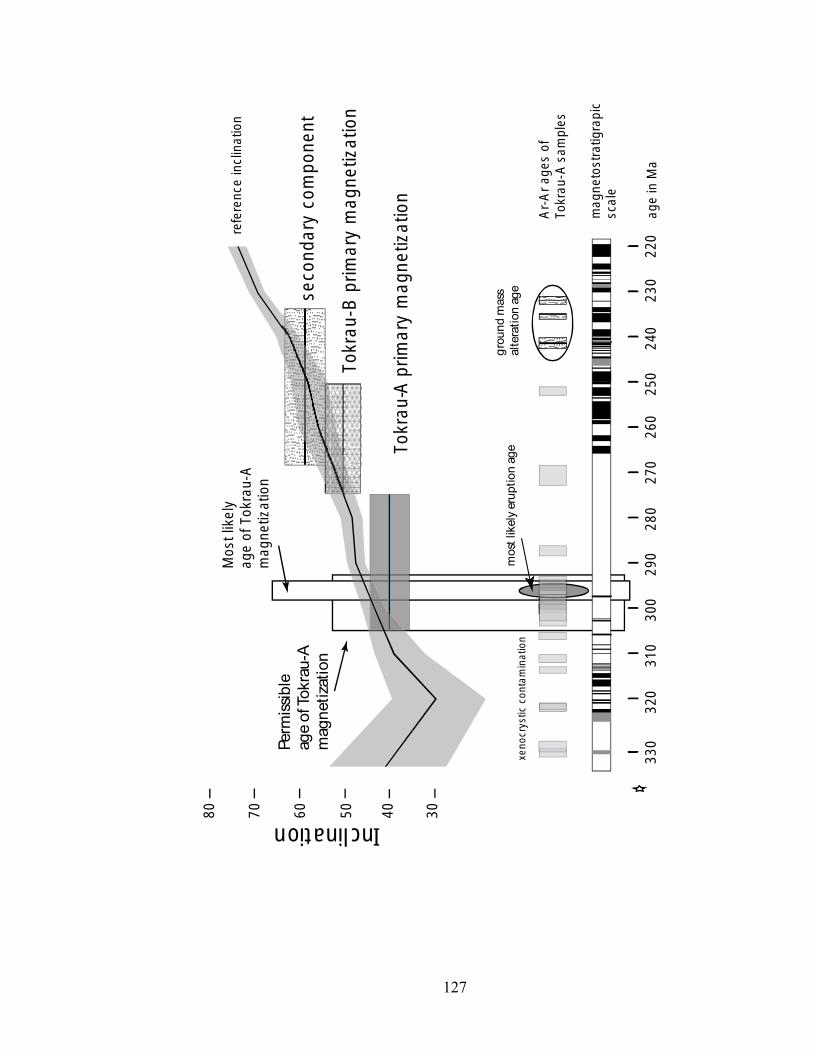
127
grou
ndm
ass
alte
ratio
nag
em
ostl
ikel
yer
uptio
nag
e
Inclination
Ar-A
rage
sof
Tokr
au-A
sam
ples
refe
renc
ein
clin
atio
n
seco
ndar
yco
mpo
nent
Tokr
au-A
prim
ary
mag
netiz
atio
n
330
320
310
300
290
280
270
260
250
240
230
220
80 70 60 50 40 30
Mos
tlik
ely
age
ofTo
krau
-Am
agne
tizat
ion
xeno
crys
ticco
ntam
inat
ion
Perm
issib
leag
eof
Tokr
au-A
mag
netiz
atio
n
mag
neto
stra
tigra
pic
scal
e
age
inM
a
Tokr
au-B
prim
ary
mag
netiz
atio
n
128
of the Kalmakemel Formation (Sal’menova and Koshkin, 1990; Tevelev, 2001). If an
earliest Permian (~296 Ma) age of the magnetization is correct, it also agrees with the
previously reported occurrences of a short normal polarity interval (Khramov et al., 1974;
Khramov, 2000). The observed inclination, however, is slightly lower (i.e., “older
looking”, at ~307 Ma – see Figs. 4-8 and 4-9) than the reference one for this time. The
difference is small, and may not be important given that some divergence between the
predicted and observed inclinations may well arise from the use of the Baltica Early
Permian reference poles when final convergence of Baltica and Kazakhstania is still a
possibility.
At any rate, regardless whether the magnetization age is earliest Permian or
whether it is latest Carboniferous, i.e., covering the entire permissible (i.e.
biostratigraphically-defined) age range for this formation (~305-275 Ma), the reference
declination changes very little (Fig. 4-9). Thus, the somewhat uncertain age estimate will
not significantly affect our determination of the net tectonic rotation after magnetization
acquisition. In further discussion we will consider the dual polarity pre-folding
component isolated in the Kalmakemel Formation at Tokrau-A as a primary
magnetization of latest Carboniferous-Early Permian age, and will use the ~300 Ma
reference direction for the rotation estimate.
The pre-folding magnetization isolated in the Tokrau-B rocks is likely to be
primary, dating to the time of the rock formation. Its inclination is shallower than that of
the overprint (i.e. it is older than Early Triassic), but steeper than that of the Tokrau-A
rocks (i.e. it is younger than Early Permian), and agrees well with the reference
inclination for the Late Permian (stratigraphic) age of the rocks.
Ayaguz The Ayaguz sampling locality yielded two magnetization components (Fig. 4-7;
Table 4-6): 1) a pre-folding upward pointing magnetization isolated from the latest
Carboniferous-Early Permian rocks at Ayaguz-A (Koldar Formation); 2) a post-folding
magnetization in the Ayaguz-B collection. When corrected for tilt, the inclination of
Ayaguz-A agrees well with the ~275-305 Ma age range deduced from the reference
inclinations (Fig.4-9), which is the same as
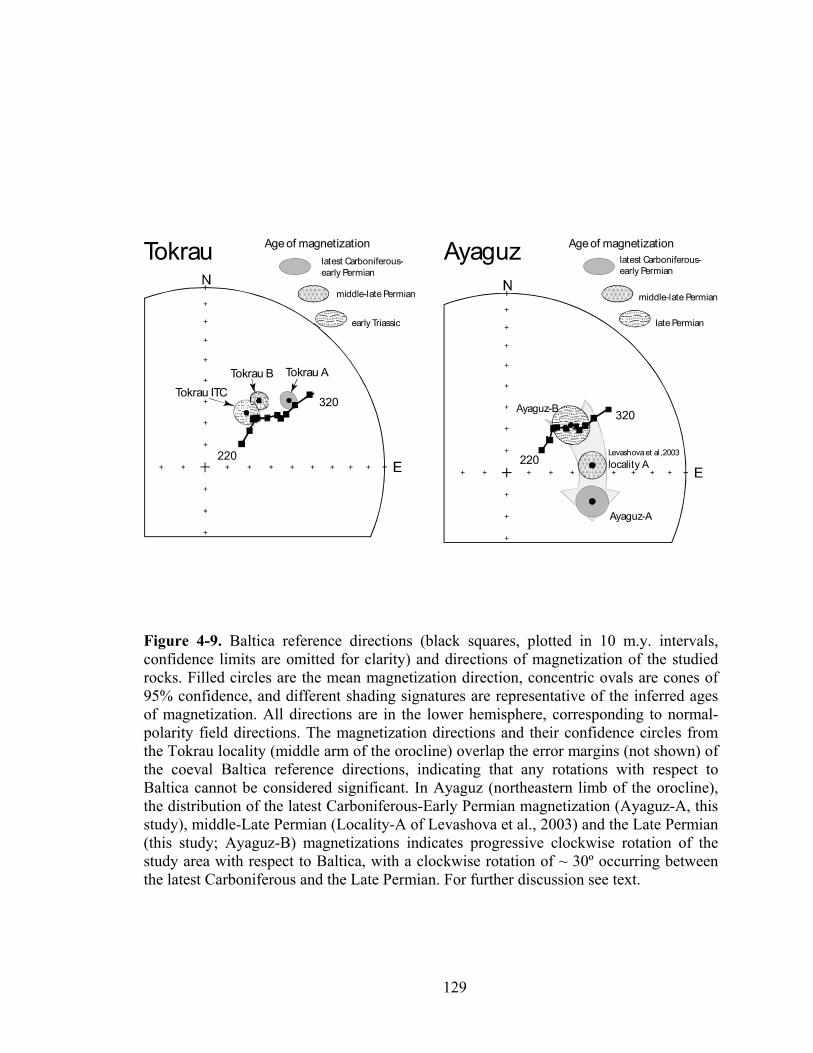
129
320
220
Tokrau ATokrau BTokrau ITC
latest Carboniferous-early Permian
middle-late Permian
late Permian
Age of magnetization
Ayaguz-A
Ayaguz-B
Levashova et al, 2003locality A
320
220
early Triassic
Age of magnetizationlatest Carboniferous-early Permian
middle-late Permian
Tokrau Ayaguz
Figure 4-9. Baltica reference directions (black squares, plotted in 10 m.y. intervals, confidence limits are omitted for clarity) and directions of magnetization of the studied rocks. Filled circles are the mean magnetization direction, concentric ovals are cones of 95% confidence, and different shading signatures are representative of the inferred ages of magnetization. All directions are in the lower hemisphere, corresponding to normal- polarity field directions. The magnetization directions and their confidence circles from the Tokrau locality (middle arm of the orocline) overlap the error margins (not shown) of the coeval Baltica reference directions, indicating that any rotations with respect to Baltica cannot be considered significant. In Ayaguz (northeastern limb of the orocline), the distribution of the latest Carboniferous-Early Permian magnetization (Ayaguz-A, this study), middle-Late Permian (Locality-A of Levashova et al., 2003) and the Late Permian (this study; Ayaguz-B) magnetizations indicates progressive clockwise rotation of the study area with respect to Baltica, with a clockwise rotation of ~ 30º occurring between the latest Carboniferous and the Late Permian. For further discussion see text.
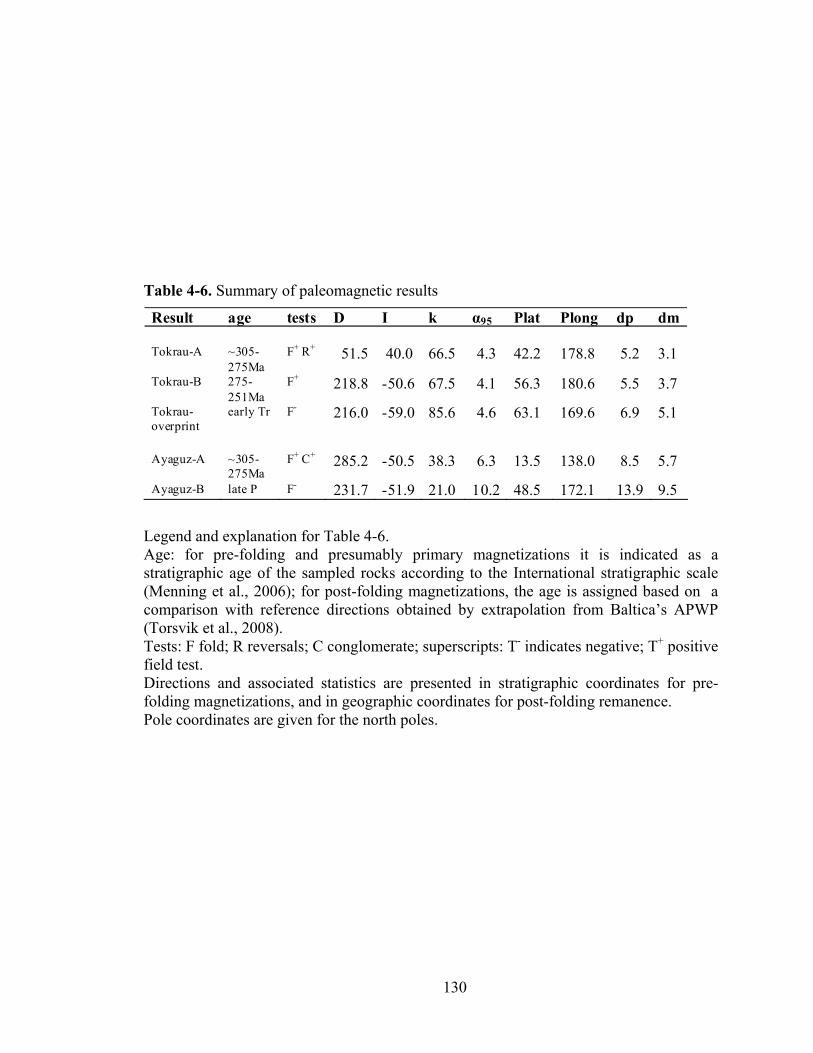
130
Table 4-6. Summary of paleomagnetic results
Result age tests D I k α95 Plat Plong dp dm Tokrau-A ~305-
275Ma F+ R+ 51.5 40.0 66.5 4.3 42.2 178.8 5.2 3.1
Tokrau-B 275-251Ma
F+ 218.8 -50.6 67.5 4.1 56.3 180.6 5.5 3.7
Tokrau-overprint
early Tr F- 216.0 -59.0 85.6 4.6 63.1 169.6 6.9 5.1
Ayaguz-A ~305-
275Ma F+ C+ 285.2 -50.5 38.3 6.3 13.5 138.0 8.5 5.7
Ayaguz-B late P F- 231.7 -51.9 21.0 10.2 48.5 172.1 13.9 9.5
Legend and explanation for Table 4-6. Age: for pre-folding and presumably primary magnetizations it is indicated as a stratigraphic age of the sampled rocks according to the International stratigraphic scale (Menning et al., 2006); for post-folding magnetizations, the age is assigned based on a comparison with reference directions obtained by extrapolation from Baltica’s APWP (Torsvik et al., 2008). Tests: F fold; R reversals; C conglomerate; superscripts: T- indicates negative; T+ positive field test. Directions and associated statistics are presented in stratigraphic coordinates for pre-folding magnetizations, and in geographic coordinates for post-folding remanence. Pole coordinates are given for the north poles.
131
assigned to this Formation based on its fossil content and stratigraphic relationships. This
good agreement indicates that the magnetization dates to the formation of the rocks and
therefore may be considered primary. As is in the case of Tokrau-A, a somewhat broader
age range does not affect estimates of post-Early Permian rotations of the Ayaguz area
because the reference declination does not change perceptibly during this period.
The negative fold test for Ayaguz-B indicates that this remanence is post-folding.
The in situ inclination of this magnetization best fits the 280-270 Ma reference directions,
and the radius of the 95% confidence cone (α95) about the mean suggests that, at the 95%
probability level, this magnetization has been acquired before 250 Ma (Fig. 4-9).
Consequently, although the magnetization is secondary, we can nevertheless be
reasonably confident that the remanence is Permian in age.
Discussion
Rotations Fig. 4-9 shows the distribution of the observed magnetization components relative
to the reference directions calculated by extrapolation from Baltica’s APWP (Torsvik et
al., 2008) for the two sampling localities. As this plot clearly demonstrates, all three
magnetization components isolated at the Tokrau locality are close to their coeval
reference directions. A slight counterclockwise deflection of the observed directions
could be explained by a post-Early Triassic rotation, but this deviation is statistically
insignificant for the older Tokrau A and the younger Tokrau-overprint (i.e., the error limit
(ΔR) about the rotation estimate overlaps a zero rotation value). Therefore we can only
conclude that, for all practical purposes, no significant rotations occurred between the
Tokrau area (i.e. the middle limb of the orocline) and Baltica since the Early Permian.
Apparently, the middle limb of the orocline was in the same relative position with respect
to Baltica in the Early Permian as it is today; the bending of this part of the curved
structure was over by that time.
The older magnetization component observed in the Ayaguz locality by our study
and the late Early to Late Permian result (“L-A”) from the Bakalin Formation in the same
area (see Fig. 4-5a) published by Levashova et al. (2003), differ in their declinations from
132
those extrapolated from Baltica. The younger (~275–250 Ma) magnetization is deflected
clockwise by 19.8 ± 4.3º, and the older (~295–305 Ma) Ayaguz-A magnetization is
deflected clockwise by 31.1 ± 6.2º relative to the reference directions (Fig. 4-9). On the
other hand, the post-folding (likely Late Permian) declination of Ayaguz-B is statistically
indistinguishable from the reference directions. The declination trend of the Ayaguz
results (Fig. 4-9) suggests that since the latest Carboniferous-Early Permian (and very
likely before the Early Triassic) the Ayaguz locality was undergoing a progressive
clockwise rotation of about 30º with respect to Baltica.
It is tempting to interpret this rotation as evidence for the last rotation phase of the
bending of the entire NE arm of the orocline. However, we do not have sufficient
coverage of Permian paleomagnetic results in the Chingiz Range of the NE limb. The
limited number of reliable Permian data allows another possibility, involving localized
shear-related block-rotations, just as was argued for the SW limb (Van der Voo et al.,
2006; see also Wang et al., 2007). In either case, the progressive rotations observed in the
Ayaguz results suggest that the NE arm was still undergoing active deformation during
the Late Permian. Levashova et al. (2003) reached a similar conclusion based on the more
limited results from the Bakalin Formation alone for this area.
Combining these new data and conclusions with those of our other recent studies
(Levashova et al., 2007, 2008; Abrajevitch et al., 2007), we can reconstruct a scenario of
oroclinal bending in Kazakhstania. Table 4-7 lists the Devonian declinations, which
strongly support oroclinal bending, because the structural trends today of the three limbs
of the orocline (see also Fig. 4-1) correlate well with them (Abrajevitch et al., 2007;
Levashova et al., 2008).
When the oroclinal bending was nearly completed, there was still further ongoing
deformation in the area during the Late Permian – Early Triassic causing localized
rotations in the vicinity of strike-slip faults, as documented for the North Tien Shan by
Van der Voo et al. (2006) and Wang et al. (2007), and interpretable within the framework
of left-lateral shear between Siberia and Baltica (Natal’in and Şengőr, 2005). This means
that the Devonian declinations of areas affected by these localized rotations need to be
restored to their pre-Permian configuration, as has been done by Abrajevitch et al. (2007).
133
Using Baltica’s Late Permian paleopole as a reference, we can portray the
structural trends with respect to the Late Permian meridian (when oroclinal bending had
terminated). The correction to be applied to the present-day trends is about 44 to 48º for
Kazakhstan’s orocline. The resulting orientations are listed in Table 4-7, and are used to
position the orocline at the end of the Paleozoic in Figure 4-10. Ideally, it would be
useful in Table 4-7 to provide not just the declination and strike or orientation values that
we have calculated, but also their error limits. However, for most of the information,
listing any error ranges would be imprecise at best and unsubstantiated at worst, so we
have refrained from entering these.
Geodynamic implications The sequence of deformations that we can deduce from the middle to late
Paleozoic paleomagnetic results, and the likely involvement of much of the crust and
lithospheric mantle in the rotations of the volcanic arc complexes of Devonian through
Permian ages, suggest that the mechanism that produced the strong curvature was
buckling of Kazakhstania in response to the transmission of compressive stresses parallel
to the long (i.e., trench-parallel) axis of this continental element. While such buckling has
been proposed for some Alaskan terranes, the Olympic Mountains orocline in the State of
Washington, and the Northland – Norfolk – New Caledonia–D’Entrecasteaux orocline
near the Vanuatu-New Hebrides Arc of the southwest Pacific (Johnston, 2001, 2004;
Johnston and Acton, 2007), there are limited or no paleomagnetic data that can be listed
as evidence for such an oroclinal process involving much of the lithosphere. Thus, our
recent and present studies may constitute some of the first evidence for oroclinal bending
involving the entire crust, rather than the much better known and well-documented
oroclinal rotations in just the upper crustal setting above a décollement zone.
It is clearly of interest to see whether the kinematics of the Kazakhstania oroclinal
bending can be translated into a scenario of its dynamics. In this regard, the observations
reveal the varying magnitude of the relative oroclinal rotations along the arc with respect
to the Late Permian meridian, from small in the SW arm (~25º counterclockwise) to large
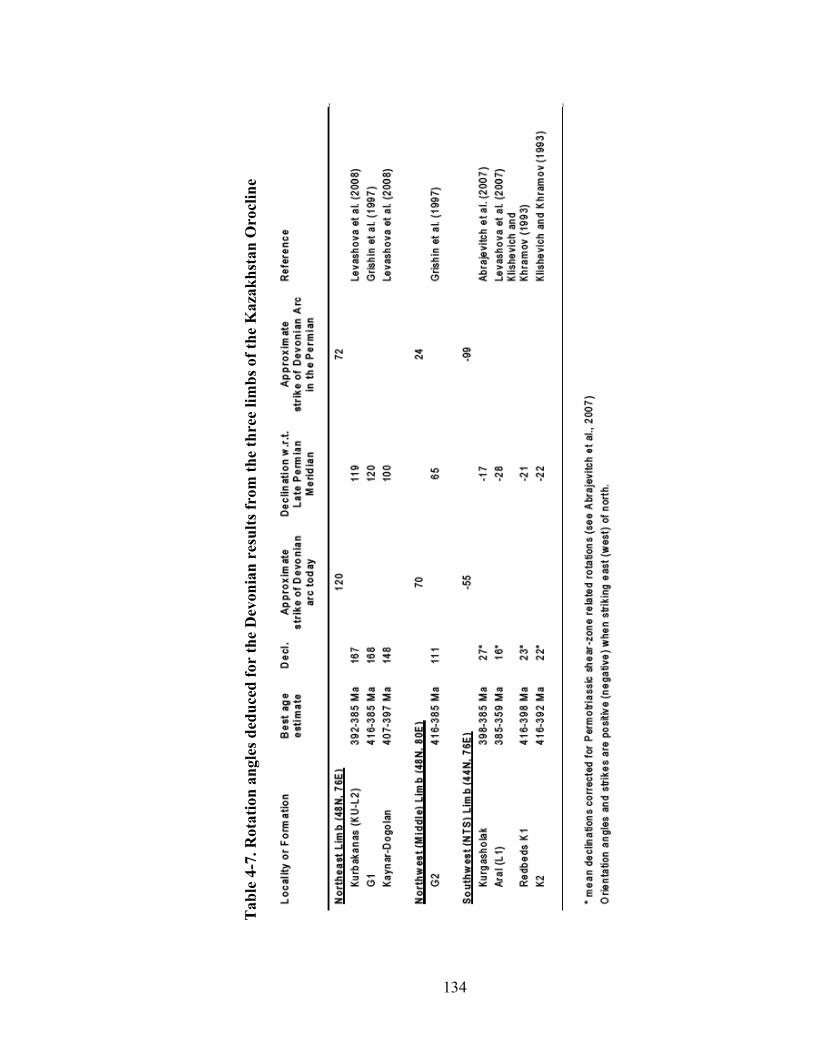
134
Tab
le 4
-7. R
otat
ion
angl
es d
educ
ed fo
r th
e D
evon
ian
resu
lts fr
om th
e th
ree
limbs
of t
he K
azak
hsta
n O
rocl
ine
135
Figure 4-10. Tectonic scenario for the bending of the Kazakhstan orocline. In the Late Devonian, Tarim and Kazakhstania collided, leading to a pinned situation of Kazakhstania’s southern corner. A dextral shear motion and a considerable clockwise rotation of Siberia resulted in Kazakhstania’s northern end being dragged clockwise with respect to its southern end held fixed by its backstop-pinning. Carboniferous continued convergence between Siberia and Tarim enhanced the buckling of Kazakhstania, trapped between them, leading to a subdivision of the belt into its three more or less orthogonal segments. The intervening Junggar-Balkhash Ocean was closed by Late Permian times after dual subduction at opposite zones. Reconstructions are based on APWP data for Baltica (Torsvik et al., 2008), Siberia (Kravchinsky et al., 2002; Pavlov et al., 2007), and Tarim (data averaged from the listing of Van der Voo, 1993 and those of Chen et al., 1999). The solid line denotes the Devonian Volcanic Belt above the pre-Late Permian subduction zone of the Junggar-Balkhash ocean basin.
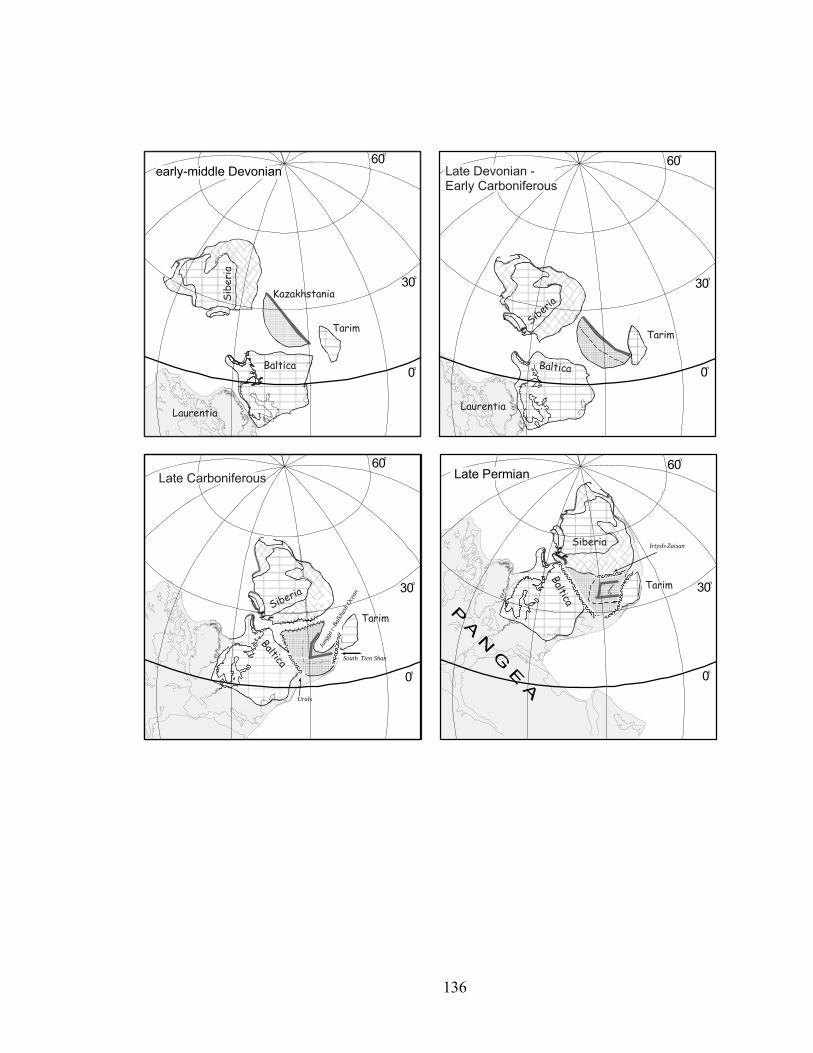
136
Sib e
ria
Baltica
Laurentia
Tarim
Kazakhstania
early-middle Devonian
Siberia
Baltica
Laurentia
Tarim
Late Devonian -Early Carboniferous
Siberia
Baltica
Tarim
Urals
South Tien Shan
Late Carboniferous
Siberia
Baltica
Tarim
Irtysh-Zaisan
Late Permian
Jung
gar-B
alkh
ash O
cean
30o
0o
60o
30o
0o
60o
30o
0o
60o
30o
0o
60o
137
in the NE arm (~120º clockwise, Table 4-7). These values provide clues as to the
mechanism. The large-scale movements of the surrounding Baltica, Siberia, and Tarim
cratons are schematically shown in Figure 4-10. This figure illustrates how one might
construct a plausible scenario involving dextral shear stress and drag applied by a
clockwise-rotating Siberia to the northern end of the Kazakhstania structure, while its
southern end was pinned down by a back-stop consisting of Tarim. This conceptual
model, as based on paleomagnetic declination and paleolatitude data can also be tested
with geological evidence.
The initiation of the collision between Kazakhstania and Tarim in the Late
Devonian is documented by deformations and emplacement of granite in the Central Tien
Shan (Cai et al., 1996); by an inferred change in Tarim’s motion (Chen et al., 1999); and
by extensive Late Devonian rifting in Kazakhstania itself (e.g. Veimarn and Milanovsky,
1990; Bukadorov et al., 2003), which possibly reflects back-arc extension within the
overriding plate, and is elsewhere commonly associated with a switch in tectonic mode
following an accretion event (Lister et. al., 2001).
The most likely candidate for imposing a shear stress on the northern end of
Kazakhstania is clearly the Siberian craton. Although the late Paleozoic APWP for
Siberia is rather poorly constrained (e.g., Cocks and Torsvik, 2007), reliable
paleomagnetic poles for 360 and 250 Ma have been reported by Kravchinsky et al. (2002)
and Pavlov et al. (2007). The difference in the pole positions indicates that Siberia
underwent a significant clockwise rotation in this Permo-Carboniferous time interval. It is
plausible that the Carboniferous movements of Siberia also had a dextral shear
component with respect to Kazakhstania and Baltica (Fig. 4-10), although this sense of
motion cannot be estimated from paleomagnetic data alone because latitude-parallel
displacements cannot be uncovered. However, paleogeographic reconstructions for the
Late Devonian (e.g. Kravchinsky et al., 2002), indicate that Siberia’s then-southern (now-
western) margin was located at ~20-30oN, while similar Devonian paleolatitudes have
been determined for the northern tip of Kazakhstania (Abrajevitch et al., 2007,
Levashova et al., 2008; Grishin et al., 1997). Given the means (significant lateral
displacement of Siberia between the Late Devonian and Permian) and the opportunity
138
(proximity of Kazakhstania and Siberia), it is likely that Siberia’s movements imposed
dextral shear stresses on Kazakhstania’s then-northern margin, whereas relative
convergence of Siberia and Tarim caused the Carboniferous buckling of the Kazakhstania
microcontinent trapped between them.
To accommodate such large-scale oroclinal bending, crustal material must either
be significantly shortened or be removed from between the converging arms. In the case
of the Kazakhstan orocline, the crust of the Junggar-Balkhash Ocean between the
converging arms was consumed at the surrounding subduction zones (Fig. 4-10). We
obtain an approximate estimate of the average subduction velocity of ~ 6 mm/year from
the calculation that ~1200 km of the oceanic crust must have been consumed in two
concurrent subduction zones in the time interval between the Late Devonian and Late
Permian (~ 360 - 260 Ma). This rate of subduction is geologically reasonable.
The buckling of the volcanic arc should also produce a specific deformation
pattern, with contractional features inside the loop and extension on the outside, showing
maximum contraction expected for the “hinges”. In full agreement with these predictions,
the hinge areas of the Devonian volcanic belt show evidence for significant contraction.
For instance, in the northern part of the Spassk anticlinorium (a hinge zone between the
middle (NW) and NE arms, labeled Sa in Fig. 4-1) isoclinal flow folds and strike-slip
faults form “squeeze-out” structures that date to the early-middle Carboniferous (Suvorov
1963; Chitalin, 1983). Moreover, in the hinge zone between the SW and middle (NW)
arms of the orocline, one finds compression in the Sarysu-Tengiz uplift in a ~150 km
wide zone. This compression produced a system of closely spaced subparallel reverse
faults that accommodated an estimated 150-200 km of shortening in this area
(Tikhomirov, 1975; Zonenshain et al., 1990).
While compressional deformations dominated within the hinge zones of the
volcanic belt, in the areas external to the belt large sedimentary basins had been forming.
A Late Devonian-Permian sequence of intercalated continental clastics and shallow-
marine deposits reaches huge thicknesses of over 6 km in the Chu-Sarysu Basin and over
7.5 km in the Tengiz Basin (Yakubchuk, 2001), suggesting syn-depositional formation of
accommodation space for these sediments, likely by extension-driven subsidence.
139
We find that, all in all, the available paleomagnetic and geologic data are
consistent with oroclinal bending of a thick-skinned lithospheric (continental) element as
a result of buckling in the relative convergence trajectory between Siberia and Tarim.
Conclusions Our paleomagnetic study of latest Carboniferous to Late Permian rocks from the
middle and north-eastern limbs of Kazakhstan orocline has yielded several magnetization
directions. At the Tokrau sampling locality (within the middle arm of the orocline), three
components of magnetization have been isolated: 1) a pre-folding dual polarity primary
magnetization of latest Carboniferous-Early Permian age at Tokrau-A; 2) a pre-folding
primary magnetization of the Late Permian age at Tokrau-B; and 3) an overprint likely of
early Triassic age. The directions are statistically similar to their coeval reference
directions obtained by the extrapolation from Baltica’s APWP. This correlation indicates
that no significant rotations occurred between the middle limb of the orocline and Baltica
since the latest Carboniferous-Early Permian and therefore, that the bending of this part
of the curved structure was over by that time.
Two magnetization components have been isolated in the Ayaguz locality (within
the NE limb of the orocline): 1) a pre-folding, likely primary magnetization of latest
Carboniferous-Early Permian age at Ayaguz-A; and 2) a post-folding magnetization
likely of Late Permian age at Ayaguz-B. These two directions differ in their position with
respect to the reference directions. While the Late Permian magnetization of Ayaguz-B is
statistically indistinguishable from both the coeval Tokrau-B magnetization and the
reference direction, the latest Carboniferous-Early Permian Ayaguz-A magnetization is
deflected clockwise by 31.1±6.2º relative to the reference. The deflection of this Ayaguz-
A magnetization suggests that the studied area underwent a clockwise rotation of ~30º
relative to Baltica sometime during the Permian.
The estimates of these rotation angles, combined with the data on the Middle
Devonian configuration of the belt (see Abrajevitch et al., 2007) lead us to suggest the
following scenario for the bending of the Kazakhstan orocline. A Late Devonian orogeny
started when an initial collision occurred between Tarim and Kazakhstania (Fig. 4-10).
140
This pinned Kazakhstania’s southern corner, while a dextral shear motion and a
considerable clockwise rotation of Siberia dragged its northern end, forcing it to buckle
with respect to its southern end (the modern North Tien Shan). Relative convergence
between Siberia and Tarim during the Carboniferous enhanced this buckling and led to
the subdivision of the belt into the three segments recognizable in modern maps (Fig. 4-
1). Continued subduction under the opposing arc-limbs eventually led to closure of the
intervening Junggar-Balkhash Ocean, in a process likely similar to the modern Molucca
Sea dual-subduction system (Hafkenscheid et al., 2001), while tightening of the orocline
continued. By the Late Permian the Junggar-Balkhash Ocean had ceased to exist.
Acknowledgements This study was supported by the Division of Earth Sciences and the Office of
International Science and Engineering's Eastern and Central Europe Program of the U.S.
National Science Foundation, grant EAR 0335882. Support was also derived from the
Russian Foundation of Basic Research, grants 04-05-64050, 05-05-65105 and 07-05-
00021 and Program No. 8 of the Earth Science Division, Russian Academy of Sciences.
We thank many colleagues from the Scientific Station of the Russian Academy of
Sciences in Bishkek (Kyrgyzstan) for logistic support of the fieldwork. Chris Hall is
greatfully acknowledged for conducting Ar-Ar dating of the rocks as well as for helpful
discussion of the results.
References Abrajevitch, A.V., Van der Voo, R., Levashova, N.M., Bazhenov, M.L. 2007.
Paleomagnetism of the mid-Devonian Kurgasholak Formation, Southern Kazakhstan: Constraints on the Devonian paleogeography and oroclinal bending of the Kazakhstan volcanic arc. Tectonophysics, 441, p. 67–84.
Bakhtiev, M.K.. 1987. Paleozoic orogenic magmatic belts. Nauka, Moscow 168 p. (In Russian)
Bykadorov, V. A., Bush, V. A., Fedorenko, O. A., Filippova, I. B., Miletenko, N. V., Puchkov, V. N., Smirnov, A. V., Uzhkenov, B. S., Volozh, Y. A. 2003. Ordovician-Permian palaeogeography of central Eurasia; development of Palaeozoic petroleum-bearing basins. Journal of Petroleum Geology, 26, 325-350.
Cai D., Lu H., Jia D., Wu S., Chen C. 1996. 40Ar/ 39Ar dating of the ophiolite melange in the southern Tien Shan and the mylonite in the southern rim of central Tien Shan
141
and their tectonic significance. Dizhi Kexue = Scientia Geologica Sinica, 31, 384-390.
Carey, S.W. 1955. The orocline concept in geotectonics, part I. Papers and Proceedings of the Royal Society of Tasmania, 89, 255-288.
Chen C., Lu H., Jia D., Cai D., Wu S. 1999. Closing history of the southern Tianshan oceanic basin, western China; an oblique collisional orogeny. Tectonophysics, 302, 23-40.
Chitalin A.F. 1983. The upper Paleozoic structure of the eastern part of the Spassk Anticlinorium and its frame (Central Kazakhstan). Moscow University Geology Bulletin, 38(4), 26-34.
Cocks, L.R.M., Torsvik, T.H. 2005. Baltica from the late Precambrian to mid Palaeozoic: the gain and loss of a terranes's identity. Eart- Science Reviews, 72, 39-66.
Cocks, L.R.M., Torsvik, T.H. 2007. Siberia, the wandering northern terrane, and its changing geography through the Palaeozoic. Earth-Science Reviews, 82, 29-74.
Cornell, R.M., Schwertmann, U. 2003. The iron oxides. Structure, properties, reactions, occurrences and uses. Wiley-VCH Verlag GmbH & Co. KGaA, Weinheim, p. 664.
Didenko, A.L., Mossakovsky, A.A., Pechersky, D.M., Ruzhentsev, S.V., Samygin, S.G., Kheraskova, T.N. 1994. Geodynamics of Paleozoic oceans of Central Asia. Geology and Geophysics, 35, 118– 145 (in Russian).
Dobretsov N.L., Berzin N.A., Buslov M.M. 1995. Opening and tectonic evolution of the Paleo-Asian ocean. International Geology Review, 37, 335-360.
Filippova, I.B., Bush, V.A., Didenko, A.N. 2001. Middle Paleozoic subduction belts: The leading factor in the formation of the Central Asian fold-and-thrust belt. Russian Journal of Earth Sciences, 3 (6) 405–426.
Fisher, R.A., 1953. Dispersion on a sphere. Proc. Roy. Soc. London, A 217, 295– 305.
Gialanella, P R; Heller, F; Haag, M; Nurgaliev, D (Nurgaliyev, D); Borisov, A; Burov, B; Jasonov, P (Yasonov, P); Khasanov, D; Ibragimov, S; Zharkov, I. 1997. Late Permian magnetostratigraphy on the eastern Russian Platform. Geologie en Mijnbouw, 76(1-2), 145-154.
Gradstein, D. M., Ogg, J. G., Smith, A. G., and many others, 2004. A geologic time scale. Cambridge University Press.
Grishin, D.V., Pechersky, D.M., Degtyarev, K.E. 1997. Paleomagnetism and reconstruction of Middle Paleozoic structure of Central Kazakhstan. Geotectonics, 1, 71– 81.
Hafkenscheid, E., Buiter, S.J.H., Wortel, M.J.R., Spakman, W., Bijwaard, H. 2001. Modelling the seismic velocity structure beneath Indonesia: a comparison with tomography. Tectonophysics, 333, 35-46.
142
Hounslow, M.W., Davydov, V.I., Klootwijk, C.T., Turner, P. 2004. Magnetostratigraphy of the Carboniferous; a review and future prospects. Newsletter on Carboniferous Stratigraphy, 22, pp.35-41.
Irving, E. 1964. Paleomagnetism and its application to geological and geophysical problems. New York-London-Sydney, John Wiley & Sons, p. 399.
Johnston, S.T. 2001. The Great Alaskan Terrane Wreck: reconciliation of paleomagnetic and geological data in the northern Cordillera. Earth and Planetary Science Letters, 193, 259–272.
Johnston, S.T. 2004. The New Caledonia-D'Entrecasteaux orocline and its role in clockwise rotation of the Vanuatu-New Hebrides Arc and formation of the North Fiji Basin. Special Paper - Geological Society of America, 383, 225-236,
Johnston, S.T., Acton, S. 2007. The Eocene Southern Vancouver Island Orocline — a response to seamount accretion and the cause of fold-and-thrust belt and extensional basin formation. Tectonophysics, 365, 165-183.
Khramov, A.N. 2000. The general magnetostratigraphic scale of the Phanerozoic. In: A.I. Zhamoida (ed.) Supplement to the stratigraphic code of Russia. St.Petersburg, Transactions of VSEGEI, p. 24-45. (in Russian).
Khramov, A. N., Goncharov, G.I., Komissarova, R.A., Osipova, E.P., Pogarskaya, I.A., Rodionov, V.P., Stausilais, I.P., Smirnov, L.S. Forsh, N.N. 1974. Paleozoic Paleomagnetism. Transaction of VNIGRI, Leningrad, p.1-238. (in Russian).
Kirschvink, J.L. 1980. The least-square line and plane and the analysis of palaeomagnetic data. Geophysical Journal of the Royal Astronomical Society, 62, 699– 718.
Koshkin, V. Ya. 1974. Upper Paleozoic stratigraphy of the northern part of the Balkhash-Ili Hercinian volcanic belt and the Sayak marine basin. In: Abdulin A.A. (ed.) Stratigraphy of Devonian, Carboniferous and Permian in Kazakhstan. Izdatel'stvo Nauka Kazahskoi SSR, Alma-Ata, p. 154-161. (in Russian).
Kravchinsky, V.A., Konstantinov, K.M., Courtillot, V., Savrasov, J.I., Valet, J.-P., Cherniy, S.D., Mishenin, S.G., Parasotka, B.S. 2002. Palaeomagnetism of East Siberian traps and kimberlites: two new poles and palaeogeographic reconstructions at about 360 and 250Ma: Geophysical Journal International, 148, p. 1-33.
Kurchavov, A.M. 1994. The lateral variability and evolution of orogenic volcanism in the fold belts. Geotectonics, 28, 3-18.
Levashova, N.M., Degtyarev, K.E., M.L. Bazhenov, M.L., Collins, A.Q., Van der Voo, R. 2003. Permian Paleomagnetism of East Kazakhstan and the Amalgamation of Eurasia: Geophysical Journal International, 152, 677-687.
Levashova, N.M., Mikolaichuk, A.V., McCausland, P.J.A, Bazhenov, M.L., Van der Voo, R., 2007. Devonian paleomagnetism of the North Tien Shan: Implications for the middle-late Paleozoic paleogeography of Eurasia. Earth and Planetary Science Letters, 257(1-2), 104-120.
143
Levashova, N.M., Van der Voo, R., Abrajevitch, A.V., and Bazhenov, M.L. 2008. Paleomagnetism of mid-Paleozoic subduction-related volcanics from the Chingiz Range in NE Kazakhstan: The evolving paleogeography of an amalgamating Eurasian continent. Geological Society of America Bulletin, in revision.
Lister, G.S., Forster, M.A., Rawling, T.J. 2001. Episodicity during orogenesis. In: Miller, J A; Holdsworth, R E; Buick, Ian S; Hand, Martin (eds). Continental reactivation and reworking. Geological Society Special Publications, 184, 89-113.
McFadden, P.L., McElhinny, M.W. 1988. The combined analysis of remagnetization circles and direct observations in paleomagnetism. Earth and Planetary Science Letters, 87, 161– 172.
McFadden, P.L., and McElhinny, M.W. 1990. Classification of the reversal test in paleomagnetism. Geophysical Journal International, 103, 725– 729.
Menning, M., Alekseev, A.S., Chuvashov, B.I., Davydov, V.I., Devuyst, F.X., Forke, H.C., Grunt, T.A., Hance, L., Heckel, P.H., Izokh, N.G., Jin, Y.G., Jones, P.J., Kotlyar, G.V., Kozur, H.W., Nemyrovska, T.I., Schneider, J.W., Wang, X.D., Weddige, K., Weyer, D., Work, D.M. 2006. Global time scale and regional stratigraphic reference scales of central and west Europe, east Europe, Tethys, south China, and North America as used in the Devonian-Carboniferous-Permian Correlation Chart 2003 (DCP 2003). Palaeogeography, Palaeoclimatology, Palaeoecology, 240(1-2), 318-372.
Menning, M., Katzung, G.,Luetzner, H. 1988. Magnetostratigraphic investigations in the Rotliegendes (300-252 Ma) of Central Europe. Zeitschrift fuer Geologische Wissenschaften, 16(11-12), 1045-1063.
Miasnikov, A.K. 1974. Upper Paleozoic of Bakanas Synclinorium (North-East Balkhash area). In: Abdulin A.A. (ed) Stratigraphy of Devonian, Carboniferous and Permian in Kazakhstan. Izdatel'stvo Nauka Kazahskoi SSR, Alma-Ata, p. 154-161. (in Russian).
Mossakovsky, A.A., Ruzhentsev, S.V., Samygin, S.G., Kheraskova, T.N. 1993. Central Asian fold belt: geodynamic evolution and formation. Geotectonics, 27(6), 3– 32.
Natal’in, B. A., and Şengör, A. M. C. 2005. Late Palaeozoic to Triassic evolution of the Turan and Scythian platforms: the pre-history of the palaeo-Tethyan closure. Tectonophysics, 404, 175-202.
Ogg, J.G. 1995. Magnetic polarity time scale of the Phanerozoic. AGU Reference Shelf, 1, pp.240-270.
Pavlov, V.E., Courtillot, V., Bazhenov, M.L., Veselovsky, R.V. 2007. Paleomagnetism of the Siberian traps: new data and a new overall 250 Ma pole for Siberia: Tectonophysics, 443, 72–92.
Sal'menova, K.Z., Koshkin, V. Y. 1990. Stratigraphy and flora of the Late Paleozoic in the North Balkhash area. Nauka, Almaty, 160 p. (in Russian)
Şengör, A M C; Natal'in, B. A., Burtman, V. S. 1993. Evolution of the Altaid tectonic collage and Palaeozoic crustal growth in Eurasia. Nature (London), 364, 299-307.
144
Şengör, A.M.C., Natal’in, B.A. 1996. Paleotectonics of Asia: fragments of a synthesis. In: Yin, A., Harrison, M. (Eds.), The Tectonic Evolution of Asia. Cambridge Univ. Press, Cambridge, pp. 486– 640.
Skrinnik, L.I., Horst, V.E. 1995. Devonian island arc volcanic complexes in the Junggar Alatau. Geology and exploration of Kazakhstan, 4, 6-10.
Suvorov, A.I., 1963. The Spassk Zone of Central Kazakhstan and some problems of its strike-slip tectonics. Izvestiya of AN SSSR, seriya geologicheskaya, 9, 46-50. (in Russian)
Tauxe, L., Watson, G.S., 1994. The fold test; an eigen analysis approach. Earth and Planetary Science Letters, 122(3-4), 331-341.
Tectonics of Kazakhstan: Explanatory notes to Tectonic map of East Kazakhstan, 1:2 500 000, 1982: Moscow, Nauka, 139 p. (in Russian).
Tevelev, A.V. 2001. The evolution of the south-eastern margin of the Kazakhstan paleocontinent in the Late Paleozoic, in: E.E. Milanovsky, A.B. Weinmar, Al.V. Tevelev, (eds.) Geology of Kazakhstan and the problems of the Ural-Mongol fold belt. Moscow State University Publications, Moscow, 113-125. (in Russian)
Tikhomirov, V.G., 1975. Paleozoic magmatism and tectonics of central Kazakhstan. Nedra, Moscow, USSR (SUN), 147 p. (in Russian)
Torsvik, T.H., Muller, R.D., Van der Voo, R., Steinberger, B., Gaina, C. 2008. Global plate motion frames: toward a unified model. Reviews of Geophysics, in revision.
Van der Voo, R. 1993. Paleomagnetism of the Atlantic, Tethys and Iapetus Oceans Cambridge Univ. Press, Cambridge. 411 pp.
Van der Voo, R. 2004. Paleomagnetism, oroclines and the growth of the continental crust, GSA Today, 14 (12), 4-9.
Van der Voo, R., Levashova, N.M., Skrinnik, L.I., Kara, T.V., Bazhenov, M.L. 2006. Late orogenic, large-scale rotations in the Tien Shan and adjacent mobile belts in Kyrgyzstan and Kazakhstan. Tectonophysics, 426, 335-360.
Veimarn, A.B. and Milanovsky, E.E. 1990. Framenian Rifting in Central Kazakhstan and some other areas, Paper 1. Byullyuten’ Moskovskogo Obschestva Ispatatelei Prirody, otd. geol., 65, 34-47 (in Russian).
Wang, B., Chen, Y., Zhan, S., Shu, L.S., Faure, M., Cluzel, D., Charvet, J., Laurent-Charvet, S. 2007. Primary Carboniferous and Permian paleomagnetic results from the Yili Block (NW China) and their implications on the geodynamic evolution of Chinese Tianshan Belt. Earth and Planetary Science Letters, 263, 288-308.
Watson, G.S. 1956. A test for randomness. Monthly Notes of the Royal Astronomical Society, 7, 160-161.
Weil, A.B. and Sussman, A.J. (eds.) 2004. Orogenic curvature: Integrating paleomagnetic and structural analyses. Geological Society of America Special Paper, 383, p. 271.
145
Windley, B.F., Alexeiev, D., Xiao, W.J., Kröner, A., and Badarch, G. 2007. Tectonic models for accretion of the Central Asian Orogenic Belt, Journal of the Geological Society of London, 164, 31-47.
Yakubchuk, A. 1997. Kazakhstan. In: Moores and Fairbridge (Eds), Encyclopedia of European and Asian regional geology. Chapman and Hall, London, pp. 450-465.
Zijderveld, J.D.A. 1967. AC demagnetization of rocks: analysis of results. In: Collinson, D.W., Creer, K.M. (Eds.), Methods in Paleomagnetism. Elsevier, Amsterdam, pp. 254– 286.
Zonenshain, L.P., Kuzmin, M.I., Natapov, L.M. 1990. Geology of the USSR: a plate tectonic synthesis. Ed. Page, B.M. AGU, Geodynamic series, volume 21. Washington, D.C., 250p.
146
Chapter 5
Variations in relative abundances of goethite and hematite in the Bengal Fan sediments: climatic vs. diagenetic signal
Introduction Growing realization that a warming climate is changing the globe contributed to
the renewed interest in paleo-climate studies. One of the most important components of
the climate system that profoundly affects humanity’s livelihood is rain-fall patterns.
Precipitation not only plays an important role in shaping the landscape on geologic (e.g.,
Etheredge et al., 2004; Grujic et al., 2006; Roe et al., 2002) and human time-scales
(Hereford and Webb, 2001), it also brings moisture needed for agriculture and basic
human necessities for the majority of the world’s population. At present, more than a
third of the world population lives in the areas of monsoonal climate; variations in the
strength of the monsoon that are likely to result from modern global warming will affect
the average amount of precipitation in these regions (e.g. Anderson et al., 2002).
Understanding the factors influencing the monsoon system, as well as the range of
variations in the average amount of rain-fall can provide a perspective for effective
sustainable development planning.
In terrestrial environments, the average amount of precipitation can be estimated
based on the response of iron-bearing minerals to climate induced changes in the soil-
forming processes (e.g. Yapp, 2001; Evans and Heller, 2003). The ratio of two pedogenic
minerals, goethite (G) and hematite (H), is climate sensitive and has been used by soil
scientists to infer cold and humid versus warm climatic phases (e.g. Kampf and
Schwertmann, 1983; Tardy and Roquin, 1992; Sangode and Bloemendal, 2004; and
references therein). Detailed studies of soil sequences showed that the G/G+H ratio does

147
not depend on the parental rocks composition, and is influenced only by climatic factors.
Higher average annual temperatures favor formation of hematite, whereas higher excess
moisture and higher organic carbon promote goethite formation. As organic carbon
content and moisture availability are generally joined in tropical and subtropical regions,
a relative abundance of goethite (high G/(G+H)) can be used as an indicator of higher
precipitation, whereas low values imply dryer/warmer conditions. The high sensitivity of
the G/(G+H) ratio to precipitation is demonstrated by its correlation with topography on
small (hundred meter) scales; soils with higher concentration of hematite occur on the
drier slopes and grade into goethite-rich soils in the wetter depressions (Curi and
Franzmeier, 1984a; Santana, 1984; da Motta and Kampf, 1992).
Similar climatic interpretation of relative abundances of goethite and hematite has
been increasingly applied to marine sediments (e.g. Harris and Mix, 1999; 2002; Clift,
2006; Zhang at al., 2007). That is, goethite vs. hematite content in the detrital fraction
reflects the precipitation regime in the source area of the sediments. Marine conditions,
however, impose another variable on the ratio of pedogenic minerals. Diagenetic
dissolution of iron (oxyhydr)oxides, goethite and hematite among them, have been
documented in multiple studies of marine sediments (e.g., Tarduno and Wilkison, 1996;
Giosan et al., 2002; Liu et al., 2004). In the studies cited at the beginning of this paragraph,
the possibility of the diagenetic modification of the G/(G+H) ratio was either not
considered (Clift, 2006), or inferred to be non-existent (Harris and Mix, 1999, 2002;
Zhang et al., 2007). As strong evidence against dissolution, the last studies invoke an
absence of a systematic down-core decline in amplitude of the variability, and the
abundance, of the pedogenic oxides ratios.
To better understand the applicability of the G/(G+H) parameter as a precipitation
proxy in the studies of marine sediments we conducted a rock-magnetic study of the
Bengal Fan sediments. The Bengal Fan is the world’s largest submarine fan; it is fed by the
Ganges-Brahmaputra river system that carries sediments eroded from the Himalaya (Fig 5-1),
including a share of sediments that had been temporarily stored on the Indo-Gangetic plain
and were chemically altered during their residence there. Various proxy records indicate that
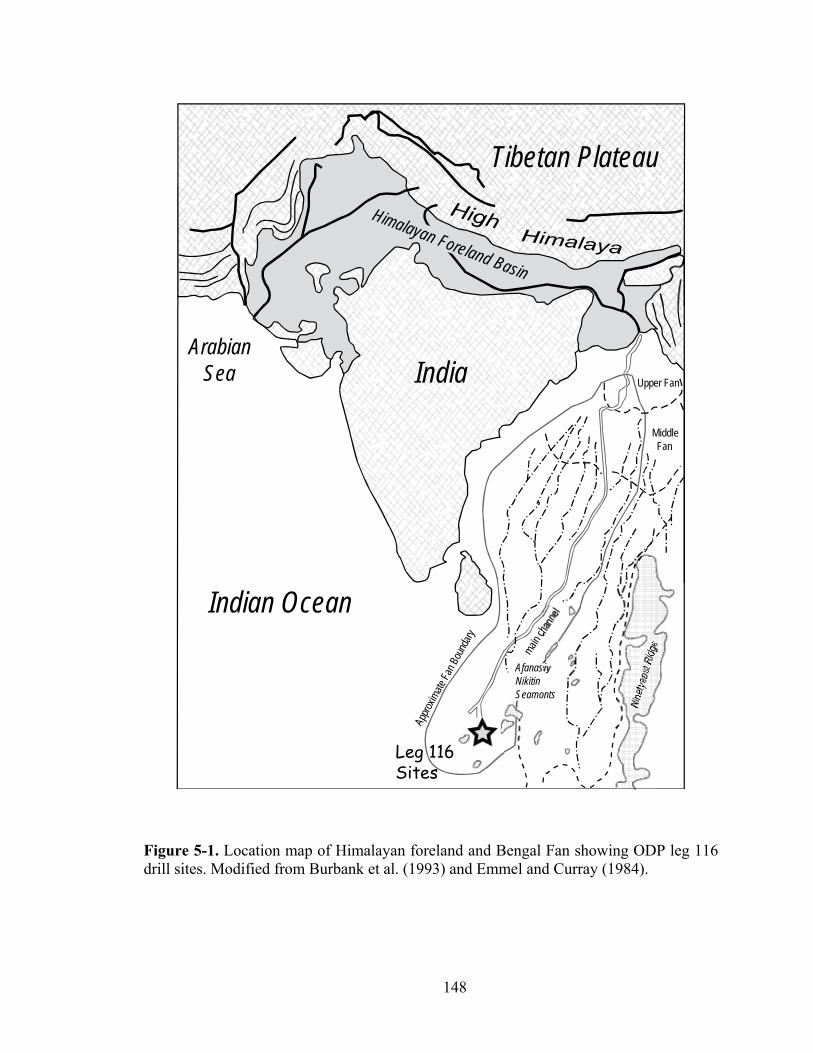
148
India
main ch
anne
lIndian Ocean
Arabian Sea Upper Fan
Middle Fan
Appro
ximate
Fan B
ound
ary
AfanasiyNikitinSeamonts
Nine
tyeas
t Ridg
e
Leg 116Sites
Tibetan Plateau
Himalayan Foreland Basin
Figure 5-1. Location map of Himalayan foreland and Bengal Fan showing ODP leg 116 drill sites. Modified from Burbank et al. (1993) and Emmel and Curray (1984).
149
there was a significant climate change in the Himalaya-Indian Ocean region at ~ 7-8 Ma (see
next section for details). The climatic turnover has been alternatively interpreted as an
indication of the onset or marked strengthening of the monsoon (e.g., Prell et al., 1992;
Quade et al., 1989; Ding et al., 2001), but also as marking increased aridity in the region
(Gupta et al., 2004; Stern et al. 1997; Derry and France-Lanord, 1996). Both options imply a
significant change, albeit of opposite sense, in the average amount of precipitation in the
Himalayan Foreland. The mode of change in relative abundances of goethite and hematite in
sediments derived from the foreland basin can help to discriminate between these end
members, as the G/(G+H) parameter should increase with the intensification of the monsoon,
and decrease with aridification.
Geological background
Climate change in the region The modern precipitation regime in the Northern part of the Indian subcontinent is
controlled by the South-Asian monsoon system. The monsoon itself is a progeny of the
Tibetan Plateau. In summer, as the plateau heats, it generates a high-altitude region of
low pressure; warm air rises from the plateau, pulling in moist air from the ocean and
bringing heavy squally showers into the highlands. In winter, the cooling plateau
generates a high pressure region; cold, dry air spills off the plateau bringing sunny, dry
and dusty weather to the northern part of the Indian subcontinent. This distinctive
alternation of wet and dry seasons implies the presence of a broad and high plateau
(Hastenrath, 1991).
It is still debated when the Asian monsoon system was initiated. Estimates range
from about 30 Ma to 7-8 Ma, based on the modeling of Paratethys retreat (Ramstein et
al., 1997), sedimentary records in China (Guo et al., 2002; Wang 1990), oceanic
microfossils (Chen et al., 2003; Kroon et al., 1991), or fossil flora (Quade et al., 1989;
Spicer et al., 2003). Regadless whether the onset of monsoon was earlier, various proxy
records indicate that there was a significant climate change in the region at ~ 7-8 Ma. At
that time, accumulation of the aeolian loess deposits in Eastern China began (Ding et al.,
2001), sedimentation rates in the Northern Indian Ocean increased (Rea 1992), biogenic
productivity in the Arabian Sea rose (Prell et al., 1992; Kroon et al., 1991), and carbon
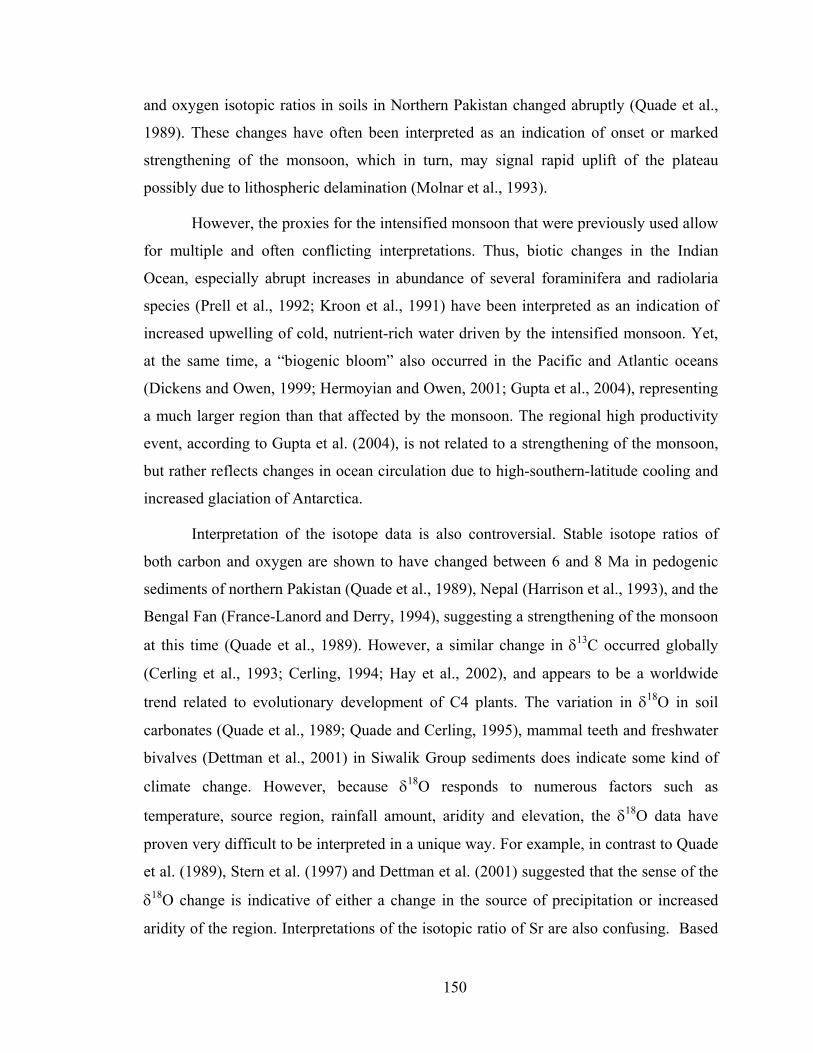
150
and oxygen isotopic ratios in soils in Northern Pakistan changed abruptly (Quade et al.,
1989). These changes have often been interpreted as an indication of onset or marked
strengthening of the monsoon, which in turn, may signal rapid uplift of the plateau
possibly due to lithospheric delamination (Molnar et al., 1993).
However, the proxies for the intensified monsoon that were previously used allow
for multiple and often conflicting interpretations. Thus, biotic changes in the Indian
Ocean, especially abrupt increases in abundance of several foraminifera and radiolaria
species (Prell et al., 1992; Kroon et al., 1991) have been interpreted as an indication of
increased upwelling of cold, nutrient-rich water driven by the intensified monsoon. Yet,
at the same time, a “biogenic bloom” also occurred in the Pacific and Atlantic oceans
(Dickens and Owen, 1999; Hermoyian and Owen, 2001; Gupta et al., 2004), representing
a much larger region than that affected by the monsoon. The regional high productivity
event, according to Gupta et al. (2004), is not related to a strengthening of the monsoon,
but rather reflects changes in ocean circulation due to high-southern-latitude cooling and
increased glaciation of Antarctica.
Interpretation of the isotope data is also controversial. Stable isotope ratios of
both carbon and oxygen are shown to have changed between 6 and 8 Ma in pedogenic
sediments of northern Pakistan (Quade et al., 1989), Nepal (Harrison et al., 1993), and the
Bengal Fan (France-Lanord and Derry, 1994), suggesting a strengthening of the monsoon
at this time (Quade et al., 1989). However, a similar change in δ13C occurred globally
(Cerling et al., 1993; Cerling, 1994; Hay et al., 2002), and appears to be a worldwide
trend related to evolutionary development of C4 plants. The variation in δ18O in soil
carbonates (Quade et al., 1989; Quade and Cerling, 1995), mammal teeth and freshwater
bivalves (Dettman et al., 2001) in Siwalik Group sediments does indicate some kind of
climate change. However, because δ18O responds to numerous factors such as
temperature, source region, rainfall amount, aridity and elevation, the δ18O data have
proven very difficult to be interpreted in a unique way. For example, in contrast to Quade
et al. (1989), Stern et al. (1997) and Dettman et al. (2001) suggested that the sense of the
δ18O change is indicative of either a change in the source of precipitation or increased
aridity of the region. Interpretations of the isotopic ratio of Sr are also confusing. Based
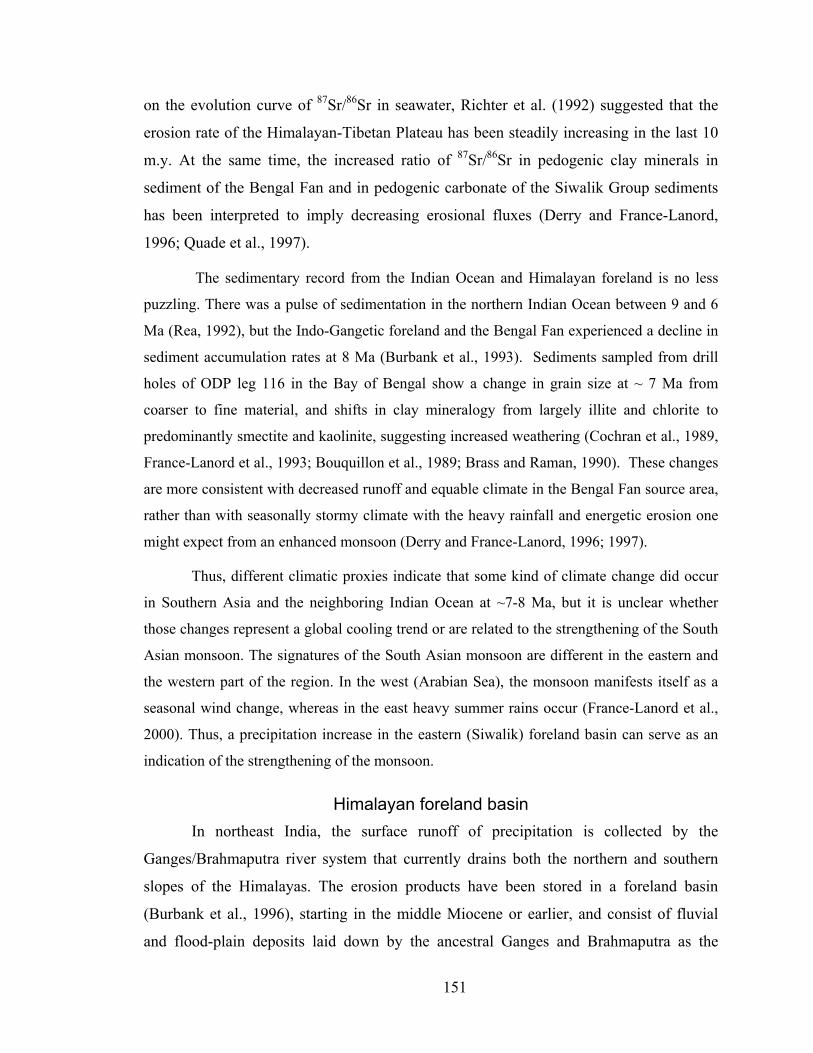
151
on the evolution curve of 87Sr/86Sr in seawater, Richter et al. (1992) suggested that the
erosion rate of the Himalayan-Tibetan Plateau has been steadily increasing in the last 10
m.y. At the same time, the increased ratio of 87Sr/86Sr in pedogenic clay minerals in
sediment of the Bengal Fan and in pedogenic carbonate of the Siwalik Group sediments
has been interpreted to imply decreasing erosional fluxes (Derry and France-Lanord,
1996; Quade et al., 1997).
The sedimentary record from the Indian Ocean and Himalayan foreland is no less
puzzling. There was a pulse of sedimentation in the northern Indian Ocean between 9 and 6
Ma (Rea, 1992), but the Indo-Gangetic foreland and the Bengal Fan experienced a decline in
sediment accumulation rates at 8 Ma (Burbank et al., 1993). Sediments sampled from drill
holes of ODP leg 116 in the Bay of Bengal show a change in grain size at ~ 7 Ma from
coarser to fine material, and shifts in clay mineralogy from largely illite and chlorite to
predominantly smectite and kaolinite, suggesting increased weathering (Cochran et al., 1989,
France-Lanord et al., 1993; Bouquillon et al., 1989; Brass and Raman, 1990). These changes
are more consistent with decreased runoff and equable climate in the Bengal Fan source area,
rather than with seasonally stormy climate with the heavy rainfall and energetic erosion one
might expect from an enhanced monsoon (Derry and France-Lanord, 1996; 1997).
Thus, different climatic proxies indicate that some kind of climate change did occur
in Southern Asia and the neighboring Indian Ocean at ~7-8 Ma, but it is unclear whether
those changes represent a global cooling trend or are related to the strengthening of the South
Asian monsoon. The signatures of the South Asian monsoon are different in the eastern and
the western part of the region. In the west (Arabian Sea), the monsoon manifests itself as a
seasonal wind change, whereas in the east heavy summer rains occur (France-Lanord et al.,
2000). Thus, a precipitation increase in the eastern (Siwalik) foreland basin can serve as an
indication of the strengthening of the monsoon.
Himalayan foreland basin In northeast India, the surface runoff of precipitation is collected by the
Ganges/Brahmaputra river system that currently drains both the northern and southern
slopes of the Himalayas. The erosion products have been stored in a foreland basin
(Burbank et al., 1996), starting in the middle Miocene or earlier, and consist of fluvial
and flood-plain deposits laid down by the ancestral Ganges and Brahmaputra as the
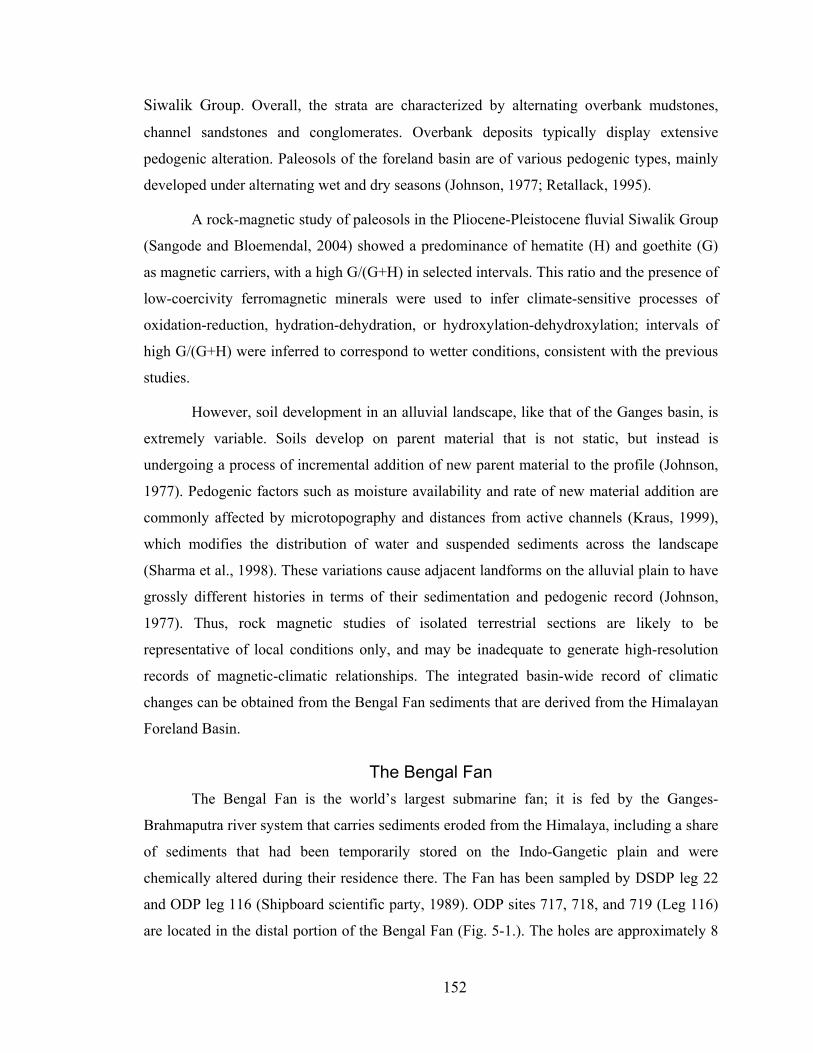
152
Siwalik Group. Overall, the strata are characterized by alternating overbank mudstones,
channel sandstones and conglomerates. Overbank deposits typically display extensive
pedogenic alteration. Paleosols of the foreland basin are of various pedogenic types, mainly
developed under alternating wet and dry seasons (Johnson, 1977; Retallack, 1995).
A rock-magnetic study of paleosols in the Pliocene-Pleistocene fluvial Siwalik Group
(Sangode and Bloemendal, 2004) showed a predominance of hematite (H) and goethite (G)
as magnetic carriers, with a high G/(G+H) in selected intervals. This ratio and the presence of
low-coercivity ferromagnetic minerals were used to infer climate-sensitive processes of
oxidation-reduction, hydration-dehydration, or hydroxylation-dehydroxylation; intervals of
high G/(G+H) were inferred to correspond to wetter conditions, consistent with the previous
studies.
However, soil development in an alluvial landscape, like that of the Ganges basin, is
extremely variable. Soils develop on parent material that is not static, but instead is
undergoing a process of incremental addition of new parent material to the profile (Johnson,
1977). Pedogenic factors such as moisture availability and rate of new material addition are
commonly affected by microtopography and distances from active channels (Kraus, 1999),
which modifies the distribution of water and suspended sediments across the landscape
(Sharma et al., 1998). These variations cause adjacent landforms on the alluvial plain to have
grossly different histories in terms of their sedimentation and pedogenic record (Johnson,
1977). Thus, rock magnetic studies of isolated terrestrial sections are likely to be
representative of local conditions only, and may be inadequate to generate high-resolution
records of magnetic-climatic relationships. The integrated basin-wide record of climatic
changes can be obtained from the Bengal Fan sediments that are derived from the Himalayan
Foreland Basin.
The Bengal Fan The Bengal Fan is the world’s largest submarine fan; it is fed by the Ganges-
Brahmaputra river system that carries sediments eroded from the Himalaya, including a share
of sediments that had been temporarily stored on the Indo-Gangetic plain and were
chemically altered during their residence there. The Fan has been sampled by DSDP leg 22
and ODP leg 116 (Shipboard scientific party, 1989). ODP sites 717, 718, and 719 (Leg 116)
are located in the distal portion of the Bengal Fan (Fig. 5-1.). The holes are approximately 8
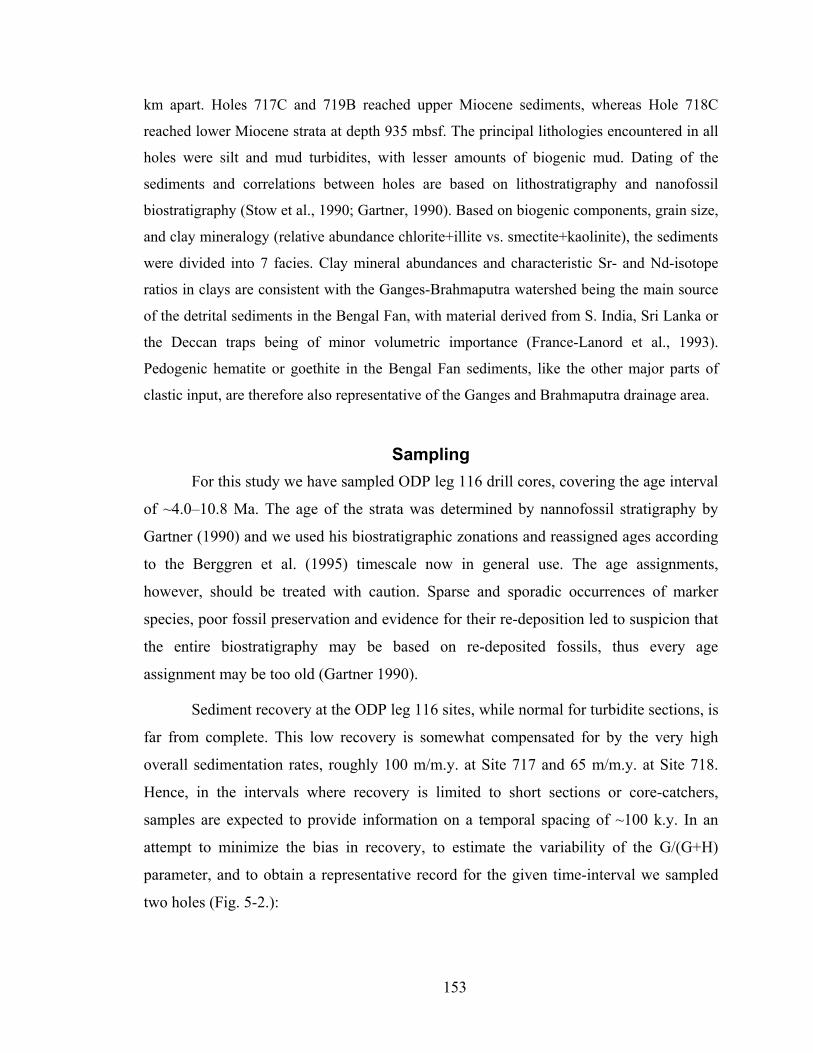
153
km apart. Holes 717C and 719B reached upper Miocene sediments, whereas Hole 718C
reached lower Miocene strata at depth 935 mbsf. The principal lithologies encountered in all
holes were silt and mud turbidites, with lesser amounts of biogenic mud. Dating of the
sediments and correlations between holes are based on lithostratigraphy and nanofossil
biostratigraphy (Stow et al., 1990; Gartner, 1990). Based on biogenic components, grain size,
and clay mineralogy (relative abundance chlorite+illite vs. smectite+kaolinite), the sediments
were divided into 7 facies. Clay mineral abundances and characteristic Sr- and Nd-isotope
ratios in clays are consistent with the Ganges-Brahmaputra watershed being the main source
of the detrital sediments in the Bengal Fan, with material derived from S. India, Sri Lanka or
the Deccan traps being of minor volumetric importance (France-Lanord et al., 1993).
Pedogenic hematite or goethite in the Bengal Fan sediments, like the other major parts of
clastic input, are therefore also representative of the Ganges and Brahmaputra drainage area.
Sampling For this study we have sampled ODP leg 116 drill cores, covering the age interval
of ~4.0–10.8 Ma. The age of the strata was determined by nannofossil stratigraphy by
Gartner (1990) and we used his biostratigraphic zonations and reassigned ages according
to the Berggren et al. (1995) timescale now in general use. The age assignments,
however, should be treated with caution. Sparse and sporadic occurrences of marker
species, poor fossil preservation and evidence for their re-deposition led to suspicion that
the entire biostratigraphy may be based on re-deposited fossils, thus every age
assignment may be too old (Gartner 1990).
Sediment recovery at the ODP leg 116 sites, while normal for turbidite sections, is
far from complete. This low recovery is somewhat compensated for by the very high
overall sedimentation rates, roughly 100 m/m.y. at Site 717 and 65 m/m.y. at Site 718.
Hence, in the intervals where recovery is limited to short sections or core-catchers,
samples are expected to provide information on a temporal spacing of ~100 k.y. In an
attempt to minimize the bias in recovery, to estimate the variability of the G/(G+H)
parameter, and to obtain a representative record for the given time-interval we sampled
two holes (Fig. 5-2.):
154
site 717, hole C, interval ~5.5 Ma (416.5 mbsf) to 9.4 Ma (828.2 mbsf), taking a
sample every 30 cm;
site 718, hole C, interval ~4.0 Ma (132.8 mbsf) to 10.8 Ma (561.3 mbsf), taking a
sample every 20 cm,
A sample in this study comprises ~1.8 cm3 volume of sediment packed into a
standard cylindrical holder (outer dimensions of 7/16” diameter and ¾” length).
Methods for identification of magnetic minerals in samples In this study magnetic minerals have been identified and their amount in the
samples estimated based on their magnetic properties, such as coercivity (IRM
acquisition analysis), the Curie or Neel temperature, and low temperature transitions
(thermomagnetic runs). In addition, we performed a transmisson electron microscopy
study on magnetic separates from two samples. A brief description of the methods and
results from the Bengal Fan sediments are given below.
IRM acquisition analysis
We used the analysis of isothermal remanent magnetization (IRM) acquisition
curves as the main method of identification/quantification of magnetic phases present in a
sample. The samples were stepwise magnetized in 30 steps to the highest field of 4.5
Tesla with an impulse magnetizer. After each step the remanent magnetization of the
sample was measured. The IRM acquisition curve then is statistically analyzed to find the
number of different coercivity components that best fit the curve. We used the IRM
fitting program of Kruiver et al. (2001) that is limited to symmetric distribution in log-
space, which is also referred to as the cumulative log-Gaussian approach (Fig. 5-3). In
this method, an assemblage of grains of a single magnetic mineral is characterized by: 1)
its saturation IRM (SIRM), a parameter that is proportional to the content of the mineral
in a sample, 2) mean coercivity, the field at which half of the SIRM is reached, B1/2;
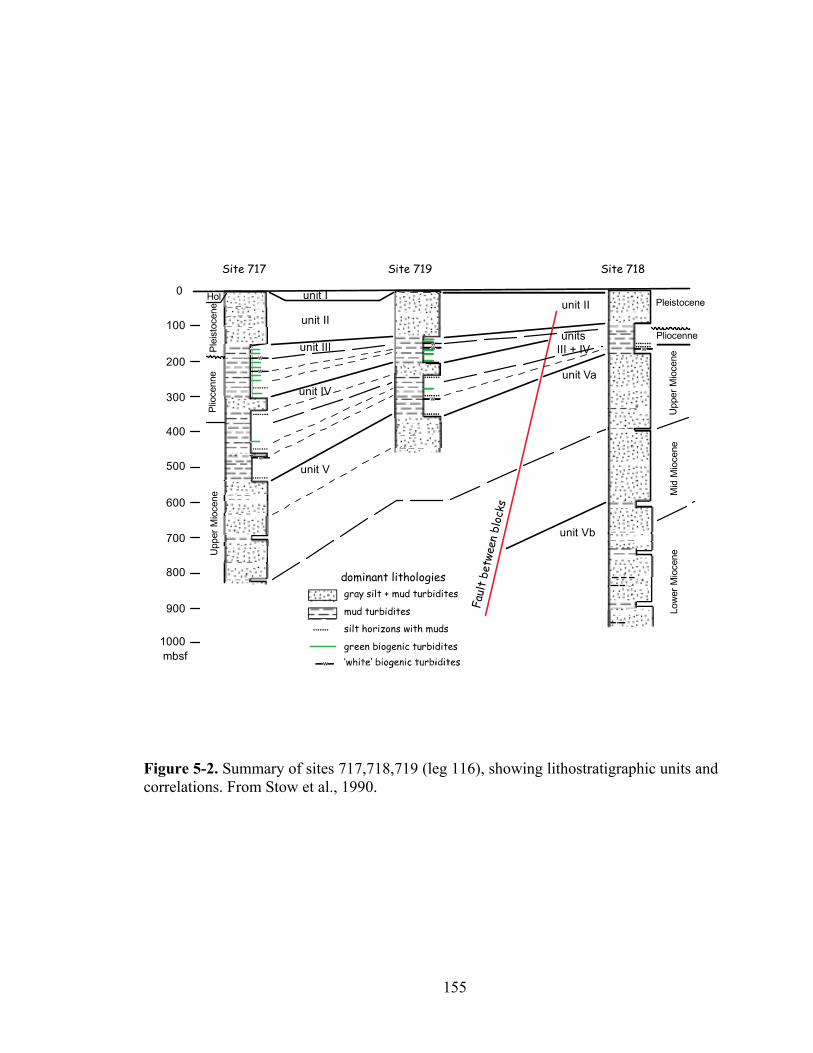
155
w
w
w
w
w
ww w
0
100
200
300
400
500
600
700
800
900
1000mbsf
unit I
unit II
unit III
unit IV
unit V
unit II
unitsIII + IV
unit Va
unit Vb
Hol
Ple
isto
cene
Pleistocene
Pliocenne
Plio
cenn
eU
pper
Mio
cene
Upp
er M
ioce
neM
id M
ioce
neLo
wer
Mio
cene
Faul
t be
twee
n bl
ocks
Site 717 Site 719 Site 718
dominant lithologiesgray silt + mud turbidites
mud turbidites
silt horizons with muds
green biogenic turbidites
Figure 5-2. Summary of sites 717,718,719 (leg 116), showing lithostratigraphic units and correlations. From Stow et al., 1990.
156
3) the width of the distribution, the dispersion parameter DP, given by one standard
deviation of the logarithmic distribution. If more than one magnetic mineral is present,
their IRM acquisition curves add linearly.
Thermomagnetic runs
Magnetization (the IRM given at 0.5 T of a sample) was measured as a function
of temperature for two representative samples, 7-75-2-30 and 7-64-2-90. Measurements
were done with the high-temperature Vibrating Sample Magnetometer at the Institute for
Rock Magnetism. Samples were heated from room temperature (25 oC) up to 700 oC in
air, and then cooled back to room temperature; heating and cooling rates were ~ 10 oC/min. Stepwise thermomagnetic runs were performed for sample 7-54-7-0; the sample
was warmed to increasingly elevated temperature with intermittent cooling between
successive heatings. The peak heating temperatures of the steps ranged from 200oC to
700oC with 100oC increments.
Low Temperature cycling
We conducted experiments described in Carter-Stiglitz et al. (2006) on a set of
samples with variable relative contributions of hematite and goethite components as
estimated by the technique of Kruiver et al. (2001). During the experiments, remanence
acquired in 5T field and then partially AF demagnetized with a maximum field of 0.2T
was measured on cooling from 300-20K, warming 20-400K, and cooling 400-20K. The
Carter-Stiglitz et al. (2006) method allows evaluation of the contribution of goethite and
hematite in the high coercivity fraction based on differences in temperature-dependent
behavior of these minerals. On cooling from room temperature (300K) to 20K and then
heating back to room temperature in zero field (i.e. low temperature loop of the
thermomagnetic run), hematite can lose a part of the initial NRM intensity at the Morin
Transition (at ~ 250K). Fig. 5-4a shows an example of the Morin transition in synthetic
(stoichiometric) hematite with a large drop in intensity on cooling and a partial recovery
on warming trough the transition temperature. The Morin transition, however, is very
sensitive to crystallinity and substitution content; in pedogenic hematite, which is poorly
crystalline and often incorporates significant amounts of aluminum into the structure, the
Morin transition can be partially or completely suppressed (e.g. De Grave et al., 2002;
157
Cornell and Schwertmann, 2003, Dunlop and Ozdemir, 1997). Thus, the low temperature
thermomagnetic runs for hematite can be either non-reversible if the Morin transition is
present, or nearly reversible if it is suppressed. On heating from room temperature to
400K and cooling back to the room temperature (the high temperature part of the
thermomagnetic run), the hematite’s NRM does not change (Fig.5-4a).
Goethite’s properties are opposite to those of hematite; the low temperature loop
of the termomagnetic run is always reversible. However, upon heating from room
temperature to 400 K (≥ the Neel temperature of goethite) goethite loses all NRM
intensity, and there is no recovery of intensity upon cooling in a zero-field back to room
temperature (Fig.5-4b). Accordingly, the contribution of goethite to the total IRM of the
high coercivity fraction can be measured as a loss of IRM5T-0.2T (remanence acquired in
5T field and then partially AF demagnetized with a maximum field of 0.2T to eliminate
low coercivity fraction of the magnetic assemblage) upon heating from 300K to 400K
and cooling back to 300K in zero field after the low temperature loop of the
termomagnetic run (Fig.5-4c).
Low temperature cycling (LowTC) experiments were performed on 51
representative samples from the Bengal Fan core 717. The samples were measured
continuously during zero-field cooling to 20K, warming to 400K and cooling to 300K
with an MPMS SQUID magnetometer at the Institute for Rock Magnetism in
Minneapolis.
TEM observations
The magnetic separates from two samples, 7-68-cc-32 and 7-68-2-88, were
prepared in order to validate the identification of magnetosomes in our samples. Distilled
water was added to the samples, and the samples were put into ultra-sonic bath to form a
suspension. A hand-held, rare-earth magnet then was used to separate magnetic grains.
Magnetic separates were transferred from the magnet onto a copper grid for analysis in a
Philips CM12 Analytical Electron Microscope. Elemental spectra for selected grains
were determined using energy dispersive spectroscopy (EDS).
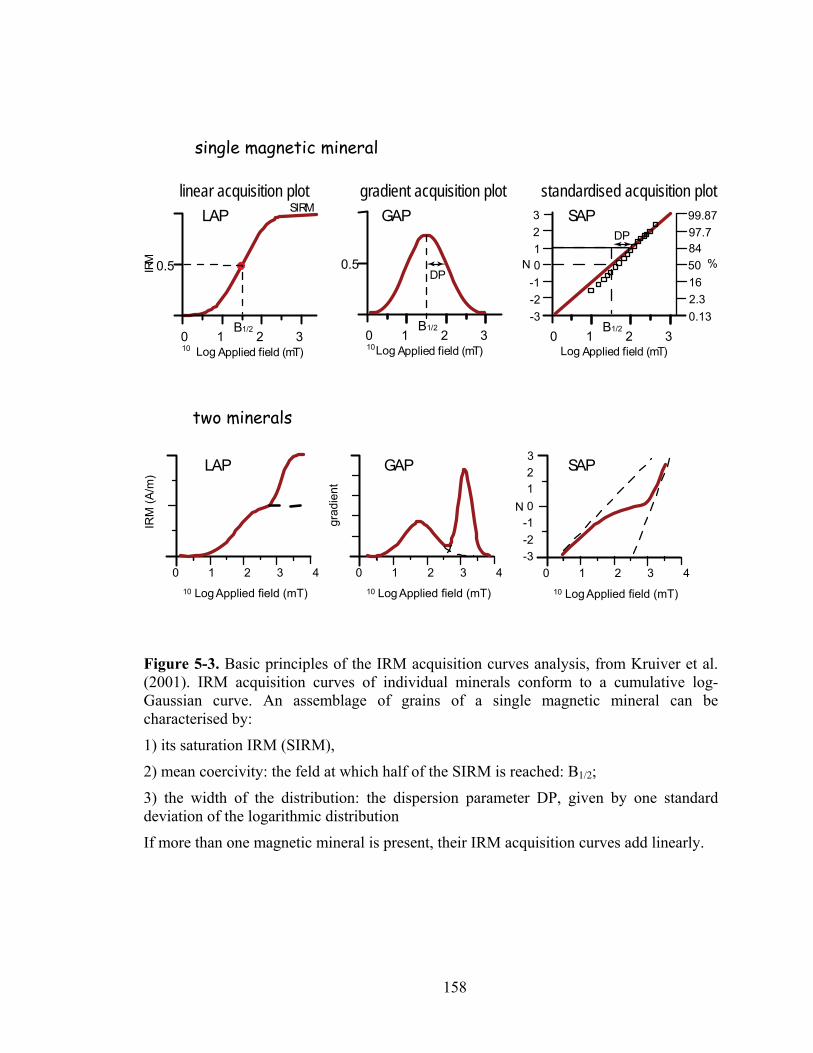
158
IRM
(A/m
)
0 1 2 3 4
LogApplied field (mT)10
0 1 2 3 4
Log Applied field (mT)10
0 1 2 3 4
LogApplied field (mT)10
grad
ient
3210
-1-2-3
N
SIRM
IRM
Applied field (mT)Log100 1 2 3
0.5
B1/2
Applied field (mT)Log100 1 2 3
0.5
B1/2
Applied field (mT)Log0 1 2 3
B1/2
3210
-1-2-3
99.8797.78450162.30.13
%NDP
DP
linear acquisition plot gradient acquisition plot standardised acquisition plot
single magnetic mineral
two minerals
LAP GAP SAP
LAP GAP SAP
Figure 5-3. Basic principles of the IRM acquisition curves analysis, from Kruiver et al. (2001). IRM acquisition curves of individual minerals conform to a cumulative log-Gaussian curve. An assemblage of grains of a single magnetic mineral can be characterised by:
1) its saturation IRM (SIRM),
2) mean coercivity: the feld at which half of the SIRM is reached: B1/2;
3) the width of the distribution: the dispersion parameter DP, given by one standard deviation of the logarithmic distribution
If more than one magnetic mineral is present, their IRM acquisition curves add linearly.
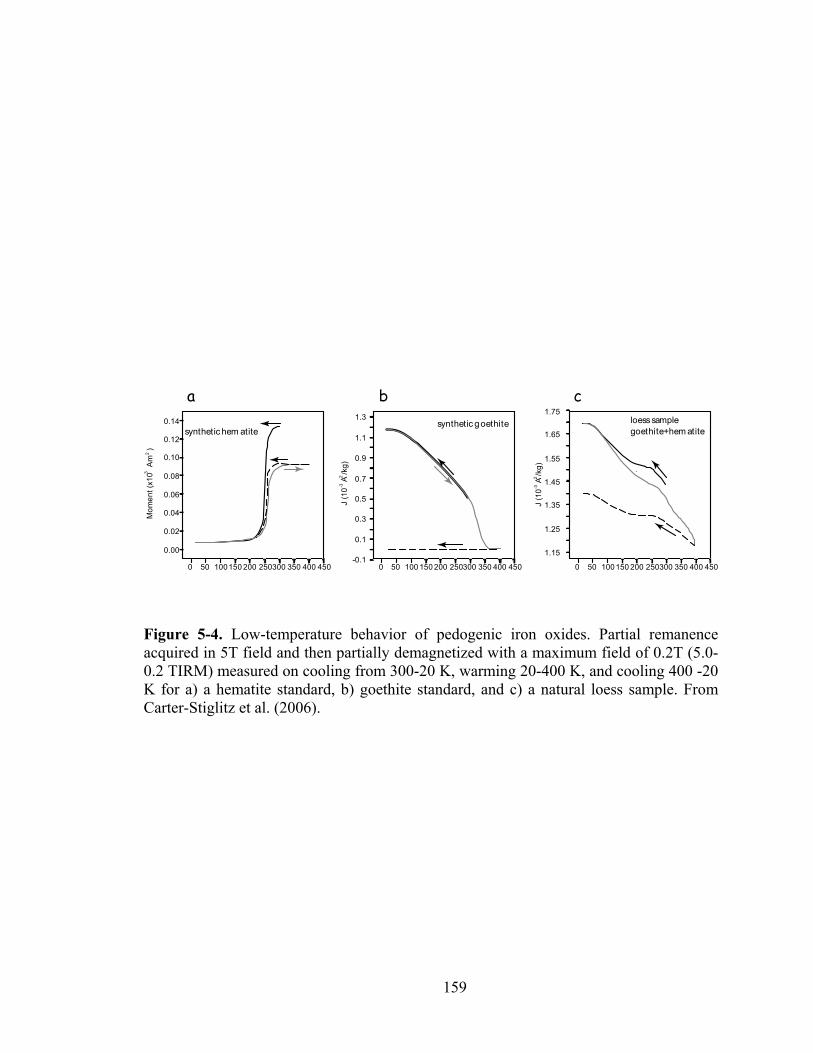
159
0 50 100150 200 250300 350 400 450
1.75
1.65
1.55
1.45
1.35
1.25
1.15
J (1
0 A
/kg)
2-3
0 50 100150 200 250300 350 400 450
0.14
0.12
0.10
0.08
0.06
0.04
0.02
0.00
Mom
ent (
x10
Am
)23
synthetic hem atite
0 50 100 150 200 250300 350 400 450
1.3
1.1
0.9
0.7
0.5
0.3
0.1
-0.1
J (1
0 A
/kg)
2-3
synthetic goethite loess samplegoethite+hem atite
a b c
Figure 5-4. Low-temperature behavior of pedogenic iron oxides. Partial remanence acquired in 5T field and then partially demagnetized with a maximum field of 0.2T (5.0-0.2 TIRM) measured on cooling from 300-20 K, warming 20-400 K, and cooling 400 -20 K for a) a hematite standard, b) goethite standard, and c) a natural loess sample. From Carter-Stiglitz et al. (2006).
160
Results Typical examples of the IRM acquisition plots for the studied samples are shown
in Fig. 5-5. There are four distinctive magnetic components with variable contribution to
the total IRM: 1) the low coercivity component with logB1/2 ~1.5-1.75 and DP ~3.0-3.5
(grey bar in Fig. 5-5) is present in all samples; 2) an additional component in the low
coercivity range; the logB1/2 is ~1.85-1.9 and a very narrow distribution, DP ~ 0.7-1.2
(green bar) is present in a majority of the samples; 3) an intermediate coercivity
component with logB1/2 ~ 2.4-2.7 and DP ~2.7-3.5 (orange bar); and 4) a high coercivity
component with logB1/2 ~3.2-3.4 and DP ~ 2.2-2.7 (yellow bar in Fig. 5-5).
Identity of the components The component with the lowest coercivity likely represents a mixture of several
magnetic phases. Previous rock-magnetic study of the ODP Leg 116 cores (Hall and
Sager, 1990) identified (titano-)magnetite and maghemite as dominant carries of
magnetization in the sediments; mean coercivities of these minerals (e.g. Dunlop and
Ozdemir, 1997) fall within our “first component” range. Thermomagnetic runs on
representative samples (Fig. 5-6) indicate that the dominant carrier of magnetization has
Curie temperature ~ 580 oC, typical of magnetite. The inflection at ~ 300-350 oC on the
heating branch of the curve (sample 7-64-2-90) suggests the presence of another
magnetic phase, likely iron sulfide, greigite or phyrrotite. The stepwise thermomagnetic
runs on sample 7-54-7-0 (Fig. 5-7) shows non-reversible behavior during heating-cooling
at temperatures up to 400 oC. In this temperature range, the cooling limb is lower than the
heating one, indicating the ongoing destruction of a magnetic phase. The Curie
temperature of this phase lies in the interval between 300 and 400 oC, consistent with iron
sulfides. The 500 oC run is reversible, with no mineralogical changes occurring in this
400-500 oC range. The 600 and 700 oC runs are non-reversible again; this time the
cooling limb is higher than the heating one, indicating that a formation of a new magnetic
phase (with the Curie temperature of ~ 580 oC- magnetite) is occurring at temperatures
higher than 500 oC. The oxidation of iron sulfide (either magnetic or non-magnetic) or a

161
Figure 5-5. Examples of IRM acquisition plotted as GAP (gradient acquisition plot) and SAP (standardized acquisition plot). Samples show variable contributions of four distinct components into the total IRM. The components are identified as hematite (orange bar), goethite (yellow bar), detrital magnetite/maghemite (grey) and biogenic magnetite (green).
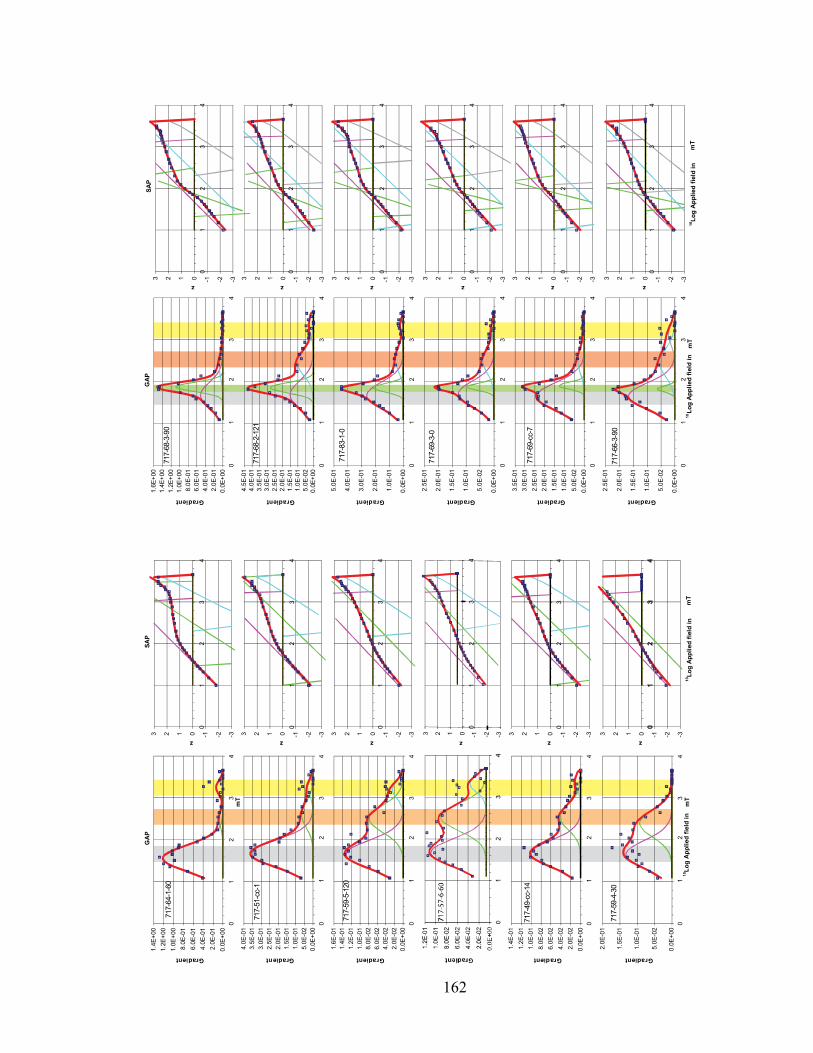
162
-3-2-10123
01
23
4
z
SAP
-3-2-10123
01
23
4
z
GA
P
0.0E
+00
2.0E
-01
4.0E
-01
6.0E
-01
8.0E
-01
1.0E
+00
1.2E
+00
1.4E
+00
01
23
4
Gradient
mT
717-
64-1
-60
-3-2-10123
01
23
4
z0.
0E+0
05.
0E-0
21.
0E-0
11.
5E-0
12.
0E-0
12.
5E-0
13.
0E-0
13.
5E-0
14.
0E-0
1
01
23
4
Gradient
717-
51-c
c-1
-3-2-10123
01
23
4
z
0.0E
+00
2.0E
-02
4.0E
-02
6.0E
-02
8.0E
-02
1.0E
-01
1.2E
-01
1.4E
-01
1.6E
-01
01
23
4
Gradient
717-
59-5
-120
-3-2-10123
01
23
4
z
0.0E
+00
2.0E
-02
4.0E
-02
6.0E
-02
8.0E
-02
1.0E
-01
1.2E
-01
1.4E
-01
01
23
4
Gradient
717-
49-c
c-14
-3-2-10123
01
23
4
10Lo
g A
pplie
d fie
ld in
z
mT
0.0E
+00
5.0E
-02
1.0E
-01
1.5E
-01
2.0E
-01
01
23
410
Log
App
lied
field
in
Gradient
mT
717-
59-4
-30
SAP
-3-2-10123
01
23
4
z
GA
P
0.0E
+00
2.0E
-01
4.0E
-01
6.0E
-01
8.0E
-01
1.0E
+00
1.2E
+00
1.4E
+00
1.6E
+00
01
23
4
Gradient
717-
68-3
-90
-3-2-10123
01
23
4
z
0.0E
+00
5.0E
-02
1.0E
-01
1.5E
-01
2.0E
-01
2.5E
-01
3.0E
-01
3.5E
-01
4.0E
-01
4.5E
-01
01
23
4
Gradient
717-
68-2
-121
-3-2-10123
01
23
4
z
0.0E
+00
1.0E
-01
2.0E
-01
3.0E
-01
4.0E
-01
5.0E
-01
01
23
4
Gradient
717-
83-1
-0
-3-2-10123
01
23
4
z
0.0E
+00
5.0E
-02
1.0E
-01
1.5E
-01
2.0E
-01
2.5E
-01
01
23
4
Gradient
717-
69-3
-0
-3-2-10123
01
23
4
z
0.0E
+00
5.0E
-02
1.0E
-01
1.5E
-01
2.0E
-01
2.5E
-01
3.0E
-01
3.5E
-01
01
23
4
Gradient
717-
69-c
c-7
-3-2-10123
01
23
4
10Lo
g A
pplie
d fie
ld in
z
mT
0.0E
+00
5.0E
-02
1.0E
-01
1.5E
-01
2.0E
-01
2.5E
-01
01
23
410
Log
App
lied
field
in
Gradient
mT
717-
66-3
-90
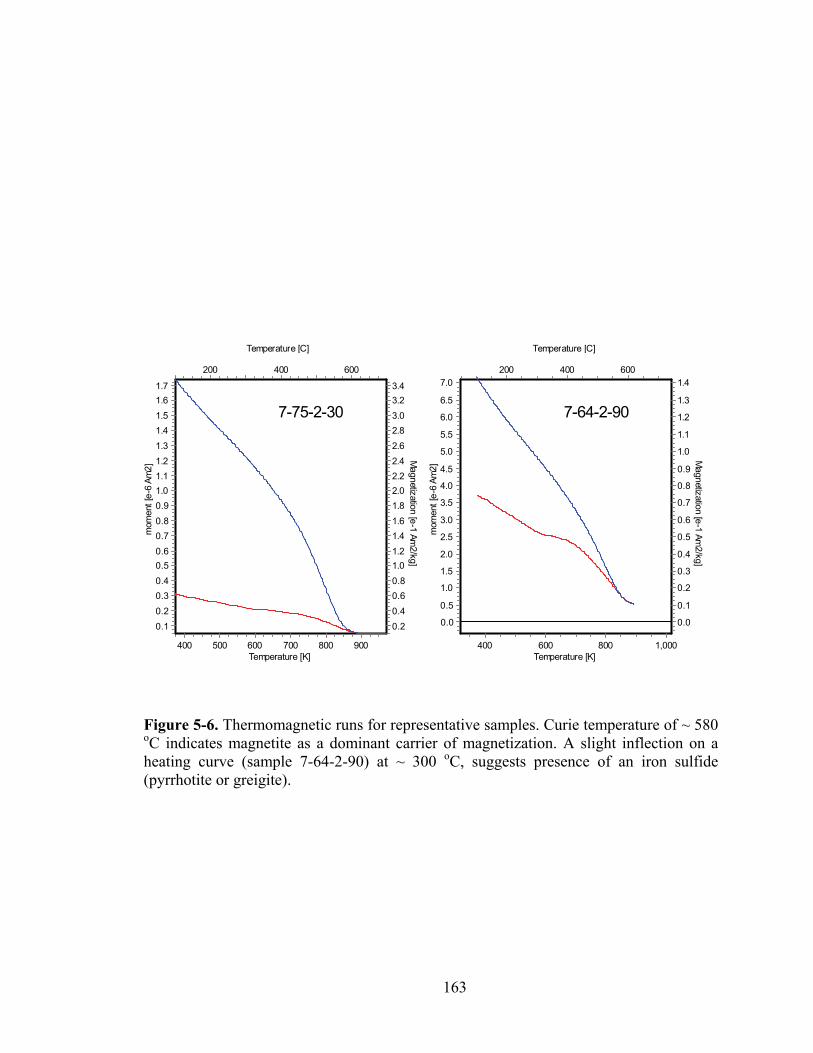
163
Temperature [K]900800700600500400
600400200
mom
ent [
e-6
Am2]
1.71.61.51.41.31.21.11.00.90.80.70.60.50.40.30.20.1
Magnetization [e-1
Am2/kg]
3.43.23.02.82.62.42.22.01.81.61.41.21.00.80.60.40.2
Temperature [K]1,000800600400
600400200
mom
ent [
e-6
Am2]
7.0
6.5
6.0
5.5
5.0
4.5
4.0
3.5
3.0
2.5
2.0
1.5
1.0
0.5
0.0
Magnetization
[e-1Am
2/kg]
1.4
1.3
1.2
1.1
1.0
0.9
0.8
0.7
0.6
0.5
0.4
0.3
0.2
0.1
0.0
Temperature [C] Temperature [C]
7-75-2-30 7-64-2-90
Figure 5-6. Thermomagnetic runs for representative samples. Curie temperature of ~ 580 oC indicates magnetite as a dominant carrier of magnetization. A slight inflection on a heating curve (sample 7-64-2-90) at ~ 300 oC, suggests presence of an iron sulfide (pyrrhotite or greigite).
164
Figure 5-7. The stepwise thermomagnetic runs on the sample 7-54-7-0. Non-reversible behavior during heating-cooling at temperatures up to 400oC indicates the ongoing destruction of a magnetic (likely iron sulfide) phase. Non-reversible 600oC and 700oC runs with the cooling branch being higher than the heating branch suggest that a new magnetic phase (with a Curie temperature of ~ 580oC, plausibly magnetite) is growing at temperatures higher than 500 oC.
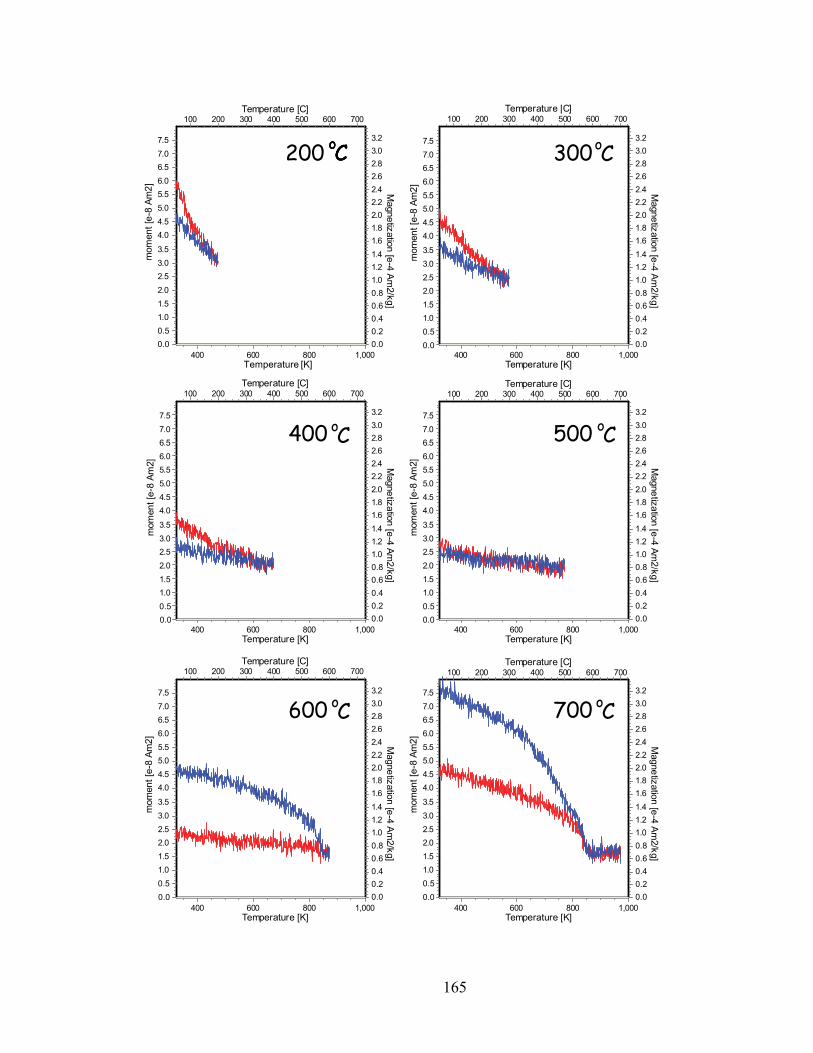
165
mom
ent [
e-8
Am2]
7.57.06.56.05.55.04.54.0
3.53.02.52.01.51.00.5
0.0
Magnetization [e-4
Am2/kg]
3.23.02.82.62.42.22.01.81.61.41.21.00.80.60.40.20.0
Temperature [K]1,000800600400
Temperature [C]700600500400300200100
Temperature [K]1,000800600400
Temperature [C]700600500400300200100
Temperature [K]1,000800600400
Temperature [C]700600500400300200100
Temperature [K]1,000800600400
Temperature [C]700600500400300200100
Temperature [K]1,000800600400
Temperature [C]700600500400300200100
Magnetization [e-4
Am2/kg]
3.23.02.82.62.42.22.01.81.61.41.21.00.80.60.40.20.0
mom
ent [
e-8
Am2]
7.57.06.56.05.55.04.54.0
3.53.02.52.01.51.00.5
0.0
Temperature [K]1,000800600400
Temperature [C]700600500400300200100
mom
ent [
e-8
Am2]
7.57.06.56.05.55.04.54.0
3.53.02.52.01.51.00.5
0.0
mom
ent [
e-8
Am2]
7.57.06.56.05.55.04.54.0
3.53.02.52.01.51.00.5
0.0
mom
ent [
e-8
Am2]
7.57.06.56.05.55.04.54.0
3.53.02.52.01.51.00.5
0.0
mom
ent [
e-8
Am2]
7.57.06.56.05.55.04.54.0
3.53.02.52.01.51.00.5
0.0
Magnetization
[e-4Am
2/kg]
3.23.02.82.62.42.22.01.81.61.41.21.00.80.60.40.20.0
Magnetization
[e-4Am
2/kg]
3.23.02.82.62.42.22.01.81.61.41.21.00.80.60.40.20.0
Magnetization [e-4
Am2/kg]
3.23.02.82.62.42.22.01.81.61.41.21.00.80.60.40.20.0
Magnetization [e-4
Am2/kg]
3.23.02.82.62.42.22.01.81.61.41.21.00.80.60.40.20.0
200 Co 300
400 500
600 700
Co Co
Co CoCo
Co Co
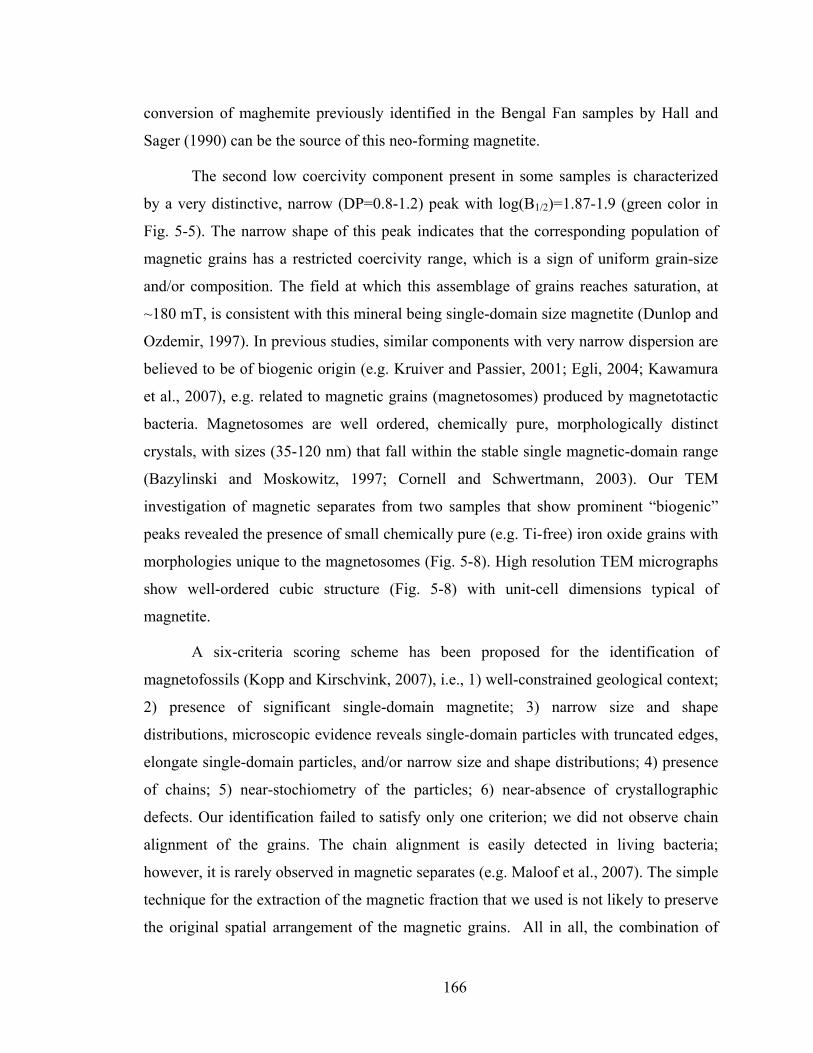
166
conversion of maghemite previously identified in the Bengal Fan samples by Hall and
Sager (1990) can be the source of this neo-forming magnetite.
The second low coercivity component present in some samples is characterized
by a very distinctive, narrow (DP=0.8-1.2) peak with log(B1/2)=1.87-1.9 (green color in
Fig. 5-5). The narrow shape of this peak indicates that the corresponding population of
magnetic grains has a restricted coercivity range, which is a sign of uniform grain-size
and/or composition. The field at which this assemblage of grains reaches saturation, at
~180 mT, is consistent with this mineral being single-domain size magnetite (Dunlop and
Ozdemir, 1997). In previous studies, similar components with very narrow dispersion are
believed to be of biogenic origin (e.g. Kruiver and Passier, 2001; Egli, 2004; Kawamura
et al., 2007), e.g. related to magnetic grains (magnetosomes) produced by magnetotactic
bacteria. Magnetosomes are well ordered, chemically pure, morphologically distinct
crystals, with sizes (35-120 nm) that fall within the stable single magnetic-domain range
(Bazylinski and Moskowitz, 1997; Cornell and Schwertmann, 2003). Our TEM
investigation of magnetic separates from two samples that show prominent “biogenic”
peaks revealed the presence of small chemically pure (e.g. Ti-free) iron oxide grains with
morphologies unique to the magnetosomes (Fig. 5-8). High resolution TEM micrographs
show well-ordered cubic structure (Fig. 5-8) with unit-cell dimensions typical of
magnetite.
A six-criteria scoring scheme has been proposed for the identification of
magnetofossils (Kopp and Kirschvink, 2007), i.e., 1) well-constrained geological context;
2) presence of significant single-domain magnetite; 3) narrow size and shape
distributions, microscopic evidence reveals single-domain particles with truncated edges,
elongate single-domain particles, and/or narrow size and shape distributions; 4) presence
of chains; 5) near-stochiometry of the particles; 6) near-absence of crystallographic
defects. Our identification failed to satisfy only one criterion; we did not observe chain
alignment of the grains. The chain alignment is easily detected in living bacteria;
however, it is rarely observed in magnetic separates (e.g. Maloof et al., 2007). The simple
technique for the extraction of the magnetic fraction that we used is not likely to preserve
the original spatial arrangement of the magnetic grains. All in all, the combination of
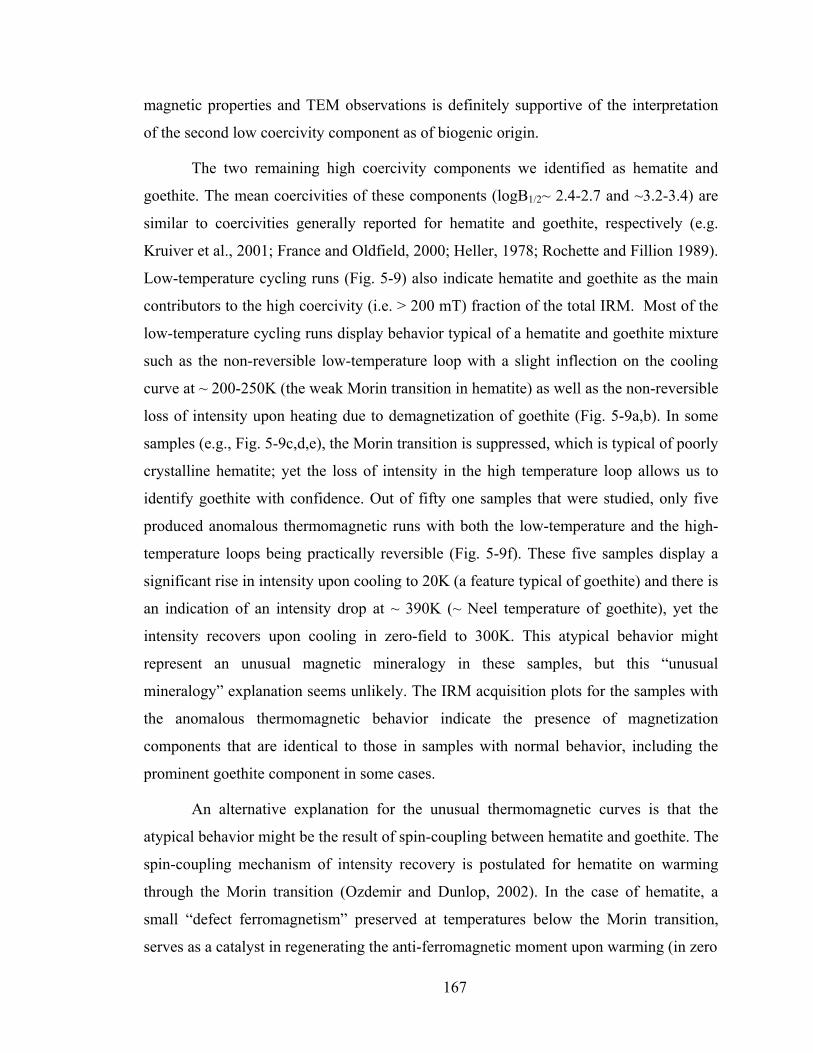
167
magnetic properties and TEM observations is definitely supportive of the interpretation
of the second low coercivity component as of biogenic origin.
The two remaining high coercivity components we identified as hematite and
goethite. The mean coercivities of these components (logB1/2~ 2.4-2.7 and ~3.2-3.4) are
similar to coercivities generally reported for hematite and goethite, respectively (e.g.
Kruiver et al., 2001; France and Oldfield, 2000; Heller, 1978; Rochette and Fillion 1989).
Low-temperature cycling runs (Fig. 5-9) also indicate hematite and goethite as the main
contributors to the high coercivity (i.e. > 200 mT) fraction of the total IRM. Most of the
low-temperature cycling runs display behavior typical of a hematite and goethite mixture
such as the non-reversible low-temperature loop with a slight inflection on the cooling
curve at ~ 200-250K (the weak Morin transition in hematite) as well as the non-reversible
loss of intensity upon heating due to demagnetization of goethite (Fig. 5-9a,b). In some
samples (e.g., Fig. 5-9c,d,e), the Morin transition is suppressed, which is typical of poorly
crystalline hematite; yet the loss of intensity in the high temperature loop allows us to
identify goethite with confidence. Out of fifty one samples that were studied, only five
produced anomalous thermomagnetic runs with both the low-temperature and the high-
temperature loops being practically reversible (Fig. 5-9f). These five samples display a
significant rise in intensity upon cooling to 20K (a feature typical of goethite) and there is
an indication of an intensity drop at ~ 390K (~ Neel temperature of goethite), yet the
intensity recovers upon cooling in zero-field to 300K. This atypical behavior might
represent an unusual magnetic mineralogy in these samples, but this “unusual
mineralogy” explanation seems unlikely. The IRM acquisition plots for the samples with
the anomalous thermomagnetic behavior indicate the presence of magnetization
components that are identical to those in samples with normal behavior, including the
prominent goethite component in some cases.
An alternative explanation for the unusual thermomagnetic curves is that the
atypical behavior might be the result of spin-coupling between hematite and goethite. The
spin-coupling mechanism of intensity recovery is postulated for hematite on warming
through the Morin transition (Ozdemir and Dunlop, 2002). In the case of hematite, a
small “defect ferromagnetism” preserved at temperatures below the Morin transition,
serves as a catalyst in regenerating the anti-ferromagnetic moment upon warming (in zero
168
Fe
FeTi
Cu(TEM grid)Cu
5 nm
Fe
Cu
5 nmFe
FeTi
Cu
(TEM grid)Cu
Fe
FeTi
Cu
Cu (TEM grid)
5 nm 50 nm
50 nm
50 nm
Figure 5-8. TEM micrographs of small grains from magnetic extract of sample 7-68-2-88, which shows a prominent “biogenic magnetite” peak. The size range of the grains (50-120 nm long dimensions), their rectangular prismatic to cubo-octahedral shapes and absence of Ti are typical for magnetosomes. Cu peaks on the energy dispersive X-ray spectra are from the TEM grid.
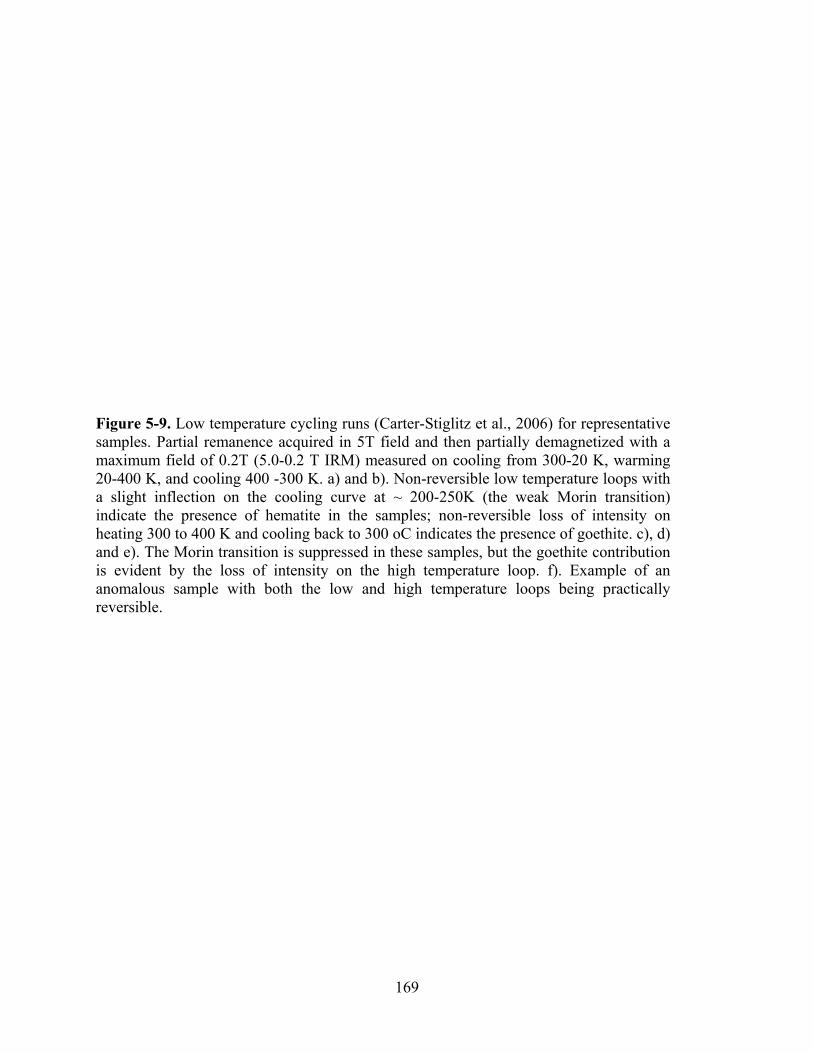
169
Figure 5-9. Low temperature cycling runs (Carter-Stiglitz et al., 2006) for representative samples. Partial remanence acquired in 5T field and then partially demagnetized with a maximum field of 0.2T (5.0-0.2 T IRM) measured on cooling from 300-20 K, warming 20-400 K, and cooling 400 -300 K. a) and b). Non-reversible low temperature loops with a slight inflection on the cooling curve at ~ 200-250K (the weak Morin transition) indicate the presence of hematite in the samples; non-reversible loss of intensity on heating 300 to 400 K and cooling back to 300 oC indicates the presence of goethite. c), d) and e). The Morin transition is suppressed in these samples, but the goethite contribution is evident by the loss of intensity on the high temperature loop. f). Example of an anomalous sample with both the low and high temperature loops being practically reversible.
170
7-60-3-30-01
T [K]400300200100
M [A
m2/
kg]
1.55e-4
1.50e-4
1.45e-4
1.40e-4
1.35e-4
1.30e-4
1.25e-4
1.20e-4
1.15e-4
1.10e-4
1.05e-4
1.00e-4
9.50e-5
9.00e-5
7-80-2-61-01
T [K]400300200100
M [A
m2/
kg]
2.10e-4
2.00e-4
1.90e-4
1.80e-4
1.70e-4
1.60e-4
1.50e-4
1.40e-4
1.30e-4
1.20e-4
1.10e-4
1.00e-4
9.00e-5
7-51-cc-1-01
T [K]400300200100
M [A
m2/
kg]
5.00e-4
4.50e-4
4.00e-4
3.50e-4
3.00e-4
2.50e-4
2.00e-4
1.50e-4
7-64-2-90-01
T [K]400300200100
M [A
m2/
kg]
2.20e-3
2.00e-3
1.80e-3
1.60e-3
1.40e-3
1.20e-3
1.00e-3
8.00e-4
6.00e-4
4.00e-4
7-49-3-90-01
T [K]400300200100
M [A
m2/
kg]
2.00e-3
1.80e-3
1.60e-3
1.40e-3
1.20e-3
1.00e-3
8.00e-4
6.00e-4
4.00e-4
7-54-7-0-01
T [K]400300200100
M [A
m2/
kg]
5.50e-5
5.00e-5
4.50e-5
4.00e-5
3.50e-5
3.00e-5
2.50e-5
2.00e-5
RT remanence on cooling RT remanen ce w arming
a b
c d
e f
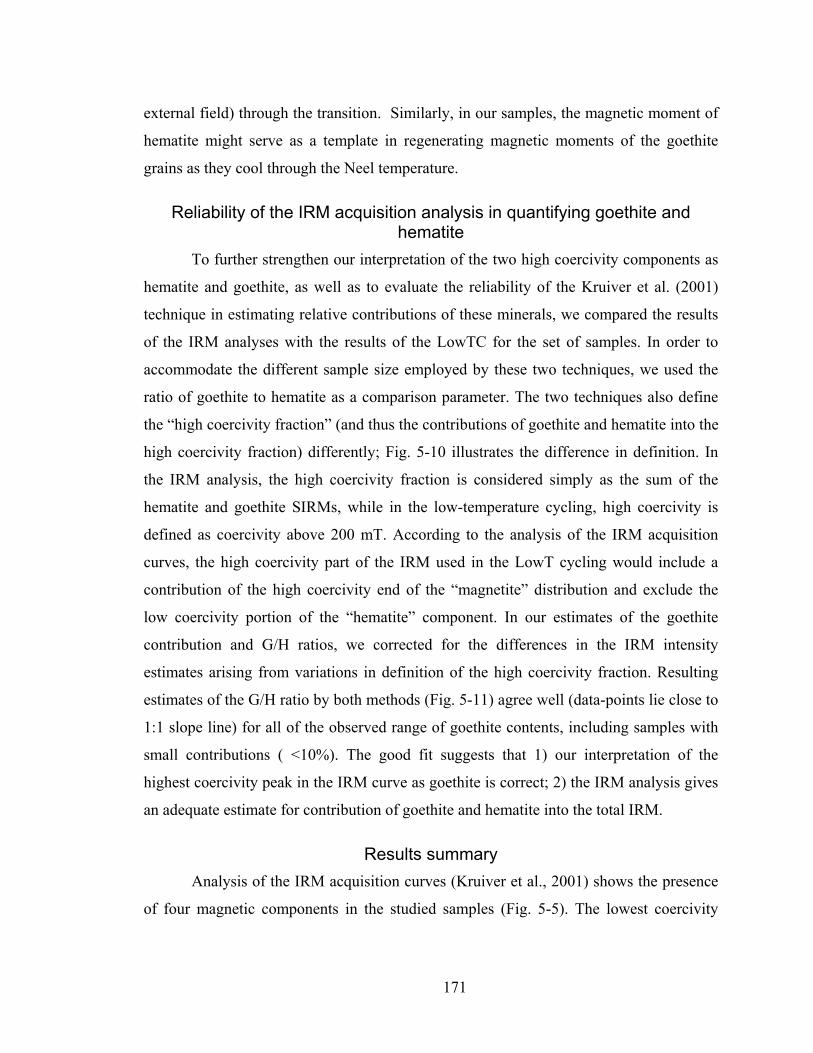
171
external field) through the transition. Similarly, in our samples, the magnetic moment of
hematite might serve as a template in regenerating magnetic moments of the goethite
grains as they cool through the Neel temperature.
Reliability of the IRM acquisition analysis in quantifying goethite and hematite
To further strengthen our interpretation of the two high coercivity components as
hematite and goethite, as well as to evaluate the reliability of the Kruiver et al. (2001)
technique in estimating relative contributions of these minerals, we compared the results
of the IRM analyses with the results of the LowTC for the set of samples. In order to
accommodate the different sample size employed by these two techniques, we used the
ratio of goethite to hematite as a comparison parameter. The two techniques also define
the “high coercivity fraction” (and thus the contributions of goethite and hematite into the
high coercivity fraction) differently; Fig. 5-10 illustrates the difference in definition. In
the IRM analysis, the high coercivity fraction is considered simply as the sum of the
hematite and goethite SIRMs, while in the low-temperature cycling, high coercivity is
defined as coercivity above 200 mT. According to the analysis of the IRM acquisition
curves, the high coercivity part of the IRM used in the LowT cycling would include a
contribution of the high coercivity end of the “magnetite” distribution and exclude the
low coercivity portion of the “hematite” component. In our estimates of the goethite
contribution and G/H ratios, we corrected for the differences in the IRM intensity
estimates arising from variations in definition of the high coercivity fraction. Resulting
estimates of the G/H ratio by both methods (Fig. 5-11) agree well (data-points lie close to
1:1 slope line) for all of the observed range of goethite contents, including samples with
small contributions ( <10%). The good fit suggests that 1) our interpretation of the
highest coercivity peak in the IRM curve as goethite is correct; 2) the IRM analysis gives
an adequate estimate for contribution of goethite and hematite into the total IRM.
Results summary Analysis of the IRM acquisition curves (Kruiver et al., 2001) shows the presence
of four magnetic components in the studied samples (Fig. 5-5). The lowest coercivity
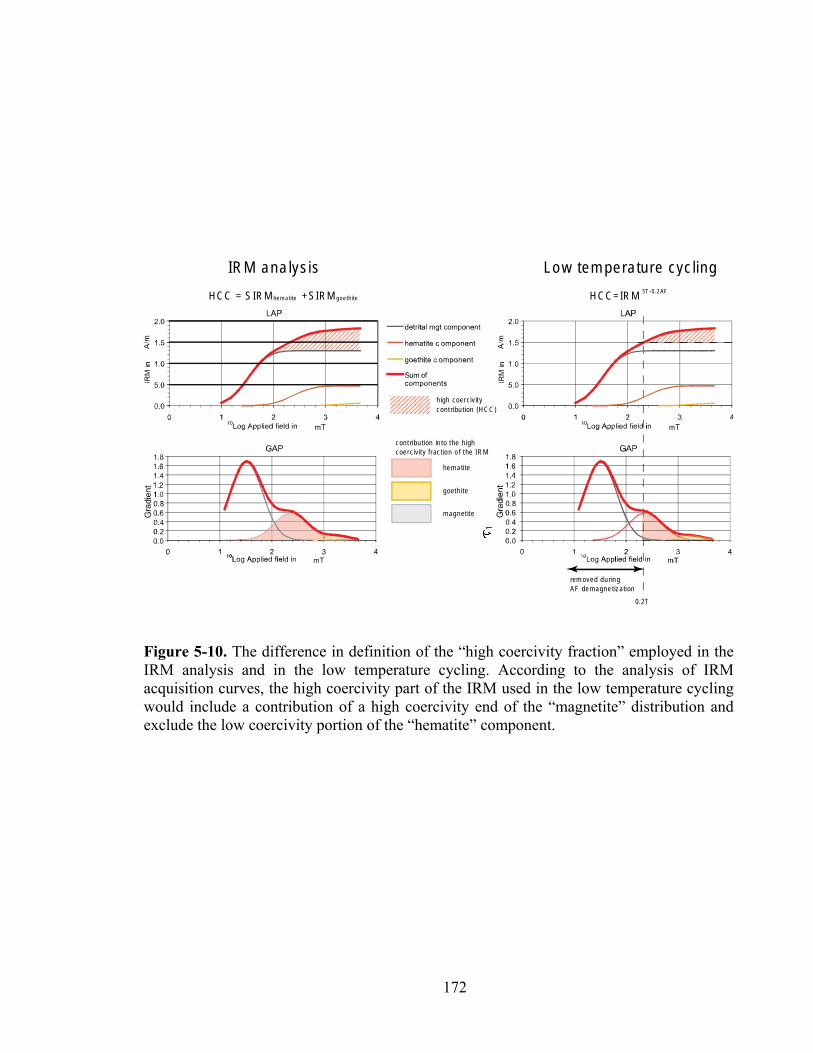
172
high coerc iv it ycont ribu tion (H C C )
cont ribu tion in to the highcoerc iv it y frac t ion o f the IR M
hem atite
goeth ite
m agnet it e
0.2T
rem oved du rin gAF de m agne tization
IRM ana lys is Lo w tem pera tu re cyc lingH CC = S IR M hem a tite + S IRM goeth ite H CC= IR M 5T -0.2 AF
1
Figure 5-10. The difference in definition of the “high coercivity fraction” employed in the IRM analysis and in the low temperature cycling. According to the analysis of IRM acquisition curves, the high coercivity part of the IRM used in the low temperature cycling would include a contribution of a high coercivity end of the “magnetite” distribution and exclude the low coercivity portion of the “hematite” component.
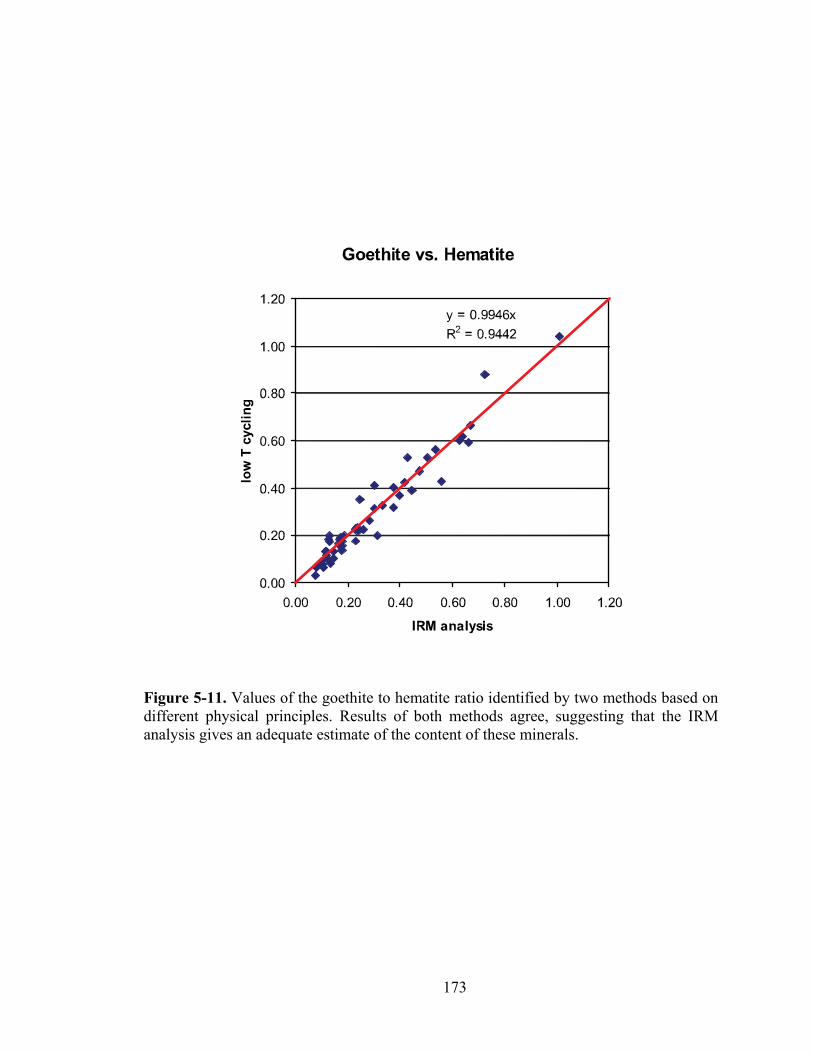
173
Figure 5-11. Values of the goethite to hematite ratio identified by two methods based on different physical principles. Results of both methods agree, suggesting that the IRM analysis gives an adequate estimate of the content of these minerals.
174
component is likely to represent a mixture of several phases, (titano)magnetite, ±
maghemite and iron sulfides. The second low coercivity component with a characteristic
narrow dispersion parameter is likely to be magnetite of biogenic origin. For simplicity
sake, in further discussion, the first low coercivity component will be referred to as
“detrital” as opposed to the “biogenic” second component. The third and fourth
components are identified as hematite and goethite, respectively. The estimates for
hematite and goethite contributions to the total IRM based on the analysis of the IRM
acquisition curves (Kruiver et al., 2001) are consistent with similar estimates obtained
from LowT cycling (Carter-Stiglitz et al., 2006), indicating that the Kruiver et al. (2001)
technique provides adequate assessment of these two mineral contents in the samples.
The variations in the relative abundance of goethite and the presence of the
biogenic component in the studied sections of the Holes 717 and 718 are plotted in Fig.
5-12. The relative abundance of goethite is shown as the G/(G+H) parameter, where the
amount of goethite (G) and hematite (H) was estimated as the SIRM of the component
divided by the saturation magnetization. The value of saturation magnetization of a
magnetic mineral may vary depending on grain-size and stoichiometry (Dunlop and
Ozdemir, 1997); in this study we used the values of ~ 2.5 kA/m for hematite and ~2kA/m
for goethite estimated for pedogenic minerals in an Argentinian paleosol sequence
(Carter-Stiglitz et al., 2006). We should note here, that the choice of different saturation
magnetization values will change the absolute value of the G/(G+H) parameter but will
not affect the overall trend of variations.
The biogenic magnetite content is plotted as the SIRM values (A/m). As the
sample volume and mass in the IRM acquisition experiments were not strictly monitored,
the absolute values of the biogenic contribution to the magnetization of the samples
cannot be given much significance. The presence or absence of this component in a
sample, however, is meaningful, and will be discussed below.
In the studied interval of Hole 717, where better recovery allowed for a more
detailed record, the G/(G+H) ratio displays quasi-periodic variations in the lower part of
the section, up to ~545 mbsf (~7 Ma). In the interval of ~545 to ~470 mbsf (or ~7 to 6.25
Ma) the ratio stays very low on average, then it shows gradual recovery in the upper part
175
of the interval, although the ratio does not reach the median value or the variability of the
pre-7Ma portion. The drop in the G/(G+H) ratio at ~ 7 Ma coincides with the virtual
disappearance of biogenic magnetite from the sediments. In the lower part of the section,
the majority of the samples contain the biogenic component, but in the upper part, the
biogenic component is rare and restricted to narrow horizons.
While data coverage of Hole 718 is limited due to very poor sediment recovery,
the general trends are rather similar to those observed in Hole 717. The G/(G+H)
parameter shows some variation prior to ~ 7 Ma. Although the scale and periodicity of
the variations appears muted compared to the Hole 717, the median value of the
parameter, ~0.25, is similar in both holes. Unfortunately, no sediments were recovered
from the section that corresponds to the low G/(G+H) interval of Hole 717 (Fig. 5-12);
yet, the decrease in the G/(G+H) ratio at ~ 7 Ma, and its gradual recovery after 6.2 Ma
resemble the Hole 717 trend. Distribution of the biogenic component is also similar in
two holes; while ubiquitous prior to ~ 7 Ma, biogenic magnetite becomes much rarer
afterwards.
Discussion
Climatic signal vs. diagenetic changes A straightforward interpretation, considering the variations in the G/(G+H)
parameter in the studied sections as a proxy for the strength of the Indian monsoon,
would suggest that between ~10 and 7 Ma, monsoonal precipitation varied quasi-
periodically, with no net increase or decrease in the average intensity. The drop in
goethite abundance at ~ 7 Ma, would imply the onset of an arid period in the Himalayan
Foreland that lasted for ~ 700,000 yr; then the monsoon began gradual recovery.
However, the drastic change in biogenic magnetite content of the sediments, which
coincides with the decline in G/(G+H) ratio, hints at another possibility. The observed
variations in the relative abundances of goethite and hematite could be in part related to
post-depositional diagenetic processes.
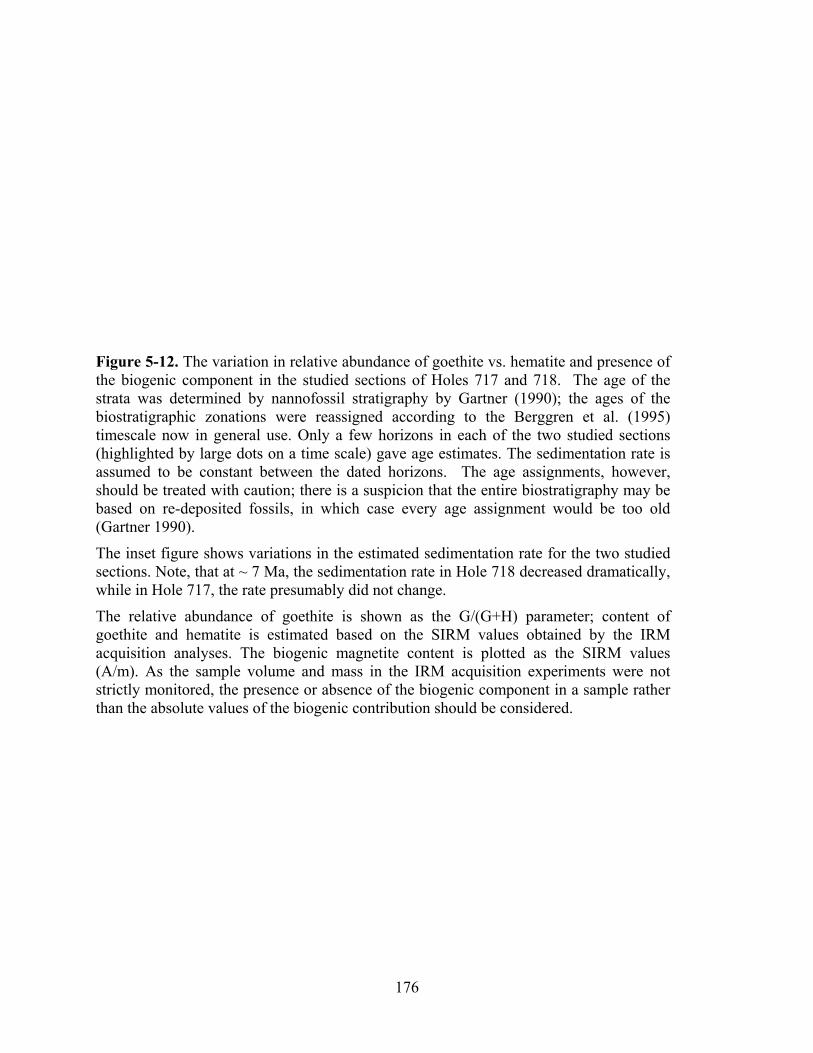
176
Figure 5-12. The variation in relative abundance of goethite vs. hematite and presence of the biogenic component in the studied sections of Holes 717 and 718. The age of the strata was determined by nannofossil stratigraphy by Gartner (1990); the ages of the biostratigraphic zonations were reassigned according to the Berggren et al. (1995) timescale now in general use. Only a few horizons in each of the two studied sections (highlighted by large dots on a time scale) gave age estimates. The sedimentation rate is assumed to be constant between the dated horizons. The age assignments, however, should be treated with caution; there is a suspicion that the entire biostratigraphy may be based on re-deposited fossils, in which case every age assignment would be too old (Gartner 1990).
The inset figure shows variations in the estimated sedimentation rate for the two studied sections. Note, that at ~ 7 Ma, the sedimentation rate in Hole 718 decreased dramatically, while in Hole 717, the rate presumably did not change.
The relative abundance of goethite is shown as the G/(G+H) parameter; content of goethite and hematite is estimated based on the SIRM values obtained by the IRM acquisition analyses. The biogenic magnetite content is plotted as the SIRM values (A/m). As the sample volume and mass in the IRM acquisition experiments were not strictly monitored, the presence or absence of the biogenic component in a sample rather than the absolute values of the biogenic contribution should be considered.
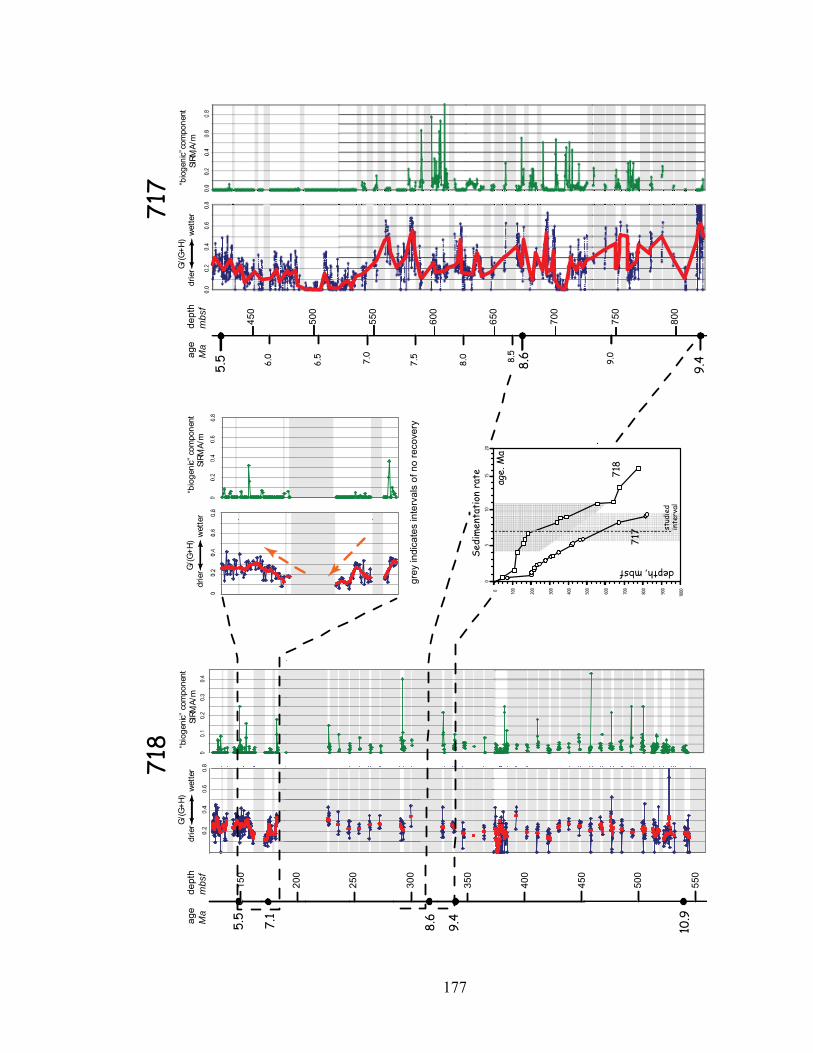
177
G/(G
+H)
drie
rw
ette
r“b
ioge
nic”
com
pone
nt
SIR
M, A
/mG/
(G+H
)dr
ier
wet
ter
“bio
geni
c”co
mpo
nent
S
IRM,
A/m
718
8.6
9.4
5.5
7.1
10.9
200
250
300
350
400
450
500
550
150
Sedi
men
tati
on r
ate
stud
ied
inte
rval
50
1015
20
0 100
200
300
400
500
600
700
800
900
1000
age.
Ma
depth, mbsf
718
717
grey
indi
cate
s in
terv
als
of n
o re
cove
ry
450
500
550
600
650
700
750
800
6.0
6.5 7.0
7.5
8.0 8.5
9.0
9.48.6
5.5
G/(G
+H)
drie
rw
ette
r“b
ioge
nic”
com
pone
nt
SIR
M, A
/m
717
age Ma
dept
hm
bsf
age Ma
dept
hm
bsf
178
Stability of the iron (oxyhydr)oxides in marine environments Burial of unoxidized organic detritus in deep-marine environments promotes
bacterially-mediated processes of suboxic diagenesis (Froelich et al., 1979). To
decompose organic matter, bacteria require an oxidant. Different populations of bacteria
initially use O2 dissolved in pore-water, followed by secondary oxidants obtained by the
reduction of available oxides in the sediments (Curtis, 1983). The sequence of alternative
oxidants is predictable and depends on the energy yield of the oxidation reaction. Nitrate
and phosphate are utilized first, followed by Mn4+-oxides, and then Fe3+-oxides. In
general, the more energetic oxidants are completely exhausted before less energetic ones
are used. If the amount of organic matter in the sediments is high enough, such that
suboxic diagenesis involves Fe-reducing bacteria, then reductive dissolution of detrital
ferromagnetic iron oxides may occur (Bloemendal et al., 1992, Karlin, 1990, Leslie et al.,
1990). The early stage of suboxic diagenesis is usually followed by a late stage of
oxidative diagenesis associated with the progressive descent of the oxidation front, which
is related to diffusion of O2 from the overlying, oxygen-rich waters. Transition metal
cations, including Fe2+ dissociated from detrital oxides during the diagenesis, migrate
interstitially, following an Eh/pH gradient, to positions in the section where oxygen is
available in pore-waters (Colley et al., 1984; Jarvis and Higgs, 1987). There, in the
oxidized zone of the sediment, the biogenic or authigenic precipitation of secondary
oxides and hydroxides (including magnetic Fe-compounds) could occur (e.g. Lowrie and
Heller, 1982, Karlin et al., 1987).
Diagenetic modification of the iron oxide content of marine sediments is well
documented in regions of high organic flux, e.g., continental shelf (e.g. Liu et al., 2004;
Kawamura et al., 2007; Richter et al., 1999) or areas of high-productivity (e.g. Tarduno
and Wilkison, 1996). In slowly accumulating pelagic sediments, the stage of Fe-oxide
reduction is seldom reached (Canfield et al., 1992), except in some specific
environmental contexts; for example, in turbidite-dominated sediments of abyssal plains.
A study of late Cenozoic turbiditic sediments in the North Atlantic (Robinson et al.,
2000), which are similar in lithology and organic carbon content to sediments of the
distal part of the Bengal Fan, showed that reductive/oxidative processes are important
179
only in organic-rich (>0.5% organic carbon content) turbidite horizons. In these horizons,
significant depletion of detrital (titano)magnetite/maghemite occurs during the initial
stage of reductive diagenesis. Reductive dissolution of ferromagnetic grains is a grain-
size selective process, that preferentially depletes finer detrital grains. However, the
presence of ultrafine ferromagnetic grains has been noted by Robinson et al. (2000) at
depths within the suboxic zone of the organic-rich turbidites; these grains were thought to
be associated with populations of live magnetotactic bacteria. The high coercivity detrital
fraction (hematite or goethite) appeared not to have been affected much, if at all, in the
sediments of the organic-rich horizons (Robinson et al., 2000). No secondary, authigenic
precipitation of these minerals has been detected in their studied rocks, either.
In modern sediments, the stage of diagenesis at a certain depth is identified by the
presence of characteristic ions in the pore-waters. Whether the detrital iron oxides in the
sediments have been modified by diagenesis in the paleo-environment has to be deduced
from often imperfect clues, e.g., high organic carbon content in the samples, presence of
pyrite or evidence for dissolution of ferromagnetic grains. A commonly used sign for
alteration is the presence of framboidal pyrite in sediments, which is indicative of sulfate
reduction with the replacement of magnetite (e.g., Berner, 1980; Passier and Dekkers,
2002). Pyrite is non-magnetic and often occurs as disseminated grains that require
microscopic investigations to detect their existence in the studied rocks. For example, in a
spectral reflectance study of ODP site 1143, South China Sea, Zhang et al. (2007) cited
the absence of pyrite as evidence for the lack of post-depositional alteration of the
sediments. The lithostratigraphic description of Site 1143, however, states that
disseminated pyrite as well as pyritized burrows were observed throughout much of the
core (Shipboard Scientific party, 2000).
Availability of organic matter, usually assessed as the total organic carbon (TOC)
content, was found to correlate with the degree of reductive dissolution in a sequence of
late Cenozoic turbiditic sediments in the North Atlantic (Robinson et al., 2000). The
dissolution has been detected only in organic-rich (>0.5% organic carbon content)
turbidite horizons. The TOC of ancient sediments by itself might not be a definitive
indicator for the organic matter initially available for early diagenesis. Bio-available
organic matter is consumed early, and only non-reactive organics, e.g. wood debris, tend
180
to be preserved. For example, in the sediments of ODP site 1143, so-called green layers
have low (<0.5%) TOC while also showing evidence for significant selective dissolution
of the original sedimentary matrix (Tamburini et al., 2003). The matrix dissolution as
well as the presence of disseminated pyrite (Shipboard Scientific party, 2000) implies
reducing conditions, perhaps caused by periods of intensive primary productivity in the
region (Tamburini et al., 2003).
Early diagenetic dissolution of ferromagnetic grains (titano-magnetite and
maghemite) and its grain-size selective character (preferential depletion of finer
ferromagnetic grains) has been documented in multiple studies (e.g., Haese et al., 1998,
Robinson et al., 2000; Kawamura et al., 2007). Thus, the loss of detrital magnetite and an
increase in the mean grain-size can potentially be used to identify sedimentary horizons
affected by diagenetic alteration, but only if the initial content and grain-size distribution
of the detrital fraction is known. In turbidite sequences, the depositional processes and
differential settling of ferromagnetic grains leads to large variations in the detrital
ferromagnetic fraction even within a single turbidite-emplacement layer (Hall and Sager
1990). On the other hand, the preservation of the fine-grained ferromagnetic fraction in
the sediments, for example, biogenic magnetite, can be used as a clue to estimating the
degree of diagenetic alteration.
Environmental significance of biogenic magnetite Biogenic magnetite, fine-grained crystals of magnetite (magnetosomes), is
produced by magnetotactic bacteria. Magnetotactic bacteria are ubiquitous in aqueous
habitats and are generally found in the highest numbers at the oxic-anoxic transition zone
(also referred to as microaerobic zone or redoxcline). The bacteria usually inhabit zones
within the sediment where only trace concentrations of oxygen exist, at a level where
nitrate reduction is the dominant source of secondary oxidant (Rhoads et al. 1991). The
majority of live (swimming) magnetotactic bacteria occupy a well-defined, narrow
subsurface layer at a fixed distance below the oxidation front (Petermann and Bleil,
1993).
Upon the death of a magnetotactic bacterium, the protective organic membrane of
the cell-wall disintegrates, and magnetosomes are released into the sediment. In suboxic
181
conditions that are optimal to the living bacteria, magnetofossils (SD magnetite) are
unstable and may eventually dissolve. Gradual dissolution of biogenic magnetite was
documented in sediments from a subarctic Swedish lake (Snowball, 1994) and in marine
sediments (e.g. Tarduno and Wilkison, 1996; Vali and Kirschvink, 1989; Robinson et al.,
2000). Thus, in a steady-state system of coupled sediment accumulation and reductive
diagenesis, fossil magnetosomes are not likely to be preserved.
In turbidite sequences, such as those of the Bengal Fan, the pulse-like
sedimentation nature promotes diagenesis to occur in two stages. An initial rapid phase of
reductive diagenesis in organic-rich turbidites is followed by a later stage of oxidative
diagenesis, associated with the slow descent of the oxidation front due to diffusion of
oxygen from the overlying bottom waters (Robinson et al. 2000). As the oxidation front
passes down within the turbidite, the zone of bacterial magnetite proliferation migrates
accordingly, leaving fossil magnetosomes behind in the interval between the migrating
colony of living bacteria and the descending oxidation front. Under these conditions,
magnetofossils could be preserved if suboxic conditions are quickly transformed into an
oxic (or post-oxic) state, either by rapid sediment accumulation or by the passage of the
oxidation front (Robinson et al., 2000).
Accordingly, preservation of the magnetosomes in turbidite sequences indicates
that diagenesis did not reach the iron reduction stage since in the iron reduction zone,
fine-grained magnetosomes (having low preservation potential because of a large surface
to volume ratio) would dissolve quickly. The ubiquitous presence of biogenic magnetite
in the lower part of the studied sections of the Bengal Fan sediments demonstrates that
diagenetic processes there are not likely to have reached the iron reduction stage, and,
therefore, are not likely to modify the relative abundances of the derital components.
Disappearance of the biogenic component from the upper part of the studied
sections, on the other hand, suggests that some kind of environmental change had taken
place there. For example, the change in oxidation state of bottom waters could have
modified the bacterial colonies and limited the production of magnetosomes, or
alternatively, the change in diagenetic conditions could have led to dissolution of the
magnetosomes.
182
Evidence for reductive dissolution The content of the TOC, fine-grained (biogenic) and coarser-grained (detrital)
ferromagnetic components, as well as the identified presence of pyrite in the sedimentary
column and the G/(G+H) ratio for the studied section of Hole 717 are plotted side-by-side
in Fig. 5-13. Based on the combination of these parameters, the sediments can be roughly
subdivided into three categories. The first category (lower part of the section, no
highlight) is characterized by the presence of the biogenic component (i.e. fine
ferromagnetic grains), variable contributions of the detrital component and a TOC
content genereally below 0.5%. The ubiquitous biogenic component testifies that the
diagenesis there did not reach the iron reduction stage; thus, relative abundances of iron
oxides of the initial detrital assemblage are not likely to be modified.
The second type (highlighted by green bars) is distinguished by the disappearance
of the biogenic component, as well as extremely low content of the detrital component.
These intervals usually have high (>0.5%) TOC, and multiple occurrences of pyrite. This
combination strongly suggests that these sedimentary horizons have been affected by
diagenesis to a significant degree.
The third type (the upper part of the section, blue higlight) essentially lacks
biogenic component, yet it has a significant content of the detrital fraction. It also
contains high TOC, as well as some pyrite. The absence of the fine-grained (biogenic)
fraction in association with some occurrence of pyrite, indicates that diagenetic
dissolution has affected this horizon, although the degree of alteration was not likely to
have been as severe as in the second type.
The measured G/(G+H) ratio in the sedimentary column seems to correlate
strongly with the dissolution-based type of the sediments, with an increased degree of
alteration accompanied by lowering of the ratio. Whether this decrease in the ratio is an
artifact of a diagenetic modification or a meaningful climatic signal is impossible to
determine at present, as relative stabilities of goethite and hematite with the respect to the
reductive dissolution are poorly known (for a brief overview of the previous studies on
stability of iron oxides see Appendix B).
183
Figure 5-13. Variations in biogenic and detrital magnetite, hematite and goethite components obtained in present study as well as the total organic carbon (TOC) and documented presence of pyrite (purple stars) in the sediments of the studied interval of Hole 717 (Shipboard scientific party, 1989. ODP Leg 116 initial report). Based on a combination of these parameters the sediments can be subdivided into three types. The first type (no highlight) is characterized by the ubiquitous presence of the biogenic (fine-grained) magnetite component and low (<0.5 %) TOC. The second type (pale green highlight) is defined by the extremely low detrital (coarse-grained) content, absence of biogenic (fine-grained) magnetite, high TOC and multiple occurrences of pyrite. The third type (blue highlight) is similar to the second type in the high TOC, presence of pyrite and the absence of biogenic magnetite, yet differs from the second type by a higher content of the detrital (coarse-grained) component. These three categories likely reflect the variable degree of diagenetic alteration at different depth intervals; low in the first type, intermediate in the third, and the severe in the second (see text for explanation). The G/(G+H) parameter exhibits a broad correlation with the diagenetic subdivision of the sediments. The first type (no significant alteration) displays a higher mean value as well as larger amplitude variability in the parameter. In the third type of the sediments (intermediate stage of alteration), both the mean value and variability of the parameter are lower compared to the first type. The second type (severe alteration) corresponds to the lowest values of the G/(G+H) parameter.
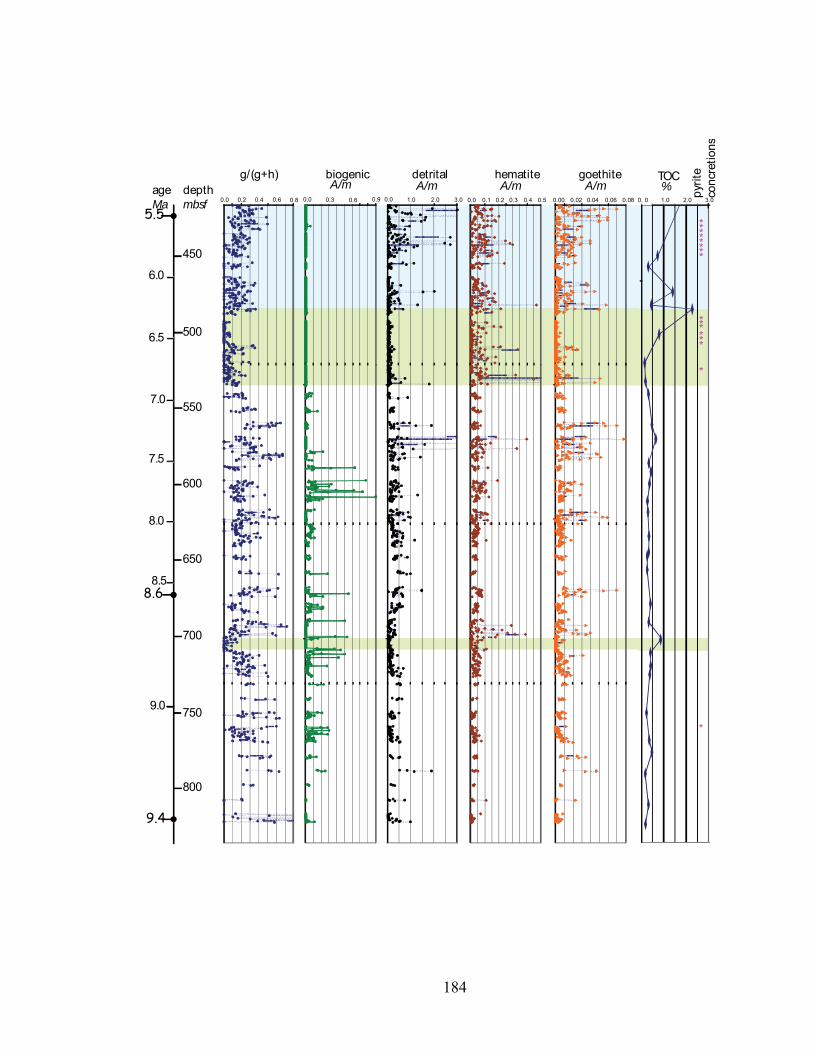
184
g/(g+h) biogenic detrital hematite goethite
450
500
550
600
650
700
750
800
depthmbsf
9.4
8.6
5.5
6.0
6.5
7.0
7.5
8.0
8.5
9.0
ageMa
TOC
0. 0 1.0 2.0 3.00.00 0.02 0.04 0.06 0.080.0 0.1 0.2 0.3 0.4 0.50.0 0.3 0.6 0.9 0.0 1.0 2.0 3.00.0 0.2 0.4 0.6 0.8
******
*
********
*
A/m A/m A/m A/m % pyrit
eco
ncre
tion s
185
Summary and Conclusions Our rock-magnetic study of the ~10.5~4.0 Ma Bengal Fan sedimentary sequence
indicates the presence of four distinct magnetic components, including “detrital” and
“biogenic” magnetite, hematite and goethite. Statistical analysis of the Isothermal
Remanent Magnetization provides an adequate estimate for the content of goethite and
hematite in the samples. Relative abundances of goethite and hematite vary with depth. In
the lower part of the studied interval of Hole 717, up to 545 mbsf or ~ 7 Ma, the G/(G+H)
ratio show quasi-periodic fluctuation, with local maximum at ~ 7.5-7.2 Ma. The biogenic
magnetite component ubiquitously present in this part of the section testifies that iron-
reduction diagenesis has not affected the studied rocks. Thus, the relative abundances of
goethite and hematite reflect weathering conditions in the source area of the sediments.
Accordingly, in the ~ 9.4-7.0 Ma time interval the Indian monsoon shows periodic
variations in its intensity. Although poor sediment recovery, combined with largely
uncertain age dating, does not allow for spectral analysis, a rather low-frequency cycle of
~ 400,000 yr seems to dominate the signal.
In the depth interval of ~ 545-480 mbsf (~7.0-6.3 Ma) the goethite content of the
sediments is very low, above which, the G/(G+H) ratio shows gradual recovery, though it
does not reach the mean value or variability of the pre-7 Ma part of the section. This part
of the section is also characterized by the disappearance of the biogenic magnetite
component and an extremely low detrital magnetite content coinciding with the lowest
values of G/(G+H) ratios. Evidence for dissolution of the ferromagnetic detrital fraction,
the higher organic carbon content and the presence of disseminated pyrite in this part of
the section strongly suggests diagenetic alteration of the sediments, likely as advanced as
the sulfite-reducing stage. This advanced stage of diagenesis is likely to affect the high
coercivity minerals as well; but how exactly the original ratio of goethite and hematite
has been modified cannot be determined, as relative stability of these two minerals with
respect to reductive diagenesis is poorly known. As a result, no reliable climatic
interpretation can be given to the G/(G+H) data from the upper part of the studied
section.
186
The recognition of diagenetic alteration, however, brings out an important
concern. Relative abundances of goethite and hematite in marine sediments have been
increasingly used as a precipitation proxy for the source area of the sediments.
Reflectance spectrometry, the method of choice in these studies, while quick and efficient
in estimating the amount of goethite and hematite in the samples, might overlook the
evidence for the post-depositional diagenetic alteration that can potentially modify the
initial ratio of these minerals. The absence of a down-hole decrease in content of the high
coercivity fraction, often cited as evidence that the G/H ratio has not been diagenetically
modified (Harris and Mix, 1999, 2002, Zhang et al., 2007), is an unreliable criterion. As
our study has shown, there is no simple correlation between the stage of diagenesis and
the depth of the sediments. The diagenetic alteration, rather, is a stratigraphic feature that
developed under the influence of several factors. In our case, the stage of diagenesis
seems to be regulated by the availability of organic matter; variations in sedimentation
rate or oxygen content of bottom waters similarly could result in a layer-parallel
difference in the reductive dissolution.
Reflectance spectroscopy studies should be supplemented with other methods,
such as rock-magnetic techniques, that allow for monitoring of diagenetic alteration.
With rock magnetic methods, alteration in the ancient sediments can be detected, and its
severity can be evaluated based on the presence and grain-size variation of the
ferrimagnetic fraction (magnetite/maghemite), which is more sensitive to early reductive
dissolution than the high coercivity minerals, goethite and hematite. There is also a need
for further studies of dissolution behavior of various iron oxides. Better understanding of
how fast and in what way reductive dissolution modifies the initial ratios of various iron
oxide phases would improve our ability to detect and correct for the diagenetic changes,
and consequently, to extract a reliable climatic signal in studies of marine sediments.
Acknowledgements This study was supported by an ODP Schlanger fellowship. This research used
samples and/or data provided by the Ocean Drilling Program (ODP). ODP is sponsored
by U.S. National Science Foundation (NSF) and participating countries under
management of Joint Oceanographic Institutions (JOI), Inc. I gratefully acknowledge
187
David Rea for his help in collecting the samples and for fruitful scientific discussions. I
wish to thank the Institute of Rock Magnetism in Minneapolis for use of its facilities. The
technical assistance of Mike Jackson, Thelma Berguo, and Peat Solheid at the IRM is
greatly appreciated.
References Anderson, D.M., Overpeck, J.T., Gupta, A.K. 2002. Increase in the Asian Southwest
monsoon during the past four centuries. Science, 297, 596-599.
Bazylinski, D.A., Moskowitz, B.M. 1997. Microbial biomineralization of magnetic iron minerals; microbiology, magnetism and environmental significance. Reviews in Mineralogy, 35, 181-223.
Berggren W. A., Kent D. V., Aubry M. P., and Hardenbol J. (eds.) 1995. Geochronology, time scales and global stratigraphic correlation. SEPM Special Publication 54.
Berner, R.A. 1980. Early diagenesis: A theoretical approach. Prinston, New Jersey, Prinston University Press, 241 pp.
Bloemendal, J; King, J.W; Hall, F.R; Doh, S.J. 1992. Rock magnetism of late Neogene and Pleistocene deep-sea sediments; relationship to sediment source, diagenetic processes, and sediment lithology. Journal of Geophysical Research, B, Solid Earth and Planets, 97 (4), 4361-4375.
Bouquillon, A; Chamley, H; Frohlich, F. 1989. Upper Cenozoic clay sedimentation in the northeastern Indian Ocean. Oceanologica Acta, 12, 133-147.
Brass, G.W., Raman, C.V. 1990. Clay mineralogy of sediments from the Bengal Fan. Proceedings of the Ocean Drilling Program, Scientific Results, 116, 34-41.
Burbank D.W., Beck, A.R., Mulder, T. 1996. The Himalayan foreland basin. In: Yin, A., and Harrison, M. (eds) The tectonic evolution of Asia. Cambridge University Press, 149-188.
Burbank, D.W., Derry, L.A., France-Lanord, C. 1993. Reduced Himalayan sediment production 8 Myr ago despite an intensified monsoon. Nature, 364, (6432), 48-50.
Canfield, D. E., Raiswell, R., Bottrell, S.H. 1992. The reactivity of sedimentary iron minerals toward sulfide. American Journal of Science, 292, 659-683.
Carter-Stiglitz, B., Banerjee, S.K., Gourlan, A., Oches, E. 2006. A multi-proxy study of Argentina loess: Marine oxygen isotope stage 4 and 5 environmental record from pedogenic hematite. Palaeogeography, Palaeoclimatology, Palaeoecology, 239, 45-62.
Cerling, T.E. 1994. Global change in the late Miocene; terrestrial effects on the ocean carbon isotopic record. Mineralogical Magazine, 58A, 160.
Cerling, T.E., Wang, Y., Quade, J. 1993. Expansion of C4 ecosystems as an indicator of global ecological change in the late Miocene. Nature, 361(6410), 344-345.
188
Chen M., Wang R., Yang L., Han J., Lu J. 2003. Development of East Asian summer monsoon environments in the late Miocene; radiolarian evidence from Site 1143 of ODP Leg 184. Marine Geology, 201(1-3), 169-177.
Clift, P.D. 2006. Controls on the erosion of Cenozoic Asia and the flux of clastic sediment to the ocean. Earth and Planetary Science Letters, 241, 571-580.
Cochran, J.R., Stow, D.A.V., Auroux, C., Amano, K., Balson, P.S., Boulegue, J.J., Brass, G.W., Corrigan, J., Gartner, S., Hall, S., Iaccarino, S.M., Ishizuka, T., Kaczmarska, I., Kassens, H., Leger, G., Proto Decima, F., Raman, C.V., Sager, W.W., Takahashi, K., Thompson, T.L., Tiercelin, J-Ja., Townsend, M.R., Wetzel, A., Wijayananda, N.P., Williams, C. 1989. Proceedings of the Ocean Drilling Program, distal Bengal Fan, covering Leg 116 of the cruises of the drilling vessel JOIDES Resolution, Colombo, Sri Lanka, to Colombo, Sir Lanka, sites 717-719, 2 July 1987-19 August 1987. Proceedings of the Ocean Drilling Program, Part A: Initial Reports, 116, 388 pp.
Colley, S., Thomson, J., Wilson, T.R.S., Higgs, N.C. 1984. Post-depositional migration of elements during diagenesis in brown clay and turbidite sequences in the North East Atlantic. Geochimica et Cosmochimica Acta, 48 (6), 1223-1235.
Cornell, R. M., Schwertmann, U. 2003. The iron oxides : structure, properties, reactions, occurrences, and uses. Weinheim : Wiley-VCH, 664 pp.
Curi, N., . Franzmeier, D.P. 1984. Toposequence of Oxisols from the Central Plateau of Brazil, Soil Scientists Society America Journal, 48(2), 341–346.
Curtis, C. D. 1983. Microorganisms and diagenesis of sediments. Blackwell Scientific Publisher, Oxford, United Kingdom (GBR), 263-286.
da Motta, P.E.F., Kampf, N. 1992. Iron oxide properties as support to soil morphological features for prediction of moisture regimes in oxisols of central Brazil. Pflanzenernahrung und Bodenkunde 155, 385-90.
Derry, L.A., France-Lanord, C. 1996. Neogene Himalayan weathering history and river (super 87) Sr/ (super 86) Sr; impact on the marine Sr record. Earth and Planetary Science Letters, 142(1-2), 59-74.
Derry, L.A., France-Lanord, C. 1997. Himalayan weathering and erosion fluxes; climate and tectonic controls. In Ruddiman, W.F.(ed) Tectonic uplift and climate change. Press, New York, NY, United States (USA), 289-312.
Dettman, D.L., Kohn, M.J., Quade, J., Ryerson, F.J., Ojha, T.P., Hamidullah, S. 2001. Seasonal stable isotope evidence for a strong Asian monsoon throughout the past 10.7 m.y. Geology, 29(1), 31-34.
Dickens, G.R., Owen, R.M. 1999. The latest Miocene-early Pliocene biogenic bloom; a revised Indian Ocean perspective. Marine Geology, 161(1), 75-91.
Ding, Z.L., Yang, S.L., Sun, J.M., Liu, T.S. 2001. Iron geochemistry of loess and red clay deposits in the Chinese Loess Plateau and implications for long-term Asian monsoon evolution in the last 7.0 Ma. Earth and Planetary Science Letters, 185(1-2), 99-109.
189
Dunlop, D.J., Ozdemir, O. 1997. Rock magnetism; fundamentals and frontiers. Cambridge Studies in Magnetism, vol.3, 573 pp.
de Grave, E., Barrero, C.A., da Costa, G.M., Vandenberghe, R. E., van San, E. 2002. Moessbauer spectra of alpha - and gamma -polymorphs of FeOOH and Fe2O3; effects of poor crystallinity and of Al-for-Fe substitution. Clay Minerals, 37, 591-606.
Egli, R. 2004. Characterization of individual rock magnetic components by analysis of remanence curves. 3. Bacterial magnetite and natural processes in lakes. Physics and Chemistry of the Earth, 29, 869-884.
Emmel, F.J., Curray, J.R. 1984. The Bengal submarine fan, northeastern Indian Ocean, Geo-Marine Letters 3, 119–124.
Etheredge, D., Gutzler, D.S., Pazzaglia, F.J. 2004. Geomorphic response to seasonal variations in rainfall in the Southwest United States. Geological Society of America Bulletin, 116, 606-618.
Evans, M.E., Heller, F. 2003. Environmental magnetism; principles and applications of enviromagnetics. Academic Press, San Diego, CA, (USA). 299 pp.
France, D.E., Oldfield, F. 2000. Identifying goethite and hematite from rock magnetic measurements of soils and sediments. Journal of Geophysical Research, B, Solid Earth and Planets, 105(2), 2781-2796.
France-Lanord, C., Derry, L., Michard, A. 1993. Evolution of the Himalaya since Miocene time; isotopic and sedimentological evidence from the Bengal Fan. Geological Society of London Special Publications, 74, 603-621.
France-Lanord, C., Derry, L.A. 1994. delta (super 13) of organic carbon in the Bengal Fan; source evolution and transport of C3 and C4 plant carbon to marine sediments. Geochimica et Cosmochimica Acta, 58(21), 4809-4814.
France-Lanord, C., Spiess, V., Molnar, P., Curray, J.P. 2000. Summary on the Bengal Fan, An introduction to a drilling proposal, March 2000. available at http://www.whoi.edu/pclift/BengalSummary.pdf
Froelich, P N; Klinkhammer, G P; Bender, M L; Luedtke, N; Heath, G R; Cullen, D; Dauphin, P; Hammond, D; Hartman, B; Maynard, V, 1979. Early oxidation of organic matter in pelagic sediments of the eastern equatorial Atlantic; suboxic diagenesis. Geochimica et Cosmochimica Acta, 43 (7)1075-1090.
Gartner, S. 1990. Neogene calcareous nannofossil biostratigraphy, Leg 116 (central Indian Ocean). Proceedings of the Ocean Drilling Program, Scientific Results, 116, 165-187.
Giosan, L., Flood, R.D., Aller, R.C. 2002. Paleoceanographic significance of sediment color on western North Atlantic drifts; I, Origin of color. Marine Geology, 189, 25-41.
Grujic, D., Coutand, I., Bookhagen, B., Bonnet, S., Blythe, A., Duncan, C. 2006. Climatic forcing of erosion, landscape, and tectonics in the Bhutan Himalayas. Geology, 34, 801-804.
190
Guo, Z.T., Ruddiman, W.F., Hao, Q.Z., Wu, H.B., Qiao, Y. S., Zhu, R.X., Peng, S.Z., Wei, J.J., Yuan, B.Y., Liu, T.S. 2002. Onset of Asian desertification by 22 Myr ago inferred from loess deposits in China. Nature, 416(6877), 159-163.
Gupta, A.K., Singh, R.K., Joseph, S., Thomas, E. 2004. Indian Ocean high-productivity event (10-8 Ma); linked to global cooling or to the initiation of the Indian monsoons? Geology, 32(9), 753-756.
Haese, R.R., Petermann, H., Dittert, L., Schulz, H.D. 1998. The early diagenesis of iron in pelagic sediments; a multidisciplinary approach. Earth and Planetary Science Letters, 157(3-4),233-248.
Hall, S. A., Sager, W. W. 1990. Paleomagnetic and rock magnetic properties of sediment samples from Ocean Drilling Program Leg 116, central Indian Ocean. Proceedings of the Ocean Drilling Program, Scientific Results, vol.116, 337-344.
Harris, S.E., Mix, A.C. 1999. Pleistocene precipitation balance in the Amazon Basin recorded in deep sea sediments. Quaternary Research, 51, 14-26.
Harris, S.E., Mix, A.C. 2002. Climate and tectonic influences on continental erosion of tropical South America, 0-13 Ma. Geology, 30(5), 447-450.
Harrison, T.M., Copeland, P., Hall, S.A., Quade, J., Burner, S., Ojha, T. P. Kidd, W.S.F. 1993. Isotopic preservation of Himalayan/Tibetan uplift, denudation, and climatic histories of two molasse deposits. Journal of Geology, 101(2), 157-175.
Hastenrath, S., 1991, Climate dynamics of the tropics: Dordrecht, Kluwer Academic Publishers 488 p.
Hay, W.W., Soeding, E., DeConto, R.M., Wold, C.N. 2002. The late Cenozoic uplift; climate change paradox. International Journal of Earth Sciences, 91(5), 746-774.
Heller, F. 1978. The magnetic properties of Upper Jurassic limestones from southern Germany. Eos, Transactions, American Geophysical Union, 59 (12), 1035.
Hereford, R. and Webb, R. H. 2001. Climate variation since 1900 affects geomorphic processes and raises issues for land management. In: Reynolds, R.E. (ed.) The changing face of the east Mojave Desert. California State University, Desert Studies Consortium, p. 54-55.
Hermoyian, C.S., Owen, R.M. 2001. Late Miocene-early Pliocene biogenic bloom; evidence from low-productivity regions of the Indian and Atlantic Oceans. Paleoceanography, 16(1), 95-100.
Jarvis, I., Higgs, N. 1987. Trace-element mobility during early diagenesis in distal turbidites; late Quaternary of the Madeira Abyssal Plain, N Atlantic. Geological Society of London Special Publications, 31, 179-214.
Johnson, G D. 1977. Paleopedology of Ramapithecus-bearing sediments, North India. Geologische Rundschau, 66(1), 192-216.
Kampf, N., and Schwertmann, U. 1983. Goethite and hematite in a climosequence in southern Brazil and their application in classification of kaolinitic soils. Geoderma, 29, 27-39.

191
Karlin, R. 1990. Magnetic mineral diagenesis in suboxic sediments at Bettis Site W-N, NE Pacific Ocean. Journal of Geophysical Research, B, Solid Earth and Planets, 95 (4), 4421-4436.
Karlin, R., Lyle, M., Heath, G.R. 1987. Authigenic magnetite formation in suboxic marine sediments. Nature, 326(6112), 490-493.
Kawamura, N.,; Oda, H.,; Ikehara, K., Yamazaki, T., Shioi, K., Taga, S., Hatakeyama, S., Torii, M. 2007. Diagenetic effect on magnetic properties of marine core sediments from the southern Okhotsk Sea. Earth, Planets and Space, 59, 83-93.
Kopp, R. E., Kirschvink, J.L. 2007. A scoring scheme for evaluating magnetofossil identifications. AGU Fall 2007, abstract GP43B-1218.
Kraus, M.J. 1999. Paleosols in clastic sedimentary rocks; their geologic applications. Earth-Science Reviews, 47(1-2), 41-70.
Kroon, D., Steens, T.N.F., Troelstra, S.R. 1991. Onset of monsoonal related upwelling in the western Arabian Sea as revealed by planktonic foraminifers. Proceedings of the Ocean Drilling Program, Scientific Results, 117, 257-263.
Kruiver, P. P., Dekkers, M. J., Heslop, D. 2001. Quantification of magnetic coercivity components by the analysis of acquisition curves of isothermal remanent magnetisation. Earth and Planetary Science Letters, 189(3-4), 269-276.
Kruiver, P.P., Passier, H.F. 2001. Coercivity analysis of magnetic phases in sapropel S1 related to variations in redox conditions, including an investigation of the S ratio. Geochemistry, Geophysics, Geosystems - G3, 2, paper number 2001GC000181.
Leslie, B. W., Hammond, D.E., Berelson, W.M., Lund, S.P. 1990. Diagenesis in anoxic sediments from the California continental borderland and its influence on iron, sulfur, and magnetite behavior. Journal of Geophysical Research, B, Solid Earth and Planets, 95 (4), 4453-4470.
Liu J., Zhu R., Roberts, A.P., Li S., Chang, J.-H. 2004. High-resolution analysis of early diagenetic effects on magnetic minerals in post-middle-Holocene continental shelf sediments from the Korea Strait. Journal of Geophysical Research, B, 109, 15.
Lowrie, W., Heller, F. 1982. Magnetic properties of marine limestones. Reviews of Geophysics and Space Physics, 20(2), 171-192.
Maloof, A.C, Kopp, R.E., Grotzinger, J.P., Fike, D.A., Bosak, T., Vali, H., Poussart, P.M., Weiss, B.P., Kirschvink, J.L. 2007. Sedimentary iron cycling and the origin and preservation of magnetization in platform carbonate muds, Andros Island, Bahamas. Earth and Planetary Science Letters, 259, 581-598.
Molnar, P., England, P., Martinod, J. 1993. Mantle dynamics, uplift of the Tibetan Plateau, and the Indian monsoon. Reviews of Geophysics, 31(4), 357-396.
Ozdemir, O., Dunlop, D.J. 2002. Thermoremanence and stable memory of single-domain hematites. Geophysical Research Letters, 29 (18), 4.
192
Passier, H.F., Dekkers, M.J. 2002. Iron oxide formation in the active oxidation front above sapropel S1 in the eastern Mediterranean Sea as derived from low-temperature magnetism. Geophysical Journal International, 150(1), 230-240.
Petermann, H., Bleil, U. 1993. Detection of live magnetotactic bacteria in South Atlantic deep-sea sediments. Earth and Planetary Science Letters, 117(1-2), 223-228.
Prell, W.L., Murray, D.W., Clemens, S.C., and Anderson, D.M. 1992. Evolution and variability of the Indian Ocean summer monsoon: Evidence from the western Arabian Sea drilling program, In Duncan, R.A., Rea, D.K., Kidd, R.B., von Rad, U., and Weissel, J.K. (eds.), Synthesis of Results from Scientific Drilling in the Indian Ocean, American Geophysical Union Geophysical Monograph 70, Washington, D.C., 447-469.
Quade, J., Cerling, T.E. 1995. Expansion of C (sub 4) grasses in the late Miocene of northern Pakistan: evidence from stable isotopes in Paleosols. Palaeogeography, Palaeoclimatology, Palaeoecology, 115(1-4), 91-116.
Quade, J., Cerling, T.E., Bowman, J.R. 1989. Development of Asian monsoon revealed by marked ecological shift during the latest Miocene in northern Pakistan. Nature, 342(6246), 163-166.
Quade, J., Roe, L., DeCelles, P.G., Ojha, T.P. 1997. The late Neogene 87Sr/ 86Sr record of lowland Himalayan rivers. Science, 276(5320), 1828-1831.
Ramstein, G., Fluteau, F., Besse, J., Joussaume, S. 1997. Effect of orogeny, plate motion and land-sea distribution on Eurasian climate change over the past 30 million years. Nature, 386(6627), 788-795.
Rea, D.K. 1992. Delivery of Himalayan sediment to the northern Indian Ocean and its relation to global climate, sea level, uplift, and seawater strontium. In: Duncan, R.A., D.K. Rea, R.B. Kidd, U. von Rad, and J.K. Weissel (eds.), Synthesis of Results from Scientific Drilling in the Indian Ocean, American Geophysical Union Geophysical Monograph 70, Washington, D.C., 387-402.
Retallack, G.J. 1995. Palaeosols of the Siwalik Group as a 15 Myr record of South Asian palaeoclimate. Memoir - Geological Society of India, 32, 36-51.
Rhoads, B.L. 1991. Impact of agricultural development on regional drainage in the lower Santa Cruz Valley, Arizona, U.S.A. Environmental Geology and Water Sciences, 18, 119-135.
Richter, C., Hayashida, A.,; Guyodo, Y.,; Valet, J.-P.,; Verosub, K.L. 1999. Magnetic intensity loss and core diagenesis in long-core samples from the East Cortez Basin and the San Nicholas Basin (California Borderland). Earth, Planets and Space, 51(5), 329-336.
Richter, F.M., Rowley, D.B., Depaolo, D.J. 1992. Sr isotope evolution of seawater - The role of tectonics. Earth and Planetary Science Letters, 109, 11-23.
Robinson, S.G., Sahota, J.T.S., Oldfield, F. 2000. Early diagenesis in North Atlantic abyssal plain sediments characterized by rock-magnetic and geochemical indices. Marine Geology, 163 (1-4), 77-107.
193
Rochette, P; Fillion, G, 1989. Field and temperature behavior of remanence in synthetic goethite; paleomagnetic implications. Geophysical Research Letters, 16 (8), 851-854.
Roden, E.E., Zachara, J.M. 1996. Microbial reduction of crystalline Fe(lll) oxides: role of oxide surface area and potential for cell growth. Environmental Science and Technology, 30, 1618-1628.
Roe, G.H., Montgomery, D.R., Hallet, B. 2002. Effects of orographic precipitation variations on the concavity of steady-state river profiles. Geology, 30, 143-146.
Sangode, S.J., Bloemendal, J. 2004. Pedogenic transformation of magnetic minerals in Pliocene-Pleistocene Palaeosols of the Siwalik Group, NW Himalaya, India. Palaeogeography, Palaeoclimatology, Palaeoecology, 212(1-2), 95-118.
Santana, D.P. 1984. Soil formation in a toposequence of oxisols from Patos de Minas region, Minas Gerais, State, Brasil. Ph. D. Thesis. Purdue University, West Lafayette, 129 pp.
Sharma, B D; Mukhopadhyay, S S; Sidhu, P S. 1998. Microtopographic controls on soil formation in the Punjab region, India. Geoderma, 81(3-4), 357-368.
Shipboard Scientific Party. 1989. Initial reports, sites 717-718-719 Distal Bengal Fan. Proceedings of the Ocean Drilling Program, Initial Reports, 116.
Shipboard Scientific Party. 2000. Initial reports, volume 184, South China Sea. Proceedings of the Ocean Drilling Program, Initial Reports, 184.
Snowball, I.F. Bacterial magnetite and the magnetic properties of sediments in a Swedish lake. Earth and Planetary Science Letters, 126(1-3), 129-142.
Spicer, R.A., Harris, N.B.W., Widdowson, M., Herman, A.B., Guo S., Valdes, P.J., Wolfe, J.A., Kelley, S.P. 2003. Constant elevation of southern Tibet over the past 15 million years. Nature, 421(6923), 622-624.
Stern, L.A., Chamberlain, C.P., Reynolds, R.C., Johnson, G.D. 1997. Oxygen isotope evidence of climate change from pedogenic clay minerals in the Himalayan molasse. Geochimica et Cosmochimica Acta, 61(4), 731-744.
Stow, D.A.V., Amano, K., Balson, P.S., Brass, G.W., Corrigan, J.D., Raman, C.V., Tiercelin, J-J., Townsend, M., Wijayananda, N P. 1990. Sediment facies and processes on the distal Bengal Fan, Leg 116. Proceedings of the Ocean Drilling Program, Scientific Results, 116, 377-396.
Tamburini, F., Adatte, T., Föllmi, K.B. 2003. Origin and Nature of Green Clay Layers, ODP Leg 184, South China Sea . Proceedings of the Ocean Drilling Program, Scientific Results, vol.184. doi:10.2973/odp.proc.sr.184.206.2003
Tarduno, J.A., Wilkison, S.L. 1996. Non-steady state magnetic mineral reduction, chemical lock-in, and delayed remanence acquisition in pelagic sediments. Earth and Planetary Science Letters, 144(3-4), 315-326.
Tardy, Y., Roquin, C. 1992. Geochemistry and evolution of lateritic landscapes. In: Martini, I P; Chesworth, W (eds). Developments in Earth Surface Processes,
194
vol.2. Elsevier, Amsterdam-Oxford-New York-Tokyo, Netherlands (NLD); pp. 407-443.
Vali, H., Kirschvink, J.L. 1989. Magnetofossil dissolution in a palaeomagnetically unstable deep-sea sediment. Nature, 339(6221), 203-206.
Wang, P. 1990. Neogene stratigraphy and paleoenvironments of China. Palaeogeography, Palaeoclimatology, Palaeoecology, 77, 315-334.
Yapp, C. 2001. Rusty relics of Earth history; iron (III) oxides, isotopes, and surficial environments. Annual Review of Earth and Planetary Sciences, 29, 165-199.
Zhang., Y.G., Ji, J., Balsam, W., Liu, L., Chen, J. 2007. High resolution hematite and goethite records from ODP 1143, South China Sea: Co-evolution of monsoonal precipitation and El-Nino over the past 600,000 years. Earth and Planetary Science Letters, 264, 136-150.
195
Chapter 6
Conclusions
Kazakhstan orocline Two subduction-related volcanic belts in Central Kazakhstan (Fig. 1-1a) represent
remains of an Andean type volcanic arc (e.g., Zonenshain et al., 1990; Bakhtiev, 1987,
Kurchavov, 1994), with a Devonian outer belt and a late Paleozoic inner belt. In their
present configuration, the belts are strongly curved. The overall shape of the structure can
be described as having three limbs; a northeastern limb (Chingiz Range), a middle limb
and a southwestern limb (North Tien Shan), with the NE and SW arms being roughly
parallel. Such a strongly curved shape is an unusual feature for a plate boundary; hence,
the oroclinal bending of an originally straighter arc has been proposed as a mechanism
for the formation of the structure (e.g., Zonenshain et al., 1990; Sengor and Natal’in,
1996). To prove the oroclinal nature of the curvature, the following questions had to be
addressed:
What was the initial configuration of the belts?
When did the bending occur?
How was the bending accommodated?
What caused the bending?
A paleomagnetic study, results of which are described in the Chapters 2, 3 and 4
of this thesis, provided the following answers to these questions.
1) Our investigation of a middle Devonian volcanic formation from the SW arm
of the orocline (Chapter 2) revealed two meaningful components of magnetization, one
being primary (of middle Devonian age) and the other being secondary (late Paleozoic in
196
age). The declination of the secondary magnetization is deflected counterclockwise by ~
100o relative to the reference direction. The deflection of this overprint is likely related to
the Late Permian-Triassic episode of strike-slip faulting in the area that occurred after the
oroclinal orogeny had ended (Van der Voo et al., 2006). Using the deflection of the
overprint, we corrected for these post-Permian rotations and restored the declination of
the primary Devonian magnetization to its initial orientation. Applying a similar
correction to other published and newly obtained (Chapter 3) results from the different
arms of the curved structure, we compiled a set of primary declinations. The corrected
Devonian declinations vary systematically from southerly in the northern limb to
northerly in the southern limb, closely following the change in the overall strike of the
structure. Using the corrected declinations as passive markers (when the studied rocks
formed, declination pointed to the north), we restored the volcanic belt to its Devonian
configuration. Our analysis showed that in the Devonian, the volcanic margin was
nearly straight and northwest-southeast trending.
2) Our paleomagnetic study of late Paleozoic volcanic sequences (Chapter 4)
from the middle and NE limbs of the curved structure produced a set of three
magnetizations; one of latest Carboniferous-Early Permian age, one of middle Permian
age and one of Late Permian or Early Triassic in age in each of the studied localities. In
the middle arm of the structure, all three magnetizations are statistically indistinguishable
from the coeval reference directions (obtained by extrapolation from Baltica), indicating
that oroclinal rotation of the middle arm was completed by the latest Carboniferous-
Early Permian. In the NE arm, the three magnetization directions form a trend that
indicates progressive clockwise rotation of the study area with respect to Baltica,
spanning from the latest Carboniferous to the Late Permian. Approximately 30o of
clockwise rotation has been accommodated during this time and by the Late Permian, the
study area had reached its present day position relative to Baltica. Although limited data
coverage does not allow us to assert whether the rotation of the study area within the NE
arm reflects the latest stages of the oroclinal bending or is related to strike-slip associated
block-rotations, the protracted rotations in this area indicate that the deformation in the
NE arm of the curved structure continued up to the Late Permian.
197
Thus, the oroclinal orogeny in Kazakhstan can be constrained to the interval
between the middle Devonian (the nearly straight belt) and the Late Permian (oroclinal
rotations are over in all parts of the structure).
3) Combining information on the initial configuration of the belt (Chapters 2 and
3) with the data on position of the orocline arms at the end of the orogeny (Chapter 4), we
obtained the following estimates for the amount of rotation experienced by each of the
three arms during the oroclinal orogeny.
The NE arm rotated ~ 120o clockwise
The middle arm rotated ~ 60o clockwise
The SW arm rotated ~ 25o counterclockwise
4) The varying magnitude of the relative oroclinal rotations along the Devonian
volcanic arc provides clues as to the mechanism of bending. A plausible scenario
involves dextral shear stress and drag applied to the northern end of the Kazakhstania
structure, while its southern end was pinned down by a back-stop consisting of Tarim.
5) The most likely candidate for imposing a shear stress on the northern end of
Kazakhstania is the Siberian craton. Paleogeographic reconstructions for the Late
Devonian (Kravchinsky et al., 2002) indicate that Siberia's paleo-southern (present
western) margin was located at ~20-30oN, while similar Devonian paleolatitudes have
been determined for the northern tip of Kazakhstania (Chapters 2 and 3). Available
paleomagnetic data (Kravchinsky et al., 2002, Pavlov et al., 2007) also indicate that
Siberia underwent a significant clockwise rotation in the Permo-Carboniferous time
interval. It is plausible that the Carboniferous movements of Siberia also had a dextral
shear component with respect to Kazakhstania and Baltica, although this sense of motion
cannot be estimated from paleomagnetic data alone because latitude-parallel
displacements cannot be uncovered. Given the means (significant lateral displacement of
Siberia between the Late Devonian and Permian) and the opportunity (proximity of
198
Kazakhstania and Siberia), it is likely that Siberia's movements imposed dextral shear
stresses on Kazakhstania's then-northern margin.
6) Bending of a large-scale structure such as the Kazakhstan orocline requires
removal of ~ 1200 km of crustal material from between the converging arms. The crust
(of the Junggar-Balkhash Ocean) must have been consumed in two concurrent subduction
zones (see Figure 4-10). An estimate for the average subduction velocity for this model
gives a geologically reasonable value of ~6mm/yr. Thus, the Kazakhstan orocline is an
example of thick-skinned tectonics, where the entire crust, and perhaps even the
lithospheric mantle, was involved in deformation.
The main findings of our study of the Kazakhstan orocline are briefly summarized
in the following scenario, which is also depicted in Fig. 4-10. In the middle Devonian, a
nearly straight, northwest-southeast trending volcanic arc delineated the northeastern
margin of Kazakhstania landmass. In the Late Devonian, an initial collision with Tarim
pinned Kazakhstania’s southern corner, while a dextral shear motion and a considerable
clockwise rotation of Siberia dragged its northern end. Relative convergence between
Siberia and Tarim caused initial buckling of the Kazakhstania microcontinent trapped
between them, subdividing the volcanic arc into three (SW, middle, and NE) segments.
Continued subduction under the established limbs of the orocline, with an estimated
outward-directed subduction velocity of ~6mm/yr, gradually led to closure of the
intervening Junggar-Balkhash Ocean and tightening of the orocline. By the Late Permian,
the Junggar-Balkhash Ocean no longer existed and the Kazakhstan orocline had obtained
its present-day strongly curved shape.
Rock magnetic study of the Bengal Fan sediments Relative abundance of two pedogenic iron oxides (goethite and hematite) is
controlled by moisture availability during soil formation (e.g., Cornell and Schwertmann,
2003). Consequently, the ratio between the two has been used as a proxy for precipitation
199
in soil-forming (terrestrial) environments. A similar interpretation of the mineral ratio has
been increasingly applied in studies of marine sediments, in which the variation in the
relative abundances of goethite and hematite is thought to reflect the variation in
precipitation regime at the source area of the sediments. The applicability of this
parameter to the studies of marine sediments is contingent on the unconfirmed
assumption that the ratio of these minerals is not modified by diagenetic processes.
A method of choice for the identification of goethite and hematite in the previous
studies was reflectance spectrometry. While this method is quick and efficient in
identifying these minerals, it is not sensitive to other iron oxides usually present in rocks.
Our rock-magnetic study of the ~10.5~4.0 Ma interval of the Bengal Fan sedimentary
sequence (Chapter 5) indicates that a statistical analysis of the Isothermal Remanent
Magnetization (Kruiver et al., 2001) and low-temperature cycling (Carter-Stiglitz et al.,
2006), also provide adequate estimates for the content of goethite and hematite in the
samples. In addition to goethite and hematite, the IRM analysis also indicates the
presence of distinctive “detrital” and biogenic components in the studied samples.
We observed in our samples that relative abundances of goethite and hematite
vary with age. At ~ 7 Ma, the sediments show a significant change in magnetic
parameters. The goethite content decreases at this time, and the biogenic component,
ubiquitous in the lower part of the sequence, practically disappears. This change is
approximately coeval with climatic turnover in the source area of the studied sediments,
as postulated by multiple studies (e.g., Gupta et al., 2004; Stern et al. 1997; Prell et al.,
1992; Quade et al., 1989; Ding et al., 2001). However, the variations in the content of
other magnetic components, both “detrital” and biogenic, as well as an increase in a total
organic carbon content of the samples and the appearance of pyrite concretions at the
same stratigraphic level, suggest that this change in magnetic content reflects a change
in the degree of diagenetic alteration of the initial detrital assemblage rather than a
climatic signal.
Our rock magnetic study also demonstrates that diagenetic alteration does not
show a simple correlation with depth, but rather is a stratigraphic feature, the
development of which can be controlled by several factors. While the stage of diagenesis
200
seems to be regulated by the availability of organic matter in the Bengal Fan sediments,
variations in sedimentation rate or oxygen content of bottom waters similarly could result
in a layer-parallel difference in the reductive dissolution. Thus, the absence of a
systematic down-hole decrease in the content of the high coercivity fraction should not
be taken as evidence for absence of diagenetic modification.
In assigning climatic interpretation to changes in the relative abundance of
goethite and hematite in marine sediments, the possibility of diagenetic modification
should be evaluated. Reflectance spectroscopy studies should be supplemented with other
methods, such as rock-magnetic techniques, that allow for monitoring of diagenetic
alteration. With rock magnetic methods, alteration in ancient sediments can be detected
and the severity of alteration can be evaluated based on the presence and grain-size
variation of the ferrimagnetic fraction (magnetite/maghemite), which is more sensitive
to early reductive dissolution than high coercivity minerals (goethite and hematite).
There is also a need for further studies of dissolution behavior of various iron oxides.
Better understanding of the rate and the manner in which reductive dissolution modifies
the initial ratios of various iron oxide phases would improve our ability to detect and
correct for diagenetic changes, and consequently, to extract a reliable climatic signal in
studies of marine sediments.
References Bakhtiev, M.K. 1987. Paleozoic orogenic magmatic belts. Nauka, Moscow 168 p. (In
Russian).
Carter-Stiglitz, B., Banerjee, S.K., Gourlan, A., Oches, E. 2006. A multi-proxy study of Argentina loess: Marine oxygen isotope stage 4 and 5 environmental record from pedogenic hematite. Palaeogeography, Palaeoclimatology, Palaeoecology, 239, 45-62.
Cornell, R. M., Schwertmann, U. 2003. The iron oxides : structure, properties, reactions, occurrences, and uses. Weinheim : Wiley-VCH, 664 pp.
Ding, Z.L., Yang, S.L., Sun, J.M., Liu, T.S. 2001. Iron geochemistry of loess and red clay deposits in the Chinese Loess Plateau and implications for long-term Asian monsoon evolution in the last 7.0 Ma. Earth and Planetary Science Letters, 185(1-2), 99-109.
201
Gupta, A.K., Singh, R.K., Joseph, S., Thomas, E. 2004. Indian Ocean high-productivity event (10-8 Ma); linked to global cooling or to the initiation of the Indian monsoons? Geology, 32(9), 753-756.
Kravchinsky, V.A., Konstantinov, K.M., Courtillot, V., Savrasov, J.I., Valet, J.-P., Cherniy, S.D., Mishenin, S.G., and Parasotka, B.S. 2002. Palaeomagnetism of East Siberian traps and kimberlites: two new poles and palaeogeographic reconstructions at about 360 and 250Ma: Geophysical Journal International, 148, p. 1-33.
Kruiver, P.P., Dekkers, M..J., Heslop, D. 2001. Quantification of magnetic coercivity components by the analysis of acquisition curves of isothermal remanent magnetisation. Earth and Planetary Science Letters, 189(3-4), 269-276.
Kurchavov, A.M. 1994. The lateral variability and evolution of orogenic volcanism in the fold belts. Geotectonics, 28, 3-18.
Pavlov, V.E., Courtillot, V., Bazhenov, M.L., Veselovsky, R.V. 2007. Paleomagnetism of the Siberian traps: new data and a new overall 250 Ma pole for Siberia: Tectonophysics, 443, 72–92.
Prell, W.L., Murray, D.W., Clemens, S.C., Anderson, D.M. 1992. Evolution and variability of the Indian Ocean summer monsoon: Evidence from the western Arabian Sea drilling program, In Duncan, R.A., Rea, D.K., Kidd, R.B., von Rad, U., and Weissel, J.K. (eds.), Synthesis of Results from Scientific Drilling in the Indian Ocean, American Geophysical Union Geophysical Monograph 70, Washington, D.C., 447-469.
Quade, J., Cerling, T.E., Bowman, J.R. 1989. Development of Asian monsoon revealed by marked ecological shift during the latest Miocene in northern Pakistan. Nature, 342(6246), 163-166.
Şengör, A.M.C., Natal’in, B.A., 1996. Paleotectonics of Asia: fragments of a synthesis. In: Yin, A., Harrison, M. (Eds.), The Tectonic Evolution of Asia. Cambridge Univ. Press, Cambridge, pp. 486– 640.
Stern, L.A., Chamberlain, C.P., Reynolds, R.C., Johnson, G.D. 1997. Oxygen isotope evidence of climate change from pedogenic clay minerals in the Himalayan molasse. Geochimica et Cosmochimica Acta, 61(4), 731-744.
Van der Voo, R., Levashova, N. M., Skrinnik, L. I., Kara, T. V., Bazhenov, M. L. 2006. Late orogenic, large-scale rotations in the Tien Shan and adjacent mobile belts in Kyrgyzstan and Kazakhstan, Tectonophysics, 426, 335-360.
Zonenshain, L.P., Kuzmin, M.I., Natapov, L.M., 1990. Geology of the USSR: a plate tectonic synthesis. Ed. Page, B.M. AGU, Geodynamic series, volume 21. Washington, D.C., 250p.

202
Appendices
203
Appendix A
Ar-Ar dating of the Tokrau-A rocks
Ar-Ar analytical method We attempted to date the Tokrau-A ignimbrites, sampled for paleomagnetism,
because of their interesting magnetic polarity characteristics, where Normal (N) polarity
is observed presumably within the long Reversed (R) Kiaman superchron. For dating we
selected three cooling units containing this normal-polarity magnetization. Samples were
crushed using a jaw crusher. For each of the three cooling units, plagioclase grains and
samples of ground mass were carefully hand picked from the separates to avoid grains
containing any visible glass or mineral inclusions. Seven individual plagioclase grains,
plus two groundmass samples, were dated for each of the three units, twenty seven
samples in total, by the 40Ar/39Ar laser ablation method at the University of Michigan.
Neutron-fluence monitor MMhb-1 was used with an assumed K-Ar age of 520.4
Ma (Samson and Alexander, 1987) as a calibration standard. Irradiation was done at the
McMaster Nuclear Reactor in Hamilton, Ontario. For groundmass separates, a total mass
of ~2 mg from each sample was step-heated at increasing levels of laser power until
complete fusion was achieved, using a defocused beam from a Coherent Innova 5 W
continuous argon-ion laser. For plagioclase separates, a step-heating was performed on
individual grains. Fusion-system blanks were run after every five steps of analysis and
subtracted from all gas fractions. The data were corrected for interference reactions due
to Ca, K, and Cl, and for 37Ar and 39Ar decay. A summary of analytical data is included
in Table A1.
204
Results of Ar-Ar dating All groundmass samples have a characteristic 40Ar/39Ar release spectrum showing
an initial peak followed by an asymptotic decay to a plateau with the total gas ages of the
sample being equal to the plateau ages (Fig. A1-a). This type of spectra is typical of many
age spectra from clay samples (e.g. Hall et al., 2000), suggesting that the Ar-Ar ages of
the groundmass (232-242 Ma) likely reflect the age of alteration.
Single crystals of plagioclase show a wide range in their apparent Ar-Ar ages,
spanning from ~360 to ~250 Ma with a weak clustering of dates between 305 to 295 Ma
(Fig. 4-9). Single-crystal ages that are older, sometimes significantly older, than the
eruption age are often reported from explosively emplaced volcanic rocks (e.g. Smith et
al., 2003; Spell et al., 2001; Miller et al., 1998; Ganeski et al., 1996; Fleck et al., 1994).
These older ages are obtained from xenocrystic grains that were incorporated in the
magma during the eruption, and have not been completely reset. Calculations of 40Ar
diffusion rate in plagioclase at ~900ºC magma temperature (typical for rhyolitic magmas)
have shown that complete degassing of larger grains takes at least several months
(Ganeski et al., 1996). The extent to which contaminating grains might have degassed in
magma prior to the eruption is impossible to determine from their total-fusion ages, and it
is notoriously difficult to distinguish xenocrysts from true phenocrysts while hand
picking and even chemically (see the references given above). It is very likely that the
older plagioclase ages in our samples represent xenocrystic contamination; large lithic
clasts with plagioclase grains are visible in hand samples (Fig. A2-a), and a rapid cooling
indicated by the glassy groundmass can account for incomplete resetting of the Ar
system.
Relatively younger ages, in the ~290 to 250 Ma interval, likely reflect partial
alteration of plagioclase phenocrysts. Although hand-picked grains appeared to be fairly
fresh, alteration of plagioclase to clay minerals is evident petrographically (Fig A2-b-d).
To estimate the most likely eruption age we calculated 39Ar/40Ar versus 36Ar/40Ar
isochron ages for the three best samples with uniform high Ca/K ratios that produced well
defined plateaus on the Ar release spectra (samples 493-15a, e and g, Fig. A1-c,d). In
calculating a regression line, we omitted points lying above the line by more than 3 sigma
205
as these points likely indicate alteration-related Ar loss. We also plot up the goodness of
fit (as the mean square weighted deviation -MSWD) on a contour plot (Fig. A1-f).
Although there is always some non-uniqueness to a solution, the best fits are achieved for
the range from t=~295 and initial 40Ar/36Ar ratio =~575 to t=~297.5, 40Ar/36Ar=~540.
Thus, we accepted this range, 297.5 to 295 Ma, as the most likely eruption age.
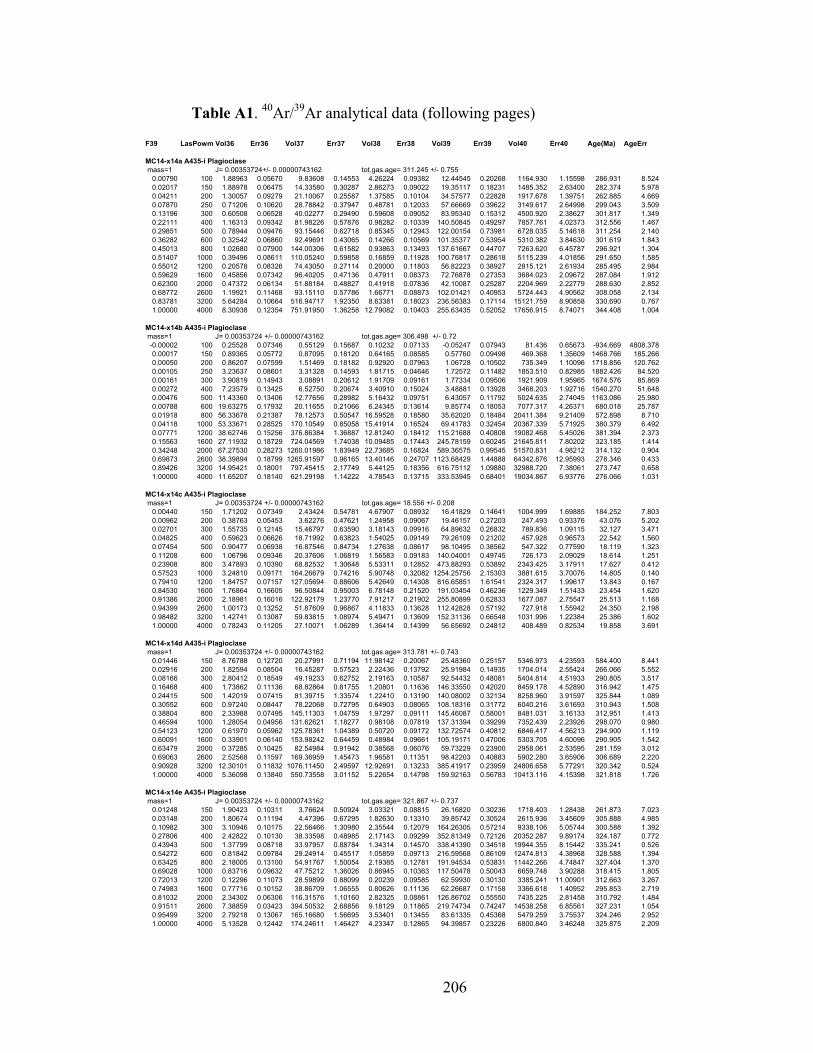
206
Table A1. 40Ar/39Ar analytical data (following pages)
F39 LasPowmWVol36 Err36 Vol37 Err37 Vol38 Err38 Vol39 Err39 Vol40 Err40 Age(Ma) AgeErr
MC14-x14a A435-i Plagioclase
0.00790 100 1.88963 0.05670 9.83608 0.14553 4.26224 0.09382 12.44545 0.20268 1164.930 1.15598 286.931 8.5240.02017 150 1.88978 0.06475 14.33580 0.30287 2.86273 0.09022 19.35117 0.18231 1485.352 2.63400 282.374 5.9780.04211 200 1.30057 0.09279 21.10067 0.25587 1.37585 0.10104 34.57577 0.22828 1917.678 1.39751 262.885 4.6690.07870 250 0.71206 0.10620 28.78842 0.37947 0.48781 0.12033 57.66669 0.39622 3149.617 2.64998 299.043 3.5090.13196 300 0.60508 0.06528 40.02277 0.29490 0.59608 0.09052 83.95340 0.15312 4500.920 2.38627 301.817 1.3490.22111 400 1.16313 0.09342 81.98226 0.57876 0.98282 0.10339 140.50845 0.49297 7857.761 4.02373 312.556 1.4670.29851 500 0.78944 0.09476 93.15446 0.62718 0.85345 0.12943 122.00154 0.73981 6728.035 5.14618 311.254 2.1400.36282 600 0.32542 0.06860 92.49691 0.43065 0.14266 0.10569 101.35377 0.53954 5310.382 3.84630 301.619 1.8430.45013 800 1.02680 0.07900 144.00306 0.61582 0.93863 0.13493 137.61667 0.44707 7263.620 6.45787 296.921 1.3040.51407 1000 0.39496 0.08611 110.05240 0.59858 0.16859 0.11928 100.76817 0.28618 5115.239 4.01856 291.650 1.5850.55012 1200 0.20578 0.08326 74.43050 0.27114 0.20000 0.11803 56.82223 0.38927 2815.121 2.61934 285.495 2.9840.59629 1600 0.45856 0.07342 96.40205 0.47136 0.47911 0.08373 72.76878 0.27353 3684.023 2.09672 287.084 1.9120.62300 2000 0.47372 0.06134 51.88184 0.48827 0.41918 0.07836 42.10087 0.25287 2204.969 2.22779 288.630 2.8520.68772 2600 1.19921 0.11468 93.15110 0.57786 1.66771 0.08873 102.01421 0.40953 5724.443 4.90562 308.058 2.1340.83781 3200 5.64284 0.10664 516.94717 1.92350 8.63381 0.18023 236.56383 0.17114 15121.759 8.90858 330.690 0.7671.00000 4000 8.30938 0.12354 751.91950 1.36258 12.79082 0.10403 255.63435 0.52052 17656.915 8.74071 344.408 1.004
MC14-x14b A435-i Plagioclase
-0.00002 100 0.25528 0.07346 0.55129 0.15687 0.10232 0.07133 -0.05247 0.07943 81.436 0.65673 -934.669 4808.3780.00017 150 0.89365 0.05772 0.87095 0.18120 0.64165 0.08585 0.57760 0.09498 469.368 1.35609 1468.766 185.2660.00050 200 0.86207 0.07599 1.51469 0.18182 0.92920 0.07963 1.06728 0.10502 735.349 1.10096 1718.856 120.7620.00105 250 3.23637 0.08601 3.31328 0.14593 1.81715 0.04646 1.72572 0.11482 1853.510 0.82985 1882.426 84.5200.00161 300 3.90819 0.14943 3.08891 0.20612 1.91709 0.09161 1.77334 0.09506 1921.909 1.95965 1674.576 85.8690.00272 400 7.23579 0.13425 6.52750 0.20674 3.40910 0.15024 3.48881 0.13928 3468.203 1.92716 1540.270 51.6480.00476 500 11.43360 0.13406 12.77656 0.28982 5.16432 0.09751 6.43057 0.11792 5024.635 2.74045 1163.086 25.9800.00788 600 19.63275 0.17932 20.11655 0.21066 6.24345 0.13614 9.85774 0.18053 7077.317 4.26371 680.018 25.7870.01918 800 56.33678 0.21387 78.12573 0.50547 16.59528 0.18580 35.62020 0.18484 20411.384 9.21409 572.898 8.7100.04118 1000 53.33671 0.28525 170.10549 0.85058 15.41914 0.16524 69.41783 0.32454 20367.339 5.71925 380.379 6.4920.07771 1200 38.62746 0.15256 376.86384 1.36887 12.81240 0.18412 115.21688 0.40808 19082.468 5.45026 381.394 2.3730.15563 1600 27.11932 0.18729 724.04569 1.74038 10.09485 0.17443 245.78159 0.60245 21645.811 7.80202 323.185 1.4140.34248 2000 67.27530 0.28273 1260.01986 1.83949 22.73685 0.16824 589.36575 0.99545 51570.831 4.98212 314.132 0.9040.69873 2600 38.39894 0.18799 1265.91597 0.96165 13.40146 0.24707 1123.68429 1.44888 64342.876 12.95993 278.346 0.4330.89426 3200 14.95421 0.18001 797.45415 2.17749 5.44125 0.18356 616.75112 1.09880 32988.720 7.38061 273.747 0.6581.00000 4000 11.65207 0.18140 621.29198 1.14222 4.78543 0.13715 333.53945 0.68401 19034.867 6.93776 276.066 1.031
MC14-x14c A435-i Plagioclase
0.00440 150 1.71202 0.07349 2.43424 0.54781 4.67907 0.08932 16.41829 0.14641 1004.999 1.69885 184.252 7.8030.00962 200 0.38763 0.05453 3.62276 0.47621 1.24958 0.09067 19.46157 0.27203 247.493 0.93376 43.076 5.2020.02701 300 1.55735 0.12145 15.46797 0.63590 3.18143 0.09916 64.89632 0.26832 789.836 1.09115 32.127 3.4710.04825 400 0.59623 0.06626 18.71992 0.63823 1.54025 0.09149 79.26109 0.21202 457.928 0.96573 22.542 1.5600.07454 500 0.90477 0.06938 16.87546 0.84734 1.27638 0.08617 98.10495 0.38562 547.322 0.77590 18.119 1.3230.11208 600 1.06796 0.09346 20.37606 1.06819 1.56583 0.09183 140.04001 0.49745 726.173 2.09029 18.614 1.2510.23908 800 3.47893 0.10390 68.82532 1.30648 5.53311 0.12852 473.88293 0.53892 2343.425 3.17911 17.627 0.4120.57523 1000 3.24810 0.09171 164.26679 0.74216 5.90748 0.32082 1254.25756 2.15303 3881.615 3.70076 14.805 0.1400.79410 1200 1.84757 0.07157 127.05694 0.88606 5.42649 0.14308 816.65851 1.61541 2324.317 1.99617 13.843 0.1670.84530 1600 1.76864 0.16605 96.50844 0.95003 6.78148 0.21520 191.03454 0.46236 1229.349 1.51433 23.454 1.6200.91386 2000 2.18981 0.16016 122.92179 1.23770 7.91217 0.21902 255.80899 0.62833 1677.087 2.75547 25.513 1.1680.94399 2600 1.00173 0.13252 51.87609 0.96867 4.11833 0.13628 112.42828 0.57192 727.918 1.55942 24.350 2.1980.98482 3200 1.42741 0.13087 59.83815 1.08974 5.49471 0.13609 152.31136 0.66548 1031.996 1.22384 25.386 1.6021.00000 4000 0.78243 0.11205 27.10071 1.06289 1.36414 0.14399 56.65692 0.24812 408.489 0.82534 19.858 3.691
MC14-x14d A435-i Plagioclase mass=1
0.01446 150 8.76788 0.12720 20.27991 0.71194 11.98142 0.20067 25.48360 0.25157 5346.973 4.23593 584.400 8.4410.02916 200 1.82594 0.08504 16.45287 0.57523 2.22436 0.13792 25.91984 0.14935 1704.014 2.55424 266.066 5.5520.08166 300 2.80412 0.18549 49.19233 0.62752 2.19163 0.10587 92.54432 0.48081 5404.814 4.51933 290.805 3.5170.16468 400 1.73862 0.11136 68.82864 0.81755 1.20801 0.11636 146.33550 0.42020 8459.178 4.52890 316.942 1.4750.24415 500 1.42019 0.07415 81.39715 1.33574 1.22410 0.13190 140.08002 0.32134 8258.960 3.91597 325.844 1.0890.30552 600 0.97240 0.08447 78.22068 0.72795 0.64903 0.08065 108.18316 0.31772 6040.216 3.61693 310.943 1.5080.38804 800 2.33988 0.07495 145.11303 1.04759 1.97297 0.09111 145.46087 0.58001 8481.031 3.16133 312.951 1.4130.46594 1000 1.28054 0.04956 131.62621 1.18277 0.98108 0.07819 137.31394 0.39299 7352.439 2.23926 298.070 0.9800.54123 1200 0.61970 0.05962 125.78361 1.04389 0.50720 0.09172 132.72574 0.40812 6846.417 4.56213 294.900 1.1190.60091 1600 0.33901 0.06140 153.98242 0.64459 0.48984 0.09661 105.19171 0.47006 5303.705 4.60096 290.905 1.5420.63479 2000 0.37285 0.10425 82.54984 0.91942 0.38568 0.06076 59.73229 0.23900 2958.061 2.53595 281.159 3.0120.69063 2600 2.52568 0.11597 169.36959 1.45473 1.96581 0.11351 98.42203 0.40883 5902.280 3.65906 306.689 2.2200.90928 3200 12.30101 0.11832 1076.11450 2.49597 12.92691 0.13233 385.41917 0.23959 24806.658 5.77291 320.342 0.5241.00000 4000 5.36098 0.13840 550.73558 3.01152 5.22654 0.14798 159.92163 0.56783 10413.116 4.15398 321.818 1.726
MC14-x14e A435-i Plagioclase mass=1
0.01248 150 1.90423 0.10311 3.76624 0.50924 3.03321 0.08815 26.16820 0.30236 1718.403 1.28438 261.873 7.0230.03148 200 1.80674 0.11194 4.47396 0.67295 1.82630 0.13310 39.85742 0.30524 2615.936 3.45609 305.888 4.9850.10982 300 3.10946 0.10175 22.56466 1.30980 2.35544 0.12079 164.26305 0.57214 9338.106 5.05744 300.588 1.3920.27806 400 2.42822 0.10130 38.33598 0.48985 2.17143 0.09299 352.81349 0.72126 20352.287 9.89174 324.187 0.7720.43943 500 1.37799 0.08718 33.97957 0.88784 1.34314 0.14570 338.41390 0.34518 19944.355 8.15442 335.241 0.5260.54272 600 0.81842 0.09784 29.24914 0.45517 1.05859 0.09713 216.59568 0.86109 12474.813 4.38968 328.588 1.3940.63425 800 2.18005 0.13100 54.91767 1.50054 2.19385 0.12781 191.94534 0.53831 11442.266 4.74847 327.404 1.3700.69028 1000 0.83716 0.09632 47.75212 1.36026 0.86945 0.10363 117.50478 0.50043 6659.748 3.90288 318.415 1.8050.72013 1200 0.12296 0.11073 28.59899 0.88099 0.20239 0.09585 62.59930 0.30130 3385.241 11.00901 312.663 3.2670.74983 1600 0.77716 0.10152 38.86709 1.06555 0.80626 0.11136 62.26687 0.17158 3366.618 1.40952 295.853 2.7190.81032 2000 2.34302 0.06306 116.31576 1.10160 2.82325 0.08861 126.86702 0.55550 7435.225 2.81458 310.792 1.4840.91511 2600 7.38859 0.03423 394.50532 2.68856 9.18129 0.11865 219.74734 0.74247 14538.258 6.85561 327.231 1.0540.95499 3200 2.79218 0.13067 165.16680 1.56695 3.53401 0.13455 83.61335 0.45368 5479.259 3.75537 324.246 2.9521.00000 4000 5.13528 0.12442 174.24611 1.46427 4.23347 0.12865 94.39857 0.23226 6800.840 3.46248 325.875 2.209
J= 0.00353724+/- 0.00000743162 tot.gas.age= 311.245 +/- 0.755 mass=1
J= 0.00353724 +/- 0.00000743162 tot.gas.age= 313.781 +/- 0.743
mass=1 J= 0.00353724 +/- 0.00000743162 tot.gas.age= 306.498 +/- 0.72
mass=1 J= 0.00353724 +/- 0.00000743162 tot.gas.age= 18.556 +/- 0.208
J= 0.00353724 +/- 0.00000743162 tot.gas.age= 321.867 +/- 0.737
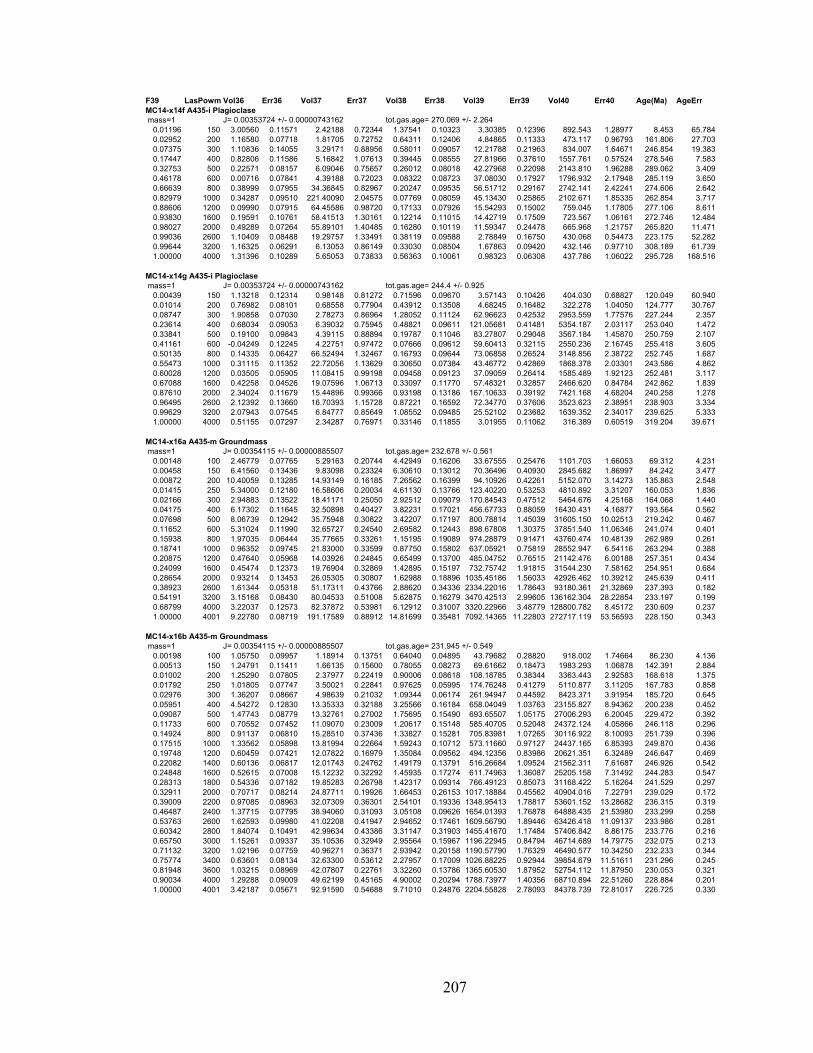
207
F39 LasPowmWVol36 Err36 Vol37 Err37 Vol38 Err38 Vol39 Err39 Vol40 Err40 Age(Ma) AgeErrMC14-x14f A435-i Plagioclase mass=1
0.01196 150 3.00560 0.11571 2.42188 0.72344 1.37541 0.10323 3.30385 0.12396 892.543 1.28977 8.453 65.7840.02952 200 1.16580 0.07718 1.81705 0.72752 0.64311 0.12406 4.84865 0.11333 473.117 0.96793 161.806 27.7030.07375 300 1.10836 0.14055 3.29171 0.88956 0.58011 0.09057 12.21788 0.21963 834.007 1.64671 246.854 19.3830.17447 400 0.82806 0.11586 5.16842 1.07613 0.39445 0.08555 27.81966 0.37610 1557.761 0.57524 278.546 7.5830.32753 500 0.22571 0.08157 6.09046 0.75657 0.26012 0.08018 42.27968 0.22098 2143.810 1.96288 289.062 3.4090.46178 600 0.00716 0.07841 4.39188 0.72023 0.08322 0.08723 37.08030 0.17927 1796.932 2.17948 285.119 3.6500.66639 800 0.38999 0.07955 34.36845 0.82967 0.20247 0.09535 56.51712 0.29167 2742.141 2.42241 274.606 2.6420.82979 1000 0.34287 0.09510 221.40090 2.04575 0.07769 0.08059 45.13430 0.25865 2102.671 1.85335 262.854 3.7170.88606 1200 0.09990 0.07915 64.45586 0.98720 0.17133 0.07926 15.54293 0.15002 759.045 1.17805 277.106 8.6110.93830 1600 0.19591 0.10761 58.41513 1.30161 0.12214 0.11015 14.42719 0.17509 723.567 1.06161 272.746 12.4840.98027 2000 0.49289 0.07264 55.89101 1.40485 0.16280 0.10119 11.59347 0.24478 665.968 1.21757 265.820 11.4710.99036 2600 1.10409 0.08488 19.29757 1.33491 0.38119 0.09588 2.78849 0.16750 430.068 0.54473 223.175 52.2820.99644 3200 1.16325 0.06291 6.13053 0.86149 0.33030 0.08504 1.67863 0.09420 432.146 0.97710 308.189 61.7391.00000 4000 1.31396 0.10289 5.65053 0.73833 0.56363 0.10061 0.98323 0.06308 437.786 1.06022 295.728 168.516
MC14-x14g A435-i Plagioclase mass=1
0.00439 150 1.13218 0.12314 0.98148 0.81272 0.71596 0.09670 3.57143 0.10426 404.030 0.68827 120.049 60.9400.01014 200 0.76982 0.08101 0.68558 0.77904 0.43912 0.13508 4.68245 0.16482 322.278 1.04050 124.777 30.7670.08747 300 1.90858 0.07030 2.78273 0.86964 1.28052 0.11124 62.96623 0.42532 2953.559 1.77576 227.244 2.3570.23614 400 0.68034 0.09053 6.39032 0.75945 0.48821 0.09611 121.05681 0.41481 5354.187 2.03117 253.040 1.4720.33841 500 0.19100 0.09843 4.39115 0.88894 0.19787 0.11046 83.27807 0.29048 3567.184 1.45870 250.759 2.1070.41161 600 -0.04249 0.12245 4.22751 0.97472 0.07666 0.09612 59.60413 0.32115 2550.236 2.16745 255.418 3.6050.50135 800 0.14335 0.06427 66.52494 1.32467 0.16793 0.09644 73.06858 0.26524 3148.856 2.38722 252.745 1.6870.55473 1000 0.31115 0.11352 22.72056 1.13629 0.30650 0.07384 43.46772 0.42869 1868.378 2.03301 243.586 4.8620.60028 1200 0.03505 0.05905 11.08415 0.99198 0.09458 0.09123 37.09059 0.26414 1585.489 1.92123 252.481 3.1170.67088 1600 0.42258 0.04526 19.07596 1.06713 0.33097 0.11770 57.48321 0.32857 2466.620 0.84784 242.862 1.8390.87610 2000 2.34024 0.11679 15.44896 0.99366 0.93198 0.13186 167.10633 0.39192 7421.168 4.68204 240.258 1.2780.96495 2600 2.12392 0.13660 16.70393 1.15728 0.87221 0.16592 72.34770 0.37606 3523.623 2.38951 238.903 3.3340.99629 3200 2.07943 0.07545 6.84777 0.85649 1.08552 0.09485 25.52102 0.23682 1639.352 2.34017 239.625 5.3331.00000 4000 0.51155 0.07297 2.34287 0.76971 0.33146 0.11855 3.01955 0.11062 316.389 0.60519 319.204 39.671
MC14-x16a A435-m Groundmass mass=1
0.00148 100 2.46779 0.07765 5.29163 0.20744 4.42949 0.16206 33.67555 0.25476 1101.703 1.66053 69.312 4.2310.00458 150 6.41560 0.13436 9.83098 0.23324 6.30610 0.13012 70.36496 0.40930 2845.682 1.86997 84.242 3.4770.00872 200 10.40059 0.13285 14.93149 0.16185 7.26562 0.16399 94.10926 0.42261 5152.070 3.14273 135.863 2.5480.01415 250 5.34000 0.12180 16.58606 0.20034 4.61130 0.13766 123.40220 0.53253 4810.892 3.31207 160.053 1.8360.02166 300 2.94883 0.13522 18.41171 0.25050 2.92512 0.09079 170.84543 0.47512 5464.676 4.25168 164.068 1.4400.04175 400 6.17302 0.11645 32.50898 0.40427 3.82231 0.17021 456.67733 0.88059 16430.431 4.16877 193.564 0.5620.07698 500 8.06739 0.12942 35.75948 0.30822 3.42207 0.17197 800.78814 1.45039 31605.150 10.02513 219.242 0.4670.11652 600 5.31024 0.11990 32.65727 0.24540 2.69582 0.12443 898.67808 1.30375 37851.540 11.06346 241.074 0.4010.15938 800 1.97035 0.06444 35.77665 0.33261 1.15195 0.19089 974.28879 0.91471 43760.474 10.48139 262.989 0.2610.18741 1000 0.96352 0.09745 21.83000 0.33599 0.87750 0.15802 637.05921 0.75819 28552.947 6.54116 263.294 0.3880.20875 1200 0.47640 0.05968 14.03926 0.24845 0.65499 0.13700 485.04752 0.76515 21142.476 6.00188 257.351 0.4340.24099 1600 0.45474 0.12373 19.76904 0.32869 1.42895 0.15197 732.75742 1.91815 31544.230 7.58162 254.951 0.6840.28654 2000 0.93214 0.13453 26.05305 0.30807 1.62988 0.18896 1035.45186 1.56033 42926.462 10.39212 245.639 0.4110.38923 2600 1.61344 0.05318 51.17311 0.43766 2.88620 0.34336 2334.22016 1.78643 93180.361 21.32869 237.393 0.1820.54191 3200 3.15168 0.08430 80.04533 0.51008 5.62875 0.16279 3470.42513 2.99605 136162.304 28.22854 233.197 0.1990.68799 4000 3.22037 0.12573 82.37872 0.53981 6.12912 0.31007 3320.22966 3.48779 128800.782 8.45172 230.609 0.2371.00000 4001 9.22780 0.08719 191.17589 0.88912 14.81699 0.35481 7092.14365 11.22803 272717.119 53.56593 228.150 0.343
MC14-x16b A435-m Groundmass mass=1
0.00198 100 1.05750 0.09957 1.18914 0.13751 0.64040 0.04895 43.79682 0.28820 918.002 1.74664 86.230 4.1360.00513 150 1.24791 0.11411 1.66135 0.15600 0.78055 0.08273 69.61662 0.18473 1983.293 1.06878 142.391 2.8840.01002 200 1.25290 0.07805 2.37977 0.22419 0.90006 0.08618 108.18785 0.38344 3363.443 2.92583 168.618 1.3750.01792 250 1.01805 0.07747 3.50021 0.22841 0.97625 0.05995 174.76248 0.41279 5110.877 3.11205 167.783 0.8580.02976 300 1.36207 0.08667 4.98639 0.21032 1.09344 0.06174 261.94947 0.44592 8423.371 3.91954 185.720 0.6450.05951 400 4.54272 0.12830 13.35333 0.32188 3.25566 0.16184 658.04049 1.03763 23155.827 8.94362 200.238 0.4520.09087 500 1.47743 0.08779 13.32761 0.27002 1.75695 0.15490 693.65507 1.05175 27006.293 6.20045 229.472 0.3920.11733 600 0.70552 0.07452 11.09070 0.23009 1.20617 0.15148 585.40705 0.52048 24372.124 4.05866 246.118 0.2960.14924 800 0.91137 0.06810 15.28510 0.37436 1.33827 0.15281 705.83981 1.07265 30116.922 8.10093 251.739 0.3960.17515 1000 1.33562 0.05898 13.81994 0.22664 1.59243 0.10712 573.11660 0.97127 24437.165 6.85393 249.870 0.4360.19748 1200 0.60459 0.07421 12.07822 0.16979 1.35084 0.09562 494.12356 0.83986 20621.351 6.32489 246.647 0.4690.22082 1400 0.60136 0.06817 12.01743 0.24762 1.49179 0.13791 516.26684 1.09524 21562.311 7.61687 246.926 0.5420.24848 1600 0.52615 0.07008 15.12232 0.32292 1.45935 0.17274 611.74963 1.36087 25205.158 7.31492 244.283 0.5470.28313 1800 0.54336 0.07182 19.85283 0.26798 1.42317 0.09314 766.49123 0.85073 31168.422 5.16264 241.529 0.2970.32911 2000 0.70717 0.08214 24.87711 0.19926 1.66453 0.26153 1017.18884 0.45562 40904.016 7.22791 239.029 0.1720.39009 2200 0.97085 0.08963 32.07309 0.36301 2.54101 0.19336 1348.95413 1.78817 53601.152 13.28682 236.315 0.3190.46487 2400 1.37715 0.07795 38.94060 0.31093 3.05108 0.09626 1654.01393 1.76878 64888.435 21.53980 233.299 0.2580.53763 2600 1.62593 0.09980 41.02208 0.41947 2.94652 0.17461 1609.56790 1.89446 63426.418 11.09137 233.986 0.2810.60342 2800 1.84074 0.10491 42.99634 0.43386 3.31147 0.31903 1455.41670 1.17484 57406.842 8.86175 233.776 0.2160.65750 3000 1.15261 0.09337 35.10536 0.32949 2.95564 0.15967 1196.22945 0.84794 46714.689 14.79775 232.075 0.2130.71132 3200 1.02196 0.07759 40.96271 0.36371 2.93942 0.20158 1190.57790 1.76329 46490.577 10.34250 232.233 0.3440.75774 3400 0.63601 0.08134 32.63300 0.53612 2.27957 0.17009 1026.88225 0.92944 39854.679 11.51611 231.296 0.2450.81948 3600 1.03215 0.08969 42.07807 0.22761 3.32260 0.13786 1365.60530 1.87952 52754.112 11.87950 230.053 0.3210.90034 4000 1.29288 0.09009 49.62199 0.45165 4.90002 0.20294 1788.73977 1.40356 68710.894 22.51260 228.884 0.2011.00000 4001 3.42187 0.05671 92.91590 0.54688 9.71010 0.24876 2204.55828 2.78093 84378.739 72.81017 226.725 0.330
J= 0.00353724 +/- 0.00000743162 tot.gas.age= 270.069 +/- 2.264
J= 0.00353724 +/- 0.00000743162 tot.gas.age= 244.4 +/- 0.925
J= 0.00354115 +/- 0.00000885507 tot.gas.age= 232.678 +/- 0.561
J= 0.00354115 +/- 0.00000885507 tot.gas.age= 231.945 +/- 0.549
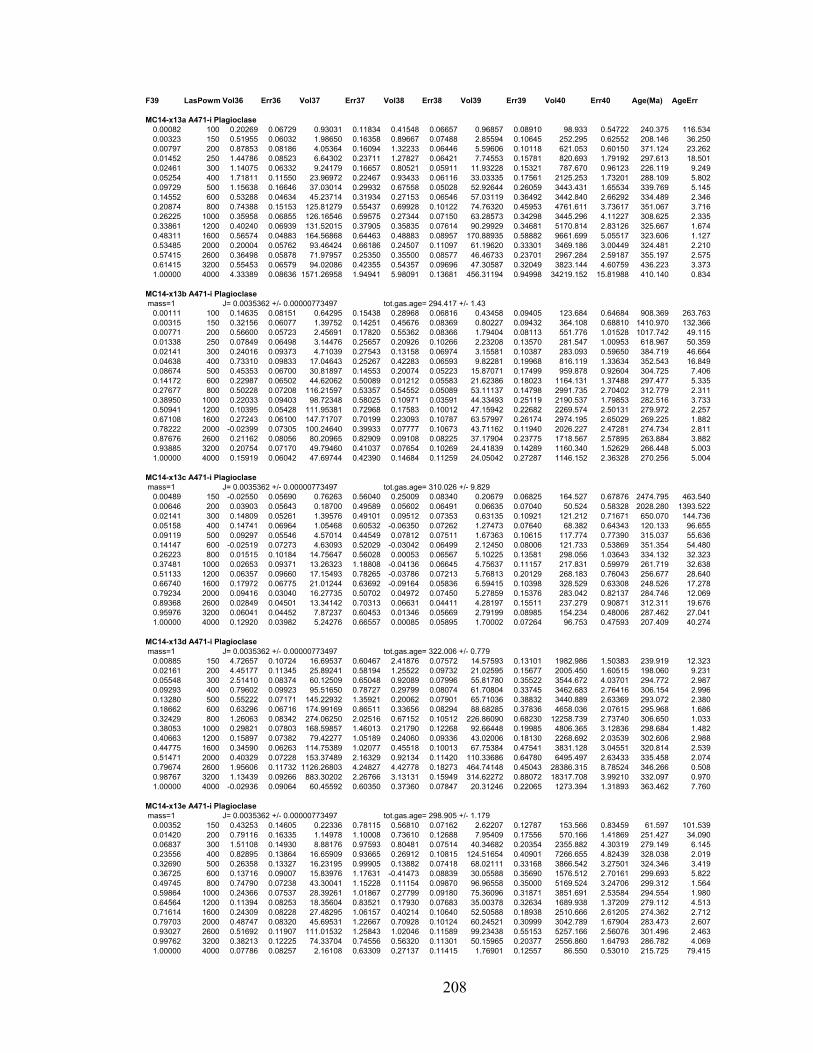
208
F39 LasPowmWVol36 Err36 Vol37 Err37 Vol38 Err38 Vol39 Err39 Vol40 Err40 Age(Ma) AgeErr
MC14-x13a A471-i Plagioclase 0.00082 100 0.20269 0.06729 0.93031 0.11834 0.41548 0.06657 0.96857 0.08910 98.933 0.54722 240.375 116.5340.00323 150 0.51955 0.06032 1.98650 0.16358 0.89667 0.07488 2.85594 0.10645 252.295 0.62552 208.146 36.2500.00797 200 0.87853 0.08186 4.05364 0.16094 1.32233 0.06446 5.59606 0.10118 621.053 0.60150 371.124 23.2620.01452 250 1.44786 0.08523 6.64302 0.23711 1.27827 0.06421 7.74553 0.15781 820.693 1.79192 297.613 18.5010.02461 300 1.14075 0.06332 9.24179 0.16657 0.80521 0.05911 11.93228 0.15321 787.670 0.96123 226.119 9.2490.05254 400 1.71811 0.11550 23.96972 0.22467 0.93433 0.06116 33.03335 0.17561 2125.253 1.73201 288.109 5.8020.09729 500 1.15638 0.16646 37.03014 0.29932 0.67558 0.05028 52.92644 0.26059 3443.431 1.65534 339.769 5.1450.14552 600 0.53288 0.04634 45.23714 0.31934 0.27153 0.06546 57.03119 0.36492 3442.840 2.66292 334.489 2.3460.20874 800 0.74388 0.15153 125.81279 0.55437 0.69928 0.10122 74.76320 0.45953 4761.611 3.73617 351.067 3.7160.26225 1000 0.35958 0.06855 126.16546 0.59575 0.27344 0.07150 63.28573 0.34298 3445.296 4.11227 308.625 2.3350.33861 1200 0.40240 0.06939 131.52015 0.37905 0.35835 0.07614 90.29929 0.34681 5170.814 2.83126 325.667 1.6740.48311 1600 0.56574 0.04883 164.56868 0.64463 0.48883 0.08957 170.88935 0.58882 9661.699 5.05517 323.606 1.1270.53485 2000 0.20004 0.05762 93.46424 0.66186 0.24507 0.11097 61.19620 0.33301 3469.186 3.00449 324.481 2.2100.57415 2600 0.36498 0.05878 71.97957 0.25350 0.35500 0.08577 46.46733 0.23701 2967.284 2.59187 355.197 2.5750.61415 3200 0.55453 0.06579 94.02086 0.42355 0.54357 0.09696 47.30587 0.32049 3823.144 4.60759 436.223 3.3731.00000 4000 4.33389 0.08636 1571.26958 1.94941 5.98091 0.13681 456.31194 0.94998 34219.152 15.81988 410.140 0.834
MC14-x13b A471-i Plagioclase mass=1
0.00111 100 0.14635 0.08151 0.64295 0.15438 0.28968 0.06816 0.43458 0.09405 123.684 0.64684 908.369 263.7630.00315 150 0.32156 0.06077 1.39752 0.14251 0.45676 0.08369 0.80227 0.09432 364.108 0.68810 1410.970 132.3660.00771 200 0.56600 0.05723 2.45691 0.17820 0.55362 0.08366 1.79404 0.08113 551.776 1.01528 1017.742 49.1150.01338 250 0.07849 0.06498 3.14476 0.25657 0.20926 0.10266 2.23208 0.13570 281.547 1.00953 618.967 50.3590.02141 300 0.24016 0.09373 4.71039 0.27543 0.13158 0.06974 3.15581 0.10387 283.093 0.59650 384.719 46.6640.04638 400 0.73310 0.09833 17.04643 0.25267 0.42283 0.06593 9.82281 0.19968 816.119 1.33634 352.543 16.8490.08674 500 0.45353 0.06700 30.81897 0.14553 0.20074 0.05223 15.87071 0.17499 959.878 0.92604 304.725 7.4060.14172 600 0.22987 0.06502 44.62062 0.50089 0.01212 0.05583 21.62386 0.18023 1164.131 1.37488 297.477 5.3350.27677 800 0.50228 0.07208 116.21597 0.53357 0.54552 0.05089 53.11137 0.14798 2991.735 2.70402 312.779 2.3110.38950 1000 0.22033 0.09403 98.72348 0.58025 0.10971 0.03591 44.33493 0.25119 2190.537 1.79853 282.516 3.7330.50941 1200 0.10395 0.05428 111.95381 0.72968 0.17583 0.10012 47.15942 0.22682 2269.574 2.50131 279.972 2.2570.67108 1600 0.27243 0.06100 147.71707 0.70199 0.23093 0.10787 63.57997 0.26174 2974.195 2.65029 269.225 1.8820.78222 2000 -0.02399 0.07305 100.24640 0.39933 0.07777 0.10673 43.71162 0.11940 2026.227 2.47281 274.734 2.8110.87676 2600 0.21162 0.08056 80.20965 0.82909 0.09108 0.08225 37.17904 0.23775 1718.567 2.57895 263.884 3.8820.93885 3200 0.20754 0.07170 49.79460 0.41037 0.07654 0.10269 24.41839 0.14289 1160.340 1.52629 266.448 5.0031.00000 4000 0.15919 0.06042 47.69744 0.42390 0.14684 0.11259 24.05042 0.27287 1146.152 2.36328 270.256 5.004
MC14-x13c A471-i Plagioclase mass=1
0.00489 150 -0.02550 0.05690 0.76263 0.56040 0.25009 0.08340 0.20679 0.06825 164.527 0.67876 2474.795 463.5400.00646 200 0.03903 0.05643 0.18700 0.49589 0.05602 0.06491 0.06635 0.07040 50.524 0.58328 2028.280 1393.5220.02141 300 0.14809 0.05261 1.39576 0.49101 0.09512 0.07353 0.63135 0.10921 121.212 0.71671 650.070 144.7360.05158 400 0.14741 0.06964 1.05468 0.60532 -0.06350 0.07262 1.27473 0.07640 68.382 0.64343 120.133 96.6550.09119 500 0.09297 0.05546 4.57014 0.44549 0.07812 0.07511 1.67363 0.10615 117.774 0.77390 315.037 55.6360.14147 600 -0.02519 0.07273 4.63093 0.52029 -0.03042 0.06499 2.12450 0.08006 121.733 0.53869 351.354 54.4800.26223 800 0.01515 0.10184 14.75647 0.56028 0.00053 0.06567 5.10225 0.13581 298.056 1.03643 334.132 32.3230.37481 1000 0.02653 0.09371 13.26323 1.18808 -0.04136 0.06645 4.75637 0.11157 217.831 0.59979 261.719 32.6380.51133 1200 0.06357 0.09660 17.15493 0.78265 -0.03786 0.07213 5.76813 0.20129 268.183 0.76043 256.677 28.6400.66740 1600 0.17972 0.06775 21.01244 0.63692 -0.09164 0.05836 6.59415 0.10398 328.529 0.63308 248.526 17.2780.79234 2000 0.09416 0.03040 16.27735 0.50702 0.04972 0.07450 5.27859 0.15376 283.042 0.82137 284.746 12.0690.89368 2600 0.02849 0.04501 13.34142 0.70313 0.06631 0.04411 4.28197 0.15511 237.279 0.90871 312.311 19.6760.95976 3200 0.06041 0.04452 7.87237 0.60453 0.01346 0.05669 2.79199 0.08985 154.234 0.48006 287.462 27.0411.00000 4000 0.12920 0.03982 5.24276 0.66557 0.00085 0.05895 1.70002 0.07264 96.753 0.47593 207.409 40.274
MC14-x13d A471-i Plagioclase mass=1
0.00885 150 4.72657 0.10724 16.69537 0.60467 2.41876 0.07572 14.57593 0.13101 1982.986 1.50383 239.919 12.3230.02161 200 4.45177 0.11345 25.89241 0.58194 1.25522 0.09732 21.02595 0.15677 2005.450 1.60515 198.060 9.2310.05548 300 2.51410 0.08374 60.12509 0.65048 0.92089 0.07996 55.81780 0.35522 3544.672 4.03701 294.772 2.9870.09293 400 0.79602 0.09923 95.51650 0.78727 0.29799 0.08074 61.70804 0.33745 3462.683 2.76416 306.154 2.9960.13280 500 0.55222 0.07171 145.22932 1.35921 0.20062 0.07901 65.71036 0.38832 3440.889 2.63369 293.072 2.3800.18662 600 0.63296 0.06716 174.99169 0.86511 0.33656 0.08294 88.68285 0.37836 4658.036 2.07615 295.968 1.6860.32429 800 1.26063 0.08342 274.06250 2.02516 0.67152 0.10512 226.86090 0.68230 12258.739 2.73740 306.650 1.0330.38053 1000 0.29821 0.07803 168.59857 1.46013 0.21790 0.12268 92.66448 0.19985 4806.365 3.12836 298.684 1.4820.40663 1200 0.15897 0.07382 79.42277 1.05189 0.24060 0.09336 43.02006 0.18130 2268.692 2.03539 302.606 2.9880.44775 1600 0.34590 0.06263 114.75389 1.02077 0.45518 0.10013 67.75384 0.47541 3831.128 3.04551 320.814 2.5390.51471 2000 0.40329 0.07228 153.37489 2.16329 0.92134 0.11420 110.33686 0.64780 6495.497 2.63433 335.458 2.0740.79674 2600 1.95606 0.11732 1126.26803 4.24827 4.42778 0.18273 464.74148 0.45043 28386.315 8.78524 346.266 0.5080.98767 3200 1.13439 0.09266 883.30202 2.26766 3.13131 0.15949 314.62272 0.88072 18317.708 3.99210 332.097 0.9701.00000 4000 -0.02936 0.09064 60.45592 0.60350 0.37360 0.07847 20.31246 0.22065 1273.394 1.31893 363.462 7.760
MC14-x13e A471-i Plagioclase mass=1
0.00352 150 0.43253 0.14605 0.22336 0.78115 0.56810 0.07162 2.62207 0.12787 153.566 0.83459 61.597 101.5390.01420 200 0.79116 0.16335 1.14978 1.10008 0.73610 0.12688 7.95409 0.17556 570.166 1.41869 251.427 34.0900.06837 300 1.51108 0.14930 8.88176 0.97593 0.80481 0.07514 40.34682 0.20354 2355.882 4.30319 279.149 6.1450.23556 400 0.82895 0.13864 16.65909 0.93665 0.26912 0.10815 124.51654 0.40901 7266.655 4.82439 328.038 2.0190.32690 500 0.26358 0.13327 16.23195 0.99905 0.13882 0.07418 68.02111 0.33168 3866.542 3.27501 324.346 3.4190.36725 600 0.13716 0.09007 15.83976 1.17631 -0.41473 0.08839 30.05588 0.35690 1576.512 2.70161 299.693 5.8220.49745 800 0.74790 0.07238 43.30041 1.15228 0.11154 0.09870 96.96558 0.35000 5169.524 3.24706 299.312 1.5640.59864 1000 0.24366 0.07537 28.39261 1.01867 0.27799 0.09180 75.36096 0.31871 3851.691 2.53584 294.554 1.9800.64564 1200 0.11394 0.08253 18.35604 0.83521 0.17930 0.07683 35.00378 0.32634 1689.938 1.37209 279.112 4.5130.71614 1600 0.24309 0.08228 27.48295 1.06157 0.40214 0.10640 52.50588 0.18938 2510.666 2.61205 274.362 2.7120.79703 2000 0.48747 0.08320 45.69531 1.22667 0.70928 0.10124 60.24521 0.30999 3042.789 1.67904 283.473 2.6070.93027 2600 0.51692 0.11907 111.01532 1.25843 1.02046 0.11589 99.23438 0.55153 5257.166 2.56076 301.496 2.4630.99762 3200 0.38213 0.12225 74.33704 0.74556 0.56320 0.11301 50.15965 0.20377 2556.860 1.64793 286.782 4.0691.00000 4000 0.07786 0.08257 2.16108 0.63309 0.27137 0.11415 1.76901 0.12557 86.550 0.53010 215.725 79.415
J= 0.0035362 +/- 0.00000773497 tot.gas.age= 294.417 +/- 1.43
J= 0.0035362 +/- 0.00000773497 tot.gas.age= 310.026 +/- 9.829
J= 0.0035362 +/- 0.00000773497 tot.gas.age= 322.006 +/- 0.779
J= 0.0035362 +/- 0.00000773497 tot.gas.age= 298.905 +/- 1.179
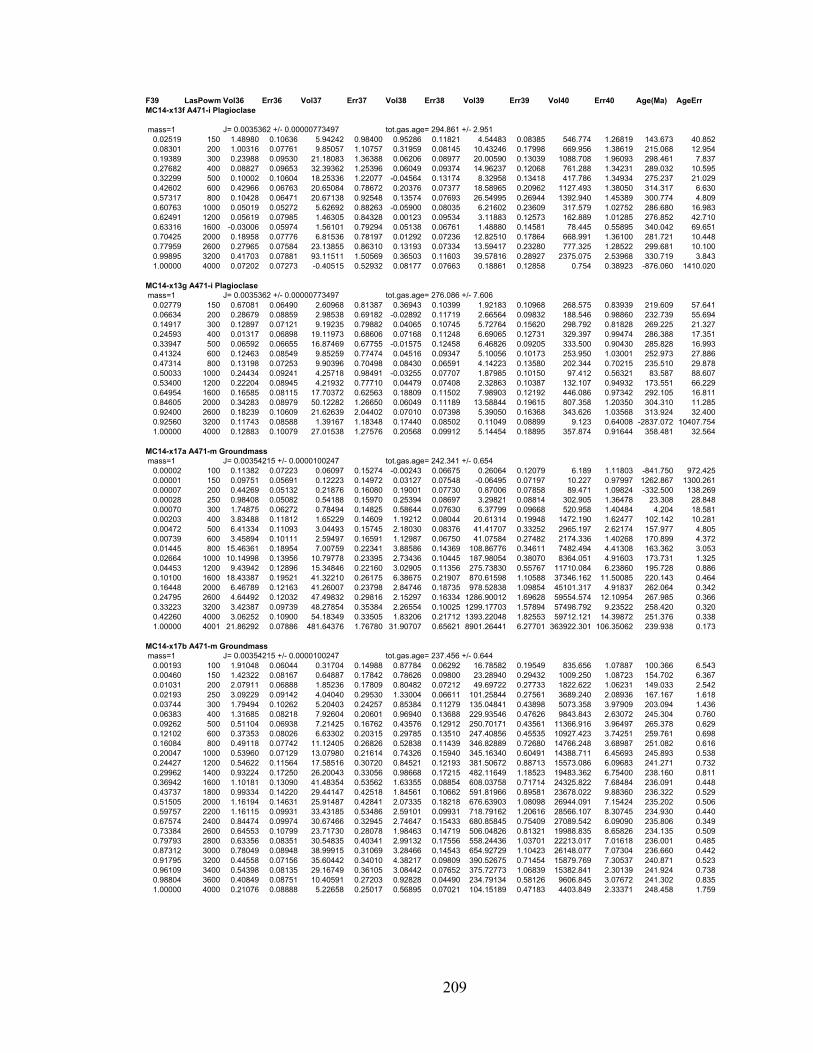
209
F39 LasPowmWVol36 Err36 Vol37 Err37 Vol38 Err38 Vol39 Err39 Vol40 Err40 Age(Ma) AgeErrMC14-x13f A471-i Plagioclase
mass=10.02519 150 1.48980 0.10636 5.94242 0.98400 0.95286 0.11821 4.54483 0.08385 546.774 1.26819 143.673 40.8520.08301 200 1.00316 0.07761 9.85057 1.10757 0.31959 0.08145 10.43246 0.17998 669.956 1.38619 215.068 12.9540.19389 300 0.23988 0.09530 21.18083 1.36388 0.06206 0.08977 20.00590 0.13039 1088.708 1.96093 298.461 7.8370.27682 400 0.08827 0.09653 32.39362 1.25396 0.06049 0.09374 14.96237 0.12068 761.288 1.34231 289.032 10.5950.32299 500 0.10002 0.10604 18.25336 1.22077 -0.04564 0.13174 8.32958 0.13418 417.786 1.34934 275.237 21.0290.42602 600 0.42966 0.06763 20.65084 0.78672 0.20376 0.07377 18.58965 0.20962 1127.493 1.38050 314.317 6.6300.57317 800 0.10428 0.06471 20.67138 0.92548 0.13574 0.07693 26.54995 0.26944 1392.940 1.45389 300.774 4.8090.60763 1000 0.05019 0.05272 5.62692 0.88263 -0.05900 0.08035 6.21602 0.23609 317.579 1.02752 286.680 16.9830.62491 1200 0.05619 0.07985 1.46305 0.84328 0.00123 0.09534 3.11883 0.12573 162.889 1.01285 276.852 42.7100.63316 1600 -0.03006 0.05974 1.56101 0.79294 0.05138 0.06761 1.48880 0.14581 78.445 0.55895 340.042 69.6510.70425 2000 0.18958 0.07776 6.81536 0.78197 0.01292 0.07236 12.82510 0.17864 668.991 1.36100 281.721 10.4480.77959 2600 0.27965 0.07584 23.13855 0.86310 0.13193 0.07334 13.59417 0.23280 777.325 1.28522 299.681 10.1000.99895 3200 0.41703 0.07881 93.11511 1.50569 0.36503 0.11603 39.57816 0.28927 2375.075 2.53968 330.719 3.8431.00000 4000 0.07202 0.07273 -0.40515 0.52932 0.08177 0.07663 0.18861 0.12858 0.754 0.38923 -876.060 1410.020
MC14-x13g A471-i Plagioclase mass=1
0.02779 150 0.67081 0.06490 2.60968 0.81387 0.36943 0.10399 1.92183 0.10968 268.575 0.83939 219.609 57.6410.06634 200 0.28679 0.08859 2.98538 0.69182 -0.02892 0.11719 2.66564 0.09832 188.546 0.98860 232.739 55.6940.14917 300 0.12897 0.07121 9.19235 0.79882 0.04065 0.10745 5.72764 0.15620 298.792 0.81828 269.225 21.3270.24593 400 0.01317 0.06898 19.11973 0.68606 0.07168 0.11248 6.69065 0.12731 329.397 0.99474 286.388 17.3510.33947 500 0.06592 0.06655 16.87469 0.67755 -0.01575 0.12458 6.46826 0.09205 333.500 0.90430 285.828 16.9930.41324 600 0.12463 0.08549 9.85259 0.77474 0.04516 0.09347 5.10056 0.10173 253.950 1.03001 252.973 27.8860.47314 800 0.13198 0.07253 9.90396 0.70498 0.08430 0.06591 4.14223 0.13580 202.344 0.70215 235.510 29.8780.50033 1000 0.24434 0.09241 4.25718 0.98491 -0.03255 0.07707 1.87985 0.10150 97.412 0.56321 83.587 88.6070.53400 1200 0.22204 0.08945 4.21932 0.77710 0.04479 0.07408 2.32863 0.10387 132.107 0.94932 173.551 66.2290.64954 1600 0.16585 0.08115 17.70372 0.62563 0.18809 0.11502 7.98903 0.12192 446.086 0.97342 292.105 16.8110.84605 2000 0.34283 0.08979 50.12282 1.26650 0.06049 0.11189 13.58844 0.19615 807.358 1.20350 304.310 11.2850.92400 2600 0.18239 0.10609 21.62639 2.04402 0.07010 0.07398 5.39050 0.16368 343.626 1.03568 313.924 32.4000.92560 3200 0.11743 0.08588 1.39167 1.18348 0.17440 0.08502 0.11049 0.08899 9.123 0.64008 -2837.072 10407.7541.00000 4000 0.12883 0.10079 27.01538 1.27576 0.20568 0.09912 5.14454 0.18895 357.874 0.91644 358.481 32.564
MC14-x17a A471-m Groundmass mass=1
0.00002 100 0.11382 0.07223 0.06097 0.15274 -0.00243 0.06675 0.26064 0.12079 6.189 1.11803 -841.750 972.4250.00001 150 0.09751 0.05691 0.12223 0.14972 0.03127 0.07548 -0.06495 0.07197 10.227 0.97997 1262.867 1300.2610.00007 200 0.44269 0.05132 0.21876 0.16080 0.19001 0.07730 0.87006 0.07858 89.471 1.09824 -332.500 138.2690.00028 250 0.98408 0.05082 0.54188 0.15970 0.25394 0.08697 3.29821 0.08814 302.905 1.36478 23.308 28.8480.00070 300 1.74875 0.06272 0.78494 0.14825 0.58644 0.07630 6.37799 0.09668 520.958 1.40484 4.204 18.5810.00203 400 3.83488 0.11812 1.65229 0.14609 1.19212 0.08044 20.61314 0.19948 1472.190 1.62477 102.142 10.2810.00472 500 6.41334 0.11093 3.04493 0.15745 2.18030 0.08376 41.41707 0.33252 2965.197 2.62174 157.977 4.8050.00739 600 3.45894 0.10111 2.59497 0.16591 1.12987 0.06750 41.07584 0.27482 2174.336 1.40268 170.899 4.3720.01445 800 15.46361 0.18954 7.00759 0.22341 3.88586 0.14369 108.86776 0.34611 7482.494 4.41308 163.362 3.0530.02664 1000 10.14998 0.13956 10.79778 0.23395 2.73436 0.10445 187.98054 0.38070 8364.051 4.91603 173.731 1.3250.04453 1200 9.43942 0.12896 15.34846 0.22160 3.02905 0.11356 275.73830 0.55767 11710.084 6.23860 195.728 0.8860.10100 1600 18.43387 0.19521 41.32210 0.26175 6.38675 0.21907 870.61598 1.10588 37346.162 11.50085 220.143 0.4640.16448 2000 6.46789 0.12163 41.26007 0.23798 2.84746 0.18735 978.52838 1.09854 45101.317 4.91837 262.064 0.3420.24795 2600 4.64492 0.12032 47.49832 0.29816 2.15297 0.16334 1286.90012 1.69628 59554.574 12.10954 267.985 0.3660.33223 3200 3.42387 0.09739 48.27854 0.35384 2.26554 0.10025 1299.17703 1.57894 57498.792 9.23522 258.420 0.3200.42260 4000 3.06252 0.10900 54.18349 0.33505 1.83206 0.21712 1393.22048 1.82553 59712.121 14.39872 251.376 0.3381.00000 4001 21.86292 0.07886 481.64376 1.76780 31.90707 0.65621 8901.26441 6.27701 363922.301 106.35062 239.938 0.173
MC14-x17b A471-m Groundmass mass=1
0.00193 100 1.91048 0.06044 0.31704 0.14988 0.87784 0.06292 16.78582 0.19549 835.656 1.07887 100.366 6.5430.00460 150 1.42322 0.08167 0.64887 0.17842 0.78626 0.09800 23.28940 0.29432 1009.250 1.08723 154.702 6.3670.01031 200 2.07911 0.06888 1.85236 0.17809 0.80482 0.07212 49.69722 0.27733 1822.622 1.06231 149.033 2.5420.02193 250 3.09229 0.09142 4.04040 0.29530 1.33004 0.06611 101.25844 0.27561 3689.240 2.08936 167.167 1.6180.03744 300 1.79494 0.10262 5.20403 0.24257 0.85384 0.11279 135.04841 0.43898 5073.358 3.97909 203.094 1.4360.06383 400 1.31685 0.08218 7.92604 0.20601 0.96940 0.13688 229.93546 0.47626 9843.843 2.63072 245.304 0.7600.09262 500 0.51104 0.06938 7.21425 0.16762 0.43576 0.12912 250.70171 0.43561 11366.916 3.96497 265.378 0.6290.12102 600 0.37353 0.08026 6.63302 0.20315 0.29785 0.13510 247.40856 0.45535 10927.423 3.74251 259.761 0.6980.16084 800 0.49118 0.07742 11.12405 0.26826 0.52838 0.11439 346.82889 0.72680 14766.248 3.68987 251.082 0.6160.20047 1000 0.53960 0.07129 13.07980 0.21614 0.74326 0.15940 345.16340 0.60491 14388.711 6.45693 245.893 0.5380.24427 1200 0.54622 0.11564 17.58516 0.30720 0.84521 0.12193 381.50672 0.88713 15573.086 6.09683 241.271 0.7320.29962 1400 0.93224 0.17250 26.20043 0.33056 0.98668 0.17215 482.11649 1.18523 19483.362 6.75400 238.160 0.8110.36942 1600 1.10181 0.13090 41.48354 0.53562 1.63355 0.08854 608.03758 0.71714 24325.822 7.68484 236.091 0.4480.43737 1800 0.99334 0.14220 29.44147 0.42518 1.84561 0.10662 591.81966 0.89581 23678.022 9.88360 236.322 0.5290.51505 2000 1.16194 0.14631 25.91487 0.42841 2.07335 0.18218 676.63903 1.08098 26944.091 7.15424 235.202 0.5060.59757 2200 1.16115 0.09931 33.43185 0.53486 2.59101 0.09931 718.79162 1.20616 28566.107 8.30745 234.930 0.4400.67574 2400 0.84474 0.09974 30.67466 0.32945 2.74647 0.15433 680.85845 0.75409 27089.542 6.09090 235.806 0.3490.73384 2600 0.64553 0.10799 23.71730 0.28078 1.98463 0.14719 506.04826 0.81321 19988.835 8.65826 234.135 0.5090.79793 2800 0.63356 0.08351 30.54835 0.40341 2.99132 0.17556 558.24436 1.03701 22213.017 7.01618 236.001 0.4850.87312 3000 0.78049 0.08948 38.99915 0.31069 3.28466 0.14543 654.92729 1.10423 26148.077 7.07304 236.660 0.4420.91795 3200 0.44558 0.07156 35.60442 0.34010 4.38217 0.09809 390.52675 0.71454 15879.769 7.30537 240.871 0.5230.96109 3400 0.54398 0.08135 29.16749 0.36105 3.08442 0.07652 375.72773 1.06839 15382.841 2.30139 241.924 0.7380.98804 3600 0.40849 0.08751 10.40591 0.27203 0.92828 0.04490 234.79134 0.58126 9606.845 3.07672 241.302 0.8351.00000 4000 0.21076 0.08888 5.22658 0.25017 0.56895 0.07021 104.15189 0.47183 4403.849 2.33371 248.458 1.759
J= 0.0035362 +/- 0.00000773497 tot.gas.age= 294.861 +/- 2.951
J= 0.0035362 +/- 0.00000773497 tot.gas.age= 276.086 +/- 7.606
J= 0.00354215 +/- 0.0000100247 tot.gas.age= 242.341 +/- 0.654
J= 0.00354215 +/- 0.0000100247 tot.gas.age= 237.456 +/- 0.644
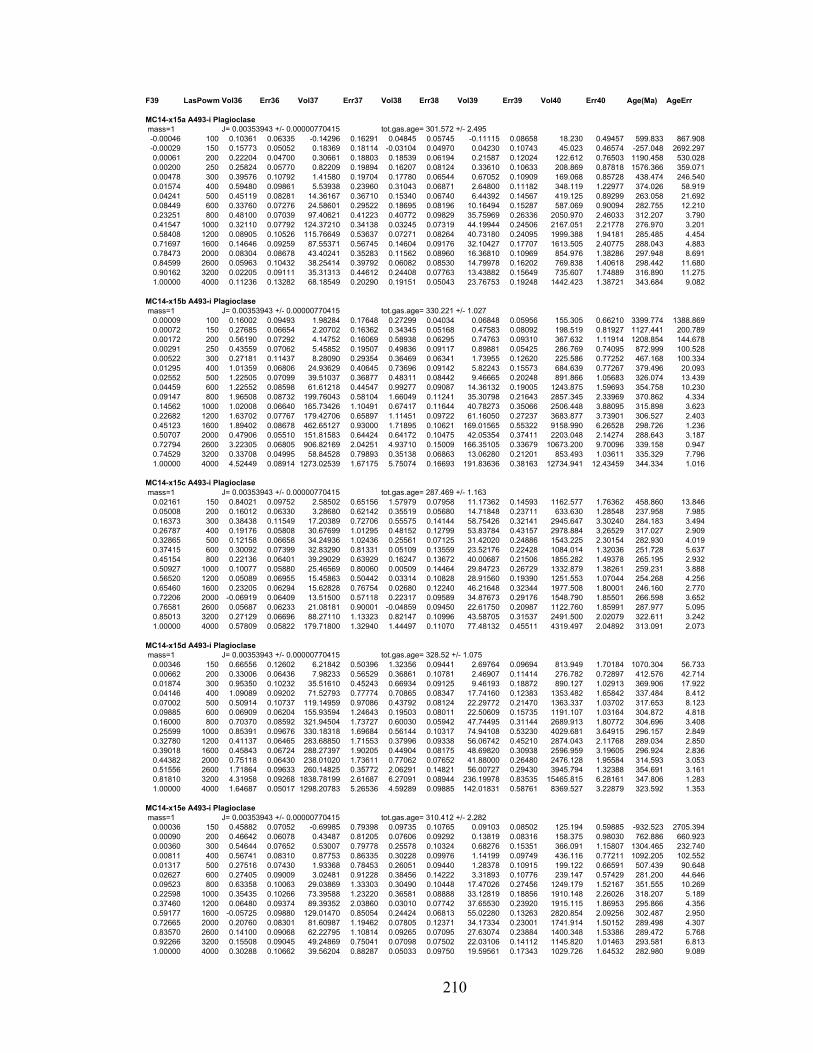
210
F39 LasPowmWVol36 Err36 Vol37 Err37 Vol38 Err38 Vol39 Err39 Vol40 Err40 Age(Ma) AgeErr
MC14-x15a A493-i Plagioclase mass=1
-0.00046 100 0.10361 0.06335 -0.14296 0.16291 0.04845 0.05745 -0.11115 0.08658 18.230 0.49457 599.833 867.908-0.00029 150 0.15773 0.05052 0.18369 0.18114 -0.03104 0.04970 0.04230 0.10743 45.023 0.46574 -257.048 2692.2970.00061 200 0.22204 0.04700 0.30661 0.18803 0.18539 0.06194 0.21587 0.12024 122.612 0.76503 1190.458 530.0280.00200 250 0.25824 0.05770 0.82209 0.19894 0.16207 0.08124 0.33610 0.10633 208.869 0.87818 1576.366 359.0710.00478 300 0.39576 0.10792 1.41580 0.19704 0.17780 0.06544 0.67052 0.10909 169.068 0.85728 438.474 246.5400.01574 400 0.59480 0.09861 5.53938 0.23960 0.31043 0.06871 2.64800 0.11182 348.119 1.22977 374.026 58.9190.04241 500 0.45119 0.08281 14.36167 0.36710 0.15340 0.06740 6.44392 0.14567 419.125 0.89299 263.058 21.6920.08449 600 0.33760 0.07276 24.58601 0.29522 0.18695 0.08196 10.16494 0.15287 587.069 0.90094 282.755 12.2100.23251 800 0.48100 0.07039 97.40621 0.41223 0.40772 0.09829 35.75969 0.26336 2050.970 2.46033 312.207 3.7900.41547 1000 0.32110 0.07792 124.37210 0.34138 0.03245 0.07319 44.19944 0.24506 2167.051 2.21778 276.970 3.2010.58408 1200 0.08905 0.10526 115.76649 0.53637 0.07271 0.08264 40.73180 0.24095 1999.388 1.94181 285.485 4.4540.71697 1600 0.14646 0.09259 87.55371 0.56745 0.14604 0.09176 32.10427 0.17707 1613.505 2.40775 288.043 4.8830.78473 2000 0.08304 0.08678 43.40241 0.35283 0.11562 0.08960 16.36810 0.10969 854.976 1.38286 297.948 8.6910.84599 2600 0.05963 0.10432 38.25414 0.39792 0.06082 0.08530 14.79978 0.16202 769.838 1.40618 298.442 11.6800.90162 3200 0.02205 0.09111 35.31313 0.44612 0.24408 0.07763 13.43882 0.15649 735.607 1.74889 316.890 11.2751.00000 4000 0.11236 0.13282 68.18549 0.20290 0.19151 0.05043 23.76753 0.19248 1442.423 1.38721 343.684 9.082
MC14-x15b A493-i Plagioclase mass=1
0.00009 100 0.16002 0.09493 1.98284 0.17648 0.27299 0.04034 0.06848 0.05956 155.305 0.66210 3399.774 1388.8690.00072 150 0.27685 0.06654 2.20702 0.16362 0.34345 0.05168 0.47583 0.08092 198.519 0.81927 1127.441 200.7890.00172 200 0.56190 0.07292 4.14752 0.16069 0.58938 0.06295 0.74763 0.09310 367.632 1.11914 1208.854 144.6780.00291 250 0.43559 0.07062 5.45852 0.19507 0.49836 0.09117 0.89881 0.05425 286.769 0.74095 872.999 100.5280.00522 300 0.27181 0.11437 8.28090 0.29354 0.36469 0.06341 1.73955 0.12620 225.586 0.77252 467.168 100.3340.01295 400 1.01359 0.06806 24.93629 0.40645 0.73696 0.09142 5.82243 0.15573 684.639 0.77267 379.496 20.0930.02552 500 1.22505 0.07099 39.51037 0.36877 0.48311 0.08442 9.46665 0.20248 891.866 1.05683 326.074 13.4390.04459 600 1.22552 0.08598 61.61218 0.44547 0.99277 0.09087 14.36132 0.19005 1243.875 1.59693 354.758 10.2300.09147 800 1.96508 0.08732 199.76043 0.58104 1.66049 0.11241 35.30798 0.21643 2857.345 2.33969 370.862 4.3340.14562 1000 1.02008 0.06640 165.73426 1.10491 0.67417 0.11644 40.78273 0.35066 2506.448 3.88095 315.898 3.6230.22682 1200 1.63702 0.07767 179.42706 0.65897 1.11451 0.09722 61.16050 0.27237 3683.877 3.73901 306.527 2.4030.45123 1600 1.89402 0.08678 462.65127 0.93000 1.71895 0.10621 169.01565 0.55322 9158.990 6.26528 298.726 1.2360.50707 2000 0.47906 0.05510 151.81583 0.64424 0.64172 0.10475 42.05354 0.37411 2203.048 2.14274 288.643 3.1870.72794 2600 3.22305 0.06805 906.82169 2.04251 4.93710 0.15009 166.35105 0.33679 10673.200 9.70096 339.158 0.9470.74529 3200 0.33708 0.04995 58.84528 0.79893 0.35138 0.06863 13.06280 0.21201 853.493 1.03611 335.329 7.7961.00000 4000 4.52449 0.08914 1273.02539 1.67175 5.75074 0.16693 191.83636 0.38163 12734.941 12.43459 344.334 1.016
MC14-x15c A493-i Plagioclase mass=1
0.02161 150 0.84021 0.09752 2.58502 0.65156 1.57979 0.07958 11.17362 0.14593 1162.577 1.76362 458.860 13.8460.05008 200 0.16012 0.06330 3.28680 0.62142 0.35519 0.05680 14.71848 0.23711 633.630 1.28548 237.958 7.9850.16373 300 0.38438 0.11549 17.20389 0.72706 0.55575 0.14144 58.75426 0.32141 2945.647 3.30240 284.183 3.4940.26787 400 0.19176 0.05808 30.67699 1.01295 0.48152 0.12799 53.83784 0.43157 2978.884 3.26529 317.027 2.9090.32865 500 0.12158 0.06658 34.24936 1.02436 0.25561 0.07125 31.42020 0.24886 1543.225 2.30154 282.930 4.0190.37415 600 0.30092 0.07399 32.83290 0.81331 0.05109 0.13559 23.52176 0.22428 1084.014 1.32036 251.728 5.6370.45154 800 0.22136 0.06401 39.29029 0.63929 0.16247 0.13672 40.00687 0.21506 1855.282 1.49378 265.195 2.9320.50927 1000 0.10077 0.05880 25.46569 0.80060 0.00509 0.14464 29.84723 0.26729 1332.879 1.38261 259.231 3.8880.56520 1200 0.05089 0.06955 15.45863 0.50442 0.03314 0.10828 28.91560 0.19390 1251.553 1.07044 254.268 4.2560.65460 1600 0.23205 0.06294 15.62828 0.76754 0.02680 0.12240 46.21648 0.32344 1977.508 1.80001 246.160 2.7700.72206 2000 -0.06919 0.06409 13.51500 0.57118 0.22317 0.09589 34.87673 0.29176 1548.790 1.85501 266.598 3.6520.76581 2600 0.05687 0.06233 21.08181 0.90001 -0.04859 0.09450 22.61750 0.20987 1122.760 1.85991 287.977 5.0950.85013 3200 0.27129 0.06696 88.27110 1.13323 0.82147 0.10996 43.58705 0.31537 2491.500 2.02079 322.611 3.2421.00000 4000 0.57809 0.05822 179.71800 1.32940 1.44497 0.11070 77.48132 0.45511 4319.497 2.04892 313.091 2.073
MC14-x15d A493-i Plagioclase mass=1
0.00346 150 0.66556 0.12602 6.21842 0.50396 1.32356 0.09441 2.69764 0.09694 813.949 1.70184 1070.304 56.7330.00662 200 0.33006 0.06436 7.98233 0.56529 0.36861 0.10781 2.46907 0.11414 276.782 0.72897 412.576 42.7140.01874 300 0.95350 0.10232 35.51610 0.45243 0.66934 0.09125 9.46193 0.18872 890.127 1.02913 369.906 17.9220.04146 400 1.09089 0.09202 71.52793 0.77774 0.70865 0.08347 17.74160 0.12383 1353.482 1.65842 337.484 8.4120.07002 500 0.50914 0.10737 119.14959 0.97086 0.43792 0.08124 22.29772 0.21470 1363.337 1.03702 317.653 8.1230.09885 600 0.06909 0.06204 155.93594 1.24643 0.19503 0.08011 22.50609 0.15735 1191.107 1.03164 304.872 4.8180.16000 800 0.70370 0.08592 321.94504 1.73727 0.60030 0.05942 47.74495 0.31144 2689.913 1.80772 304.696 3.4080.25599 1000 0.85391 0.09676 330.18318 1.69684 0.56144 0.10317 74.94108 0.53230 4029.681 3.64915 296.157 2.8490.32780 1200 0.41137 0.06465 283.68850 1.71553 0.37996 0.09338 56.06742 0.45210 2874.043 2.11768 289.034 2.8500.39018 1600 0.45843 0.06724 288.27397 1.90205 0.44904 0.08175 48.69820 0.30938 2596.959 3.19605 296.924 2.8360.44382 2000 0.75118 0.06430 238.01020 1.73611 0.77062 0.07652 41.88000 0.26480 2476.128 1.95584 314.593 3.0530.51556 2600 1.71864 0.09633 260.14825 0.35772 2.06291 0.14821 56.00727 0.29430 3945.794 1.32388 354.691 3.1610.81810 3200 4.31958 0.09268 1838.78199 2.61687 6.27091 0.08944 236.19978 0.83535 15465.815 6.28161 347.806 1.2831.00000 4000 1.64687 0.05017 1298.20783 5.26536 4.59289 0.09885 142.01831 0.58761 8369.527 3.22879 323.592 1.353
MC14-x15e A493-i Plagioclase mass=1
0.00036 150 0.45882 0.07052 -0.69985 0.79398 0.09735 0.10765 0.09103 0.08502 125.194 0.59885 -932.523 2705.3940.00090 200 0.46642 0.06078 0.43487 0.81205 0.07606 0.09292 0.13819 0.08316 158.375 0.98030 762.886 660.9230.00360 300 0.54644 0.07652 0.53007 0.79778 0.25578 0.10324 0.68276 0.15351 366.091 1.15807 1304.465 232.7400.00811 400 0.56741 0.08310 0.87753 0.86335 0.30228 0.09976 1.14199 0.09749 436.116 0.77211 1092.205 102.5520.01317 500 0.27516 0.07430 1.93368 0.78453 0.26051 0.09440 1.28378 0.10915 199.122 0.66591 507.439 90.6480.02627 600 0.27405 0.09009 3.02481 0.91228 0.38456 0.14222 3.31893 0.10776 239.147 0.57429 281.200 44.6460.09523 800 0.63358 0.10063 29.03869 1.33303 0.30490 0.10448 17.47026 0.27456 1249.179 1.52167 351.555 10.2690.22598 1000 0.35435 0.10266 73.39588 1.23220 0.36581 0.08888 33.12819 0.18856 1910.148 2.26026 318.207 5.1890.37460 1200 0.06480 0.09374 89.39352 2.03860 0.03010 0.07742 37.65530 0.23920 1915.115 1.86953 295.866 4.3560.59177 1600 -0.05725 0.09880 129.01470 0.85054 0.24424 0.06813 55.02280 0.13263 2820.854 2.09256 302.487 2.9500.72665 2000 0.20760 0.08301 81.60987 1.19462 0.07805 0.12371 34.17334 0.23001 1741.914 1.50152 289.498 4.3070.83570 2600 0.14100 0.09068 62.22795 1.10814 0.09265 0.07095 27.63074 0.23884 1400.348 1.53386 289.472 5.7680.92266 3200 0.15508 0.09045 49.24869 0.75041 0.07098 0.07502 22.03106 0.14112 1145.820 1.01463 293.581 6.8131.00000 4000 0.30288 0.10662 39.56204 0.88287 0.05033 0.09750 19.59561 0.17343 1029.726 1.64532 282.980 9.089
J= 0.00353943 +/- 0.00000770415 tot.gas.age= 301.572 +/- 2.495
J= 0.00353943 +/- 0.00000770415 tot.gas.age= 330.221 +/- 1.027
tot.gas.age= 287.469 +/- 1.163J= 0.00353943 +/- 0.00000770415
J= 0.00353943 +/- 0.00000770415 tot.gas.age= 328.52 +/- 1.075
J= 0.00353943 +/- 0.00000770415 tot.gas.age= 310.412 +/- 2.282
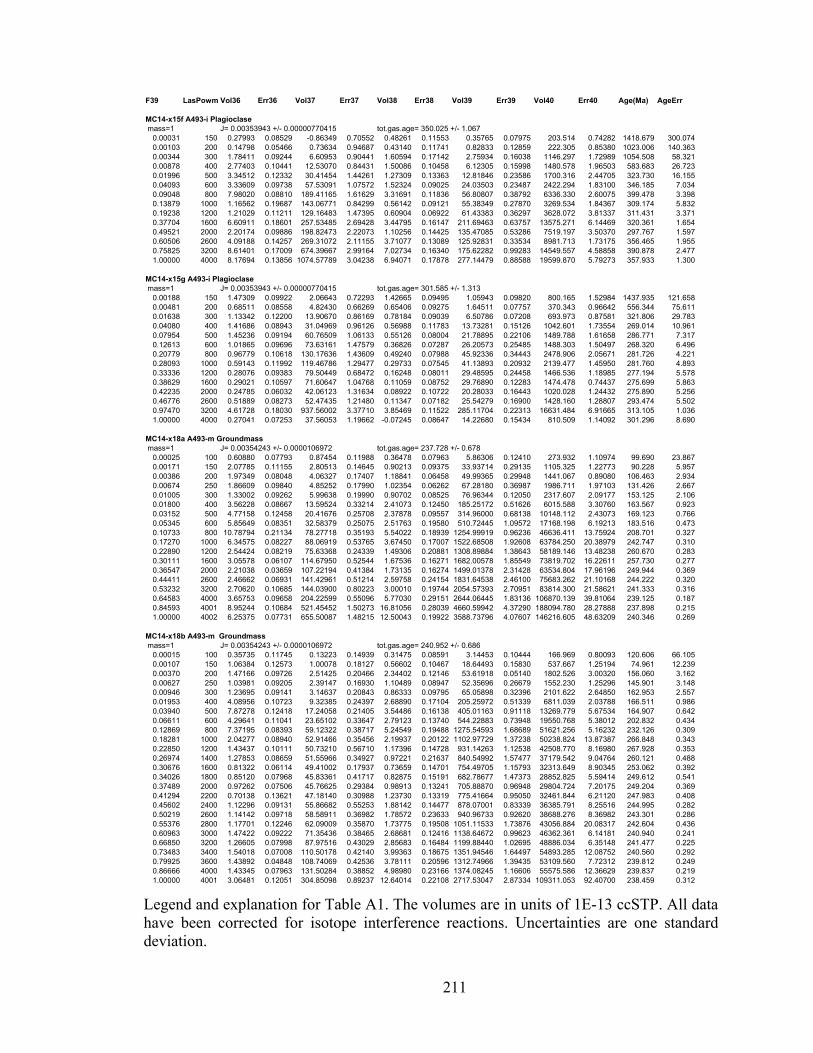
211
F39 LasPowmWVol36 Err36 Vol37 Err37 Vol38 Err38 Vol39 Err39 Vol40 Err40 Age(Ma) AgeErr
MC14-x15f A493-i Plagioclase mass=1
0.00031 150 0.27993 0.08529 -0.86349 0.70552 0.48261 0.11553 0.35765 0.07975 203.514 0.74282 1418.679 300.0740.00103 200 0.14798 0.05466 0.73634 0.94687 0.43140 0.11741 0.82833 0.12859 222.305 0.85380 1023.006 140.3630.00344 300 1.78411 0.09244 6.60953 0.90441 1.60594 0.17142 2.75934 0.16038 1146.297 1.72989 1054.508 58.3210.00878 400 2.77403 0.10441 12.53070 0.84431 1.50086 0.10458 6.12305 0.15998 1480.578 1.96503 583.683 26.7230.01996 500 3.34512 0.12332 30.41454 1.44261 1.27309 0.13363 12.81846 0.23586 1700.316 2.44705 323.730 16.1550.04093 600 3.33609 0.09738 57.53091 1.07572 1.52324 0.09025 24.03503 0.23487 2422.294 1.83100 346.185 7.0340.09048 800 7.98020 0.08810 189.41165 1.61629 3.31691 0.11836 56.80807 0.38792 6336.330 2.60075 399.478 3.3980.13879 1000 1.16562 0.19687 143.06771 0.84299 0.56142 0.09121 55.38349 0.27870 3269.534 1.84367 309.174 5.8320.19238 1200 1.21029 0.11211 129.16483 1.47395 0.60904 0.06922 61.43383 0.36297 3628.072 3.81337 311.431 3.3710.37704 1600 6.60911 0.18601 257.53485 2.69428 3.44795 0.16147 211.69463 0.63757 13575.271 6.14469 320.361 1.6540.49521 2000 2.20174 0.09886 198.82473 2.22073 1.10256 0.14425 135.47085 0.53286 7519.197 3.50370 297.767 1.5970.60506 2600 4.09188 0.14257 269.31072 2.11155 3.71077 0.13089 125.92831 0.33534 8981.713 1.73175 356.465 1.9550.75825 3200 8.61401 0.17009 674.39667 2.99164 7.02734 0.16340 175.62282 0.99283 14549.557 4.58858 390.878 2.4771.00000 4000 8.17694 0.13856 1074.57789 3.04238 6.94071 0.17878 277.14479 0.88588 19599.870 5.79273 357.933 1.300
MC14-x15g A493-i Plagioclase mass=1
0.00188 150 1.47309 0.09922 2.06643 0.72293 1.42665 0.09495 1.05943 0.09820 800.165 1.52984 1437.935 121.6580.00481 200 0.68511 0.08558 4.82430 0.66269 0.65406 0.09275 1.64511 0.07757 370.343 0.96642 556.344 75.6110.01638 300 1.13342 0.12200 13.90670 0.86169 0.78184 0.09039 6.50786 0.07208 693.973 0.87581 321.806 29.7830.04080 400 1.41686 0.08943 31.04969 0.96126 0.56988 0.11783 13.73281 0.15126 1042.601 1.73554 269.014 10.9610.07954 500 1.45236 0.09194 60.76509 1.06133 0.55126 0.08004 21.78895 0.22106 1489.788 1.61658 286.771 7.3170.12613 600 1.01865 0.09696 73.63161 1.47579 0.36826 0.07287 26.20573 0.25485 1488.303 1.50497 268.320 6.4960.20779 800 0.96779 0.10618 130.17636 1.43609 0.49240 0.07988 45.92336 0.34443 2478.906 2.05671 281.726 4.2210.28093 1000 0.59143 0.11992 119.46786 1.29477 0.29733 0.07545 41.13893 0.20932 2139.477 1.45950 281.760 4.8930.33336 1200 0.28076 0.09383 79.50449 0.68472 0.16248 0.08011 29.48595 0.24458 1466.536 1.18985 277.194 5.5780.38629 1600 0.29021 0.10597 71.60647 1.04768 0.11059 0.08752 29.76890 0.12283 1474.478 0.74437 275.699 5.8630.42235 2000 0.24785 0.06032 42.06123 1.31634 0.08922 0.10722 20.28033 0.16443 1020.028 1.24432 275.890 5.2560.46776 2600 0.51889 0.08273 52.47435 1.21480 0.11347 0.07182 25.54279 0.16900 1428.160 1.28807 293.474 5.5020.97470 3200 4.61728 0.18030 937.56002 3.37710 3.85469 0.11522 285.11704 0.22313 16631.484 6.91665 313.105 1.0361.00000 4000 0.27041 0.07253 37.56053 1.19662 -0.07245 0.08647 14.22680 0.15434 810.509 1.14092 301.296 8.690
MC14-x18a A493-m Groundmass mass=1
0.00025 100 0.60880 0.07793 0.87454 0.11988 0.36478 0.07963 5.86306 0.12410 273.932 1.10974 99.690 23.8670.00171 150 2.07785 0.11155 2.80513 0.14645 0.90213 0.09375 33.93714 0.29135 1105.325 1.22773 90.228 5.9570.00386 200 1.97349 0.08048 4.06327 0.17407 1.18841 0.06458 49.99365 0.29948 1441.067 0.89080 106.463 2.9340.00674 250 1.86609 0.09840 4.85252 0.17990 1.02354 0.06262 67.28180 0.36987 1986.711 1.97103 131.426 2.6670.01005 300 1.33002 0.09262 5.99638 0.19990 0.90702 0.08525 76.96344 0.12050 2317.607 2.09177 153.125 2.1060.01800 400 3.56228 0.08667 13.59524 0.33214 2.41073 0.12450 185.25172 0.51626 6015.588 3.30760 163.567 0.9230.03152 500 4.77158 0.12458 20.41676 0.25708 2.37878 0.09557 314.96000 0.68138 10148.112 2.43073 169.123 0.7660.05345 600 5.85649 0.08351 32.58379 0.25075 2.51763 0.19580 510.72445 1.09572 17168.198 6.19213 183.516 0.4730.10733 800 10.78794 0.21134 78.27718 0.35193 5.54022 0.18939 1254.99919 0.96236 46636.411 13.75924 208.701 0.3270.17270 1000 6.34575 0.08227 88.06919 0.53765 3.67450 0.17007 1522.68508 1.92608 63784.250 20.38979 242.747 0.3100.22890 1200 2.54424 0.08219 75.63368 0.24339 1.49306 0.20881 1308.89884 1.38643 58189.146 13.48238 260.670 0.2830.30111 1600 3.05578 0.06107 114.67950 0.52544 1.67536 0.16271 1682.00578 1.85549 73819.702 16.22611 257.730 0.2770.36547 2000 2.21038 0.03659 107.22194 0.41384 1.73135 0.16274 1499.01378 2.31428 63534.804 17.96196 249.944 0.3690.44411 2600 2.46662 0.06931 141.42961 0.51214 2.59758 0.24154 1831.64538 2.46100 75683.262 21.10168 244.222 0.3200.53232 3200 2.70620 0.10685 144.03900 0.80223 3.00010 0.19744 2054.57393 2.70951 83814.300 21.58621 241.333 0.3160.64583 4000 3.65753 0.09658 204.22599 0.55096 5.77030 0.29151 2644.06445 1.83136 106870.139 39.81064 239.125 0.1870.84593 4001 8.95244 0.10684 521.45452 1.50273 16.81056 0.28039 4660.59942 4.37290 188094.780 28.27888 237.898 0.2151.00000 4002 6.25375 0.07731 655.50087 1.48215 12.50043 0.19922 3588.73796 4.07607 146216.605 48.63209 240.346 0.269
MC14-x18b A493-m Groundmass mass=1
0.00015 100 0.35735 0.11745 0.13223 0.14939 0.31475 0.08591 3.14453 0.10444 166.969 0.80093 120.606 66.1050.00107 150 1.06384 0.12573 1.00078 0.18127 0.56602 0.10467 18.64493 0.15830 537.667 1.25194 74.961 12.2390.00370 200 1.47166 0.09726 2.51425 0.20466 2.34402 0.12146 53.61918 0.05140 1802.526 3.00320 156.060 3.1620.00627 250 1.03981 0.09205 2.39147 0.16930 1.10489 0.08947 52.35696 0.26679 1552.230 1.25296 145.901 3.1480.00946 300 1.23695 0.09141 3.14637 0.20843 0.86333 0.09795 65.05898 0.32396 2101.622 2.64850 162.953 2.5570.01953 400 4.08956 0.10723 9.32385 0.24397 2.68890 0.17104 205.25972 0.51339 6811.039 2.03788 166.511 0.9860.03940 500 7.87278 0.12418 17.24058 0.21405 3.54486 0.16138 405.01163 0.91118 13269.779 5.67534 164.907 0.6420.06611 600 4.29641 0.11041 23.65102 0.33647 2.79123 0.13740 544.22883 0.73948 19550.768 5.38012 202.832 0.4340.12869 800 7.37195 0.08393 59.12322 0.38717 5.24549 0.19488 1275.54593 1.68689 51621.256 5.16232 232.126 0.3090.18281 1000 2.04277 0.08940 52.91466 0.35456 2.19937 0.20122 1102.97729 1.37238 50238.824 13.87387 266.848 0.3430.22850 1200 1.43437 0.10111 50.73210 0.56710 1.17396 0.14728 931.14263 1.12538 42508.770 8.16980 267.928 0.3530.26974 1400 1.27853 0.08659 51.55966 0.34927 0.97221 0.21637 840.54992 1.57477 37179.542 9.04764 260.121 0.4880.30676 1600 0.81322 0.06114 49.41002 0.17937 0.73659 0.14701 754.49705 1.15793 32313.649 8.90345 253.062 0.3920.34026 1800 0.85120 0.07968 45.83361 0.41717 0.82875 0.15191 682.78677 1.47373 28852.825 5.59414 249.612 0.5410.37489 2000 0.97262 0.07506 45.76625 0.29384 0.98913 0.13241 705.88870 0.96948 29804.724 7.20175 249.204 0.3690.41294 2200 0.70138 0.13621 47.18140 0.30988 1.23730 0.13319 775.41664 0.95050 32461.844 6.21120 247.983 0.4080.45602 2400 1.12296 0.09131 55.86682 0.55253 1.88142 0.14477 878.07001 0.83339 36385.791 8.25516 244.995 0.2820.50219 2600 1.14142 0.09718 58.58911 0.36982 1.78572 0.23633 940.96733 0.92620 38688.276 8.36982 243.301 0.2860.55376 2800 1.17701 0.12246 62.09009 0.35870 1.73775 0.19508 1051.11533 1.73876 43056.884 20.08317 242.604 0.4360.60963 3000 1.47422 0.09222 71.35436 0.38465 2.68681 0.12416 1138.64672 0.99623 46362.361 6.14181 240.940 0.2410.66850 3200 1.26605 0.07998 87.97516 0.43029 2.85683 0.16484 1199.88440 1.02695 48886.034 6.35148 241.477 0.2250.73483 3400 1.54018 0.07008 110.50178 0.42140 3.99363 0.18675 1351.94546 1.64497 54893.285 12.08752 240.560 0.2920.79925 3600 1.43892 0.04848 108.74069 0.42536 3.78111 0.20596 1312.74966 1.39435 53109.560 7.72312 239.812 0.2490.86666 4000 1.43345 0.07963 131.50284 0.38852 4.98980 0.23166 1374.08245 1.16606 55575.586 12.36629 239.837 0.2191.00000 4001 3.06481 0.12051 304.85098 0.89237 12.64014 0.22108 2717.53047 2.87334 109311.053 92.40700 238.459 0.312
J= 0.00353943 +/- 0.00000770415 tot.gas.age= 350.025 +/- 1.067
J= 0.00354243 +/- 0.0000106972 tot.gas.age= 240.952 +/- 0.686
J= 0.00353943 +/- 0.00000770415 tot.gas.age= 301.585 +/- 1.313
J= 0.00354243 +/- 0.0000106972 tot.gas.age= 237.728 +/- 0.678
Legend and explanation for Table A1. The volumes are in units of 1E-13 ccSTP. All data have been corrected for isotope interference reactions. Uncertainties are one standard deviation.
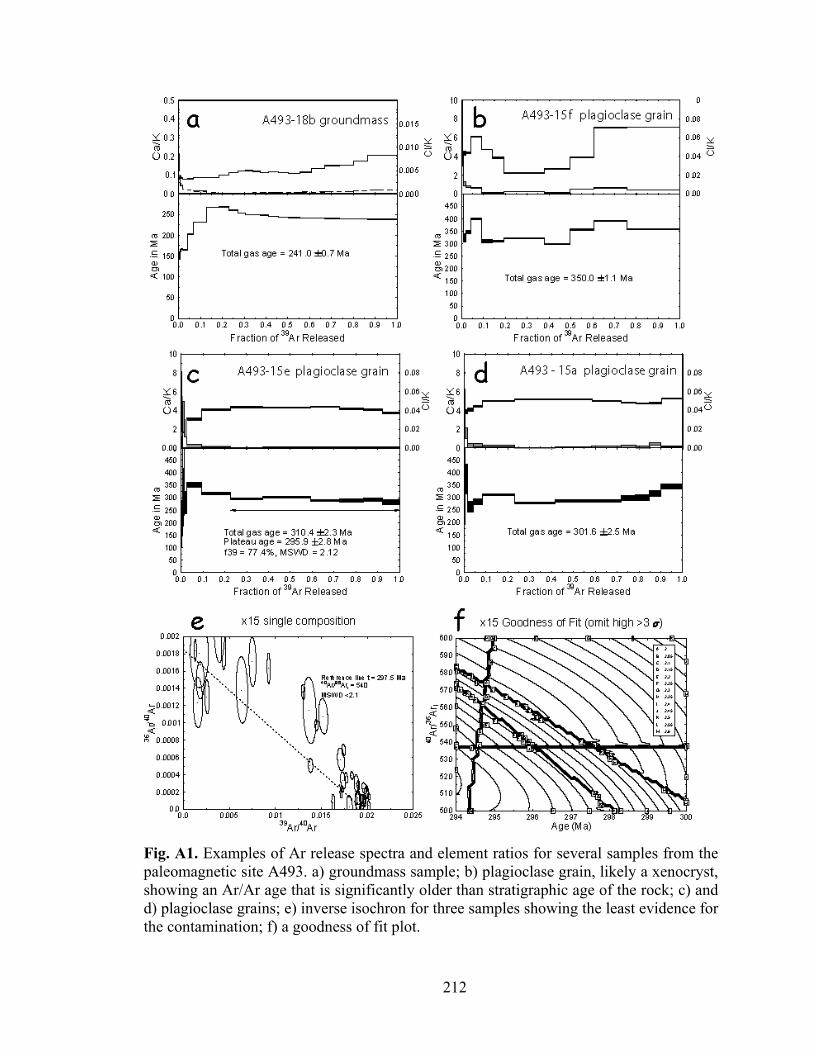
212
Fig. A1. Examples of Ar release spectra and element ratios for several samples from the paleomagnetic site A493. a) groundmass sample; b) plagioclase grain, likely a xenocryst, showing an Ar/Ar age that is significantly older than stratigraphic age of the rock; c) and d) plagioclase grains; e) inverse isochron for three samples showing the least evidence for the contamination; f) a goodness of fit plot.
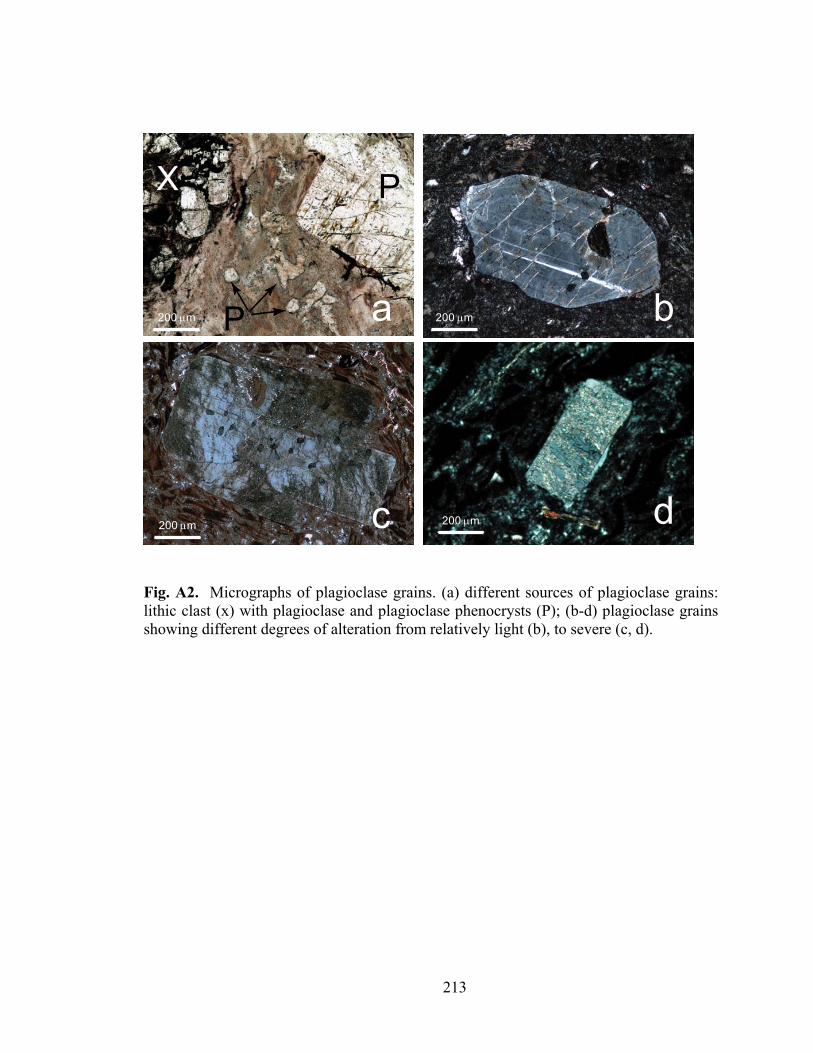
213
X P
P a b
c d200 μm 200 μm
200 μm200 μm
Fig. A2. Micrographs of plagioclase grains. (a) different sources of plagioclase grains: lithic clast (x) with plagioclase and plagioclase phenocrysts (P); (b-d) plagioclase grains showing different degrees of alteration from relatively light (b), to severe (c, d).
214
References Fleck, R.J., Mattinson, J.M., Busby, C.J., Carr, M.D., Davis, G.A., Burchfiel, B.C. 1994.
Isotopic complexities and the age of the Delfonte volcanic rocks, eastern Mescal Range, southeastern California; stratigraphic and tectonic implications. Geological Society of America Bulletin, 106 (10), 1242-1253.
Gansecki, C.A., Mahood, G.A., McWilliams, M.O. 1996. 40 Ar/ 39Ar geochronology of rhyolites erupted following collapse of the Yellowstone Caldera, Yellowstone Plateau volcanic field; implications for crustal contamination. Earth and Planetary Science Letters, 142 (1-2), 91-108.
Hall, C.M., Kesler, S.E., Simon, G. and Fortuna, J., 2000, Overlapping Cretaceous and Eocene Alteration, Twin Creeks Carlin-Type Deposit, Nevada. Economical. Geology., 95, 1739-1752.
Miller, J.S., Heizler, M.T., Miller, C.F. 1998. Timing of magmatism, basin formation, and tilting at the west edge of the Colorado River extensional corridor; results from single-crystal 40Ar/ 39Ar geochronology of Tertiary rocks in the Old Woman Mountains area, southeastern California. Journal of Geology, 106 (2), 195-209.
Samson, S.D. and Alexander, E.C., 1987, Calibration of the interlaboratory 40Ar-39Ar dating standard, MMhb-1. Chemical Geology, 66, 27-34.
Smith, M.E., Singer, B., Carroll, A. 2003. 40Ar/ 39Ar geochronology of the Eocene Green River Formation, Wyoming. Geological Society of America Bulletin, 115 (5), 549-565.
Spell, T. L., Smith, E.I., Sanford, A., Zanetti, K.A. 2001. Systematics of xenocrystic contamination; preservation of discrete feldspar populations at McCullough Pass Caldera revealed by 40Ar/ 39Ar dating. Earth and Planetary Science Letters, 190 (3-4), 153-165.
215
Appendix B
Overview of previous studies on stability of iron (oxyhydr)oxides towards reductive dissolution
For a good review on dissolution studies of magnetic minerals see Cornell and
Schwertmann, (2003). The next section only briefly summarizes information relevant to
our study. Dissolution behavior of iron oxides has been studied extensively, but most of
those studies were aimed primarily at elucidating the main principles of dissolution
mechanisms and factors controlling the rate of the reaction (Cornell and Schwertmann,
2003, and references herein). The common approach in dissolution studies is to add
known chemical reagents or bacterial cultures to a known iron oxide (usually a single-
phase suspension, or a mixture of minerals with widely differing reactivities) and monitor
the change in iron released into the solution. The data (the concentration of the Fe2+ in the
solution as a function of time) then is tested against several theoretical models
(concentration or a surface-controlled diffusion, etc.). As criteria of suitability of the
particular model, the correlation coefficient between measured and predicted values is
usually used. According to a chosen model, a parameter related to stability, either a rate
constant or a half-life can be calculated for a specific iron oxide mineral and specific
experimental conditions.
It has been well established that multiple factors influence the rate of dissolution
of Fe oxides, among them temperature, composition of the solution (pH, concentration of
acids, reductant and complexing agents), and properties of the oxide (specific surface
area, stoichiometry, crystal habit, presence of defects or guest ions). Currently, there are
no models that take all of these factors into account. In general, only the specific surface
area, the composition of the solution and in some cases the tendency of the ions in the
216
solution to form surface complexes are considered. Even when those factors are included
into calculations, they are, by necessity, simplified. For example, the change in the
specific surface area during dissolution is modeled on the assumption of what is called
shape-preserving dissolution. Each crystal face is assigned its own dissolution rate, and
during dissolution, the reacting interface is considered as moving inwards at a constant
rate, thus preserving the overall shape of the oxide crystal. As laboratory studies have
shown, this is rarely the case (e.g. Schwertmann, 1984).
There are a number of rate equations that are commonly applied to dissolution
processes (Brown et al., 1980). Often, the data obtained during the laboratory
experiments could either fit reasonably well by more than one physical model or by none
of them, suggesting that an apparent rate law is the result of the interaction between
several counterbalancing processes (Cornell and Schwertmann, 2003). Thus, there is a
significant uncertainty in an absolute value of a stability parameter, calculation of which
depends on the physical model chosen.
According to previous studies (see a review in Cornell and Schwernmann, 2003),
iron oxides could be divided into two groups based on their reactivity. Poorly-crystalline
oxides such as ferrihydrite, lepidocrocite, and green rust have rate constants ~two orders
of magnitude higher than well-crystalline oxides, magnetite, hematite and goethite. The
relative stabilities of the last group are poorly defined, especially those of goethite and
hematite. Although goethite and hematite have similar thermodynamic stabilities, their
dissolution rates relative to each other and to magnetite can vary significantly depending
simply on whether the rates are expressed in terms of surface area (goethite < hematite <
magnetite), or in terms of mass (hematite < magnetite < goethite) (e.g. Poulton et al.,
2004). It is not clear how applicable these stability schemes are to rock magnetic studies,
as magnetic properties of mineral grains depend on both their volume and shape.
References Cornell, R. M., Schwertmann, U. 2003. The iron oxides: structure, properties, reactions,
occurrences, and uses. Weinheim: Wiley-VCH, 664 pp.
Schwertmann, 1984. The influence of aluminiun on iron oxides. IX. Dissolution of Al-goethites in 6 M HCl. Clay minerals, 19, 9-19.
217
Brown, W.E.B., Dollimore, D. and Galwey, A.K. 1980. Reactions in the solid state. In: Bamford, C.H. and Tipper, C.F.H. (eds.) Comprehensive chemical kinetics. Elsevier Amsterdam, 22, 41-109.
Poulton, S.W., Krom, M.D., Raiswell, R. 2004. A revised scheme for the reactivity of iron (oxyhydr)oxide minerals towards dissolved sulfide. Geochimica et Cosmochimica Acta, 68(18), 3703-3715.

![U-Pb Detrital Zircon Geochronology of Late Triassic to Early … · 2019-06-25 · China and Tarim cratons [1] (Figure 1A). As the eastern margin of the Kazakhstan orocline, the western](https://img.pdfslide.net/doc/110x75/5f8561a246c6af41b70c5125/u-pb-detrital-zircon-geochronology-of-late-triassic-to-early-2019-06-25-china.jpg)