Embed Size (px)
Citation preview
Magnetized particle transport in multi-MA accelerators
N. Bennett ,1 D. R. Welch,2 G. Laity,1 D. V. Rose ,2 and M. E. Cuneo11Sandia National Laboratories, Albuquerque, New Mexico 87185, USA
2Voss Scientific, LLC, Albuquerque, New Mexico 87108, USA
(Received 19 February 2021; accepted 1 June 2021; published 23 June 2021)
Kinetic simulations of Sandia National Laboratories’ Z machine are conducted to understand particletransport in the highly magnetized environment of a multi-MA accelerator. Joule heating leads to the rapidformation of electrode surface plasmas. These plasmas are implicated in reducing accelerator efficiencyby diverting current away from the load [M.R. Gomez et al., Phys. Rev. Accel. Beams 20, 010401 (2017),N. Bennett et al., Phys. Rev. Accel. Beams 22, 120401 (2019)]. The fully-relativistic, electromagneticsimulations presented in this paper show that particles emitted in a space-charge-limited manner, in theabsence of plasma, are magnetically insulated. However, in the presence of plasma, particles are transportedacross the magnetic field in spite of being only weakly collisional. The simulated cross-gap currents arewell-approximated by the Hall current in the generalized Ohm’s law. The Hall conductivities are calculatedusing the simulated particle densities and energies, and the parameters that increase the Hall current arerelated to transmission line inductance. Analogous to the generalized Ohm’s law, we extend the derivationof the magnetized diffusion coefficients to include the coupling of perpendicular components. These yield aHall diffusion rate, which is equivalent to the empirical Bohm diffusion.
DOI: 10.1103/PhysRevAccelBeams.24.060401
I. INTRODUCTION
The pulsed-power TW-class accelerators driving fastZ-pinch experiments generate magnetic fields of 100–1000 T by transporting multi-MA currents to mm-diameterloads [1,2]. These high current densities create a chargedparticle environment in the accelerator transmission linesthat is significantly denser (1015–1017 cm−3 [3,4]) thanfound in kA-scale accelerators (1010–1012 cm−3 [5–7]).While kA-class accelerators typically transition from vac-uum operation to magnetically insulated transmission lines(MITLs) during the pulse, multi-MA accelerators progressfrom vacuum to MITL to dense electrode plasma formationwithin 10s of ns [8,9]. These unique plasma conditions maydegrade the accelerator performance by shunting currentaway from the load.Surface plasmas form primarily through Joule heating,
with particle energy deposition contributing in somelocations. These plasmas have the potential to reduce thepower coupling to the load at Z-pinch facilities such asthe Z machine at Sandia National Laboratories [10–12],the Primary Test Stand (PTS) at the China Academy of
Engineering Physics [13,14], and the MIG generator at theInstitute of High Current Electronics [15,16].The efficiency in current delivery has been studied for
the Z machine [17] and the PTS [18] using transmission-line-circuit models. While unable to capture particlemotion, these circuit models have increased our under-standing of the electrical coupling of the pulse-formingcomponents to the transmission lines and the magnitudeof power lost in transit to the load. To understandplasma formation and evolution, particle-in-cell (PIC)methods were advanced to model localized Joule heatingand the plasmas resulting from desorbed contaminantsin MA-scale transmission lines [19]. It was found thathigher rates of cathode plasma desorption decreased theeffective transmission line gap and created conditions forpower loss.The PIC electrode-plasma models were further devel-
oped [20] and applied more recently to detailed 2D and3D simulations of the Z machine [9]. These simulationsshowed that in all but the vacuum stage of operation, somesmall fraction of the current is shunted across the trans-mission line gaps. At larger radius in the Z machine, wherethe current density is a few 104–105 A=cm2 and the peakplasma densities are of order 1014 cm−3, unmagnetizedclassical transport accounts for the cross-gap currents. Byclassical transport, we refer to collisional transport unaidedby plasma instabilities. This transport is unmagnetizedprior to magnetic insulation or in the vicinity of magneticnulls [9,21,22].
Published by the American Physical Society under the terms ofthe Creative Commons Attribution 4.0 International license.Further distribution of this work must maintain attribution tothe author(s) and the published article’s title, journal citation,and DOI.
PHYSICAL REVIEW ACCELERATORS AND BEAMS 24, 060401 (2021)
2469-9888=21=24(6)=060401(14) 060401-1 Published by the American Physical Society
At the smallest radii on Z (r ≤ 4.5 cm), where thetransmission line approaches the load, the electrode currentdensity exceeds 106 A=cm2. Here, electrode surface plas-mas form during the pulse rise and evolve a Hall-current-related conductivity that scales with electron density andenables current to cross the gap in the presence of a strongmagnetic field [9].In this paper, we use kinetic simulations of the Z
accelerator to investigate the Hall conductivity in detailand its dominance as the mechanism for cross-gap currentat small radii. We stress that any Hall current is notsimulated in an ad hoc way, but arises from the self-consistent calculations of the current densities, chargedistributions, and fields. The analytical origin of the Hallconductivity is summarized in Sec. II and compared to aderived Hall-current diffusion rate for a magnetized plasma.We show that this Hall-current diffusion scales with themagnetized diffusion rate by the same factor as the Hallconductivity scales with the conductivity perpendicular to amagnetic field. This Hall-diffusion rate is equivalent to theexperimentally derived Bohm diffusion [23].The classical transport enabled by the Hall conduc-
tivity is demonstrated in 2D simulations of a series ofZ-machine experimental configurations in Sec. V.Although the Hall conductivity is derived in a fluiddescription that assumes Maxwell distributions, weextract the densities and electric fields from kineticsimulations (with arbitrary distributions) to calculatethe analogous cross-gap current. This cross-gap currentis also referred to as “current loss” [3]. The experimentalconfigurations modeled include one that was previouslypresented in Ref. [9] and five related geometries that havedifferent anode-cathode (AK) gap widths but similarinitial inductance. Of these, four have a dynamicallyincreasing inductance. These differences enable a furtherexamination of the relationship between load inductanceand current loss [3], discussed in Sec. V C.Details of the simulation particle, field, and surface
heating models that capture the plasma dynamics areprovided in Sec. III. The Z machine and 3D models ofits current-adder region are also described in Sec. III. The3D models are then used in Sec. IV to show magnetizedtransport persists at larger radius (r ≥ 5 cm) such that evenenhanced space-charged-limited (SCL) emission is largelyinsulated.
II. COEFFICIENTS IN MAGNETIZEDTRANSPORT
Particle transport in MA-scale transmission lines occursdespite the presence of very high magnetic fields. Typically,electrode plasmas diffuse across a magnetic field alonga density gradient, via interparticle collisions [24]. Theconductivity and diffusion coefficient transverse to the
magnetic field are reduced by the factor ð1þ ω2c
ν2cÞ−1 [25],
where ωc is the cyclotron frequency and νc is the collisionrate. This factor would prohibit cross-gap transport in theinner MITL of the Z accelerator, where magnetic fieldsexceed 200 T, densities range from 1014–1017 cm−3,and ωc=νc > 104.However, experiments and kinetic simulations have
shown that current is diverted from the load, especiallyin the inner MITL [3,9]. This is explained by the Hallcurrent which arises, in a fluid approximation, from thenondiagonal elements of the second-order conductivitytensor [26]. The Hall conductivity couples the current inone direction to electric field components in two directions.Here, we show that a Hall term also exists in the fluidapproximation for magnetized diffusion when nondiagonalelements are considered. The Hall diffusion rate, like theHall conductivity from the generalized Ohm’s law [27], is
related to unmagnetized transport via ðωc=νcÞ=ð1þ ω2c
ν2cÞ.
Thus, transport perpendicular to the magnetic field isfeasible, even for ωc ≫ νc.The Hall conductivity, σH, arises in the generalized
Ohm’s law presented by Braginskii [27]. The currentdensity, j, is expressed as the sum of components paralleland perpendicular to B plus a Hall term that establishes acurrent perpendicular to both E0 and B [28]:
j ¼ σE0k þ σ⊥E0⊥ þ σHðb × E0⊥Þ:
Here, b ¼ B=B, σ is the conductivity parallel to B, σ⊥ isperpendicular to B, and E0 is the effective electric field inthe ion inertial frame:
E0 ¼ Eþ ðvi ×BÞ þ 1
neeð∇pe −RTÞ;
where ne is the electron density, pe is the electron pressure,RT is the thermal force [Ref. [27] Eq. (2.9)], and electroninertia and viscosity are ignored. The perpendicular andHall-term conductivities relate to σ by [28]
σ ¼ ne2
mνc
σ⊥ ¼ σ
1þ ω2c
ν2c
and;
σH ¼ σ⊥ωc
νc: ð1Þ
Diffusion from the Hall term is explicit in the diffusioncoefficients for magnetized plasmas. To demonstrate, wefollow the derivation found in Ref. [25], which begins withthe particle flux
Γ ¼Z
vfdv ¼ −D∇n: ð2Þ
BENNETT, WELCH, LAITY, ROSE, and CUNEO PHYS. REV. ACCEL. BEAMS 24, 060401 (2021)
060401-2
where D are the diffusion coefficients and the distributionfunction f may be determined from the Boltzmann equation,
∂f∂t þ v ·
∂f∂r þ
Fm·∂f∂v ¼
�∂f∂t
�c: ð3Þ
The collision term in Eq. (3) is assumed a perturbation[24,25] such that
�∂f∂t
�c¼ −νcðf − f0Þ;
which is solved for f ¼ f0 þ f1, with higher order termsneglected.For steady-state magnetized transport, Eq. (3) is linear-
ized to
v ·∂f0∂r þ Ze
mðv ×BÞ · ∂f1∂v ¼ −νcf1: ð4Þ
where B is assumed unperturbed. Then assuming∂n=∂y ¼ 0, E ¼ Exx, B ¼ Bzz, and an initial Maxwelldistribution,
f0 ¼ nðrÞ�
m2πkBT
�3=2
e−mv2=2kBT;
and the components of the flux are
Γx ¼Z �
−1
nνcvxf0vx
∂n∂x −
ωc
νcvxðvyÞ
∂f1∂vx
�d3v
¼ −kBTmνc
∂n∂x þ
ωc
νcΓy; ð5Þ
Γy ¼ −ωc
νcΓx; and ð6Þ
Γz ¼ −kBTmνc
∂n∂z : ð7Þ
Equation (7) is diffusion parallel to B with coefficient
Dk ¼kBTmνc
¼ λ2cνc; ð8Þ
where λc ¼ vthνc is the collisional mean free path.Equations (5) and (6) combine to provide diffusionperpendicular to B:
Γx ¼ −kBT
mνcð1þ ω2c
ν2cÞ∂n∂x ; and
Γy ¼ −ωc
νc
kBT
mνcð1þ ω2c
ν2cÞ∂n∂x ; ð9Þ
yielding
D⊥ ¼ kBT
mνcð1þ ω2c
ν2cÞ¼ Dk
ð1þ ω2c
ν2cÞ
≃mv2νcmω2
c
¼ r2Lνc; ð10Þ
and
DH ¼ kBTωc
mν2cð1þ ω2c
ν2cÞ¼ ωc
νcD⊥
≃kBTmωc
¼ kBTeB
¼ mv2
mωc
¼ r2Lωc; ð11Þ
with the second lines taken in the limit ωc=νc ≫ 1.Equation (11) is the Bohm diffusion coefficient [23].The derivation of D⊥ has long existed, but we have beenunable to locate a derivation that includes Eq. (9). It ispossible that the connection between magnetized diffusion,the empirical Bohm diffusion, and the Hall current has notbeen made previously [29–31]. The relationship betweenBohm diffusion and fast electric field fluctuations has beenidentified [32], and is consistent with the results presentedhere and in Ref. [9].The length scale for Eq. (10) is the Larmor radius (rL)
on the collision time scale. The length scale for Bohmdiffusion is rL on the cyclotron time scale. This faster rate iscomparable to the kinetic solution of the plasma expansionvelocities, shown in Sec. VA.
III. KINETIC MODEL OF THE ZTRANSMISSION LINES
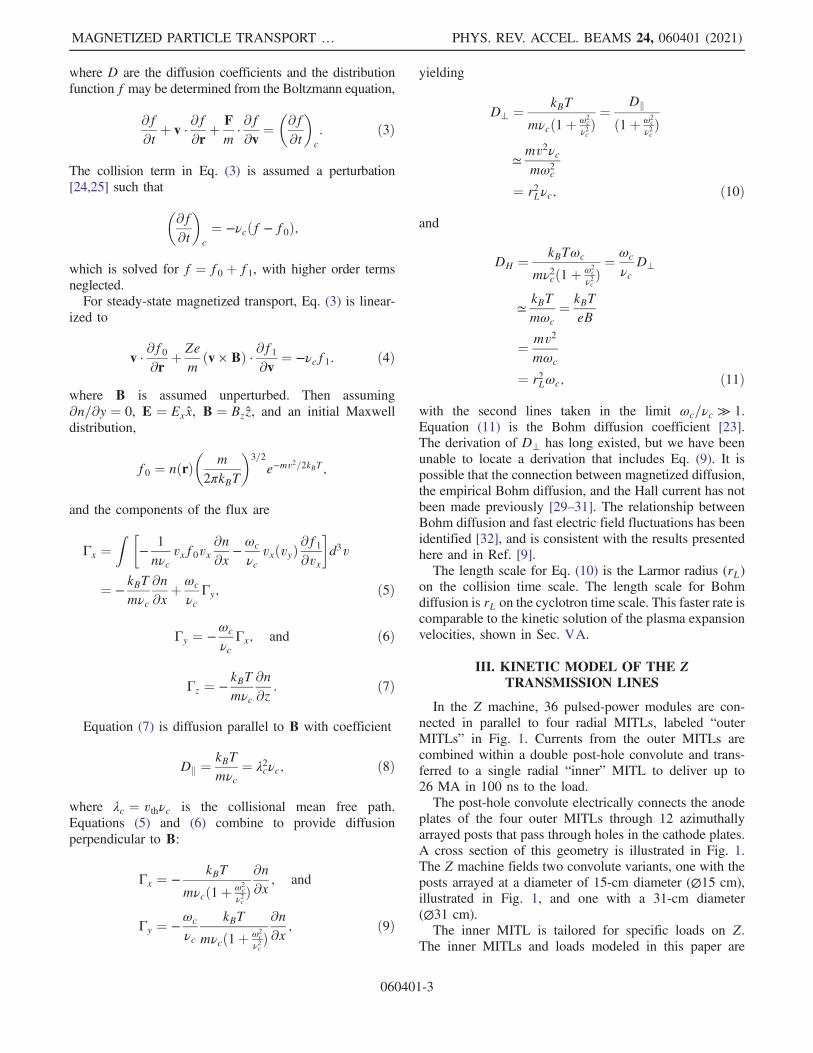
In the Z machine, 36 pulsed-power modules are con-nected in parallel to four radial MITLs, labeled “outerMITLs” in Fig. 1. Currents from the outer MITLs arecombined within a double post-hole convolute and trans-ferred to a single radial “inner” MITL to deliver up to26 MA in 100 ns to the load.The post-hole convolute electrically connects the anode
plates of the four outer MITLs through 12 azimuthallyarrayed posts that pass through holes in the cathode plates.A cross section of this geometry is illustrated in Fig. 1.The Z machine fields two convolute variants, one with theposts arrayed at a diameter of 15-cm diameter (∅15 cm),illustrated in Fig. 1, and one with a 31-cm diameter(∅31 cm).The inner MITL is tailored for specific loads on Z.
The inner MITLs and loads modeled in this paper are
MAGNETIZED PARTICLE TRANSPORT … PHYS. REV. ACCEL. BEAMS 24, 060401 (2021)
060401-3
specifically for power flow study. Each has an axialtransmission line segment at r ¼ 1 cm that is subject tothe highest current densities and rapid surface plasmaformation.To study the generation and evolution of electrode
plasmas, simulations of the Z machine convolute andvarious inner MITL configurations are conducted usingthe fully-relativistic electromagnetic PIC code CHICAGO
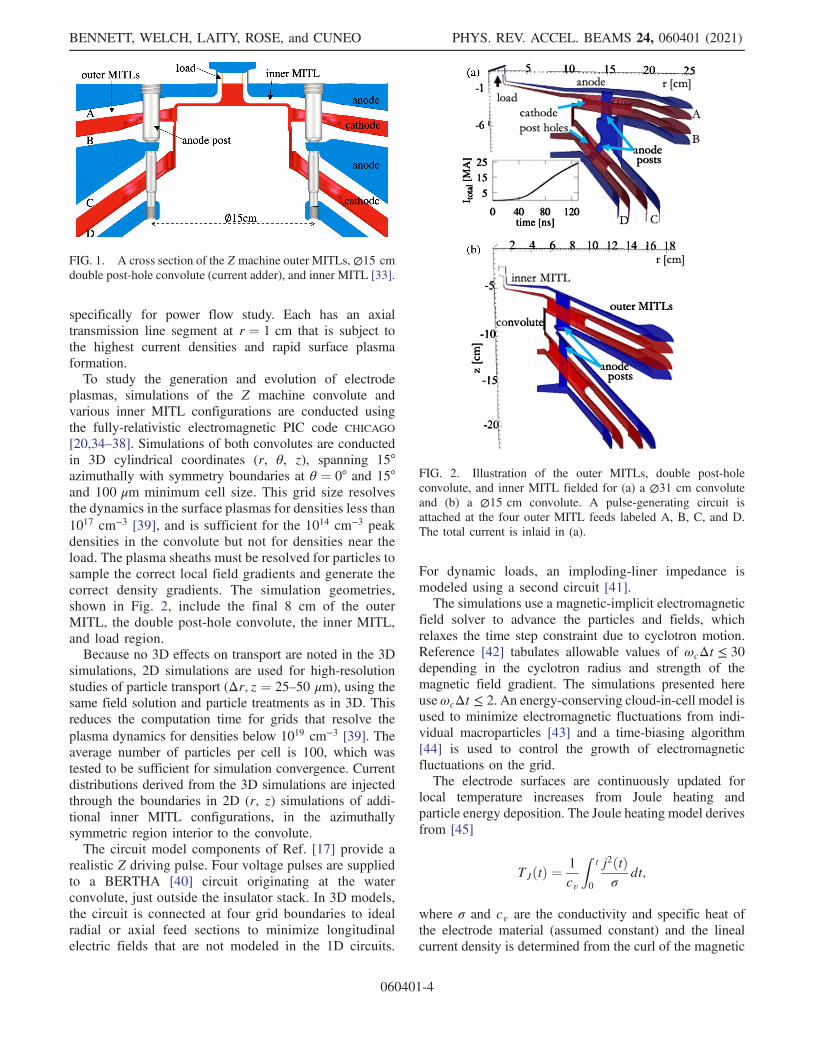
[20,34–38]. Simulations of both convolutes are conductedin 3D cylindrical coordinates (r, θ, z), spanning 15°azimuthally with symmetry boundaries at θ ¼ 0° and 15°and 100 μm minimum cell size. This grid size resolvesthe dynamics in the surface plasmas for densities less than1017 cm−3 [39], and is sufficient for the 1014 cm−3 peakdensities in the convolute but not for densities near theload. The plasma sheaths must be resolved for particles tosample the correct local field gradients and generate thecorrect density gradients. The simulation geometries,shown in Fig. 2, include the final 8 cm of the outerMITL, the double post-hole convolute, the inner MITL,and load region.Because no 3D effects on transport are noted in the 3D
simulations, 2D simulations are used for high-resolutionstudies of particle transport (Δr; z ¼ 25–50 μm), using thesame field solution and particle treatments as in 3D. Thisreduces the computation time for grids that resolve theplasma dynamics for densities below 1019 cm−3 [39]. Theaverage number of particles per cell is 100, which wastested to be sufficient for simulation convergence. Currentdistributions derived from the 3D simulations are injectedthrough the boundaries in 2D (r, z) simulations of addi-tional inner MITL configurations, in the azimuthallysymmetric region interior to the convolute.The circuit model components of Ref. [17] provide a
realistic Z driving pulse. Four voltage pulses are suppliedto a BERTHA [40] circuit originating at the waterconvolute, just outside the insulator stack. In 3D models,the circuit is connected at four grid boundaries to idealradial or axial feed sections to minimize longitudinalelectric fields that are not modeled in the 1D circuits.
For dynamic loads, an imploding-liner impedance ismodeled using a second circuit [41].The simulations use a magnetic-implicit electromagnetic
field solver to advance the particles and fields, whichrelaxes the time step constraint due to cyclotron motion.Reference [42] tabulates allowable values of ωcΔt ≤ 30depending in the cyclotron radius and strength of themagnetic field gradient. The simulations presented hereuseωcΔt ≤ 2. An energy-conserving cloud-in-cell model isused to minimize electromagnetic fluctuations from indi-vidual macroparticles [43] and a time-biasing algorithm[44] is used to control the growth of electromagneticfluctuations on the grid.The electrode surfaces are continuously updated for
local temperature increases from Joule heating andparticle energy deposition. The Joule heating model derivesfrom [45]
TJðtÞ ¼1
cv
Zt
0
j2ðtÞσ
dt;
where σ and cv are the conductivity and specific heat ofthe electrode material (assumed constant) and the linealcurrent density is determined from the curl of the magnetic
FIG. 2. Illustration of the outer MITLs, double post-holeconvolute, and inner MITL fielded for (a) a ∅31 cm convoluteand (b) a ∅15 cm convolute. A pulse-generating circuit isattached at the four outer MITL feeds labeled A, B, C, and D.The total current is inlaid in (a).
FIG. 1. A cross section of the Z machine outer MITLs,∅15 cmdouble post-hole convolute (current adder), and inner MITL [33].
BENNETT, WELCH, LAITY, ROSE, and CUNEO PHYS. REV. ACCEL. BEAMS 24, 060401 (2021)
060401-4
field: jðtÞ ¼ ∂Hðx; tÞ=∂x, where H ¼ B=μ0 and x is thecoordinate normal to the conducting surface cell. Assuminga linearly rising jðtÞ and that magnetic field diffusion isthe dominant contributor over heat conduction, the localtemperature increase is
ΔTJðtÞ ≈ϑμ0H2ðtÞ
2cv; ð12Þ
which is Eq. (5.2-30) from Ref. [45]. The surface energyfactor ϑ ¼ 1.273 (from Table 5.2-II of Ref. [45]) and cv ¼3.9 J=cm3 K for stainless steel [46,47]. As noted inRef. [45], the assumption of constant σ underestimatesthe temperature rise but is valid for small δT=T.Particle energy deposition (dE=ds) is calculated using
the Bethe-Bloch equations for electron and ion energyloss [48]. The path length in a grid cell is ds ¼ dx= cos θ,where dx is the cell depth and θ is the particle angle ofincidence. The temperature increase (TdðtÞ) per macro-particle is then calculated as
ΔTd ¼dEds
qecvA
; ð13Þ
where q is the macroparticle charge, e is the electroncharge, and A is the cell’s surface area.The assumption of constant cv in Eqs. (12) and (13)
overestimates the temperature rise because cv increases35% from 700 to 1727 K for stainless steel [46]. Thesensitivity to the parameters used in Eqs. (12) and (13) weretested in Ref. [9] using simulations in which the desorptionrate was varied by a factor of 6. In this range, there was nochange in the plasma transport.Joule heating melts the electrodes within a 4-cm radius
prior to the z-pinch implosion (Fig. 8 of Ref. [9]). Theimpact of melt on the conductivity and the surface con-taminant constituency and inventory, with potential vapori-zation near the imploding liner, is the focus of a futureinvestigation. The impact on MITL inductance of neglect-ing melt is estimated using magnetohydrodynamic simu-lations [49]. A Z-relevant model of electrodes carrying25 MA from r ¼ 0.3 to 8.0 cm resulted in electrodeexpansion within 1% for r ≥ 2 cm and 3% at r ¼ 1 cm.
A. Particle emission models
Particle emission is modeled as both field and thermalemission of charged particles from the electrode surfacesand thermal desorption of neutral plasma. Electrons areemitted from the cathode after the local electric field stressexceeds the tolerance of the conductor [50,51]. Theemission threshold depends on the material and its prepa-ration, with typical values ranging from 150 to 280 kV=cmas determined when the anode current exceeds the cathodeboundary current [5,6]. A previously tested value of240 kV=cm [19] is used here. Protons are emitted from
the anode after the local surface temperature increases by400 °C [52]. The emission rate for these processes isgoverned by the SCL current density, the nonrelativisticversion of which is [50]:
jCL ¼ 4ϵ09
�2Zem
�1=2 V3=2
0
d2; ð14Þ
where V0 is the voltage drop, d is the AK gap width, m isthe particle mass, and Z is its charge state. An exactrelativistic solution was derived in Ref. [53], the seriesexpansion of which may be written
jrel CL ¼ 2mc3ϵ0Zed2
��ZeVmc2
þ 1
�1=2
− 0.8471
�2
: ð15Þ
Both the high electric field stress near the cathode andthe high temperatures of both electrodes lead to the creationof local surface plasmas. To model plasma formation, aneutral atom or molecule is desorbed from an electrodesurface and immediately fragmented to its atomic constitu-ents and ionized, as in Refs. [54,55], and [9]. Thermalionization [56] is assumed. Previous measurements atSandia have identified hydrogen, oxygen, and carbon asthe primary electrode surface contaminants in the SABREaccelerator [57] and as negative ions in prototypes ofthe Particle Beam Fusion Accelerator [58]. More recentspectral measurements on the Z machine identify hydrogenas the primary plasma constituent [3]. While carbon wasincluded in models in Ref. [55], hydrogen was thedominant contributor to bipolar currents based on mass,as expressed in Eq. (14) and consistent with the conclusionsof Ref. [3]. To reduce the computation time by reducing thenumber of tracked species, we use hydrogen to representlight ions and oxygen to represent heavy ions. The crosssection for O2þ ranges from 1 to 2 orders of magnitude lessthan the first ionization [59], so higher states are neglected.The excitation process is significant at electron energiesbelow ∼40 eV, but ionization dominates above this energyso these processes are also neglected.The H2O molecule and its constituents are tracked as
kinetic species. The molecule is fragmented and sub-sequently ionized according to: H2O → 2Hþ þ Oþ þ 3e.The Arrhenius equation calculates the thermal desorptionrate as a function of the surface density of adsorbedcontaminant particles (nðtÞ):
dnðtÞdt
¼ −νthnðtÞe−E0ðnÞ=ðkBTðtÞÞ; ð16Þ
where νth ∼ 1013 s−1, E0ðnÞ is the effective binding energy,and T is the local surface temperature [57,60]. The surfacedensity is measured in monolayers, n ¼ fnML, wherenML ≡ 1015 particles=cm2 and f is a surface roughnessfactor [61] (f ∼ 8 for average machining of stainless
MAGNETIZED PARTICLE TRANSPORT … PHYS. REV. ACCEL. BEAMS 24, 060401 (2021)
060401-5
steel [62]). The Temkin isotherm model has been shown tocapture the surface-density dependence of E0ðnÞ seen inmolecular dynamics simulations of Fe2O3 lattices [63]:
E0ðnÞ ¼ Ed
�1 − α
nðtÞfnML
�½eV�;
where Ed is the binding energy at infinitesimal coverage, αis determined experimentally. For the values used, Ed ¼1 eV is consistent with molecular dynamics calculationsand α ¼ 0.17 is retained from comparisons of simulatedcurrents to data [9] and to a physics-based transmission-line-circuit model of Z [17]. The initial contaminantinventory on the electrode surfaces, nð0Þ, is taken fromthe surface roughness factor noted above to be 8.3 ML.There is no significance to the decimal place. The simulatedcurrent loss has been shown to be insensitive to valuesbetween 8 and 16 ML [39].
B. Particle interactions
The electrons, ions, and neutrals are all governed bykinetic particle algorithms. Thus, the particles are advancedvia their individual momenta, collision frequencies, andinteraction cross sections, with no assumed distributions.The ionization of neutral particles is expected to occurrapidly due to high electric field stresses, temperatures, andimpact ionization. The electron-ion pairs created in ioniza-tion events are added to their respective kinetic species.Ion-neutral collisions are also handled in binary fashionassuming a hard-sphere collision model.Charged particle collisions use a binary Coulomb colli-
sion model described in Refs. [64] and [65], in whichNanbu’s theory of the cumulative property of Coulombcollisions is applied. Individual particles located within thesame grid cell are paired and a Monte-Carlo algorithmdetermines the effective cumulative Coulomb collisionscattering angle for the pair. The correct local velocitydistribution is sampled over successive time steps.Recent work indicates transport coefficients are modified
in strong magnetic fields [66]. However, the change instopping powers in unmagnetized and strongly magnetizedregimes is ∼25%, and is computationally expensive toextract [67], so modifications to the collision operator aredeferred to future work [68].
IV. ENHANCED ION TRANSPORT INTESLA-SCALE MAGNETIC FIELDS
An enhanced ion current has been proposed as a possiblecurrent loss mechanism in the inner MITL where theelectron flow is adjacent to the anode [17,69]. TheE ×B vectors in the convolute and entrance to the innerMITL create an unusual spatial distribution of flow currentin which the electron and ion sheaths are adjacent tothe upper anode plate entering the inner MITL [9,70].
This configuration could give rise to a negative chargedistribution near the anode that decreases the local electricfield and enables more ion SCL emission (for surfacesexceeding the emission threshold).An enhancement to the Eq. (14) current is analyzed in
Ref. [69], but is limited to a 1D electrostatic solution thatneglects the applied electric field and the magnetic force onthe ions. To quantify a possible enhanced ion emission inthe more realistic models presented in this paper, wedetermine the change in the electric field near the anodesurface due to space charge and its impact on Eq. (14).The expected current densities from Eqs. (14) and (15)
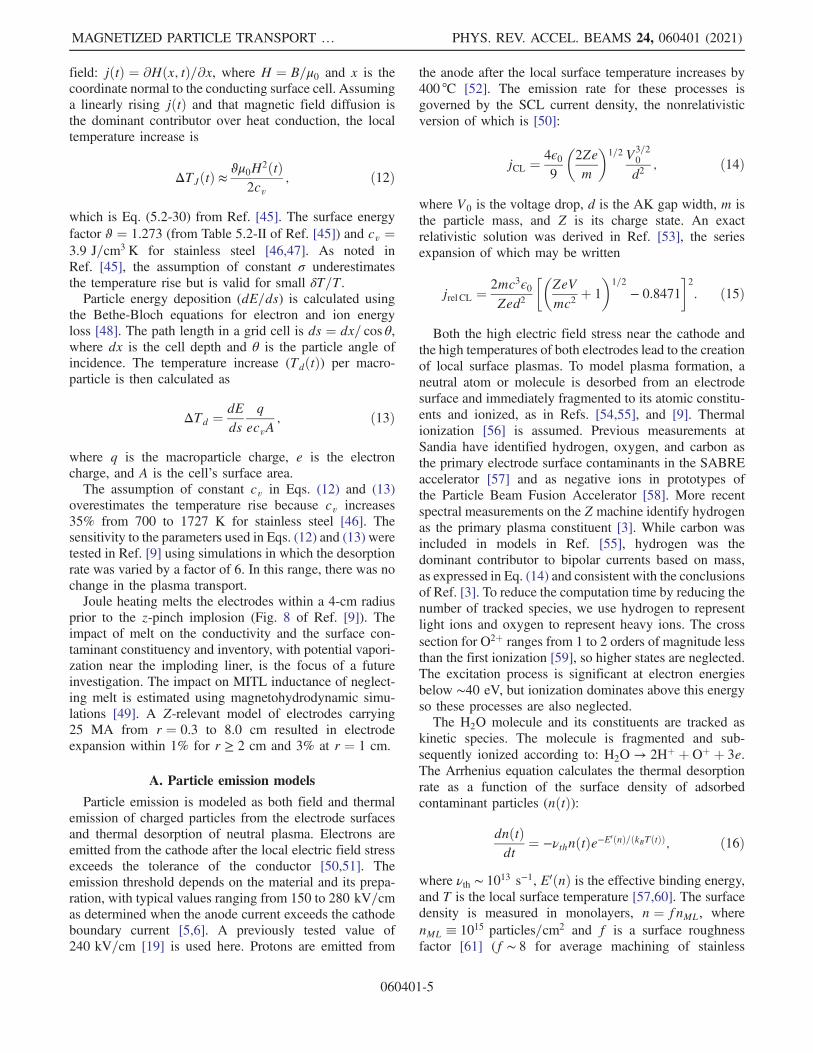
for a 7-mm AK gap [r ∼ 5 cm in Fig. 2(a)] at 0.5–2 MVareplotted in Fig. 3. Simulated electron current densities arealso shown. For more direct comparison to Child-Langmuirtheory, the electrode plasmas are not modeled in thesimulation results in Fig. 3 only. The comparison doesinclude electron and ion emission with accompanyingmagnetic insulation and vortices in the flow.An example of the change in the electric field due to the
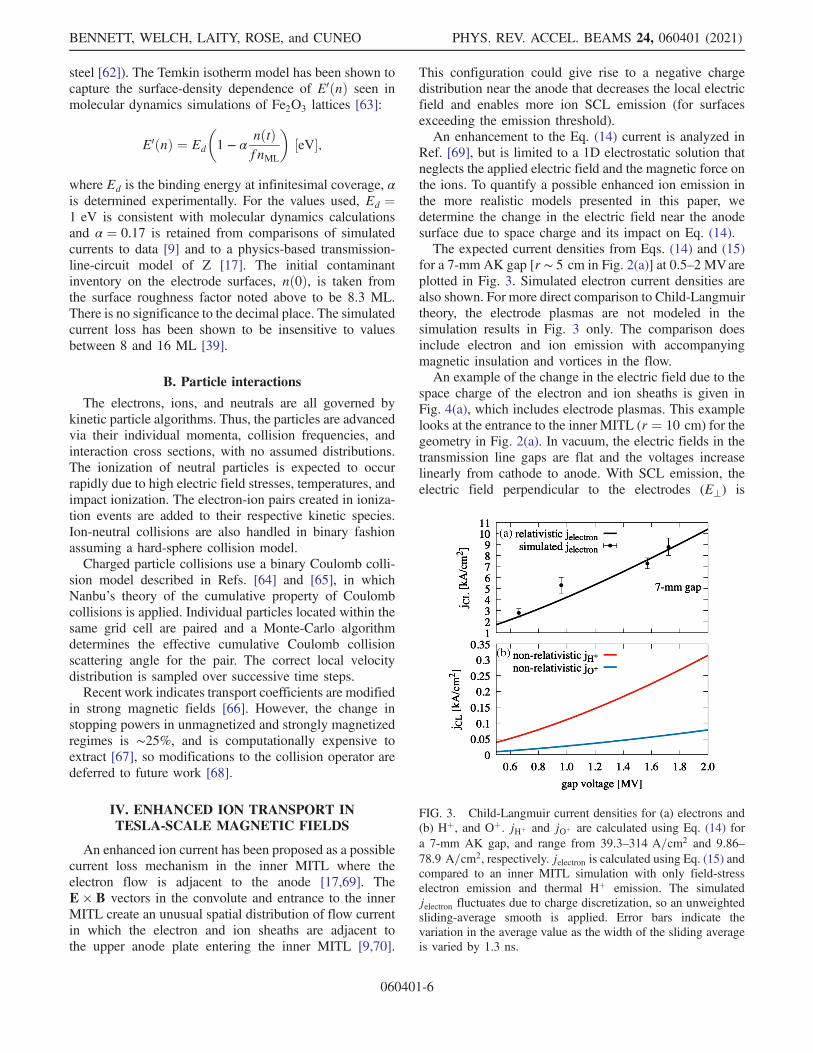
space charge of the electron and ion sheaths is given inFig. 4(a), which includes electrode plasmas. This examplelooks at the entrance to the inner MITL (r ¼ 10 cm) for thegeometry in Fig. 2(a). In vacuum, the electric fields in thetransmission line gaps are flat and the voltages increaselinearly from cathode to anode. With SCL emission, theelectric field perpendicular to the electrodes (E⊥) is
FIG. 3. Child-Langmuir current densities for (a) electrons and(b) Hþ, and Oþ. jHþ and jOþ are calculated using Eq. (14) fora 7-mm AK gap, and range from 39.3–314 A=cm2 and 9.86–78.9 A=cm2, respectively. jelectron is calculated using Eq. (15) andcompared to an inner MITL simulation with only field-stresselectron emission and thermal Hþ emission. The simulatedjelectron fluctuates due to charge discretization, so an unweightedsliding-average smooth is applied. Error bars indicate thevariation in the average value as the width of the sliding averageis varied by 1.3 ns.
BENNETT, WELCH, LAITY, ROSE, and CUNEO PHYS. REV. ACCEL. BEAMS 24, 060401 (2021)
060401-6
neutralized near the cathode and the voltage increase fromcathode to anode appears as a parabola, as in Fig. 2 ofRef. [50]. This is the shape of the voltage in Fig. 4(b) in thecase of surface emission with electrode plasmas. A notabledifference is the change of sign of E⊥ near the cathode dueto positive ion charge.To use E⊥ from Fig. 4 to estimate the enhancement to the
ion current in Eq. (14), we determine an effective gapwidth, deff ¼ V0=E⊥ using E⊥ near the anode. At 60 nsinto the current pulse shown in Fig. 2(a), deff ∼ d=3 leadingto a factor of 9 enhancement. Applying this to Hþ at1.9 MV in a 8-mm gap, where jCL ¼ 223 A=cm2, theenhancement could lead to over 600 kA of loss interior tothe ∅31 cm convolute [71]. However, three physicalprocesses mitigate this effect: magnetic insulation, cathodeplasma formation, and their space-charge impact on E⊥.As this system evolves, the ions emitted from the anode
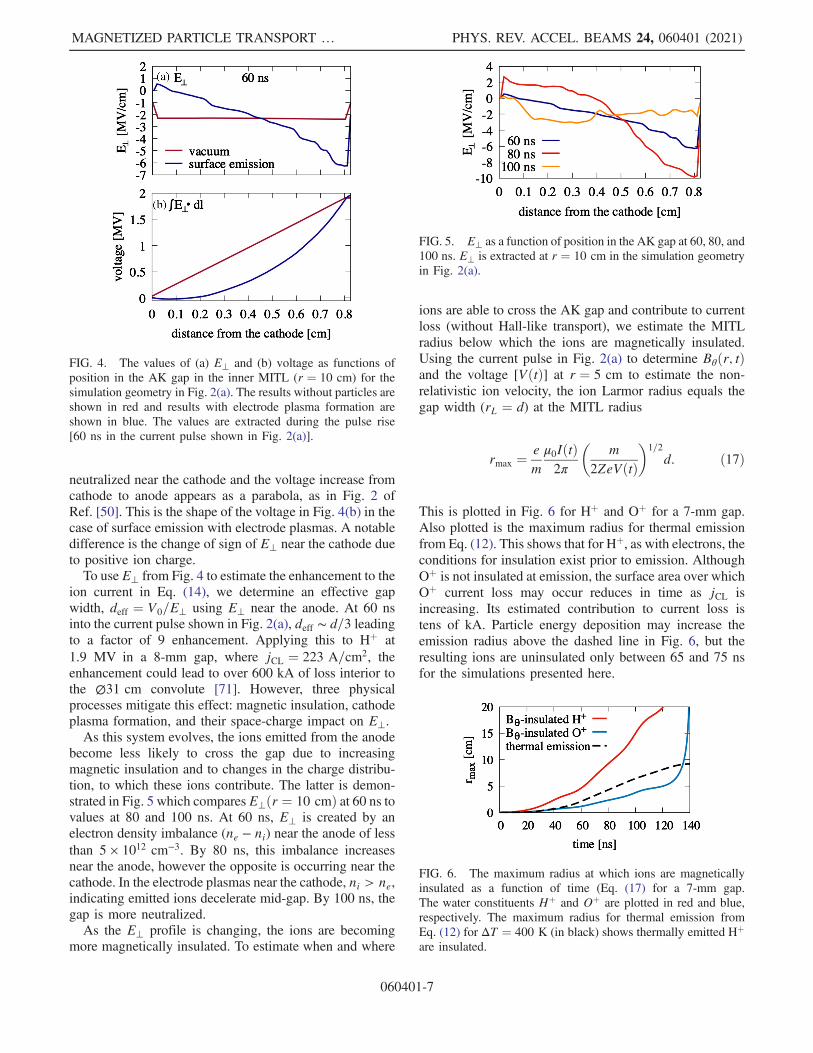
become less likely to cross the gap due to increasingmagnetic insulation and to changes in the charge distribu-tion, to which these ions contribute. The latter is demon-strated in Fig. 5 which comparesE⊥ðr ¼ 10 cmÞ at 60 ns tovalues at 80 and 100 ns. At 60 ns, E⊥ is created by anelectron density imbalance (ne − ni) near the anode of lessthan 5 × 1012 cm−3. By 80 ns, this imbalance increasesnear the anode, however the opposite is occurring near thecathode. In the electrode plasmas near the cathode, ni > ne,indicating emitted ions decelerate mid-gap. By 100 ns, thegap is more neutralized.As the E⊥ profile is changing, the ions are becoming
more magnetically insulated. To estimate when and where
ions are able to cross the AK gap and contribute to currentloss (without Hall-like transport), we estimate the MITLradius below which the ions are magnetically insulated.Using the current pulse in Fig. 2(a) to determine Bθðr; tÞand the voltage [VðtÞ] at r ¼ 5 cm to estimate the non-relativistic ion velocity, the ion Larmor radius equals thegap width (rL ¼ d) at the MITL radius
rmax ¼emμ0IðtÞ2π
�m
2ZeVðtÞ�
1=2d: ð17Þ
This is plotted in Fig. 6 for Hþ and Oþ for a 7-mm gap.Also plotted is the maximum radius for thermal emissionfrom Eq. (12). This shows that for Hþ, as with electrons, theconditions for insulation exist prior to emission. AlthoughOþ is not insulated at emission, the surface area over whichOþ current loss may occur reduces in time as jCL isincreasing. Its estimated contribution to current loss istens of kA. Particle energy deposition may increase theemission radius above the dashed line in Fig. 6, but theresulting ions are uninsulated only between 65 and 75 nsfor the simulations presented here.
FIG. 4. The values of (a) E⊥ and (b) voltage as functions ofposition in the AK gap in the inner MITL (r ¼ 10 cm) for thesimulation geometry in Fig. 2(a). The results without particles areshown in red and results with electrode plasma formation areshown in blue. The values are extracted during the pulse rise[60 ns in the current pulse shown in Fig. 2(a)].
FIG. 5. E⊥ as a function of position in the AK gap at 60, 80, and100 ns. E⊥ is extracted at r ¼ 10 cm in the simulation geometryin Fig. 2(a).
FIG. 6. The maximum radius at which ions are magneticallyinsulated as a function of time (Eq. (17) for a 7-mm gap.The water constituents Hþ and Oþ are plotted in red and blue,respectively. The maximum radius for thermal emission fromEq. (12) for ΔT ¼ 400 K (in black) shows thermally emitted Hþare insulated.
MAGNETIZED PARTICLE TRANSPORT … PHYS. REV. ACCEL. BEAMS 24, 060401 (2021)
060401-7
The magnetic insulation feeds back to E⊥. As emittedions become confined to flow near the anode, they areneutralizing the current sheath entering from the convolute.This is consistent with the E⊥ profile at 100 ns in Fig. 5.While ions emitted from upstream surfaces may not
cross the AK gap initially, they do E ×B drift downstreaminto the inner MITL and contribute to the local plasmadensity there. In this way, they still contribute to currentloss, as described in Sec. V.
V. MAGNETIZED TRANSPORT AT >10 TELSA
The intense magnetic fields in multi-MA acceleratorsgenerate electron Larmor radii that are measured inmicrons. Particles from surface emission are magneticallyconfined near the electrode surfaces, as briefly described inSec. IV, and cross-field transport is typically considered forcollisional populations (νc > ωc).However, collisional transport is not significant in
the inner MITL of the Z machine, where the electrodeplasmas and the sheath currents entering from the con-volute are hot (102–105 eV) and of moderate density(1015–1017 cm−3) [9], such that νc<108 s−1. Reference [9]demonstrated that cross-field transport is well-approxi-mated by the Hall conductivity. In this reference, kineticsimulations of the inner MITLs of the Z machine were usedto crudely estimate an effective conductivity using a singlevalue of Erms and the current loss (Iloss). Discrete values ofthis effective conductivity showed the same scaling withdensity as σH.A more rigorous comparison to σH is presented here
using six inner MITL geometries that differ by lengthand/or minimum AK gap width. A time-dependent value ofσH is calculated from Eq. (1) for each simulation usingBðtÞ, neðtÞ, and νcðtÞ. For νcðtÞ, we use the Coulombcollision rate given by Spitzer for species α scattering offspecies β [72]:
ναβ ¼4
ffiffiffiffiffiffi2π
pe4Z2
αZ2βnβ lnΛαβ
ð4πϵ0Þ23mαμαβ
�Tα
mαþ Tβ
mβ
�−3=2
; ð18Þ
where μαβ ¼ mαmβ=ðmα þmβÞ and lnΛαβ is the Coulomblogarithm. We describe here how the different MITLgeometries result in different σHðtÞ, EðtÞ, and IlossðtÞ,but how in all cases the scaling of IlossðtÞ is well-approximated by the Hall current.Two of the simulation geometries were presented in
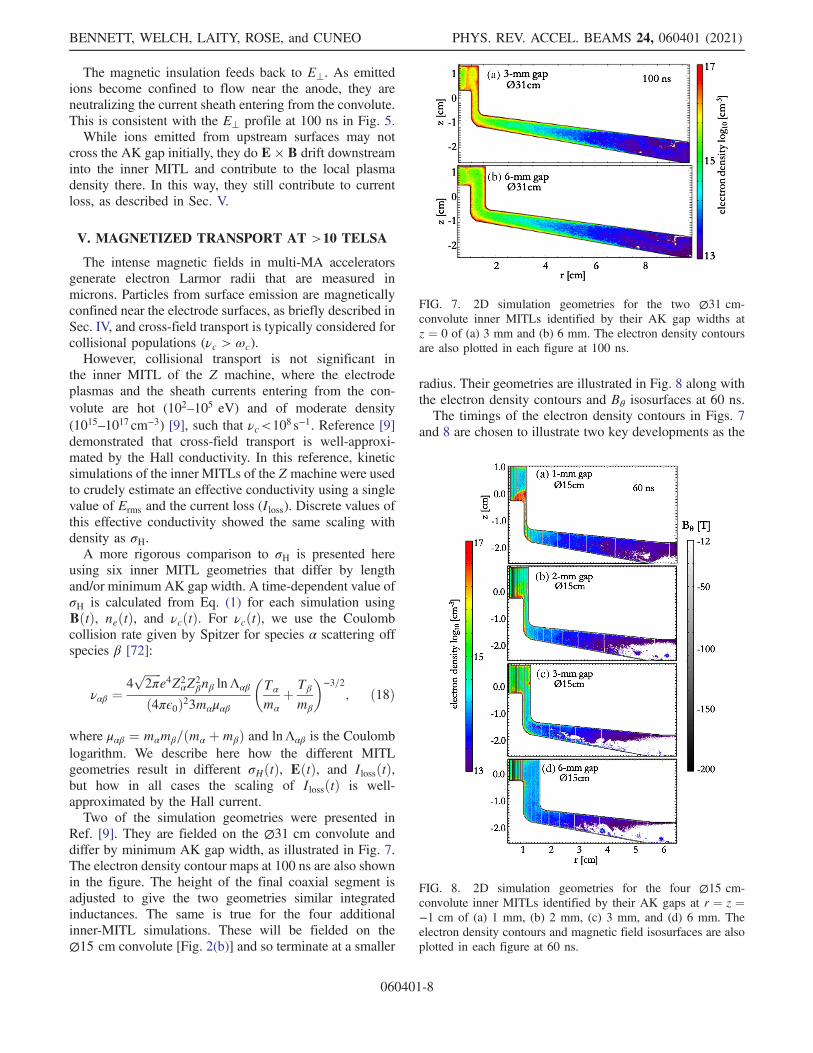
Ref. [9]. They are fielded on the ∅31 cm convolute anddiffer by minimum AK gap width, as illustrated in Fig. 7.The electron density contour maps at 100 ns are also shownin the figure. The height of the final coaxial segment isadjusted to give the two geometries similar integratedinductances. The same is true for the four additionalinner-MITL simulations. These will be fielded on the∅15 cm convolute [Fig. 2(b)] and so terminate at a smaller
radius. Their geometries are illustrated in Fig. 8 along withthe electron density contours and Bθ isosurfaces at 60 ns.The timings of the electron density contours in Figs. 7
and 8 are chosen to illustrate two key developments as the
FIG. 7. 2D simulation geometries for the two ∅31 cm-convolute inner MITLs identified by their AK gap widths atz ¼ 0 of (a) 3 mm and (b) 6 mm. The electron density contoursare also plotted in each figure at 100 ns.
FIG. 8. 2D simulation geometries for the four ∅15 cm-convolute inner MITLs identified by their AK gaps at r ¼ z ¼−1 cm of (a) 1 mm, (b) 2 mm, (c) 3 mm, and (d) 6 mm. Theelectron density contours and magnetic field isosurfaces are alsoplotted in each figure at 60 ns.
BENNETT, WELCH, LAITY, ROSE, and CUNEO PHYS. REV. ACCEL. BEAMS 24, 060401 (2021)
060401-8
AK gap width is reduced (keeping rC fixed). The con-taminant inventory is proportional to the surface area, so thetotal inventories, and the densities near the electrodes, aresimilar in all cases. This inventory flows downstream into avolume that decreases with AK gap width, so the localdensity increases with decreasing (local) gap. From Fig. 8,Bθ ≥ 100 T while ne ∼ 1015–1017 cm−3, so ωc ≫ νc andσH ∼ nee2=mωc. The linear relationship between σH and neleads to the first development, which is that geometries thatincrease density generate larger cross-gap transport.The second key development is that as the cross-gap
current density increases, the j × B force may change thedensity distribution. This occurs for the configurations inFig. 8(a) and (b) (1 and 2-mm gaps, ∅15 cm convolute).Figure 8(a) shows the time during which the densityexceeds 1017 cm−3 across the gap over an axial lengthof a few mm. The j ×B force on this slice of plasmasweeps it downstream and opens the gap back up. While thetotal particle charge is similar for all configurations, theplasma occupies a larger volume for the larger gaps anddoes not carry enough j to sweep downstream.As reported in Ref. [9], the current loss occurs along a
transmission line length of a few cm. The plasma accu-mulated in this region is a combination of locally desorbedparticles and sheath currents generated at larger radius thatdrift downstream. The electrode plasma expansion velocitypresented in Sec. VA is too slow for the surface plasmasalone to fill the AK gap above a few 1014 cm−3. However,the combined surface and sheath distributions, reflected inFigs. 7 and 8, may contain sufficient density that currentloss may be accounted for by the Hall conductivity, asdetailed in Sec. V B. The structures that increase the localEfield and densities are related to inductance in Sec. V C, asis appropriate for these inductively loaded MITLs.
A. Electrode plasma expansion
We roughly estimate the plasma expansion velocity(vplasma) as the rate at which an ion 1016-cm−3 density contourmigrates into the AK gap. The average vplasma is calculatedfrom the cathode near r ¼ 1 cm for each∅15 cm-convolutesimulation in Fig. 8. For the 1-mm through 6-mm gaps, thevplasma estimates are 1.3, 1.6, 0.98, and 0.92 cm=μs, respec-tively. (The average vplasma obtained using a 1015 − cm−3
density contour is 1.6 cm=μs for the 2-mm and 6-mm gaps.The inflow of particles from upstream complicates estimatesusing density contours <1015-cm−3.)To determine if the simulated plasma expansion is
consistent with the diffusion rate in Eq. (11), we estimateDH using the global values of TiðtÞ and BθðtÞ for eachsimulation. The estimates for DH are plotted in Fig. 9,where the average vplasma is included on a separate axis. Todraw a comparison, Eq. (2) may be rewritten DH∇n ¼ nv.Then, for surface densities of order 1016 cm−3 and mini-mum gradients of order 1017 cm−4 (from Figs. 7 and 8),
DH provides 1D expansion velocities that are of the sameorder as vplasma in the 2D simulations. In this roughcomparison, Hall physics is not inconsistent with thesimulated plasma expansion, and it is suitable to considerits role in current loss.
B. Cross-gap current
The densities in the gap from expanding electrodeplasmas are supplemented by particles flowing down-stream. The resulting plasmas span the AK gaps withminimum densities exceeding 1015 cm−3 out to r∼2–3 cm,as seen in Figs. 7 and 8.The regions of plasma build-up correspond to the
locations of cross-gap current, as illustrated in Figs. 10,11, 12, and 13. These figures map the values of rBθ (netcurrent) versus position. These are negative for the way wehave oriented the MITLs. Two contour plots are shown foreach of the geometries in Fig. 8; they represent the currentdistributions at 50 ns (∼3.5 MA into the pulse) and 100 ns(∼18 MA). These distributions indicate that the majorityof current loss is generally distributed along a 1–5 cmsegment of the MITL and not confined to a single arc.This is supportive of the rBθ map reported in Ref. [9] forthe Fig. 8(a) geometry.The exceptions to this distributed current loss occur
early in the simulations with the smaller gaps, Figs. 10(a)and 11(a). In these two cases, a plasma density exceeding1017 cm−3, along a length of a few mm, carries most of theloss current. This high current density generates a non-negligible j × B acceleration toward the load. While this isoccurring, the plasma density is still increasing in the innerMITL, so the loss current fluctuates without droppingto zero.The fluctuations in current loss for the smaller AK gaps
are seen in Fig. 14. The current loss is calculated as thedifference between the anode currents recorded at outerradius and near the load (Iloss ¼ Iin − Iload). The time-dependent IlossðtÞ is compared to a Hall current calculatedusing σHðtÞEðtÞA. Here, E is the electric field from
FIG. 9. DH from Eq. (11) estimated for the Fig. 8 geometries.Using DH∇n ¼ nv, with n ∼ 1016 cm−3 and ∇n ∼ 1017 cm−4
from simulation, DH provides an estimated v that is consistentwith the simulated average plasma expansion velocity shown onthe right axis.
MAGNETIZED PARTICLE TRANSPORT … PHYS. REV. ACCEL. BEAMS 24, 060401 (2021)
060401-9
VgapðtÞ=d at r ¼ 1 cm and A is the anode surface area tor ¼ 3 cm. (A fixed value of A is used with the time-dependent parameters. The value of r ¼ 3 cm is chosencrudely as the universal extent of the 1015 cm−3 minimumdensities.) σH is calculated from Eq. (1) using BθðtÞ, theaverage neðtÞ in the gap (excluding the electrode surfaces)to r ¼ 3 cm, and νcðtÞ from the average TeðtÞ.This volume-averaged Hall current calculation, from
time-history probes in the simulation, fails to capture theIloss fluctuations in Figs. 14(d) and (c) near 60 and 80 ns,respectively. These large, transient increases in Iloss are a
result of the large j and subsequent j ×B motion in thenarrow, higher-density plasma regions. These are alluded toin the changing current distributions in Figs. 10 and 11. Wemore accurately estimate σHEA in the 1.0 < r < 1.2 cmregion using 2D contours of ne and E generated assnapshots in a simulation. This yields the discrete valuesof the Hall current, calculated for 40, 50, and 60 ns, that areplotted in Figs. 14(c) and (d). Because ne and E are drawnfrom smoothed 2D contour plots, error bars are included.The Hall current is generally in good agreement with
IlossðtÞ for the four geometries in Fig. 14. The volume-averaged Hall current is calculated for the Fig. 7 geometriesand plotted in Fig. 15. The agreement provides evidencethat transport perpendicular to strong magnetic fields in
FIG. 11. Current distribution in the ∅15 cm 2-mm gap sim-ulation [Fig. 8(b)] at (a) 50 ns and (b) 100 ns.
FIG. 10. Current distribution (rBθ map) in the ∅15 cm 1-mmgap simulation [Fig. 8(a)] at (a) 50 ns and (b) 100 ns.
FIG. 12. Current distribution in the ∅15 cm 3-mm gap sim-ulation [Fig. 8(c)] at (a) 50 ns and (b) 100 ns.
FIG. 13. Current distribution in the ∅15 cm 6-mm gap sim-ulation [Fig. 8(d)] at (a) 50 ns and (b) 100 ns.
BENNETT, WELCH, LAITY, ROSE, and CUNEO PHYS. REV. ACCEL. BEAMS 24, 060401 (2021)
060401-10
these inner MITLs is a result of the Hall terms.Experimental campaigns and diagnostics for Z are indevelopment to further test this result.
C. Role of inductance
Figure 14 shows the average Iloss increases as theminimum AK gap width decreases, as expected basedon upstream plasma accumulating in smaller volumes. Inaddition, there is a dramatic increase in Iloss for all gaps at∼110 ns. This latter increase is not caused by density butby an increase inE that begins at that time. A dynamic loadis attached to these ∅15 cm-convolute inner MITLs tomimic the change in inductance from an imploding Z-pinchliner. The same liner mass is used in each, even though theaxial extents of the loads are different for each, as illustratedin Fig. 8. The induced E⊥ is increased by more than 50%during implosion.There is a different cause for the more gradual increase in
Iloss seen in Fig. 15. The loads on the two∅31 cm-convolute
inner MITLs are static, but the MITLs are longer, with moresurface area for contaminant desorption. The result is moreplasma available to accumulate in the downstream region.Using Fig. 7(a) and Fig. 8(c) as examples, the minimumgap widths are the same but the densities at 100 ns are∼8× larger for the longer MITL, which is approximatelytheir difference in upstream surface area.This provides some explanation of the relationship
between load inductance and Iloss that was introduced inRef. [3]. The inner MITL carries the full acceleratorcurrent, so Joule heating and particle energy depositionincrease most surface temperatures above the desorptionthreshold. Thus a longer MITL, with higher total induct-ance, generates more plasma that contributes to σH down-stream. This is true for the longer radial segment on the∅31 cm convolute and for longer coaxial sections on eitherconvolute. This adds to the impact of increases in the Efrom a time-dependent increase in the load inductance.The total inductance is not the sole determining factor,
however. Where and how the inductance increases alsomatters. For simulations in which the AK gap is increasedat small radius, the total inductance increases but the E⊥and density are reduced, thus reducing Iloss.
VI. SUMMARY
Kinetic simulations of the Z machine have been con-ducted in 3D and 2D to understand particle transport in thehighly magnetized environment of a multi-MA accelerator.While the transmission lines in kA-scale accelerators aredominated by SCL electron emission, at the MA scale,joule heating and particle energy deposition lead to therapid formation of electrode surface plasmas. These plas-mas may ultimately degrade the accelerator performance byshunting current away from the load.The 3D simulation was conducted of the Z machine’s
current adder region. Results show that because electrons
FIG. 14. Current loss (Iloss ¼ Iin − Iload) compared to anestimate of the Hall current (σHEA) for the four geometriesfielded on the ∅15 cm convolute (Fig. 8). The volume-averageHall current, given by the dotted lines, has an estimated error of11% from using VgapðtÞ from a single location and average neðtÞ,both of which fluctuate at the 8% level over 0.5 mm. The points in(c) and (d) are calculated from local values in the minimum AKgap region, averaged over a 7-mm axial region. The mean of theresulting radial distribution is used with statistical errors definedas the 10%–90% values.
FIG. 15. Current loss (Iloss ¼ Iin − Iload) compared to anestimate of the Hall current (σHEA) for (a) the 6-mm gap and(b) the 3-mm gap fielded on the ∅31 cm convolute (Fig. 7). Thevolume-average Hall current has an estimated 11% error asdescribed in Fig. 14.
MAGNETIZED PARTICLE TRANSPORT … PHYS. REV. ACCEL. BEAMS 24, 060401 (2021)
060401-11
and ions generated in the adder region drift downstreaminto the inner MITL along the anode surface, their space-charge enhancements to the electric field can increase SCLion emission from the anode. This effect is mitigated asprotons emitted from the anode are magnetically insulated,thereby neutralizing any local space-charge imbalance. Themagnetic insulation of the emitted ions, and the restoringeffect they have on the local electric field, precludes themfrom significantly enhancing current loss via unmagnetizedclassical transport.The enhanced ion emission does, however, increase
the plasma density downstream in the inner MITL. Thisplasma density is a factor in the Hall conductivity that isderived in the generalized Ohm’s law [27,28]. In ananalogous treatment, we extend the derivation of themagnetized diffusion coefficients [25] to include thecoupling of perpendicular components. In this way, wederive an analogous Hall diffusion rate, which is theempirical Bohm diffusion [23].The 2D simulations resolve the dynamics in the inner
MITLs. Comparisons of six inner MITL geometries showthat the time-dependent current loss (the difference betweenthe currents at the outer radius and the load) is wellapproximated by a Hall current calculated by σHEA. Westress that no Hall terms need be added to the fully-kineticsimulations. The Hall effect arises from the self-consistentcalculations of the current densities, charge distributions,and fields. Instabilities may contribute to transport, but arenot analyzed.Because the current losses are Hall-driven, they are
limited by the plasma densities and localE, rather than by aspace-charge-limited or magnetically-insulated current lossmechanism. Thus, the current loss may be mitigated byreducing the contaminant inventory and the induced E.It is in this way that the inner MITL inductance is
related to the current loss, as has been observed exper-imentally [3]. Longer transmission lines that increase thecontaminant inventory, and hence the electrode plasmadensity, also increase the integrated inductance. The Hallcurrent is linearly proportional to the induced electricfields, as well. Where and how the inductance increasesmatters, though. If the AK gap is increased at smallradius, the total inductance increases but the density andE are reduced.A complex analysis of the breakdown of the desorbed
contaminants is underway. This study incorporates elec-tron and ion impact ionization, dissociative ionization,and attachment for desorbed water molecules. The goal isa prediction of the plasma ionization fraction for a rangeof system energy densities. Further studies will includethe roles of photoionization and radiation transport.Finally, code validation is on-going. The 3D and 2D
geometries in Figs. 2(a) and 7(a) are compared to mea-surements in Ref. [9]. The geometries in Fig. 8 will becompared to data in a future work.
ACKNOWLEDGMENTS
Sandia National Laboratories is a multi-mission labo-ratory managed and operated by National Technology &Engineering Solutions of Sandia, LLC., a wholly ownedsubsidiary of Honeywell International, Inc., for the U.S.Department of Energy’s National Nuclear SecurityAdministration under Contract No. DE-NA0003525. Theviews expressed in the article do not necessarily representthe views of the U.S. Department of Energy or the UnitedStates Government. This project was partially supported byLDRD Project No. 209240.
[1] M. K. Matzen, Phys. Plasmas 4, 1519 (1997).[2] M. G. Haines, Plasma Phys. Controlled Fusion 53, 093001
(2011).[3] M. R. Gomez, R. M. Gilgenbach, M. E. Cuneo, C. A.
Jennings, R. D. McBride, E. M. Waisman, B. T. Hutsel,W. A. Stygar, D. V. Rose, and Y. Maron, Phys. Rev. Accel.Beams 20, 010401 (2017).
[4] A. Porwitzky, D. H. Dolan, M. R. Martin, G. Laity, R. W.Lemke, and T. R. Mattsson, Phys. Plasmas 25, 063110(2018).
[5] N. Bruner, T. Genoni, E. Madrid, D. Rose, D. Welch, K.Hahn, J. Leckbee, S. Portillo, B. Oliver, V. Bailey, and D.Johnson, Phys. Rev. ST Accel. Beams 11, 040401 (2008).
[6] N. Bennett et al., Phys. Rev. STAccel. Beams 17, 050401(2014).
[7] A. S. Richardson, J. C. Zier, J. T. Engelbrecht, S. B.Swanekamp, J.W. Schumer, D. Mosher, P. F. Ottinger,D. L. Duke, T. J. Haines, M. P. McCumber, and A. Gehring,Phys. Rev. Accel. Beams 22, 050401 (2019).
[8] D. R. Welch, N. Bennett, D. Rose, C. Thoma, and W.Stygar, Phys. Rev. Accel. Beams 22, 070401 (2019).
[9] N. Bennett, D. R. Welch, C. A. Jennings, E. Yu, M. H.Hess, B. T. Hutsel, G. Laity, J. K. Moore, D. V. Rose, K.Peterson, and M. E. Cuneo, Phys. Rev. Accel. Beams 22,120401 (2019).
[10] R. B. Spielman et al., Phys. Plasmas 5, 2105 (1998).[11] M. E. Savage, K. R. LeChien, M. R. Lopez, B. S.
Stoltzfus, W. A. Stygar, D. S. Artery, J. A. Lott, and P. A.Corcoran, in 2011 IEEE Pulsed Power Conference (2011),pp. 983–990, https://doi.org/10.1109/PPC.2011.6191629.
[12] D. B. Sinars et al., Phys. Plasmas 27, 070501 (2020).[13] D. Jianjun, X. Weiping, F. Suping, W. Meng, L. Hongtao,
S. Shengyi, X. Minghe, H. An, T. Qing, G. Yuanchao, G.Yongchao, W. Bin, Z. Wenkang, H. Xianbin, W. Lijuan, Z.Zhaohui, H. Yi, and Y. Libing, IEEE Trans. Plasma Sci. 41,2580 (2013).
[14] J. Deng et al., Matter Radiat. Extremes 1, 48 (2016).[15] B. A. Kablambaev, A. V. Luchinsky, V. K. Petin, N. A.
Ratakhin, S. A.Sorokin,V. F. Fedushchak, S. A.Chaikovsky,and S. V. Shlyakhtun, Vopr. At. Nauki Tekhn. 34, 149(2001).
[16] S. A. Sorokin, Phys. Plasmas 23, 043110 (2016).[17] B. T. Hutsel, P. A. Corcoran, M. E. Cuneo, M. R. Gomez,
M. H. Hess, D. D. Hinshelwood, C. A. Jennings,G. R. Laity, D. C. Lamppa, R. D. McBride, J. K. Moore,
BENNETT, WELCH, LAITY, ROSE, and CUNEO PHYS. REV. ACCEL. BEAMS 24, 060401 (2021)
060401-12
A. Myers, D. V. Rose, S. A. Slutz, W. A. Stygar, E. M.Waisman, D. R. Welch, and B. A. Whitney, Phys. Rev.Accel. Beams 21, 030401 (2018).
[18] W. Zou, F. Guo, L. Chen, S. Song, M. Wang, W. Xie,and J. Deng, Phys. Rev. ST Accel. Beams 17, 110401(2014).
[19] D. V. Rose, E. A. Madrid, D. R. Welch, R. E. Clark, C. B.Mostrom, W. A. Stygar, and M. E. Cuneo, Phys. Rev. STAccel. Beams 18, 030402 (2015).
[20] D. R. Welch, N. Bennett, T. C. Genoni, C. Thoma,and D. V. Rose, Phys. Rev. Accel. Beams 23, 110401(2020).
[21] T. D. Pointon, W. A. Stygar, R. B. Spielman, H. C. Ives,and K.W. Struve, Phys. Plasmas 8, 4534 (2001).
[22] D. V. Rose, D. R. Welch, T. P. Hughes, R. E. Clark, andW. A. Stygar, Phys. Rev. ST Accel. Beams 11, 060401(2008).
[23] D. Bohm, The Characteristics of Electrical Discharges inMagnetic Fields, edited by A. Guthrie and R. Wakerling(McGraw-Hill, New York, 1949), Chap. 2.
[24] M. N. Rosenbluth and A. N. Kaufman, Phys. Rev. 109, 1(1958).
[25] T. Boyd and J. Sanderson, The Physics of Plasmas(Cambridge University Press, Cambridge, England, 2003).
[26] R. Balescu, Transport Processes in Plasmas (NorthHolland, Amsterdam, 1988).
[27] S. I. Braginskii, in Reviews of Plasma Physics, Vol. 1,edited by M. A. Leontovich (Consultants Bureau,New York, 1965), p. 205.
[28] B. V. Somov, Plasma Astrophysics: Part I Fundamentalsand Practice (Springer Science+Business Media, LLC,New York, 2006).
[29] L. Spitzer, Phys. Fluids 3, 659 (1960).[30] J. B. Taylor and B. McNamara, Phys. Fluids 14, 1492
(1971).[31] H. R. Kaufman, J. Vac. Sci. Technol. B 8, 107 (1990).[32] E. Bultinck, S. Mahieu, D. Depla, and A. Bogaerts, J. Phys.
D 43, 292001 (2010).[33] W. A. Stygar et al., Phys. Rev. ST Accel. Beams 12,
120401 (2009).[34] D. Welch, D. Rose, B. Oliver, and R. Clark, Nucl. Instrum.
Methods Phys. Res., Sect. A 464, 134 (2001), proc. of the13th Int. Symp. on Heavy Ion Intertial Fusion.
[35] D. R. Welch, D. V. Rose, R. E. Clark, T. C. Genoni, andT. P. Hughes, Comp. Phys. Comm. 164, 183 (2004),proceedings of the 18th International Conference on theNumerical Simulation of Plasmas.
[36] D. Rose, D. Welch, B. Oliver, R. Clark, D. Johnson, J.Maenchen, P. Menge, C. Olson, and D. Rovang, J. Appl.Phys. 91, 3328 (2002).
[37] D. Welch, T. Genoni, R. Clark, and D. Rose, J. Comput.Phys. 227, 143 (2007).
[38] C. Thoma, D. R. Welch, R. E. Clark, D. V. Rose, and I. E.Golovkin, Phys. Plasmas 24, 062707 (2017).
[39] G. R. Laity et al., Towards predictive plasma science andengineering through revolutionary multiscale algorithmsand models, final report, Sandia National LaboratoriesTech. Report No. SAND2021-0718, 2021.
[40] D. Hinshelwood, Naval Research Laboratory, Washington,DC, Memo. Report No. 5185, 1983.
[41] M. E. Cuneo et al., IEEE Trans. Plasma Sci. 40, 3222(2012).
[42] T. C. Genoni, R. E. Clark, and D. R. Welch, Open PlasmaPhys. J. 3, 36 (2010).
[43] C. K. Birdsall and A. B. Langdon, Plasma Physics viaComputer Simulation (Adam Hilger, New York, 1991).
[44] B. B. Godfrey, Time-biased field solver for electromagneticcodes, Mission Research Corp. Tech. Report No. AMRC-N-138, 1980; presented at the 9th Conference on theNumerical Simulation of Plasmas.
[45] H. Knoepfel, Magnetic Fields (John Wiley and Sons,New York, 2000).
[46] J. Valencia and P. Quested, in ASM Handbook, Vol. 15:Castings (ASM International, Materials Park, Ohio, 2008).
[47] W. A. Stygar, S. E. Rosenthal, H. C. Ives, T. C. Wagoner,G. O. Allshouse, K. E. Androlewicz, G. L. Donovan, D. L.Fehl, M. H. Frese, T. L. Gilliland, M. F. Johnson, J. A.Mills, D. B. Reisman, P. G. Reynolds, C. S. Speas, R. B.Spielman, K. W. Struve, A. Toor, and E. M. Waisman,Phys. Rev. ST Accel. Beams 11, 120401 (2008).
[48] W. Leo, Techniques for Nuclear and Particle PhysicsExperiments, 2nd ed. (Springer-Verlag, New York BerlinHeidelberg, 1994).
[49] K. Cochrane, M. Desjarlais, M. Lane, K. Leung, A.Thompson, and A. Wright, Desorption source modeling:From electronic structure, molecur dynamics, Temkinisotherm, to finite element calculations, Sandia NationalLaboratories Tech. Report No. SAND2018-8709C, 2018.
[50] I. Langmuir, Phys. Rev. 2, 450 (1913).[51] R. Fowler and L. Nordheim, Proc. R. Soc. A 119, 173
(1928).[52] T. W. L. Sanford, J. A. Halbleib, J. W. Poukey, A. L.
Pregenzer, R. C. Pate, C. E. Heath, R. Mock, G. A. Mastin,D. C. Ghiglia, T. J. Roemer, P. W. Spence, and G. A.Proulx, J. Appl. Phys. 66, 10 (1989).
[53] H. Jory and A. Trivelpiece, J. Appl. Phys. 40, 3924 (1969).[54] N. Bruner, D. R. Welch, K. D. Hahn, and B. V. Oliver,
Phys. Rev. ST Accel. Beams 14, 024401 (2011).[55] N. Bennett, D. R. Welch, T. J. Webb, M. G. Mazarakis,
M. L. Kiefer, M. D. Crain, D. W. Droemer, R. E. Gignac,M. D. Johnston, J. J. Leckbee, I. Molina, D. Nielsen,R. Obregon, T. Romero, S. Simpson, C. C. Smith, F. L.Wilkins, and D. Ziska, Phys. Plasmas 22, 033113 (2015).
[56] A. A. Noyes and H. A. Wilson, Proc. Natl. Acad. Sci.U.S.A. 8, 303 (1922).
[57] M. E. Cuneo, P. R. Menge, D. Hanson, W. Fowler, M.Bernard, G. Ziska, A. Filuk, T. Pointon, R. Vesey, D.Welch, J. E. Bailey, M. Desjarlais, T. Lockner, T.Mehlhorn, S. Slutz, and M. Stark, IEEE Trans. PlasmaSci. 25, 229 (1997).
[58] J. P. VanDevender, R. W. Stinnett, and R. J. Anderson,Appl. Phys. Lett. 38, 229 (1981).
[59] R. R. Laher and F. R. Gilmore, J. Phys. Chem. Ref. Data19, 277 (1990).
[60] P. Redhead, The Physical Basis for Ultrahigh Vacuum(Chapman and Hall, London, 1968).
[61] M. Li and H. F. Dylla, J. Vac. Sci. Technol. A 11, 1702(1993).
[62] H. F. Dylla, D. M. Manos, and P. H. LaMarche, J. Vac. Sci.Technol. A 11, 2623 (1993).
MAGNETIZED PARTICLE TRANSPORT … PHYS. REV. ACCEL. BEAMS 24, 060401 (2021)
060401-13

[63] J. M. D. Lane, K. Leung, A. P. Thompson, and M. E.Cuneo, J. Phys. Condens. Matter 30, 465002 (2018).
[64] K. Nanbu and S. Yonemura, J. Comput. Phys. 145, 639(1998).
[65] D. P. Higginson, I. Holod, and A. Link, J. Comput. Phys.413, 109450 (2020).
[66] S. D. Baalrud and J. Daligault, Phys. Rev. Lett. 110,235001 (2013).
[67] L. Jose and S. D. Baalrud, Phys. Plasmas 27, 112101 (2020).[68] E. S. Evans, S. A. Cohen, and D. R. Welch, Phys. Plasmas
25, 042105 (2018).
[69] E. M. Waisman, M. P. Desjarlais, and M. E. Cuneo, Phys.Rev. Accel. Beams 22, 030402 (2019).
[70] E. A. Madrid, D. V. Rose, D. R. Welch, R. E. Clark, C. B.Mostrom, W. A. Stygar, M. E. Cuneo, M. R. Gomez, T. P.Hughes, T. D. Pointon, and D. B. Seidel, Phys. Rev. STAccel. Beams 16, 120401 (2013).
[71] D. V. Rose, E. M. Waisman, M. P. Desjarlais, M. E. Cuneo,B. T. Hutsel, D. R. Welch, N. Bennett, and G. R. Laity,Phys. Rev. Accel. Beams 23, 080401 (2020).
[72] P. W. Rambo and R. J. Procassini, Phys. Plasmas 2, 3130(1995).
BENNETT, WELCH, LAITY, ROSE, and CUNEO PHYS. REV. ACCEL. BEAMS 24, 060401 (2021)
060401-14