Embed Size (px)
Citation preview

AQUACULTURE ENVIRONMENT INTERACTIONSAquacult Environ Interact
Vol. 8: 311–329, 2016doi: 10.3354/aei00175
Published May 3
INTRODUCTION
For decades it has been recognized that dense pop-ulations of bivalve filter-feeders possess a hugepotential for clearing the water column of phyto-plankton and other particulate matter (e.g. Cloern
© The authors 2016. Open Access under Creative Commons byAttribution Licence. Use, distribution and reproduction are un -restricted. Authors and original publication must be credited.
Publisher: Inter-Research · www.int-res.com
*Corresponding author: [email protected]
FEATURE ARTICLE
Magnitude, spatial scale and optimization of ecosystem services from a nutrient extraction
mussel farm in the eutrophic Skive Fjord, Denmark
Pernille Nielsen1,*, Peter J. Cranford2, Marie Maar3, Jens Kjerulf Petersen1
1DTU Aqua, Danish Shellfish Center, Øroddevej 80, 7900 Nykøbing Mors, Denmark2Fisheries and Oceans Canada, Bedford Institute of Oceanography, 1 Challenger Dr., Dartmouth, Nova Scotia B4C 4C9, Canada
3Aarhus University, Department of Bioscience, PO Box 358, Frederiksborgvej 399, 4000 Roskilde, Denmark
ABSTRACT: Suspended mussel aquaculture hasbeen proposed as a possible mechanism by whichto remove excess nutrients from eutrophic marineareas. In this study, seasonal mussel growth andwater clarification (through seston and phytoplank-ton depletion) were studied at a commercial-scalenutrient extractive mussel farm in a highly eu -trophic Danish fjord. Spatial variations in musselbiomass were examined throughout the year andno significant differences were detected within thefarm. Food depletion by mussels was examined atspatial scales ranging from individuals to the entirefarm and surrounding area. Phytoplankton deple-tion on the scale of individual mussel loops, deter-mined using the siphon mimic approach, indicatedbetween 27 and 44% depletion of chlorophyll a(chl a). Farm-scale depletion was detected andvisualized based on intensive 3D spatial surveys ofthe distribution of chl a and total suspended partic-ulate matter concentrations both inside and outsidethe farmed area. Average reductions in food supplywithin the farm ranged from 13 to 31%, with someareas showing >50% food depletion. A food deple-tion model was developed to estimate the optimalmussel density required to maximize removal ofexcess phytoplankton. The model employed mus-sel clearance rate estimates derived from the ob -served magnitude of food depletion within thefarm. Model results indicate that the mussel popu-lation filtration rate could be increased by 80 to120% without any negative feedback on musselgrowth. This could be accomplished by approxi-mately doubling the standing stock of mussels inthe farm, hence doubling the amount of nutrientsremoved at mussel harvest.
Measurements of the water clarification capacity of a nutri-ent extractive mussel farm in a eutrophic fjord in Denmarkwere used to optimize eutrophication mitigation capacity.
Graphic: Camille Saurel, DTU Aqua
KEY WORDS: Food depletion · Mussel feeding ·Phytoplankton · Mytilus edulis · Nutrient extraction ·Depletion model
OPENPEN ACCESSCCESS

Aquacult Environ Interact 8: 311–329, 2016
1982, Officer et al. 1982, Dame 1993, 1996). The bio -filtration activities of mussel populations can, undersome conditions, reduce the occurrence and magni-tude of algal blooms and markedly increase waterclarity (e.g. Dame 1996). Commercial mussel aqua-culture has been predicted and shown to reducephytoplankton and seston biomass (i.e. depletion) atthe scale of coastal ecosystems under intensive cul-ture conditions (Grant et al. 2008). Reported levels ofphytoplankton and seston reduction measured withinindividual mussel farms range between 10 and 80%(Heasman et al. 1998, Ogilvie et al. 2000, Strohmeieret al. 2005, 2008, Petersen et al. 2008, Cranford etal. 2014), and different zooplankton groups werereduced by 26 to 77% (Maar et al. 2008). Blue mus-sels Mytilus edulis can grow rapidly under eutrophicconditions because of the high phyto plankton concen-trations, and transform the excess nitrogen (N) andphosphorus (P) into mussel meat that is subsequentlyremoved from coastal waters during the mussel har-vest. Consequently, the introduction of suspendedbivalve farms has been proposed as an eco-engineer-ing approach for removing nutrients from eutrophicmarine environments and improving water quality(Haamer 1996, Edebo et al. 2000, Newell 2004,Petersen 2004, Lindahl et al. 2005, Gren et al. 2009,Petersen et al. 2012, 2014, 2015, Rose et al. 2012,2015).
Studies on the concept of ‘mitigation mussels’ havelargely been conducted under relatively small-scaleconditions (e.g. Haamer 1996, Hart 2003, Lindahl etal. 2005, Gren et al. 2009, Lindahl & Kollberg 2009) orthrough theoretical modelling (Hart 2003, Nunes etal. 2011, Ferreira et al. 2014, Saurel et al. 2014). Theonly non-pilot scale study of nutrient removal by anextractive mussel farm was that of Petersen et al.(2014), who showed that a typical Danish musselfarm (18.8 ha) in a eutrophic fjord was able to cost-effectively remove 0.6 to 0.9 t N ha−1 yr−1 and 0.03 to0.05 t P ha−1 yr−1. While that study determined thecumulative effect of the farm on total nutrientremoval from the fjord, the present companion study,conducted at the same farm, addresses the spatialscale and magnitude of a related ecosystem service:increased water clarity. Performance indicators ofthis service include the percentage depletion of thestanding stock of phytoplankton and total seston. Arange of sampling methodologies and technologieswere employed to quantify local to farm-scale fooddepletion, as well as to determine the capacity ofeach approach to detect food depletion.
The aim of commercial mussel aquaculture is tomaximize the production of a high quality com -
mercial product produced for human consumptionfrom the farmed area, whereas the primary focusof extractive aquaculture is to maximize nutrientremoval from the coastal system. While both prac-tices generally strive to be as area-intensive and cost-efficient as possible, optimization criteria for extrac-tive culture are not constrained by the quality of theproduct. Although stocking and husbandry practicesfor the optimization of extractive mussel culture haveyet to be determined, it may be expected that exces-sive food depletion would result in reduced musselgrowth (Heasman et al. 1998, Fuentes et al. 2000,Aure et al. 2007, Rosland et al. 2011) and therebyreduce the nutrient extraction potential. In the pres-ent study, spatial variations in mussel growththroughout the experimental farm were ex amined inconjunction with measurements of the ambient foodsupply to determine if growth was impacted byexcessive levels of food depletion (i.e. negative feedback). To further explore possible optimizationoptions for nutrient extraction, field measurementswere integrated into a farm-scale food depletionmodel. The model was used to estimate the musseldensity required to maximize the removal of excessphytoplankton, and thereby improve water quality.
MATERIALS AND METHODS
Study site
The mussel farm and sampling stations were locatedin the Skive Fjord, Denmark: a small estuary in thewestern part of Limfjorden (Fig. 1). The fjord has asurface area of 49 km2, a low tidal range (<0.3 m),and a mean depth of 4.7 m. This estuary is partiallymixed, with stratification on the scale of days toweeks depending on fresh water inflow, solar radia-tion and wind (Møhlenberg 1999). Skive Fjord can beclassified as eutrophic based on the frequent oxygendepletion events, high dissolved nutrient and chloro-phyll a (chl a) concentrations, high sedimentationrates of organic-rich particulate matter, sparse ben-thic communities and rapid nutrient regeneration inthe water column and sediments (Maar et al. 2010,Carstensen et al. 2013)
A commercial-scale mussel farm was rented forexperimental purposes in a region where the waterdepth ranged from 5 to 7 m. The farm covered anarea of approximately 250 × 750 m (18.8 ha) and wasdivided into 3 sections (north, middle and south),each containing 30 long-lines (200 m each) that ranparallel to the shore (Fig. 1C). Buoys and anchors
312

Nielsen et al.: Nutrient extractive mussel farm in a eutrophic area
maintained the long-lines at a depth of 0.5 to 1 mbelow the water surface. Vertical mussel loops wereattached to the long-lines at 0.5 m spacing and hungto a maximum depth of 2 m below the long-line. Atotal of 90 km of mussel loops were deployed withinthe farm. The farm was self-recruiting; blue mussellarvae were first observed in Skive Fjord in May 2010(P. Nielsen pers. obs.) and the larvae had settled onthe mussel loops by the end of May to the beginningof June 2010. The study period lasted from June 2010until June 2011, and included seasonal mussel ropeand water column sampling as well as 2 intensive12 d field campaigns (23 August to 3 September2010, and 2 to 13 May 2011). Skive Fjord was coveredby ice (20 to 32 cm thick in January 2011) fromthe beginning of December 2010 until the end ofFebruary 2011.
Mussel growth
Mussel rope samples (including mussels and bio-fouling) were collected by randomly removingapproximately 1 m sections of mussel loops from dif-ferent sections of the farm. These samples were usedto examine spatial and temporal variations in musselbiomass and growth within the farm. Mussel ropeswere sampled on 7 random occasions from July 2010until June 2011 from the same lines in each of the 3farm sections. On each sampling occasion, 10 ropesamples were collected from each section (total: 30samples). The first 1 m of the loop was discarded; the
next 1 m section of mussel loop was removed and col-lected in a plastic bag for transport to the laboratory.In addition, 9 rope samples (3 from each section)were collected from the middle and edge linesbetween August and November to further examinespatial variations in mussel growth within the farm.In December 2010, the ice severed the edge line, sofurther sampling and comparisons of edge versusmiddle lines were not possible.
The following measurements were taken for eachmussel rope sample: exact length of rope, total wetweight (WW, in kg) including mussels and biofoul-ing, no. of mussels kg−1 WW, WW (kg) of mussels andWW (kg) of byssus. Individual mussels were ran-domly selected from each rope sample for measure-ments of shell length (n = 100) with a digital caliper(±1 mm) and individual tissue and shell dry weight(DW, n = 10). Mussel tissue and shell were separatedand dried at 80°C for ≥5 d, cooled to room tempera-ture in a desiccator and weighed to the nearest mg.
Mussel growth within each of the 3 farm sectionswas determined from seasonal changes in averagetissue mass. The weight-specific growth rate ofMytilus edulis (μ, d−1) was calculated as:
(1)
where DWt and DW0 are the mean dry weights ofmussel tissues on Day 0 and Day t, respectively. Theactual weight-specific growth rates were comparedwith measured maximum growth rates of musselsdeployed in net-bags from 6 other studies conducted
lnDWDW0
1( )μ = × −tt
313
Fig. 1. (A,B) Location of the Limfjorden, Denmark and (C) the position of the mussel farm and sampling stations in the Skive Fjord. Stations: N = north section; M = middle section; S = south section; C = outside the farm; P = siphon mimic samples

Aquacult Environ Interact 8: 311–329, 2016314
in Danish waters (Riisgård & Poulsen 1981, Riisgårdet al. 2012, 2014, Landes et al. 2015). The measuredmaximum growth rate (n = 6, mussel weight 0.049 ±0.035 mg; mean ± SD) was on average 7.6% d−1, andwas compared with present values using an allomet-ric biomass scaling of 0.34 (Riisgård et al. 2012), andcorrected for temperature effects by the Arrheniusequation (van der Veer et al. 2006).
Mussel biomass (kg WW m−1; n = 10) and tissue DW(n = 100) were compared between sections for the dif -ferent sampling dates using a fixed factor (Model I)2-way ANOVA (GraphPad Prism v.5.0f). Mussel bio-mass (n = 3) and DW (n = 30) were comparedbetween the middle and edge lines for each sectionof the farm on the different sampling dates usingunpaired Student’s t-tests (α = 0.05). Any change inDW during ice-cover was determined by comparingDW data from October (before ice) with data fromMarch (right after ice) by using a Mann-Whitney U-test (α = 0.05). Homogeneity of variances and nor-mality were assured for the above datasets accordingto Bartlett’s test and D’Agostino−Pearson omnibusnormality test.
Water currents
Water currents replenish the food supply in themussel farm and are therefore important for model-ling changes in food concentrations across the farm.Current speed and direction within and around thefarm was measured using a boat-mounted 1200 kHzacoustic Doppler current profiler (Workhorse Moni-tor, Teledyne RD Instruments). These data were col-lected simultaneously with the spatial surveys of suspended particulate matter and chl a concentra-tions (see ‘High-resolution synoptic survey approach’below), and were averaged for water depths between1 and 4 m.
Small-scale phytoplankton depletion
Food depletion by mussels quantified at the scaleof individual mussel ropes (0.1 to 50 cm from themussels) was examined during 2 field campaigns (3times in August 2010 and 4 times in May 2011) usingthe siphon mimic technique (Petersen et al. 2008,2013). This method consists of small tubes by whichwater (i.e. chl a) is sampled at 5 different distances(0.1, 5, 10, 20 and 50 cm) from the edge of the musselshells. The day before the first water sample wastaken, 2 siphons (each siphon included the 5 sam-
pling distances) were positioned by a SCUBA diveron a mussel loop in the middle farm section near thefarm edge (Stn P in Fig. 1C). The siphons were posi-tioned at 2 m depth with one siphon aligned perpen-dicular to the long-line and the other, parallel. Datacollected using both siphon orientations were aver-aged to control for any current direction bias in theresults. During each sampling period, water fromboth siphons and all 5 distances was simultaneouslypumped to the surface for 4 to 7 min at 4 l h−1 using aperistaltic pump. Water samples were collected intriplicate in 0.3 l glass bottles for analysis of chl aand phaeopigments in different size fractions as de -scribed below. The average percentage food de -pletion at a given distance from the mussels was calculated as:
(2)
where Cx and C0 are average chl a concentrations atthe given distance from the mussels and at 50 cmfrom the mussels, respectively. Food depletion wasdetermined when linear regression analysis of foodconcentration at the different distances indicated aslope that was significantly different from zero.
Farm-scale phytoplankton and seston depletion
Discrete sampling approach
On 22 occasions between June 2010 and June2011, a standard monitoring program consisting ofCTD-casts and water sampling was conducted tocharacterize environmental conditions at 4 perma-nent sampling stations located inside and outside thefarm area. Sampling stations were positioned at 2edges of the farm (Stns N and S), in the center of thefarm (Stn M) and 300 m south of the farm (Stn C)(Fig. 1C). The CTD-profiles were conducted using acalibrated conductivity-temperature-depth sensor andan integrated chl a fluorescence sensor (ECO-probe,Meerestechnik Elektronik). Spatial differences influorescence on different sampling occasions werecompared between the stations within the farm (N, S,M) as well as with the control station outside the farm(C), to determine if food depletion could be detectedusing this sampling approach. Salinity profiles fromeach station were also compared to ensure that waterproperties at all stations were uniform. All stationcomparisons were conducted using 1-way ANOVA,and significant results were followed by a Tukey’spost hoc test or Dunn’s multiple comparison tests.
Depletion (%)( )
1000
0
C CC
x= − ×

Nielsen et al.: Nutrient extractive mussel farm in a eutrophic area
Homogeneity of variances and normality were as -sured for all datasets according to Bartlett’s test andD’Agostino−Pearson omnibus normality test.
Water sampling was conducted on the same datesas the CTD-casts at Stns M and C. Samples were collected with a 1.7 l Ruttner water sampler (KC Denmark) from a depth of 1 m. Water samples werekept in the dark during transport to the laboratory,where they were immediately and gently pre-filteredthrough a 200 μm mesh to avoid possible inclusion ofmussel fecal pellets. The pre-filtered water sampleswere then analysed for size-fractionated chl a by filtering either 50 or 100 ml duplicate sub-samplesthrough Whatman GF/F and GF/D filters (0.7 and2.7 μm nominal pore size). Chl a and phaeopigmentswere extracted from the filters in 10 ml of 96%ethanol, and analysed by the fluorometric techniqueof Holm-Hansen et al. (1965) using a Turner Designs10-AU fluorometer calibrated against a chl a stan-dard (PPS-CAPSA, DHI).
High-resolution synoptic survey approach
Farm-scale depletion was also investigated basedon intensive spatial surveys of the horizontal and ver-tical distribution of chl a and total suspended partic-ulate matter (TPM) concentrations inside and outsidethe farmed area (Cranford et al. 2008). This towedsensor approach provides depth-averaged maps(contour plots) of particle concentrations in andaround the farm, providing a synoptic description ofthe effect of the mussel farm’s impact on chl a andTPM concentrations. Spatial data on TPM and chl aconcentrations were collected using in situ electronicsensors mounted on a computer controlled, undulat-ing tow vehicle (Acrobat LTV-50, Sea Sciences). Thesensor payload consisted of a CTD (AML Oceano-graphic MicroCTD), a chl a fluorometer (SeapointSensors) and a transmissometer with a 25 cm opticalpath length (c-Rover CRV5, WET Labs). For all sur-veys, the Acrobat was programmed to automaticallyundulate between 0.5 and 5 m depth. The instru-ments were powered from the surface by 12 V lead-acid batteries, and all measurements were made at asampling frequency of 1 Hz. Tow speed was main-tained at approximately 2 m s−1, and the sensor datastream was combined in real time with simultaneousGPS and water depth readings (Model GPSMAP 421,Garmin) using Windmill 7 data acquisition and visu-alization software (Windmill Software). Acrobat sur-veys were conducted on 7 occasions during the 2field campaigns (3 between 28 August and 1 Septem-
ber 2010, and 4 between 4 and 10 May 2011) andincluded data collection inside the farm (tows be -tween multiple mussel long-lines) and in all directionsoutside the farm. A typical survey was completedwithin a 2 h period.
An in situ calibration of the Acrobat fluorometerand transmissometer was conducted using seawatersamples collected from areas outside the farm inorder to avoid mussel faecal pellets. Water was col-lected at the same depth as the Acrobat with a 2 lKemmerer water sampler. Water samples stored inpre-rinsed 1 l Nalgene bottles were kept in the darkduring transport and filtered through pre-washedAdvantec GC-50 glass fiber filters (0.5 μm porosity;n = 1 for chl a and n = 3 for TPM analysis). The chl acontent of particles was determined as describedabove. The relationship between measured chl a (μgl−1) and the Seapoint fluorescence voltage (FLV, inmV) was determined using regression analysis (chl a= 5.007 × FLV + 0.970; n = 46, r2 = 0.93). The materialcollected on TPM filters was rinsed with isotonicammonium formate to remove salt, dried at 60°C andweighed to the nearest 0.01 mg for determination ofTPM concentration (mg l−1). The relationship betweenTPM concentrations and c-Rover instrument countswas also determined by regression (TPM = −11.863 ×ln(counts) + 17.883; n = 101, r2 = 0.84).
Vertical profile plots and contour maps of waterdensity (Sigma-t; σT), chl a, and TPM concentrationswere used to summarize and observe spatial patternsin each of these parameters during each Acrobat sur-vey. Depth intervals exhibiting low vertical variationin the measured parameter were selected for contourmapping using Surfer 9 (Golden Software) and theOrdinary Kriging interpolation method. The averagepercentage food depletion within the total farm vol-ume (Dx) was calculated using Eq. (2), where Cx andC0 are average chl a or TPM concentrations withinthe farm and reference areas, respectively. The ref -erence area included all data collected outside thefarm boundaries with the exception of any plume ofdepleted mussel food moving away from the farm,which was identified from the contour maps of TPMand chl a concentration. Food depletion was also cal-culated at various distances in the direction of thecurrent flow across the mussel farm by extractingsubsets of the Acrobat survey data for preselectedareas. For these calculations, all data collected imme-diately adjacent to the inflow side of the farm servedas the reference (i.e. C0) while data from parallel sec-tions located in the center and outflow side of thefarm represented food concentrations impacted bymussel feeding (i.e. Cx).
315

Aquacult Environ Interact 8: 311–329, 2016
Eq. (2) assumes that spatial variations within thesurvey domain are solely caused by the feedingactivity of the farmed mussels and not by naturalvariability. Consequently, care was taken to ensurethat food depletion was only calculated for samplingperiods that exhibited uniform water properties (asingle water mass) within the surveyed area. Thiswas particularly important for the Skive Fjord, whichexhibited a high degree of patchiness in water den-sity during this study due to freshwater run-off.Given the possible presence of more than one watermass within the farm during each survey, contourplots of σT were first examined prior to any calcula-tion of food depletion. While it may be expected thatthe level of farm-scale TPM and chl a depletionwould be similar on consecutive sampling days, sev-eral surveys had to be conducted during each sam-pling campaign to obtain a survey that conformedwith the methodological assumption of water massuniformity. Of the 7 surveys conducted, only the datacollected on 1 September 2010 and 10 May 2011were consistent with this assumption.
Depletion model
The food supply to the farmed mussels is deter-mined by water transport into the farm, the upstreamfood concentration and the farm design. Food con-centrations are progressively reduced as the waterflows through the farm due to mussel filtration. Asimple 1D horizontal depletion model was applied todescribe changes in food concentrations across thefarm. The depletion model assumes a constant uni-directional flow, a fully mixed surface layer, a uni-form distribution of mussels, and that dispersion andvertical transport are disregarded (Bacher et al. 2003).The depletion rate of food concentration (C; mg m−3)is described as:
(3)
where N is the density of mussels (ind. m−3), CR is therealized clearance rate of mussels (m3 ind.−1 s−1), x isthe downstream distance (m) and u– is the averagecurrent velocity (m s−1) in the middle of the farm.Current velocities measured inside the farm wereused to account for the effect of mussel structure dragon currents (Cranford et al. 2014). Current speedswithin the farm averaged 0.027 m s−1 and are inaccordance with previously measured current speedsin and around mussel farms in Skive Fjord (Stevens &Petersen 2011). Published CR values for individual
M. edulis of standard size vary over a wide range,owing largely to responses to ambient food concen-tration and composition; in situ CR measurementscan differ greatly from the theoretical maximum (e.g.Maar et al. 2008, Cranford et al. 2011). Re-filtration ofwater by dense populations, particularly during peri-ods of low flows and reduced turbulent mixing, alsoaffects predictions of food depletion rates (Saurel etal. 2013, Cranford et al. 2014). Instead of employingCR values from previous studies for modelling pur-poses, the average realized CR of the farmed musselswas calculated by solving Eq. (3) analytically assum-ing steady-state conditions (∂t = 0). We assumed con-stant food depletion (Cx/C0), current velocity anddensity of mussels within a uniform water mass dur-ing each sampling period in the estimation of anaverage realized CR:
(4)
where Cx and C0 are the downstream and upstreamfood concentrations, respectively. The ratio Cx/C0
was the average depletion across the length (x) of themussel farm measured on 1 September 2010 and 10May 2011 using the Acrobat survey data. Eq. (4) wasapplied for a single farm section (250 × 200 m) with xset as half the distance across the section in the pre-vailing current direction and Cx/C0 measured in thecenter of the section using subsets (C0 = inflow sideand Cx = farm center) of the Acrobat survey data. Thecomplete farm was not modelled owing to potentialcomplications imposed by the 50 m of open waterthat separated each farm section in which verticaland horizontal mixing could occur, and possible en -hanced mixing at the edges of the farm (see ‘Discus-sion’). In September, the current direction was ap -proximately 270° and the distance to the center of thefarm section was 125 m, whereas in May the currentdirection was 180° and x = 100 m. Realized CR wasestimated from Eq. (4) for the average (±SD) abun-dance of mussels measured on the correspondingsampling dates.
The growth rate, μ (d−1), of mussels was estimatedfrom CR as:
(5)
where B is the individual biomass (g DW, see Table 2),and assimilation efficiency, AE = 0.75 (van der Veeret al. 2006), active respiration, Ra = 1.12 (Clausen &Riisgård 1996) and maintenance respiration, Rm =0.475 × DW0.66 (Hamburger et al. 1983). Model sce-
CRln
0( )
=−
××
CC
x Nu
x
dd
( , ) CRt uCx
C x t N∂ = − + × ×
(CR AE )m
aμ = × × −
×C RB R
316

Nielsen et al.: Nutrient extractive mussel farm in a eutrophic area
narios with increasing mussel densities were con-ducted using the following equation to test the effecton downstream chl a concentrations and percentagedepletion (Eq. 2). Downstream concentrations at dis-tance x (m) were estimated from:
(6)
Scenarios with increasing mussel densities wererun for the September 2010 and May 2011 samplingperiods using the realized CR values (see Table 4).This assumes that re-filtration at the scale of indi -vidual mussel ropes was independent of the numberof ropes present on each date. The scenarios weretested for the range of measured upstream chl a con-centrations from May to October. A lower targetthreshold for phytoplankton concentration was setto 1 mg chl a m−3, because CR has been reported toreduce at 0.5 to 1.0 mg m−3 (Dolmer 2000b, Riisgårdet al. 2006, Saurel et al. 2007, Pascoe et al. 2009). Thetotal population filtration rate (F, g DW m−3 d−1) forone farm section was calculated as:
F = CR × C × N (7)
where C is the average chl a concentrations convertedto DW using a DW:C ratio of 2.5 (Smaal et al. 1997)and C:chl a ratio of 30 (Olesen & Lundsgaard 1995).
RESULTS
Mussel biomass and growth
The density (no. m−1) and biomass (kg WW m−1, in-cluding meat and shell) of mussels, averaged over the3 sections (north, middle and south) of the musselfarm are presented in Table 1, along with the meas-ured total amount of nitrogen and phosphorus re-
moved in December 2010, March and May 2011 (datafrom Petersen et al. 2014). Mussel density decreasedexponentially over the experiment through self-thinning, The highest mussel biomass (1100 t WW)was reached in May 2011, which also resulted in thehighest amount of nutrients removed (Table 1).Mussel biomass increased during the growth season,except during winter when the farm was covered withice (Fig. 2). No significant differences in mean musselbiomass (kg WW m−1 rope) among the 3 sections weredetected on each sampling date (p = 0.07; Table 2), al-though the mean effect between dates was highly sig-nificant (Table 2). In addition, no differences were ob-served (p > 0.09) when comparing the mean DW ofindividual mussel tissue from the 3 sections on eachsampling date (data not shown). Fig. 3 shows the bio-mass (kg WW m−1 rope) of whole mussels (meat andshell) collected at the edge line and middle line on 4different sampling dates in 2010. No significant differ-ences for any of the 4 sampling dates were detectedwhen comparing mussel biomass (Student’s t-test,p > 0.26) or mean DW of mussel tissue (data notshown; Student’s t-test, p > 0.08) collected from theedge line versus middle line at a given sampling date.
Since no significant spatial differences in musselbiomass or dry tissue mass were observed on anygiven sampling date, data from all sections werepooled and the average farm values for the differentsamplings dates (mussel tissue DW data from Julywas not estimated) were used to calculate growthrates. The highest specific growth rate (7.1% d−1) wasobserved in August–September (Fig. 4), whereasfrom October until March, mussel tissue DW de -creased (Mann-Whitney U-test, p = 0.003) resultingin a negative specific growth rate for that time period(Fig. 4). The estimated growth rates were 48 to 57%of maximum from September to March, but at maxi-mum from March to May (Fig. 4).
expCR
0 ( )= − × ×C C
N xux
317
Date Shell length DW Biomass Farm biomass Mussel density N and P (mm) (g) (kg WW m−1) (t WW) (ind. m−1) removed (t)
14 Jul 2010 6.2 ± 1.5 na 1.3 ± 0.6 119 ± 55 52070 ± 23318 na3 Aug 2010 11.6 ± 4.3 0.015 ± 0.007 1.6 ± 0.6 146 ± 54 6401 ± 1935 na1 Sep 2010 21.0 ± 5.1 0.135 ± 0.054 5.7 ± 1.8 513 ± 160 4621 ± 1527 na27 Sep 2010 27.1 ± 6.6 0.236 ± 0.102 8.1 ± 1.8 732 ± 163 4099 ± 1223 na28 Oct 2010 30.7 ± 9.4 0.359 ± 0.147 9.5 ± 3.5 855 ± 315 2937 ± 790 N: 11, P: 0.516 Mar 2011 30.4 ± 10.0 0.261 ± 0.162 7.0 ± 2.7 629 ± 241 2551 ± 1185 N: 10.5, P: 0.510 May 2011 37.2 ± 12.0 0.547 ± 0.241 12.2 ± 2.1 1098 ± 188 2316 ± 699 N: 16, P: 0.7
Table 1. Mean (±SD) values, taken on 7 different sampling dates, of blue mussel Mytilus edulis shell length, tissue dry weight(DW), biomass (wet weight, WW m−1 of rope), estimated farm mussel biomass, density of mussels m−1 of rope and estimatedtotal amount of nitrogen (N) and phosphorus (P) in the mussels (meat, shells and byssus) at the extractive mussel farm shown
in Fig. 1. Data on N and P removed are from Petersen et al. (2014). na: not available

Aquacult Environ Interact 8: 311–329, 2016
Water clarification by extractive mussels
Phytoplankton standing stock in Skive Fjord
Chl a concentrations at Stns M and C varied from3.8 to 26.6 μg chl a l−1 during the year, with thehighest concentrations measured in June, July andSeptember 2010 (>20 μg chl a l−1) and the lowest concentrations in November 2010 (<5 μg chl a l−1)(Fig. 5). With the exception of April and November,chl a concentrations in Skive Fjord exceeded DanishNature Agency and EU threshold values for ‘bad’ or‘poor’ status (https://goo.gl/RjqCcz). The mean (±SE)chl a concentration was not significantly different (Wil -coxon paired t-test, p = 0.80) between Stn M (12.7 ±1.7 μg chl a l−1) and Stn C (13.3 ± 2.2 μg chl a l−1).
Small-scale phytoplankton depletion
The siphon mimic measurements typically showeda gradient in chl a concentrations (>3 μm size frac-tion) from the mussels out to a distance of 10 to 20 cm
on each sampling date (Fig. 6). The average (±SE)depletion percentage in water immediately adjacentto mussels in August 2010 and May 2011 was 44 ±11% and 27 ± 4%, respectively (Fig. 6A), which cor-responded to mean (±SD) chl a concentrations at thefarm of 7.4 ± 2.2 and 11.9 ± 5.4 μg chl a l−1. A cleardepletion gradient in the >3 μm particle size fractionwas observed for 6 out of 7 sampling days (linearregression analysis; p = 0.07 and p = 0.03 for August2010 and May 2011, respectively; data not shown).The picoplankton fraction (0.2 to 3 μm), which is inef-fectively captured by mussels and served as a controlfor any other possible effects on the phytoplanktondistribution, did not exhibit a depletion gradient forany sampling date (Fig. 6B).
318
14 Jul 3 Aug 1 Sep 27 Sep 28 Oct 16 Mar 10 May20112010
0
5
10
15
20
Sampling date
Bio
mas
s (k
g W
W m
–1)
North Middle South
Fig. 2. Mean (+SD) mussel wet weight (WW) biomass m−1 of rope (n = 30 biomass samples for each section at each samplingdate, except for south on 16 March and 10 May 2011, where n = 5) from the 3 different sections in the mussel farm (north,
middle and south) on 7 different sampling dates during the 2010−2011 growth season
df MS F p
Section × sampling day 10 4.435 0.8406 0.59Sections 2 14.26 2.703 0.07Sampling day 5 273.3 51.8 <0.0001Residual 147 5.275
Table 2. Results from 2-way ANOVA testing overall differ-ences in mussel biomass (kg WW m−1) collected at the dif -ferent sections (north, middle and south) of the mussel farm
and on different sampling dates
3 Aug 1 Sep 27 Sep 28 Oct0
5
10
15
20
Bio
mas
s (k
g W
W m
–1)
Sampling date
Middle Edge
Fig. 3. Mean (+SD) mussel wet weight (WW) biomass m−1 ofrope (n = 9 biomass samples for each section at each sam-pling date) at the edge and middle lines in the mussel
farm sampled on 4 different dates in 2010

Nielsen et al.: Nutrient extractive mussel farm in a eutrophic area
Farm-scale seston and phytoplankton depletion
It was generally not possible to detect the depletionof phytoplankton by comparing the results of chl afluorescence obtained with discrete CTD-casts withinand near the farm during the study period. Compari-son of fluorescence was only done on sampling dayswhen the salinity profiles measured at the 4 samplingstations (N, M, S and C) exhibited uniform waterproperties (e.g. same salinity profile at each station).The mean salinity (1 to 3 m depth) measured at the 4sampling stations was not significantly different (p >0.50) on 12 of the 22 sampling days. Of those 12 d,comparisons of mean fluorescence (1 to 3 m depth)between farm and the reference stations detectedsignificant differences on only 5 d (p < 0.05). How-
ever, significant reductions in chl a on each of these5 d was not detected at all of the farm stations.
As noted above, the high-resolution 3D Acrobatsurvey data showed that water density in the surveydomain was sufficiently spatially uniform on 1 Sep-tember 2010 and 10 May 2011 to permit the accuratecalculation of chl a and TPM depletion. The remain-ing Acrobat surveys indicated a high degree ofsmall-scale spatial variability in water density in theregion around the farm. On 1 September 2010, chl aand TPM concentrations interpolated over the surveydomain and within the 0.5 to 5 m depth range wererelatively low within the mussel farm compared withmuch of the outside region (Fig. 7). The exceptionwas a plume of depleted water that extended out-ward from the farm in a westerly direction (Fig. 7),which is consistent with the observed current direc-tion. The TPM data collected on 10 May 2011 alsoshowed reduced levels within the farm, with lowestconcentrations observed at the center of the farm(Fig. 8). The spatial distribution of chl a is not shownin Fig. 8, owing to the presence of a strong depth gra-dient throughout the region that resulted in a com-plex 2D contour map that reflected both horizontaland vertical chl a variations.
The percentage food depletion inside the musselfarm was greatest on 1 September 2010 and reacheda maximum of approximately 80% for both chl a andTPM (Fig. 9) compared with a maximum of approxi-mately 50% depletion of TPM on 10 May 2011(Fig. 10). The percentage food depletion averagedwithin the total farmed volume (Df) on the 2 differentsampling days varied between 13 and 31%, withslightly higher depletion of chl a relative to TPM(Table 3). The chl a depth gradient on 10 May 2011,which prevented presentation of a depth-integratedcontour map in Fig. 8, was present in both the farmand reference areas, permitting the calculation ofaverage farm-scale chl a depletion. Food depletionmeasured at different distances across the farm (Dx)are also presented in Table 3. Depletion across thetotal farm distance (in the prevailing current direction)averaged 45% for both TPM and chl a on 1 Septem-ber 2011, but averaged only approximately 5% on 10May 2011. In contrast, depletion to the central part ofthe farm was 37% in 2010 and 33% in 2011 (Table 3).
Depletion model
Mussel densities employed in the model were616 ± 430 and 309 ± 180 ind. m−3 (mean ± SD) in Sep-tember and May, respectively. Based on the meas-
319
0
2
4
6
8
Timespan
Sp
ecifi
c gr
owth
(% d
–1)
Aug-Sep Sep Sep-Oct Oct-Mar Mar-May
Actual Maximal
Fig. 4. Average specific growth rates of individual mussels (%d−1) measured within the experimental farm (white bars) andthe corresponding calculated potential maximal growth(grey bars) for selected periods (see ’Materials and methods’)
Jan Mar May Jul Sep Nov0
10
20
30
40
Month
Chl
a (µ
g l–
1 )
GoodModerate
Bad
Poor
High
Fig. 5. Mean (±SD) chl a concentrations in Skive Fjord during 2010−2011. Data were collected at Stns M and C(see Fig. 1). Also shown are threshold values for the WaterFrame Directive separating the ecological states ‘high’,
‘good’, ‘moderate’, ‘bad’ and ‘poor’ (horizontal lines)

Aquacult Environ Interact 8: 311–329, 2016
ured chl a depletion levels at the centre of the farm(Table 3), the model estimated a realized CR of 0.60 lh−1 (6.94 × 10⁻⁹ m3 s−1) and 1.26 l h−1 (14.58 × 10⁻⁹ m3
s−1) (Eq. 4) and growth rates of 4.1 d−1 and 1.6 d−1 (Eq.5) for Sep tember and May, respectively (Table 4). Inthe model scenarios, increasing mussel densityresulted in ex ponentially lower downstream chl aconcentrations (Fig. 11). The target threshold of 1 mgm−3 was reached at 1500 and 1000 ind. m−3 on 1 Sep-tember and 10 May, respectively (Fig. 11). The popu-lation filtration rate increased with higher number ofmussels and was similar at around 5 g DW m−3 d−1 forthe 2 days (Fig. 12). These results suggest that mus-sel-stocking levels at the farm are below the capacityof the farmed mussels to capture nutrients and clarify
the water column. The density of mussels in the farmcould almost be doubled and still maintain a foodconcentration within the farm of ≥1 mg m−3 (Fig. 11).
DISCUSSION
The mussel growth data indicated that the farm inSkive Fjord was under-utilized in terms of productionof mussel biomass, water clarification capacity andnutrient extraction. The specific growth rates of mus-sels were 48 to 98% of maximum except during winter. In addition, there was no significant differ-ence in dry tissue growth or mussel biomass on ropes(kg WW m−1) between the 3 farm sections (Table 2),
320
0 10 20 30 40 500
10
20
30
40
50
60
Distance from mussels (cm) Distance from mussels (cm)C
hl a
dep
letio
n (%
)
Aug 2010May 2011
Aug 2010May 2011
A0 10 20 30 40 50
0
5
10
15
20
25Pic
opla
nkto
n d
eple
tion
(%)
B
Fig. 6. Mean (±SE) depletion percentages of (A) chl a (n = 10 in August and 12 in May; retained on 0.7 μm porosity filters)measured at different distances from the mussel rope sampled in August 2010 and May 2011 by siphon mimics at 2 m depth,and (B) the picoplankton fraction (measured here as between 0.7 to 3 μm diameter) at different distances from the mussel rope
Fig. 7. Acrobat tow track on 1 September 2010 in Limfjorden (left) and contour maps of chl a and total suspended particulatematter (TPM) integrated over the 0.5 to 5 m depth range. White polygon: location of the mussel farm; red line: survey route

Nielsen et al.: Nutrient extractive mussel farm in a eutrophic area
or between the center and edge lines of the farm(Fig. 3). These results indicate that mussel growthwas not food limited during the 2010−2011 growthseason and that the production carrying capacity of
the farm had not been not reached even though thisnutrient extractive farm was more densely packedthan a typical Danish commercial mussel farm. Consequently, the ecosystem services provided by
321
Fig. 8. Acrobat tow track (red) on 10 May 2011 in the Limfjorden (left) and contour map of total suspended particulate matter(TPM) integrated over the 0.5 to 5 m depth range. Chl a data were not mapped as in Fig. 7, owing to a strong depth gradient.
White polygon: location of the mussel farm
Fig. 9. Contour maps of the percentage depletion of chl a and total particulate matter (TPM) in the vicinity of the Limfjordenexperimental mussel farm on 1 September 2010. The locations of data collected inside the mussel farm are indicted as red dotsin the left plot and the reference data are similarly shown in the right. Note that the reference area excluded data collected
to the west of the farm
Aquacult Environ Interact 8: 311–329, 2016
the Skive Fjord nutrient extractive farm could beincreased.
The water clarification capacity of the mussels wasdemonstrated at the spatial scale of individual mussel
ropes as well as the whole farm. The siphon mimicexperiments showed small-scale depletion of phyto-plankton on 6 of 7 sampling days during both fieldcampaigns, with an effective mussel ‘feeding zone’ of10 to 20 cm (Fig. 6A). This zone is in accordance withprevious observations of chl a depletion gradientsabove mussel beds (e.g. Muschenheim & Newell1992, Dolmer 2000a, Nielsen & Maar 2007, Petersenet al. 2013, Saurel et al. 2013). The average chl adepletion of 27% (May) and 44% (August) was lowerthan the 63 to 74% reduction reported by Petersenet al. (2008), who used the siphon mimic method ata raft culture of Mytilus galloprovincialis in Spain.The higher depletion at the Spanish site may be ex -plained by the higher rope stocking biomass (15 kgm−1) reported in that study compared with the stocking levels shown in Table 1.
Although farm-scale food depletion could not bedetected by profile sampling at discrete farm and references stations, the intensive 3D spatial surveyapproach detected reductions in phytoplankton(chl a) and total seston (TPM) concentrations withinthe farm (Df) of between 13 and 31% during the 2sampling periods (Table 3). The depletion of bothphytoplankton and total seston was similar, with<5% difference in Df estimates (Table 3); similar spa-tial patterns were observed (Fig. 9). The replicationof results using chl a and turbidity sensors provides ahigh level of confidence in the food depletion esti-mates. Food depletion levels in excess of 50%occurred in some sections of the farm (Figs. 9 & 10).The presence of a food depletion maximum in the
322
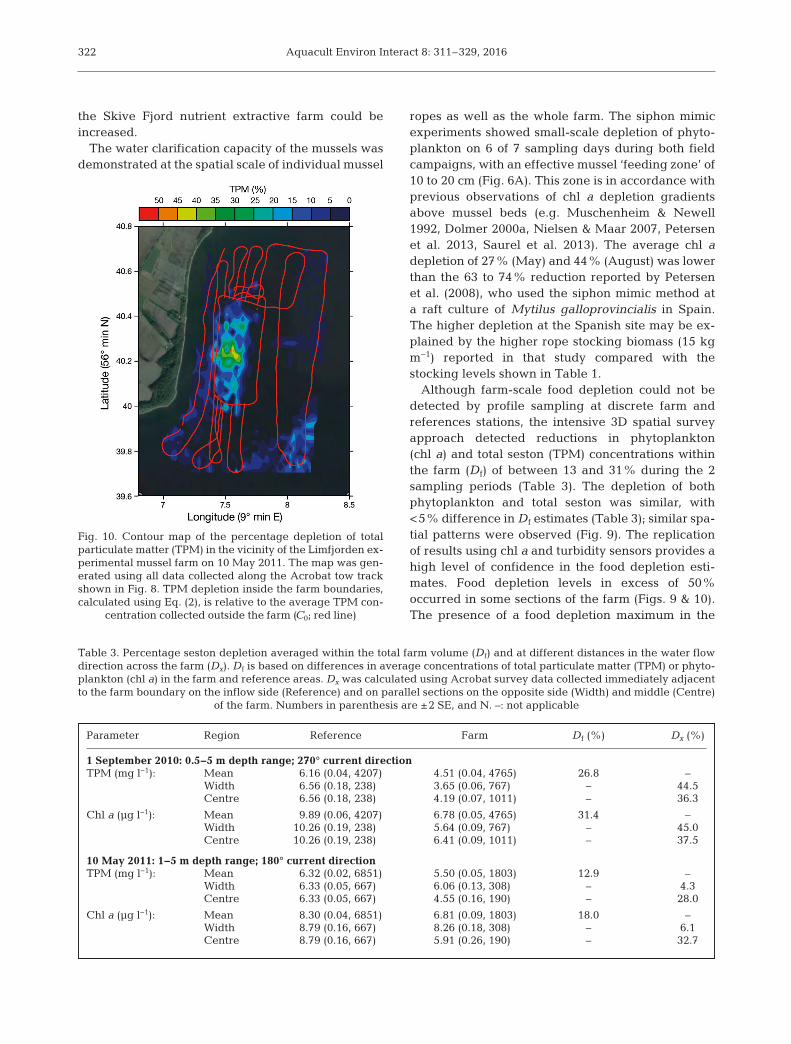
Fig. 10. Contour map of the percentage depletion of totalparticulate matter (TPM) in the vicinity of the Limfjorden ex-perimental mussel farm on 10 May 2011. The map was gen-erated using all data collected along the Acrobat tow trackshown in Fig. 8. TPM depletion inside the farm boundaries,calculated using Eq. (2), is relative to the average TPM con-
centration collected outside the farm (C0; red line)
Parameter Region Reference Farm Df (%) Dx (%)
1 September 2010: 0.5−5 m depth range; 270° current directionTPM (mg l−1): Mean 6.16 (0.04, 4207) 4.51 (0.04, 4765) 26.8 –
Width 6.56 (0.18, 238) 3.65 (0.06, 767) – 44.5Centre 6.56 (0.18, 238) 4.19 (0.07, 1011) – 36.3
Chl a (μg l−1): Mean 9.89 (0.06, 4207) 6.78 (0.05, 4765) 31.4 –Width 10.26 (0.19, 238) 5.64 (0.09, 767) – 45.0Centre 10.26 (0.19, 238) 6.41 (0.09, 1011) – 37.5
10 May 2011: 1−5 m depth range; 180° current directionTPM (mg l−1): Mean 6.32 (0.02, 6851) 5.50 (0.05, 1803) 12.9 –
Width 6.33 (0.05, 667) 6.06 (0.13, 308) – 4.3Centre 6.33 (0.05, 667) 4.55 (0.16, 190) – 28.0
Chl a (μg l−1): Mean 8.30 (0.04, 6851) 6.81 (0.09, 1803) 18.0 –Width 8.79 (0.16, 667) 8.26 (0.18, 308) – 6.1Centre 8.79 (0.16, 667) 5.91 (0.26, 190) – 32.7
Table 3. Percentage seston depletion averaged within the total farm volume (Df) and at different distances in the water flowdirection across the farm (Dx). Df is based on differences in average concentrations of total particulate matter (TPM) or phyto-plankton (chl a) in the farm and reference areas. Dx was calculated using Acrobat survey data collected immediately adjacentto the farm boundary on the inflow side (Reference) and on parallel sections on the opposite side (Width) and middle (Centre)
of the farm. Numbers in parenthesis are ±2 SE, and N. –: not applicable

Nielsen et al.: Nutrient extractive mussel farm in a eutrophic area
center of the mussel farm on 10 May 2011was also observed by Petersen et al.(2008) at a mussel raft in Spain. This phe-nomenon may result from entrainment ofwater into the farm from the raft sides,and enhanced mixing near the outflowside of the farm. Both processes are asso-ciated with interactions between the flowaround the mussel farm and the reducedflow through the farm caused by dragfrom mussel structures (Cranford et al.2014). Measurements of food depletionfor the middle of the farm (Table 3; Dx forcenter region) were higher in September2010 (36 to 38% lower than outside thefarm) than in May 2011 (28 and 33%).The higher depletion on the former dateoccurred despite the presence of smallermussels with a relatively low feedingrate compared with the larger musselspresent in 2011. Mussel densities werereduced by half through self-thinningbetween these sampling pe riods (Table 1),and approximately 25% of the long-linesin the farm had been harvested or re -moved by ice. The feeding pressure onthe food supply during May 2011 wastherefore reduced compared with Sep-tember 2010.
On 1 September 2010, when the cur-rent was flowing towards the west, TPMand chla concentrationsdeclined markedlyfrom the inflow to outflow side of the farmand a plume of depleted water extendedto the west of the farm towards the shore-line (Figs. 7 & 9). However, on 10 May2011, when the current was flowing tothe south, no plume of depleted waterwas observed to exit the farm (Figs. 8 &10). The presence of the shoreline andthe rapid decrease in water depth to thewest of the farm may exacerbate fooddepletion by reducing outflow and in -creasing water retention time inside thefarm. The interaction of water flow withcoastal morphology, in addition to theabove noted changes in mussel biomassbetween sampling dates, help to explainthe higher levels of food depletion occur-ring in September 2010 compared withthe latter observations. When the waterflow through the farm was less impededby bottom drag on 10 May 2011, average
323
B) September
0 1000 2000 3000 4000 5000 6000
0 1000 2000 3000 4000 5000 6000
Dow
nstr
eam
chl
a c
once
ntra
tion
(mg
m–3
)
0
2
4
6
8
10
12
14
16
18
20
B) September
Mussel density (ind. m–3)
0
2
4
6
8
10
12
14
16
18
20
A) 1 September 2010
B) 10 May 2011
Fig. 11. Model scenario of increasing mussel densities and the effect ondownstream chl a concentrations on 2 campaign days. Grey area: effect ofchanging the upstream average chl a concentrations within the observed an-nual range at Stn C (Fig. 1). Solid black line: range of observed mussel density(mean ±1 SD); thick line: actual data; thin line: model (incl. actual data). Greylines: 95% confidence interval. Black dashed line: lower threshold (where
Danish studies have shown mussels to reduce their clearance rates)
1 September 2010 10 May 2011
Current direction East−West North−SouthCurrent speed inside farm (m s−1) 0.027 ± 0.013 0.027 ± 0.008Upstream current speed (m s−1) 0.035 ± 0.018 0.037 ± 0.009Average current speed (m s−1) 0.031 ± 0.023 0.032 ± 0.005Mussel density (ind. m−3) 616 ± 430 309 ± 180Distance to the farm centre (m) 125 100Chl a depletion ratio (Cx/C0) 0.62 0.67Estimated realized CR (l h−1) 0.60 1.26Growth rate (d−1) 4.1 1.6
Table 4. Environmental and mussel farm variables (mean ± SD) used inthe depletion model for the 2 campaign days and the model estimated
clearance rate (CR) and growth rate

Aquacult Environ Interact 8: 311–329, 2016
food depletion within and across the farm was lower(Table 3).
Considering that mussel growth, food limitationand seston depletion are interrelated (e.g. Fuentes etal. 2000, Aure et al. 2007, Strohmeier et al. 2008,Rosland et al. 2011) the lack of significant spatialvariations in mussel growth within the Skive Fjordfarm appear to conflict with the results showing highlevels of food depletion in this farm. Several previousstudies have reported differences in mussel growthwithin different sections of a farm (Navarro et al.1991, Grant et al. 1993, Heasman et al. 1998, Stroh -meier et al. 2005, 2008) and have quantified thedegree of food depletion (Pérez Camacho et al. 1991,Heasman et al. 1998, Strohmeier et al. 2005, 2008,Cranford et al. 2008, 2014, Petersen et al. 2008).However, these studies were conducted at lowerchl a concentrations (<6 μg l−1) than reported hereinfor the Skive Fjord (Fig. 5, Table 3), and according toPetersen et al. (2008) and Strohmeier et al. (2005),lower individual growth rates related to food deple-tion will occur more often in areas with low food con-centrations than in nutrient-rich areas. Since SkiveFjord is highly eutrophic (Maar et al. 2010, Car -stensen et al. 2013, Tomczak et al. 2013), the musselfarm was generally supplied with high food concen-trations throughout most of the year (Fig. 5). Despitethe steep depletion gradients shown in Fig. 6A, chl aconcentrations were still relatively high (11.9 ± 5.4in May and 7.4 ± 2.2 μg chl a l−1 in August) just 0.1 cmaway from the mussel ropes. Chl a and TPM concen-trations also did not decrease below 2 μg l−1 or 2 mgl−1, respectively, at any location within the mussel
farm and the zone of maximum food depletion didnot consistently occur in the same location (Figs. 7 &8). These data indicate that the replenishment of thefood supply to the mussels was sufficient to preventmussel growth being food limited due to food deple-tion. Furthermore, mussel filtration and other physio-logical components of growth are related to food concentration (reviewed by Cranford et al. 2011),resulting in a non-linear relationship between foodabundance and growth.
The discrete CTD/salinity profiles and the towed-vehicle surveys showed a high degree of spatial andtemporal variation in the physical and biologicalproperties of the water column in the Skive Fjordduring this study. On many of the sampling dates,different density water masses were simultaneouslypresent within the farm. These masses often con-tained different food concentrations, such that ahighly variable food supply was provided to the mus-sels. Farm-scale food depletion could only be meas-ured for 2 of the 7 Acrobat survey dates as a result ofthe presence of water mass variability within thefarm. This is purely a methodological limitation and itmay be expected that the mussels were continuouslyfeeding and depleting the food supply. The high vari-ability in food supply is a possible additional reasonwhy there was no significant difference in musselgrowth detected between the edge and middle of thefarm (Figs. 2 & 3, Table 2). In order for mussel growthto reflect spatial patterns in food depletion, the natu-ral spatial variation in the food supply would have tobe less than the variation induced by mussel feeding.Small-scale patchiness in the supply of food to thefarm appears to dominate over food depletion as afactor limiting mussel growth in this region.
Model predictions of the impact of increasing mus-sel stocking on the available food supply (Fig. 11)were conducted in this study to estimate the optimalfarm stocking density for increasing water qualityand extracting excess phytoplankton in this highlyeutrophic setting. Optimization of commercial shell-fish culture is based on the production carryingcapacity concept, which is the cultured biomass and/or growth rate that can be sustained by availablefood in a given area (Grant & Filgueira 2011). Theoptimal stocking of a nutrient extraction facility maybe expected to be similarly constrained given thatthe objective is also to harvest the maximum biomassfrom the farm over a given time, albeit with less con-cern over product quality. Carrying capacity modelsgenerally follow an ecophysiological approach thatsimulates the physiological components of shellfishgrowth, including water clearance rates. Mussel CRs
324
Mussel density (ind. m–3)0 500 1000 1500 2000 2500 3000 3500
Filtr
atio
n ca
pac
ity (g
-DW
m–3
d–1
)
0
5
10
15
20Sep modelMay modelSep dataMay data
Fig. 12. Filtration capacity as a function of mussel densities(lines) and average mussel density (circles) on 2 campaign
days (1 September 2010 and 10 May 2011)

Nielsen et al.: Nutrient extractive mussel farm in a eutrophic area
are related to site-specific population dynamics andenvironmental change (e.g. Filgueira et al. 2010,Cranford et al. 2011, Petersen et al. 2013, Riisgård etal. 2013) and are therefore best predicted afterobtaining extensive measurements. An alternative isto obtain realized CR information based on the back-calculation of the effect of shellfish grazing on thefood supply (Aure et al. 2007) or growth (Fréchette &Bacher 1998). The realized CRs of mussels at theSkive Fjord farm (Table 4), calculated based onEq. (4) for the 2 d when farm-scale food depletionwas measured, were used to model mussel growth(Eq. 7) and food depletion (Eq. 2) at increasing stock-ing densities, as a means towards predicting the opti-mal stocking density.
The estimated realized CRs were 0.60 and 1.26 lh−1, respectively, on 1 September 2010 and 10 May2011. According to Cranford et al. (2011), the 0.14and 0.55 g DW mussels (September 2010 and May2011, respectively) fed natural seston may be ex -pected to exhibit average CRs of 1.0 and 2.3 l h−1,respectively, whereas maximal CRs obtained in labo-ratory studies with optimal algal-cell diets may beexpected to average 1.8 l h−1 for a 0.14 g mussel and4.9 l h−1 for a 0.55 g mussel (Møhlenberg & Riisgård1979, Riisgård & Møhlenberg 1979). Consequently,the estimated realized CR for each date is 40 to 74%lower than published values. Experimental CR val-ues may be expected to overestimate the realizedrate under some conditions, as a result of water re-filtration by multiple mussels during passage througha farm, particularly during periods of low flow.Experimental CR measurements are required to beconducted under controlled conditions that preventwater re-filtration by the mussel(s) (e.g. Filgueira etal. 2006). However, the siphon mimic experimentsshowed that the effective ‘feeding zone’ of a musselis of a length-scale that would influence the food supply of neighboring mussels. The food depletionmodel developed for Spanish mussel raft culture(Cranford et al. 2014) accounted for this re-filtrationeffect by including a function that simulates the relationship between flow-speed, water re-filtrationand CR. They concluded that neglecting the effectsof re-filtration on CR will otherwise result in largeoverestimates of food depletion during periods of relatively low cur rent speeds (<2 cm s−1). Musselstructure drag can have a large effect on water flowthrough a mussel farm and on food depletion (Cran-ford et al. 2014 and references therein). The presentmodel (Eq. 4) uses the mean current speed in themiddle of the farm to provide an approximation of thenet effect of drag-induced flow reduction on current
speed and the related effect on CR caused by waterre-filtration.
The effect of water re-filtration on mussel CRwithin a farm will be highly site- and time-specific asa result of the interacting influences of mussel den-sity and size, current speed, the orientation of musselstructures in a farm and circulation patterns aroundsingle and multiple mussel structures. To our knowl-edge, there are only a few other studies that have calculated realized mussel farm CRs (Aure et al.2007, Petersen et al. 2008). Based on different modelassumptions, Aure et al. (2007) estimated a meanrealized CR of 1.3 to 2.7 l h−1. Given that no musselsize was reported in that study for comparison withpublished CR values, it is not possible to determine ifthese realized rates are also lower than experimentalvalues. Petersen et al. (2008) reported a realized CRvalue of 2.9 l h−1, which is 60 to 90% of potentialCRs for similar sized mussels. A realized CR value of0.17 l h−1 was reported for bottom mussels in a differ-ent area of the Limfjorden (Petersen et al. 2013).Saurel et al. (2013) reported an average realized CRvalue of 2.93 ± 1.56 l h−1 in the tidal driven MenaiStrait, North Wales, UK, were turbulent mixing pre-vents re-filtration. In all cases, the realized CR ofdense mussel populations was lower than reportedfor individuals measured under optimal flow and/ordietary conditions.
The optimal stocking density of the farm was de -fined by setting a target phytoplankton biomassthreshold of 1 mg chl a m−3. Reducing chl a to lowerlevels may not be possible due to the observed cessa-tion of mussel feeding at lower concentrations in thistype of environment (Dolmer 2000b, Riisgård et al.2006, Saurel et al. 2007). Based on this threshold, theresults of the depletion model (based on Eqs. 2 & 6)indicate that the mussel population filtration ratecould be increased by 80 to 120% in order to reachthe target threshold. This could be accomplished byapproximately doubling the standing stock of mus-sels in the farm (Fig. 12) and still maintaining a foodconcentration within the farm of ≥1 mg m−3 (Fig. 11).This would represent a dramatic increase in waterclarity over current conditions (Fig. 5). An option forreaching the desired increase in stocking may be todecrease the intervals between loop attachmentpoints on the existing long-lines. A doubling of thestanding stock of mussels would result in a netremoval of 32 t N and 1.4 t P using the measured N-and P-contents for May 2011 (Table 1) reported byPetersen et al. (2014). This corresponds to N removalof 1.8 t ha−1 yr−1. This estimate is higher than theremoval of 0.1 to 0.7 t ha−1 yr−1 estimated by the
325

Aquacult Environ Interact 8: 311–329, 2016
FARM-model for long-line cultures of Mytilus spp. at3 other European sites (Rose et al. 2015) and is alsohigher than the removal of 1.1 t ha−1 yr−1 estimatedin a field study on the Swedish west coast (Lindahlet al. 2005).
Achieving the theoretical maximum ecosystemservices from extractive culture may be constrainedby a number of factors. Mussel density on the ropesdecreased by 50% between September 2010 andMay 2011 (Table 1) due to self-thinning. Increasingthe density on the rope therefore does not appear tobe an option for doubling the mussel stock. The addi-tion of additional long-lines in the farmed area wouldinterfere with service vessel access to the lines. In -creasing the mussel biomass within the mussel farmwould, on the other hand, cause additional flowreduction (e.g. Petersen et al. 2008, Stevens &Petersen 2011, Cranford et al. 2014), which wouldincrease water re-filtration by the mussels and re -duce realized CRs, growth rates and nutrient extrac-tion. Increasing mussel density may therefore beexpected to reach a self-limited threshold for theextraction of excess phytoplankton that is specific toa given area. An additional constraint for optimizingan extractive mussel farm is the possible effects onbenthic habitat and communities from the depositionof organic matter in mussel faeces and pseudofaeces.Observations of benthic effects from bivalve farmingare generally limited to the immediate vicinity of thefarm in shallow, poorly flushed regions (Chamberlainet al. 2001, Hartstein & Stevens 2005, Hargrave et al.2008, Carlsson et al. 2009, 2010, Cranford et al. 2009).Benthic impacts at the Skive Fjord mussel farm wereshown to be limited compared to the surroundingarea due to the high rate of sediment organic enrich-ment from eutrophication (Holmer et al. 2015). Whilemussel farming may not improve existing eutrophicbenthic conditions under some farms, the removal ofexcess phytoplankton and nutrients from the watercolumn should result in a net reduction in benthicorganic enrichment and associated impacts at thecoastal ecosystem scale.
Mussel mitigation farming has focused on the eco-logical benefits of sequestering excess nutrients thatare removed from the system (e.g. Petersen et al.2015 and references within). However, ancillary eco-system services from mussel farming include themediation of additional nutrients in biodepositsbeing buried in sediments or lost through microbialdenitrification (Newell et al. 2004) and the removal ofexcess phytoplankton and other suspended particu-lates (e.g. Petersen et al. 2008, 2015, Cranford et al.2014, Newell & Richardson 2014), which will en -
hance light penetration and water quality (Schröderet al. 2014, Petersen et al. 2015) and reduce theoccurrence of anoxic events (Newell 2004). Musselropes and anchors can also provide a temporary habi-tat for other species (Murray et al. 2007, D’Amourset al. 2008, Wilding & Nickell 2013). Beside these ecological services, the mitigation mussels providegoods for human consumption (Lindahl 2011, Pe -tersen et al. 2014), feed for husbandry (Jönsson &Elwinger 2009, Jönsson et al. 2011, Nørgaard et al.2015) and fertilizer (Olrog & Christensson 2008).Nutrient extraction mussel farms represent an effec-tive bioengineering approach for the provision ofpositive coastal ecosystem services and economicbenefits. However, the availability of this mitigationapproach does not negate the need to reduce excessnutrient emissions at the source.
Acknowledgements. We thank Dr. Dave Plew for providingcurrent speed data and for assistance with the towed vehiclesurveys. This study is part of the research project ‘Produc-tion of Mussels−Mitigation and Feed for Husbandry (MuMi-Hus)’ funded by the Danish Council for Strategic Researchunder grant agreement no. 09-066983. P.N. was funded byThe Danish Council for Strategic Research under grantagreement no. 10-078561.
LITERATURE CITED
Aure J, Strohmeier T, Strand Ø (2007) Modelling currentspeed and carrying capacity in long-line blue mussel(Mytilus edulis) farms. Aquacult Res 38: 304−312
Bacher C, Grant J, Hawkins A, Fang J, Zhu M, Besnard M(2003) Modelling the effect of food depletion on scallopgrowth in Sungo Bay (China). Aquat Living Resour 16: 10−24
Carlsson MS, Holmer M, Petersen JK (2009) Seasonal andspatial variations of benthic impacts of mussel longlinefarming in a eutrophic Danish Fjord, Limfjorden. J SeaRes 28: 791−801
Carlsson MS, Glud RN, Petersen JK (2010) Degradation ofmussel (Mytilus edulis) fecal pellets released from hang-ing long-lines upon sinking and after settling at the sediment. Can J Fish Aquat Sci 67: 1376−1387
Carstensen J, Krause-Jensen D, Markager S, TimmermannK, Windolf J (2013) Water clarity and eelgrass responsesto nitrogen reductions in the eutrophic Skive Fjord, Denmark. Hydrobiologia 704: 293−309
Chamberlain J, Fernandes TF, Read P, Nickell TD, DaviesIM (2001) Impacts of biodeposits from suspended mussel(Mytilus edulis L.) culture on the surrounding surficialsediments. ICES J Mar Sci 58: 411−416
Clausen I, Riisgård HU (1996) Growth, filtration and respira-tion in the mussel Mytilus edulis: no evidence for physio-logical regulation of the filter-pump to nutritional needs.Mar Ecol Prog Ser 141: 37−45
Cloern JE (1982) Does the benthos control phytoplankton insouth San Francisco Bay? Mar Ecol Prog Ser 9: 191−202
326
Nielsen et al.: Nutrient extractive mussel farm in a eutrophic area
Cranford PJ, William L, Strand Ø, Strohmeier T (2008)Phytoplankton depletion by mussel aquaculture: highresolution mapping, ecosystem modeling and potentialindicators of ecological carrying capacity. ICES CM2008/H: 12. International Council for the Exploration ofthe Sea, Copenhagen
Cranford PJ, Hargrave BT, Doucette LI (2009) Benthicorganic enrichment from suspended mussel (Mytilusedulis) culture in Prince Edward Island, Canada. Aqua-culture 292: 189−196
Cranford PJ, Ward JE, Shumway SE (2011) Bivalve filterfeeding: variability and limits of the aquaculture biofilter.In: Shumway SE (ed) Shellfish aquaculture and the envi-ronment. Wiley-Blackwell, Oxford, p 81−124
Cranford PJ, Duarte P, Robinson SMC, Fernández-Reiriz FJ,Labarta U (2014) Suspended particulate matter depletionand flow modification inside mussel (Mytilus gallo-provincialis) culture rafts in the Ría de Betanzos, Spain.J Exp Mar Biol Ecol 452: 70−81
D’Amours O, Archambault P, McKindsey CW, Johnson LE(2008) Local enhancement of epibenthic macrofauna byaquaculture activities. Mar Ecol Prog Ser 371: 73−84
Dame RF (1993) Bivalve filter feeders in estuarine andcoastal ecosystem processes. Springer, New York, NY
Dame RF (1996) Ecology of marine bivalves: an ecosystemapproach. CRC Press, Boca Raton, FL
Dolmer P (2000a) Algal concentration profiles above musselbeds. J Sea Res 43: 113−119
Dolmer P (2000b) Feeding activity of mussels Mytilus edulisrelated to near-bed currents and phytoplankton biomass.J Sea Res 44: 221−231
Edebo L, Haamer J, Lindahl O, Loo LO, Piriz L (2000) Recy-cling of macronutrients from sea to land using musselcultivation. Int J Environ Pollut 13: 190−207
Ferreira JG, Saurel C, Lencarte Silva JD, Nunes JP, VazquezF (2014) Modelling of interactions between inshore andoffshore aquaculture. Aquaculture 426–427: 154−164
Filgueira R, Labarta U, Fernandez-Reiriz MJ (2006) Flow-through chamber method for clearance rate measure-ments in bivalves: design and validation of individualchambers and mesocosm. Limnol Oceanogr Methods 4: 284−292
Filgueira R, Fernandez-Reiriz MJ, Labarta U (2010) Clear-ance rate of the mussel Mytilus galloprovincialis. II.Response to uncorrelated seston variables (quantity,quality, and chlorophyll content). Cienc Mar 36: 15−28
Fréchette M, Bacher C (1998) A modelling study of optimalstocking density of mussel populations kept in experi-mental tanks. J Exp Mar Biol Ecol 219: 241−255
Fuentes J, Gregorio V, Giraldez R, Molares J (2000) Within-raft variability of the growth rate of mussels, Mytilus gal-loprovincialis, cultivated in the Ría de Arousa (NWSpain). Aquaculture 189: 39−52
Grant J, Filgueira R (2011) The application of dynamic mod-eling to prediction of production carrying capacity inshellfish farming. In: Shumway SE (ed) Shellfish aqua-culture and the environment. Wiley-Blackwell, Oxford, p135−151
Grant J, Dowd M, Thompson K, Emerson C, Hatcher A(1993) Perspectives on field studies and related biologi-cal models of bivalve growth. In: Dame R (ed) Bivalve filter feeders and marine ecosystem processes. Springer,New York, NY, p 371−420
Grant J, Bacher C, Cranford PJ, Guyondet T, Carreau M
(2008) A spatially explicit ecosystem model of sestondepletion in dense mussel culture. J Mar Syst 73: 155−168
Gren IM, Lindahl O, Lindqvist M (2009) Values of musselfarming for combating eutrophication: an application tothe Baltic Sea. Ecol Eng 35: 935−945
Haamer J (1996) Improving water quality in a eutrophiedfjord system with mussel farming. Ambio 25: 356−362
Hamburger K, Møhlenberg F, Randlov A, Riisgård HU (1983)Size, oxygen consumption and growth in the musselMytilus edulis. Mar Biol 75: 303−306
Hargrave BT, Doucette LI, Cranford PJ, Law BA, MilliganTG (2008) Influence of mussel aquaculture on sedimentorganic enrichment in a nutrient-rich coastal embay-ment. Mar Ecol Prog Ser 365: 137−149
Hart R (2003) Dynamic pollution control—time lags andoptimal restoration of marine ecosystems. Ecol Econ 47: 79−93
Hartstein ND, Stevens SL (2005) Deposition beneath long-line mussel farms. Aquacult Eng 33: 192−213
Heasman K, Pitcher G, McQuaid C, Hecht T (1998) Shellfishmariculture in the Benguela system: raft culture ofMytilus galloprovincialis and the effect of rope spacingon food extraction, growth rate, production, and condi-tion of mussels. J Shellfish Res 17: 33−39
Holm-Hansen O, Lorenzen C, Holmes R, Strickland J (1965)Fluorometric determination of chlorophyll. ICES J MarSci 30: 3−15
Holmer M, Thorsen SW, Carlsson MS, Petersen JK (2015)Pelagic and benthic nutrient regeneration processes inmussel cultures (Mytilus edulis) in a eutrophic coastal area(Skive Fjord, Denmark). Estuaries Coasts 38: 1629−1641
Jönsson L, Elwinger K (2009) Mussel meal as a replacementfor fish meal in feeds for organic poultry—a pilot short-term study. Acta Agric Scand A Anim Sci 59: 22−27
Jönsson L, Wall H, Tauson R (2011) Production and eggquality in layers fed organic diets with mussel meal. Animal 5: 387−393
Landes A, Dolmer P, Poulsen LK, Petersen JK, Vismann B(2015) Growth and respiration in blue mussels (Mytilusspp.) from different salinity regimes. J Shellfish Res 34: 373−382
Lindahl O (2011) Mussel farming as a tool for re-eutrophica-tion of coastal waters: experiences from Sweden. In: Shumway S (ed) Shellfish aquaculture and the environ-ment. Wiley-Blackwell, Oxford, p 217−237
Lindahl O, Kollberg S (2009) Can the EU agri-environmentalaid program be extended into the coastal zone to combateutrophication? Hydrobiologia 629: 59−64
Lindahl O, Hart R, Hernroth B, Kollberg S and others (2005)Improving marine water quality by mussel farming: aprofitable solution for Swedish society. Ambio 34: 131−138
Maar M, Nielsen TG, Petersen JK (2008) Depletion of plankton in a raft culture of Mytilus galloprovincialis inRía de Vigo, NW Spain. II. Zooplankton Aquat Biol 4: 127−141
Maar M, Timmermann K, Petersen JK, Gustafsson KE,Storm LM (2010) A model study of the regulation of bluemussels by nutrient loadings and water column stabil -ity in a shallow estuary, the Limfjorden. J Sea Res 64: 322−333
Møhlenberg F (1999) Effect of meteorology and nutrientload on oxygen depletion in a Danish micro-tidal estuary.Aquat Ecol 33: 55−64
Møhlenberg F, Riisgård HU (1979) Filtration-rate, using a
327

Aquacult Environ Interact 8: 311–329, 2016
new indirect technique, in 13 species of suspension-feeding bivalves. Mar Biol 54: 143−147
Murray LG, Newell CR, Seed R (2007) Changes in the biodi-versity of mussel assemblages induced by two methodsof cultivation. J Shellfish Res 26: 153−162
Muschenheim DK, Newell CR (1992) Utilization of sestonflux over a mussel bed. Mar Ecol Prog Ser 85: 131−136
Navarro E, Iglesias J, Perez-Camacho A, Labarta U, Beiras R(1991) The physiological energetics of mussels (Mytilusgalloprovincialis Lmk) from different cultivation rafts inthe Ria de Arosa (Galicia, NW Spain). Aquaculture 94: 197−212
Newell RIE (2004) Ecosystem influences of natural and cul-tivated populations of suspension-feeding bivalve mol-luscs: a review. J Shellfish Res 23: 51−61
Newell CR, Richardson J (2014) The effects of ambient andaquaculture structure hydrodynamics on the food supplyand demand of mussel rafts. J Shellfish Res 33: 257−272
Nielsen TG, Maar M (2007) Effects of a blue mussel Mytilusedulis bed on vertical distribution and composition of thepelagic food web. Mar Ecol Prog Ser 339: 185−198
Nørgaard JV, Petersen JK, Tørring DB, Jørgensen H, LærkeHN (2015) Chemical composition and standardized ilealdigestibility of protein and amino acids from blue mussel,starfish, and fish silage in pigs. Anim Feed Sci Technol205: 90−97
Nunes JP, Ferreira JG, Bricker SB, O’Loan B and others(2011) Towards an ecosystem approach to aquaculture: assessment of sustainable shellfish cultivation at differ-ent scales of space, time and complexity. Aquaculture315: 369−383
Officer CB, Smayda TJ, Mann R (1982) Benthic filter feed-ing: a natural eutrophication control. Mar Ecol Prog Ser9: 203−210
Ogilvie SC, Ross AH, Schiel DR (2000) Phytoplankton bio-mass associated with mussel farms in Beatrix Bay, NewZealand. Aquaculture 181: 71−80
Olesen M, Lundsgaard C (1995) Seasonal sedimentation ofautochthonous material from the euphotic zone of acoastal system. Estuar Coast Shelf Sci 41: 475−490
Olrog L, Christensson E (2008) Användning av musslor ochmusselrester som gödselmedel i jordbruket (Use of mus-sels and mussel waste as fertilizer in agriculture). Hus -hållningssällskapet Väst Rapport no. 1, Swedish RuralEconomy and Agricultural Societies (in Swedish)
Pascoe PL, Parry HE, Hawkins AJS (2009) Observations onthe measurement and interpretation of clearance ratevariations in suspension-feeding bivalve shellfish. AquatBiol 6: 181−190
Pérez Camacho A, Gonzalez R, Fuentes J (1991) Mussel cul-ture in Galicia (NW Spain). Aquaculture 94: 263−278
Petersen JK (2004) Grazing on pelagic primary producers: the role of benthic suspension feeders in estuaries. In: Nielsen SL, Banta G, Pedersen MF (eds) Estuarine nutri-ent cycling: the influence of primary producers. KluwerAcademic, Dordrecht, p 129−152
Petersen JK, Nielsen TG, van Duren L, Maar M (2008)Depletion of plankton in a raft culture of Mytilus gallo-provincialis in Ría de Vigo, NW Spain. I. Phytoplankton.Aquat Biol 4: 113−125
Petersen JK, Timmermann K, Carlsson M, Holmer M, MaarM, Lindahl O (2012) Mussel farming can be used as amitigation tool—a reply. Mar Pollut Bull 64: 452−454
Petersen JK, Maar M, Ysebaert T, Herman PMJ (2013) Near-
bed gradients in particles and nutrients above a musselbed in the Limfjorden: influence of physical mixing andmussel filtration. Mar Ecol Prog Ser 490: 137−146
Petersen JK, Hasler B, Timmermann K, Nielsen P, TørringDB, Larsen MM, Holmer M (2014) Mussels as a tool formitigation of nutrients in the marine environment. MarPollut Bull 82: 137−143
Petersen JK, Saurel C, Nielsen P, Timmermann K (2015) Theuse of shellfish for eutrophication control. Aquacult Int,doi: 10.1007/s10499-015-9953-0
Riisgård HU, Møhlenberg F (1979) Improved automaticrecording apparatus for determining the filtration rate ofMytilus edulis as a function of size and algal concentra-tion. Mar Biol 52: 61−67
Riisgård HU, Poulsen E (1981) Growth of Mytilus edulis innet bags transferred to different localities in a eutrophi-cated Danish fjord. Mar Pollut Bull 12: 272−276
Riisgård HU, Lassen J, Kittner C (2006) Valve-gape responsetimes in mussels (Mytilus edulis)—effects of laboratorypreceding-feeding conditions and in situ tidally inducedvariation in phytoplankton biomass. J Shellfish Res 25: 901−911
Riisgård HU, Lundgreen K, Larsen PS (2012) Field data andgrowth model for mussels Mytilus edulis in Danishwaters. Mar Biol Res 8: 683−700
Riisgård HU, Pleissner D, Larsen PS, Lundgreen K (2013)Growth of mussels Mytilus edulis at algal (Rhodomonassalina) concentrations below and above saturation levelsfor reduced filtration rate. Mar Biol Res 9: 1005−1017
Riisgård HU, Lundgreen K, Larsen PS (2014) Potential forproduction of ‘mini-mussels’ in Great Belt (Denmark)evaluated on basis of actual and modeled growth ofyoung mussels Mytilus edulis. Aquacult Int. 22: 859−885
Rose JM, Ferreira JG, Stephenson K, Bricker SB, Tedesco M,Wikfors GH (2012) Comment on Stadmark and Conley(2011) Mussel farming as a nutrient reduction measure inthe Baltic Sea: consideration of nutrient biogeochemicalcycles. Mar Pollut Bull 64: 449−451
Rose JM, Bricker SB, Ferreira JG (2015) Comparative analy-sis of modeled nitrogen removal by shellfish farms. MarPollut Bull 91: 185−190
Rosland R, Bacher C, Strand Ø, Aure J, Strohmeier T (2011)Modelling growth variability in longline mussel farms asa function of stocking density and farm design. J Sea Res66: 318−330
Saurel C, Gascoigne JC, Palmer MR, Kaiser MJ (2007) Insitu mussel feeding behavior in relation to multiple envi-ronmental factors: regulation through food concentrationand tidal conditions. Limnol Oceanogr 52: 1919−1929
Saurel C, Petersen JK, Wiles PJ, Kaiser MJ (2013) Turbulentmixing limits mussel feeding: direct estimates of feedingrate and vertical diffusivity. Mar Ecol Prog Ser 485: 105−121
Saurel C, Ferreira JG, Cheney D, Suhrbier A, Dewey B,Davis J, Cordell J (2014) Ecosystem goods and servicesfrom Manila clam culture in Puget Sound: a modellinganalysis. Aquacult Environ Interact 5: 255−270
Schröder T, Stank J, Schernewski G, Krost P (2014) Theimpact of a mussel farm on water transparency in theKiel Fjord. Ocean Coast Manage 101: 42−52
Smaal AC, Vonck A, Bakker M (1997) Seasonal variation inphysiological energetics of Mytilus edulis and Cerasto-derma edulis of different size classes. J Mar Biol AssocUK 77: 817−838
328

Nielsen et al.: Nutrient extractive mussel farm in a eutrophic area
Stevens CL, Petersen JK (2011) Turbulent, stratified flowthrough a suspended shellfish canopy: implications formussel farm design. Aquacult Environ Interact 2: 87−104
Strohmeier T, Aure J, Duinker A, Castberg T, Svardal A,Strand Ø (2005) Flow reduction, seston depletion, meatcontent and distribution of diarrhetic shellfish toxins in along-line blue mussel (Mytilus edulis) farm. J ShellfishRes 24: 15−23
Strohmeier T, Duinker A, Strand Ø, Aure J (2008) Temporaland spatial variation in food availability and meat ratio ina longline mussel farm (Mytilus edulis). Aquaculture
276: 83−90Tomczak MT, Dinesen GE, Hoffmann E, Maar M, Støttrup
JG (2013) Integrated trend assessment of ecosystemchanges in the Limfjord: Evidence of a recent regimeshift? Estuar Coast Shelf Sci 117: 178−187
van der Veer HW, Cardoso JFMF, van der Meer J (2006) Theestimation of DEB parameters for various NortheastAtlantic bivalve species. J Sea Res 56: 107−124
Wilding TA, Nickell TD (2013) Changes in benthos associ-ated with mussel (Mytilus edulis L.) farms on the west-coast of Scotland. PLoS One 8: e68313
329
Editorial responsibility: Catriona MacLeod, Hobart, Tasmania, Australia
Submitted: October 29, 2015; Accepted: February 28, 2016Proofs received from author(s): April 26, 2016
➤
➤
➤
➤
➤
➤