Embed Size (px)
Citation preview

Mahadik, Y., Robson Brown, K. A., & Hallett, S. R. (2010). Characterisationof 3D woven composite internal architecture and effect of compaction.Composites Part A: Applied Science and Manufacturing, 4!(7), 872 - 880.10.1016/j.compositesa.2010.02.019
Early version, also known as pre-print
Link to published version (if available):10.1016/j.compositesa.2010.02.019
Link to publication record in Explore Bristol ResearchPDF-document
University of Bristol - Explore Bristol ResearchGeneral rights
This document is made available in accordance with publisher policies. Please cite only the publishedversion using the reference above. Full terms of use are available:http://www.bristol.ac.uk/pure/about/ebr-terms.html
Take down policy
Explore Bristol Research is a digital archive and the intention is that deposited content should not beremoved. However, if you believe that this version of the work breaches copyright law please [email protected] and include the following information in your message:
• Your contact details• Bibliographic details for the item, including a URL• An outline of the nature of the complaint
On receipt of your message the Open Access Team will immediately investigate your claim, make aninitial judgement of the validity of the claim and, where appropriate, withdraw the item in questionfrom public view.

1
CHARACTERISATION OF 3D WOVEN COMPOSITE
INTERNAL ARCHITECTURE AND EFFECT OF
COMPACTION
Y. Mahadik, K.A. Robson Brown and S.R. Hallett
Advanced Composites Centre for Innovation and Science, University of Bristol,
University Walk, Bristol, BS8 1TR.
ABSTRACT
Yarn waviness and resin rich regions play a major role in 3D woven composite
mechanical properties and failure. A detailed study of two angle-interlock 3D woven
carbon fabrics has been carried out to characterise these architectural features and how
they change under increasing levels of compaction. Computerised tomography (CT) x-
ray scanning was used to capture the internal architecture of the fabrics. The study
focussed on the out-of-plane crimp of the yarns and the size and shape of resin rich
regions in consolidated panels. Results showed areas of high local crimp at weft/weaver
interlace points. This was exacerbated at low levels of compaction but was eventually
lowered under higher compaction levels. The appearance of resin channels was found to
be heavily dependent on weave style, with large resin pockets appearing in weaver yarn
planes which decreased significantly in size under compaction with distinctive changes
in profile.
Keywords: A. 3-‐Dimensional reinforcement; A. Fabrics/Textiles; D. Radiography; E. Weaving

2
INTRODUCTION
3D woven carbon fibre fabrics consist of layers of warp and weft tows interlaced in the
through-thickness direction by weaver yarns. This type of preform has an advantage
over more commonplace unidirectional laminates and 2D woven reinforcements as it
provides genuine through-thickness reinforcement, improving the interlaminar and
damage tolerance properties of a composite.
3D woven fabrics exhibit a complex internal structure of interlaced tows which are
deformed and distorted when woven and also when undergoing compaction in the
moulding of the final composite. The detailed internal architecture of the fabric yarns
plays a large part in determining the mechanical properties and failure mechanisms of a
3D woven composite.
Studies by Cox et al. [1,2] showed that out-of plane yarn crimp, caused by yarn nesting,
played a large role in the tensile failure properties of a 3D woven composite and caused
a drop in elastic modulus in both the warp and weft yarn directions. The study also
highlighted the increased level of crimp in the weft yarn compared to the warp stuffers
due to these yarns not being held under tension in the weaving process.
Similar findings were presented by Tan et al. [3] and Callus et al. [4]. The latter study
presented results that showed the effect of resin channels on failure initiation and crack
propagation. Resin rich regions present between yarns allowed cracks to propagate
quickly and caused yarn failure at specific locations in the fabric architecture.

3
A number of studies have shown the large variations in mechanical properties produced
by different interlock weave styles. Leong et al. [5] demonstrated how improvements
could be made to yarn crimp and the presence of resin pockets by altering the path of
weaver yarns specifically, leading to an improvement in strength and stiffness.
Although there has been some characterisation of 3D woven fabric architecture that
considers yarn crimp and the spacing of the yarns (Lomov et al.[6]) and some work on
modelling yarn deformations (Zhou et al.[7]), there is a distinct lack of detailed
publications on experimental characterisation of out-of-plane crimp and resin pockets in
3D woven fabrics, and in particular the variation of these features under consolidation.
This is in spite of the fact that previous literature highlights the crucial role they play in
determining material properties.
There has however been some detailed analysis of 2D woven fabric architecture
undergoing manufacturing processes. Statistical studies on yarn cross section shape in a
2D woven laminate under compaction (Saunders et al.[8]) and yarn crimp angles of
nesting 2D woven layers (Yugartis [9]) demonstrated the feasibility of using cross
section images and microscopy followed by detailed quantizing of tow shape to reflect
the nature of internal fabric architectures. Similar studies by Chang et al.[10] and Chang
et al [11] showed the measurement of yarn cross section shape and angle during
draping, moulding and shearing of a 2D woven ply while Kim and Chang [12] related
these changes in yarn geometry to variations in in-plane failure.
4
The above studies used a method of optical microscopy to provide images of yarn layers
that were subsequently analysed. X-ray micro computed tomography (Micro-CT) is a
more effective method of gathering internal images of structures. The Micro CT
technique produces images of thin slices through the entire structure. This gives the user
the ability to pinpoint areas of interest and also view them from any angle as well as
providing a sequence of images that can be manipulated and analysed in image
processing software. It has been shown to be effective in producing yarn cross section
images of conventional 2D woven structures and 3D woven laminates (Summerscales et
al. [13], Despentere et al. [14and Djukic [15]). Micro CT also allows the reconstruction
of 3D images of composite features such as resin channels (Schell et al. [16]) and yarn
paths (Schilling et al. [17] and Pandita [18]) from the 2D image slices.
This study presents a detailed analysis of yarn crimp and resin channel size and shape
on two different 3D interlock fabrics using images obtained from micro CT scanning.
In addition, it investigates the effect of increasing levels of compaction on the fabric
architecture. This investigation was conducted with a view to subsequently linking the
architectural features seen in the fabrics to failure mechanisms in a moulded 3D
composite. The importance of yarn cross section shape as well as in-plane yarn
waviness as architectural features is acknowledged but was beyond the scope of this
study. It is suggested as a potential continuation of the work.
MANUFACTURE OF SAMPLES
Two fabrics, designated Fabric A and Fabric B, were each potted in the as-woven state
and moulded to different thicknesses to cover a wide range of consolidated volume

5
fractions. The fibre volume fraction (VF) of consolidated samples was chosen to be in
the range of 50% to 65% with four points evenly spaced in this range.
Fabric A is a layer-to-layer angle interlock fabric including seven layers of weft and six
layers of warp yarns. One in three warp yarns is an interlacing weaver with the rest
warp stuffers. Fabric B is a layer-to-layer angle fabric with alternating columns if weft
of five and six layers producing a staggered weft pattern. The warp direction includes
no stuffers, with every warp yarn being an interlacing yarn. Schematics of both fabrics
are presented in Figure 1.
Figure 1 about here
To capture the as-woven fabric architecture, samples were potted in resin in small trays.
The resin system chosen to consolidate the samples was SP115, a two-part epoxy
resin/hardener system from Gurit Systems. It was chosen for its low viscosity at room
temperatures and a clear finish when cured. Sections of fabric were placed in the trays
and the resin poured on top. The trays were agitated using a small shaking table at a
range of frequencies to dislodge air bubbles and help resin infusion.
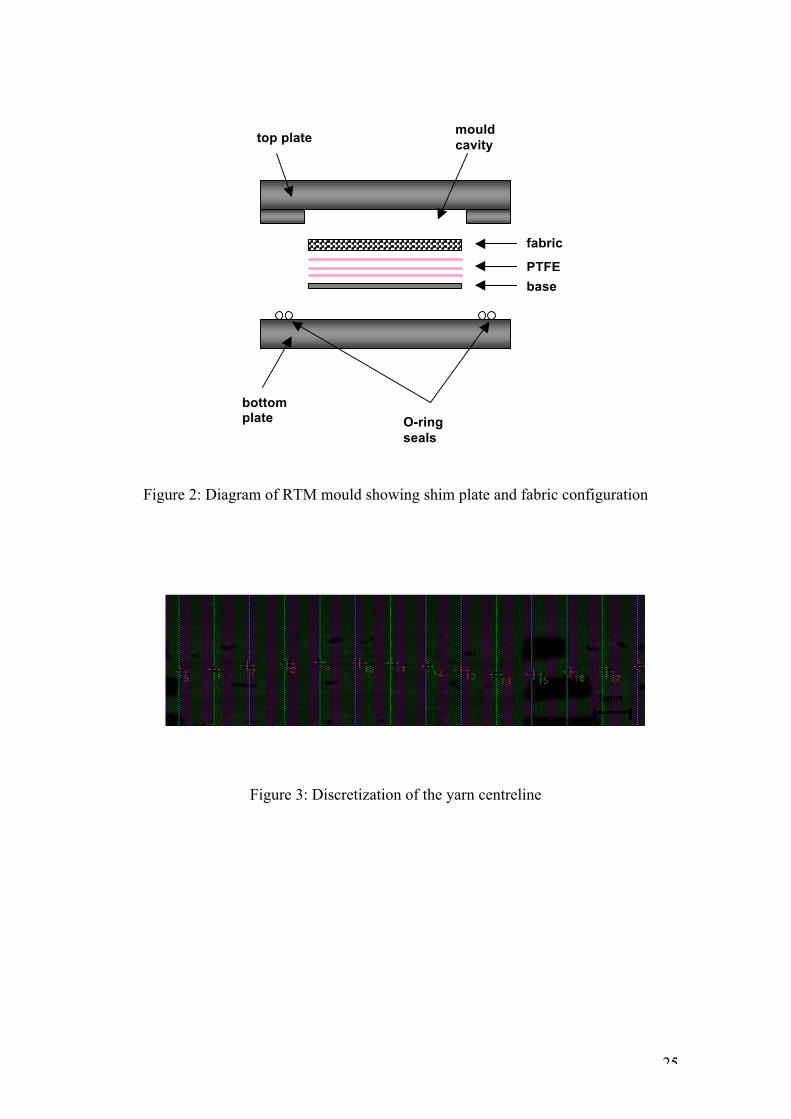
A resin transfer moulding (RTM) infusion process was chosen to manufacture the 50%-
65% VF samples. A two sided tool was designed so that it could produce samples of
different volume fractions via the introduction of shims in the mould cavity (Figure 2).
The shim plate consisted of a steel base plate of either 4mm or 5mm thickness with
added layers of reinforced PTFE fabric. The 0.125mm thick PTFE fabric layers were

6
used to approach the target thickness for each sample more accurately. The resin system
used was Prime 20 from Gurit Systems. It was chosen for its clear finish and range of
cure cycles and hardeners. The infusion was conducted under 3 bar pressure and
produced samples with good wet out and reliable thickness tolerances. There was no
noticeable distortion of the samples from resin shrinkage or spring back that could have
affected yarn geometries.
Figure 2 about here
SAMPLE SCANNING AND YARN IMAGE ACQUISITION
Small coupons suitable for x-ray computer tomography (CT) scanning were cut from
the potted and RTM produced 90x150mm panels. The lengthwise direction of each
coupon was aligned in the warp or weft direction to maximise the length of yarn
captured in each specimen.
CT scanning apparatus from SkyScan was used to capture the internal architecture of
the consolidated fabrics. A bespoke sample stage was designed and manufactured to
house the samples and allow the x-ray source to approach the sample as closely as
possible.
Despite trialling several different combinations of scanning parameters, the images
produced exhibited quite poor contrast between yarns and resin as well as featuring a
large amount of graininess which would hinder graphical characterisation of the
architecture.

7
Image enhancement techniques were implemented in order to try and improve the
quality of the images. It was found that using an intensity averaging technique across a
number of slices cleared up the images significantly. This coupled with altering the
brightness and contrast to capture the areas of interest produced satisfactory images.
RESULTS AND DISCUSSION: YARN CRIMP
Fabric A yarn crimp The local, out of plane yarn crimp of individual tows was measured by discretizing a
single tow using a series of points plotted along its centre line (Figure 3). The absolute
local angle between two adjacent points could then be calculated from their coordinates
(Figure 4). Yarn crimp was defined as the local angle of deviation from a specified
horizontal datum for each yarn. The local yarn angle was measured along every yarn in
6-8 different slices in both the warp and weft directions. Local crimp data was recorded
in the straight warp (Fabric A only), weft and weaver yarn planes for both Fabric A and
Fabric B.
Figure 3 followed by Figure 4 about here.
Observations of CT scan slices of the as-woven Fabric A showed generally straight, low
crimped warp yarns (Figure 5). The weft yarns are not held under tension in the
weaving process, and therefore exhibited more crimp, especially at interlacing points
with the weaver yarns. Weaver yarns showed the highest crimp as they are deliberately
woven to interlace adjacent layers. Significant voids were present in all the samples
(shown up as black in Figure 5) as the potting process used no pressure or injection to

8
improve resin infusion. They did not however influence the captured fabric architecture.
The main aim was to set the fabric architecture in the as woven state without
introducing unnecessary distortions.
Figure 5 about here.
These general features remained when the fabric was moulded to higher volume
fractions. Figure 6 shows the mean yarn crimp in the weft, warp stuffer, and warp
weaver yarns in Fabric A from the as-woven state to approximately 65% volume
fraction. The mean yarn crimp is the average of every measurement of local angle
across all the slices that were analysed. The error bars shown represent the standard
deviation between crimp measurements for each yarn slice. The warp and weft were
relatively straight in the as-woven state with only the weaver showing a high level of
initial crimp due to the through-thickness weaving path.
Figure 6 about here.
At increasing levels of compaction the warp stuffer yarns remained relatively
unaffected. Mean yarn crimp remained in the region of 2° with just a small rise at 50%-
60% volume fraction. CT scan slices of a typical warp yarn layer at progressively higher
volume fractions showed how the yarns retain their straightness. The warp yarns were
not interlaced in the weaving process and subsequently had no inherently introduced
deflection that could be exacerbated. Also, the yarns in the weft layers above and below

9
each warp yarn were evenly spaced and without large gaps. This architecture kept the
warp yarns straight when the warp and weft yarns nested together under compaction.
The weft yarns in Fabric A exhibited more crimp in their as-woven state than the warp
yarns. The mean weft crimp was 4° before compaction and with the yarns exhibiting
local, high crimp areas at weft/warp weaver interlacing points.
The weft yarns showed an increase in overall mean crimp to 6° when compacted to 50%
volume fraction and subsequently a decrease in crimp with increasing compaction. At
65% volume fraction the flattening effect of compaction reduced the crimp to approach
the as-woven crimp level.
The changing architecture of the weft yarns that cause these statistical trends was
clearly seen in CT scan images. At 50% volume fraction the major change from the as
woven state was an increase in crimp due to the nesting of the yarns in the large inter-
yarn gap left between the warp weaver and weft yarn at the interlacing point. This
exacerbated the already introduced crimp at these locations (Figure 7).
The extra crimp in these locations spread out to parts of the yarn that lay between
straight warp stuffers above and below. The gaps between the weft yarn and the straight
warp stuffer sections were smaller than those found at the interlacing point allowing the
weft to deflect less in these areas.
Figure 7 about here.

10
As the compaction increased to 60% VF, the inter yarn gaps gradually closed and the
straightening effect of the compaction on the yarns grew. The smaller gaps between
weft yarns and the straight warp yarns closed up first leading to a decrease in crimp in
these regions. The even spacing of the warp yarns above and below the weft as well as
the effect of tow spreading that further removed gaps in the warp layers lead to flatter
surface when nesting with the weft yarn leading to lower crimp in the weft at these
locations.
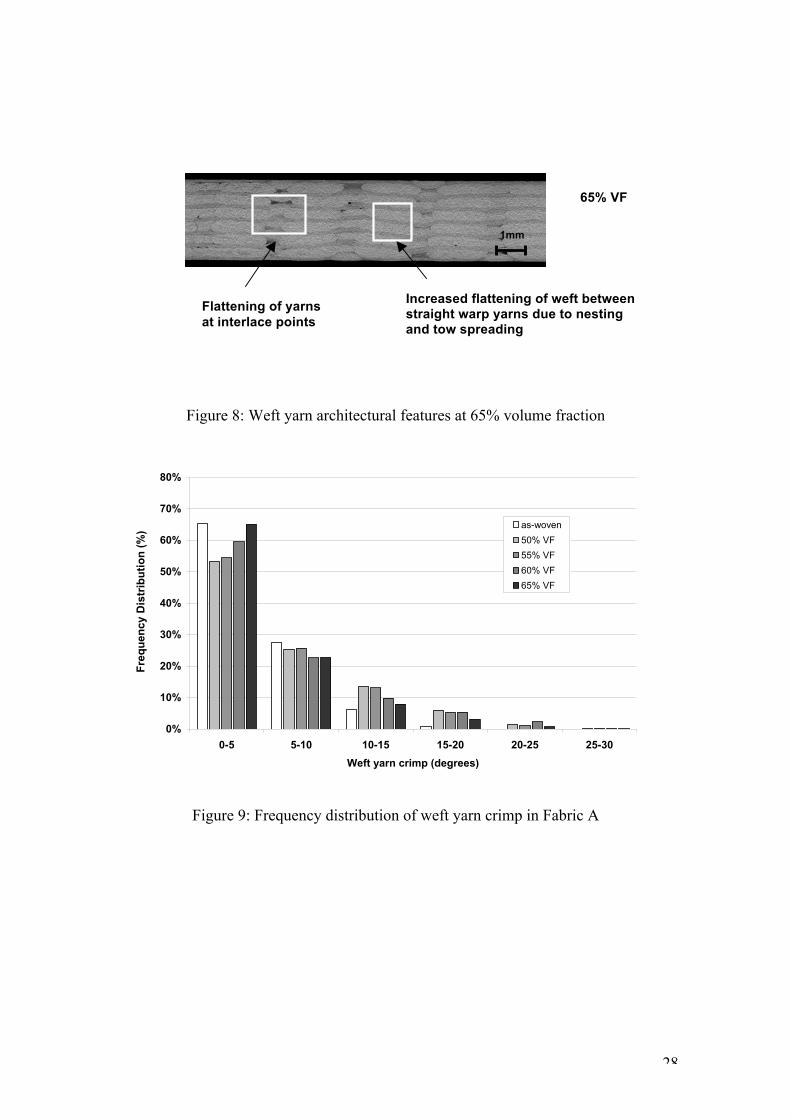
The larger inter-yarn gaps at weft/warp weaver interlace points, and therefore the highly
crimped weft yarn regions at these locations, persisted up to 55%-60% VF but
eventually flattened out at 65% VF as these larger gaps were closed (Figure 8).
Figure 8 about here.
These qualitative observations were borne out in the frequency distributions for local
crimp in the weft yarns and provided a clearer picture of the distribution of crimp in the
weft layers (Figure 9).
Figure 9 about here.
The initial increase in crimp at 50% volume fraction from the as-woven state was seen
as a decrease in the proportion of ‘straight’ yarn (between 0-5° of crimp). The
proportion of yarn crimped at 5° or less dropped from 67% to just over 50%. The
increase of local areas of high crimp seen at the weft/warp weaver interlace points in the

11
x-ray slices was captured by the sharp increase in the proportion of yarn crimped by 15-
20° from 2% in the as-woven state to 6%.
Further compaction to 55% and 60% volume fraction produced an increase in the
proportion of straight yarn from 53% to 59%. However, the frequency distribution
shows that the proportion of highly crimped yarn (15-20° and above) at 55-60% volume
fraction remained constant. This can be explained by the flattening of the weft where it
lay between areas of straight warp stuffers, away from the interlace points. Smaller
inter-yarn gaps in these regions closed up at the lower volume fractions but the highly
crimped regions at interlace points persisted due to the larger inter-yarn gaps.
At the highest level of compaction, at 65% volume fraction, the flattening effect reached
the interlace points alongside a further increase in the flattening between straight warp
areas. This was seen as an increase in the proportion of straight yarn along with a
decrease in the proportion of highly crimped yarn in the crimp frequency distribution
data.
Areas of high local crimp remain throughout the compaction range with 2% of the yarn
seen exhibiting crimp of over 20°. This was attributed to the areas of weft at the surface
interlacing points which remain in a highly crimped state throughout the compaction
process. The weaver yarns were pushed down at the surface by the tool face, forcing the
surface weft yarn to be deflected.

12
The Fabric A warp weaver yarns interlace the layer of weft above and below to provide
through-thickness reinforcement. This leads to them being deliberately crimped in the
weaving process in order to trace the desired path in the weave style. The mean local
crimp for the warp weavers in the as woven state was 12° (refer back to Figure 6), much
higher than the warp and the weft. The initial compaction to 50% volume fraction
reduced this value to 8°. This was due to the large decrease in height of the fabric in the
through thickness direction, counteracting the path of the weavers that traverse between
weft layers.
Further compaction to 60% appeared to have little effect on the mean crimp, but a closer
look at the architecture seen in the CT scan slices and from the frequency distribution
provided a clearer picture of the more subtle changes in the crimp of the yarn (Figure
10).
Figure 10 about here.
The frequency distribution of local crimp angles showed a steady rise in the proportion
of yarn at low crimp (0-5°) between 50% and 60% volume fraction. The proportion of
‘straight’ yarn rose from 33% to 48%. However, the amount yarn at higher crimp levels
(15-30°) remained between 10-15% with the amount of crimp at 25-30° having showed
a small increase.
These conflicting trends were thought to be the reason that the overall crimp stayed
fairly constant between 50%-60% volume fraction.

13
At the higher levels of compaction up to 65% volume fraction, the flattening effect of
yarn nesting increased and was sufficient to extend to the interlaced regions leading to a
sharp drop in overall crimp to 6° and a decrease in the proportion of yarn showing
crimp greater than 15°.
Fabric B yarn crimp
Fabric B was constructed using a different weave style that included no straight warp
stuffers, with every warp yarn being a weaver that interlaced the next layer of weft
yarns. The weave pattern also incorporated a staggered weft pattern that allowed the
weft yarns to lie in between the weavers. The weft yarns subsequently exhibited less
local deflection at interlace points giving rise to a very low crimp state in the weft
direction in the as-woven fabric (Figure 11).
Under compaction, this initial low crimp in the weft was quickly lost. The mean crimp
of the weft yarns rose from 2° in the as-woven state to 8° at 60% volume fraction. This
was caused by the gaps between the weft and interlacing warp decreasing and
introducing local deflections at interlacing points. Fabric B has a much higher
occurrence of interlacing points due to every warp yarn being an interlacing yarn
leading to a much greater presence of local regions of high crimp in these areas. The
large increase in crimp in a more dispersed pattern was reflected by the high scatter in
the data.
Figure 11 about here.

14
The mean crimp trends were reflected by the local crimp frequency distribution results.
The proportion of ‘straight’ (0-5° crimp) weft yarn declined sharply from nearly 90% in
the uncompressed state to under 40% at 60% volume fraction. In addition, the
proportion of yarn that was considered to be highly crimped (15° and above) rose from
1% to approximately 14%.
As seen with the previous fabric, the amount of crimp seen in the weft yarns in Fabric B
begins to diminish at 65% volume fraction. The mean crimp dropped from 8° at 60%
volume fraction to just over 6.5° at 65% volume fraction. There was also an expected
rise in the proportion of yarn crimped between 0-5° from 40% to 48% and a small drop
in the proportion of highly crimped yarn, 15° and above, from 14% to 9%. This was due
to the high degree of compaction flattening out the staggered weaver columns to allow
the weft to lie in a straighter path.
These results are well illustrated by CT scan slices at 50% and 65% volume fraction
with the slices showing the crimp being introduced at interlace points at 50% volume
fraction and the flattening of the yarn at 65% volume fraction (Figure 12).
Figure 12 about here.
The Fabric B weaver yarns showed a large drop in crimp from 11.5° in the as-woven
state to a roughly constant mean crimp level of 6.5-7° at volume fractions between 50%
and 65%. As seen in the Fabric A, the flattening is caused by yarn nesting and the

15
closing up of the inter yarn gaps. Local regions of high crimp still occurred at various
points on the weaver, especially at weft interlacing points where the inter yarn gaps are
largest and least likely to be affected by the overall flattening of the fabric.
RESULTS AND DISCUSSION: RESIN POCKETS
Large and distinctive resin channels were seen to occur along the warp weaver yarns in
the as woven state of both the fabrics. These were caused by the path of the yarn leaving
large gaps between yarn layers where resin rich regions subsequently developed. Resin
pockets seen in the weft yarn planes were orthogonal cross sections of the channels in
the warp direction. The resin channel dimensions and volume discussed in this section
refer to single one of these typical regions that occur in layers in the warp weaver yarn
planes. Figure 13 shows a 3D representation of one of these channels and the images
they produce when sectioned in the warp weaver and weft direction. The average
dimensions of a single resin pocket were calculated from the yarn images by digitally
separating the resin and yarn and outlining the resin rich regions. Resin pocket
dimensions were measured in 6-8 slices in each yarn direction for each volume fraction.
Results presented are the mean of all measured dimensions across the slices in a
particular volume fraction sample.
Figure 13 about here.

16
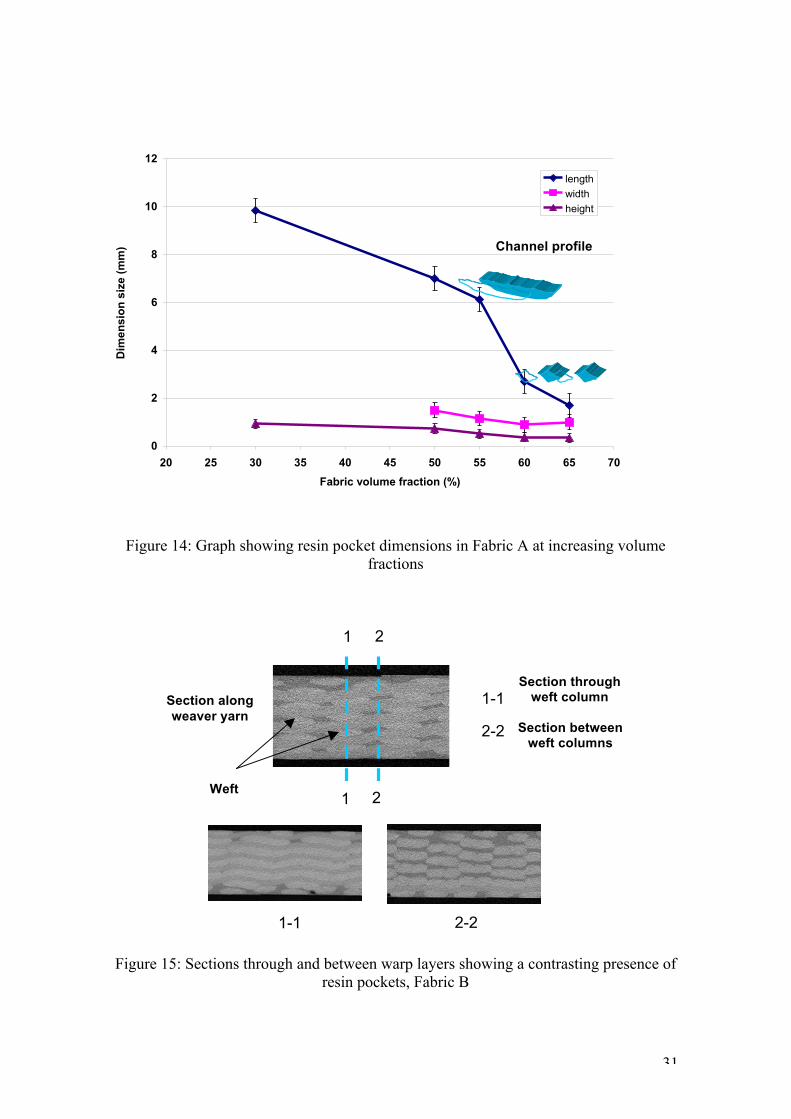
Fabric A Resin Pockets
The compaction process progressively closed up the inter-yarn gaps, decreasing the size
of the major resin pockets in the weaver direction dramatically. The volume of a typical
warp weaver resin channel dropped from 10mm3 in the as-woven state to 0.22mm3 at
65% volume fraction.
A major trend in the measured dimensions of a resin pocket was a large decrease in
resin pocket length with increasing compaction. The average length of each pocket
dropped sharply from 6.1mm at 55% to 2.6mm at 60% volume fraction (Figure 14).
This was due to weaver resin pocket retaining its distinctive shape, spanning one half of
the repeating unit of the binder shape from the as-woven state up to 55% volume
fraction but then closing up in the centre to form two distinct, shorter channels at further
levels of compaction.
An expected drop in resin channel height due to the reduction in thickness of the fabric
was also observed. The width of each channel was dependent on the width of the inter
yarn gap left at the weaver/weft interlacing point and was less affected by the
compaction of the fabric showing a smalldecrease from 1.4mm to 1mm.
Overall, the number of resin rich regions seen in each of the yarn directions (straight
warp, weft and warp weaver) decreased sharply.
Figure 14 about here.

17
The above trends were confined to the internal resin channels away from the surfaces of
the fabric. Surface resin channels are not bounded by yarns on one side and
subsequently remain large. The surface channels retained the approximate size and
shape seen at 50% volume fraction right up to 65%volume fraction.
Fabric B Resin Pockets
Fabric B also showed significant resin rich regions in the as woven state and throughout
the volume fraction range. Internal resin pockets lay between warp weavers where the
angle of the yarns let gaps remain (Figure 13). The Fabric B weave style used every
warp yarn as an interlacing weaver and so these resin channels are much more prevalent
than in Fabric A where two out of every three warp yarns were not interlaced and had
negligible resin rich regions
The staggered weft patterns inherent in the Fabric B weave style allowed the weft yarns
to nest between the warp weaver yarns and to break up the resin channels in the length
direction giving a series of small diamond shaped resin pockets which had a much lower
warp-weft aspect ratio than the resin regions of the Fabric A. In addition, the staggered
pattern positioned the weft so that it touched the weaver yarns above and below. This
led to fewer resin rich regions in a cross section through a weft yarn layer. However, a
wide spacing was left between the weft layers and led to the resin channels to form
between the weft yarns rather than underneath or over each yarn as in Fabric A. (Figure
15).
18
Figure 15 about here.
The resin pockets were on average significantly smaller (3mm3) in the as woven state
compared to the longer, uninterrupted channels in Fabric A (12mm3). The total volume
of each pocket declined sharply under the initial compaction of the fabric at 50%
volume fraction to 0.5mm3 and then saw a smaller decrease to 0.2mm3 at 65% volume
fraction.
Compaction of the fabric in the through-thickness direction largely affected the height
of the resin channel but had relatively little effect on the width and length after the
initial large drop in resin channel volume from the as-woven state. The height of the
channel decreases from 1.8mm at 50% volume fraction state to 0.3mm at 65% volume
fraction. The length shows a small reduction from 3 mm to 1 mm and the width of the
resin pocket, determined by the weft yarn spacing, remained largely unchanged. See
Figure 16 for detailed breakdown of resin pocket dimension.
Figure 16 about here.
As with Fabric A, the above analysis considers the internal resin channels away from
the surface of the fabric. Much larger resin rich regions were present on the surface of
the fabric where there was no further layer of weaver yarns above or below to close up
the inter yarn gaps under compaction. These remained significantly greater in volume as
well as having a greater length and height than the internal resin channels throughout
the compaction range. They were less prevalent however, occurring only once per

19
binder repeating unit at a peak or a trough depending on which surface the resin pocket
lay on.
CONCLUSIONS
A detailed, experimental characterisation of yarn crimp and resin pocket size and shape
was conducted on two angle interlock fabrics.
The internal architecture of the fabrics was captured using an x-ray computer
tomography (CT) scanning technique and the developed yarn images post-processed
using a series of image analysis techniques. A wealth of data was produced and allowed
reliable conclusions to be drawn from statistical analyses. CT scanning allowed the
internal structure of the fabric to be viewed without the need for lengthy polishing and
optical microscopy techniques. It also allowed easy manipulation of viewing angles and
produced an image set that could be effectively digitised for analysis. Technical
challenges included the limited sample size that could be scanned and the difficulty in
producing good images due to the poor contrast between carbon fibre and epoxy resin.
Local, out of plane yarn crimp was recorded for each of the yarn directions in both
fabrics over the volume fraction range. Non interlaced warp yarns, the warp stuffers
present in Fabric A, were held in tension in the weaving process and show a low crimp
in the off-the-loom fabric. This low crimped state remained up to 65% volume fraction.
Crimp in the weft yarns of Fabric A was dominated by the local architecture at
weft/weaver interlacing points. The weaver yarns passed under or over a weft yarn at
these points causing it to deflect, creating a local area of high crimp. This local high

20
crimp was exacerbated at lower volume fractions due to yarn nesting in the large inter
yarn gap that accompanies the interlace point. Sections of the weft yarn away from the
interlacing points flattened much more readily at lower volume fractions and exhibited
lower crimp. At volume fractions close to 65%, the flattening effect of compaction
reached the interlaced points and caused a sharp decrease in overall weft crimp.
Fabric B showed a very similar trend but incorporated a much higher proportion of
weaver yarns, and therefore a greater number of weft interlacing points which caused
the crimp in the weft yarns in this fabric to be higher when compacted. Fabric B
demonstrated that the weave style can lower the initial as-woven weft crimp by
staggering the weft pattern. This low crimp state did not survive the compaction process
however.
A small proportion of the weft yarn in both fabrics remained highly crimped even at
high levels of compaction. Local highly crimped areas were seen at surface interlace
points throughout the fabric.
The weaver yarns in both fabrics showed the highest level of crimping in the off the
loom state as they are deliberately deflected in order to interlace the adjacent layer of
weft yarns. The compaction of the fabric flattened these yarns considerably but regions
of high crimp remained especially at weft/weaver interlacing points.
Large resin pockets were present in both fabrics in both the as-woven state and
throughout the compaction regime. The major resin channels existed between warp

21
weaver yarns. The resin pocket in Fabric A was much longer in the as woven state
compared to Fabric B where the staggered weft pattern broke up the resin channels
more effectively.
The internal resin channels away from the surface of the fabrics collapsed under
compaction to one tenth of their as-woven size but remained a significant feature. The
long internal resin pockets in Fabric A splits into distinct, smaller channels at 60%
volume fraction and above. Both fabrics exhibited larger resin channels on the surface
throughout the compaction range.
REFERENCES
[1] Cox BN, Dadkhah MS, Morris WL, Flintoff JG. Failure mechanisms of 3D
woven composites in tension, compression, and bending. Acta Metallurgica et
Materialia 1994; 42(12): 3967-3984.
[2] Cox BN, Dadkhah MS, Morris WL. On the tensile failure of 3D woven
composites. Composites - Part A: Applied Science and Manufacturing 1996;
27(6): 447-458.
[3] Tan P, Tong L, Steven GP, Ishikawa T. Behaviour of 3D orthogonal woven
CFRP composites. Part I. Experimental investigation. Composites - Part A:
Applied Science and Manufacturing 2000; 31(3): 259-271.
[4] Callus PJ, Mouritz AP, Bannister MK, Leong KH. Tensile properties and failure
mechanisms of 3D woven GRP composites Composites - Part A: Applied
Science and Manufacturing 1999; 30(11):1277-1287.
22
[5] Leong KH, Lee B, Herzberg I, Bannister MK. Effect of binder path on the
tensile properties and failure of multilayer woven CFRP composites,
Composites Science and Technology 2000; 60 (1) :149-156.
[6] Lomov SV, Ivanov DS, Perie G, Verpoest I. Modelling 3D fabrics and 3D
reinforced composites: challenges and solutions. Conference Proceedings:1st
World Conference on 3D fabrics; Manchester 2008.
[7] Zhou G, Sun X, Wang Y, Multi-chain digital element analysis in textile
mechanics. Composites Science and Technology 2004; 64:239–244.
[8] Saunders RA, Lekakou C, Bader MG. Compression and microstructure of fibre
plain woven cloths in the processing of polymer composites. Composites Part A
1998; 29A: 443-454
[9] Yugartis SW, Morey K. Measurement of yarn shape and nesting in plain-weave
composites. Composites Science and Technology 1993; 46:39-50.
[10] Chang SH, Sutcliffe MPF, Sharma SB. Microscopic investigation of tow
geometry changes in a woven prepreg material during draping and
consolidation. Composites Science and Technology 2004; 64:1701-1707.
[11] Chang SH, Sharma SB, Sutcliffe MPF. Microscopic investigation of tow
geometry of a dry satin weave fabric during deformation. Composites Science
and Technology 2003; 63: 99-111.
[12] Kim S., Chang .H. The relation between compressive strength of carbon/epoxy
fabrics and micro-tow geometry with various bias angles. Composite Structures
2006; 75: 400-407.
23
[13] Summercales J, Russell PM, Lomov S, Verpoest I, Parnas RS. The fractal
dimension of x-ray tomographic sections of a woven composite. Advanced
Composite Letters 2004; 13(2): 133-121.
[14] Desplentere F, Lomov SV, Woerdeman DL, Verpoest I, Wevers M,
Bogdanovich A. Micro-CT characterization of variability in 3D textile
architecture. Composites Science and Technology2005; 65: 1920-1930.
[15] Djukic L. Tow visualistaion in woven composites using x-ray computed
tomography. Recent Advances in Textile Composites2008; 417 -425
[16] Schell JSU, Renggli M, van Lenthe GH, Müller R, Ermanni P. Micro-computed
tomography determination of glass fibre reinforced polymer meso-structure.
Composites Science and Technology 2006; 66: 2016-2022.
[17] Schilling PJ, Bhanuprakash RK, Tatiparthi AK, Verges MA, Herrington PD. X-
ray computed microtomography of internal damage in fiber reinforced polymer
matrix composites. Composites Science and Technology 2005; 65: 2071-2078.
[18] Pandita SD, Verpoest I. Prediction of the tensile stiffness of weft knitted fabric
composites based on x-ray tomography images. Composites Science and
Technology 2003; 63: 311-325.

24
Figure 1 Schematics showing the weave architecture of Fabric A and Fabric B
Weft
Weaver
Warp
Fabric A
TOP VIEW
SIDE VIEW
END VIEW
Fabric B
Weft
Weaver
Warp
TOP VIEW
SIDE VIEW
TOP VIEW
SIDE VIEW
END VIEW
25
Figure 2: Diagram of RTM mould showing shim plate and fabric configuration
Figure 3: Discretization of the yarn centreline
top plate mould
cavity
bottom plate O-ring
seals
fabric
PTFE layers base plate
1mm

26
Figure 4: Calculation of the local angle from two points on the yarn centreline
Figure 5: CT scan slices showing yarn profile in Fabric A in as-woven potted samples
Local angle θ
1 2
x
y
θ = y1 – y2 x1 – x2
Tan-1
weaver
weft
warp
1mm
voids

27
Figure 6: Overall mean yarn crimp for Fabric A
Figure 7: Weft yarn architectural features at 50% volume fraction of Fabric A
Weft between straight warp
layers
50% VF
weft / weaver interlace point
Greater yarn nesting between straight warp yarns
leads to lower crimp
weft yarn
0
2
4
6
8
10
12
14
25 30 35 40 45 50 55 60 65 70
volume fraction (%)
crim
p an
gle
(deg
rees
)
weftwarpweaver
28
Figure 8: Weft yarn architectural features at 65% volume fraction
Figure 9: Frequency distribution of weft yarn crimp in Fabric A
0%
10%
20%
30%
40%
50%
60%
70%
80%
0-5 5-10 10-15 15-20 20-25 25-30Weft yarn crimp (degrees)
Freq
uenc
y D
istr
ibut
ion
(%) as-woven
50% VF55% VF60% VF65% VF
65% VF
Flattening of yarns at interlace points
Increased flattening of weft between straight warp yarns due to nesting and tow spreading
1mm

29
Figure 10: Frequency distribution of weaver yarn crimp in Fabric A
Figure 11: Mean yarn crimp in Fabric B
0%
10%
20%
30%
40%
50%
60%
0-5 5-10 10-15 15-20 20-25 25-30weaver yarn crimp (degrees)
Freq
uenc
y D
istr
ibut
ion
(%)
as-woven
50% VF
55% VF
60% VF
65% VF
0
2
4
6
8
10
12
14
25 30 35 40 45 50 55 60 65 70Sample volume fraction (%)
Mea
n cr
imp
(deg
rees
)
weft
weaver

30
Figure 12: Weft yarn architecture of Fabric B at 50% and 65% volume fraction.
Figure 13: Schematic showing dimension definitions and CT scan views of the weaver resin channel
warp weaver section
weft section
length
height
width length
height
width
warp weaver section
weft section
FABRIC A FABRIC B
Crimp introduced at interlacing points
65% VF
50% VF
Flattening of weft at high volume
fractions
1mm
31
Figure 14: Graph showing resin pocket dimensions in Fabric A at increasing volume fractions
Figure 15: Sections through and between warp layers showing a contrasting presence of resin pockets, Fabric B
1 2
1 2
1-1
2-2
Section along weaver yarn
Weft yarn
columns
Section through weft column
Section between weft columns
1-1 2-2
0
2
4
6
8
10
12
20 25 30 35 40 45 50 55 60 65 70Fabric volume fraction (%)
Dim
ensi
on s
ize
(mm
)
lengthwidthheight
Channel profile

32
Figure 16: Graph showing resin pocket dimensions in Fabric B
0
0.5
1
1.5
2
2.5
3
3.5
20 25 30 35 40 45 50 55 60 65 70
Fabric volume fraction (%)
Dim
ensi
on s
ize
(mm
)
lengthwidthheight


![[D2]pinpoint 개발기](https://img.pdfslide.net/doc/110x75/55ac51991a28abe7118b4726/d2pinpoint-.jpg)
