Embed Size (px)
Citation preview
Initiating Coverage
ICICI Securities Ltd | Retail Equity Research
March 28, 2017
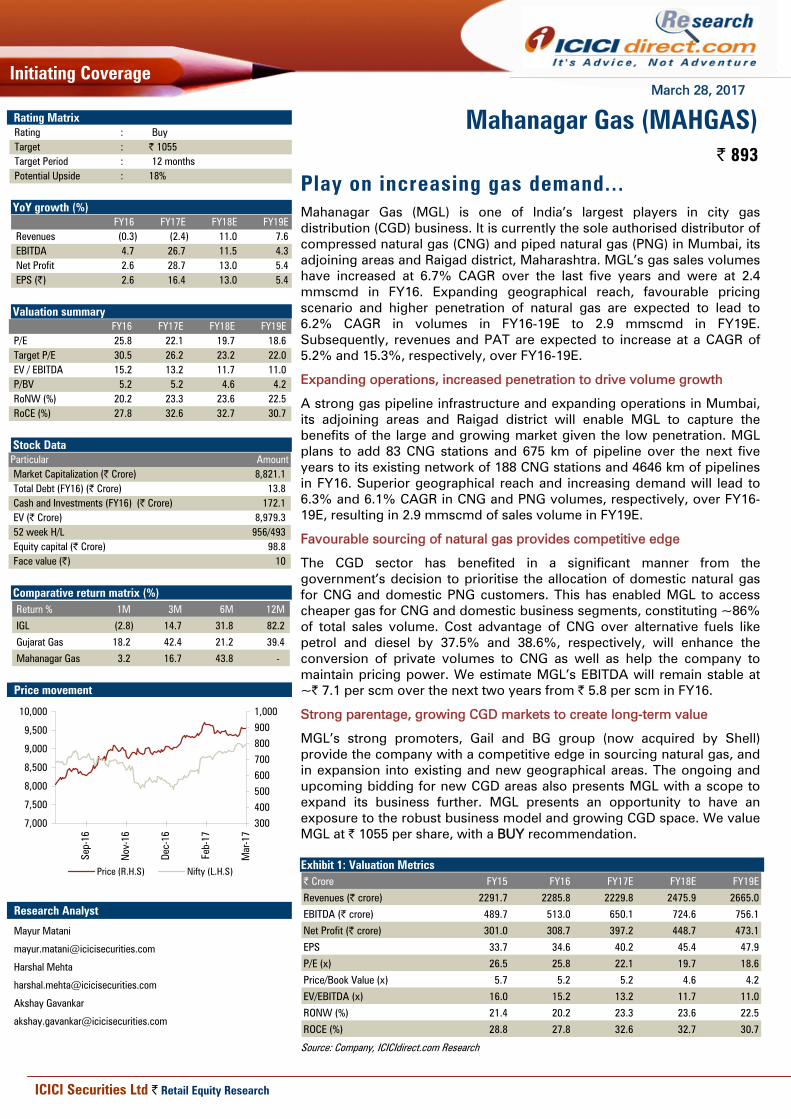
Play on increasing gas demand... Mahanagar Gas (MGL) is one of India’s largest players in city gas distribution (CGD) business. It is currently the sole authorised distributor of compressed natural gas (CNG) and piped natural gas (PNG) in Mumbai, its adjoining areas and Raigad district, Maharashtra. MGL’s gas sales volumes have increased at 6.7% CAGR over the last five years and were at 2.4 mmscmd in FY16. Expanding geographical reach, favourable pricing scenario and higher penetration of natural gas are expected to lead to 6.2% CAGR in volumes in FY16-19E to 2.9 mmscmd in FY19E. Subsequently, revenues and PAT are expected to increase at a CAGR of 5.2% and 15.3%, respectively, over FY16-19E.
Expanding operations, increased penetration to drive volume growth
A strong gas pipeline infrastructure and expanding operations in Mumbai, its adjoining areas and Raigad district will enable MGL to capture the benefits of the large and growing market given the low penetration. MGL plans to add 83 CNG stations and 675 km of pipeline over the next five years to its existing network of 188 CNG stations and 4646 km of pipelines in FY16. Superior geographical reach and increasing demand will lead to 6.3% and 6.1% CAGR in CNG and PNG volumes, respectively, over FY16-19E, resulting in 2.9 mmscmd of sales volume in FY19E.
Favourable sourcing of natural gas provides competitive edge
The CGD sector has benefited in a significant manner from the government’s decision to prioritise the allocation of domestic natural gas for CNG and domestic PNG customers. This has enabled MGL to access cheaper gas for CNG and domestic business segments, constituting ~86% of total sales volume. Cost advantage of CNG over alternative fuels like petrol and diesel by 37.5% and 38.6%, respectively, will enhance the conversion of private volumes to CNG as well as help the company to maintain pricing power. We estimate MGL’s EBITDA will remain stable at ~| 7.1 per scm over the next two years from | 5.8 per scm in FY16.
Strong parentage, growing CGD markets to create long-term value
MGL’s strong promoters, Gail and BG group (now acquired by Shell) provide the company with a competitive edge in sourcing natural gas, and in expansion into existing and new geographical areas. The ongoing and upcoming bidding for new CGD areas also presents MGL with a scope to expand its business further. MGL presents an opportunity to have an exposure to the robust business model and growing CGD space. We value MGL at | 1055 per share, with a BUY recommendation. Exhibit 1: Valuation Metrics | Crore FY15 FY16 FY17E FY18E FY19E
Revenues (| crore) 2291.7 2285.8 2229.8 2475.9 2665.0
EBITDA (| crore) 489.7 513.0 650.1 724.6 756.1
Net Profit (| crore) 301.0 308.7 397.2 448.7 473.1
EPS 33.7 34.6 40.2 45.4 47.9
P/E (x) 26.5 25.8 22.1 19.7 18.6
Price/Book Value (x) 5.7 5.2 5.2 4.6 4.2
EV/EBITDA (x) 16.0 15.2 13.2 11.7 11.0
RONW (%) 21.4 20.2 23.3 23.6 22.5
ROCE (%) 28.8 27.8 32.6 32.7 30.7
Source: Company, ICICIdirect.com Research
Mahanagar Gas (MAHGAS)| 893
Rating Matrix Rating : BuyTarget : | 1055Target Period : 12 monthsPotential Upside : 18%
YoY growth (%)
FY16 FY17E FY18E FY19ERevenues (0.3) (2.4) 11.0 7.6 EBITDA 4.7 26.7 11.5 4.3 Net Profit 2.6 28.7 13.0 5.4 EPS (|) 2.6 16.4 13.0 5.4
Valuation summary
FY16 FY17E FY18E FY19EP/E 25.8 22.1 19.7 18.6 Target P/E 30.5 26.2 23.2 22.0 EV / EBITDA 15.2 13.2 11.7 11.0 P/BV 5.2 5.2 4.6 4.2 RoNW (%) 20.2 23.3 23.6 22.5 RoCE (%) 27.8 32.6 32.7 30.7
Stock Data Particular AmountMarket Capitalization (| Crore) 8,821.1 Total Debt (FY16) (| Crore) 13.8 Cash and Investments (FY16) (| Crore) 172.1 EV (| Crore) 8,979.3 52 week H/L 956/493Equity capital (| Crore) 98.8 Face value (|) 10
Comparative return matrix (%)
Return % 1M 3M 6M 12M
IGL (2.8) 14.7 31.8 82.2
Gujarat Gas 18.2 42.4 21.2 39.4
Mahanagar Gas 3.2 16.7 43.8 -
Price movement
300
400
500
600
700
800
900
1,000
Mar
-17
Feb-
17
Dec-
16
Nov
-16
Sep-
16
7,000
7,500
8,000
8,500
9,000
9,500
10,000
Price (R.H.S) Nifty (L.H.S)
Research Analyst
Mayur Matani
Harshal Mehta
Akshay Gavankar
Page 2 ICICI Securities Ltd | Retail Equity Research
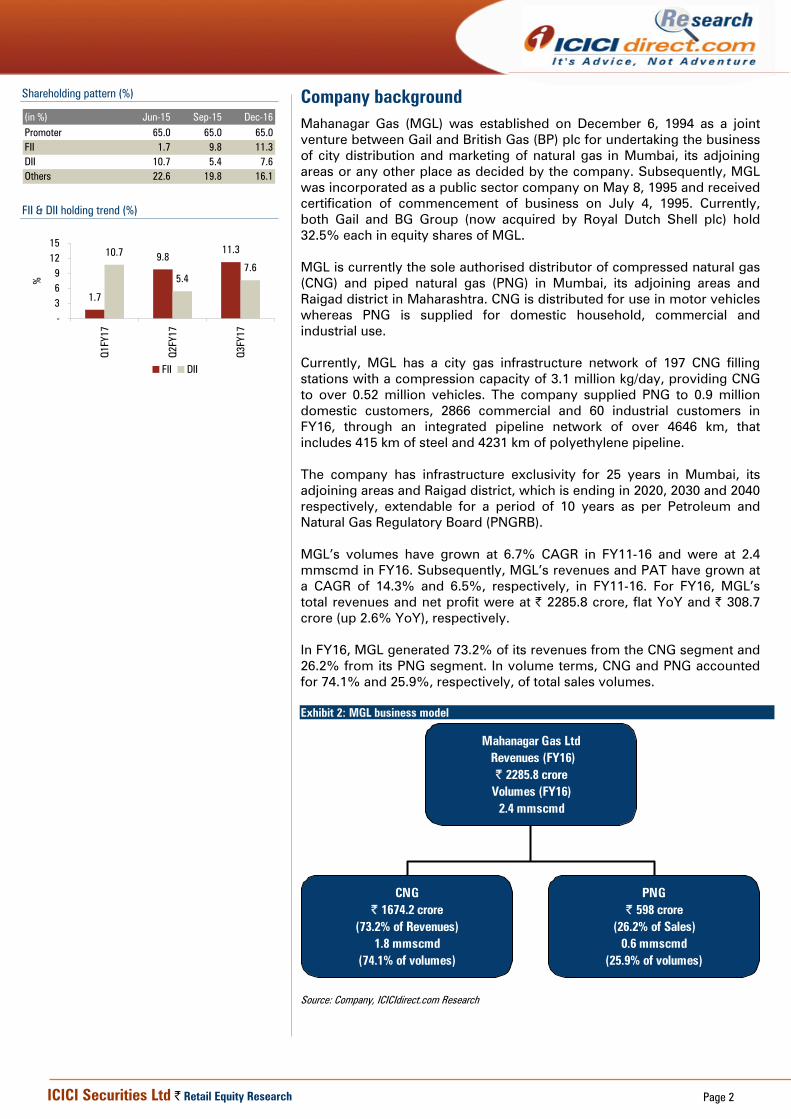
Company background Mahanagar Gas (MGL) was established on December 6, 1994 as a joint venture between Gail and British Gas (BP) plc for undertaking the business of city distribution and marketing of natural gas in Mumbai, its adjoining areas or any other place as decided by the company. Subsequently, MGL was incorporated as a public sector company on May 8, 1995 and received certification of commencement of business on July 4, 1995. Currently, both Gail and BG Group (now acquired by Royal Dutch Shell plc) hold 32.5% each in equity shares of MGL. MGL is currently the sole authorised distributor of compressed natural gas (CNG) and piped natural gas (PNG) in Mumbai, its adjoining areas and Raigad district in Maharashtra. CNG is distributed for use in motor vehicles whereas PNG is supplied for domestic household, commercial and industrial use. Currently, MGL has a city gas infrastructure network of 197 CNG filling stations with a compression capacity of 3.1 million kg/day, providing CNG to over 0.52 million vehicles. The company supplied PNG to 0.9 million domestic customers, 2866 commercial and 60 industrial customers in FY16, through an integrated pipeline network of over 4646 km, that includes 415 km of steel and 4231 km of polyethylene pipeline. The company has infrastructure exclusivity for 25 years in Mumbai, its adjoining areas and Raigad district, which is ending in 2020, 2030 and 2040 respectively, extendable for a period of 10 years as per Petroleum and Natural Gas Regulatory Board (PNGRB). MGL’s volumes have grown at 6.7% CAGR in FY11-16 and were at 2.4 mmscmd in FY16. Subsequently, MGL’s revenues and PAT have grown at a CAGR of 14.3% and 6.5%, respectively, in FY11-16. For FY16, MGL’s total revenues and net profit were at | 2285.8 crore, flat YoY and | 308.7 crore (up 2.6% YoY), respectively. In FY16, MGL generated 73.2% of its revenues from the CNG segment and 26.2% from its PNG segment. In volume terms, CNG and PNG accounted for 74.1% and 25.9%, respectively, of total sales volumes. Exhibit 2: MGL business model
Source: Company, ICICIdirect.com Research
Shareholding pattern (%)
(in %) Jun-15 Sep-15 Dec-16Promoter 65.0 65.0 65.0FII 1.7 9.8 11.3DII 10.7 5.4 7.6Others 22.6 19.8 16.1
FII & DII holding trend (%)
1.7
9.811.310.7
5.47.6
-369
1215
Q1FY
17
Q2FY
17
Q3FY
17
%
FII DII
Mahanagar Gas Ltd Revenues (FY16)
| 2285.8 croreVolumes (FY16)
2.4 mmscmd
CNG| 1674.2 crore
(73.2% of Revenues)1.8 mmscmd
(74.1% of volumes)
PNG| 598 crore
(26.2% of Sales)0.6 mmscmd
(25.9% of volumes)
Page 3 ICICI Securities Ltd | Retail Equity Research
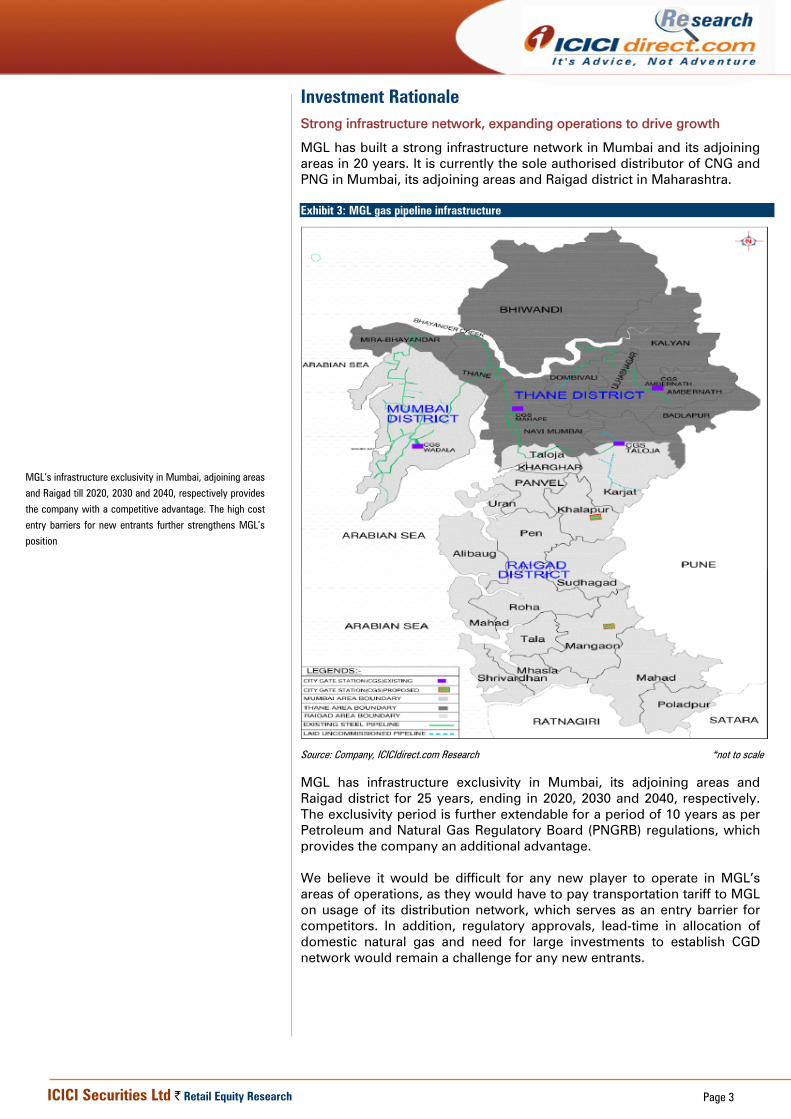
Investment Rationale Strong infrastructure network, expanding operations to drive growth
MGL has built a strong infrastructure network in Mumbai and its adjoining areas in 20 years. It is currently the sole authorised distributor of CNG and PNG in Mumbai, its adjoining areas and Raigad district in Maharashtra. Exhibit 3: MGL gas pipeline infrastructure
Source: Company, ICICIdirect.com Research *not to scale
MGL has infrastructure exclusivity in Mumbai, its adjoining areas and Raigad district for 25 years, ending in 2020, 2030 and 2040, respectively. The exclusivity period is further extendable for a period of 10 years as per Petroleum and Natural Gas Regulatory Board (PNGRB) regulations, which provides the company an additional advantage. We believe it would be difficult for any new player to operate in MGL’s areas of operations, as they would have to pay transportation tariff to MGL on usage of its distribution network, which serves as an entry barrier for competitors. In addition, regulatory approvals, lead-time in allocation of domestic natural gas and need for large investments to establish CGD network would remain a challenge for any new entrants.
MGL’s infrastructure exclusivity in Mumbai, adjoining areas
and Raigad till 2020, 2030 and 2040, respectively provides
the company with a competitive advantage. The high cost
entry barriers for new entrants further strengthens MGL’s
position
Page 4 ICICI Securities Ltd | Retail Equity Research
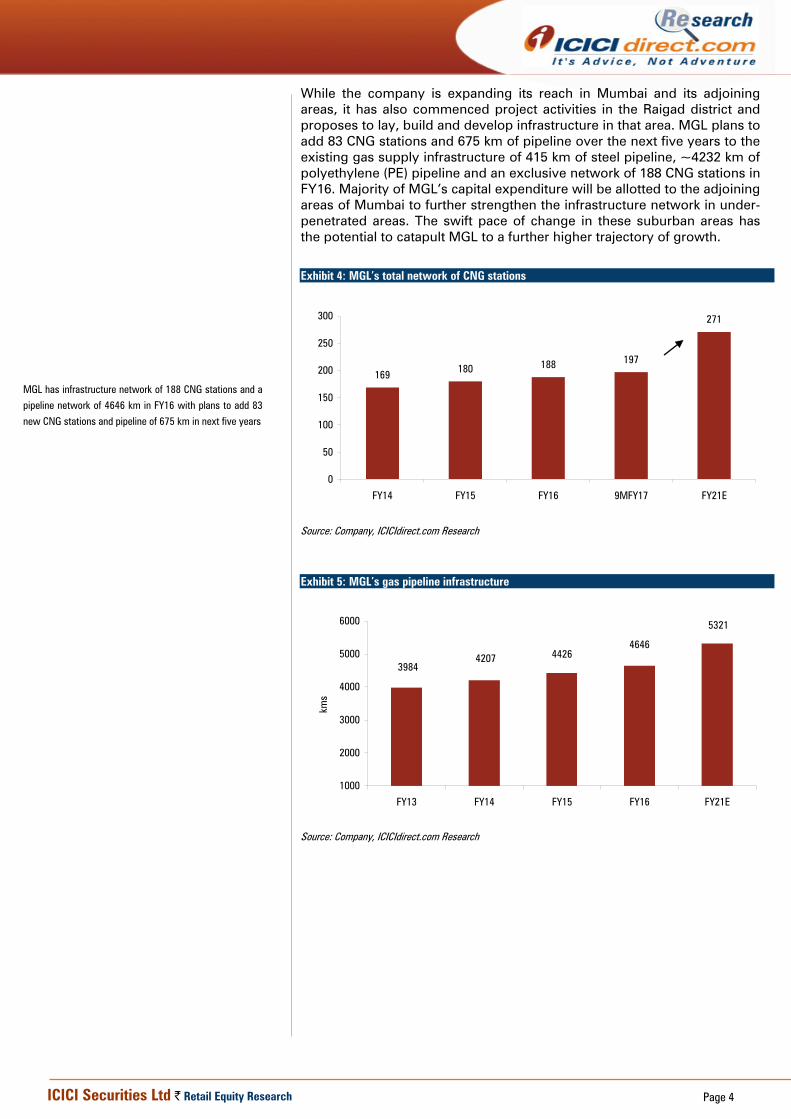
While the company is expanding its reach in Mumbai and its adjoining areas, it has also commenced project activities in the Raigad district and proposes to lay, build and develop infrastructure in that area. MGL plans to add 83 CNG stations and 675 km of pipeline over the next five years to the existing gas supply infrastructure of 415 km of steel pipeline, ~4232 km of polyethylene (PE) pipeline and an exclusive network of 188 CNG stations in FY16. Majority of MGL’s capital expenditure will be allotted to the adjoining areas of Mumbai to further strengthen the infrastructure network in under-penetrated areas. The swift pace of change in these suburban areas has the potential to catapult MGL to a further higher trajectory of growth.
Exhibit 4: MGL’s total network of CNG stations
169 180 188 197
271
0
50
100
150
200
250
300
FY14 FY15 FY16 9MFY17 FY21E
Source: Company, ICICIdirect.com Research
Exhibit 5: MGL’s gas pipeline infrastructure
39844207 4426
4646
5321
1000
2000
3000
4000
5000
6000
FY13 FY14 FY15 FY16 FY21E
kms
Source: Company, ICICIdirect.com Research
MGL has infrastructure network of 188 CNG stations and a
pipeline network of 4646 km in FY16 with plans to add 83
new CNG stations and pipeline of 675 km in next five years
Page 5 ICICI Securities Ltd | Retail Equity Research
Sustainable volume growth on the back of increased penetration
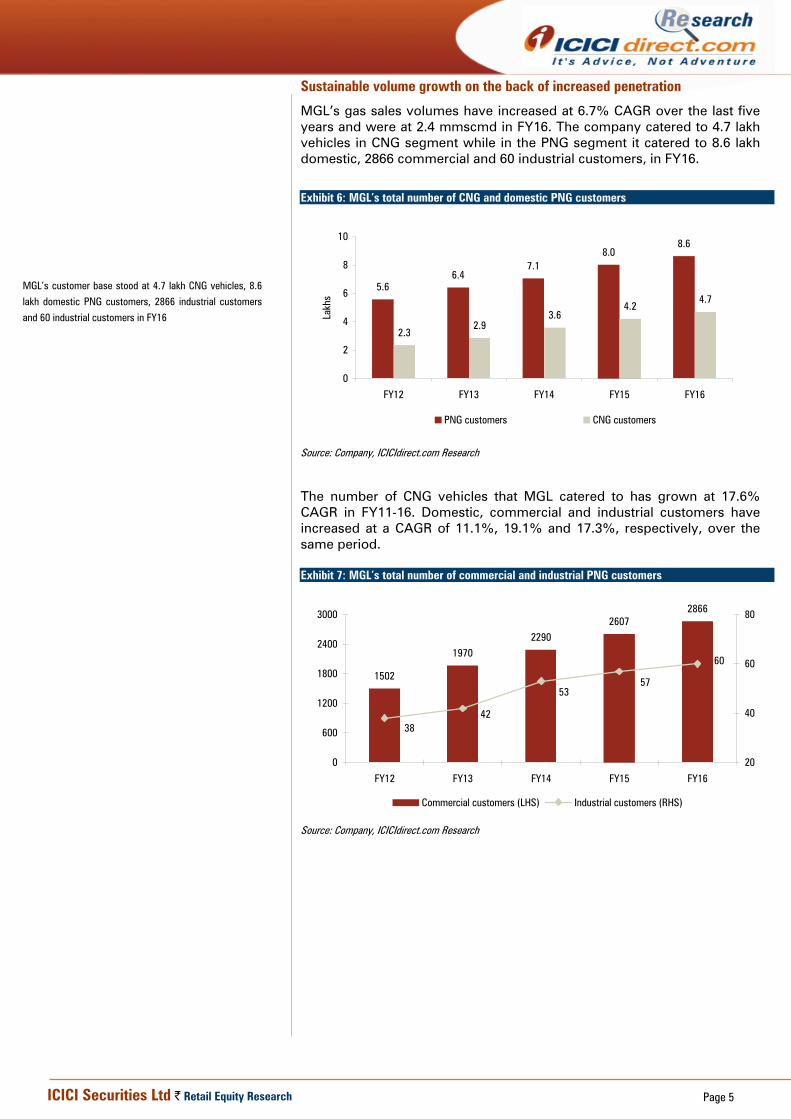
MGL’s gas sales volumes have increased at 6.7% CAGR over the last five years and were at 2.4 mmscmd in FY16. The company catered to 4.7 lakh vehicles in CNG segment while in the PNG segment it catered to 8.6 lakh domestic, 2866 commercial and 60 industrial customers, in FY16.
Exhibit 6: MGL’s total number of CNG and domestic PNG customers
5.66.4
7.18.0
8.6
2.32.9
3.64.2
4.7
0
2
4
6
8
10
FY12 FY13 FY14 FY15 FY16
Lakh
s
PNG customers CNG customers
Source: Company, ICICIdirect.com Research
The number of CNG vehicles that MGL catered to has grown at 17.6% CAGR in FY11-16. Domestic, commercial and industrial customers have increased at a CAGR of 11.1%, 19.1% and 17.3%, respectively, over the same period. Exhibit 7: MGL’s total number of commercial and industrial PNG customers
1502
19702290
26072866
3842
5357
60
0
600
1200
1800
2400
3000
FY12 FY13 FY14 FY15 FY16
20
40
60
80
Commercial customers (LHS) Industrial customers (RHS)
Source: Company, ICICIdirect.com Research
MGL’s customer base stood at 4.7 lakh CNG vehicles, 8.6
lakh domestic PNG customers, 2866 industrial customers
and 60 industrial customers in FY16
Page 6 ICICI Securities Ltd | Retail Equity Research
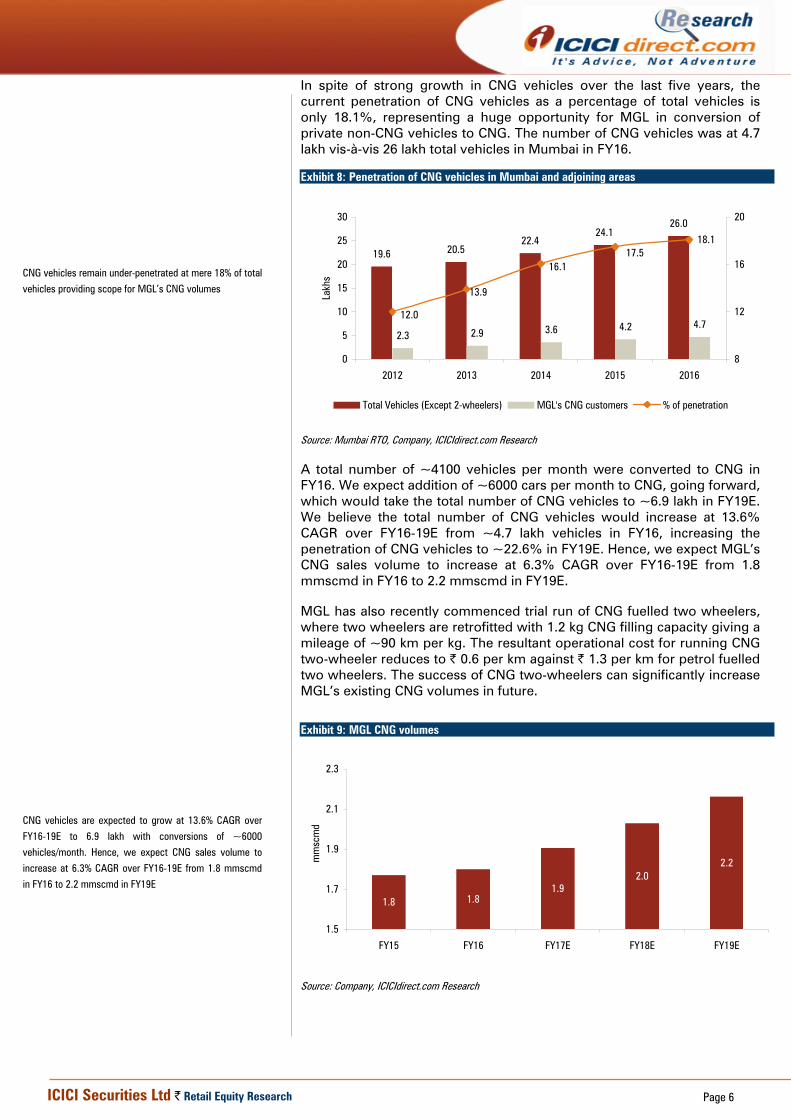
In spite of strong growth in CNG vehicles over the last five years, the current penetration of CNG vehicles as a percentage of total vehicles is only 18.1%, representing a huge opportunity for MGL in conversion of private non-CNG vehicles to CNG. The number of CNG vehicles was at 4.7 lakh vis-à-vis 26 lakh total vehicles in Mumbai in FY16. Exhibit 8: Penetration of CNG vehicles in Mumbai and adjoining areas
19.6 20.522.4
24.126.0
2.3 2.9 3.6 4.2 4.7
18.117.5
16.1
13.9
12.0
0
5
10
15
20
25
30
2012 2013 2014 2015 2016
Lakh
s
8
12
16
20
Total Vehicles (Except 2-wheelers) MGL's CNG customers % of penetration
Source: Mumbai RTO, Company, ICICIdirect.com Research
A total number of ~4100 vehicles per month were converted to CNG in FY16. We expect addition of ~6000 cars per month to CNG, going forward, which would take the total number of CNG vehicles to ~6.9 lakh in FY19E. We believe the total number of CNG vehicles would increase at 13.6% CAGR over FY16-19E from ~4.7 lakh vehicles in FY16, increasing the penetration of CNG vehicles to ~22.6% in FY19E. Hence, we expect MGL’s CNG sales volume to increase at 6.3% CAGR over FY16-19E from 1.8 mmscmd in FY16 to 2.2 mmscmd in FY19E. MGL has also recently commenced trial run of CNG fuelled two wheelers, where two wheelers are retrofitted with 1.2 kg CNG filling capacity giving a mileage of ~90 km per kg. The resultant operational cost for running CNG two-wheeler reduces to | 0.6 per km against | 1.3 per km for petrol fuelled two wheelers. The success of CNG two-wheelers can significantly increase MGL’s existing CNG volumes in future.
Exhibit 9: MGL CNG volumes
1.8 1.81.9
2.02.2
1.5
1.7
1.9
2.1
2.3
FY15 FY16 FY17E FY18E FY19E
mm
scm
d
Source: Company, ICICIdirect.com Research
CNG vehicles remain under-penetrated at mere 18% of total
vehicles providing scope for MGL’s CNG volumes
CNG vehicles are expected to grow at 13.6% CAGR over
FY16-19E to 6.9 lakh with conversions of ~6000
vehicles/month. Hence, we expect CNG sales volume to
increase at 6.3% CAGR over FY16-19E from 1.8 mmscmd
in FY16 to 2.2 mmscmd in FY19E
Page 7 ICICI Securities Ltd | Retail Equity Research
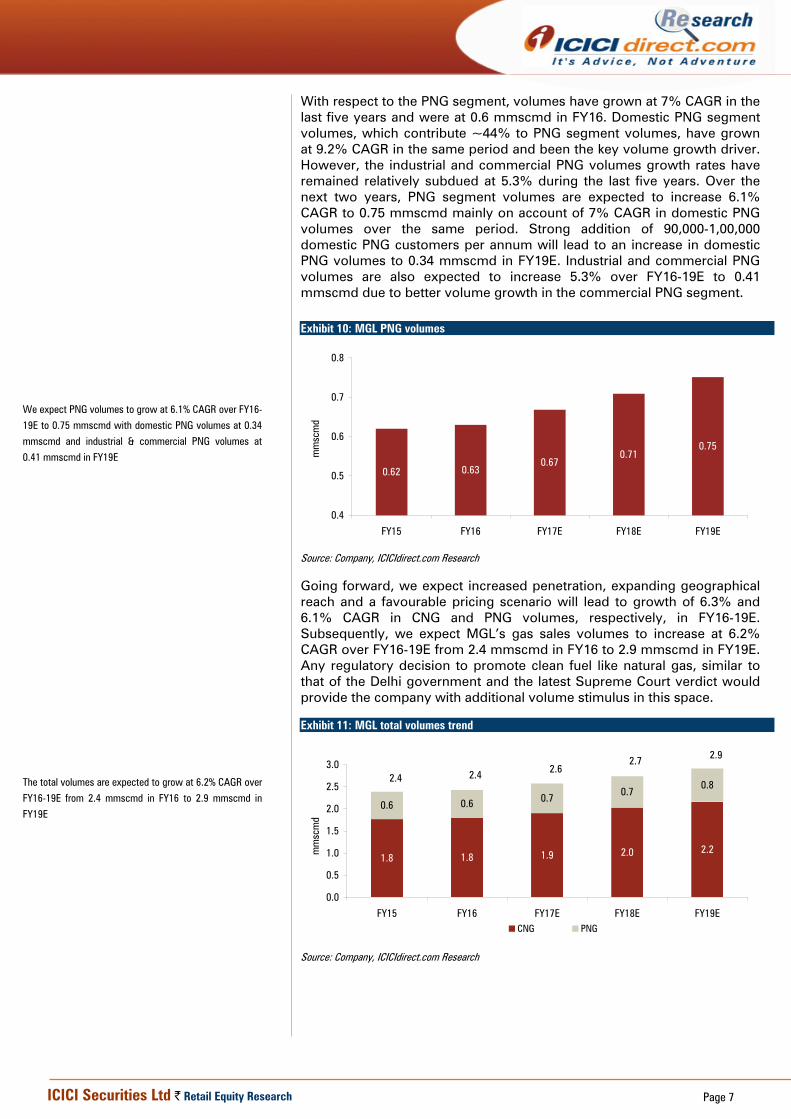
With respect to the PNG segment, volumes have grown at 7% CAGR in the last five years and were at 0.6 mmscmd in FY16. Domestic PNG segment volumes, which contribute ~44% to PNG segment volumes, have grown at 9.2% CAGR in the same period and been the key volume growth driver. However, the industrial and commercial PNG volumes growth rates have remained relatively subdued at 5.3% during the last five years. Over the next two years, PNG segment volumes are expected to increase 6.1% CAGR to 0.75 mmscmd mainly on account of 7% CAGR in domestic PNG volumes over the same period. Strong addition of 90,000-1,00,000 domestic PNG customers per annum will lead to an increase in domestic PNG volumes to 0.34 mmscmd in FY19E. Industrial and commercial PNG volumes are also expected to increase 5.3% over FY16-19E to 0.41 mmscmd due to better volume growth in the commercial PNG segment.
Exhibit 10: MGL PNG volumes
0.62 0.630.67
0.710.75
0.4
0.5
0.6
0.7
0.8
FY15 FY16 FY17E FY18E FY19E
mm
scm
d
Source: Company, ICICIdirect.com Research
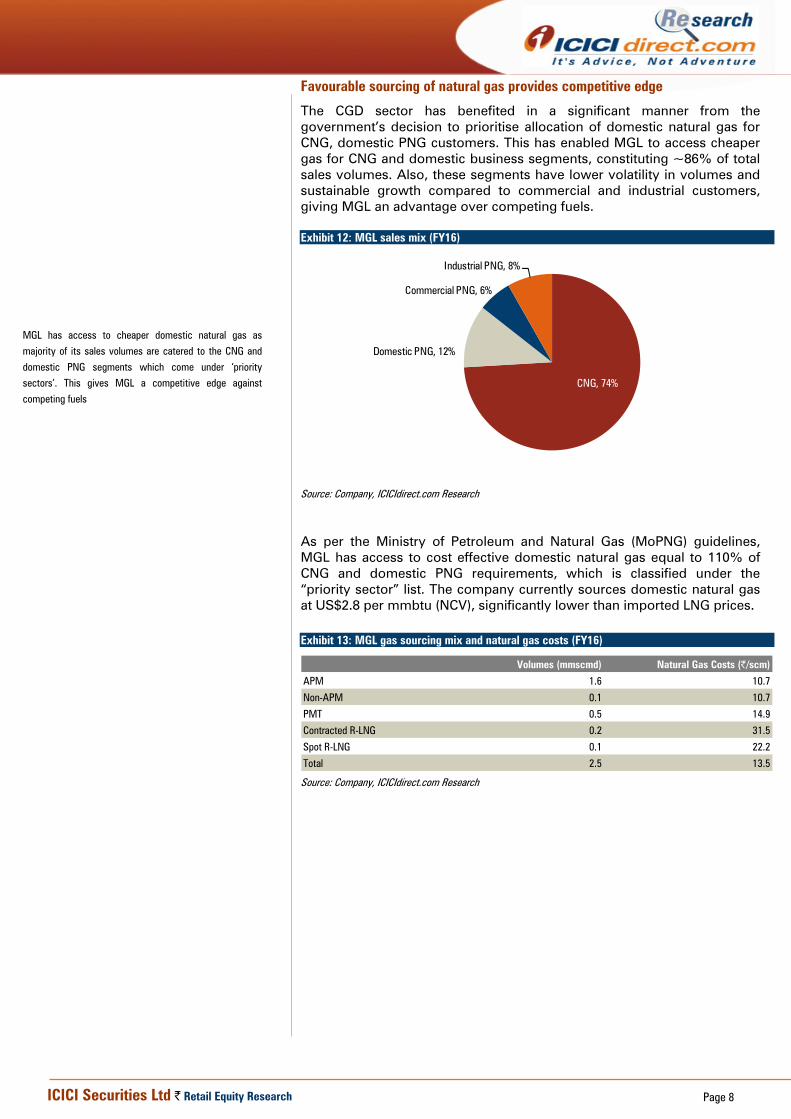
Going forward, we expect increased penetration, expanding geographical reach and a favourable pricing scenario will lead to growth of 6.3% and 6.1% CAGR in CNG and PNG volumes, respectively, in FY16-19E. Subsequently, we expect MGL’s gas sales volumes to increase at 6.2% CAGR over FY16-19E from 2.4 mmscmd in FY16 to 2.9 mmscmd in FY19E. Any regulatory decision to promote clean fuel like natural gas, similar to that of the Delhi government and the latest Supreme Court verdict would provide the company with additional volume stimulus in this space. Exhibit 11: MGL total volumes trend
1.8 1.8 1.9 2.0 2.2
0.6 0.6 0.70.7
0.82.4 2.4 2.6
2.7 2.9
0.0
0.5
1.0
1.5
2.0
2.5
3.0
FY15 FY16 FY17E FY18E FY19E
mm
scm
d
CNG PNG
Source: Company, ICICIdirect.com Research
We expect PNG volumes to grow at 6.1% CAGR over FY16-
19E to 0.75 mmscmd with domestic PNG volumes at 0.34
mmscmd and industrial & commercial PNG volumes at
0.41 mmscmd in FY19E
The total volumes are expected to grow at 6.2% CAGR over
FY16-19E from 2.4 mmscmd in FY16 to 2.9 mmscmd in
FY19E
Page 8 ICICI Securities Ltd | Retail Equity Research
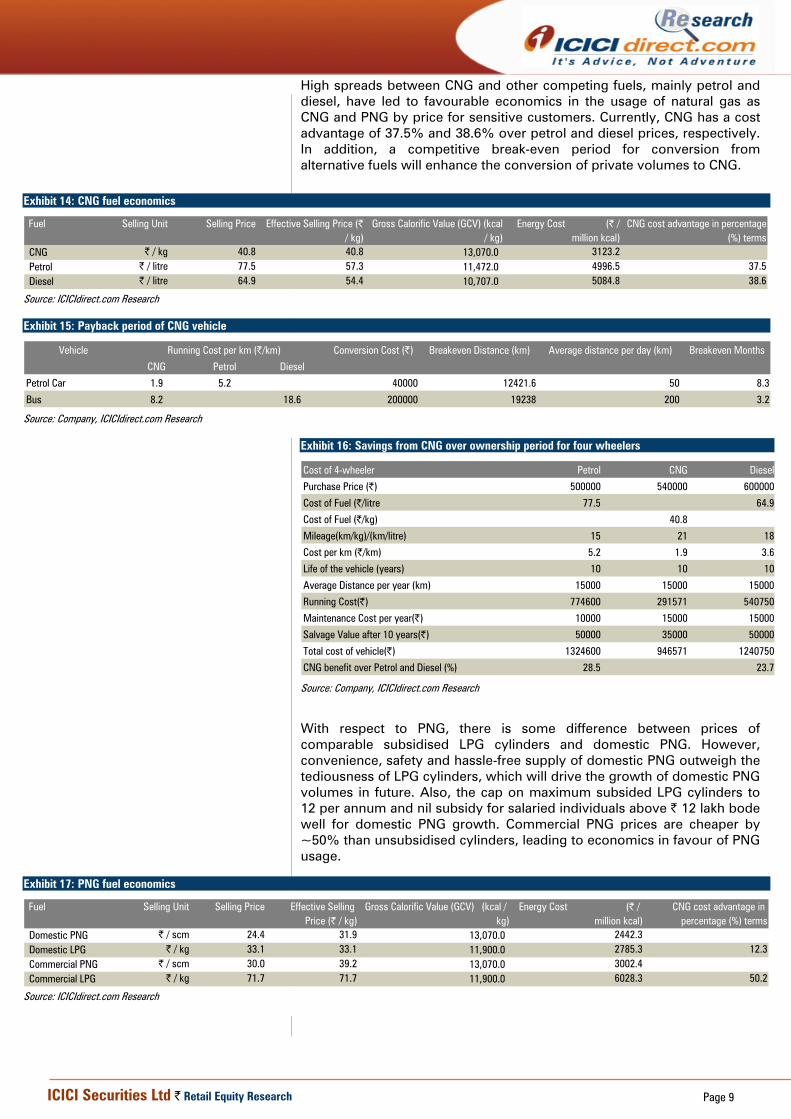
Favourable sourcing of natural gas provides competitive edge
The CGD sector has benefited in a significant manner from the government’s decision to prioritise allocation of domestic natural gas for CNG, domestic PNG customers. This has enabled MGL to access cheaper gas for CNG and domestic business segments, constituting ~86% of total sales volumes. Also, these segments have lower volatility in volumes and sustainable growth compared to commercial and industrial customers, giving MGL an advantage over competing fuels. Exhibit 12: MGL sales mix (FY16)
CNG, 74%
Domestic PNG, 12%
Commercial PNG, 6%
Industrial PNG, 8%
Source: Company, ICICIdirect.com Research
As per the Ministry of Petroleum and Natural Gas (MoPNG) guidelines, MGL has access to cost effective domestic natural gas equal to 110% of CNG and domestic PNG requirements, which is classified under the “priority sector” list. The company currently sources domestic natural gas at US$2.8 per mmbtu (NCV), significantly lower than imported LNG prices. Exhibit 13: MGL gas sourcing mix and natural gas costs (FY16)
Volumes (mmscmd) Natural Gas Costs (|/scm)
APM 1.6 10.7
Non-APM 0.1 10.7
PMT 0.5 14.9
Contracted R-LNG 0.2 31.5
Spot R-LNG 0.1 22.2
Total 2.5 13.5
Source: Company, ICICIdirect.com Research
MGL has access to cheaper domestic natural gas as
majority of its sales volumes are catered to the CNG and
domestic PNG segments which come under ‘priority
sectors’. This gives MGL a competitive edge against
competing fuels
Page 9 ICICI Securities Ltd | Retail Equity Research
High spreads between CNG and other competing fuels, mainly petrol and diesel, have led to favourable economics in the usage of natural gas as CNG and PNG by price for sensitive customers. Currently, CNG has a cost advantage of 37.5% and 38.6% over petrol and diesel prices, respectively. In addition, a competitive break-even period for conversion from alternative fuels will enhance the conversion of private volumes to CNG.
Exhibit 14: CNG fuel economics
Fuel Selling Unit Selling Price Effective Selling Price (| / kg)
Gross Calorific Value (GCV) (kcal / kg)
Energy Cost (| / million kcal)
CNG cost advantage in percentage (%) terms
CNG | / kg 40.8 40.8 13,070.0 3123.2Petrol | / litre 77.5 57.3 11,472.0 4996.5 37.5Diesel | / litre 64.9 54.4 10,707.0 5084.8 38.6
Source: ICICIdirect.com Research
Exhibit 15: Payback period of CNG vehicle
Vehicle Conversion Cost (|) Breakeven Distance (km) Average distance per day (km) Breakeven Months
CNG Petrol Diesel
Petrol Car 1.9 5.2 40000 12421.6 50 8.3
Bus 8.2 18.6 200000 19238 200 3.2
Running Cost per km (|/km)
Source: Company, ICICIdirect.com Research
Exhibit 16: Savings from CNG over ownership period for four wheelers
Cost of 4-wheeler Petrol CNG Diesel
Purchase Price (|) 500000 540000 600000
Cost of Fuel (|/litre 77.5 64.9
Cost of Fuel (|/kg) 40.8
Mileage(km/kg)/(km/litre) 15 21 18
Cost per km (|/km) 5.2 1.9 3.6
Life of the vehicle (years) 10 10 10
Average Distance per year (km) 15000 15000 15000
Running Cost(|) 774600 291571 540750
Maintenance Cost per year(|) 10000 15000 15000
Salvage Value after 10 years(|) 50000 35000 50000
Total cost of vehicle(|) 1324600 946571 1240750
CNG benefit over Petrol and Diesel (%) 28.5 23.7
Source: Company, ICICIdirect.com Research
With respect to PNG, there is some difference between prices of comparable subsidised LPG cylinders and domestic PNG. However, convenience, safety and hassle-free supply of domestic PNG outweigh the tediousness of LPG cylinders, which will drive the growth of domestic PNG volumes in future. Also, the cap on maximum subsided LPG cylinders to 12 per annum and nil subsidy for salaried individuals above | 12 lakh bode well for domestic PNG growth. Commercial PNG prices are cheaper by ~50% than unsubsidised cylinders, leading to economics in favour of PNG usage.
Exhibit 17: PNG fuel economics
Fuel Selling Unit Selling Price Effective Selling Price (| / kg)
Gross Calorific Value (GCV) (kcal / kg)
Energy Cost (| / million kcal)
CNG cost advantage in percentage (%) terms
Domestic PNG | / scm 24.4 31.9 13,070.0 2442.3Domestic LPG | / kg 33.1 33.1 11,900.0 2785.3 12.3Commercial PNG | / scm 30.0 39.2 13,070.0 3002.4Commercial LPG | / kg 71.7 71.7 11,900.0 6028.3 50.2
Source: ICICIdirect.com Research
Page 10 ICICI Securities Ltd | Retail Equity Research
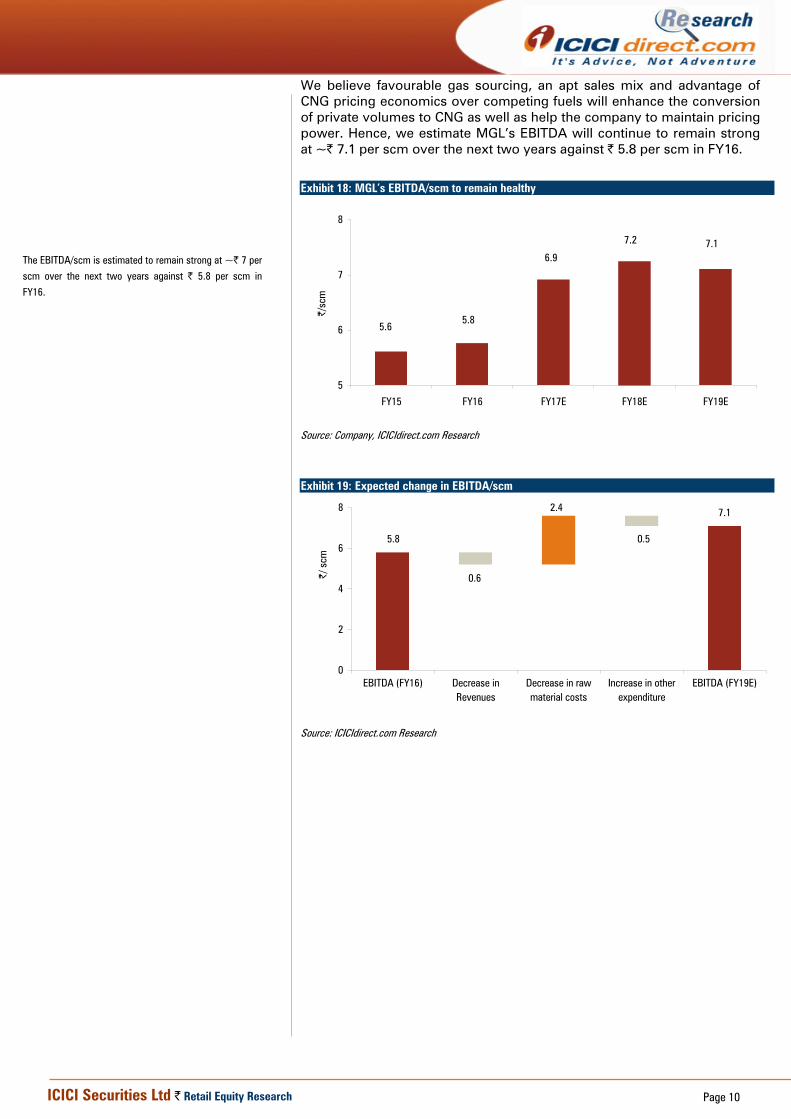
We believe favourable gas sourcing, an apt sales mix and advantage of CNG pricing economics over competing fuels will enhance the conversion of private volumes to CNG as well as help the company to maintain pricing power. Hence, we estimate MGL’s EBITDA will continue to remain strong at ~| 7.1 per scm over the next two years against | 5.8 per scm in FY16.
Exhibit 18: MGL’s EBITDA/scm to remain healthy
5.65.8
6.9
7.2 7.1
5
6
7
8
FY15 FY16 FY17E FY18E FY19E
|/sc
m
Source: Company, ICICIdirect.com Research
Exhibit 19: Expected change in EBITDA/scm
7.1
0.5
2.4
0.6
5.8
0
2
4
6
8
EBITDA (FY16) Decrease inRevenues
Decrease in rawmaterial costs
Increase in otherexpenditure
EBITDA (FY19E)
|/ s
cm
Source: ICICIdirect.com Research
The EBITDA/scm is estimated to remain strong at ~| 7 per
scm over the next two years against | 5.8 per scm in
FY16.
Page 11 ICICI Securities Ltd | Retail Equity Research
Strong parentage to facilitate in capturing growing CGD market opportunities
MGL has strong promoters, Gail and BG group (now acquired by Shell), which have expertise and rich experience in CGD business operations. Gail and Shell’s leadership in natural gas transmission, LNG imports and marketing will provide MGL with a competitive edge in sourcing natural gas, and expansion into existing and new geographical areas.
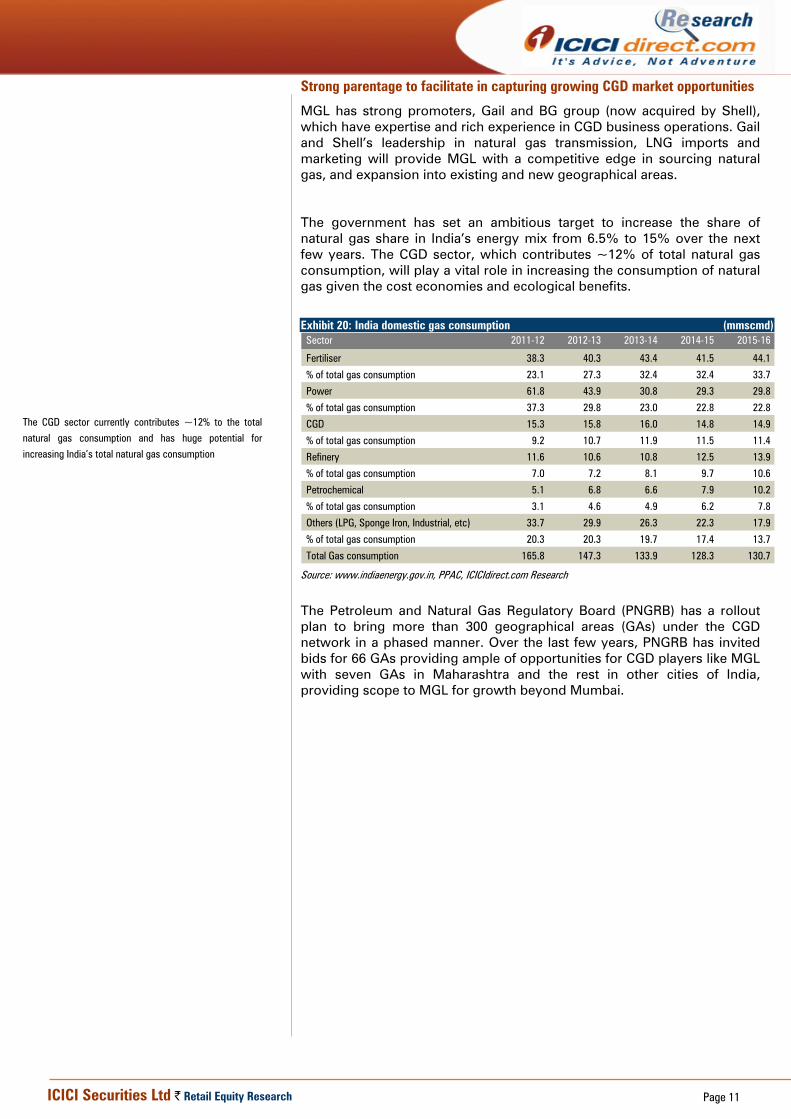
The government has set an ambitious target to increase the share of natural gas share in India’s energy mix from 6.5% to 15% over the next few years. The CGD sector, which contributes ~12% of total natural gas consumption, will play a vital role in increasing the consumption of natural gas given the cost economies and ecological benefits.
Exhibit 20: India domestic gas consumption (mmscmd)
Sector 2011-12 2012-13 2013-14 2014-15 2015-16
Fertiliser 38.3 40.3 43.4 41.5 44.1
% of total gas consumption 23.1 27.3 32.4 32.4 33.7
Power 61.8 43.9 30.8 29.3 29.8
% of total gas consumption 37.3 29.8 23.0 22.8 22.8
CGD 15.3 15.8 16.0 14.8 14.9
% of total gas consumption 9.2 10.7 11.9 11.5 11.4
Refinery 11.6 10.6 10.8 12.5 13.9
% of total gas consumption 7.0 7.2 8.1 9.7 10.6
Petrochemical 5.1 6.8 6.6 7.9 10.2
% of total gas consumption 3.1 4.6 4.9 6.2 7.8
Others (LPG, Sponge Iron, Industrial, etc) 33.7 29.9 26.3 22.3 17.9
% of total gas consumption 20.3 20.3 19.7 17.4 13.7
Total Gas consumption 165.8 147.3 133.9 128.3 130.7
Source: www.indiaenergy.gov.in, PPAC, ICICIdirect.com Research
The Petroleum and Natural Gas Regulatory Board (PNGRB) has a rollout plan to bring more than 300 geographical areas (GAs) under the CGD network in a phased manner. Over the last few years, PNGRB has invited bids for 66 GAs providing ample of opportunities for CGD players like MGL with seven GAs in Maharashtra and the rest in other cities of India, providing scope to MGL for growth beyond Mumbai.
The CGD sector currently contributes ~12% to the total
natural gas consumption and has huge potential for
increasing India’s total natural gas consumption
Page 12 ICICI Securities Ltd | Retail Equity Research
MGL - Well placed among CGD players
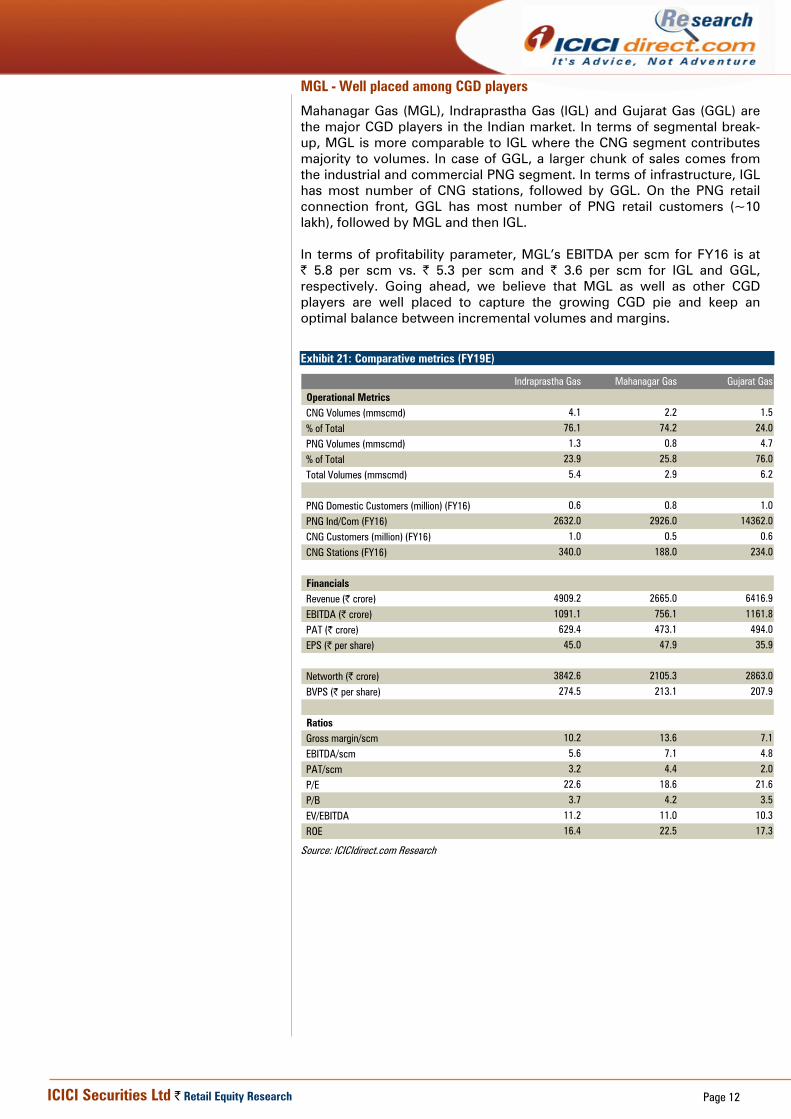
Mahanagar Gas (MGL), Indraprastha Gas (IGL) and Gujarat Gas (GGL) are the major CGD players in the Indian market. In terms of segmental break-up, MGL is more comparable to IGL where the CNG segment contributes majority to volumes. In case of GGL, a larger chunk of sales comes from the industrial and commercial PNG segment. In terms of infrastructure, IGL has most number of CNG stations, followed by GGL. On the PNG retail connection front, GGL has most number of PNG retail customers (~10 lakh), followed by MGL and then IGL. In terms of profitability parameter, MGL’s EBITDA per scm for FY16 is at | 5.8 per scm vs. | 5.3 per scm and | 3.6 per scm for IGL and GGL, respectively. Going ahead, we believe that MGL as well as other CGD players are well placed to capture the growing CGD pie and keep an optimal balance between incremental volumes and margins.
Exhibit 21: Comparative metrics (FY19E)
Indraprastha Gas Mahanagar Gas Gujarat Gas
Operational Metrics CNG Volumes (mmscmd) 4.1 2.2 1.5
% of Total 76.1 74.2 24.0
PNG Volumes (mmscmd) 1.3 0.8 4.7
% of Total 23.9 25.8 76.0
Total Volumes (mmscmd) 5.4 2.9 6.2
PNG Domestic Customers (million) (FY16) 0.6 0.8 1.0
PNG Ind/Com (FY16) 2632.0 2926.0 14362.0
CNG Customers (million) (FY16) 1.0 0.5 0.6
CNG Stations (FY16) 340.0 188.0 234.0
Financials Revenue (| crore) 4909.2 2665.0 6416.9
EBITDA (| crore) 1091.1 756.1 1161.8
PAT (| crore) 629.4 473.1 494.0
EPS (| per share) 45.0 47.9 35.9
Networth (| crore) 3842.6 2105.3 2863.0
BVPS (| per share) 274.5 213.1 207.9
RatiosGross margin/scm 10.2 13.6 7.1
EBITDA/scm 5.6 7.1 4.8
PAT/scm 3.2 4.4 2.0
P/E 22.6 18.6 21.6
P/B 3.7 4.2 3.5
EV/EBITDA 11.2 11.0 10.3
ROE 16.4 22.5 17.3 Source: ICICIdirect.com Research
Page 13 ICICI Securities Ltd | Retail Equity Research
Financials Revenues to grow at 5.2% CAGR in FY16-19E on account of volume increase
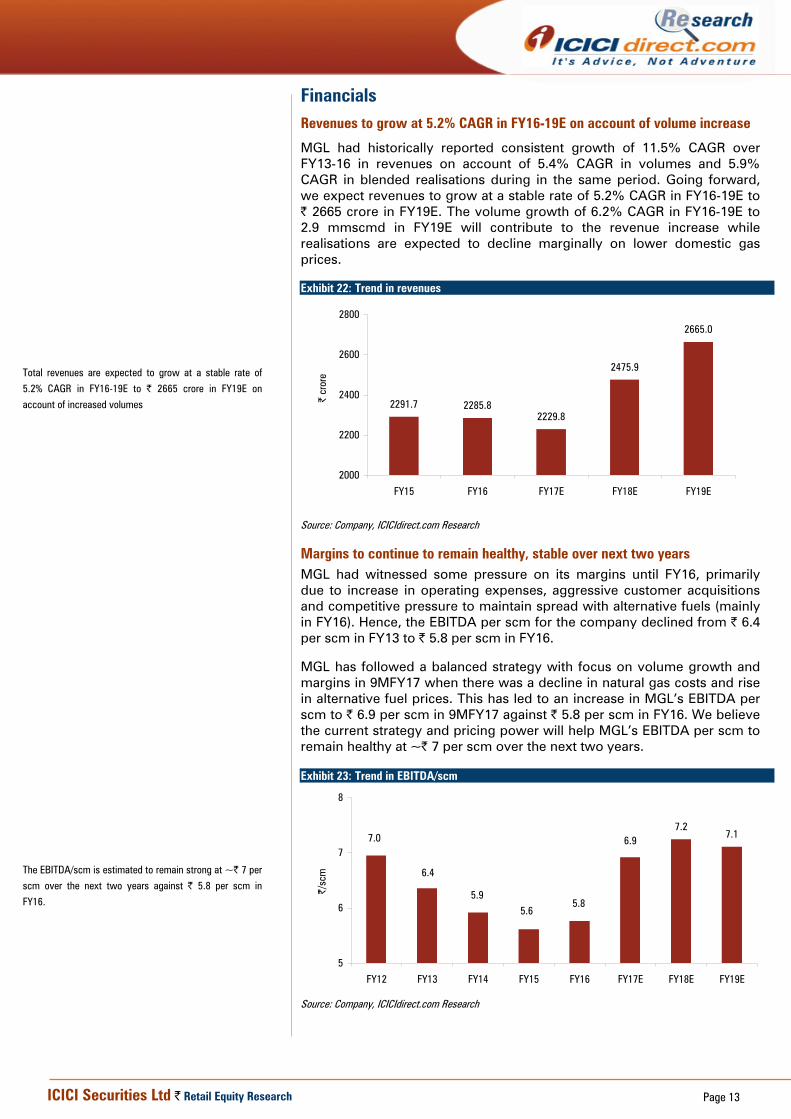
MGL had historically reported consistent growth of 11.5% CAGR over FY13-16 in revenues on account of 5.4% CAGR in volumes and 5.9% CAGR in blended realisations during in the same period. Going forward, we expect revenues to grow at a stable rate of 5.2% CAGR in FY16-19E to | 2665 crore in FY19E. The volume growth of 6.2% CAGR in FY16-19E to 2.9 mmscmd in FY19E will contribute to the revenue increase while realisations are expected to decline marginally on lower domestic gas prices.
Exhibit 22: Trend in revenues
2291.7 2285.82229.8
2475.9
2665.0
2000
2200
2400
2600
2800
FY15 FY16 FY17E FY18E FY19E
| cr
ore
Source: Company, ICICIdirect.com Research
Margins to continue to remain healthy, stable over next two years MGL had witnessed some pressure on its margins until FY16, primarily due to increase in operating expenses, aggressive customer acquisitions and competitive pressure to maintain spread with alternative fuels (mainly in FY16). Hence, the EBITDA per scm for the company declined from | 6.4 per scm in FY13 to | 5.8 per scm in FY16. MGL has followed a balanced strategy with focus on volume growth and margins in 9MFY17 when there was a decline in natural gas costs and rise in alternative fuel prices. This has led to an increase in MGL’s EBITDA per scm to | 6.9 per scm in 9MFY17 against | 5.8 per scm in FY16. We believe the current strategy and pricing power will help MGL’s EBITDA per scm to remain healthy at ~| 7 per scm over the next two years. Exhibit 23: Trend in EBITDA/scm
7.27.1
6.9
5.85.6
5.9
6.4
7.0
5
6
7
8
FY12 FY13 FY14 FY15 FY16 FY17E FY18E FY19E
|/sc
m
Source: Company, ICICIdirect.com Research
Total revenues are expected to grow at a stable rate of
5.2% CAGR in FY16-19E to | 2665 crore in FY19E on
account of increased volumes
The EBITDA/scm is estimated to remain strong at ~| 7 per
scm over the next two years against | 5.8 per scm in
FY16.
Page 14 ICICI Securities Ltd | Retail Equity Research
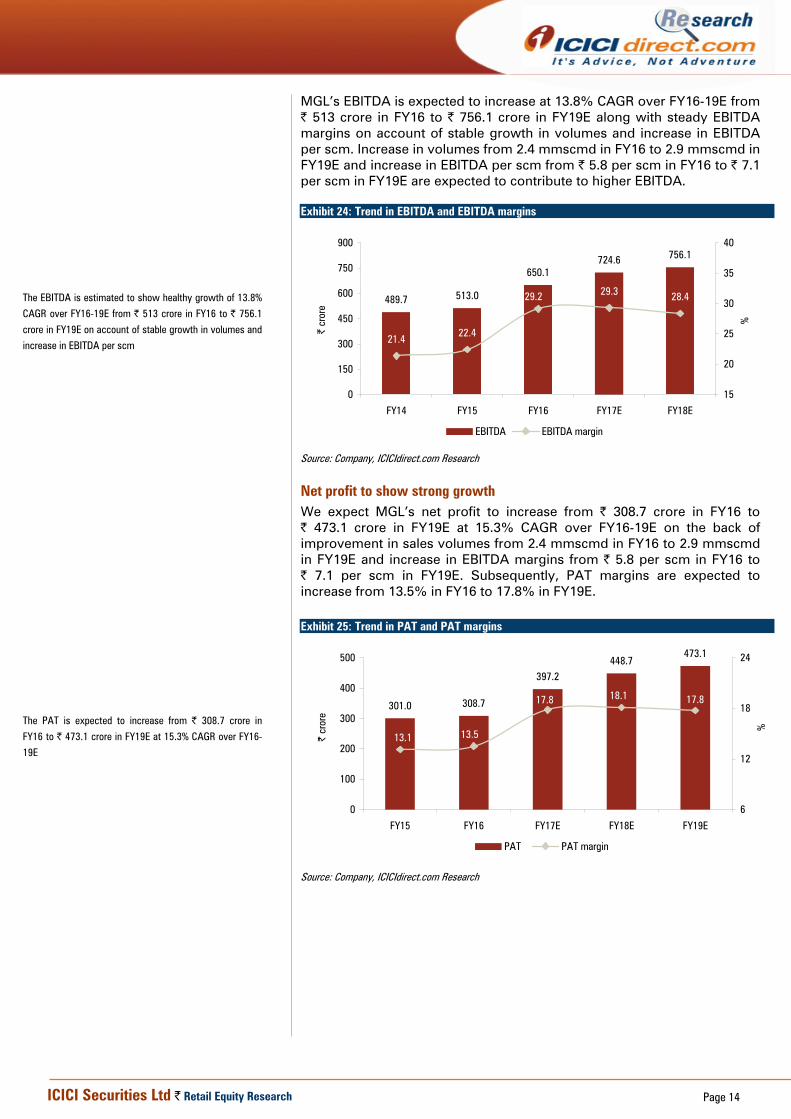
MGL’s EBITDA is expected to increase at 13.8% CAGR over FY16-19E from | 513 crore in FY16 to | 756.1 crore in FY19E along with steady EBITDA margins on account of stable growth in volumes and increase in EBITDA per scm. Increase in volumes from 2.4 mmscmd in FY16 to 2.9 mmscmd in FY19E and increase in EBITDA per scm from | 5.8 per scm in FY16 to | 7.1 per scm in FY19E are expected to contribute to higher EBITDA. Exhibit 24: Trend in EBITDA and EBITDA margins
489.7 513.0
650.1724.6 756.1
21.4 22.4
29.2 29.3 28.4
0
150
300
450
600
750
900
FY14 FY15 FY16 FY17E FY18E
| cr
ore
15
20
25
30
35
40
%
EBITDA EBITDA margin
Source: Company, ICICIdirect.com Research
Net profit to show strong growth We expect MGL’s net profit to increase from | 308.7 crore in FY16 to | 473.1 crore in FY19E at 15.3% CAGR over FY16-19E on the back of improvement in sales volumes from 2.4 mmscmd in FY16 to 2.9 mmscmd in FY19E and increase in EBITDA margins from | 5.8 per scm in FY16 to | 7.1 per scm in FY19E. Subsequently, PAT margins are expected to increase from 13.5% in FY16 to 17.8% in FY19E. Exhibit 25: Trend in PAT and PAT margins
301.0 308.7
397.2448.7
473.1
17.818.117.8
13.513.1
0
100
200
300
400
500
FY15 FY16 FY17E FY18E FY19E
| cr
ore
6
12
18
24
%
PAT PAT margin
Source: Company, ICICIdirect.com Research
The EBITDA is estimated to show healthy growth of 13.8%
CAGR over FY16-19E from | 513 crore in FY16 to | 756.1
crore in FY19E on account of stable growth in volumes and
increase in EBITDA per scm
The PAT is expected to increase from | 308.7 crore in
FY16 to | 473.1 crore in FY19E at 15.3% CAGR over FY16-
19E
Page 15 ICICI Securities Ltd | Retail Equity Research
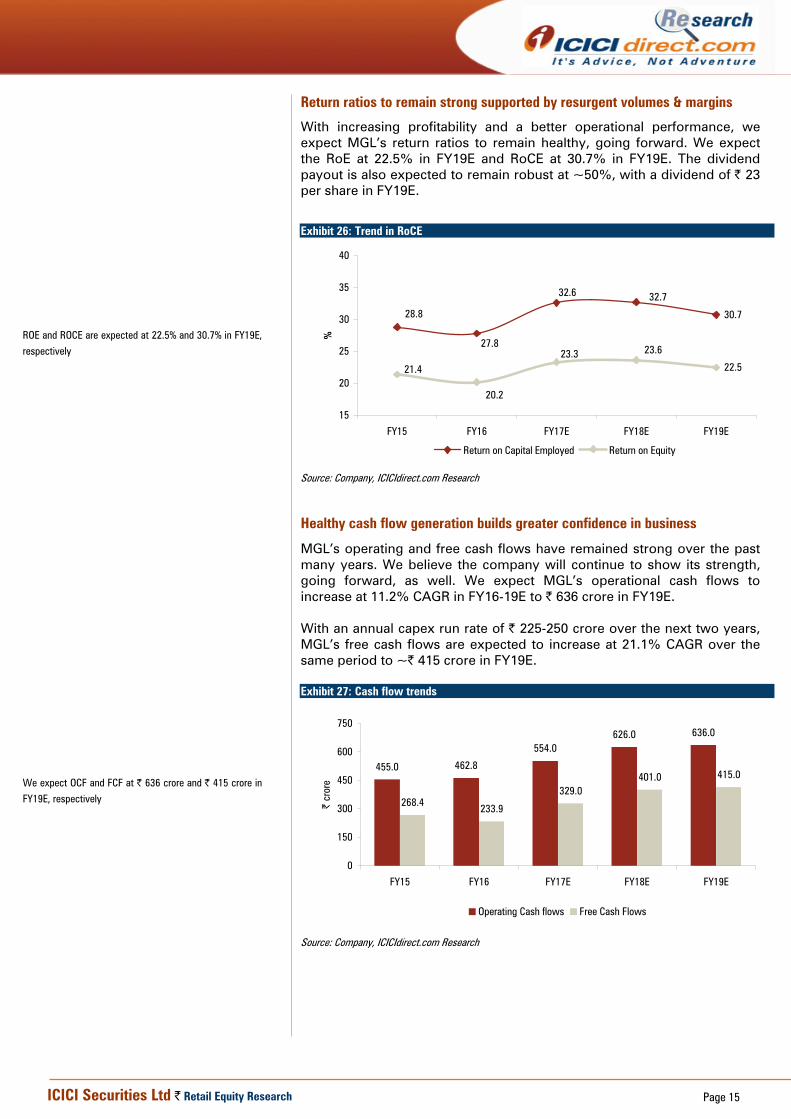
Return ratios to remain strong supported by resurgent volumes & margins
With increasing profitability and a better operational performance, we expect MGL’s return ratios to remain healthy, going forward. We expect the RoE at 22.5% in FY19E and RoCE at 30.7% in FY19E. The dividend payout is also expected to remain robust at ~50%, with a dividend of | 23 per share in FY19E.
Exhibit 26: Trend in RoCE
30.7
22.5
27.8
28.8
32.6 32.7
21.4
20.2
23.3 23.6
15
20
25
30
35
40
FY15 FY16 FY17E FY18E FY19E
%
Return on Capital Employed Return on Equity
Source: Company, ICICIdirect.com Research
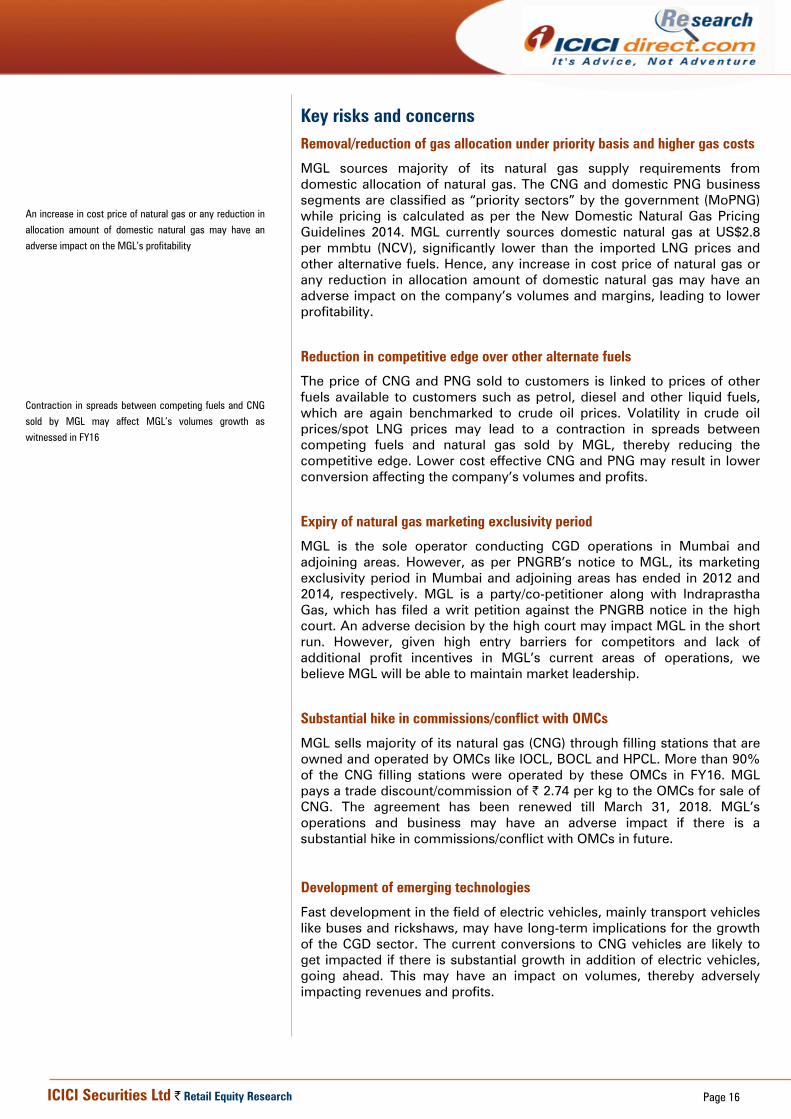
Healthy cash flow generation builds greater confidence in business
MGL’s operating and free cash flows have remained strong over the past many years. We believe the company will continue to show its strength, going forward, as well. We expect MGL’s operational cash flows to increase at 11.2% CAGR in FY16-19E to | 636 crore in FY19E. With an annual capex run rate of | 225-250 crore over the next two years, MGL’s free cash flows are expected to increase at 21.1% CAGR over the same period to ~| 415 crore in FY19E. Exhibit 27: Cash flow trends
455.0 462.8
554.0626.0 636.0
268.4 233.9
329.0401.0 415.0
0
150
300
450
600
750
FY15 FY16 FY17E FY18E FY19E
| cr
ore
Operating Cash flows Free Cash Flows
Source: Company, ICICIdirect.com Research
ROE and ROCE are expected at 22.5% and 30.7% in FY19E,
respectively
We expect OCF and FCF at | 636 crore and | 415 crore in
FY19E, respectively
Page 16 ICICI Securities Ltd | Retail Equity Research
Key risks and concerns Removal/reduction of gas allocation under priority basis and higher gas costs
MGL sources majority of its natural gas supply requirements from domestic allocation of natural gas. The CNG and domestic PNG business segments are classified as “priority sectors” by the government (MoPNG) while pricing is calculated as per the New Domestic Natural Gas Pricing Guidelines 2014. MGL currently sources domestic natural gas at US$2.8 per mmbtu (NCV), significantly lower than the imported LNG prices and other alternative fuels. Hence, any increase in cost price of natural gas or any reduction in allocation amount of domestic natural gas may have an adverse impact on the company’s volumes and margins, leading to lower profitability.
Reduction in competitive edge over other alternate fuels
The price of CNG and PNG sold to customers is linked to prices of other fuels available to customers such as petrol, diesel and other liquid fuels, which are again benchmarked to crude oil prices. Volatility in crude oil prices/spot LNG prices may lead to a contraction in spreads between competing fuels and natural gas sold by MGL, thereby reducing the competitive edge. Lower cost effective CNG and PNG may result in lower conversion affecting the company’s volumes and profits.
Expiry of natural gas marketing exclusivity period
MGL is the sole operator conducting CGD operations in Mumbai and adjoining areas. However, as per PNGRB’s notice to MGL, its marketing exclusivity period in Mumbai and adjoining areas has ended in 2012 and 2014, respectively. MGL is a party/co-petitioner along with Indraprastha Gas, which has filed a writ petition against the PNGRB notice in the high court. An adverse decision by the high court may impact MGL in the short run. However, given high entry barriers for competitors and lack of additional profit incentives in MGL’s current areas of operations, we believe MGL will be able to maintain market leadership.
Substantial hike in commissions/conflict with OMCs
MGL sells majority of its natural gas (CNG) through filling stations that are owned and operated by OMCs like IOCL, BOCL and HPCL. More than 90% of the CNG filling stations were operated by these OMCs in FY16. MGL pays a trade discount/commission of | 2.74 per kg to the OMCs for sale of CNG. The agreement has been renewed till March 31, 2018. MGL’s operations and business may have an adverse impact if there is a substantial hike in commissions/conflict with OMCs in future.
Development of emerging technologies
Fast development in the field of electric vehicles, mainly transport vehicles like buses and rickshaws, may have long-term implications for the growth of the CGD sector. The current conversions to CNG vehicles are likely to get impacted if there is substantial growth in addition of electric vehicles, going ahead. This may have an impact on volumes, thereby adversely impacting revenues and profits.
An increase in cost price of natural gas or any reduction in
allocation amount of domestic natural gas may have an
adverse impact on the MGL’s profitability
Contraction in spreads between competing fuels and CNG
sold by MGL may affect MGL’s volumes growth as
witnessed in FY16
Page 17 ICICI Securities Ltd | Retail Equity Research
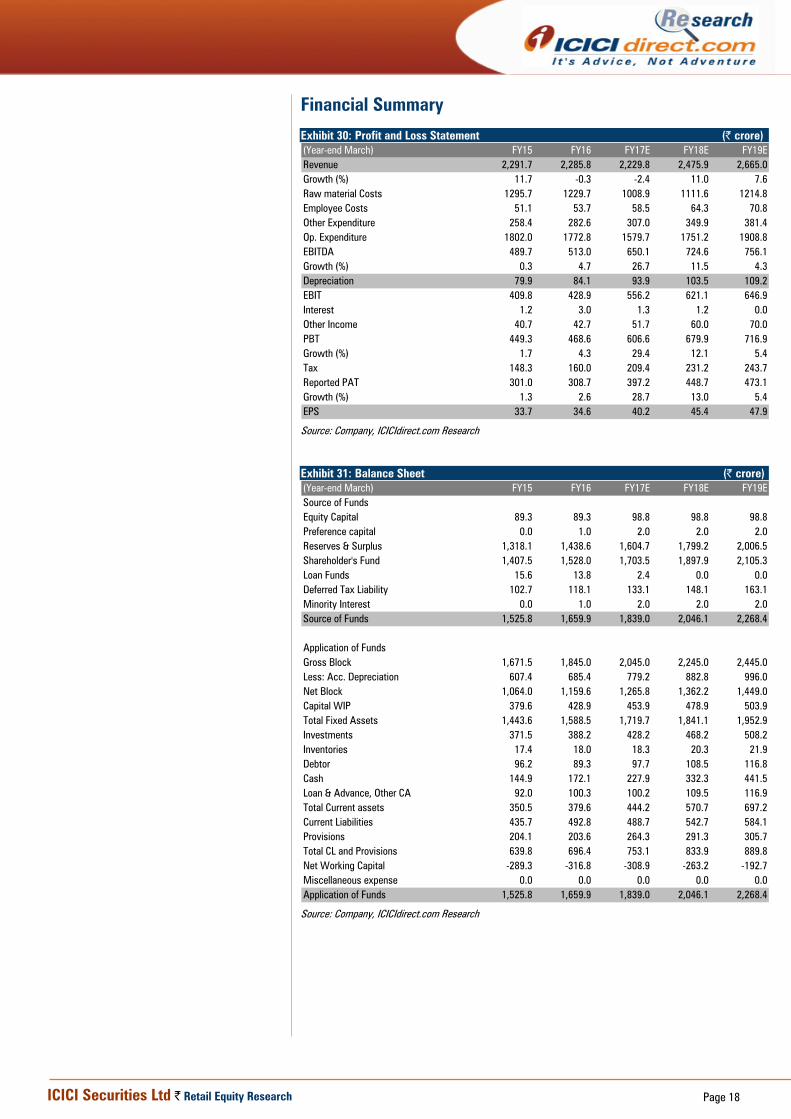
Valuation MGL presents an opportunity to have an exposure to the robust business model and growing CGD space. We believe the company’s strong CGD network offers good demand potential due to lower CNG and residential PNG penetration and increased usage of gas for commercial volumes. MGL’s strong promoters, Gail and BG group (now acquired by Shell) provide the company with a competitive edge in sourcing natural gas, and expansion into existing and new geographical areas. The ongoing and upcoming bidding for new CGD areas also presents MGL with a scope to expand its business further. Also, MGL’s strong financial position provides it with required flexibility to expand its network in its existing markets and enter new markets. We believe MGL’s sustainable volume growth and ability to maintain superior pricing power will create value for shareholders, going ahead. We value MGL at 22x FY19E EPS of | 47.9 to arrive at a target price of | 1055 with a BUY recommendation.
Exhibit 28: Global peer matrix Market Cap Revenues (| crore) PAT (| crore)
(| crore) FY16 FY16 FY17E FY18E FY17E FY18E FY17E FY18EChina Gas Holdings Ltd China 54,983 24,582.6 1,917.7 15.9 13.9 20.0 19.7 12.9 11.4Hong Kong & China Gas Co Ltd China 167,009 24,716.8 6,449.2 25.7 24.6 12.9 12.8 22.9 21.2Towngas China Co Ltd China 10,354 6,215.4 843.0 10.1 9.7 8.2 8.2 10.4 9.9Enagas SA Europe 40,750 8,834.5 3,102.7 12.8 13.2 17.3 16.1 10.2 10.4Gas Natural SDG SA Europe 139,229 172,728.1 10,017.0 14.4 13.4 8.9 9.2 7.6 7.3Snam SpA Europe 99,195 17,988.9 6,402.8 15.1 14.7 13.7 13.5 12.4 12.2Atmos Energy Corp US 55,862 22,378.7 2,338.8 22.5 21.2 10.3 10.2 11.4 10.5CMS Energy Corp US 84,148 42,993.0 3,702.0 20.8 19.4 13.9 13.6 10.2 9.6PG&E Corp US 227,796 118,692.5 9,453.2 18.4 17.6 10.1 10.0 8.3 7.8Sempra Energy US 186,505 68,416.5 9,211.3 21.9 19.6 9.4 10.8 11.9 10.9Gujarat Gas India 10,037 6,105.9 178.6 41.8 27.5 10.6 14.6 15.8 12.6Indraprastha Gas Ltd India 14,028 3,685.8 416.2 24.2 23.0 20.1 18.2 13.1 12.0Average 20.3 18.2 12.9 13.1 12.3 11.3Mahanagar Gas Ltd India 8,791 2,285.8 308.7 22.1 19.6 23.3 23.6 13.2 11.7
Company NameP/E(x) ROE(%) EV/EBITDA(X)
Region
Source: Bloomberg, ICICIdirect.com Research
We can see that MGL’s RoE of 23.6% in FY18E is superior to the global comparable companies, where average FY18E RoE is at 13.1%. Hence, we believe MGL deserves premium valuation multiples compared to peers. Hence, we have assigned P/E ratio of 22x for MGL on FY19E EPS of 47.9.
Exhibit 29: P/E multiple trend
400
600
800
1000
1200
Jul-1
6
Aug
-16
Sep-
16
Oct-1
6
Nov
-16
Dec-
16
Jan-
17
Feb-
17
Mar
-17
(|)
Price 22.5x 20.0x 17.5x 15.0x 12.5x 10.0x
Source: Company, ICICIdirect.com Research
Page 18 ICICI Securities Ltd | Retail Equity Research
Financial Summary Exhibit 30: Profit and Loss Statement (| crore)(Year-end March) FY15 FY16 FY17E FY18E FY19ERevenue 2,291.7 2,285.8 2,229.8 2,475.9 2,665.0Growth (%) 11.7 -0.3 -2.4 11.0 7.6Raw material Costs 1295.7 1229.7 1008.9 1111.6 1214.8Employee Costs 51.1 53.7 58.5 64.3 70.8Other Expenditure 258.4 282.6 307.0 349.9 381.4Op. Expenditure 1802.0 1772.8 1579.7 1751.2 1908.8EBITDA 489.7 513.0 650.1 724.6 756.1Growth (%) 0.3 4.7 26.7 11.5 4.3Depreciation 79.9 84.1 93.9 103.5 109.2EBIT 409.8 428.9 556.2 621.1 646.9Interest 1.2 3.0 1.3 1.2 0.0Other Income 40.7 42.7 51.7 60.0 70.0PBT 449.3 468.6 606.6 679.9 716.9Growth (%) 1.7 4.3 29.4 12.1 5.4Tax 148.3 160.0 209.4 231.2 243.7Reported PAT 301.0 308.7 397.2 448.7 473.1Growth (%) 1.3 2.6 28.7 13.0 5.4EPS 33.7 34.6 40.2 45.4 47.9
Source: Company, ICICIdirect.com Research
Exhibit 31: Balance Sheet (| crore)(Year-end March) FY15 FY16 FY17E FY18E FY19ESource of FundsEquity Capital 89.3 89.3 98.8 98.8 98.8Preference capital 0.0 1.0 2.0 2.0 2.0Reserves & Surplus 1,318.1 1,438.6 1,604.7 1,799.2 2,006.5Shareholder's Fund 1,407.5 1,528.0 1,703.5 1,897.9 2,105.3Loan Funds 15.6 13.8 2.4 0.0 0.0Deferred Tax Liability 102.7 118.1 133.1 148.1 163.1Minority Interest 0.0 1.0 2.0 2.0 2.0Source of Funds 1,525.8 1,659.9 1,839.0 2,046.1 2,268.4
Application of FundsGross Block 1,671.5 1,845.0 2,045.0 2,245.0 2,445.0Less: Acc. Depreciation 607.4 685.4 779.2 882.8 996.0Net Block 1,064.0 1,159.6 1,265.8 1,362.2 1,449.0Capital WIP 379.6 428.9 453.9 478.9 503.9Total Fixed Assets 1,443.6 1,588.5 1,719.7 1,841.1 1,952.9Investments 371.5 388.2 428.2 468.2 508.2Inventories 17.4 18.0 18.3 20.3 21.9Debtor 96.2 89.3 97.7 108.5 116.8Cash 144.9 172.1 227.9 332.3 441.5Loan & Advance, Other CA 92.0 100.3 100.2 109.5 116.9Total Current assets 350.5 379.6 444.2 570.7 697.2Current Liabilities 435.7 492.8 488.7 542.7 584.1Provisions 204.1 203.6 264.3 291.3 305.7Total CL and Provisions 639.8 696.4 753.1 833.9 889.8Net Working Capital -289.3 -316.8 -308.9 -263.2 -192.7Miscellaneous expense 0.0 0.0 0.0 0.0 0.0Application of Funds 1,525.8 1,659.9 1,839.0 2,046.1 2,268.4
Source: Company, ICICIdirect.com Research
Page 19 ICICI Securities Ltd | Retail Equity Research
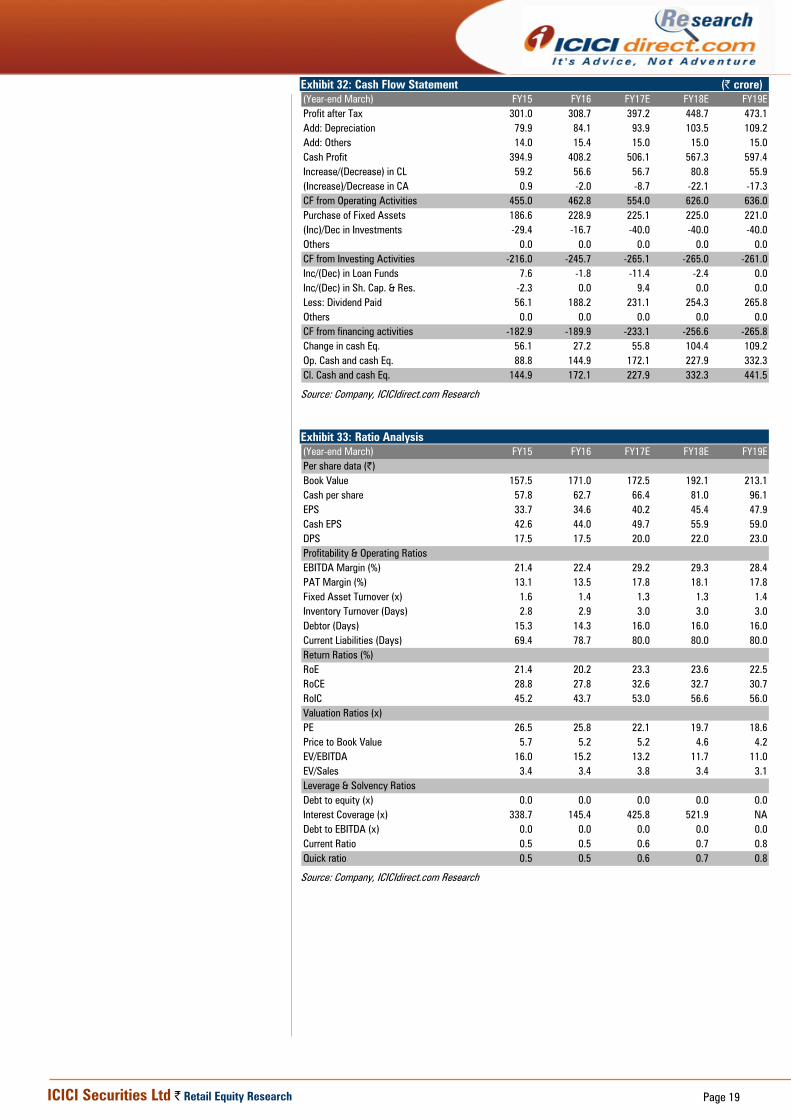
Exhibit 32: Cash Flow Statement (| crore)(Year-end March) FY15 FY16 FY17E FY18E FY19EProfit after Tax 301.0 308.7 397.2 448.7 473.1Add: Depreciation 79.9 84.1 93.9 103.5 109.2Add: Others 14.0 15.4 15.0 15.0 15.0Cash Profit 394.9 408.2 506.1 567.3 597.4Increase/(Decrease) in CL 59.2 56.6 56.7 80.8 55.9(Increase)/Decrease in CA 0.9 -2.0 -8.7 -22.1 -17.3CF from Operating Activities 455.0 462.8 554.0 626.0 636.0Purchase of Fixed Assets 186.6 228.9 225.1 225.0 221.0(Inc)/Dec in Investments -29.4 -16.7 -40.0 -40.0 -40.0Others 0.0 0.0 0.0 0.0 0.0CF from Investing Activities -216.0 -245.7 -265.1 -265.0 -261.0Inc/(Dec) in Loan Funds 7.6 -1.8 -11.4 -2.4 0.0Inc/(Dec) in Sh. Cap. & Res. -2.3 0.0 9.4 0.0 0.0Less: Dividend Paid 56.1 188.2 231.1 254.3 265.8Others 0.0 0.0 0.0 0.0 0.0CF from financing activities -182.9 -189.9 -233.1 -256.6 -265.8Change in cash Eq. 56.1 27.2 55.8 104.4 109.2Op. Cash and cash Eq. 88.8 144.9 172.1 227.9 332.3Cl. Cash and cash Eq. 144.9 172.1 227.9 332.3 441.5
Source: Company, ICICIdirect.com Research
Exhibit 33: Ratio Analysis (Year-end March) FY15 FY16 FY17E FY18E FY19EPer share data (|)Book Value 157.5 171.0 172.5 192.1 213.1Cash per share 57.8 62.7 66.4 81.0 96.1EPS 33.7 34.6 40.2 45.4 47.9Cash EPS 42.6 44.0 49.7 55.9 59.0DPS 17.5 17.5 20.0 22.0 23.0Profitability & Operating RatiosEBITDA Margin (%) 21.4 22.4 29.2 29.3 28.4PAT Margin (%) 13.1 13.5 17.8 18.1 17.8Fixed Asset Turnover (x) 1.6 1.4 1.3 1.3 1.4Inventory Turnover (Days) 2.8 2.9 3.0 3.0 3.0Debtor (Days) 15.3 14.3 16.0 16.0 16.0Current Liabilities (Days) 69.4 78.7 80.0 80.0 80.0Return Ratios (%)RoE 21.4 20.2 23.3 23.6 22.5RoCE 28.8 27.8 32.6 32.7 30.7RoIC 45.2 43.7 53.0 56.6 56.0Valuation Ratios (x)PE 26.5 25.8 22.1 19.7 18.6Price to Book Value 5.7 5.2 5.2 4.6 4.2EV/EBITDA 16.0 15.2 13.2 11.7 11.0EV/Sales 3.4 3.4 3.8 3.4 3.1Leverage & Solvency RatiosDebt to equity (x) 0.0 0.0 0.0 0.0 0.0Interest Coverage (x) 338.7 145.4 425.8 521.9 NADebt to EBITDA (x) 0.0 0.0 0.0 0.0 0.0Current Ratio 0.5 0.5 0.6 0.7 0.8Quick ratio 0.5 0.5 0.6 0.7 0.8
Source: Company, ICICIdirect.com Research
Page 20 ICICI Securities Ltd | Retail Equity Research
RATING RATIONALE ICICIdirect.com endeavours to provide objective opinions and recommendations. ICICIdirect.com assigns ratings to its stocks according to their notional target price vs. current market price and then categorises them as Strong Buy, Buy, Hold and Sell. The performance horizon is two years unless specified and the notional target price is defined as the analysts' valuation for a stock. Strong Buy: >15%/20% for large caps/midcaps, respectively, with high conviction; Buy: >10%/15% for large caps/midcaps, respectively; Hold: Up to +/-10%; Sell: -10% or more;
Pankaj Pandey Head – Research [email protected]
ICICIdirect.com Research Desk, ICICI Securities Limited, 1st Floor, Akruti Trade Centre, Road No 7, MIDC, Andheri (East) Mumbai – 400 093
Page 21 ICICI Securities Ltd | Retail Equity Research
Disclaimer
ANALYST CERTIFICATION We /I, Mayur Matani, MBA, Harshal Mehta, MTech and Akshay Gavankar, (PGDM) Research Analysts, authors and the names subscribed to this report, hereby certify that all of the views expressed in this research report accurately reflect our views about the subject issuer(s) or securities. We also certify that no part of our compensation was, is, or will be directly or indirectly related to the specific recommendation(s) or view(s) in this report.
Terms & conditions and other disclosures: ICICI Securities Limited (ICICI Securities) is a full-service, integrated investment banking and is, inter alia, engaged in the business of stock brokering and distribution of financial products. ICICI Securities Limited is a Sebi registered Research Analyst with Sebi Registration Number – INH000000990. ICICI Securities is a wholly-owned subsidiary of ICICI Bank which is India’s largest private sector bank and has its various subsidiaries engaged in businesses of housing finance, asset management, life insurance, general insurance, venture capital fund management, etc. (“associates”), the details in respect of which are available on www.icicibank.com. ICICI Securities is one of the leading merchant bankers/ underwriters of securities and participate in virtually all securities trading markets in India. We and our associates might have investment banking and other business relationship with a significant percentage of companies covered by our Investment Research Department. ICICI Securities generally prohibits its analysts, persons reporting to analysts and their relatives from maintaining a financial interest in the securities or derivatives of any companies that the analysts cover. The information and opinions in this report have been prepared by ICICI Securities and are subject to change without any notice. The report and information contained herein is strictly confidential and meant solely for the selected recipient and may not be altered in any way, transmitted to, copied or distributed, in part or in whole, to any other person or to the media or reproduced in any form, without prior written consent of ICICI Securities. While we would endeavour to update the information herein on a reasonable basis, ICICI Securities is under no obligation to update or keep the information current. Also, there may be regulatory, compliance or other reasons that may prevent ICICI Securities from doing so. Non-rated securities indicate that rating on a particular security has been suspended temporarily and such suspension is in compliance with applicable regulations and/or ICICI Securities policies, in circumstances where ICICI Securities might be acting in an advisory capacity to this company, or in certain other circumstances. This report is based on information obtained from public sources and sources believed to be reliable, but no independent verification has been made nor is its accuracy or completeness guaranteed. This report and information herein is solely for informational purpose and shall not be used or considered as an offer document or solicitation of offer to buy or sell or subscribe for securities or other financial instruments. Though disseminated to all the customers simultaneously, not all customers may receive this report at the same time. ICICI Securities will not treat recipients as customers by virtue of their receiving this report. Nothing in this report constitutes investment, legal, accounting and tax advice or a representation that any investment or strategy is suitable or appropriate to your specific circumstances. The securities discussed and opinions expressed in this report may not be suitable for all investors, who must make their own investment decisions, based on their own investment objectives, financial positions and needs of specific recipient. This may not be taken in substitution for the exercise of independent judgment by any recipient. The recipient should independently evaluate the investment risks. The value and return on investment may vary because of changes in interest rates, foreign exchange rates or any other reason. ICICI Securities accepts no liabilities whatsoever for any loss or damage of any kind arising out of the use of this report. Past performance is not necessarily a guide to future performance. Investors are advised to see Risk Disclosure Document to understand the risks associated before investing in the securities markets. Actual results may differ materially from those set forth in projections. Forward-looking statements are not predictions and may be subject to change without notice. ICICI Securities or its associates might have managed or co-managed public offering of securities for the subject company or might have been mandated by the subject company for any other assignment in the past twelve months. ICICI Securities or its associates might have received any compensation from the companies mentioned in the report during the period preceding twelve months from the date of this report for services in respect of managing or co-managing public offerings, corporate finance, investment banking or merchant banking, brokerage services or other advisory service in a merger or specific transaction. ICICI Securities or its associates might have received any compensation for products or services other than investment banking or merchant banking or brokerage services from the companies mentioned in the report in the past twelve months. ICICI Securities encourages independence in research report preparation and strives to minimize conflict in preparation of research report. ICICI Securities or its associates or its analysts did not receive any compensation or other benefits from the companies mentioned in the report or third party in connection with preparation of the research report. Accordingly, neither ICICI Securities nor Research Analysts and their relatives have any material conflict of interest at the time of publication of this report. It is confirmed that Mayur Matani, MBA, Harshal Mehta, MTech and Akshay Gavankar, PGDM Research Analysts of this report have not received any compensation from the companies mentioned in the report in the preceding twelve months. Compensation of our Research Analysts is not based on any specific merchant banking, investment banking or brokerage service transactions. ICICI Securities or its subsidiaries collectively or Research Analysts or their relatives do not own 1% or more of the equity securities of the Company mentioned in the report as of the last day of the month preceding the publication of the research report. , Since associates of ICICI Securities are engaged in various financial service businesses, they might have financial interests or beneficial ownership in various companies including the subject company/companies mentioned in this report. It is confirmed that Mayur Matani, MBA, Harshal Mehta, MTech, and Akshay Gavankar, PGDM. Research Analysts do not serve as an officer, director or employee of the companies mentioned in the report. ICICI Securities may have issued other reports that are inconsistent with and reach different conclusion from the information presented in this report. Neither the Research Analysts nor ICICI Securities have been engaged in market making activity for the companies mentioned in the report. We submit that no material disciplinary action has been taken on ICICI Securities by any Regulatory Authority impacting Equity Research Analysis activities. This report is not directed or intended for distribution to, or use by, any person or entity who is a citizen or resident of or located in any locality, state, country or other jurisdiction, where such distribution, publication, availability or use would be contrary to law, regulation or which would subject ICICI Securities and affiliates to any registration or licensing requirement within such jurisdiction. The securities described herein may or may not be eligible for sale in all jurisdictions or to certain category of investors. Persons in whose possession this document may come are required to inform themselves of and to observe such restriction. report and information herein is solely for informational purpose and shall not be used or considered as an offer document or solicitation of offer to buy or sell or subscribe for securities or other financial instruments. Though disseminated to all the customers simultaneously, not all customers may receive this report at the same time. ICICI Securities will not treat recipients as customers by virtue of their receiving this report. Nothing in this report constitutes investment, legal, accounting and tax advice or a representation that any investment or strategy is suitable or appropriate to your specific circumstances. The securities discussed and opinions expressed in this report may not be suitable for all investors, who must make their own investment decisions, based on their own investment objectives, financial positions and needs of specific recipient. This may not be taken in substitution for the exercise of independent judgment by any recipient. The recipient should independently evaluate the investment risks. The value and return on investment may vary because of changes in interest rates, foreign exchange rates or any other reason. ICICI Securities accepts no liabilities whatsoever for any loss or damage of any kind arising out of the use of this report. Past performance is not necessarily a guide to future performance. Investors are advised to see Risk Disclosure Document to understand the risks associated before investing in the securities markets. Actual results may differ materially from those set forth in projections. Forward-looking statements are not predictions and may be subject to change without notice. ICICI Securities or its associates might have managed or co-managed public offering of securities for the subject company or might have been mandated by the subject company for any other assignment in the past twelve months. ICICI Securities or its associates might have received any compensation from the companies mentioned in the report during the period preceding twelve months from the date of this report for services in respect of managing or co-managing public offerings, corporate finance, investment banking or merchant banking, brokerage services or other advisory service in a merger or specific transaction. ICICI Securities or its associates might have received any compensation for products or services other than investment banking or merchant banking or brokerage services from the companies mentioned in the report in the past twelve months. ICICI Securities encourages independence in research report preparation and strives to minimize conflict in preparation of research report. ICICI Securities or its analysts did not receive any compensation or other benefits from the companies mentioned in the report or third party in connection with preparation of the research report. Accordingly, neither ICICI Securities nor Research Analysts have any material conflict of interest at the time of publication of this report. It is confirmed that Mayur Matani, MBA, Harshal Mehta, M.Tech, and Akshay Gavankar, PGDM, Research Analysts of this report have not received any compensation from the companies mentioned in the report in the preceding twelve months. Compensation of our Research Analysts is not based on any specific merchant banking, investment banking or brokerage service transactions.