Embed Size (px)
Citation preview

1
Main Heading in 32pt Arial White
Sub-heading in 24pt Arial White
TPDDL’s Journey
KBF Meeting 5th July, 2013
TPDDL’s Excellence Journey

2
Power Scenario in Delhi (Prior to Reforms in 2002)
Financially unhealthy
utilities
Vicious Circle of Un-sustainability
• AT&C/Theft losses range between 53% to 60% of Input • Govt. Subsidies approx. Rs 1,500 cr per annum to bridge
Revenue Gap • Condition of Network pathetic • Billing Receivables close to 1 year outstanding • Poor Condition of Consumer Records • Consumer nowhere in focus/Regular black-outs and brown-
outs of 4-6 hours
Nee
d f
or
Ref
orm
s
•Investment needed to improve Network •Subsidies - not a long term solution; Sector to be made Self Sufficient •AT&C loss reduction and sector efficiency improvements required •Enhance consumer satisfaction •Introduce Best Practices, enhancing employee skill sets and morale

3
About TPDDL Parameter FY ‘13
Turnover INR 5644 Cr
Peak Load 1573 MW
Annual energy requirement 7762 MUs
Total registered consumers 13.35 Lacs
Number of employees 3612
Area 510 Sq Kms
Population serviced in Network area (approx)
6 Million
Number of consumers per Sq.Km
2618
Joint Venture of Tata Power Company and Govt. of NCT of
Delhi (51: 49)
Licensed for distribution of power in North and North West Delhi
Certifications : ISO 9001, 14001, 27001 ; SA 8000 ; OHSAS 18001 UN Global Compact Reporting
About TPDDL

4
Comparison of Distribution Utilities Parameters TPDDL BRPL BYPL
Shareholding (Delhi Govt. – 49)
Tata Power – 51% Reliance Energy – 51%
Management Control Tata Power Reliance Energy
Distribution License Area
North & North-West South & South-West East & Central
Area (sq km) 510 750 200
Opening (July ‘02)
Current (FY13)
Opening (July ‘02)
Current (FY13)
Opening (July ‘02)
Current (FY13)
No. of Customers (Lacs) 7.4 13.35 8.5 18.5 8.6 13.5
AT&C Loss % 53.1 10.8 48.1 17.26 57.2 19.74
% Reduction in 10 years 79.7 64.12 65.5
Input (MUs) 3928 7764 5568 11457 3625 6520
Capex (Rs Crs) 1210 4531 1533 4595 360 2387
Turnover (Rs Crs) 867.24 (FY03) 5346(FY12) 5644 (FY13)
1104 (FY03) 7004 (FY12) 483.49(FY03) 4208.75 (FY12)

5
TPDDL Turnaround Snapshot Parameter Unit Jul-02 Mar-13 % change
Operational Performance AT&C Losses % 53.1 10.78 80%
System Reliability – ASAI -Availability Index % 70 99.94 43%
Transformer Failure Rate % 11 0.79 93%
Peak Load MW 930 1573 69%
Length of Network Ckt. Km 6750 10438 54%
Street Light Functionality % 40 99.60 149%
Consumer Related Performance New Connection Energization Time Days 51.8 6 88%
Meter Replacement Time Days 25 3 88%
Provisional Billing % 15 3 80%
Defective Bills % 6 0.2 97%
Bill Complaint Resolution Days 45 6 87%
Mean Time to Repair Faults Hours 11 1.2 89%
Call Center Performance - Service Level % - 91 -
Payment Collection Avenues Nos. 20 5377 26785%
Consumer Satisfaction Index % - 88 -
Financial Performance Capex Incurred (Cumulative)
Distribution Rs. Cr. 1210 4189 274%
Generation (Rithala + Solar) Rs. Cr. - 342 -
Revenue (* Annualized for FY ‘03) Rs. Cr. 1156.32 * 5656 388%
Others Consumers Lacs 7 13.3 90%
Employees Nos. 5,600 3612 35%

6
Performance Snapshot - Operational
47.79% 44.86%
33.79%
26.52% 23.73%
18.56% 16.74% 15.16% 13.10% 11.00% 10.78%
47.60% 45.35%
40.85%
35.35% 31.10%
22% 20.35% 18.68% 17% 13% 12.50%
0.00%
10.00%
20.00%
30.00%
40.00%
50.00%
60.00%
2002-03 2003-04 2004-05 2005-06 2006-07 2007-08 2008-09 2009-10 2010-11 2011-12 2012-13
Actual Loss Level Target Loss Level
Average System Reliability Index
AT&C Loss Trajectory
DT Failure Vs. Installed Capacity %

7
Performance Snapshot - Operational
Street Light Performance-%
Length of Network
Peak Demand Met

8
Performance Snapshot - Customer
Provisional Billing
Meter Replacement Time - Days New Connection Energization Cycle Time Reduction
Defective Billing

9
Performance Snapshot - Customer
Customer Satisfaction Index-%
Call Centre Performance and Service Level Mean Time To Repair Faults - Hrs
Payment Collection Avenues – Nos.

10
Performance Snapshot – Financial Performance
Revenue – Rs. Crs.
CAPEX – Rs. Crs

11
Turnaround Snapshot

12
Our Sustainability Philosophy
Passion for excellence
Consumer Service Excellence
Operational Excellence
AT&C Loss Reduction
Care for Community
Care for Environment
Areas of Focus
Becoming Carbon Neutral
Drivers
Skilled & Motivated Workforce
Innovative Technology Adaptation
Success Parameters
Improving CSI Score
Reliability Indices
ATC Levels
TCCI Score AA Score
Safety
Consumer Centric Inclusive Approach
Shareholder Value
Care for Environment
Care for Community
Customer Excellence

13 13
EXCELLENCE JOURNEY :
AT&C Loss Reduction

14
AT&C Loss Reduction Trend
Consistently Exceeding Targets
47.79%
44.86%
33.79%
26.52% 23.73%
18.56%
16.74% 15.16% 13.10%
11.00% 10.78%
47.60% 45.35%
40.85%
35.35%
31.10%
22% 20.35%
18.68% 17%
13% 12.50%
0.00%
10.00%
20.00%
30.00%
40.00%
50.00%
60.00%
2002-03 2003-04 2004-05 2005-06 2006-07 2007-08 2008-09 2009-10 2010-11 2011-12 2012-13
Actual Loss Level Target Loss Level

15
Initiatives: AT&C Loss Reduction
Unique Efforts appreciated
nationally and internationally
Prioritizing Focus
Front runner in Technology Implementation to improve efficiency and consumer service delivery

16
Initiatives: AT&C Loss Reduction
Technological Interventions
• Energy Audit up to the DT level – prioritizing focus
• HVDS & LT ABC Implementation – Technology interventions for theft prevention
• Replacement of Electromechanical meters with Electronic meters
• AMR for all High Revenue consumers – 60% of Total Revenue
• Aggressive Enforcement activities with scientific inputs & analysis

17
Initiatives: AT&C Loss Reduction Social Interventions
• Collaboration with NGOs – awareness creation across LA especially slums
• Settlements of Enforcement cases through PHFs , Special Lok Adalats , Electricity Courts etc.
• Public participation in controlling Theft through Community pressure
• Separate Segment for consumers at Bottom of Pyramid –Sp. Consumer Group
– Employment Oriented Vocational Trainings - “ Creating Capacity in consumers to pay before asking them to pay”

18 18
EXCELLENCE JOURNEY :
Enhancing Power Supply Reliability

19
Improvement in Reliability
System Average Interruption Duration Index (SAIDI): The average outage duration for each customer served
2002 2011-12 2012-13
SAIDI -11 kv (hrs) 110 4.38 3.07
SAIDI Overall (hrs) Not Recorded 52.06 63.62
Interruptions Due to External Factor (e.g. DTL , NRLDC , GENCO shutdown etc.)-Not attributable to TPDDL (hrs.)
Not Recorded 21.39 36.22
Interruptions Due to Internal Factor-attributable to TPDDL (hrs.)
Not Recorded 30.67 27.40
PEPCO 2.35 hrs
Delmarva 2.71 hrs
Long Island Power
Authority 0.68 hrs

20
Outage Management System
GIS – Mapping all electrical assets and consumers
Initiatives: Reliability Improvement
Many Industry Firsts!

21
• Power Purchase Agreements
– Executed long term PPAs for 1050 MW over 914 MW allocated ; sufficient to meet requirements till FY 18
• Future Plans
– No captive power plants to be added - due to adequate availability
– Bids invited for Long Term procurement of 750 Mus of renewable power (solar & non-solar) from FY ‘16.
Initiatives – Reliability Improvement
Wind Solar Biomass Small Hydro
22 22
EXCELLENCE JOURNEY :
Technological Firsts

23
Adoption of Technology - Many firsts
SCADA
Cap on Tap
Monitoring of total load through SCADA
100% Automatic Voltage Regulation

24
Adoption of Technology - Many firsts
Geographical Information System Integration of GIS with Operational and Commercial Sys.
Integrated Outage Management System Integrated Call Center with
BCM Smart Grid Pilot
Architecture

25
Initiatives: Outage Management System
TPDDL is the only utility in India to implement the INTEGRATED OUTAGE MANAGEMENT SYSTEM (OMS)
• Geo referenced network details along with trouble order to the field crew
• Prediction of the outage device thus curtaining diagnostic time
• Management of crews assisting in restoration
• Updation of CRM with status of on going and planned outages for intimation to customers
• Actionable intelligent reports.
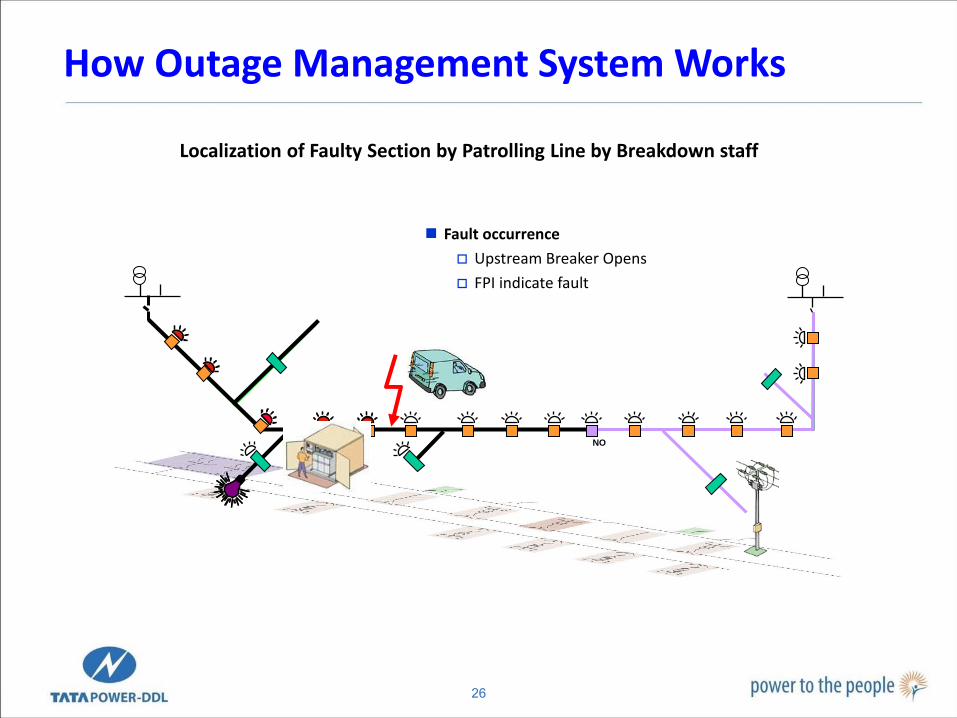
26
NO
Fault occurrence
Upstream Breaker Opens
FPI indicate fault
Localization of Faulty Section by Patrolling Line by Breakdown staff
How Outage Management System Works

27
NO
Manual Isolation of Faulty Section
• Manual isolation of the faulty section
Close NO point
How Outage Management System Works

28
Impact : OMS Deployment Comparison of Pole Complaints on Top 20 Distribution Transformers Comparison of Total Complaints on Top 20 Distribution Transformers
Mean Time To Repair – Street Lighting Complaints in Days
35 % Reduction 83 % Reduction
29
• Distribution Automation. 20% yielding 80% restoration remotely
• DMS- OMS - GIS Integration and Implementation
• SAP-FAR –GIS Integration
• Nitrogen Injection Drain and Stir System (worldwide known as NIDS) for Power
Transformers
• Centralized smoke and fire detection system
• Automatic Reactive Power Compensation in Grid stations
• Unmanned grid stations through SCADA-EMS
• GPRS based spot billing
• Automated Meter Reading (AMR) for high end consumers (HRB)
• Secondary Data Centre (SDC) for Systems back-up
• SAP-ISU roll out for billing and CRM
• Implementation of Business Communication Management (BCM)
• Pilot Project on Smart Grid / AMI
Initiatives – Major Technological Achievements

30 30
EXCELLENCE JOURNEY :
Enhance Consumer Satisfaction

31 31
CONSUMER SERVICE INITIATIVES

32
Consumer Service Excellence
Before After
Long Queue for payment & services
• 14 Fully networked consumer care
centers • Integrated Call Center for No Supply
and Commercial Complaints • Billing database of 100% of
consumers on website • Spot Billing • Automatic Cash/ Cheque Collection
Machines
• Video Conferencing for Consumers
• SMS based pull services
• Instant/ Speedy New Connections

33
• Meetings with RWAs/IWAs on a monthly basis in all Districts
• Segmented meets
• Relationship Approaches
o Client & Account Managers : Xpress, KCG, HRB, G&I o Consumer Relationship Officers (CROs): HCB o Special Consumer Group: JJ Clusters
• BPR of Revenue Management Cycle
• Automated Workflow (SAP ISU)
• Instant/ Speedy New Connections
• Performance Assurance Standards
Initiatives - Revamping Consumer Experience

34
Value Added Services
• Lucky draw for consumers using E-Payment options
• Energy Audit of Key Consumers • Safety Audits at Customer Premises
• Discount coupons to paying consumers
• Pay & Win Schemes for SCG consumers
Integrated Call Center launched through BCM
• Common IVR for No Supply & Commercial.
• Reduction in response time through pre-fed information. • Auto response for outage information & registration of
No Supply complaint using BCM-CRM-OMS integration. • Capturing caller’s experience with call through IVR. • Voice mail recording for theft/harassment/project
execution related complaint.
Initiatives - Revamping Consumer Experience

35
Impact – Improvement in Consumer Services & Satisfaction
Improvement in CSI
79 81 88 85 88 93 95 71 75 82 0
20
40
60
80
100
FY09 FY10 FY11 FY12 (Int) FY13 FY14(T) FY22(T)
Ind
ex
TPDDL (Top 3) TPDDL (Top 2) BRPL (Top 3) BYPL (Top 3)
BEST - 93

36
Tariff – Comparative Scenario
Despite Improvement in Supply & Consumer Services, Lowest Average Tariff Among All Metros & Neighboring States
States/ Discoms Domestic - 5 KW Commercial -
LT - 10 KW
Industrial -
LT - 10 KW
Industrial HT -
100 KW/108
KVA - Supply at
11 kV
Last Tariff Order
Date/Effective From
Units-> 200 400 1500 1500 15000
Delhi 290 415 857 813 750 1st Aug 2013
Mumbai – BEST 420 496 940 865 893 1st Jun 2012
Haryana - Gurgaon 564 610 700 685 714 1st March 2013
Gujrat 369 412 445 445 530 1st March 2013
Karnataka 470 515 743 513 640 30th Apr 2012
Punjab 594 591 635 658 553 1st Apr 2013
Uttar Pradesh 508 444 728 735 770 19th Oct 2012
Rajasthan 516 517 666 518 651 9th Aug 2012
Madhya Pradesh 534 581 657 480 672 1st Apr 2012
Kolkata 586 652 780 621 796 1st Dec 2012

37 37
FUTURE IMPROVEMENT PLAN

38
Future Projections
Parameter UOM Actual (10-11)
Actual (11-12)
Actual (12-13)
Target (13-14)
Target (17-18)
Target (21-22)
Benchmark
AT&C Losses % 13.2 11.22 10.78 10.4 9 7 Torrent 9.23%
CSI Overall Index 88 85
(internal)
Top 2:71 Top 3: 87
Top2 : 75 Top 3:93
Top2 : 78 Top 3:94
Top2 : 82
Top 3:95
BEST 93%
Total Commercial Complaints/ '000 consumers
Nos. 2.9 2.32 1.5 1
Total Operational Complaints/ '000 consumers
Nos. 20.62 18.0 8.0 5
SAIDI - Overall hrs 65.98 54.89 50.00 21.00 17
CPFL Paulista – Brazil
7.48
SAIFI - Overall nos. 66.93 63.63 56.00 25.00 20
CPFL Paulista – Brazil
5.37

39
Initiatives to attain future targets
39
AT&C Reduction
SMART Metering
Real Time Energy Audit Advanced Business Analytics
Enforcement Annual CAPEX of Rs. 45 crs for next 5
years
Customer Satisfaction
Instant Resolutions
ToD Smart Metering
Enhanced customer care centres and payment avenues
Ease in providing new connections
Reliability Improvement
Solar Grid Connectivity
OMS Sufficient power tie-ups upto FY18
n-1 Annual CAPEX of Rs.85 crs for next 5
years

40
Technological Interventions – Smart Grid Road
Map 4Q 2013 2Q 2009 2Q 2011 1Q 2007
•Grid Substation Automation System (GSAS) •Communication Infrastructure •Supervisory Control and Data Acquisition (SCADA) •Geographical Information System (GIS) •Automated Meter Reading (AMR) •ERP based maintenance management •SAMBANDH – CRM •Payment gateway
•Distribution Management System (DMS) •Distribution Automation (DA) •Outage Management System (OMS) •Secondary Data Centre (SDC) •CRM & Billing Systems (SAP-ISU) •Asset Equalization •Reactive Power Management •SURAKSHA / Ethics / Security / MIS Portals •DEBS Up-gradation •SAP Up-gradation (technical) •SAP – GRC (Governance Risk & Compliance) Access Control •SRM - Live Auction Cockpit
•Demand Side Management •Distributed Generation (DG) •Enterprise Application Integration (EAI) •Data Historian •Business Analytics (BA) – phase 1 •Mobile Workforce Management (MWM) •Smart Grid pilot roll out – Phase 1 •RCM based maintenance management •Green Grid pilot •DR Site •Security Management System •Integrated Power Procurement Solution •GIS Up-gradation •Transmission Integration •Integration of non SAP (Business) Applications •Comprehensive Intrusion Detection & Protection System
•Advanced Metering Infrastructure (AMI) •Smart Grid roll out – Phase 2 •Green Grid implementation •Business Warehouse •Business Analytics (BA) – phase 2 •Distributed Energy resources (DER) Integration •Incident / Accident free environment through advanced surveillance system
Phase 1 Phase 2 Future
Phase Phase 3
2016 & beyond
SGMM - Level 1 Score # 1.69
SGMM - Level 2 Score # 2.5
SGMM - Level 3 Score # 3.6
SGMM - Level 4 Score # 4.5
40

41
Technological Interventions – Smart Grid Road
Map
41
TPDDL is developing 10 years Smart Grid Road Map. Five Business Cases identified are -
– Advanced Metering Infrastructure (AMI)
- Enterprise Service Bus
- Business Intelligence
- Integrated Communication Network
- Field Force Automation

42
• First Utility initiated Advanced Metering Infrastructure based ADR program in the country
• Project approved by DERC
• Project Objectives:
– To manage peak demand
– To manage Grid Stress situations
• Project Components include :
– Automated Demand Response infrastructure
– Smart Meters
– RF Mesh based Communication
– MDMS and its integration with other OT & IT systems like OMS, SAP, ADR.
• Collaborative partnership with selected vendors
• Project being undertaken to demonstrate:
– technological capability
– understand customer behavior
– Case study for regulator to work on differential tariffs and financial incentives.
– Processes required for scaling up
AMI based Auto Demand Response project

43
Great Places To Work For
India
Utilities
Vision 2022
Profit Planet People
Top 10
Complaints, Accidents
Smarter DISCOM
Energy & Water Neutral
Single Digit AT&C Loss (7%)
Domestic & International
Presence

44 44
Way Forward

45
Thank You
45