Embed Size (px)
Citation preview

EGISLATIVE
Safer Needle & SharpsDevice Usage Survey
January 2001
L REPORT
Maine Department of Labor

Acknowledgements
This report was prepared with the assistance of the following: Kathleen Stuchner – Maine Hospital Association Mary Anne Turowski – Service Employees International Union Patricia Philbrook – Maine State Nurses Association Jonathan Torres, M.D. – Work Med Occupational Health Services

Contents
Section 1: Authorization for the Survey ................................................................................. 1Section 2: Research Methodology ......................................................................................... 1Section 3: Results ................................................................................................................... 2Section 4: Reporting and Prevalence of Needlestick/Sharps Injuries 1995-1999.................. 8Appendix A: Safer Needle & Sharps Device Usage Survey ................................................. 12
Tables1. Response rate by provider category ................................................................................ 22. Use of safer needle and sharps devices by the seven major provider categories ............ 33. Use of different injection devices by provider category.................................................. 44. Use of IV medication delivery systems by provider category ......................................... 55. Use of IV insertion equipment by provider category ...................................................... 66. Use of lancets by provider category ................................................................................ 67. Use of surgical devices by provider category .................................................................. 68. Use of blood collection devices by provider category .................................................... 79. Use of limited blood bank devices by provider category ................................................ 8
10. Prevalence of needlestick/sharps injuries by provider category: 1995-1999 .................. 911. Reasons for not having a needleless system by provider category.................................. 11
Figures1. Use of safer needle and sharps devices by providers (n=570) ........................................ 22. Specific types of injection equipment used by providers ................................................ 33. IV medication delivery equipment .................................................................................. 44. Use of IV insertion equipment ........................................................................................ 55. Use of blood collection devices ...................................................................................... 76. Prevalence of needlestick/sharps injuries 1995-1999 ..................................................... 87. Support for a mandatory reporting of needlestick/sharps injuries .................................. 98. Support for a voluntary reporting program for needlestick/sharp injuries ...................... 109. Reasons for not having a needleless system ................................................................... 10
10. Frequency of review and evaluation of current needleless system ................................. 11

1
A Survey of Health Care Providers to Collect Information About the Use of Needleless Systems and Other Safe Needle Devices
Section 1: Authorization for the Survey The survey was authorized by the Maine Legislature during the 119th Legislative Session. Under Resolve 1151 the Department of Labor and the Department of Human Services shall conduct a survey of public and private health care providers and field providers, including, but not limited to, emergency medical technicians, to collect information about:
1. The use of needleless systems and other safe needle devices by employees; and
2. The process used or to be used by the providers to comply with federal regulations or state rules regarding engineering controls to protect employees against exposure to bloodborne pathogens.
Section 2: Research Methodology A: Survey Design A cross-sectional design was selected because it is the most appropriate method for gathering descriptive data such as utilization data of needleless systems and other safe needle devices. In addition, a cross-sectional survey will enable the researchers to assess the prevalence of needlesticks and sharps injuries. B: Survey Instrument The Bureau of Labor Standards (BLS) designed a survey using resources from the International Health Care Worker Safety Center at the University of Virginia2 and from the Service Employees International Union3. A panel of experts reviewed the survey for content validity. (See Appendix A.) C: Sampling Frame The sampling frame included all licensed providers working in the state who may need to use needles and other sharp instruments in the course of their work. Mailing lists were obtained from the Department of Human Services, Division of Licensing and Certification, Maine Emergency Medical Services and the Board of Dental Examiners. D: Survey Implementation Surveys were mailed to providers with an enclosed cover letter and a pre-paid postage return envelope. Follow-up phone calls were made to non-respondents to increase the response rate of the survey.
1119th Maine Legislative Session, H.P. 1532 L.D. 2185 – http://janus.state.me.us/legis/ros/lom/LOM119th/Res90-137/RES90-137-25.htm 2 http://www.med.virginia.edu/medcntr/centers/epinet/home.html 3 Safer Needle and Sharps Device Usage Survey, SEIU Washington, D.C.

2
Section 3: Results A: Response Rate The sampling frame consisted of 1,208 health care providers and field providers including emergency medical technicians. An overall response rate of 69.5% (840) was attained. Of these 840 providers, 67.9% (570) reported using some form of safer needle or sharps device. Table 1 describes the response rate by provider category, while Figure 1 shows the distribution of the type of device used by the providers. Table 1. Response rate by provider category
Provider (combined)* % of Surveys
Received # of Responses # of Surveys
Mailed Ambulance 61.4% 121 197Dentist 72.8% 449 617Dialysis 91.7% 11 12Health Care 72.1% 49 68Home Health 70.8% 46 65Hospital 97.7% 42 43Long Term Care 57.8% 115 199PHN* & Blood Bank 100.0% 7 7Total 69.5% 840 1,208 *Public Health Nurse B: Use of safer needle and sharps devices by providers The four most common types of equipment used as reported by the providers were injection equipment, IV medication delivery system, IV insertion equipment and lancet. Figure 1. Use of safer needle and sharps devices by providers (n=570)
Use of Safer Needle and Sharps Devices by Providers
419
256
198241
187 154
1
0
95
190
285
380
475
570
# of
Pro
vide
rs
Injection Equipment
IV Medication Delivery System
IV Insertion Equipment
Lancet
Surgical Sharps
Blood Collection Equipment
Blood Bank Devices
(73.5%)
(44.9%)
(34.7%)
(42.3%)
(32.8%)
(27.0%)
(3.0%)

3
C: The use of safer needle and sharps devices by the seven major provider categories Table 2 shows the use of safer needle and sharps devices by the seven major provider categories. The results show that hospitals and ambulance services have a higher rate of use of the following equipment: a) Injection equipment, b) IV Medication Delivery system, c) IV Insertion Equipment and d) Lancet when compared to the other categories of providers. Table 2. Use of safer needle and sharps devices by the seven major provider categories
Device Category
Ambu- lance
(n = 121) Dentist
(n = 449)
Dialysis (n = 6)
Health Care
(n = 49)
Home Health (n = 46)
Hospital (n = 42)
Long Term Care (n = 115)
PHN & Blood Bank (n = 7)
# % # % # % # % # % # % # % # % Injection Equipment 79 65.3 220 49.0 6 54.5 13 26.5 10 21.7 31 73.8 60 52.2 0 0.0IV Medication Delivery system 95 78.5 24 5.3 6 54.5 13 26.5 26 56.5 40 95.2 52 45.2 0 0.0IV Insertion Equipment 89 73.6 7 1.6 2 18.2 6 12.2 15 32.6 33 78.6 45 39.1 1 14.3Lancet 71 58.7 2 0.4 2 18.2 27 55.1 20 43.5 35 83.3 83 72.2 1 14.3Surgical Sharps 18 14.9 135 30.1 2 18.2 4 8.2 22 47.8 6 14.3 0 0.0 0 0.0Blood Collection Equipment 48 39.7 4 0.9 6 54.5 21 42.9 18 39.1 32 76.2 24 20.9 1 14.3Blood Bank Devices 1 0.8 0 0.0 0 0.0 0 0.0 0 0.0 15 35.7 0 0.0 1 14.3
D: Specific types of injection equipment used by providers Of the different types of injection equipment used, 50 providers (11.9%) reported using needleless jet injection devices, while 19.3% (81) use retractable needles. The most commonly used injection equipment was the needle guards-hinged recap type. Over 61.0% (259) of the providers reported using this type of equipment. Figure 2: Specific types of injection equipment used by providers
Specific Types of Injection Equipment Used by Providers
62 50
81
259
79
0
50
100
150
200
250
300
# of
Pro
vide
rs
Needle guards-hinged recap
Needleless jet injection
Retractable needles
Needle guards-slidingsheath/sleeve
Other(14.8%) (11.9%)
(19.3%)
(61.8%)
(18.9%)

4
E: Use of different injection devices by provider category About 26.4% (32) of ambulance services reported using needleless jet injection, while 14.3% (6) of the hospitals use such a device. About 37.0% (45) of the ambulances and 31.0% (13) of the hospitals reported using retractable needles. Table 3 describes the distribution of use by provider category. Table 3: Use of different injection devices by provider category
Ambulance (n = 121)
Dentist (n = 449)
Dialysis (n = 11)
Health Care (n = 49)
Home Health (n = 46)
Hospital (n = 42)
Long Term Care
(n = 115)
PHN & Blood Bank
(n = 7) # % # % # % # % # % # % # % # %
Injection Equipment 79 65.3 220 49.0 6 54.5 13 26.5 10 21.7 31 73.8 60 52.2 0 0.0 Needle guards-hinged recap 7 5.8 34 7.6 2 18.2 4 8.2 1 2.2 9 21.4 5 4.3 0 0.0
Needleless Jet Injection 32 26.4 4 0.9 0 0.0 2 4.1 4 8.7 6 14.3 2 1.7 0 0.0
Retractable Needles 45 37.2 2 0.4 0 0.0 4 8.2 2 4.3 13 31.0 15 13.0 0 0.0 Needle guards-sliding sheath 38 31.4 136 30.3 6 54.5 6 12.2 6 13.0 21 50.0 46 40.0 0 0.0 Other 6 5.0 58 12.9 2 18.2 0 0.0 1 2.2 6 14.3 6 5.2 0 0.0 F: IV medication delivery equipment Over 60.0% (160) of the providers reported using the needleless IV type with blunted cannulas, while 54.5% (139) reported using the needleless valve type with access ports and connectors. Figure 3: IV medication delivery equipment
Overall Use of Medication Delivery Equipment
139
160
106
61
74
15
0
20
40
60
80
100
120
140
160
180
# of
Pro
vide
rs
Needleless IV access withblunted cannulas
Needleless valve with accessports and connectors
Prefilled medication cartridgewith safety needles
Needle guards for prefilledmedication cartridge
Recessed/protected needle
Other
(54.5%)
(62.7%)
(41.6%)
(23.9%)
(29.0%)
(5.9%)

5
G: Use of IV medication delivery systems by provider category The survey found that about 70.0% (30) of the hospitals reported using needleless IV type with blunted cannulas, while 64.3% (27) reported using the needleless valve type with access ports and connectors. Table 4: Use of IV medication delivery systems by provider category
Ambulance (n = 121)
Dentist (n = 449)
Dialysis (n = 11)
Health Care (n = 49)
Home Health (n = 46)
Hospital (n = 42)
Long Term Care
(n = 115)
PHN & Blood Bank
(n = 7)
# % # % # % # % # % # % # % # % IV Medication Delivery system 95 78.5 24 5.3 6 54.5 13 26.5 26 56.5 40 95.2 52 45.2 0 0.0 Needleless IV Access with Blunted Cannulas 50 41.3 2 0.4 2 18.2 6 12.2 15 32.6 30 71.4 34 29.6 0 0.0 Needleless Valve with access ports 55 45.5 3 0.7 4 36.4 8 16.3 18 39.1 27 64.3 45 39.1 0 0.0 Prefilled medication cartridge 54 44.6 9 2.0 2 18.2 3 6.1 7 15.2 14 33.3 17 14.8 0 0.0 Needle guards for pre-filled medication 33 27.3 9 2.0 1 9.1 3 6.1 3 6.5 5 11.9 7 6.1 0 0.0 Recessed/protected needle 36 29.8 6 1.3 3 27.3 1 2.0 3 6.5 10 23.8 15 13.0 0 0.0
Other 5 4.1 1 0.2 1 9.1 2 4.1 2 4.3 3 7.1 1 0.9 0 0.0 H: Use of the IV insertion equipment About 90.0% (177) of the providers reported using shielded or retracting peripheral IV catheters. Figure 4: Use of the IV insertion equipment
Use of IV Insertion Equipment
177
18 18
0
20
40
60
80
100
120
140
160
180
200
# of
Pro
vide
rs Shielded or retractingperipheral IV catheters
Shielded midline IVcatheters
Other
(89.8%)
(9.1%) (9.1%)

6
I: Use of IV insertion equipme nt by provider category The major users of IV insertion equipment are ambulance services and hospitals. Table 5: Use of IV insertion equipment by provider category
Ambulance (n = 121)
Dentist (n = 449)
Dialysis (n = 11)
Health Care (n = 49)
Home Health (n = 46)
Hospital (n = 42)
Long Term Care
(n = 115)
PHN & Blood Bank
(n = 7)
# % # % # % # % # % # % # % # % IV Insertion Equipment 89 73.6 7 1.6 2 18.2 6 12.2 15 32.6 33 78.6 45 39.1 1 14.3Shielded or retracting peripheral IV catheters 82 67.8 2 0.4 1 9.1 6 12.2 12 26.1 32 76.2 42 36.5 0 0.0Shielded midline IV catheters 6 5.0 1 0.2 1 9.1 0 0.0 2 4.3 5 11.9 3 2.6 0 0.0Other 6 5.0 4 0.9 1 9.1 0 0.0 2 4.3 2 4.8 2 1.7 1 14.3 J: Use of lancets by provider category The retractable type of lancet is the most commonly used among all providers surveyed. There were three ambulance services that reported using laser lancets. Table 6: Use of lancets by provider category
Ambulance (n = 121)
Dentist (n = 449)
Dialysis (n = 11)
Health Care (n = 49)
Home Health (n = 46)
Hospital (n = 42)
Long Term Care
(n = 115)
PHN & Blood Bank
(n = 7) # % # % # % # % # % # % # % # % Lancet 71 58.7 2 0.4 2 18.2 27 55.1 20 43.5 35 83.3 83 72.2 1 14.3Laser lancet 3 2.5 0 0.0 0 0.0 0 0.0 0 0.0 0 0.0 0 0.0 0 0.0Retracting lancet 50 41.3 2 0.4 2 18.2 23 46.9 19 41.3 35 83.3 77 67.0 1 14.3Strip lancet 16 13.2 1 0.2 0 0.0 1 2.0 0 0.0 0 0.0 3 2.6 0 0.0Other 7 5.8 0 0.0 0 0.0 4 8.2 1 2.2 1 2.4 3 2.6 0 0.0 K: Use of surgical devices by provider category Table 7: Use of surgical devices by provider category
Ambulance (n = 121)
Dentist (n = 449)
Dialysis (n = 11)
Health Care (n = 49)
Home Health (n = 46)
Hospital (n = 42)
Long Term Care
(n = 115)
PHN & Blood Bank
(n = 7)
# % # % # % # % # % # % # % # % Surgical Sharps 18 14.9 135 30.1 2 18.2 4 8.2 22 47.8 6 14.3 0 0.0 0 0.0Quick-release scalpel blade handles 4 3.3 70 15.6 0 0.0 1 2.0 3 6.5 0 0.0 0 0.0 0 0.0Retracting scalpel 2 1.7 0 0.0 0 0.0 0 0.0 6 13.0 2 4.8 0 0.0 0 1.0Blunted suture needles 0 0 13 2.9 1 9.1 0 0.0 13 28.3 3 7.1 0 0.0 0 0.0
Cut- or puncture-resistant barrier products 4 3.3 38 8.5 1 9.1 3 6.1 10 21.7 3 7.1 0 0.0 0 0.0Other 10 8.3 34 7.6 0 0.0 0 0.0 8 17.4 0 0.0 0 0.0 0 0.0
7
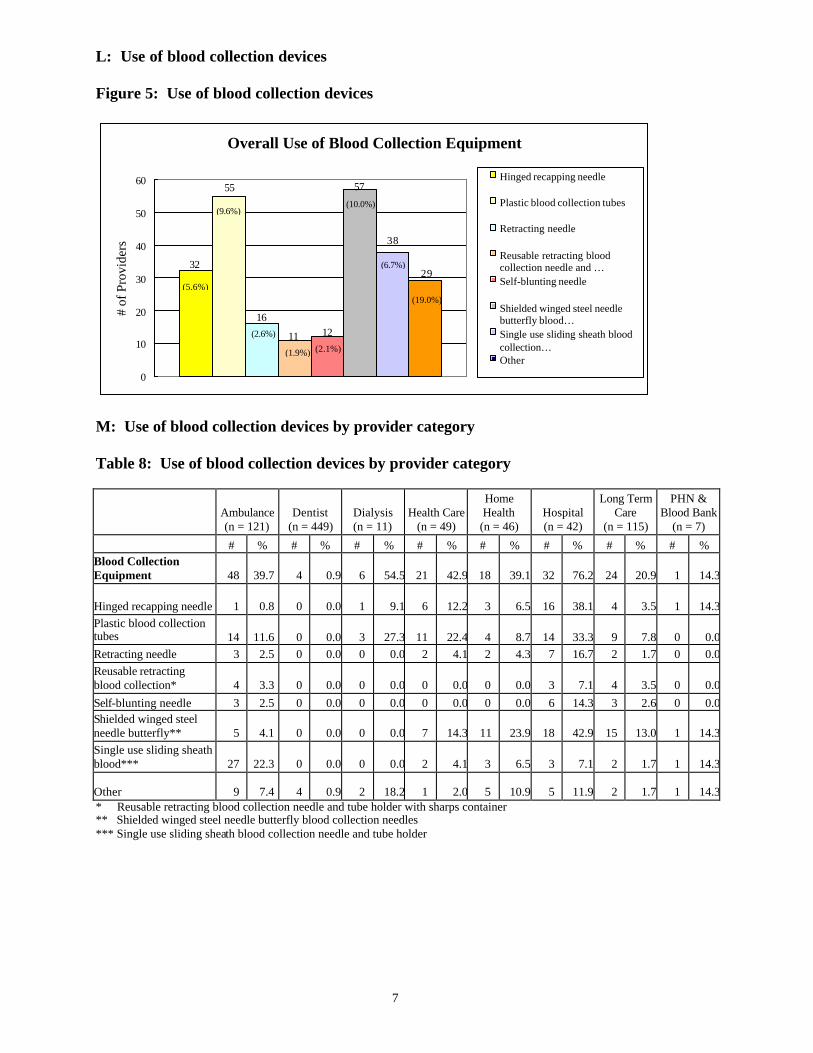
L: Use of blood collection devices Figure 5: Use of blood collection devices
Overall Use of Blood Collection Equipment
32
55
16
11 12
57
38
29
0
10
20
30
40
50
60
# of
Pro
vide
rs
Hinged recapping needle
Plastic blood collection tubes
Retracting needle
Reusable retracting bloodcollection needle and …Self-blunting needle
Shielded winged steel needlebutterfly blood…Single use sliding sheath bloodcollection…Other
(5.6%)
(9.6%)
(2.6%)
(1.9%) (2.1%)
(10.0%)
(6.7%)
(19.0%)
M: Use of blood collection devices by provider category Table 8: Use of blood collection devices by provider category
Ambulance (n = 121)
Dentist (n = 449)
Dialysis (n = 11)
Health Care (n = 49)
Home Health (n = 46)
Hospital (n = 42)
Long Term Care
(n = 115)
PHN & Blood Bank
(n = 7)
# % # % # % # % # % # % # % # % Blood Collection Equipment 48 39.7 4 0.9 6 54.5 21 42.9 18 39.1 32 76.2 24 20.9 1 14.3
Hinged recapping needle 1 0.8 0 0.0 1 9.1 6 12.2 3 6.5 16 38.1 4 3.5 1 14.3Plastic blood collection tubes 14 11.6 0 0.0 3 27.3 11 22.4 4 8.7 14 33.3 9 7.8 0 0.0Retracting needle 3 2.5 0 0.0 0 0.0 2 4.1 2 4.3 7 16.7 2 1.7 0 0.0Reusable retracting blood collection* 4 3.3 0 0.0 0 0.0 0 0.0 0 0.0 3 7.1 4 3.5 0 0.0Self-blunting needle 3 2.5 0 0.0 0 0.0 0 0.0 0 0.0 6 14.3 3 2.6 0 0.0Shielded winged steel needle butterfly** 5 4.1 0 0.0 0 0.0 7 14.3 11 23.9 18 42.9 15 13.0 1 14.3Single use sliding sheath blood*** 27 22.3 0 0.0 0 0.0 2 4.1 3 6.5 3 7.1 2 1.7 1 14.3
Other 9 7.4 4 0.9 2 18.2 1 2.0 5 10.9 5 11.9 2 1.7 1 14.3* Reusable retracting blood collection needle and tube holder with sharps container ** Shielded winged steel needle butterfly blood collection needles *** Single use sliding sheath blood collection needle and tube holder

8
N: Use of limited blood bank devices by provider category Table 9: Use of limited blood bank devices by provider category
Ambulance (n = 121)
Dentist (n = 449)
Dialysis (n = 11)
Health Care (n = 49)
Home Health (n = 46)
Hospital (n = 42)
Long Term Care
(n = 115)
PHN & Blood Bank
(n = 7) # % # % # % # % # % # % # % # %
Blood Bank Devices 1 0.8 0 0.0 0 0.0 0 0.0 0 0.0 15 35.7 0 0.0 1 14.3Segment sampling devices 0 0.0 0 0.0 0 0.0 0 0.0 0 0.0 15 35.7 0 0.0 1 14.3
Others 1 0.8 0 0.0 0 0.0 0 0.0 0 0.0 0 0.0 0 0.0 0 0.0 Section 4: Reporting and Prevalence of Needlestick/Sharps Injuries 1995-1999
A: Reporting of needlestick/sharps injuries Of the 840 respondents, 463 (55.1%) indicated they had a data collection system in addition to that required by Occupational Safety & Health Administration (OSHA). The survey results indicate that the number of needlestick/sharps injuries has been on the rise since 1995. The data presented in Figure 6 includes clean as well as contaminated needlestick or sharps injuries. Figure 6: Prevalence of needlestick/sharps injuries 1995-1999*
Prevalence of Needlestick/Sharps Injuries 1995 - 1999
760
526
698
785 794
0
100
200
300
400
500
600
700
800
900
1995 1996 1997 1998 1999
Inju
ries
(14.8%)
(19.6%)(21.3%)
(22.0%) (22.3%)
* May include non-contaminated needlesticks.

9
B: Prevalence of needlestick/sharps injuries by provider category: 1995-1999
Hospitals and dentists reported the highest numbers of needlestick and sharps injuries of all the providers surveyed. This finding must be interpreted with caution. In order to assess the risk of needlestick and sharps injuries among different providers, the odds ratio must be computed using the number of hours worked by workers and an investigation of other possible contributing risk factors. This is beyond the scope of this survey. Table 10: Prevalence of needlestick/sharps injuries by provider category: 1995-1999 Provider 1995 1996 1997 1998 1999 Ambulance 0 2 13 10 9Dentist 18 16 33 41 49Dialysis 3 8 2 9 6Health Care 7 4 4 8 7Home Health 8 9 16 19 27Hospital 480 639 665 667 662Long Term Care 10 20 27 31 34PHN & Blood Bank 0 0 0 0 0Total 526 698 760 785 794 C: Support for a mandatory reporting of needlestick/sharps injuries A total of 409 (48.7%) providers indicated they would support a mandatory reporting of needlestick/sharps injuries in addition to what is required by OSHA and the Maine Workers’ Compensation Board (WCB). OSHA and WCB only require reporting of injuries if there is time lost from work or medical attention rendered (beyond first aid). Figure 7: Support for a mandatory reporting of needlestick/sharps injuries
Providers Supporting Mandatory Reporting
31
70
28289
149
88
6
0
50
100
150
200
Ambulance Dentist Dialysis Health Care HomeHealth
Hospital Long TermCare
PHN &Blood Bank
# of
Pro
vide
rs
(72.7%)
(33.2%)
(81.8%) (63.3%)(60.9%) (66.7%)
(60.9%)
(85.7%)

10
D: Support for a voluntary reporting program for needlestick/sharps injuries A total of 381 (45.4%) providers indicated they would support a voluntary reporting program.* Figure 8: Support for a voluntary reporting program for needlestick/sharps injuries
Providers Supporting Voluntary Reporting
6
69
32
1927
8
131
89
0
20
40
60
80
100
120
140
Ambulance Dentist Dialysis Health Care Home Health Hospital Long TermCare
PHN &Blood Bank
# o
f Pro
vide
rs
(73.6%)
(29.2%)
(72.7%) (55.1%)(41.3%)
(76.2%)
(60.0%)
(85.7%)
*(Note: There were a number of providers who indicated they wanted additional information concerning mandatory and voluntary reporting before indicating whether or not they would support mandatory or voluntary reporting.) E: Reasons for not having a needleless system Of the providers, 244 (29.0%) reported having no problems with needlestick/sharps injuries as a reason for not having a needleless system. Figure 9: Reasons for not having a needleless system
Reason For Not Having Needleless System
244
114
5958
120
73
0
50
100
150
200
250
300
Cost Not available Currently testing Not accepted No problem withneedle sticks
Others
# of
Pro
vide
rs
(8.7%)
(14.3%)
(6.9%)
(7.0%)
(29.0%)
(13.6%)

11
F: Reasons for not having a needleless system by provider category Table 11: Reasons for not having a needleless system by provider category
Reason Ambulance (n = 121)
Dentist (n = 449)
Dialysis (n = 11)
Health Care (n = 49)
Home Health
(n = 49) Hospital (n = 42)
Long Term Care
(n = 115)
PHN & Blood Bank
(n = 7)
# % # % # % # % # % # % # % # %
Equipment Cost 12 9.9 22 4.9 0 0.0 12 24.5 9 18.4 3 7.1 15 13.0 0 0.0
Current Equipment not Available 8 6.6 98 21.8 4 36.4 3 4.1 1 2.0 2 4.8 3 2.6 1 14.3
Testing New Equipment 8 6.6 6 1.3 4 36.4 8 0.0 7 14.3 7 16.7 18 15.7 0 0.0
Available Equipment not Accepted 6 5.0 43 9.6 3 27.3 1 2.0 2 4.1 3 7.1 1 0.0 0 0.0 No Previous Problem with NSI 27 22.3 161 35.9 4 36.4 11 6.1 11 22.4 2 4.8 28 24.3 0 0.0
Other 19 15.7 54 12.0 3 27.3 10 10.2 5 10.2 1 2.4 17 14.8 5 71.4 G: Frequency of review and evaluation of current needleless system Figure 10: Frequency of review and evaluation of current needleless system
Frequency of Review and Evaluation
201
29 21 26
3665
37
0
50
100
150
200
250
Annually Semiannually Monthly As needed Ongoing Didn't specify All others
# of
Pro
vide
rs
(48.4%)
(7.0%) (5.1%) (8.7%)
(15.7%)(8.9%)
(6.3%)

«ID» «First_Name» «Last_Name» «Degree» «Title» «dba» «Address1» «Address2» «City», «State» «Zip» Instructions: Does your facility/organization use any of the following safety devices?
Yes No If “No”, please sign and return to us in the postage paid envelope provided. If “Yes” please complete the survey. 1) For Section 1, check “Yes” if your organization uses that category of safety devices and “No” if you don’t; 2) For each section you check “Yes”:
?? Check the specific type of equipment you use. Indicate the number of years you have used each type of equipment. ?? Write down the areas or departments where you use that category of device. (We do not need to know where you use each
specific type of equipment). (Please use acronyms to define Area/s (e.g., OR for operating room, ER for emergency room etc). Example:
Yes No Injection Equipment No. of Identify Area/s Years Used Utilized
___ Needle guards-hinged recap _____ _X_ Needleless jet injection __2__ ___ Retractable needles _____ _X_ Needle guards-sliding sheath/sleeve __1__ ___ Others (please specify) _________________________ _____
Section 1:
Yes No Injection Equipment No. of Identify Area/s Years Used Utilized
___ Needle guards-hinged recap _____ ___ Needleless jet injection _____ ___ Retractable needles _____ ___ Needle guards-sliding sheath/sleeve _____ ___ Others (please specify) _________________________ _____
Yes No IV Medication Delivery Systems
___ Needleless IV access with blunted cannulas _____ ___ Needleless valve with access ports and connectors _____ ___ Prefilled medication cartridge with safety needles _____ ___ Needle guards for pre-filled medication cartridges _____ ___ Recessed/protected needle _____ ___ Others (please specify) _________________________ _____
Yes No IV Insertion Equipment
___ Shielded or retracting peripheral IV catheters _____ ___ Shielded midline IV catheters _____ ___ Others (please specify) _________________________ _____
OR, ER, Nursing
Appendix A SAFER NEEDLE & SHARPS DEVICE USAGE SURVEY

Yes No Lancet No. of Identify Area/s Years Used Utilized
___ Laser Lancet _____ ___ Retracting Lancet _____ ___ Strip Lancet _____ ___ Others (please specify) ________________________ _____
Yes No Surgical Sharps
___ Quick-release scalpel blade handles _____ ___ Retracting scalpel _____ ___ Blunted Suture Needles _____ ___ Cut- or puncture-resistant barrier products _____ ___ Others (please specify) ________________________ _____
Yes No Blood Collection Equipment
___ Hinged recapping needle _____ ___ Plastic blood collection tubes _____ ___ Retracting needle _____ ___ Reusable retracting blood collection needle and tube holder with sharps container _____ ___ Self-blunting needle _____ ___ Shielded winged steel needle butterfly® blood collection needles _____ ___ Single use sliding sheath blood collection needle and tube holder _____ ___ Others (please specify) ________________________ _____
Yes No Blood Bank Devices
____ Segment sampling devices _____ ____ Others (please specify) _____________________ _____
Section 2: 1. Does your facility/organization review and evaluate current needleless systems (i.e., engineering
controls) to reduce or eliminate exposure to bloodborne pathogens? Yes No Frequency of review
2. If you do not have a needleless system at this time, please indicate why. Check all that apply.
Equipment cost Current equipment not available Currently testing new equipment Available equipment not accepted by medical profession No previous problems with needle sticks Others
3. Estimate the number of individuals in your organization who, in the performance of their jobs, work around needles/sharps. _____ 4. In addition to OSHA reporting requirements, does your facility/organization have a data collection system on needle stick/sharps
injuries? Yes, please provide number of cases reported for the following years: ____1995 ____1996____1997_____1998 _____1999 No
5. Would your facility/organization support mandatory reporting of needle stick/sharps injuries?
Yes No 6. Would your facility/organization participate in a voluntary needle stick/sharps study?
Yes No Name of Person Completing Survey: (Print) Signature Title: Telephone Number: