Embed Size (px)
Citation preview
2
Acknowledgments
The Metrics Handbook for Maintenance Leaders was produced by the Air Force
Logistics Management Agency for use in the Air Force maintenance community.
The project was commissioned by the Director of Maintenance, Deputy Chief of
Staff, Installations and Logistics, United States Air Force. Specific questions
concerning the content should be addressed to the Directorate of Maintenance.
Grateful acknowledgment is extended to the many action officers at the Air Staff
and major commands who contributed to the writing and production effort.
Air Force Logistics Management Agency
501 Ward Street
Maxwell AFB, Gunter Annex, Alabama 36114-3236
DSN: 596-4087/4088
Commercial: (334) 416-4087/4088
FAX: (334) 416-5890
James C. Rainey, Editor-in-Chief
Senior Master Sergeant Robert McGonagle, Associate Editor
Beth F. Scott, Editor
Lieutenant Colonel Gail Waller, Contributing Editor
The Editors, Air Force Journal of Logistics
Graphics and Layout
James C. Rainey
Beth F. Scott
Senior Master Sergeant Robert McGonagle
Lieutenant Colonel Mark R. McConnell
Chief Master Sergeant John G. Drew
20 December 2001
Air Force Maintenance Metrics3
Foreword
Aircraft maintenance metrics are important. Don’t let anyone
tell you differently! They are critical tools to be used by
maintenance managers to gauge an organizat ion’s
effectiveness and efficiency. In fact, they are roadmaps that let you
determine where you’ve been, where you’re going, and how (or if)
you’re going to get there. Use of metrics allows you to flick off your
organizational autopilot and actually guide your unit. But they must
be used correctly to be effective. Chasing metrics for metrics’ sake is
a bad thing and really proves nothing. A good maintenance manager
will not strive to improve a metric but will use them to improve the
performance of the organization. The intent of this handbook is to help
reacquaint or introduce managers at all levels to these necessary tools
of trade. I encourage each of you to read this handbook and keep it
close at hand for future reference. Discuss the importance of metrics
with others in the maintenance community. Today’s Air Force has the
best people, parts, and equipment in the world. My hope is that this
handbook will help you capitalize on these strengths. As a maintenance
leader, your task is to provide good iron to the operators when needed.
I t i s y o u r r e s p o n s i b i l i t y .
Understanding metrics and
their use in effectively and
efficiently managing
aircraft maintenance
i s k e y t o y o u r
ability to uphold
that responsibility.
Good luck.
Terry L. Gabreski, Brigadier General, USAF
Director of Logistics
Air Force Materiel Command
4
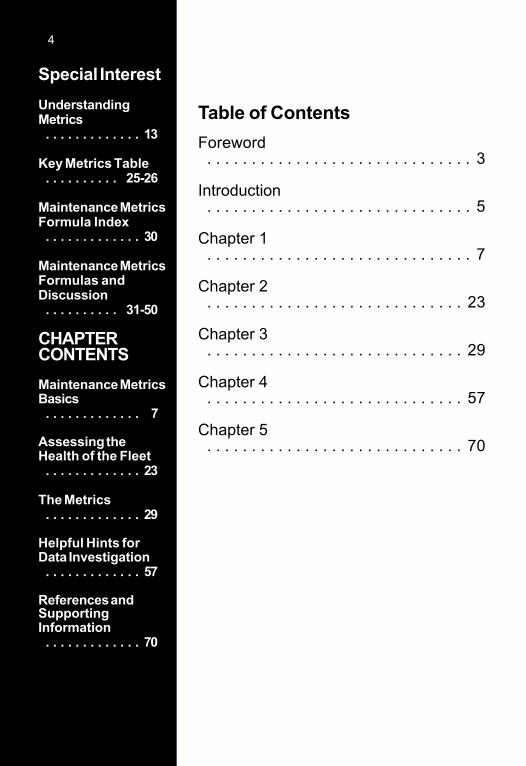
Table of Contents
Foreword. . . . . . . . . . . . . . . . . . . . . . . . . . . . . . 3
Introduction. . . . . . . . . . . . . . . . . . . . . . . . . . . . . . 5
Chapter 1. . . . . . . . . . . . . . . . . . . . . . . . . . . . . . 7
Chapter 2. . . . . . . . . . . . . . . . . . . . . . . . . . . . . 23
Chapter 3. . . . . . . . . . . . . . . . . . . . . . . . . . . . . 29
Chapter 4. . . . . . . . . . . . . . . . . . . . . . . . . . . . . 57
Chapter 5. . . . . . . . . . . . . . . . . . . . . . . . . . . . . 70
Special Interest
UnderstandingMetrics. . . . . . . . . . . . . 13
Key Metrics Table. . . . . . . . . . 25-26
Maintenance MetricsFormula Index. . . . . . . . . . . . . 30
Maintenance MetricsFormulas andDiscussion. . . . . . . . . . 31-50
CHAPTERCONTENTS
Maintenance MetricsBasics. . . . . . . . . . . . . 7
Assessing theHealth of the Fleet. . . . . . . . . . . . . 23
The Metrics. . . . . . . . . . . . . 29
Helpful Hints forData Investigation. . . . . . . . . . . . . 57
References andSupportingInformation. . . . . . . . . . . . . 70
5
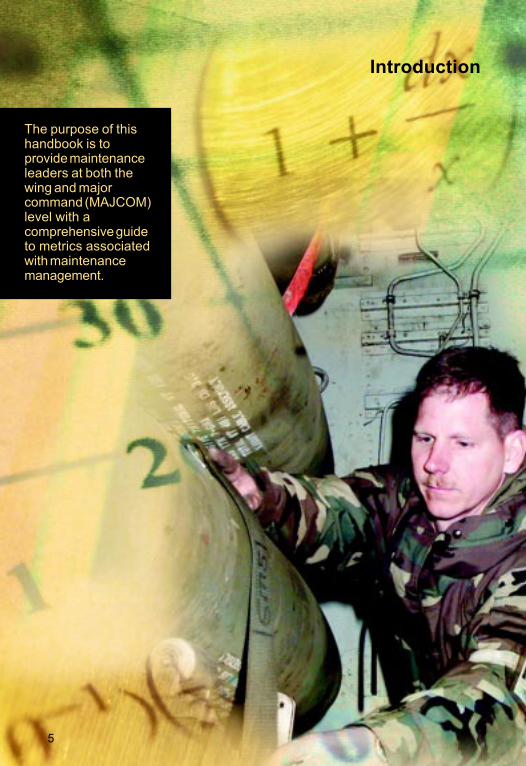
The purpose of thishandbook is toprovide maintenanceleaders at both thewing and majorcommand (MAJCOM)level with acomprehensive guideto metrics associatedwith maintenancemanagement.
Introduction
6 Introduction
Note: MAJCOM
formulas may deviate
slightly. For exact
formulas, check with
the MAJCOM logistics
analysis division.
This handbook is an encyclopedia of metrics and
includes an overview to metrics, a brief description
of things to consider when analyzing fleet statistics,
an explanation of data that can be used to perform analysis,
a detailed description of each metric, a formula to calculate
the metric, and an explanation of the metric’s importance
and relationship to other metrics. The handbook also
identifies which metrics are leading indicators (predictive)
and which are lagging indicators (historical). It is also a
guide for data investigation.
However, a word of caution is in order at this point.
Overemphasis of a particular metric while ignoring the root
cause of a problem may well lead to an improvement in the
metric but worsening of the problem. Metrics are indicators
and, as such, should be viewed in aggregate. The
relationship between two metrics may be so intertwined as
to make it impossible for the maintenance manager to
separate the cause from the effect. Generally, metrics should
be used to identify trends and not as pass or fail indicators.
Individually, they are snapshots in time, and even the best
organizations will occasionally dip below standards. Good
metrics analysis, however, will focus the maintenance
manager’s attention on those areas where improvements
can be realized.
MAJCOM formulas may deviate slightly. For exact
formulas, check with the MAJCOM logistics analysis
division.
MAJCOM formulas
may deviate
slightly. For exact
formulas, check
with the MAJCOM
logistics analysis
division.
7
Chapter 1Maintenance Metrics Basics
Special Interest
Scheduling. . . . . . . . . . . . . 8
Work ForceManagement
. . . . . . . . . . . . . 9
Sortie Generation. . . . . . . . . . . . . 11
MaintenancePerformance
. . . . . . . . . . . . . 11
Equipment/MissionAnalysis
. . . . . . . . . . . . . 13
Fleet Availability. . . . . . . . . . . . . 14
Program Execution. . . . . . . . . . . . . 17
MaintenanceTraining
. . . . . . . . . . . . . 19
CHAPTERCONTENTS
Foundations forMetrics
. . . . . . . . . . . . . 8
UnderstandingMetrics
. . . . . . . . . . . . . 13
8 Chapter 1Maintenance Metrics Basics
Metrics are nothing more than a barometer for pain.
As leaders, our responsibility is to know where
the pain is in order to alleviate it. Understanding
the unit’s maintenance metrics is only the first part of
learning to manage the pain. Metrics are not just charts and
numbers to be looked at. They are tools for fixing problems.
If the tool does not generate questions, it is a waste of time.
If a lot of time is spent looking at metrics that do not address
daily problems affecting the unit , their value is
questionable. When there is no applicable metric for driving
unit performance, build one. Watch for filtering of the
metrics that show the pain—they are the ones with the
greatest value. If a metric rarely meets its prescribed
standard, the standard is probably not realistic for one of
two reasons—it was arbitrarily set too high, or significant
issues need resolution. Either way, investigation into the
circumstances is warranted.
Foundations for Metrics
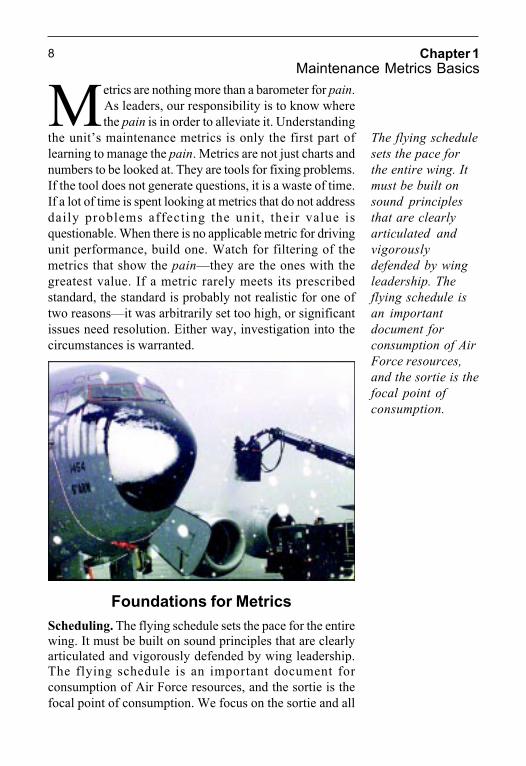
Scheduling. The flying schedule sets the pace for the entire
wing. It must be built on sound principles that are clearly
articulated and vigorously defended by wing leadership.
The flying schedule is an important document for
consumption of Air Force resources, and the sortie is the
focal point of consumption. We focus on the sortie and all
The flying schedule
sets the pace for
the entire wing. It
must be built on
sound principles
that are clearly
articulated and
vigorously
defended by wing
leadership. The
flying schedule is
an important
document for
consumption of Air
Force resources,
and the sortie is the
focal point of
consumption.
Chapter 1Maintenance Metrics Basics
Air Force Maintenance Metrics9
the events required for it to succeed. We establish a
schedule to attempt a smooth flow of resource use that
includes people, aircraft, and consumables. Without a
schedule, all the moving parts certainly would not come
together efficiently.
Work Force Management. Key to any maintenance
activity is the availability of personnel. A schedule allows
the work force needed to support the required task to be
identified, manipulated, and managed. The schedule
becomes a contract that identifies requirements (number
of sorties and configurations) and provides a measure of
stability and security for the work effort, as well as a gauge
for performance. Plan what you fly, and fly what you plan.
Agree on the basics and write them down: standard
flying window, rules of engagement (ROE) for surges, night
flying, cross country (XC) sorties; weekend duty; quiet
hours; training days; standard configurations; minimum/
standard turn times; approval authority for Form 2407,
Weekly/Daily Flying Coordination; scheduling changes
(if it is too easy to change the schedule, it won’t be built
right the first time); XC ROE; crew ready/step minimums;
and so forth.
Aircraft should rarely be added. If you are adding aircraft
because maintenance can’t provide front lines, something
else is wrong. There is a domino effect—how many more
aircraft will you add to the broke pile before you call knock
it off? Not all aircraft are prepared to fly every day. Some
aircraft are selected for ground training, cannibalization
(CANN), spares, or nonflyers for time management. For the
combat air forces (CAF), time management is critical to a
smooth phase inspection flow. It sounds obvious, but
adding an aircraft means it is not doing what was originally
planned for it.
The flying window drives shift scheduling, and
operations and maintenance are not the only agencies
involved in sortie generation. Fuels management, air traffic
control, the weather squadron, and many others are also
involved. Supervision must cover the entire flying
window—and then some. The length of the flying window
The schedule
becomes a contract
that identifies
requirements
(number of sorties
and
configurations)
and provides a
measure of stability
and security for the
work effort, as well
as a gauge for
performance.
Aircraft should
rarely be added. If
you are adding
aircraft because
maintenance can’t
provide front lines,
something else is
wrong.
10 Chapter 1Maintenance Metrics Basics
determines effectiveness of the maintenance fix shift.
Turbulence in the flying window creates stress on the flight
line—keep the schedule consistent throughout the week.
A late start on one day affects the next day’s early start.
Turn times must be negotiated between operations and
maintenance and should be published. When building the
schedule, early takeoffs and late landings should never
cause a minimum turn time to be violated. For mobility air
force (MAF) units, operational requirements flow from the
Joint Chiefs of Staff, Air Staff, or other customer
requirements through the Air Mobility Command (AMC)
Tanker/Airlift Control Center (TACC) to the units. Most
MAF operational requirements are short notice, requiring
maximum flexibility. MAF units develop plans and
schedules based on known requirements. However,
unforeseen higher headquarters (HHQ) taskings cause units
to refine their schedules daily. MAF units do not have a
flying-hour window. Instead, the daily flying schedule
determines the work shifts and personnel requirements.
Constant communication between the sortie generation
and the plans and scheduling elements is vital to the
isochronal inspection concept. This communication
ensures aircraft are available for their scheduled dock input
and available to meet mission requirements. The smooth
flow of aircraft—through dash 6 inspection, time change,
and time compliance technical order requirements—
maximizes aircraft availability and reduces excessive
maintenance down time. The result is capable aircraft
available to accomplish the mission.
Known maintenance requirements should be included
in both short- and long-range maintenance plans.
Scheduling flexibility is the key to success in the MAF,
along with adherence to sound maintenance management
policy. Don’t reconfigure aircraft during the day shift
without an overwhelming, urgent need. Work with
operations and fly the same configuration for the entire
week. Unnecessary aircraft configuration drains manpower
from troubleshooting, repairing, inspecting, servicing,
launching, and recovering.
Chapter 1Maintenance Metrics Basics
Air Force Maintenance Metrics11
For the CAF, weekend duty should not be routine.
Weekend duty should be based on rules, and aircraft should
not be worked unless there is no other option but to work
or replace a Monday flyer. XCs should rarely, if ever, return
on a weekend.
Problems occur when:
• The lead operations scheduler changes week to week.
• Forms 2407 are approved by whoever is around.
• Late landings or early takeoffs are the norm.
• You’re reconfiguring instead of servicing in the turn.
• Ground abort and CANN rates are on the rise.
• A squadron regularly flies more hours off its fleet than
the phase dock can regenerate.
• Day shift is not fixing any aircraft.
• Major changes occur to next week’s flying schedule.
• All scheduled maintenance is saved for phase.
• The maintenance schedule does not receive the same
attention as the flying schedule.
• Maintenance scheduling effectiveness (MSE) is 100
percent, but there are many overdue items in the planning
requirements report.
• Weekend duty is the norm.
• Technicians do not know what time they’re coming to
work tomorrow.
Sortie Generation. Maintenance leaders must review
sortie production and maintenance health constantly and
be knowledgeable about maintenance indicators that will
highlight trends before they become a problem. You should
be familiar with the daily production. Remember, sortie
generation includes maintenance support, supply, airfield
management, fire department, weather, safety, and civil
engineers.
Maintenance Performance. Maintenance leaders’
primary concerns are how well the unit is meeting mission
requirements and how to improve equipment performance,
Maintenance
leaders must
review sortie
production and
maintenance
health constantly
and be
knowledgeable
about maintenance
indicators that will
highlight trends
before they become
a problem.
12 Chapter 1Maintenance Metrics Basics
identifying emerging support problems, and projecting
current trends. Maintenance performance is assessed using
standards, goals, and maintenance plans. When operational
requirements are not achieved, maintenance analysis can
determine root causes. Some areas for serious consideration
include:
• Are operational requirements realistically based on
availability of equipment?
• What are causes for f lying schedule deviat ions
(cancellations, aborts, additions, and early or late
takeoffs)?
Maintenance
leaders’ primary
concerns are how
well the unit is
meeting mission
requirements and
how to improve
equipment
performance,
identifying
emerging support
problems, and
projecting current
trends.
Maintenance
performance is
assessed using
standards, goals,
and maintenance
plans.

Chapter 1Maintenance Metrics Basics
Air Force Maintenance Metrics13
• Are specific aircraft, equipment, systems, or subsystems
contributing to a disproportionate share of deviations
and turbulence?
• Does specific equipment fail to perform as scheduled?
Does this equipment require more or less maintenance
than normal?
• Are there enough people to meet mission needs? Do
certain work centers document significant overtime or
show consistently high utilization rates?
• Is there a good balance of skills within Air Force specialty
codes (AFSC) and between the units?
• Do higher rates of repeat/recur (R/R) discrepancies
indicate training or experience shortfalls?
• Is there suff icient t ime to schedule and work
maintenance problems?
• Are trends significant? Are the trends short term (6
months or less) or long term? Where are the units likely
to be in 6-12 months?
• Are there seasonal or cyclical variations? Are current
variations outside the norm?
• Does the rate look too good to be true? If it does, it
probably should be challenged in the same way a bad
rate would be challenged. If it stands the scrutiny, then
a better process may have been found that should be
shared with other units.
Understanding Metrics
Equipment/Mission Analysis. When negative trends are
identified, further investigation may be necessary to gather
facts. Quality assurance (QA), maintenance analysis leaders,
and work-center technicians may be contacted for
assistance. Consider the following questions when
reviewing negative trends:
Which systems are creating a high not mission capable
(NMC) rate? Are these the systems that normally create high
NMC rates? If so, are the rates higher than normal? What
14 Chapter 1Maintenance Metrics Basics
are the high-rate driving components, and what is being
done (or could be done) to address the problems?
• What factors are causing an increase or decrease in NMC
hours?
• Are units’ deployments affecting the rates? If so, to what
extent?
• Are specific aircraft or equipment causing trend
distortions?
• What systems are having high cannot duplicate (CND)
or R/R malfunctions?
• What parts or components are causing not mission
capable for supply (NMCS) conditions? Are these
normal, or is a new problem possibly emerging?
• Are the items repaired on station? Are they two-level
maintenance components? Could they be repaired
locally?
• Is supply support sufficient and responsive? If not, why
not? Are stocks adequate?
• Is the lack of training, technical data, or tools and
equipment affecting certain systems or AFSCs?
Most of the key metrics fall into two categories—leading
and lagging indicators. The theory of leading and lagging
indicators is one of cause and effect. Leading indicators
are those that directly impact maintenance’s capability to
provide resources to execute the mission. Lagging
indicators show firmly established trends. In other words,
the leading indicators will show a problem first, and the
lagging indicators will follow. There are two cornerstones
of maintenance metrics: fleet availability as measured by
the mission capable (MC) rate and program execution as
measured by the utilization (UTE) rate. For the MAF,
movement of fuel, cargo, and people, as measured by
departure and arrival reliability, replaces program
execution (UTE) as a cornerstone.
Fleet Availability. These indicators measure the ability
of logistics to provide sufficient aircraft to accomplish
mission requirements. A set percentage of the fleet is
Most of the key
metrics fall into
two categories—
leading and
lagging indicators.
Leading indicators
are those that
directly impact
maintenance’s
capability to
provide resources
to execute the
mission. Lagging
indicators show
firmly established
trends. The leading
indicators will
show a problem
first, and the
lagging indicators
will follow.
Chapter 1Maintenance Metrics Basics
Air Force Maintenance Metrics15
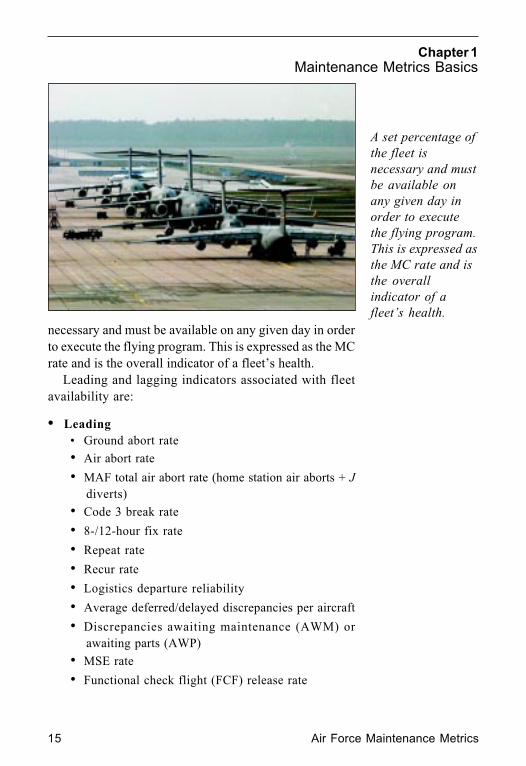
necessary and must be available on any given day in order
to execute the flying program. This is expressed as the MC
rate and is the overall indicator of a fleet’s health.
Leading and lagging indicators associated with fleet
availability are:
• Leading
• Ground abort rate
• Air abort rate
• MAF total air abort rate (home station air aborts + J
diverts)
• Code 3 break rate
• 8-/12-hour fix rate
• Repeat rate
• Recur rate
• Logistics departure reliability
• Average deferred/delayed discrepancies per aircraft
• Discrepancies awaiting maintenance (AWM) or
awaiting parts (AWP)
• MSE rate
• Functional check flight (FCF) release rate
A set percentage of
the fleet is
necessary and must
be available on
any given day in
order to execute
the flying program.
This is expressed as
the MC rate and is
the overall
indicator of a
fleet’s health.
16 Chapter 1Maintenance Metrics Basics
• CANN rate
• Issue effectiveness rate
• Stockage effectiveness rate
• Bench-stockage effectiveness rate
• Mission capability (MICAP) aircraft part rate
• Average repair cycle days
• Phase flow—a phase time distribution interval (TDI)
• Lagging
• MC–mission capable rate
• FMC–fully mission capable rate
• PMC–partially mission capable rate
• PMCS–PMC for supply rate
• PMCM–PMC for maintenance rate
• PMCB–partially MC both maintenance and supply
rate
• N M C M ( U / S ) – n o t M C f o r m a i n t e n a n c e ,
unscheduled or scheduled rate
• NMCS–not MC for supply rate
• NMCB (U/S)–not MC for maintenance and supply,
unscheduled or scheduled rate
• TNMCM–total not MC for maintenance (NMCM +
NMCB) rate
• TNMCS–total not MC for supply (NMCS + NMCB)
rate

Chapter 1Maintenance Metrics Basics
Air Force Maintenance Metrics17
Program Execution. These indicators show a unit's
ability to fly a given schedule to accomplish the mission.
A set flying schedule is planned, then carried out in the
prescribed manner in order to execute the flying program
requirements and ensure adequate time to perform fleet
health functions (scheduled maintenance). The UTE rate
is the overall indicator for a flying program or mission.
Leading and lagging indicators associated with program
execution are:
• Leading
• Primary aircraft inventory (PAI) versus possessed
aircraft rate
• Programmed UTE versus actual UTE rates
• Programmed average sortie duration (ASD) versus
actual ASD
• Flying-hour execution
• Flying-scheduling effectiveness (FSE) rate
• Chargeable deviation rate:
Operations add* Operations delete
Operations nondelivery Logistics nondelivery**
Maintenance nondelivery Supply nondelivery
A set flying
schedule is
planned, then
carried out in the
prescribed manner
in order to execute
the flying program
requirements and
ensure adequate
time to perform
fleet health
functions
(scheduled
maintenance).
18 Chapter 1Maintenance Metrics Basics
• Nonchargeable deviations rates:
Ferry/FCF add*** Weather add
Other add**** Weather delete
Sympathy delete***** Other delete
HHQ/TACC delete HHQ/TACC add
*An add is an aircraft added to the flying schedule after
that schedule goes into execution.
**A nondelivery is interchangeable with cancellation or a
scheduled sortie that did not fly.
***Ferry refers to a cross-country ferry, where the aircraft
is en route from one location to another. FCF refers to
a functional check flight, normally required after heavy
or specialized maintenance to ensure airworthiness of
an aircraft, and is not part of the normal flying schedule.
****Other stands for reasons not attributed to otherwise
defined categories of deviations.
***** Sympathy refers to sorties that depend on other
aircraft or facilities to be effective (for example, a tanker
aircraft cancels it mission due to the abort of aircraft
planned to receive its fuel).
Note: Not all MAJCOMs distinguish between chargeable
and nonchargeable deviations.
• Lagging
• UTE rate—sortie (the average number of sorties
flown per assigned aircraft per month) or hourly (the
average number of hours flown per assigned aircraft
per month).
• Logistics departure reliability measures the ability
of logistics to ensure aircraft depart within 14
minutes of the scheduled departure time. Indicators
associated with departure reliability are:
• Home station
• En route (second or subsequent leg of a mission)
• Worldwide
• First station after home station
Chapter 1Maintenance Metrics Basics
Air Force Maintenance Metrics19
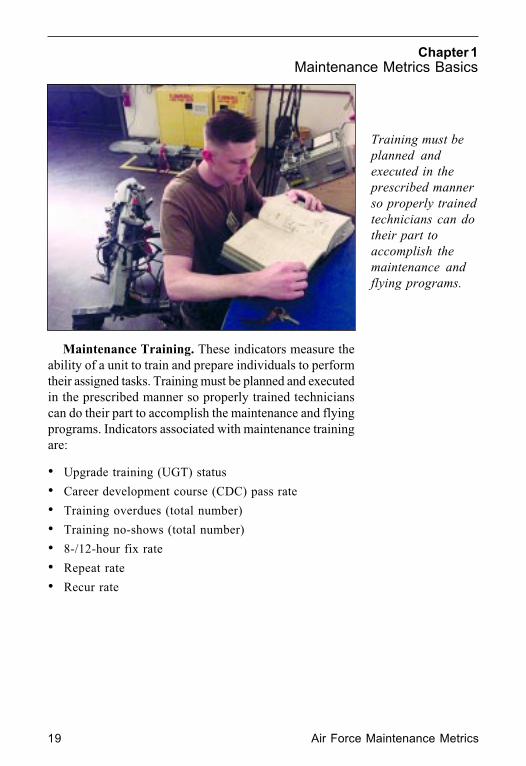
Maintenance Training. These indicators measure the
ability of a unit to train and prepare individuals to perform
their assigned tasks. Training must be planned and executed
in the prescribed manner so properly trained technicians
can do their part to accomplish the maintenance and flying
programs. Indicators associated with maintenance training
are:
• Upgrade training (UGT) status
• Career development course (CDC) pass rate
• Training overdues (total number)
• Training no-shows (total number)
• 8-/12-hour fix rate
• Repeat rate
• Recur rate
Training must be
planned and
executed in the
prescribed manner
so properly trained
technicians can do
their part to
accomplish the
maintenance and
flying programs.

20 Chapter 1 NotesMaintenance Metrics Basics
Air Force Maintenance Metrics21
Chapter 1 NotesMaintenance Metrics Basics

22 Chapter 1 NotesMaintenance Metrics Basics
2323
Special Interest
Key Metrics Table. . . . . . . . . . 25-26
CHAPTERCONTENTS
MaintenanceAnalysts
. . . . . . . . . . . . . 24
Gauging the Unit. . . . . . . . . . . . . 24
Chapter 2Assessing the Health of the Fleet
24 Chapter 2
Assessing the Health of the Fleet
Maintenance
analysts are
trained
statisticians and
investigators.
Their core job is to
analyze raw data,
identify significant
trends and
problem areas, and
present that
information to the
people who can
correct the
deficiencies.
The maintenance analysis section is the key toproviding data analyses and graphical presentationsthat illustrate how well mission requirements are
being met. Its primary responsibility is to show where thepain is. Maintenance analysts are trained statisticians andinvestigators. Their core job is to analyze raw data, identifysignificant trends and problem areas, and present thatinformation to the people who can correct the deficiencies.Most important, they can identify impending problems thatrequire action. Astute leaders charge analysis withinvestigating problems suspected of driving unit
effectiveness.
Maintenance Analysts
The analysts are the focal point for the managementinformation systems (MIS) in the maintenance complex,providing assistance with information availability and dataretrieval. Maintenance analysts are experts on thecapabilities and limitations of the MIS used to collect rawdata from across the maintenance complex (includingdebriefing, maintenance operations center, and productionwork centers). The analysts turn raw data into information(HHQ reports, special studies, and maintenance analysisreferrals) used to evaluate the effectiveness and efficiencyof a unit’s maintenance effort. While some of these productsare devised and used only at the unit level, others aremonitored at higher headquarters. The maintenanceanalysis superintendent can provide an in-depth briefing
on the specific measurements used.
Gauging the Unit
One way to gauge a unit’s performance is to compare itsrates to those of other units Air Force-wide with the sametype aircraft and fleet size. When a unit’s rates are verydifferent from like units, it may indicate problems.Comparing present performance to past performance andcurrent trends to past trends may also reveal insights intothe relative health of a unit.
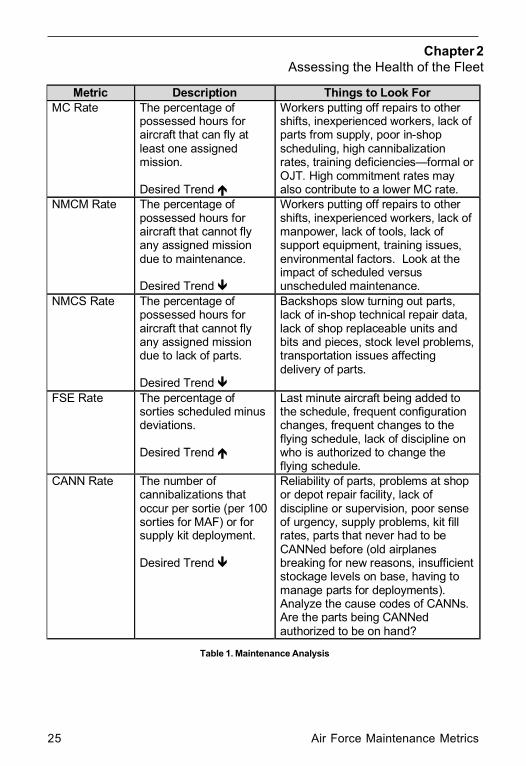
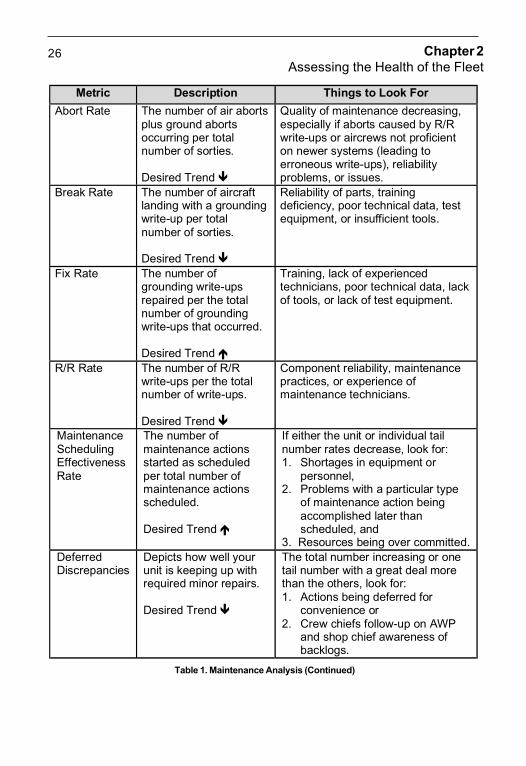
Table 1 identifies some key metrics, provides a briefdescription of that metric with the desired trend, andpresents some things to consider when a unit’s performanceis not meeting the desired trend.
Chapter 2
Assessing the Health of the Fleet
Air Force Maintenance Metrics25
������� ���������� �����������������
�������� ������� ����������������������������������������� ��������������� ������� ��������� �������������� �� �
������������ ����������������������������� ������ ������������������������������������������ ����������� �������� �!���"���� ������������ � ��������� ����#����������$%���&����������� ������������������� ���!�������������������������
'��������� ������� ����������������������������������������� �������� ������� ��������� ����������� �� � ����������������� �� �
������������ ����������������������������� ������ ����������������������� ������������������������������������*���� ������� � ����������� +��� �� ��������������,����������������������������+������� ������������ �� � ����
'��-������ ������� ����������������������������������������� �������� ������� ��������� ���������������������������������� �� �
/��������������� � ��������������������� ������� �����������������������������������!���� ����� ��!����� �����������������+�����!��������� �������� ��������������� ������+�������������
:-;������ ������� ��������������������������� �����+����� ��������������� �� �
,������ �������������!�� ��������������������������*�� ���� ��������� ��� ��������*�� ���� �������������� �������������������������� ��� �������������"�������� ���������� �����������
�<''������ ��� ��!�������� �!���"���� ����������������������=���>??��������������<:@������������������������ ��������������� �� �
�����!�����������������!�������������������������������������������������� ���������+���� �������� ���������� �����������!������������������������������� �+���������!���<''���!������=��������� ���!����� ������ �������� ���� �������� �������������+����� �!������+� ������� �������������������� ��@���< ���"���������������������<''����<�����������!�� ���<''���������"������!��� �� �D�
Table 1. Maintenance Analysis
26 Chapter 2
Assessing the Health of the Fleet
������� ���������� �����������������
<!��������� ��� ��!�����������!������������� ���!������������ ����������� ��!��������������������������� �� �
E������������� �� � ����������� �����������������!������������!���G����������������������� ���������� ��� � �������������=����� ��������� �������������@�������!��������!�����������������
/���������� ��� ��!����������������� �� ������������ �� ������������������� ��!���������������������������� �� �
�����!������������������� � ��������� ����������� �����������������*���� ������� �������� ����������
:�������� ��� ��!���������� �� ������������������������������� ��!���������� �� ������������������������������������� �� �
���� � ����������������� ������� ���� ���������� �������������������������������������������*���� ���
�G������� ��� ��!�������G����������������������� ��!���������������������������� �� �
���� � �������!���������� �� � ���������������������� ��������� �� � ������ ���� ����
��� �� � ���-������ ��;������+� ���������
��� ��!��������� �� � �������� ������������������������������� ��!��������� �� � �������� ������������������������ �� �
K������������ ������� ��+����������� ��!���������������������������L�>�� -��������� ��*���� �����
���� ����N�� P��!�������������������������
������ �� � �������� �!�� ��������������������� ������������ �������
Q�������������!�� ���+��������������
���������������� �����
��������������������� ���������� ����������*�������� ����������������������� �� �
��������� ��!���� ������ ������ ������� ��!��������������������������� �������������������L�>�� <���� ��!�� ���������������
�� +� �� ������N�� ��������������������� �<�P�
� ��������������� �������!���������
Table 1. Maintenance Analysis (Continued)
Chapter 2 Notes
Assessing the Health of the Fleet
Air Force Maintenance Metrics27

28 Chapter 2 Notes
Assessing the Health of the Fleet
2929
Special Interest
Maintenance MetricsFormula Index
. . . . . . . . . . . . . 30
CHAPTERCONTENTS
Flying-RelatedMetrics
. . . . . . . . . . . . . 31
Maintenance-RelatedMetrics
. . . . . . . . . . . . . 37
Supply-RelatedMetrics
. . . . . . . . . . . . . 44
Shop-RelatedMetrics
. . . . . . . . . . . . . 46
Training-RelatedMetrics
. . . . . . . . . . . . . 49
AMC-Only Metrics. . . . . . . . . . . . . 51
Chapter 3The Metrics
30 Chapter 3
The Metrics
Maintenance Metrics Formula Index
Flying Related
FSE Rate (Leading) .....................................................32Flying Schedule Deviations ........................................32FCF Release Rate ........................................................33ASD..............................................................................33Average Number of Aircraft Possessed ........................34Sortie UTE Rate (Lagging) ..........................................35Hourly UTE Rate (Lagging) ........................................35Total Abort Rate ..........................................................36
Code 3 Break Rate (Leading) ......................................37
Maintenance Related
FMC Rate (Lagging) ...................................................37PMC Rate ....................................................................37MC Rate (Lagging) .....................................................38TNMCM Rate (Lagging) .............................................39TNMCS Rate (Lagging) ..............................................40R/R Rate (Leading) .....................................................40Eight- and Twelve-Hour Fix Rates (Leading) .............41MSE Rate (Leading) ....................................................42DD Rate (Leading) ......................................................42Phase Flow ...................................................................43
CANN Rate (Lagging) .................................................44
Supply Related
Issue Effectiveness Rate ..............................................44Stockage Effectiveness Rate .......................................45Total Repair Cycle Time .............................................45
Average Repair Cycle Time by Segments ..................46
Shop Related
EW Pod MC Rate ........................................................47EW Pods Weekly AWP Rate .......................................47LANTIRN MC Rate .....................................................47
LANTIRN Test Station MC Status ..............................48
Air Mobility Command-Only Related
Logistics Departure Reliability ...................................51Worldwide Logistics Departure Reliability ................52Home-Station Logistics Departure Reliability ...........52En Route Logistics Departure Reliability ..................52First Station After Home-Station Logistics
Departure Reliability ................................................52
Chapter 3
The Metrics
Air Force Maintenance Metrics31
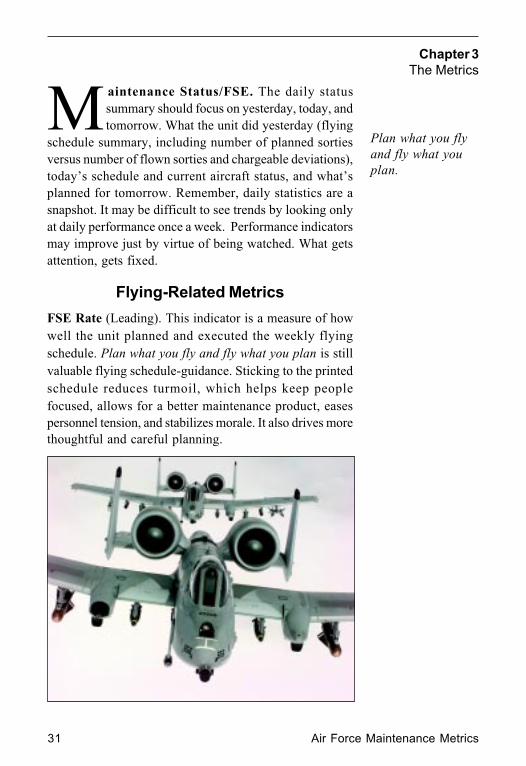
Maintenance Status/FSE. The daily status
summary should focus on yesterday, today, and
tomorrow. What the unit did yesterday (flying
schedule summary, including number of planned sorties
versus number of flown sorties and chargeable deviations),
today’s schedule and current aircraft status, and what’s
planned for tomorrow. Remember, daily statistics are a
snapshot. It may be difficult to see trends by looking only
at daily performance once a week. Performance indicators
may improve just by virtue of being watched. What gets
attention, gets fixed.
Flying-Related Metrics
FSE Rate (Leading). This indicator is a measure of how
well the unit planned and executed the weekly flying
schedule. Plan what you fly and fly what you plan is still
valuable flying schedule-guidance. Sticking to the printed
schedule reduces turmoil, which helps keep people
focused, allows for a better maintenance product, eases
personnel tension, and stabilizes morale. It also drives more
thoughtful and careful planning.
Plan what you fly
and fly what you
plan.
32 Chapter 3
The Metrics
Adjusted Sorties Scheduled – Chargeable DeviationsAdjusted Sorties Scheduled
Formula 1. Flying Scheduling Effectiveness Rate
x 100
x 100Maintenance Rate = Maintenance DeviationsTotal Sorties Scheduled
x 100Operations Rate = Operations DeviationsTotal Sorties Scheduled
Formula 2. Flying Schedule Deviations
A high FSE rate indicates the unit has planned well and
executed the schedule. A low FSE rate may indicate
needless turbulence; however, not all turbulence is bad.
When intentionally introduced to avoid additional
turbulence later, it is smart management. Otherwise, it is
nothing but added pain for the unit. It is all too easy to get
drawn into operations requirements versus maintenance
capabilities when looking at causes of turbulence. The
mission is priority number one all the time, but firm
scheduling discipline is a must for effective operations.
When the rate is low, leaders must search for
opportunities to plan more carefully or stick to the current
plan. Review chargeable deviations (situations generally
within a unit’s control) because they cause FSE to decrease.
Ground aborts are the primary driver. A high commitment
rate may also be influencing FSE. Have HHQ/TACC
taskings caused a surge period? The FSE rate is a valuable
indicator because it takes into account total unit
performance. Some of the factors affecting FSE rates are
timely aircraft preparation and repair, quality of
maintenance, sense of urgency, crew-show discipline,
avoidance of early and late takeoffs, and flexibility when
unplanned events arise.
Flying Schedule Deviations. These are reasons why an
aircraft didn’t fly a sortie as scheduled and are recorded as
chargeable or nonchargeable for activity causing deviation
(operations, logistics, air traffic control, weather, higher
headquarters, and so forth).
A high FSE rate
indicates the unit
has planned well
and executed the
schedule. A low
FSE rate may
indicate needless
turbulence. The
FSE rate is a
valuable indicator
because it takes
into account total
unit performance.
Chapter 3
The Metrics
Air Force Maintenance Metrics33
FCF Release Rate. This indicator is tied directly to
completeness of troubleshooting and thoroughness of
repair procedures. FCF is a closely managed program. Every
effort should be made to ensure qualified technicians and
supervisors do the work and work review on FCF aircraft.
If an aircraft fails to release from an FCF and repeats for the
same problem, the maintenance manager must take serious
actions.
ASD. This is the average time an aircraft stays airborne
during an individual sortie. This number is normally
computed monthly but can be done weekly. The
computation is straightforward: total hours flown divided
by total sorties flown.
PAI. This inventory shows the number of aircraft assigned
to meet primary aircraft authorization. A low PAI possessed
forces a higher real UTE rate on fewer aircraft, possibly
compromising two key areas: scheduled maintenance and
deferred discrepancies (DD). Look for higher R/R rates.
Break rates may increase, and the fix rate may suffer as well.
If an aircraft fails
to release from an
FCF and repeats
for the same
problem, the
maintenance
manager must take
serious actions.
Number of FCFs ReleasedNumber of FCFs Attempted
x 100
Formula 3. FCF Release Rate
34 Chapter 3
The Metrics
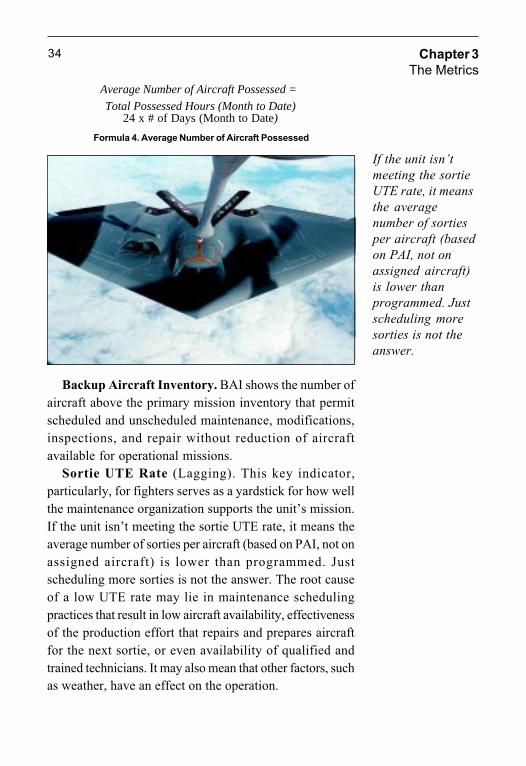
Total Possessed Hours (Month to Date)24 x # of Days (Month to Date)
Average Number of Aircraft Possessed =
Formula 4. Average Number of Aircraft Possessed
Backup Aircraft Inventory. BAI shows the number of
aircraft above the primary mission inventory that permit
scheduled and unscheduled maintenance, modifications,
inspections, and repair without reduction of aircraft
available for operational missions.
Sortie UTE Rate (Lagging). This key indicator,
particularly, for fighters serves as a yardstick for how well
the maintenance organization supports the unit’s mission.
If the unit isn’t meeting the sortie UTE rate, it means the
average number of sorties per aircraft (based on PAI, not on
assigned aircraft) is lower than programmed. Just
scheduling more sorties is not the answer. The root cause
of a low UTE rate may lie in maintenance scheduling
practices that result in low aircraft availability, effectiveness
of the production effort that repairs and prepares aircraft
for the next sortie, or even availability of qualified and
trained technicians. It may also mean that other factors, such
as weather, have an effect on the operation.
If the unit isn’t
meeting the sortie
UTE rate, it means
the average
number of sorties
per aircraft (based
on PAI, not on
assigned aircraft)
is lower than
programmed. Just
scheduling more
sorties is not the
answer.
Chapter 3
The Metrics
Air Force Maintenance Metrics35
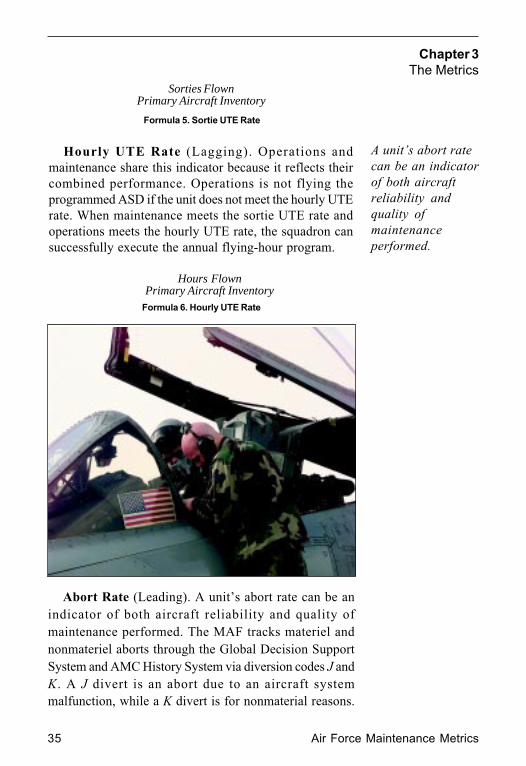
Sorties FlownPrimary Aircraft Inventory
Formula 5. Sortie UTE Rate
Hours FlownPrimary Aircraft Inventory
Formula 6. Hourly UTE Rate
Hourly UTE Rate (Lagging). Operations and
maintenance share this indicator because it reflects their
combined performance. Operations is not flying the
programmed ASD if the unit does not meet the hourly UTE
rate. When maintenance meets the sortie UTE rate and
operations meets the hourly UTE rate, the squadron can
successfully execute the annual flying-hour program.
Abort Rate (Leading). A unit’s abort rate can be an
indicator of both aircraft reliability and quality of
maintenance performed. The MAF tracks materiel and
nonmateriel aborts through the Global Decision Support
System and AMC History System via diversion codes J and
K. A J divert is an abort due to an aircraft system
malfunction, while a K divert is for nonmaterial reasons.
A unit’s abort rate
can be an indicator
of both aircraft
reliability and
quality of
maintenance
performed.
36 Chapter 3
The Metrics
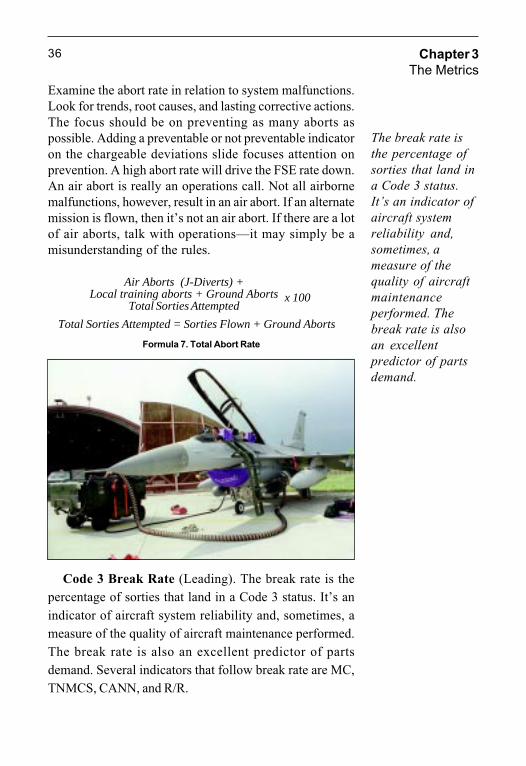
Formula 7. Total Abort Rate
Total Sorties Attempted = Sorties Flown + Ground Aborts
Air Aborts (J-Diverts) +Local training aborts + Ground Aborts
Total Sorties Attemptedx 100
Examine the abort rate in relation to system malfunctions.
Look for trends, root causes, and lasting corrective actions.
The focus should be on preventing as many aborts as
possible. Adding a preventable or not preventable indicator
on the chargeable deviations slide focuses attention on
prevention. A high abort rate will drive the FSE rate down.
An air abort is really an operations call. Not all airborne
malfunctions, however, result in an air abort. If an alternate
mission is flown, then it’s not an air abort. If there are a lot
of air aborts, talk with operations—it may simply be a
misunderstanding of the rules.
Code 3 Break Rate (Leading). The break rate is the
percentage of sorties that land in a Code 3 status. It’s an
indicator of aircraft system reliability and, sometimes, a
measure of the quality of aircraft maintenance performed.
The break rate is also an excellent predictor of parts
demand. Several indicators that follow break rate are MC,
TNMCS, CANN, and R/R.
The break rate is
the percentage of
sorties that land in
a Code 3 status.
It’s an indicator of
aircraft system
reliability and,
sometimes, a
measure of the
quality of aircraft
maintenance
performed. The
break rate is also
an excellent
predictor of parts
demand.
Chapter 3
The Metrics
Air Force Maintenance Metrics37
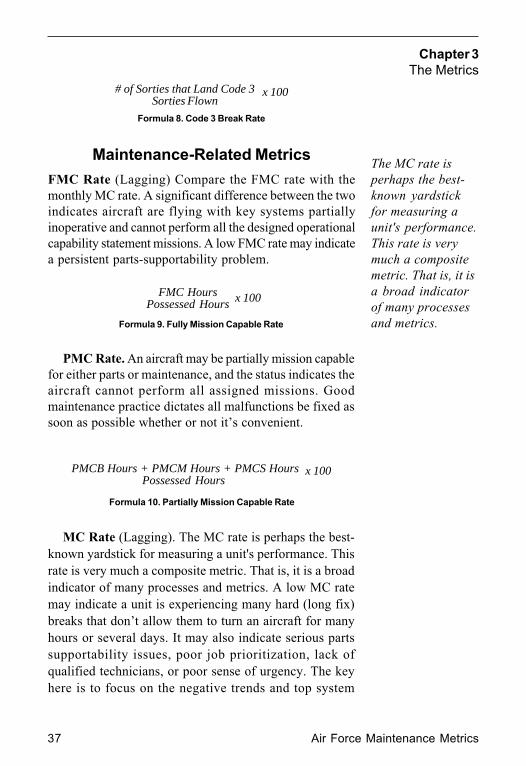
Formula 8. Code 3 Break Rate
# of Sorties that Land Code 3Sorties Flown
x 100
PMCB Hours + PMCM Hours + PMCS HoursPossessed Hours
x 100
Formula 10. Partially Mission Capable Rate
Formula 9. Fully Mission Capable Rate
FMC HoursPossessed Hours x 100
Maintenance-Related Metrics
FMC Rate (Lagging) Compare the FMC rate with the
monthly MC rate. A significant difference between the two
indicates aircraft are flying with key systems partially
inoperative and cannot perform all the designed operational
capability statement missions. A low FMC rate may indicate
a persistent parts-supportability problem.
PMC Rate. An aircraft may be partially mission capable
for either parts or maintenance, and the status indicates the
aircraft cannot perform all assigned missions. Good
maintenance practice dictates all malfunctions be fixed as
soon as possible whether or not it’s convenient.
MC Rate (Lagging). The MC rate is perhaps the best-
known yardstick for measuring a unit's performance. This
rate is very much a composite metric. That is, it is a broad
indicator of many processes and metrics. A low MC rate
may indicate a unit is experiencing many hard (long fix)
breaks that don’t allow them to turn an aircraft for many
hours or several days. It may also indicate serious parts
supportability issues, poor job prioritization, lack of
qualified technicians, or poor sense of urgency. The key
here is to focus on the negative trends and top system
The MC rate is
perhaps the best-
known yardstick
for measuring a
unit's performance.
This rate is very
much a composite
metric. That is, it is
a broad indicator
of many processes
and metrics.
38 Chapter 3
The Metrics
FMC Hours + PMCB Hours + PMCM Hours +PMCS Hours
Possessed Hoursx 100
Formula 11. Mission Capable Rate
problems that lower the MC rate. Examining the 8-hour
(fighter) or 12-hour (all other aircraft) fix rates may provide
clues to a low MC rate, but be careful here—the message
units should hear from leadership is, fixing aircraft well is
more important than fixing aircraft fast. Positive trends for
a well-managed fix rate will indicate good management.
Fixes on some systems predictably take longer than 8 or
12 hours. Exceeding this mark is not necessarily indicative
of poor maintenance. However, a unit with poor
production problems may consistently exceed 8-/12-hour
fixes in a wide variety of systems.
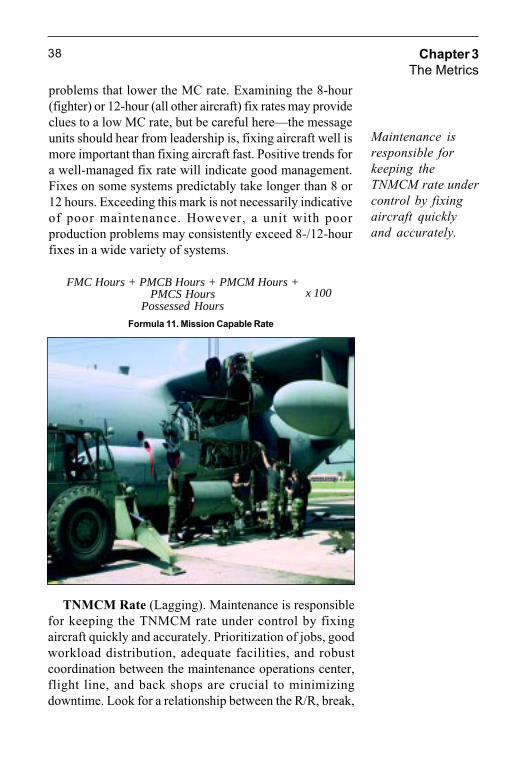
TNMCM Rate (Lagging). Maintenance is responsible
for keeping the TNMCM rate under control by fixing
aircraft quickly and accurately. Prioritization of jobs, good
workload distribution, adequate facilities, and robust
coordination between the maintenance operations center,
flight line, and back shops are crucial to minimizing
downtime. Look for a relationship between the R/R, break,
Maintenance is
responsible for
keeping the
TNMCM rate under
control by fixing
aircraft quickly
and accurately.
Chapter 3
The Metrics
Air Force Maintenance Metrics39
and fix rates to NMCM. A strong correlation could indicate
heavy workloads (people are overtasked), poor
management, training problems, or poor maintenance
practices. Usually, if the TNMCM rate is too high, these
other rates also indicate problems. The key is to be alert.
When one is bad, automatically look at the others.
NMCM Hours + NMCB HoursPossessed Hours x 100
Formula 12. TNMCM Rate
TNMCS Rate (Lagging). TNMCS is driven principally
by spare parts availability. However, maintenance can keep
the rate lower by consolidating feasible CANNs to as few
aircraft as practical. TNMCS is based on the number of
airframes out for parts, instead of the number of parts that
are MICAP. It does not take long to see the link between
the CANN rate and TNMCS rate. The best situation is for
both rates to be as low as possible. Another word of caution
here—TNMCS should not be held low at the expense of
increased CANN actions. Maintenance should not be
driven to make undesirable CANNs (those that may be labor
intensive or risk damaging the good part) just to keep the
TNMCS rate low. Maintainers will let leaders know what
they think if pressed to CANN a part that’s not feasible just
to consolidate all MICAPs on one aircraft. An easy mistake
is just looking at the few components eating up huge chunks
of time. Usually these are hard-to-obtain items across the
Air Force or involve heavy maintenance. They are obvious,
but little can be done about them. Try focusing on the items
getting a lot of hits. They may be easy to get, but why are
so many being ordered? Is the base-stockage level high
enough? Is there a trend or reason why so many need to be
ordered in the first place? Another facet is the amount of
time lost due to parts in transit. Are the parts easy to procure
but sitting on pallets at some port? Are the folks on base
getting the old parts turned in? Could the part be fixed on
base, even though the current guidance says send it back
to the depot; can the status quo be challenged?
Maintainers will
let leaders know
what they think if
pressed to CANN a
part that’s not
feasible just to
consolidate all
MICAPs on one
aircraft. An easy
mistake is just
looking at the few
components eating
up huge chunks of
time. Usually these
are hard-to-obtain
items across the Air
Force or involve
heavy
maintenance.
40 Chapter 3
The Metrics
R/R Rate (Leading). R/R is perhaps the most important
and accurate measure of the quality of maintenance
performed in a unit. A repeat discrepancy is one occurring
on the same system or subsystem on the first sortie or sortie
attempt after originally reported. A recurring discrepancy
occurs on the second through fourth sortie or attempted
sortie after the original occurrence. A unit’s goal should be
no R/Rs. A high R/R rate may indicate lack of thorough
troubleshooting; inordinate pressure to commit aircraft to
the flying schedule for subsequent sorties; or a lack of
experienced, qualified, or trained technicians. Examine
each R/R discrepancy and seek root causes and lasting fixes.
Totals Repeats + Total RecursTotal Pilot Reported Discrepancies x 100
Formula 14. R/R Rate
x 100# of Code 3 Breaks Fixed within 8 or 12 Hours After Landing
Total Code 3 BreaksFormula 15. Eight-Hour (Fighter) or
12-Hour (other Aircraft) Fix Rate
NMCS Hours + NMCB HoursPossessed Hours x 100
Formula 13. TNMCS Rate
Eight- and Twelve-Hour Fix Rates (Leading). This
indicator shows how well the repair process is being
managed. Occasionally, some repairs, just by their nature,
exceed the standard timeframe. However, all repairs
exceeding the standard time should be reviewed.
Eight-Hour Fix Rate. The cumulative percentage of
Code 3 aircraft breaks recovered within 8 hours of landing.
This interval is used for fighter aircraft.
Twelve-Hour Fix Rate. The cumulative percentage of
aircraft breaks recovered within 12 hours of landing. This
interval is reported for all aircraft other than fighter aircraft.
Chapter 3
The Metrics
Air Force Maintenance Metrics41
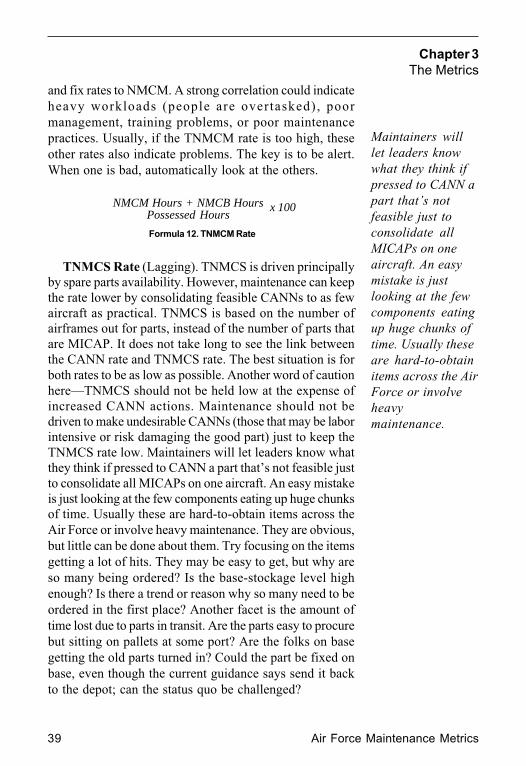
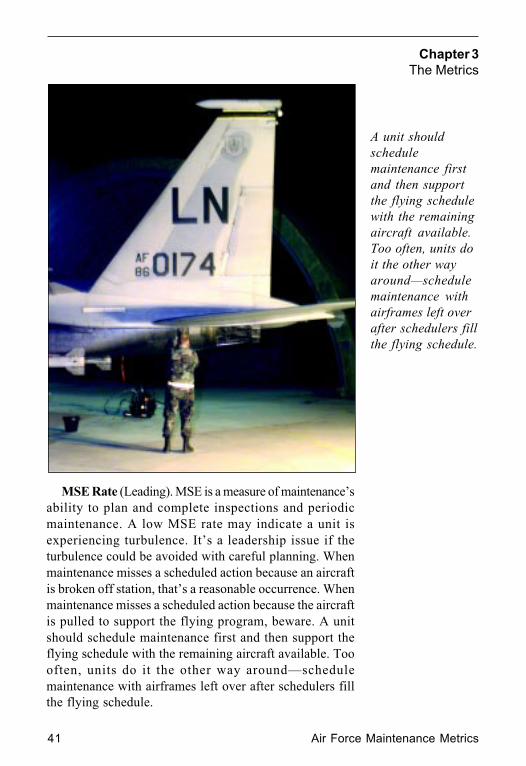
MSE Rate (Leading). MSE is a measure of maintenance’s
ability to plan and complete inspections and periodic
maintenance. A low MSE rate may indicate a unit is
experiencing turbulence. It’s a leadership issue if the
turbulence could be avoided with careful planning. When
maintenance misses a scheduled action because an aircraft
is broken off station, that’s a reasonable occurrence. When
maintenance misses a scheduled action because the aircraft
is pulled to support the flying program, beware. A unit
should schedule maintenance first and then support the
flying schedule with the remaining aircraft available. Too
often, units do it the other way around—schedule
maintenance with airframes left over after schedulers fill
the flying schedule.
A unit should
schedule
maintenance first
and then support
the flying schedule
with the remaining
aircraft available.
Too often, units do
it the other way
around—schedule
maintenance with
airframes left over
after schedulers fill
the flying schedule.
42 Chapter 3
The Metrics
Number of CompletedScheduled Maintenance Actions
Number of MaintenanceActions Scheduled
MaintenanceSchedulingEffectiveness
x 100=
Formula 16. MSE Rate
DD Rate (Leading). Sometimes minor maintenance
actions must be deferred to a more opportune time. DDs
fall into two categories—AWM and AWP. Many deferred
actions appropriately wait until a scheduled event like
phase. Supply should maintain an aggressive follow-up
program to keep visibility on those parts ordered for AWP
deferred discrepancies. Maintenance should try to keep the
AWM rate as low as possible. If a discrepancy doesn’t need
to be scheduled with a more extensive maintenance action,
maintenance schedulers can schedule an aircraft down for
a day to work deferred discrepancies.
Monthly Rates: Each Monday morning, analysts take asnapshot of each reportable MDS, of the total number ofdeferred discrepancies, for both maintenance and supply,for the previous workweek. The following calculations areapplied to the "snapshot" information.
Units use the following formulas to determine thecumulative monthly rates. At least four weekly rates mustbe used to calculate the cumulative monthly rate.
Total AWM(Snapshot) Discrepancies
Average Aircraft PossessedAWM =
AWP =Total AWP
(Snapshot) DiscrepanciesAverage Aircraft Possessed
MonthlyAWM Rate =
AWM (Week 1) + AWM (Week 2) +AWM (Week 3) + AWM (Week 4)
Number of SamplesFormula 17. DD Rate
Chapter 3
The Metrics
Air Force Maintenance Metrics43
AWP (Week 1) + AWP (Week 2) +AWP (Week 3) + AWP (Week 4)
Number of Samples
MonthlyAWP Rate =
Formula 17. DD Rate (Continued)
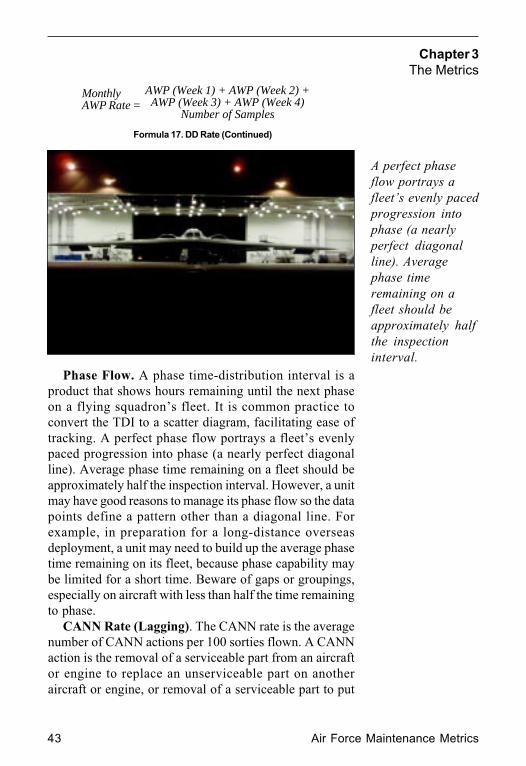
Phase Flow. A phase time-distribution interval is a
product that shows hours remaining until the next phase
on a flying squadron’s fleet. It is common practice to
convert the TDI to a scatter diagram, facilitating ease of
tracking. A perfect phase flow portrays a fleet’s evenly
paced progression into phase (a nearly perfect diagonal
line). Average phase time remaining on a fleet should be
approximately half the inspection interval. However, a unit
may have good reasons to manage its phase flow so the data
points define a pattern other than a diagonal line. For
example, in preparation for a long-distance overseas
deployment, a unit may need to build up the average phase
time remaining on its fleet, because phase capability may
be limited for a short time. Beware of gaps or groupings,
especially on aircraft with less than half the time remaining
to phase.
CANN Rate (Lagging). The CANN rate is the average
number of CANN actions per 100 sorties flown. A CANN
action is the removal of a serviceable part from an aircraft
or engine to replace an unserviceable part on another
aircraft or engine, or removal of a serviceable part to put
A perfect phase
flow portrays a
fleet’s evenly paced
progression into
phase (a nearly
perfect diagonal
line). Average
phase time
remaining on a
fleet should be
approximately half
the inspection
interval.
44 Chapter 3
The Metrics
(Number of Aircraft-to-Aircraft CANNs)+(Number of Engine-to-Aircraft CANNs)
Total Sorties FlownCANN Rate = x 100
Formula 18. CANN Rate
into a readiness spares package for deployments. This rate
includes all aircraft-to-aircraft and engine-to-aircraft CANN
actions. The measurement is used in conjunction with the
supply issue effectiveness rate. In most cases, a CANN
action takes place when base supply cannot deliver the part
when needed and mission requirements demand the aircraft
be returned to an MC status. Since supply relies on the
depot for replenishment, this indicator can also be used, in
part, to indicate depot support.
Supply-Related Metrics
Issue Effectiveness Rate. This is the percentage of customer
requests that were filled by items in the inventory. Issue
effectiveness is based on filling any request, not just
requests for items supply is authorized to stock. It is used
to measure how well the logistics customer is supported
by supply. Issue effectiveness is usually lower than
stockage effectiveness, but it is more representative of a
supply customer’s view of supply support.
Stockage Effectiveness Rate. This is the percentage of
customer requests filled by items supply is authorized to
stock. The significant difference between issue and
stockage effectiveness is that stockage effectiveness uses
only those back orders for items supply is authorized to
stock. It measures how well the logistics customer is
supported by base supply and depot replenishment. This
is especially important since supply cannot possibly stock
every possible part. It is funded to stock only the most used
Issue effectiveness
is usually lower
than stockage
effectiveness, but it
is more
representative of a
supply customer’s
view of supply
support. The
significant
difference between
issue and stockage
effectiveness is that
stockage
effectiveness uses
only those back
orders for items
supply is
authorized to stock.
Formula 19. Issue Effectiveness Rate
IssuesIssues + All Back OrdersIssue Effectiveness Rate = x 100
Chapter 3
The Metrics
Air Force Maintenance Metrics45
Formula 20. Stockage Effectiveness Rate
IssuesIssues + All Back Orders –
4W Back OrdersStockage Effectiveness Rate = x 100
or critical parts. A high stockage-effectiveness rate means
success in anticipation of customer needs.
Formula 21. Total Repair Cycle Time
Pre-maintenance Days + Repair Days +Post-maintenance Days – AWP Days
Number of Items Turned InRepair Cycle Time =
Total Repair Cycle Time. This is the average time, in
days, an unserviceable asset spends in the repair cycle at a
unit. This indicator is for aircraft only. It does not include
engines or support equipment. The clock begins when
maintenance orders a repair cycle asset from supply and
ends when a like asset (serviceable or unserviceable) is
turned in to supply. The time the item is awaiting parts in
the repair shop is not included. This indicator is primarily
a local management tool. To improve the process of
repairing parts, the different steps in that process must be
measured. This indicator and its components provide this
capability.
Total repair cycle
time is for aircraft
only. It does not
include engines or
support equipment.
46 Chapter 3
The Metrics
Formula 22. Average Repair Cycle Time
Total Repair Cycle Time = Pre-Maintenance Days +Repair days + Post-Maintenance Days
Total Number of Days in Pre-Maintenance
Total Number of Items Repaired
Total Number of Daysin Repair–AWP days
Total Number ofItems Repaired
Total Number of Days in Post Maintenance
Total Number ofItems Repaired
Pre-Maintenance Time =
Repair Time =
Post-Maintenance Time =
Average Repair Cycle Time by Segments (Buckets of
Time). This is a more detailed look at the total repair cycle
days. The total repair cycle is broken into three segments:
• Pre—the time a serviceable part is issued from supply
until the broken part is received by the backshop for
repair.
• Repair—the time a part remains in the shop until repaired,
minus time spent AWP.
• Post—the time it takes for the repaired part to be turned
back to supply.
The sum of the three steps above equals the total repair
cycle time. It measures the efficiency of the three major steps
in a unit’s repair cycle.
Shop-Related Metrics
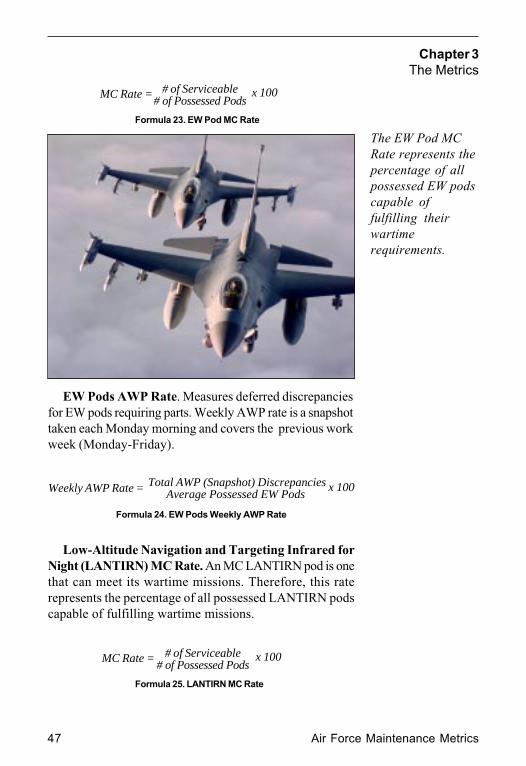
Electronic Warfare (EW) Pod MC Rate. An MC EW pod
is one that can meet its wartime missions. Therefore, this
rate represents the percentage of all possessed EW pods
capable of fulfilling their wartime requirements.
Chapter 3
The Metrics
Air Force Maintenance Metrics47
Formula 25. LANTIRN MC Rate
# of Serviceable# of Possessed PodsMC Rate = x 100
Formula 24. EW Pods Weekly AWP Rate
Total AWP (Snapshot) DiscrepanciesAverage Possessed EW PodsWeekly AWP Rate = x 100
EW Pods AWP Rate. Measures deferred discrepancies
for EW pods requiring parts. Weekly AWP rate is a snapshot
taken each Monday morning and covers the previous work
week (Monday-Friday).
Low-Altitude Navigation and Targeting Infrared for
Night (LANTIRN) MC Rate. An MC LANTIRN pod is one
that can meet its wartime missions. Therefore, this rate
represents the percentage of all possessed LANTIRN pods
capable of fulfilling wartime missions.
The EW Pod MC
Rate represents the
percentage of all
possessed EW pods
capable of
fulfilling their
wartime
requirements.
Formula 23. EW Pod MC Rate
# of Serviceable# of Possessed PodsMC Rate = x 100
48 Chapter 3
The Metrics
LANTIRN Test Station MC Status. LANTIRN test
station capability is computed by calculating the ability
of the shelter test equipment to bench check the 16 testable
line-replaceable units, including LANTIRN intermediate
automatic test equipment (LIATE), radio frequency
automatic and electro-optical test set, power supply test set
(PSTS), and the environmental control unit test set
(ECUTS). The condition of the external support equipment
(cooling and servicing unit, 400Hz frequency converter,
and fluid-conditioning unit) is also tracked.
• LANTIRN LIATE—ten-unit test capability
Example: 40 percent MC = 4/10 units testable
• Power PSTS—four-unit test capability
Example: 75 percent MC = 3/4 units testable
• ECUTS—two-unit test capability
Example: 50 percent =1/2 units testable
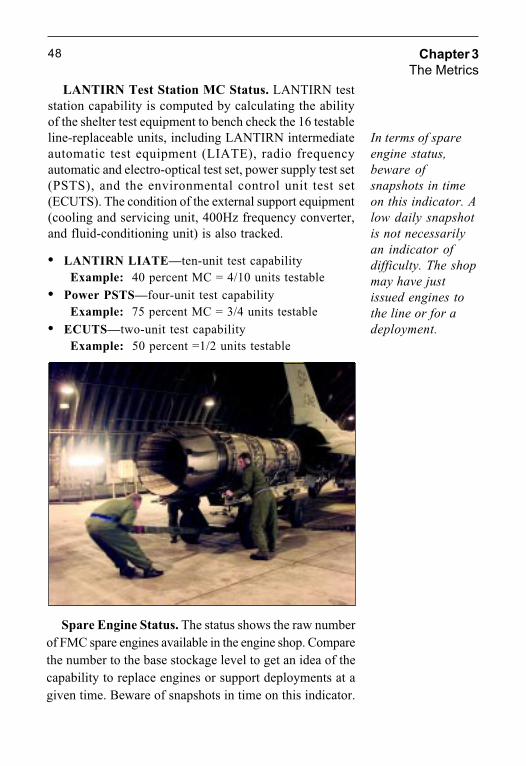
Spare Engine Status. The status shows the raw number
of FMC spare engines available in the engine shop. Compare
the number to the base stockage level to get an idea of the
capability to replace engines or support deployments at a
given time. Beware of snapshots in time on this indicator.
In terms of spare
engine status,
beware of
snapshots in time
on this indicator. A
low daily snapshot
is not necessarily
an indicator of
difficulty. The shop
may have just
issued engines to
the line or for a
deployment.
Chapter 3
The Metrics
Air Force Maintenance Metrics49
A low daily snapshot is not necessarily an indicator of
difficulty. The shop may have just issued engines to the
line or for a deployment. The engine shop should show the
annual trend line with war-reserve engine levels by month
for the previous year. A particular month’s data point not
shown in association with the previous year’s trend is not
useful. Engines NMCS and engines NMCM are objective
measures rating the health of engine parts supportability
and the engine repair line.
Training-Related Metrics
Several indicators are useful to show the health of the
maintenance training process. The following key
indicators are available in a monthly status-of-training
presentation the maintenance training organization
develops and the logistics group (LG) and operations group
(OG) review.
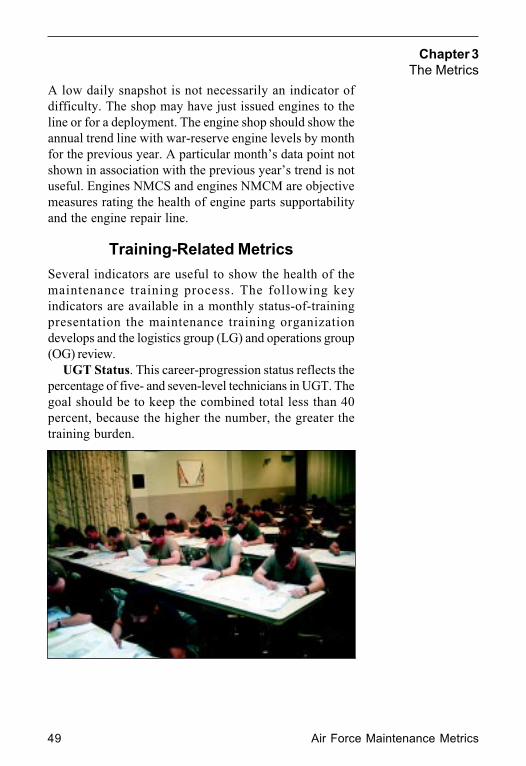
UGT Status. This career-progression status reflects the
percentage of five- and seven-level technicians in UGT. The
goal should be to keep the combined total less than 40
percent, because the higher the number, the greater the
training burden.
50 Chapter 3
The Metrics
CDC Pass Rate. CDC pass rate is the percent of people
who pass their end-of-course tests. The goal is 95 percent;
first and second fail percentages are also available.
Training Overdues. This indicator tracks the
percentage of overdue training actions. The goal is to
maintain this indicator at less than 5 percent. Training
overdues are frequently a measure of readiness, as this
measure considers wartime skills, such as M-16 and
chemical warfare defense-equipment training. Excessive
overdues may indicate a force that feels they only have
time for the day-to-day mission and don’t have time to
train.
Training No-Shows. This indicator tracks the number
of scheduled training events versus the number of events
actually attended. The desired number of no-shows is zero.
Every effort should be made to ensure individuals receive
training once they are scheduled.
Other Indicators. As mentioned earlier in the
handbook, some aircraft indicators, such as 8- and 12-hour
fix rates or R/R, may also indicate training problems.
Chapter 3
The Metrics
Air Force Maintenance Metrics51
AMC-Only Metrics
Logistics Departure Reliability. This provides the percentof departures that are delayed because of supply, saturation,or maintenance problems.1 AMCI 10-202, Volume 6,Mission Reliability Reporting System, provides criteria fordelay-code assignment. It also provides the commanderwith an objective measure of the health of the air mobilitysystem and reflects the percentage of departures that areon time. On time refers to the standard for departurescontained within the Air Mobility Master Plan—thosewithin 14 minutes of the scheduled departure time. Themain focus of departure reliability is to strengthen the airmobility system through accountability for process
improvement.
Local training
missions that do
not support an
external customer
are excluded
because there are
no requirements
for the units to
report delays for
organically
planned and
executed missions.
AMCI 10-202,
Volume 6, Mission
Reliability
Reporting System,
provides criteria
for logistics delay-
code assignment.
AMC Formula 1. Logistics Departure Reliability
# of Departures – # of Logistics Delays# of Departures x 100
Worldwide Logistics Departure Reliability.
Essentially this is the same as Logistics Departure
Reliability. It provides the percent of total departures that
are delayed for supply, saturation, or maintenance
problems.1
52 Chapter 3
The Metrics
AMC Formulas 2 -
4 are all new. They
will be
incorporated into
the new AMC
supplement to AFI
21-101,
Maintenance
Management of
Aircraft.
Home-Station Logistics Departure Reliability. This
delineates down to only first-leg departures of unit-owned
aircraft departing home station.1
En Route Logistics Departure Reliability. This is any
second or subsequent leg departure of a mission.1
First Station After Home-Station Departure
Reliability. This captures only second-leg departures when
the second leg originates from a base other than the home
station from which the first leg departed.1
AMC Notes
1. Local training missions that do not support an external customer
are excluded because there are no requirements for the units to
report delays for organically planned and executed missions.
AMC Formula 2. Worldwide Logistics Departure Reliability
# of Departures – # of Logistics Delays# of Departures x 100
AMC Formula 3. Home-Station Logistics Departure Reliability
*Home-station departure = Unit-Owned (first leg of mission) Departure.**Home-station logistics delays that occur on the first leg of mission only.
# of Home-Station Departures* –# of Home-Station* Logistics Delays**
# of Home-Station Departures* x 100
AMC Formula 4. En Route Logistics Departure Reliability
*En route departure = second or subsequent leg of the mission.**En route logistics delays that occur on the second or subsequent leg of themission.
# of En Route Departures* –# of En Route* Logistics Delays**
# En Route Departures* x 100
AMC Formula 5. First Station After Home-Station
Logistics Departure Reliability
*First station after home-station departure = second leg of mission only.**First station after home-station delays that occur on the second leg of themission only.
# of First Station After Home-Station Departures* –# of First Station After Home-Station* Logistics Delays**
# First Station After Home-Station Departures*x 100

Chapter 3 Notes
The Metrics
Air Force Maintenance Metrics53

54 Chapter 3 Notes
The Metrics
Chapter 3 Notes
The Metrics
Air Force Maintenance Metrics55

56 Chapter 3 Notes
The Metrics

5757
Special Interest
Break Rates. . . . . . . . . . . . . 64
Abort Rates. . . . . . . . . . . . . 64
CANN Rates. . . . . . . . . . . . . 65
CHAPTERCONTENTS
Analytical Process. . . . . . . . . . . . . 58
MaintenanceContribution to theAnalytical Process. . . . . . . . . . . . . 58
MaintenanceAnalysis Referrals. . . . . . . . . . . . . 60
Functions ofDeficiency Analysis. . . . . . . . . . . . . 60
Chapter 4Helpful Hints for Data Investigation

58 Chapter 4
Helpful Hints for Data Investigation
Analytical Process
The analytical process consists of identifying contributory
factors, manipulating raw data into meaningful formats;
computing management indicators; performing statistical
measurements; and creating accurate, complete, and easy-
to-understand presentations. An analytical process uses a
number of methods—for example, visual observation
dependent upon the observer’s experience and knowledge
and statistically or visually performed comparative
analysis—and involves the comparison of two or more like
operations or items to identify variations or differences.
Statistical analysis and statistical investigation are the
methodical study of data. These methods are used to reveal
facts, relationships, and differences about data and data
elements and are a useful adjunct to comparative and visual
analysis. Analysts should use these tools and other methods
to perform analytical studies to gain insight into unit
performance and enhance process improvement.
AFSC 2R0X1 CDC is a good source of statistical and
analytical techniques, and the maintenance data analysis
section (MDAS) maintains a current copy of the five- and
seven-level CDC for reference.
Management Contributions to
the Analytical Process
Operations and logistics leaders have a significant impact
on the usefulness of the MDAS. By challenging the MDAS
with analyzing problems, they foster the in-depth training
of the analysts and help the unit.
When leaders have a hunch or a specific agenda, it is
almost always better that they spell out what they think is
going on or what they would like to see, if it can be done.
Asking analysis for specific information or data is perfectly
legitimate but fails to recognize just how much more it can
provide. If analysis knows what the agenda is, it is far better
prepared to use all the tools at its disposal to uncover or
present all the pertinent analyses.
When leaders have
a hunch or a
specific agenda, it
is almost always
better that they
spell out what they
think is going on or
what they would
like to see, if it can
be done. Asking
analysis for
specific
information or
data is perfectly
legitimate but fails
to recognize just
how much more it
can provide.
Chapter 4
Helpful Hints for Data Investigation
Air Force Maintenance Metrics59
Never let analysts just hand over raw data sheets; that is
bean counting. Good analysts will always try, situation
permitting, to provide a bottom-line narrative. The leader
should not have to analyze the data; that is the analyst’s
job. It is easy to miscommunicate what is really wanted or
how it is to be presented. The leader must be willing to go
back to the well several times, because there are infinite
ways to present information. There needs to be a dynamic
relationship between leadership and analysts, where the
latter feels free to probe for the real agenda. In the end, this
saves a lot of time, and leaders get far better analyses and
information.
Leaders should constantly review how information is
being organized and presented. The lack of focus regarding
use of data, improper arrangement of data for analysis, or
unclear presentation of results can obscure meaningful
information. Leaders should be familiar with how data are
developed, interpreted, and presented to ensure accurate
presentations for decision making. Studies and analyses
specifically targeted for areas of concern are valuable in
helping units isolate factors surrounding problem areas.
Analytical Studies. MDAS will provide work centers
the results of investigations, analyses, or studies. Specific
studies are provided to the requester, and a file copy is
retained for future reference. Reproducing the study or
including it in a monthly maintenance summary achieves
widespread dissemination.
The study should state assumptions up front,
summarized in plain English, and state how the significance
is measured.
Most studies should begin with some sort of background
information. Each study should include the data, research,
investigation, and statistical findings, along with their
respective sources. Conclusions relevant to the study
should be drawn from this information. Finally, the study
should include recommendations to address the
conclusions relevant to the problem (other issues
uncovered can be identif ied but should be kept
separate). The most effective study is one that goes beyond
Most studies
should begin with
some sort of
background
information. Each
study should
include the data,
research,
investigation, and
statistical findings,
along with their
respective sources.
Conclusions
relevant to the
study should be
drawn from this
information.
Finally, the study
should include
recommendations
to address the
conclusions
relevant to the
problem.
60 Chapter 4
Helpful Hints for Data Investigation
superficial conclusions and helps solve a problem relative
to mission performance.
Maintenance Analysis Referrals
Referrals are highly effective for making many agencies
aware of a common problem. Referral reports are simply
tools to aid in process improvement and should never be
used to attach blame. A referral identifies, investigates, and
proposes corrective actions for management problems.
Referral reports are used to start the referral procedure
and document corrective actions for implementation and
future reference. Given the amount of investigation and
research needed to properly process referrals, they should
be not used for problems that can be resolved more
eff ic ient ly through verbal or other less formal
communications.
Referrals should not be determined by a quota system.
They should be used only when necessary to effect a
permanent solution to a problem that cannot be solved by
other means. Referral reports must be concise, accurate, and
timely to provide operations and logistics leaders with
information for making decisions. Anyone can initiate a
referral, but MDAS is the office of primary responsibility
and maintains a log of all referrals, assigning a referral
number before processing begins. Referrals are routed
through the affected agencies for comments, with the final
addressee as the MDAS. The MDAS retains copies,
indicates whether additional monitoring or follow-up
action is necessary, and provides a completed study to the
LG/OG quality assurance.
Functions of Deficiency Analysis
Deficiency analysts serve a dual role. They provide
analytical support to the squadrons and maintenance
leaders and also provide technical expertise for the MDAS.
They use analytical data and technical knowledge to
identify problems, work with the customer, and help find
solutions. They should not limit themselves to pointing
Referrals should
not be determined
by a quota system.
They should be
used only when
necessary to effect
a permanent
solution to a
problem that
cannot be solved
by other means.
Chapter 4
Helpful Hints for Data Investigation
Air Force Maintenance Metrics61
out general areas for investigation. They should identify
deficiencies applicable to a work center, particular
equipment end item, maintenance practice, or management
action. Deficiency analysis responsibilities include:
• Review QA summaries for positive and negative trends.
• Review debriefing data and abort information daily to
assist in the identification of problem aircraft or systems.
• As a minimum, perform monthly reviews of:
• Deferred discrepancy lists for technical errors or
negative trends.
• R/R discrepancy lists for problems.
• High CND rates and incidents for inadequate
troubleshooting or technical data problems.
• Aircraft scheduling deviations for negative
maintenance practices and trends that impact work
force and workload stability.
• Monitor and evaluate the maintenance portion of the
b a s e r e p a i r p r o g r a m a n d i n t e r m e d i a t e r e p a i r
enhancement program.
• Analyze the performance of se lec ted sys tems,
subsystems, and line-replaceable units to help determine
the source of problems affecting the mission.
• Attend the QA program and product improvement
working group meetings, providing trend data as
needed.
Note: The function of the deficiency analyst is not to
become the full-time, data-integrity team monitor.
The following are questions the assigned analysts have
been trained to ask.
Building Narratives for Out-of-Standard Indicators
• Weekly Reports
• What are the major contributing systems?
• What are the common write-ups within the major
contributing systems?
• Are there aircraft with multiple write-ups in the
major contributing systems or different systems?
• Is MICAP information available on aircraft with high
supply times?

62 Chapter 4
Helpful Hints for Data Investigation
• Are there any previously stated facts that apply?
• Are there any systems trends?
• Are there technical data limitations?
• Is there a lack of proper tools?
• Answer the questions: what is the problem, what is
the unit doing to resolve the problem, and/or what
does the headquarters staff need to know to resolve
the problem?
• Monthly Report
• What are the major contributing systems?
• What are the common write-ups within the major
contributing systems?
• Are there aircraft with multiple write-ups in the
major contributing systems or different systems?
• Do pilot reported discrepancies (PRD) indicate a
recent trend in system write-ups for major
contributors?
• Do PRDs indicate a recent trend in write-ups for a
particular tail number within major contributing
systems?
• What type of corrective actions were taken? Do
similar discrepancies still reappear?
• Could CANNs have been a factor?
• Did the aircraft/system cause problems with other
maintenance indicators?
• Is MICAP information available on aircraft with high
supply times?
• How has the aircraft/system performed since the last
inc ident (PRD l i s t ing /Core Automated
Maintenance System [CAMS] Screen 174)?
• Are there any previously stated facts that apply
(previous weeklies, studies, and so forth)?
• Check repeat/recurs in an effort to identify actual
component failures versus maintenance procedural,
training, or skill-level problems. This will involve
contacting the shop responsible for the repair.
Chapter 4
Helpful Hints for Data Investigation
Air Force Maintenance Metrics63
• Are there any systems trends?
• Are there technical data limitations?
• Is there a lack of proper tools?
• What is the problem, what is the unit doing to resolve
the problem, and/or what does the headquarters staff
need to know to work resolution of the problem?
The following hints can be applied to all processes under
investigation. (Breaks, Aborts, and CANNs are used only
as examples.)
Technical Information. Always check with deficiency
analysis for answers to technical questions. It’s a good idea
to review their summaries, also. Sometimes they’ve already
gathered information on the same aircraft/systems. Make
it a point to talk to the appropriate shops concerning
problem aircraft and components.
Fix Rates and Write-Ups Exceeding the 4-/8-/12-Hour
Requirement. Deficiency analysts or the shop responsible
for repair may have the average time it takes to troubleshoot
and repair some items.
Supply. The MICAP section of supply should have
information on supply issues and actions affecting aircraft
and components with high supply times.
Trends. There are various types of trends that should be
investigated. Detailed analysis will depend on how much
time is available and the type of data being researched.
Ask:
• Are the failures seasonal (more failures in hot or cold
temperatures)?
• Are the components that are failing environmentally
sensitive (that is, responding to temperature extremes,
corroding)?
• Could the failures be operating-time related?
• Do corrective actions point toward lack of training or
workarounds caused by lack of parts or proper tools?
After weekly reports and spreadsheets are updated, it’s a
good time to start looking at historical data for possible
trends affecting current data.
64 Chapter 4
Helpful Hints for Data Investigation
Break Rates
Verify documentation of Code 3 aircraft:
• Are debriefing forms loaded correctly?
• Are landing times correct?
• Are the proper system break codes used?
Verify accuracy of aircraft status:
• Are start and stop times of NMC conditions correct?
• Do the work unit codes match the identified Code 3
systems on the debrief form?
Isolate the problem system:
• Once verification of Code 3 documentation and aircraft
status is completed, what systems stand out?
• Past history?
Identify components within suspect systems:
• Does CAMS documentation seem reasonable?
• Do start and stop times for maintenance actions agree
with aircraft status times?
Track problem items through the backshop:
• Can the failure be confirmed?
• Can the common repair ac t ions in the shop be
identified?
Check for R/R/CND actions:
• Were they good fixes?
• Is there a chance some Code 3 actions are self-inflicted?
Abort Rates
Verify documentation of aborted aircraft:
• Are debriefing forms loaded correctly?
• Do the data correlate with the daily flying schedule?
Chapter 4
Helpful Hints for Data Investigation
Air Force Maintenance Metrics65
• Are the proper systems used?
• Are the proper when discovered codes used?
• Are the proper abort cause codes used?
Isolate the problem:
• What systems stand out?
• Past history?
Identify components within suspect systems:
• Does the CAMS documentation seem reasonable?
• Do start and stop times for maintenance actions agree
with aircraft status times?
Track problem items through the backshop:
• Can the failure be confirmed?
• Can common repair actions in the shop be identified?
Check for R/R/CND actions:
• Were they good fixes?
CANN Rates
• If CANN logs are maintained, do they match what is
documented in CAMS?
• Are there obvious gaps in the CANN log (missing or
incomplete data)?
• Are there notes of CANN act ions ini t ia ted but
canceled?
• Does it appear parts have been sitting around?
Isolate the problem:
• What systems stand out?
• Past history?
Identify components within suspect systems:
• Does CAMS documentation seem reasonable, or is
everything coded to the next higher assembly or
66 Chapter 4
Helpful Hints for Data Investigation
subsystem level (that is, actual components not
identified)?
• Was the CANN action faster than removing, repairing,
or replacing the item?
Check for R/R/CND actions:
• Was the CANN action a good fix?
• Did the CANN action only provide a partial fix?
Take the list of problem or suspect subsystems and
components to quality assurance and the technical
representatives.
• Have the problems been identified previously?
• Have material deficiency reports, safety reports, and so
forth been submitted?
• Are there pending modification programs?
Identify problem aircraft. Correlate findings with
other areas. Is there a common thread with:
• Causes for NMC/PMC conditions?
• Overall system/component failures in the fleet?
• Problem items in the Base Self-Sufficiency Program?
• Overall pilot-reported discrepancies?
• Air and ground abort causes?
• Overall R/R/CND problems and rates?
In General:
• Are sufficient samples tracked to get an accurate picture?
• If updates to CAMS are backlogged or if CAMS has been
down, was time allowed for data to be updated before
taking samples?
• Was the sample or monthly average compared with past
samples?
• Is there a large change in overall rates?
• Examine data by squadron, flight, and aircraft:
Chapter 4
Helpful Hints for Data Investigation
Air Force Maintenance Metrics67
• Is there a large change in overall rates from one
month to another or from one sample to another?
• Can a problem aircraft be identified as a CANN bird
or one in an inspection or modification?
• Could the problem be tied to nonavailability of
CAMS or other documentation problems?
If possible, compare data with other units that have
like aircraft and missions:
• Are the numbers comparable?
• Are there similar trends?
• Are there common systems or component problems?
Document findings and distribute to the OG/LG and
other appropriate maintenance activities.

68 Chapter 4 Notes
Helpful Hints for Data Investigation
Chapter 4 Notes
Helpful Hints for Data Investigation
Air Force Maintenance Metrics69
70 Chapter 5
References and Supporting Information
InstructionsAFPD 21-1 Managing Aerospace Equipment Maintenance
AFI 21-101 Maintenance Management of Aircraft
AFI 21-103 Equipment Inventory, Status, and Utilization Reporting
AFI 21-105 Aerospace Equipment Structural Maintenance
AFI 21-118 Improving Aerospace Equipment Reliability and
Maintainability
AFI 90-1102 Performance Management
AFCSM
21-556-V1
through
21-579-V2
Air Force Technical Orders00-5-1 Air Force Technical Order System
00-20-1 Aerospace Equipment Maintenance General Policy and
Procedures (with RAC 1 incorporated)
00-20-2 Maintenance Data Documentation
00-20-5 Aerospace Vehicle Inspection and Documentation
00-25-107 Maintenance Assistance
00-25-254-1 Comprehensive Engine Management System Engine
Configuration, Status, and TCTO Reporting Procedures
00-35D-54 USAF Deficiency Reporting and Investigating System
Core Automated Maintenance System Manuals

Notes
Air Force Maintenance Metrics71

Notes72
Notes
Air Force Maintenance Metrics73

Notes74