Embed Size (px)
Citation preview

1
Maintenance of Vertical Scales
Ye Tong Pearson
Michael J. Kolen
The University of Iowa
Paper to be presented at the National Council on Measurement in Education annual
conference in New York City, March 2008

2
Introduction
Vertical scaling refers to the process of placing scores of tests that measure
similar domains but at different educational levels onto a common scale, a vertical scale.
Vertical scaling involves many factors. Research tends to show that vertical scaling is
design-dependent (Kolen & Brennan, 2004; Harris, 1991; Tong & Kolen, 2007), group-
dependent (Harris & Hoover, 1987; Slinde & Linn, 1979; Skaggs & Lissitz, 1988) and
method-dependent (Kolen, 1981; Skaggs & Lissitz, 1986; Tong & Kolen, 2007).
Construction of a vertical scale is a complicated process. It involves decisions
such as scaling design, scaling methodology, and scale setup. Much research has been
conducted in this area. Findings tend to be mixed with regard to how the scale should be
developed, which linking method or design is optimal and what the characteristics of the
vertical scale is in ideal alignment with how students progress through school.
Once a vertical scale is established, it also needs to be maintained over different
forms and over time. Much of the research on vertical scaling has focused on the
development of vertical scales; sparse research has been conducted on maintaining
vertical scales across forms or years. Simple horizontal equating is always an option, but
caution needs to be taken to prevent scale drift over time. Another approach for
maintaining vertical scale is to develop a different vertical scale based on the new forms,
and then to link the two vertical scales. However, the latter approach requires vertical
linking items be administered in multiple years, which can lead to practical concerns.
A study conducted by Hoskens, Lewis and Patz (2003) considered the issue of
maintaining vertical scales across years, using a baseline scale. They examined various
methods for scale maintenance and all the methods showed non-trivial growth over time.

3
The results from their study implied that the method chosen for maintaining the vertical
scale affects the resulting scale.
In this study, scale maintenance is further investigated. Using data collected from
a large-scale state assessment program over a period of two years, both with embedded
vertical linking items and equating linking items, different methods were explored to
observe their impact on the resulting scale and growth interpretations.
Data
The data used in this study came from a large-scale state assessment program
administration in 2005 and 2006, covering grades 3 through 8. Two subjects were
investigated: English Language Arts (ELA) and Mathematics. For each subject and grade
combination, there were equating items for the same grade level across the two years and
vertical linking items between adjacent grades within the same year. For example, a
certain number of common items appropriate for grade 3 appeared on the grade 3 test in
both 2005 and 2006. Also, there were a number of items that were common between
grade 3 and grade 4 for a given administration. The equating items common for the same
grade between administrations can be used to horizontally equate the tests in the two
years. The vertical linking items common between adjacent grades for a given
administration can be used to establish a vertical scale spanning all grade levels.
Table 1 reports the number of operational items, number of common items for
equating, and number of vertical linking items between adjacent grade levels. As can be
observed from the table, the number of common items for equating and the number of
vertical linking items were high relative to the corresponding number of operational
items. This is because an external linking design was used, and different sets of the

4
equating or vertical linking items were placed in field test item slots in multiple test
forms (7-10 equating items per form and 7 vertical linking items per form). In this way,
we were able to test more common items and still did not burden students much with
taking too many test items. Such practice ensures that the common items, both for
equating and for vertical linking, have good content coverage of the test compared to the
operational items.
The unique feature about this dataset is that in both years, vertical linking items
were embedded in the operational test. These vertical linking items did not contribute to
students’ scores and all came from the lower grade core items. For example, the vertical
linking items between grades 3 and 4 were grade 3 items that contributed to grade 3
scoring but not grade 4 scoring. Because of the source of vertical linking items, as the
table indicates, there were no vertical linking items in grade 3.
The entire testing population was used to conduct the analysis in this study. The
sample sizes were in the neighborhood of 120,000 per grade across the two years.
Generally the tests consist of both multiple choice (MC) and constructed response (CR)
items. The Rasch model is the IRT model used in this state assessment program. A large
incomplete data matrix, with items not taken by the students coded as missing, was
created to conduct all the analysis.
Methodology
Because there were two years of data containing vertical linking items, vertical
scales can be constructed using the first year’s data or using second year’s data. The
general practice is to construct a vertical scale once and maintain it through horizontal
equating after the base year. It is rare to have two years of data with the possibility of

5
constructing two vertical scales, mainly because of logistical reasons. The data at hand
provided us with an excellent opportunity to observe how a vertical scale can be
maintained and how different decisions can affect the resulting scale. The base vertical
scale will be developed using 2005 data. The research question is how to maintain the
vertical scale moving onto 2006. There are two possibilities:
• Horizontally equate 2006 tests to 2005 tests within grade, and hence place
them onto the base-year vertical scale
• Develop a separate vertical scale using 2006 data and through horizontal
equating, “equate” the two vertical scales to place 2006 scale onto the
baseline 2005 scale
In the following, construction of a vertical scale is described first. Next, maintenance of
vertical scales through horizontal equating and through construction of a second vertical
scale is discussed.
Construction of Vertical Scales
The vertical linking items for a given grade come from the core items in the grade
below. Such a design is called common-item design (Kolen & Brennan, 2004). The link
is established through these common items between each pair of adjacent grades.
To construct the vertical scale, data need to be calibrated to obtain item parameter
estimates for all items, including the vertical linking items. As mentioned before, all the
students’ response data were placed into an incomplete data matrix, with items not taken
by students coded as missing. This is because the vertical linking and equating items
were placed into multiple sets into multiple different test forms so that students taking a
certain test form were only exposed to a few vertical linking and equating items.

6
With the common-item design, calibration approach is always a decision that
needs to be made. Do we want to conduct separate calibration or concurrent calibration?
Separate calibration refers to calibration of one grade level at a time and uses linking to
place all grade levels onto the same scale. Concurrent calibration refers to the calibration
of all grade levels at the same time, coding students’ response data from all grade levels
into one very large incomplete data matrix. Concurrent calibration only involves one
large calibration and does not need further linking, whereas with separate calibration, a
linking chain needs to be conducted to place all grade levels onto the same scale. Even
so, separate calibration avoids many of the concerns regarding multidimensionality and
convergence in estimation that concurrent calibrations tend to face. Therefore, a separate
calibration of each grade for each year’s data was conducted using WINSTEPS (Linacre,
2006), since this is a Rasch model based assessment.
Mean/mean linking was conducted to obtain the linking constant between each of
the adjacent grades. Grade 3 was used as the base grade. In this case, because a
mean/mean linking was used, choice of a base grade does not impact the resulting
vertical scale because the linking only involves a mean shift. A linking chain is used to
link parameter estimates for higher grades onto the common vertical scale. For example,
to link grade 6 to the grade 3 based vertical scale, the grade 6 scale is linked to the grade
5 scale first using the vertical linking items that were common between these two grades,
and then to grade 4 using items that were common between grades 4 and 5 and finally to
grade 3.
Through this linking chain, a vertical scale was established, spanning grades 3
through 8. Such linking does not change the within-grade variability.

7
Scale Maintenance: Horizontal Equating
To maintain the vertical scale for 2006, one possibility is through horizontal
equating. One obvious advantage to this approach is that only vertical linking items
would be needed in the baseline year to establish the vertical scale. In the following
years, no vertical linking items would be needed. Instead, common items for the same
grade between two years would be used to establish the equating relationship. Through
equating, the scores from future administrations are placed onto the established vertical
scale.
Table 1 lists the number of common items for horizontal equating. Item parameter
estimates for these items in the two years were obtained through separate calibration. The
average of the item parameter estimates for these common items for both 2005 and 2006
were computed and the difference was obtained to serve as the equating constant to link
the two administrations.
To place 2006 results onto the 2005 scale, the corresponding equating constant
was added to parameter estimates for each of the grade levels. No further adjustment is
needed because 2005 was already on the baseline vertical scale; through horizontal
equating, 2006 results were also placed onto the same vertical scale and ready for
comparison.
Scale Maintenance: Two Vertical Scales
Another vertical scale maintenance approach is to establish multiple vertical
scales in each of the administrations and “equate” the vertical scales. This approach is
more complicated than the horizontal equating method. Under this approach, two
separate vertical scales (one for 2005 and one for 2006) were constructed using the

8
methodology described above, for each content area. After construction of the two
separate vertical scales, the vertical scale developed for 2006 was placed onto the vertical
scale for 2005.
To achieve this linking of the two vertical scales, horizontal equating was applied.
To obtain the equating constant1, the item parameters for each grade level in both years
were placed onto the respective vertical scale developed for that administration. Next,
mean/mean equating was conducted for each of the six grade levels to obtain the equating
constant. Because there were common items for each of the six grade levels between the
two years, potentially six sets of equating constants could be computed. Which equating
constant should be applied to establish the link? If the equating constants for all six
grades were the same or similar, it would not matter much which grade was used to
establish the horizontal linking of two vertical scales. However, if the equating constants
across grades were too different from each other, the equating constant chosen would
impact the results. One way to proceed was to average all the equating constants and to
use the average to link the two vertical scales.
Therefore, there are four major steps under this approach:
1. Develop a vertical scale for each of the two administrations, 2005 and
2006
2. For each administration, place item parameter estimates for all grade
levels onto the developed vertical scale
3. Conduct horizontal equating using these vertically scaled item parameter
estimates for each grade across the two administrations
1 There is a scale shift under this approach from the equating constants applied under the horizontal equating approach.

9
4. Compute the average of the equating constants from step 3 and use the
average to link the two vertical scales developed in step 1
Furthermore, a set of six different vertical scales were also developed using the equating
constant from each of the six grades, to further observe what impact such a linking
decision was likely to be.
Results
Table 2 reports the equating constants computed for both subjects using the
common items for a given grade between two administrations. The item parameters were
still on their own scale, without being vertically linked. These equating constants were
applied to equate 2006 administration to 2005 administration, under the horizontal
equating approach.
Table 3 reports vertical scaling constants developed for each
subject/administration combination. These constants were applied to each of the grade
levels to link them to the grade 3 base scale. For example, a constant of 1.2346 was added
to the grade 8 results in ELA, 2005, to link that grade onto the grade 3 scale.
Table 4 reports the vertically adjusted equating constants, after placing all item
parameter estimates onto their corresponding vertical scale. As can be observed from this
table, after the vertical adjustment, the equating constants became very similar among the
various grades in both subjects. There are some minor differences, with the largest
difference for ELA being around 0.10 and for mathematics being around 0.15. As
previously mentioned, under the maintenance approach of developing two vertical scales,
when we “equate” the second vertical scale to the baseline vertical scale, an equating
constant needs to be applied. As the results indicate, with this set of data, the equating

10
constants can be somewhat similar across grades, with minor differences. Still, it appears
that the reasonable solution is to use the overall average of the equating constants to
achieve this linking of vertical scales.
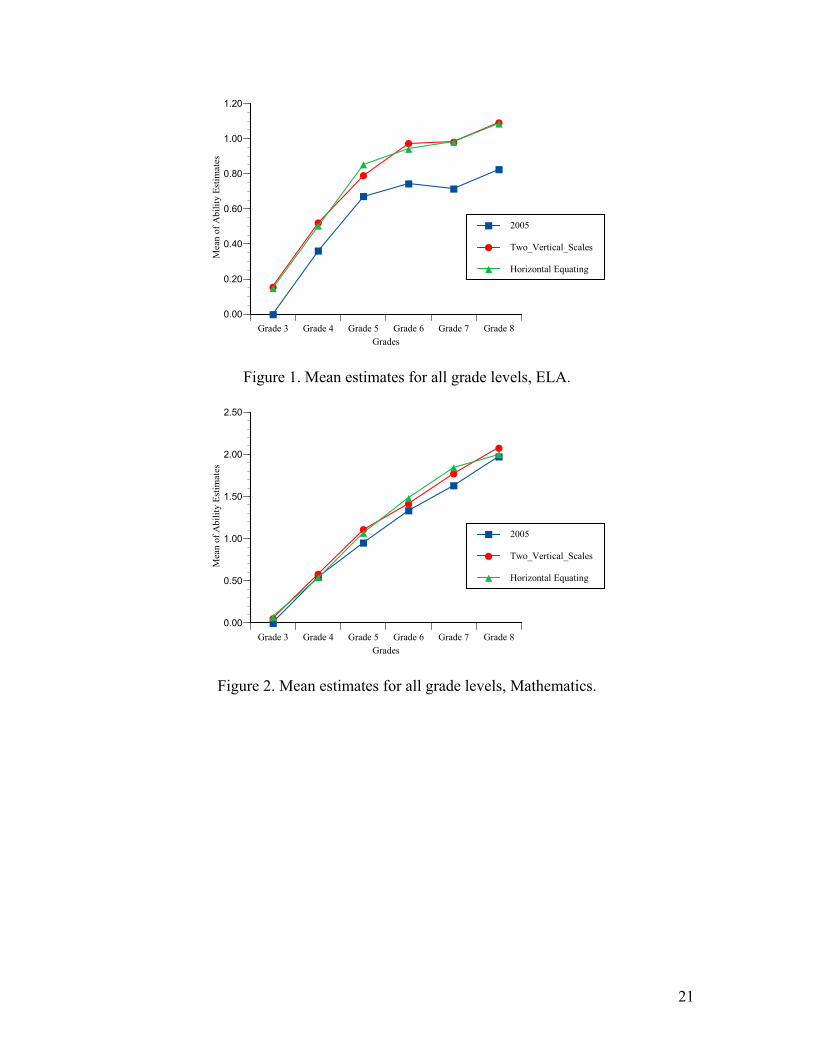
Ability estimates were obtained for each of the grades for both years. Next, means
and standard deviations were computed for the vertical scales: base scale in 2005 and two
maintenance approaches in 2006, with using overall average of equating constants for the
two vertical scales approach. Table 5 reports these results. Next, effect sizes were
computed and are reported in Table 6. Table 7 reports the mean estimates across grades
for the baseline year in 2005 as well as the mean estimates for the various vertical scales
using the second maintenance approach but applying each of the six equating constants.
Figures 1-6 were also constructed for visual observation of the various results: mean
estimates, effect sizes as well as contrasts among various equating constants.
ELA Results
With ELA, the vertical linking constants reported in Table 3 tended to increase
from lower grades to higher grades, with the exception between grades 7 and 8.
Compared with the mathematics results contained in the same table, the magnitudes of
these vertical linking constants were much lower for the ELA subject.
In terms of means, as can be observed from Table 5, there was a general increase
in mean estimates across grades, indicating higher performance at higher grade levels.
However, the mean estimate for grade 6 was slightly higher than the mean estimate for
grade 7. Even though the difference was small (0.029), it still runs counter to the general
belief: the overall performance at higher grade level tends to be higher than that at the
lower grade level. Some possible reasons for this observation include measurement error,

11
significant curriculum change between the two grades, etc. The results between the two
maintenance models were quite similar. The difference between the mean estimates for
each grade was computed and reported in the table. These differences were rather small,
with the largest difference being 0.06. It appears that with this dataset, the two
maintenance approaches yielded very similar scales for later administration.
The standard deviations for both 2005 and 2006 appear to fluctuate and are
relatively flat, indicating stable spread of score distributions. Such an observation is
common among vertical scales developed based on IRT models. Only one set of standard
deviations was computed for 2006. This being a Rasch model based assessment, a mean
shift does not change the standard deviation.
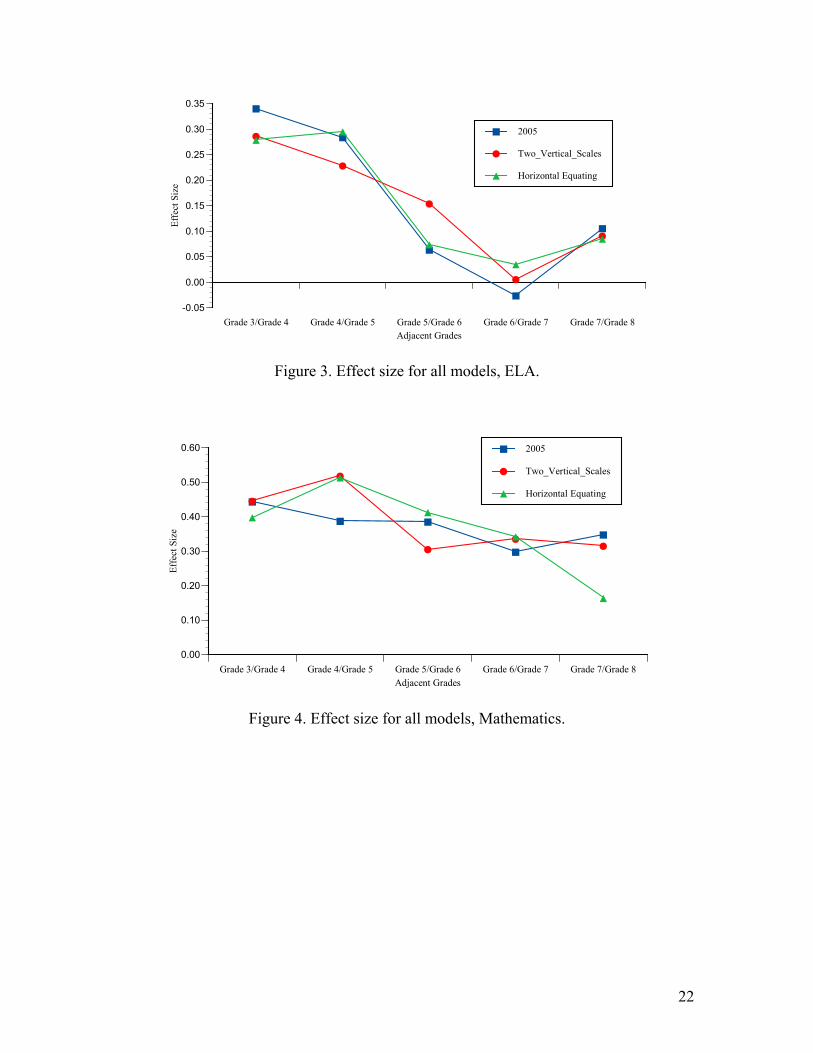
In terms of effect size, a general decrease was observed across grades, indicating
decelerating growth. Consistent with the mean estimates, there was negative growth from
grade 6 to grade 7 for the 2005 base scale. Very little growth was observed between these
two grades for the 2006 scale, for either of the two maintenance models.
With the various equating constant contrasts, as Table 7 and Figure 5 have shown,
the results based on different equating constants tend to be quite similar. The largest
difference exists between results using the grade 5 constant and the grade 6 constant, and
the difference was around 0.10 on the theta scale. Because this is mean estimate, such
difference was not trivial. This observation indicates that if a multiple vertical scale
approach is applied, decisions need to be made regarding the establishment of the
horizontal linking. The equating constants tend to be similar across grades but they still
can lead to somewhat different location placement for the various grades. Using the
average of the adjusted horizontal equating constants appeared to have performed well

12
with this data, producing a scale very similar to the scale developed under the horizontal
equating approach.
Mathematics Results
A solid increasing trend was observed with the vertical linking constant (table 3)
with this subject. The difference between the constants in adjacent grades tends to
decrease across grades, indicating decelerating growth in some sense.
In terms of means, there was a general increase in mean estimates across grades,
indicating higher performance at higher grade levels. The results between the two
maintenance models were quite similar again, with the largest difference being around
0.07. Compared with the base scale in 2005, the results from the two models for
mathematics appeared to have produced more similar results to the base scale than the
results based on ELA.
The standard deviation estimates fluctuated, with a drop between grades 3 and 4
and then flattening out. Such patterns again indicate the spread of the score distribution
remained fairly constant across grade levels. The implication of such an observation is
that the growth rate for high performance and low performance students tends to be about
the same as they progress in school.
In terms of effect size, a more or less decreasing trend was observed across
grades, indicating decelerating growth. But this decreasing pattern was not as dominant
as that observed with the ELA results. One interruption of this pattern was observed with
grades 3/4 versus grades 4/5 for 2006 results. Under both maintenance models, more
growth was shown from grade 4 to grade 5 than from grade 3 to grade 4.

13
With the various equating constant contrasts, as shown in Table 7 and Figure 6,
the results based on different equating constants tend to be somewhat similar from one
another. The largest difference exists between results using grade 7 constant and grade 8
constant and the difference can be as large as 0.15 on the theta scale in terms of mean
estimate. Again, such an observation confirms that if multiple vertical scale construction
maintenance model is adopted, it requires sound decisions on how horizontal linking is
established between various vertical scales.
Discussion and Limitations
Vertical scaling is a challenging and complex procedure. Much research has been
conducted in the area, but the findings are not always consistent. Most of the research has
been devoted to the development of a vertical scale. Very little research has looked at the
maintenance of a vertical scale.
In this study, large-scale state assessment data were used to observe how different
approaches may impact the maintenance of a vertical scale. The richness in the real data
is rare in a vertical scaling context and through further analysis of this data, the authors
hope to inform practioners, once vertical scale is established, what can be done to
maintain a psychometrically sound vertical scale.
The results showed that the results were very similar for the two methodologies:
construct base vertical scale and maintain it through horizontal equating versus construct
multiple vertical scales and horizontally link vertical scales. It appears that with this
current dataset, it would not have mattered much which maintenance model was used to
establish the vertical scale for the second year.

14
The horizontal equating approach is the more straightforward and is easier to
apply in practice. The multiple vertical scales approach is more complex; it also demands
vertical linking items be administered in multiple years. Furthermore, decisions need to
be made on how horizontal equating can be conducted to link the vertical scales. It
appears that in the present context of linking scales from two adjacent years, the
horizontal equating approach might be preferable because it produces results similar to
those for multiple vertical scales but is easier to implement However, it might still be
preferable to consider multiple vertical scales in situations where linking is done over
multiple years..
Because only Rasch and partial credit models were fit to the data for analysis, the
differences between scales only exist in location, but not in scale. In future work, the
three-parameter logistic model will be fit to the multiple choice items and the graded
response model will be fit to the constructed response items. When these models are
used, the linking function is no longer a simple scale shift; it involves transformation of
both location and scale. The impact of different approaches can be further observed in
terms of within-grade variability, growth trends, etc.

15
References
Harris, D. J. (1991). A comparison of Angoff’s Design I and Design II for vertical equating using traditional and IRT methodology. Journal of Educational Measurement, 28(3), 221-235.
Harris, D. J., and Hoover, H. D. (1987). An application of the three-parameter IRT model
to vertical equating. Applied Psychological Measurement 11(2), 151-159. Jodoin, M.G., Keller, L.A., and Swaminathan, H. (2003). A comparison of linear, fixed
common item and concurrent parameter estimation equating procedures in capturing academic growth. Journal of Experimental Education, 71(3), 229-250.
Karkee, T., Lewis, D.M., Hoskens, M., Yao, L., and Haug, C. (2003). Separate versus
Concurrent calibration methods in vertical s caling. Paper presented at the annual meeting of National Council on Measurement in Education, Chicago, IL.
Kolen, M. J. (1981). Comparison of traditional and item response theory methods for
equating tests. Journal of Educational Measurement, 18(1), 1-11. Kolen, M. J., & Brennan, R. L. (2004). Test equating:, Methods and practices. (2nd ed.).
New York: Springer-Verlag. Linacre, J. M. (2006). A user’s guide to WINSTEPS. Chicago, IL: MESA Press.
Skaggs, G., & Lissitz, R. W. (1986). IRT test equating: Relevant issues and a review of
recent research. Review of Educational Research, 56(4), 495-529. Skaggs, G., & Lissitz, R. W. (1988). Effect of examinee ability on test equating
invariance. Applied Psychological Measurement, 14(1), 23-32. Slinde, J. A. and Linn, R. L. (1979). A note on vertical equating via the Rasch model for
groups of quite different ability and tests of quite different difficulty. Journal of Educational Measurement, 16(3), 159-165.
Thissen, D. (1991). MULTILOG: multiple category item analysis and test scoring using
item response theory. Chicago: Scientific Software International, Inc. Tong, Y., and Kolen, M.J. (2007). Comparisons of methodologies and results in
vertical scaling for educational achievement tests. Applied Measurement in Education, Vol. 20, No. 2, 227-253.
Yen, W. M. (1986). The choice of scale for educational measurement: An IRT
perspective. Journal of Educational Measurement, 23(4), 299-325.

16
Table 1. Tests Layout for ELA and Mathematics.
Number of Operational Items
Number of Equating Common Items
Number of Vertical Scaling Items
ELA, 2005 Grade 3 30 N.A. Grade 4 30 24 Grade 5 30 24 Grade 6 30 24 Grade 7 30 24 Grade 8 30 24
ELA, 2006 Grade 3 30 30 N.A. Grade 4 30 28 24 Grade 5 30 29 24 Grade 6 30 29 24 Grade 7 30 21 24 Grade 8 30 22 24
Math, 2005 Grade 3 57 N.A. Grade 4 58 58 Grade 5 57 54 Grade 6 55 52 Grade 7 60 51 Grade 8 54 56
Math, 2006 Grade 3 60 52 N.A. Grade 4 58 53 60 Grade 5 57 50 57 Grade 6 56 51 57 Grade 7 60 57 54 Grade 8 55 37 60

17
Table 2. Equating constants used under horizontal equating approach.
ELA Mathematics Grade 3 0.2913 0.5236 Grade 4 0.1852 0.0450 Grade 5 -0.1014 0.2429 Grade 6 0.1161 0.2716 Grade 7 0.1199 0.3469 Grade 8 0.1693 0.0558
Table 3. Vertical scaling constants for 2005 and 2006.
ELA Mathematics 2005 2006 2005 2006
Grade 4 0.6782 0.5818 1.0004 0.5779 Grade 5 1.1748 0.7130 1.9594 1.7387 Grade 6 1.2147 1.0652 2.6949 2.3954 Grade 7 1.3208 1.1415 3.0211 2.7895 Grade 8 1.2346 1.1117 3.5937 3.2163
Table 4. Equating constants used under developing two vertical scales approach.
ELA Mathematics Grade 3 0.2913 0.5236 Grade 4 0.2816 0.4676 Grade 5 0.3605 0.4636 Grade 6 0.2656 0.5710 Grade 7 0.2992 0.5785 Grade 8 0.2922 0.4332 Average 0.2984 0.5062

18
Table 5. Mean and standard deviation results based on the two approaches.
Mean SD 2005 2006 2005 2006 Two VS Equating Difference ELA Grade 3 0.0000 0.1559 0.1488 -0.0071 1.1243 1.3663 Grade 4 0.3622 0.5220 0.5052 -0.0168 0.9988 1.1810 Grade 5 0.6732 0.7915 0.8536 0.0621 1.0685 1.1758 Grade 6 0.7449 0.9746 0.9418 -0.0328 1.0890 1.1946 Grade 7 0.7156 0.9819 0.9828 0.0009 0.9613 1.1098 Grade 8 0.8257 1.0921 1.0859 -0.0062 1.0857 1.2971
Mathematics Grade 3 0.0000 0.0544 0.0718 0.0173 1.3304 1.3007 Grade 4 0.5473 0.5820 0.5433 -0.0387 1.1242 1.0499 Grade 5 0.9551 1.1115 1.0689 -0.0426 0.9728 0.9909 Grade 6 1.3358 1.4182 1.4830 0.0648 0.9980 1.0114 Grade 7 1.6345 1.7747 1.8470 0.0723 1.0047 1.1074 Grade 8 1.9760 2.0780 2.0049 -0.0731 0.9531 0.7853

19
Table 6. Effect sizes based on the two approaches.
2005 2006 Two VS Equating ELA Grade 3/Grade 4 0.3406 0.2867 0.2791 Grade 4/Grade 5 0.2844 0.2287 0.2956 Grade 5/Grade 6 0.0638 0.1545 0.0745 Grade 6/Grade 7 -0.0256 0.0063 0.0355 Grade 7/Grade 8 0.1060 0.0913 0.0854 Mathematics Grade 3/Grade 4 0.4444 0.4463 0.3990 Grade 4/Grade 5 0.3879 0.5187 0.5148 Grade 5/Grade 6 0.3862 0.3063 0.4136 Grade 6/Grade 7 0.2983 0.3362 0.3433 Grade 7/Grade 8 0.3488 0.3160 0.1645

20
Table 7. Mean estimates based on the various equating constants, two vertical scales approach.
2005 Base Scale
Use G3 Equating Constant
Use G4 Equating Constant
Use G5 Equating Constant
Use G6 Equating Constant
Use G7 Equating Constant
Use G8 Equating Constant
ELA Grade 3 0.0000 0.1488 0.1390 0.2179 0.1231 0.1567 0.1496 Grade 4 0.3622 0.5149 0.5052 0.5841 0.4892 0.5229 0.5158 Grade 5 0.6732 0.7844 0.7747 0.8536 0.7587 0.7924 0.7853 Grade 6 0.7449 0.9675 0.9578 1.0367 0.9418 0.9755 0.9684 Grade 7 0.7156 0.9748 0.9651 1.0440 0.9491 0.9828 0.9757 Grade 8 0.8257 1.0850 1.0753 1.1541 1.0593 1.0929 1.0858
Mathematics Grade 3 0.0000 0.0717 0.0158 0.0118 0.1192 0.1267 -0.0187 Grade 4 0.5473 0.5993 0.5433 0.5393 0.6468 0.6543 0.5089 Grade 5 0.9551 1.1288 1.0728 1.0688 1.1763 1.1838 1.0384 Grade 6 1.3358 1.4355 1.3795 1.3755 1.4829 1.4904 1.3451 Grade 7 1.6345 1.7920 1.7360 1.7321 1.8395 1.8470 1.7016 Grade 8 1.9760 2.0953 2.0393 2.0354 2.1428 2.1503 2.0049
21
B
B
B
BB
B
J
J
J
J J
J
H
H
H
HH
H
Grade 3 Grade 4 Grade 5 Grade 6 Grade 7 Grade 80.00
0.20
0.40
0.60
0.80
1.00
1.20
Mea
n of
Abi
lity
Estim
ates
Grades
B 2005
J Two_Vertical_Scales
H Horizontal Equating
Figure 1. Mean estimates for all grade levels, ELA.
B
B
B
B
B
B
J
J
J
J
J
J
H
H
H
H
H
H
Grade 3 Grade 4 Grade 5 Grade 6 Grade 7 Grade 80.00
0.50
1.00
1.50
2.00
2.50
Mea
n of
Abi
lity
Estim
ates
Grades
B 2005
J Two_Vertical_Scales
H Horizontal Equating
Figure 2. Mean estimates for all grade levels, Mathematics.
22
B
B
B
B
B
J
J
J
J
J
HH
H
H
H
Grade 3/Grade 4 Grade 4/Grade 5 Grade 5/Grade 6 Grade 6/Grade 7 Grade 7/Grade 8-0.05
0.00
0.05
0.10
0.15
0.20
0.25
0.30
0.35
Effe
ct S
ize
Adjacent Grades
B 2005
J Two_Vertical_Scales
H Horizontal Equating
Figure 3. Effect size for all models, ELA.
B
B B
B
B
J
J
JJ
J
H
H
H
H
H
Grade 3/Grade 4 Grade 4/Grade 5 Grade 5/Grade 6 Grade 6/Grade 7 Grade 7/Grade 80.00
0.10
0.20
0.30
0.40
0.50
0.60
Effe
ct S
ize
Adjacent Grades
B 2005
J Two_Vertical_Scales
H Horizontal Equating
Figure 4. Effect size for all models, Mathematics.

23
B
B
BB B
B
J
J
J
J JJ
H
H
H
H HH
F
F
F
F FF
3
3
3
3 33
1
1
1
1 11
>
>
>
> >>
Grade 3 Grade 4 Grade 5 Grade 6 Grade 7 Grade 80.00
0.50
1.00
1.50
2.00
2.50
Mea
n of
Abi
lity
Estim
ates
Grades
B 2005
J Use G3 Equating Constant
H Use G4 Equating Constant
F Use G5 Equating Constant
3 Use G6 Equating Constant
1 Use G7 Equating Constant
> Use G8 Equating Constant
Figure 5. Mean estimates based on various equating constants, ELA.
B
B
B
B
B
B
J
J
J
J
J
J
H
H
H
H
H
H
F
F
F
F
F
F
3
3
3
3
3
3
1
1
1
1
1
1
>
>
>
>
>
>
Grade 3 Grade 4 Grade 5 Grade 6 Grade 7 Grade 8-0.50
0.00
0.50
1.00
1.50
2.00
2.50
Mea
n of
Abi
lity
Estim
ates
Grades
B 2005
J Use G3 Equating Constant
H Use G4 Equating Constant
F Use G5 Equating Constant
3 Use G6 Equating Constant
1 Use G7 Equating Constant
> Use G8 Equating Constant
Figure 6. Mean estimates based on various equating constants, Mathematics