Embed Size (px)
Citation preview
Maintenance Planning of Railway Ballast
Ali Ebrahimi1and Andrew K. Keene2
1 Research Associate, Civil and Environmental Engineering, University of Wisconsin-Madison,
Madison, WI 53706, e-mail: [email protected] 2 Research Assistant, Civil and Environmental Engineering, University of Wisconsin-Madison, Madison,
WI 53706, e-mail: [email protected]
Abstract
A model for maintenance planning of railway substructure is proposed using a permanent
deformation model for various materials in a track substructure. Among track substructure
materials, railway ballast has a critical role on the maintenance frequency of a railway track.
The deformation model for fouled railway ballast was developed using data obtained from a
large-scale cyclic triaxial (LSCT) apparatus. The ballast deformation model introduces a strong
correlation between the rate of plastic deformation (or strain) of ballast and different fouling and
stress conditions. Substructure maintenance planning software was developed based on
laboratory deformation data to model surface deviation of the railway track and consequent
maintenance events. The software can determine the intervals between corrective maintenance
activities (e.g., tamping) and necessity for preventive maintenance activities (e.g., undercutting
or drainage systems, etc).
Keywords: Railway, maintenance, substructure, ballast
1 INTRODUCTION
Railway substructure maintenance is a main concern facing the freight rail industry. Increasing
demand for higher freight capacity (greater loads and traffic volume) shortens intervals between
maintenance operations and increases costs. Angular, uniform, large-size ballast particles play
a significant role in distributing train loads to the subgrade. The frequency of railway
maintenance is linked to the quality of ballast, which changes continually due to the generation
© 2011 AREMA ®
of fine particles (i.e., ‘fouling’). The cost of maintenance for ballast tamping and surface
alignment is approximately $500M annually for the 150,000 kilometers of Class1 track in the
USA ($3,800/km/yr, Christmer and Davis 2000). The fouling process is initiated by any of
several potential fouling mechanisms including: fracture and abrasion of ballast particles (i.e.,
‘mineral fouling’), infiltration from underlying layers (e.g., clay fouling), and spillage from surface
sources (e.g., coal fouling) (Selig and Waters 1994; Darell 2003; Su et al. 2010; Huang et al.
2009). Ballast layer fouling leads to an accumulation of permanent deformation, increasing
surface deviation of the track. Employing heavier freight loads in the US will likely increase the
surface deviation of the track and related maintenance costs (Lee 2009). Larsson and
Gunnarsson (2001) stated that a 20% increase in axle load results in 24% extra maintenance
cost.
Timely maintenance of railway substructure is essential to provide continuous service at
a reasonable cost. Maintenance decisions within the railway industry depend on available
information from inspections, standards, and individual and institutional experience (Andersson
2002). Within the rail industry, there are limited standardized procedures or protocol for
scheduling preventive maintenance activities or, and possibly more importantly, to evaluate their
potential effects (Andersson 2002).
There are two approaches for track maintenance planning; one is performance-based and the
other mechanistic-based. For creating a comprehensive maintenance model based on a
performance-based approach, significant historical data (e.g., traffic, maintenance activities,
substructure conditions, and climate data) is required. However, in many cases, sufficient
historical data is unlikely to be archived or accessible (Andersson 2002; Stirling et al. 1999).
The key aspect of a mechanistic-based model assesses the performance of various track
components based on their respective mechanical properties. During track service life, use of a
mechanistic-based model can define and predict rate of track deterioration in various conditions
© 2011 AREMA ®
and decrease prediction uncertainty. A comprehensive track deterioration model should
combine both performance and mechanistic models to determine the track quality (Fazio and
Prybella 1980; Zarembski 1998). A ballast deterioration model was proposed by Chrismer and
Selig (1994) to predict ballast-related maintenance timing and costs based on field data. In our
paper, the effects of changing fouling conditions, moisture contents, and state of stress, on
ballast and rail track deformation are accounted for.
The objective of this study was to develop a deformation model for railway ballast to
account for various fouling conditions, moisture (i.e., climate), traffic, freight capacity (i.e., level
of stress), and substructure material quality (e.g., rate of fouling generation and subgrade
conditions). A substructure maintenance planning software incorporates a deformation model of
track substructure to predict surface deviation of the railway track.
2 BACKGROUND
2.1 Fouling index
Selig and Waters (1994) defined a fouling index (FI) that has been widely used in the USA as
200P4PFI , where P4 fraction is % mass < 4.75 mm, and P200 fraction is % mass < 0.075
mm.
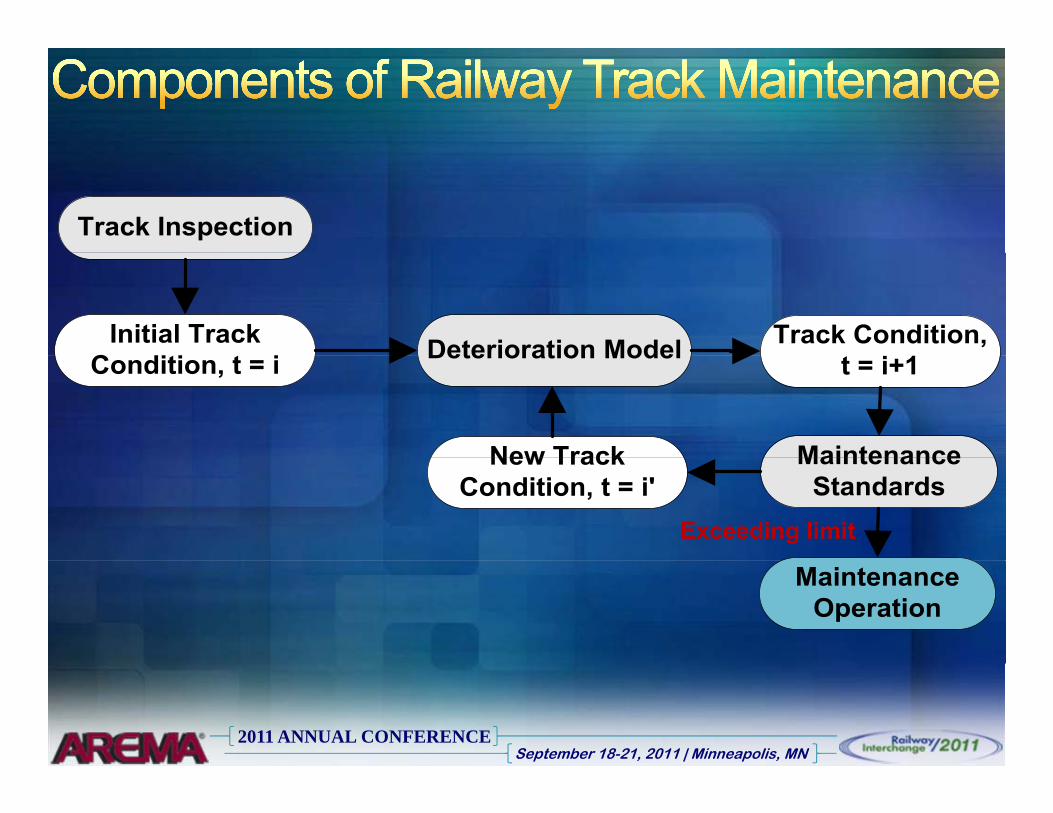
2.2 Maintenance planning model for railway ballast
The main concepts of this model are track inspection, a track deterioration model, and
standards for maintenance planning, which can be adopted for railway ballast. Prior to using
the maintenance model, ballast quality is determined by inspection techniques. From the
deterioration model (or deformation model for substructure), the surface deviation of the track
due to the subgrade and ballast deformation can be predicted. Maintenance criteria are
assigned with respect to rail class (i.e., passenger or freight rail and operating speed) to
© 2011 AREMA ®
estimate the timing for corrective (e.g., tamping) or preventive (e.g., ballast cleaning)
maintenance activities.
3 MATERIALS AND METHODS
The ballast deformation model was based on experiments performed on granitic ballast samples
provided from a BNSF Rail Company quarry in Wyoming. The ballast particle size was 25 to 63
mm. Different sources of non-plastic fouling were tested in this study, including fouling from
subballast intrusion or ballast breakage (i.e., mineral fouling) and surface spillage (i.e., coal
fouling).
A prototype large-scale cyclic triaxial (LSCT) apparatus was developed to test
specimens with a 305-mm diameter and 610-mm length. Plastic deformation of ballast in
various fouling, moisture, and stress conditions was determined over 2 x 10⁵ traffic cycles. For
studying the effects of fouling conditions, ballast specimens were tested at a reference stress
state consisting of 90 kPa confining stress (3 ref) and 300 kPa cyclic stress (d ref) . The
method of determining the representative stress states of ballast is described in Ebrahimi
(2011). The ballast specimens were also tested in various states of stress to determine the
deformational behavior of ballast under heavier freight loads. Ballast specimens were prepared
by compaction to the maximum dry unit weight of ballast d = 15.8 ± 0.3 kN/m3, additional
specimen preparation detail is provided in Ebrahimi (2011).
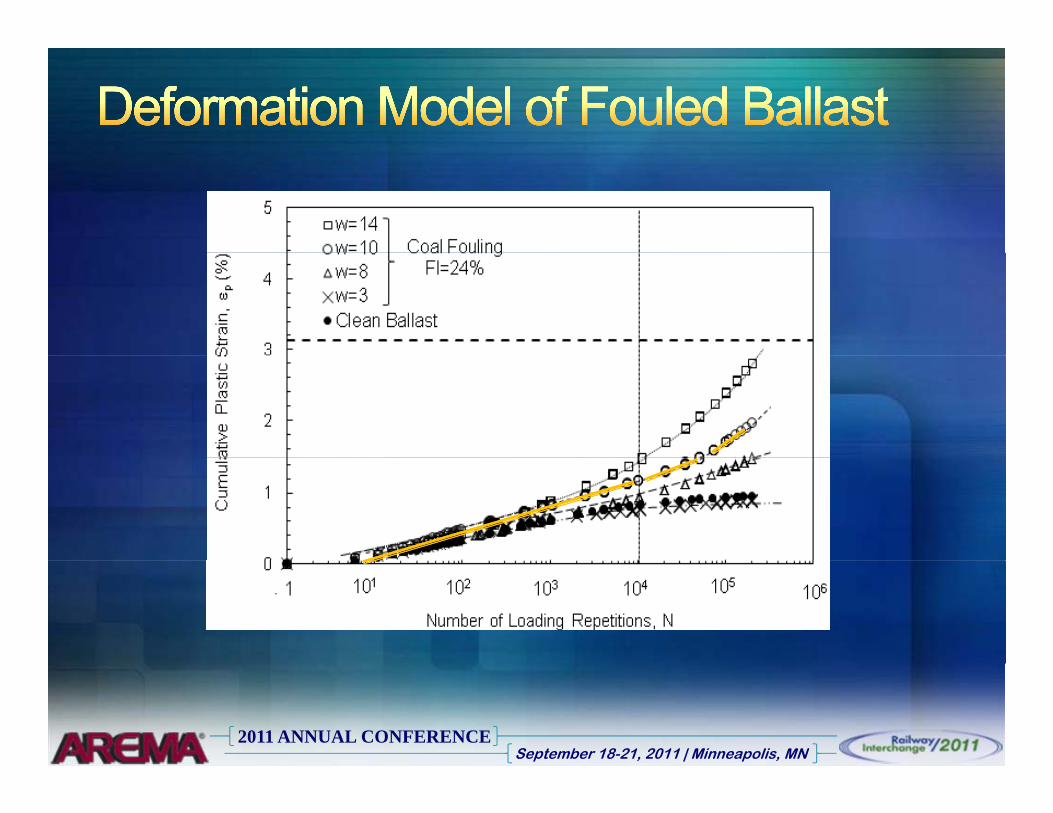
4 SUMMARY BEHAVIOR OF FOULED BALLAST
Plastic strain (p) of fouled ballast was measured as a function of loading cycles (N) for a wide
range of FI and water contents (w), The rate of p in semi-logarithmic scale, rp, was calculated
based on measured plastic strain in the cyclic triaxial test. The number of load repetitions (N)
© 2011 AREMA ®
was converted into million gross tones for rail cars with axle load of 264 kN (30 tones)
(610
30NMGT
). Mineral and coal fouling were called ‘non-cohesive fouling’ and have similar
deformational behavior. As described by Ebrahimi (2011), the p of ballast increases linearly up
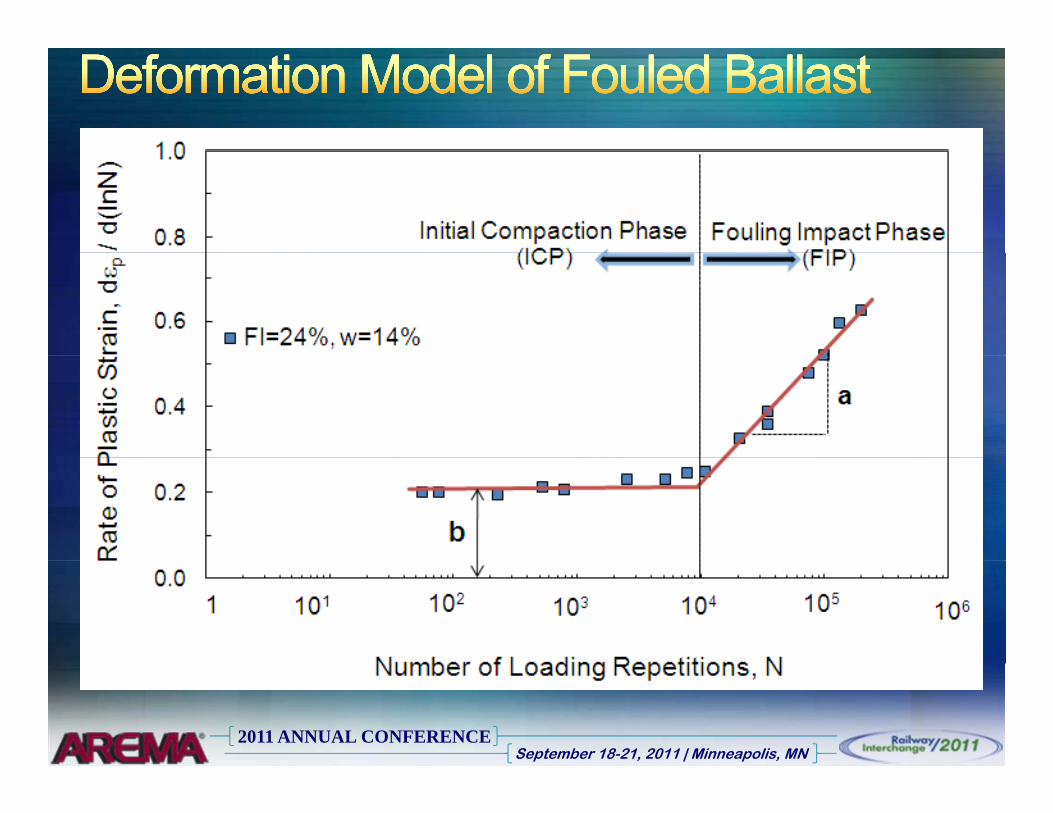
to N=104 (0.3 MGT) in a semi-log scale. This part of the deformation model is called the ‘initial
compaction phase (ICP)’. The rate of plastic strain (rp= dep/dlnN) of ballast is fairly constant in
the ICP. When the ICP is passed, an increase in p is pronounced. This part of the
deformational behavior of ballast is called the ‘fouling impact phase - FIP’. Therefore, a
deformation model was proposed as shown in Fig. 1 to account for ICP and FIP phases in the
accumulation of plastic strain of fouled ballast. Parameters ‘a’ and ‘b’ in Fig. 1 represent the
ICP and FIP in the deformation model of ballast.
5 DEFORMATION MODEL OF RAILWAY BALLAST
Ballast is typically placed in a railway track in a clean or slightly fouled condition. However,
generation of fouling continues during track service life. To predict the deformation of ballast
during the service life of rail track, three steps were taken: (1) the deformation model for railway
ballast in a various fouling conditions (combination of w and FI) was characterized, (2) the
deformation model for ballast at different states of stress was determined, and (3) an
incremental analysis (integrating the change of FI, w, and traffic loading during the service life of
track) was performed.
5.1 Effect of fouling and water content on mechanistic-based deformation model
The mechanistic-based deformation model of ballast was determined at given FI, w, and
reference confining (3ref) and cyclic (dref) stresses of 90 kPa and 300 kPa, respectively.
Change in FI during LSCT tests was assumed negligible (less than 0.5%), which is in
© 2011 AREMA ®
agreement with typical fouling generation rates of ballast, about 0.1%/MGT (Selig and Waters
1994). The rate of plastic strain (rp) of ballast is defined:
bNlnd
dr
pp
N < 104 (0.3 MGT) (Eq. 1a)
)10N(logab
Nlnd
dr 4pp
N > 104 (Eq. 1b)
The effect of fouling and moisture on parameters ‘a’ and ‘b’ at the representative state of stress
were determined from the data in Table 1. The parameters aref and bref can be defined as:
)3w(FISa aref (w > 3%) R2=0.91 (Eq.2a)
obref b)3w(FISb (w > 3%) R2=0.87 (Eq.2b)
When w ≤ 3%, the rp of ballast is constant (bo= 0.08) and rp diminishes toward zero at FIP. Sa is
0.0012 and Sb is 0.0005 for fresh ballast conditions. Sa and Sb may change for different types of
ballast (recycled or clean ballast) and fouling materials. Increasing FI and w accelerates the rp
of ballast both at the ICP and FIP, with corresponding parameters ‘a’ and ‘b’. At a given w, the
rp of ballast at the ICP (i.e., parameter a) increases 2.5 times more than the rp of ballast in the
FIP (compare Sb). The parameters a and b increase relatively linearly with FI and w for the
series of tests conducted on fouled railway ballast.
5.2 Effect of state of stress on deformational behavior of ballast
To include the state of stress in the deformation model of railway ballast, parameters ‘a’ and ‘b’
at various states of stress were calculated relative to those with the reference state of stress
(i.e., aref and bref). The ratio of principal stresses (1 /3) is used to determine the deformational
behavior of ballast in various states of stress, where 1 = d + 3. The reference confining
stress (3 ref) of 90 kPa and cyclic stress (d ref) of 300 kPa results in 1 /3 = 4.3. The range of
© 2011 AREMA ®
1 /3 from 3 to 10 was considered in the series of LSCT tests accounting for range of stresses
ballast can experience in the track. The range of stresses was derived from a finite element
analysis as described by Ebrahimi (2011).
The parameters of the deformation model (i.e., ‘a’ and ‘b’) at various states of stress are
summarized in Table 1. The normalized parameters refa
aand
refb
b as a function of 1 /3 are
described as:
)(20.0a
a
3
1
ref
R2=0.94 (Eq.3a)
26.0)(26.0b
b
3
1
ref
R2=0.95 (Eq.3b)
Parameter a increases linearly by a factor of 0.20 and parameter b increases linearly by a factor
of 0.26 with ratio of principal stresses. The rp in initial compaction phase (i.e., b) approaches
zero when 1 /3 reaches to 1; i.e., isotropic stress condition for the ballast.
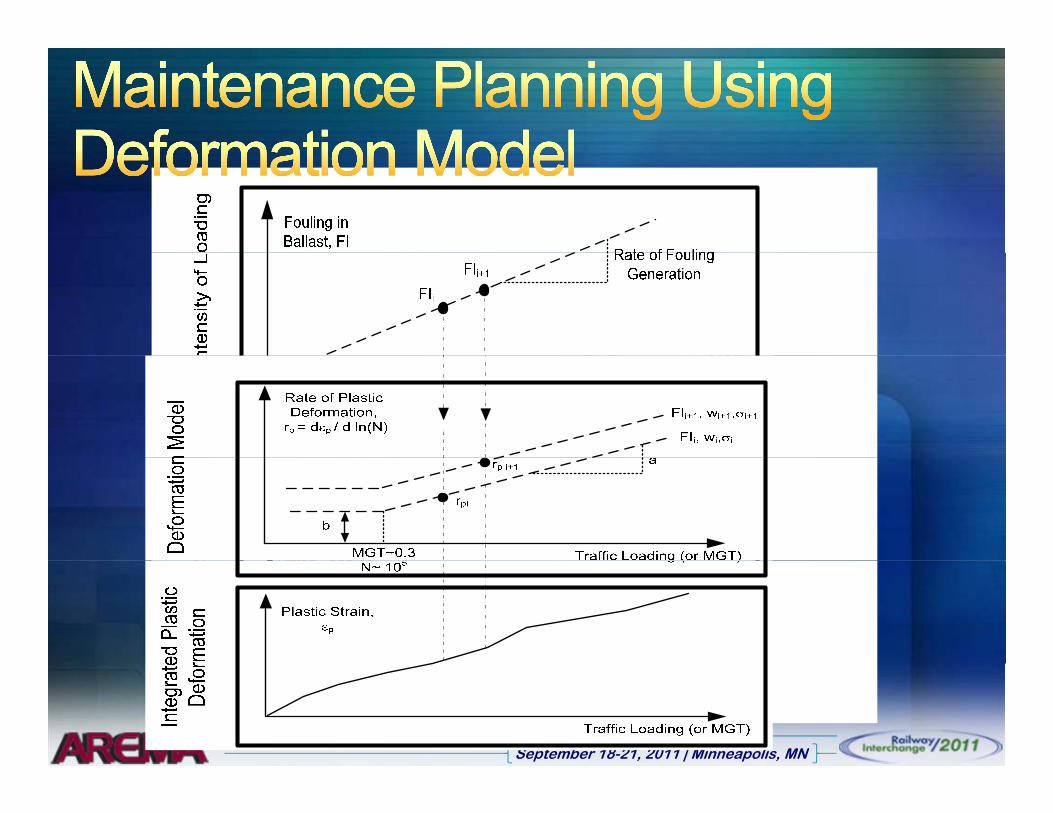
5.3 Incremental analysis by integrating change of fouling, moisture, and state of stress
The continual change of fouling content (i.e., due to generation of fouling), moisture (i.e., effect
of climate), and stress (due to heavier freight load or higher speed) should be incorporated into
the deformation model of railway ballast to determine the track surface deviation during traffic
loading. To account for changes in fouling, moisture, and stress, the p of ballast should be
calculated in increments of traffic (i.e., N or MGT). Fig. 2 demonstrates schematically how
change of fouling, water content, and state of stress is captured in an integrated deformation
model for railway ballast. Based on this approach, FI is determined from the rate of fouling
generation from the field data and quality of materials, while moisture and state of stress are
© 2011 AREMA ®
from the climate and traffic data. Accumulation of p of ballast (pi) in a period of Ni to Ni+1 traffic
loading is calculated by integrating the rp of ballast:
)N(lnd
)N(lnd
d1i
i
N
N
p
pi
(Eq.4)
where Ni is the ith increment of integration for the plastic strain. Accumulation of p of ballast in
different fouling conditions is calculated by summing the pi in increments of traffic, as:
N
1i
i
N
Ni
p
P ))N(lnd))N(lnd
d(()N(
1i
(Eq.5)
In Eq.13, the rp of ballast ()N(lnd
d p)i in ith increment of traffic is a function of FI, w, and stress
level at the beginning of each traffic (or time) increment and is calculated from the developed
mechanistic-based deformation model of railway ballast in this study.
6 DEFORMATION MODEL OF RAILWAY SUBGRADE
To determine the surface deviation of railway track due to accumulation of deformation in the
rail substructure, deformational behavior of both ballast and subgrade layers are required. The
deformation of subgrade can be predicted using the equation proposed by Li and Selig (1994),
as follows:
dm
s
dsps N)(c)N(
(Eq.6)
where ps (%) is the plastic strain of railway subgrade, ds is the deviator stress on the subgrade,
and s is the unconfined subgrade strength described by Li and Selig (1994). Parameters ‘c’,
‘d’, and ‘m’ are related to the type of subgrade materials and proposed by Li and Selig (1994)
and summarized in Table 2. The incremental accumulation of plastic strain within the subgrade
© 2011 AREMA ®

is also calculated with similar approach to the railway ballast to incorporate the strength of
subgrade (i.e., s) and the state of stress (i.e., sd).
Talbot’s equation (1985) was used to find the cyclic stress on subgrade (sd). The stress
beneath the centerline of the tie at depth h (mm) below the tie, sd, (kPa) is a function of stress
over the bearing area of the tie (t, kPa). Therefore, for a given thickness of ballast equal to h,
stress on the subgrade is,
25.1
tsd
h957
(Eq.7)
7 RAIL TRACK SURFACE DEVIATION
Chrismer and Selig (1994) showed that the change in surface deviation of the railway track (v)
is a function of initial surface deviation (v0), and the deformation of the track (dL) under traffic
loading is:
Lvov d15.0 (Eq.8)
where v0 = 2.5 mm was recommended if input data is lacking. dL is the track deformation (from
fouled ballast and subgrade), which is calculated from the deformation model presented in this
study. This approach is adopted here.
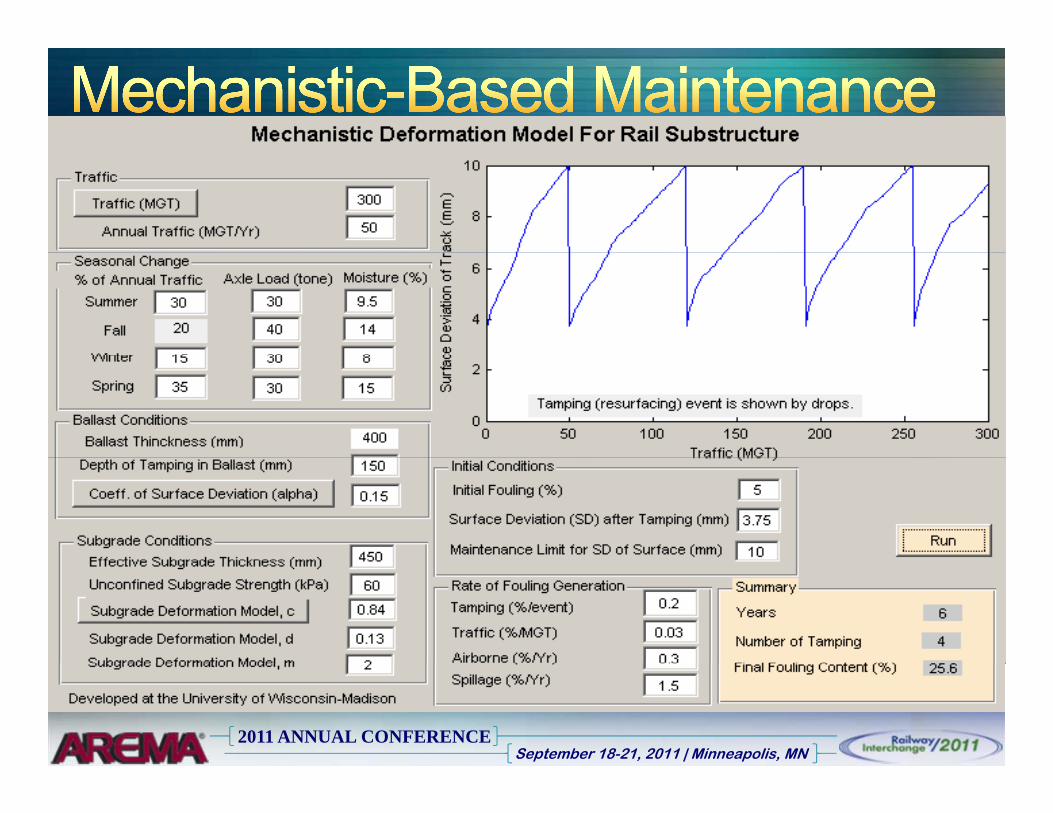
8 MECHANISTIC-BASED MAINTENANCE PLANNING MODEL FOR RAIL SUBSTRUCTURE
(WiscRailTM)
A computer software program was developed using MATLABTM to predict the surface deviation
of the railway track due to railway substructure deformation. This program incorporates the
mechanistic-based deformation model of railway ballast and subgrade as described above. The
graphical user interface of the mechanistic-based maintenance planning model for railway
substructure, called ‘WiscRailTM’, is shown in Fig. 3. This program is capable of predicting the
© 2011 AREMA ®
surface deviation of railway track for different fouling conditions, weather conditions, subgrade
materials, and traffic loads. As shown in Fig. 3, the program includes traffic data, change in axle
load (indication of heavier freight load), moisture in fouled ballast, ballast conditions (i.e., initial
fouling condition), subgrade materials, initial track condition, rate of fouling generation (due to
particle breakage, subgrade infiltration, and external fouling), and depth of tamping. It was
assumed that rate of plastic deformation of ballast deeper than depth of taming continues from
previous traffic loading(i.e., smaller rate of plastic deformation due to a denser condition),
however rate of plastic deformation within the tamped layer starts over (i.e., fouled ballast is
rearranged to a looser condition after tamping). When track surface deviation, due to
substructure deformation, exceeds the assigned limit (based on various classes of railway
systems and operation speeds), then maintenance is required. An example of required track
alignments (i.e., tamping) with specified 10-mm limit for surface deviation is shown in Fig. 3. As
predicted in summary results, for the given traffic and track conditions, five tamping
maintenances are required in seven years of track operation, while the fouling content of ballast
increases from 5 to 29%.
10 SUMMARY AND CONCLUSIONS
A maintenance planning program was presented based on a deformation model of railway
substructure. Predicting the permanent deformation of ballast, the approach taken was based
on a mechanistic-based ballast deformation model based on the data obtained using large-scale
cyclic triaxial apparatus. Two main phases were distinguished in the deformation model: (1) an
initial compaction phase, where the semi-logarithmic rate of plastic strain of ballast (rp) remains
constant for loading cycles, N up to 10 000 and (2) a fouling impact phase, where rp increases
linearly in a semi-log scale due to the presence of fouling materials. Parameters ‘a’ and ‘b’ were
used to characterize the FIP and ICP in the deformation model. A correlation between ‘a’ and
© 2011 AREMA ® ® ®
‘b’ parameters and fouling index, moisture, and state of stress are presented. An incremental
integration of plastic deformation of railway ballast in different fouling, moisture, and traffic
loading conditions is used, along with a subgrade deformation model, to predict the surface
deviation of the railway track. Finally, a mechanistic-based maintenance planning software
program was developed by incorporating the mechanistic-based deformation model for railway
substructure. The developed model is based on laboratory tests and, although powerful, is
recommended for a field validation prior to full-scale implementation in the profession.
ACKNOWLEDGEMENT
Funding for this research was provided by the National Center for Freight and Infrastructure
Research and Education (C-FIRE). Assistance from the BNSF Railway and Wisconsin and
Southern Railroad Company for providing the ballast is appreciated.
REFERENCES
Andersson, M., 2002, Strategic Planning of Track Maintenance, Swedish National Rail Administration (Banverket), TRITA-INFRA 02-035
Chang, C.C., and Lin, C.J., 2001, LIBSVM: a Library for Support Vector Machines, Software
available at http://www.csie.ntu.edu.tw/~cjlin/libsvm Chrismer, S., and Davis, D., 2000, Cost Comparisons of Remedial Methods to Correct Track
Substructure Instability, Trans. Res. Rec., 1713, Paper #00-019, 10-15 Chrismer, S.M., and Selig, E.T., 1994, Mechanics-Based Model to Predict Ballast-Related
Maintenance Timing and Costs, Ass. of American Railroads, Report No. R-863, AAR-Technical Centre, Chicago, Illinois, USA
Darell, D.D., 2003, Substructure Can Add Life to Rail and Ties, Railway Track and Structures,
99(3), pp.25–27 Dibike, Y.B., Velickov, S., Solomatine, D.P., Abbott, M.B., 2001, Model Induction with Support
Vector Machines: Introduction and Applications. Journal of Computing in Civil Engineering, 15(3), pp.208–216
© 2011 AREMA ®
Ebrahimi, A. 2011, Deformational Behavior of Railway Ballast, PhD Dissertation, University of Wisconsin-Madison.
Fazio, A.E., and Prybella, R., 1980, Development of an Analytical Approach to Track
Maintenance Planning, Trans. Res. Rec. 744, National Research Council, National Academy Press, Washington, D.C., USA, pp.46-52
Hsu, J., Chang, C.C., and Lin, C.J., 2010, A Practical Guide to Support Vector Classification Huang, H., Tutumluer, E., Dombrow, W., 2009, Laboratory Characterization of Fouled Railroad
Ballast Behavior, 88th annual Mtg. of Trans. Res. Board, on CD-ROM Larsson, D., and Gunnarsson, J., 2001, A Model to Predict Track Degradation Costs, Proc. of
the 7th Inter. Heavy Haul Conf., Inter. Heavy Haul Ass. Inc., Virginia Beach, VA, USA, pp. 437-444.
Lee, H. M., 2009, Ballast Evaluation and Hot Mixed Asphalt Performance, Proc. BCR2A Conf.,
Univ. of Illinois Urbana-Champaign, Urbana, IL, pp.1283-1289 Li, D., and Selig, E.T., 1994, Cumulative Plastic Deformation for Fine-Grained Subgrade Soils,
J. Geotech. Engrg., ASCE, 122(12), pp.1006-1014 Maalouf, M., Khoury, N., and Trafalis, T.B., 2008, Support Vector Regression to Predict Asphalt
Mix Performance. International Journal For Numerical And Analytical Methods In Geomechanics, 32, pp.1989–1996
Pal, M., 2006, Support Vector Machines-Based Modeling of Seismic Liquefaction Potential,
International Journal for Numerical & Analytical Methods in Geomechanics, 30, pp.983–996
Selig, E.T., and Waters, J.M., 1994, Track Geotechnology and Substructure Management,
Thomas Telford, NY Smola, A.J., and Scholkopf, B., 2004, A Tutorial on Support Vector Regression, Statistics and
Computing, 14, pp.199-222 Stirling, A.B., Roberts, C.M., Chan, A.H.C., Madelin, K.B., and Bocking, A., 1999, Development
of A Rule Base (Code of Practice) for the Maintenance of Plain Track in the UK to Be Used in An Expert System, 2nd Inter. Conf. on Railway Engineering, London, UK
Su, L., Rujikiatkamjorn, C., Indraratna, B., 2010, An Evaluation of Fouled Ballast in a Laboratory
Model Track Using Ground Penetrating Radar, ASTM Geot. Testing J., GTJ103045 Talbot, A.N., 1985, Stresses in Railroad Track-The Talbot Reports, American Railway
Engineering Association Vapnik V.N., 1995, The Nature of Statistical Learning Theory, Springer: New York
© 2011 AREMA ®
Zarembski, A.M., 1998, Development and Implementation of Integrated Maintenance Planning Systems, Transportation Research Board Annual Meeting 1998, Washington D.C.
© 2011 AREMA ®
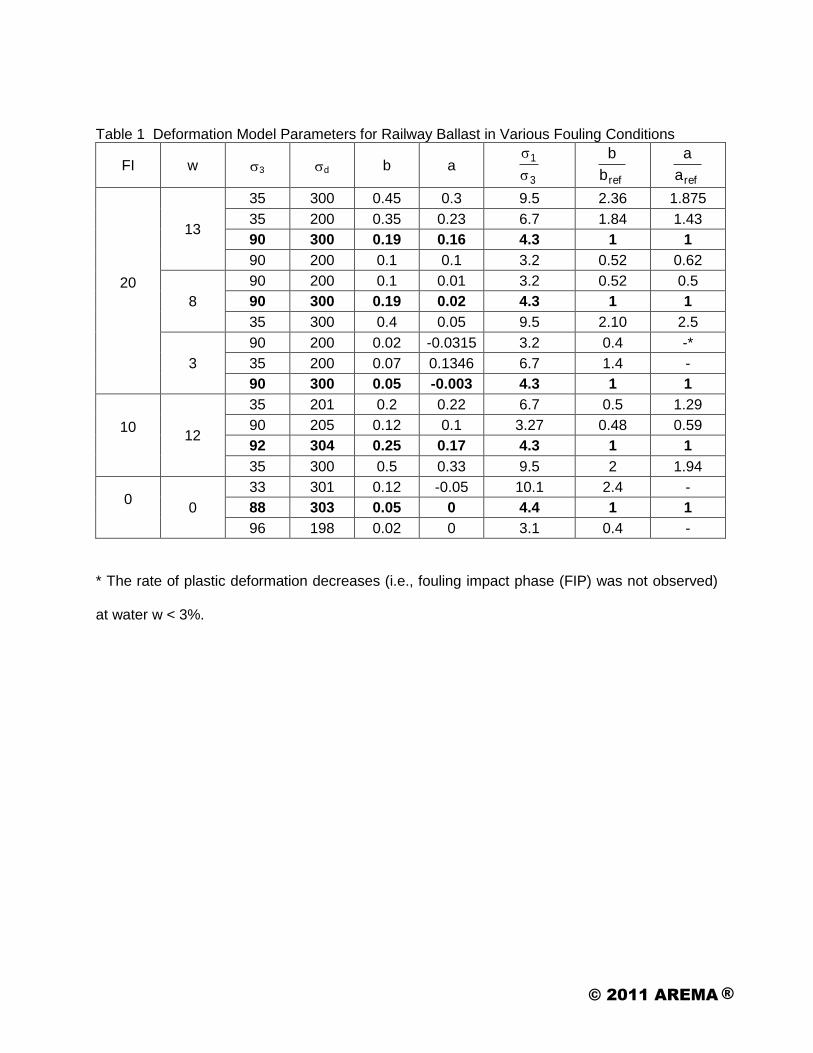
Table 1 Deformation Model Parameters for Railway Ballast in Various Fouling Conditions
FI w 3 d b a 3
1
refb
b
refa
a
20
13
35 300 0.45 0.3 9.5 2.36 1.875
35 200 0.35 0.23 6.7 1.84 1.43
90 300 0.19 0.16 4.3 1 1
90 200 0.1 0.1 3.2 0.52 0.62
8
90 200 0.1 0.01 3.2 0.52 0.5
90 300 0.19 0.02 4.3 1 1
35 300 0.4 0.05 9.5 2.10 2.5
3
90 200 0.02 -0.0315 3.2 0.4 -*
35 200 0.07 0.1346 6.7 1.4 -
90 300 0.05 -0.003 4.3 1 1
10 12
35 201 0.2 0.22 6.7 0.5 1.29
90 205 0.12 0.1 3.27 0.48 0.59
92 304 0.25 0.17 4.3 1 1
35 300 0.5 0.33 9.5 2 1.94
0 0
33 301 0.12 -0.05 10.1 2.4 -
88 303 0.05 0 4.4 1 1
96 198 0.02 0 3.1 0.4 -
* The rate of plastic deformation decreases (i.e., fouling impact phase (FIP) was not observed)
at water w < 3%.
© 2011 AREMA ®
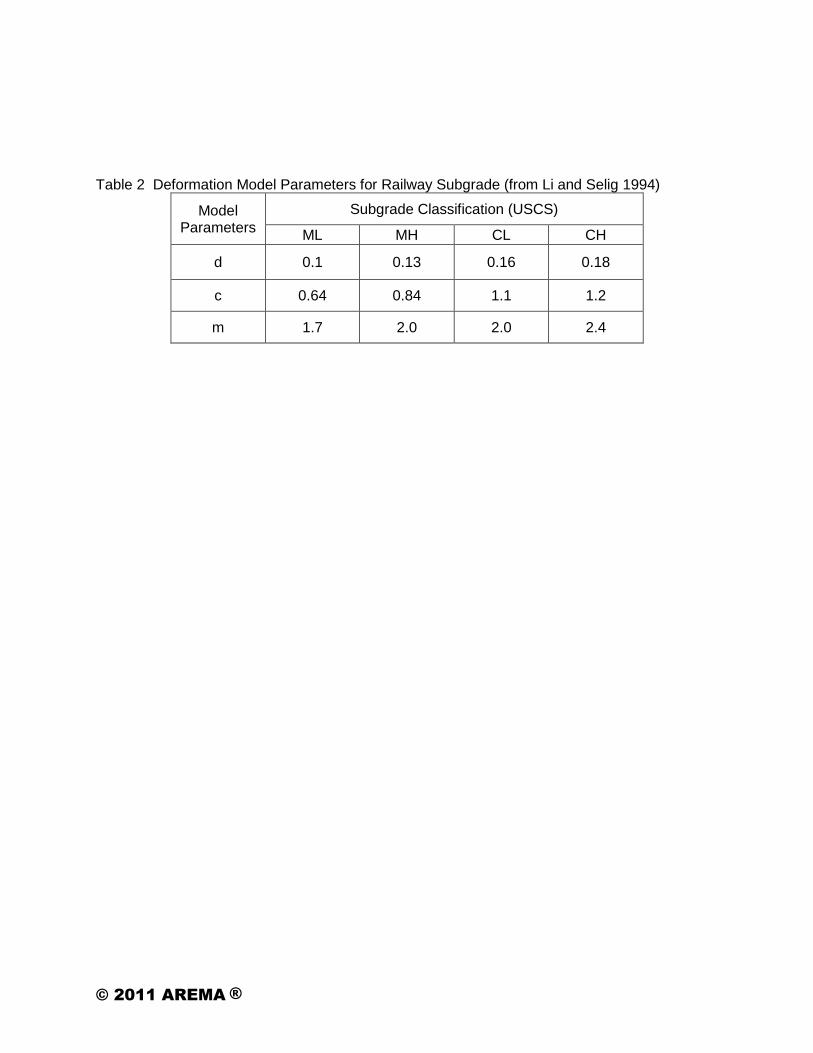
Table 2 Deformation Model Parameters for Railway Subgrade (from Li and Selig 1994)
Model Parameters
Subgrade Classification (USCS)
ML MH CL CH
d 0.1 0.13 0.16 0.18
c 0.64 0.84 1.1 1.2
m 1.7 2.0 2.0 2.4
© 2011 AREMA ®
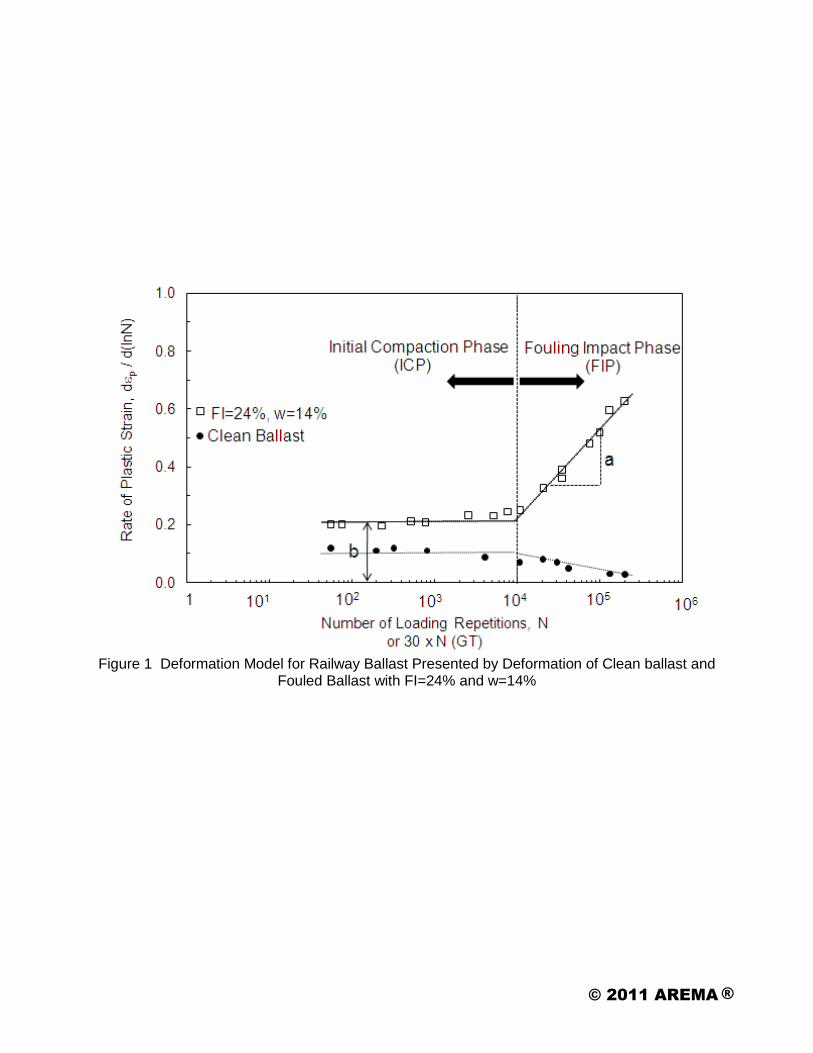
Figure 1 Deformation Model for Railway Ballast Presented by Deformation of Clean ballast and
Fouled Ballast with FI=24% and w=14%
© 2011 AREMA ®

Rate of Plastic
Deformation,
rp
= dp
/ d ln(N)
a
b
MGT~0.3
N~ 105
Fouling in
Ballast, FIRate of Fouling
Generation
Moisture of
Fouling, w
Summer
Fall
Winter
Spring
Plastic Strain,
p
Traffic Loading (or MGT)
FIi+1
, wi+1
,i+1
wi
FIi
FIi+1
wi+1
rpi
rp i+1
Traffic Loading,
Tones
i
i+1
FIi, w
i,
i
Traffic Loading (or MGT)
Traffic Loading (or MGT)
Traffic Loading (or MGT)
Traffic Loading (or MGT)
Inp
ut In
form
atio
n:
Ra
te o
f F
ou
ling
Ge
ne
ratio
n, M
ois
ture
, In
ten
sity o
f L
oa
din
gD
efo
rma
tio
n M
od
el
Inte
gra
ted
Pla
stic
De
form
atio
n
Figure 2 Maintenance Planning Using Incremental Analysis of Deformation Model for Ballast with Changing States of Fouling, Moisture, and Traffic
© 2011 AREMA ®
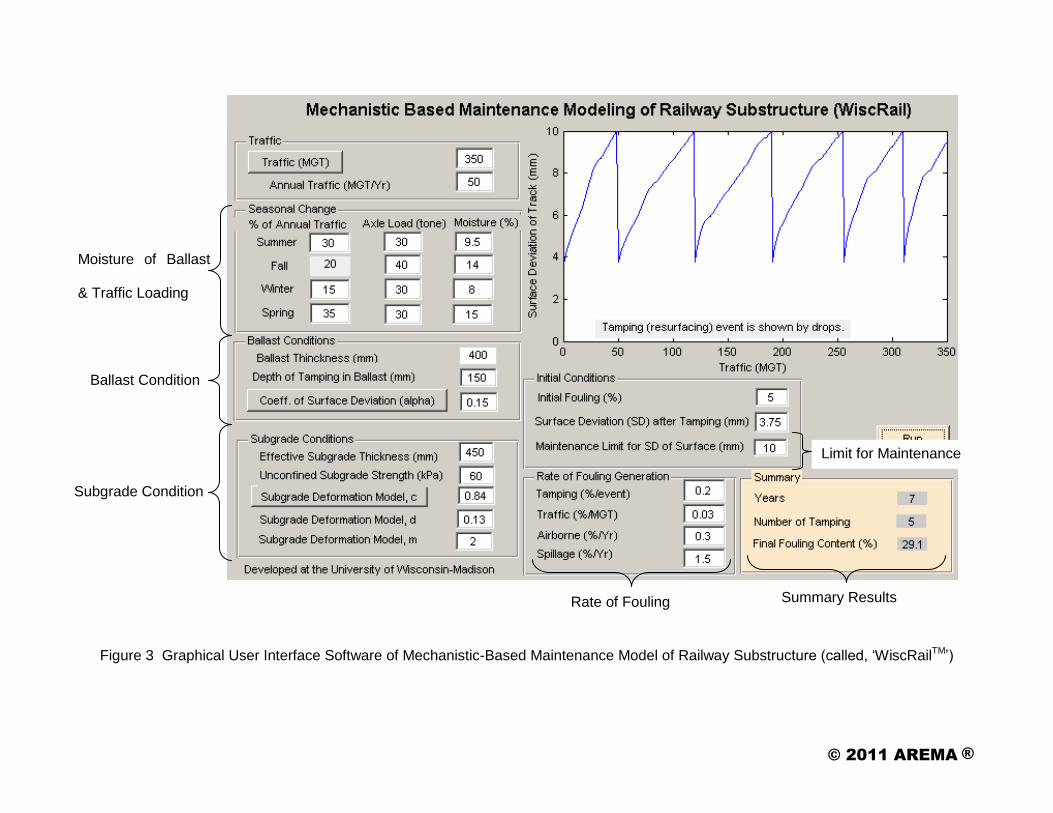
Figure 3 Graphical User Interface Software of Mechanistic-Based Maintenance Model of Railway Substructure (called, ‘WiscRailTM’)
Subgrade Condition
Ballast Condition
Moisture of Ballast
& Traffic Loading
Limit for Maintenance
Summary Results Rate of Fouling
© 2011 AREMA ®
1Ali Ebrahimi, 2Andrew Keene1 Senior Staff Engineer Geosyntec Consultant1 Senior Staff Engineer, Geosyntec Consultant2 Graduate Student, UW-Madison
2011 ANNUAL CONFERENCESeptember 18-21, 2011 | Minneapolis, MN
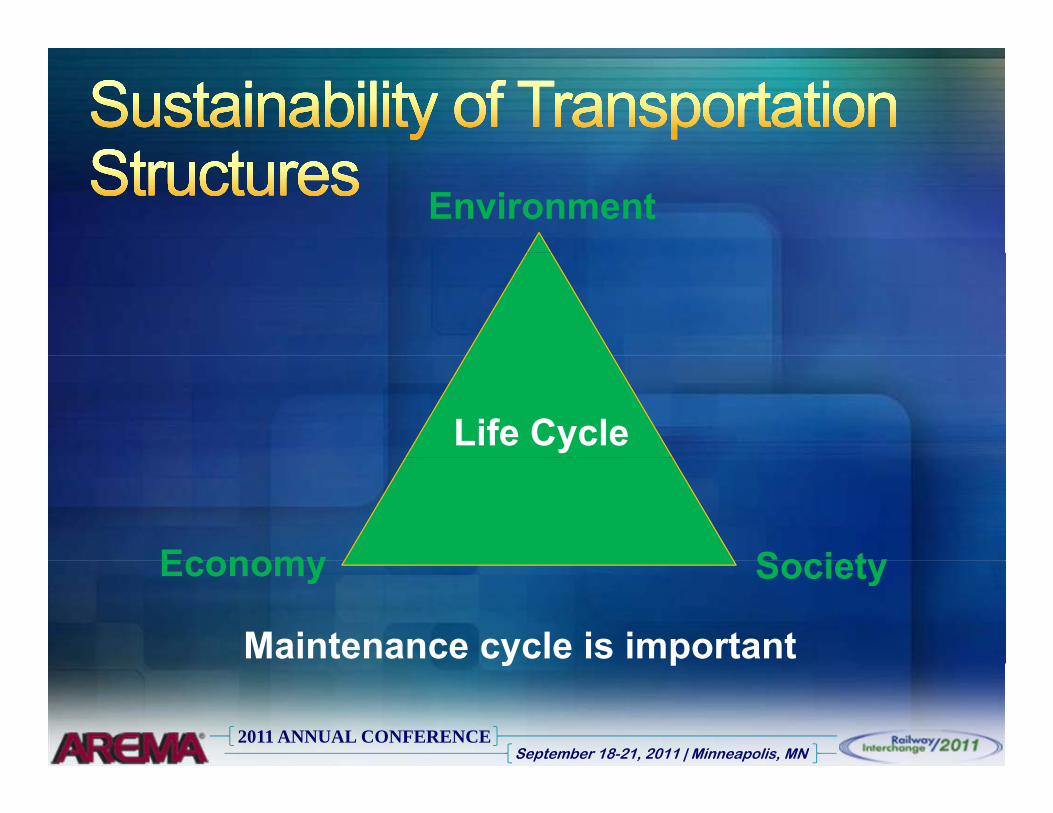
Environment
Life Cycle
Economy SocietyEconomy Society
Maintenance cycle is important
2011 ANNUAL CONFERENCESeptember 18-21, 2011 | Minneapolis, MN
y p

2011 ANNUAL CONFERENCESeptember 18-21, 2011 | Minneapolis, MN
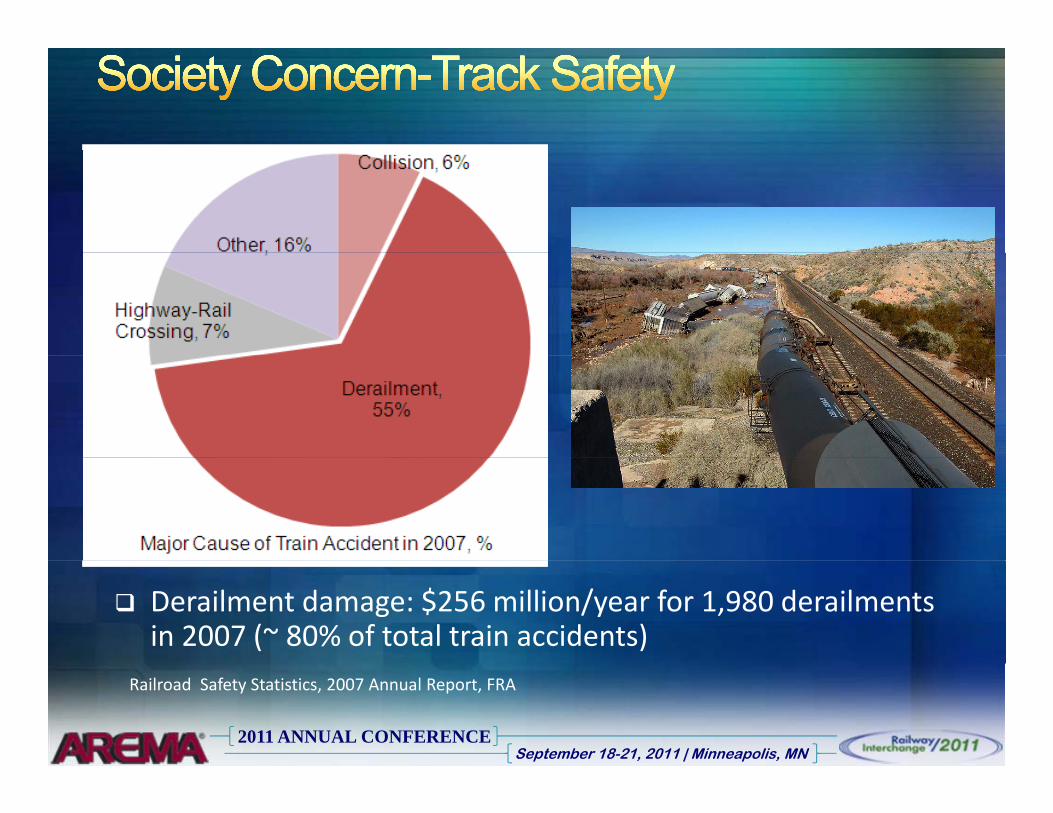
Derailment damage: $256 million/year for 1,980 derailments in 2007 (~ 80% of total train accidents)
2011 ANNUAL CONFERENCESeptember 18-21, 2011 | Minneapolis, MN
Railroad Safety Statistics, 2007 Annual Report, FRA
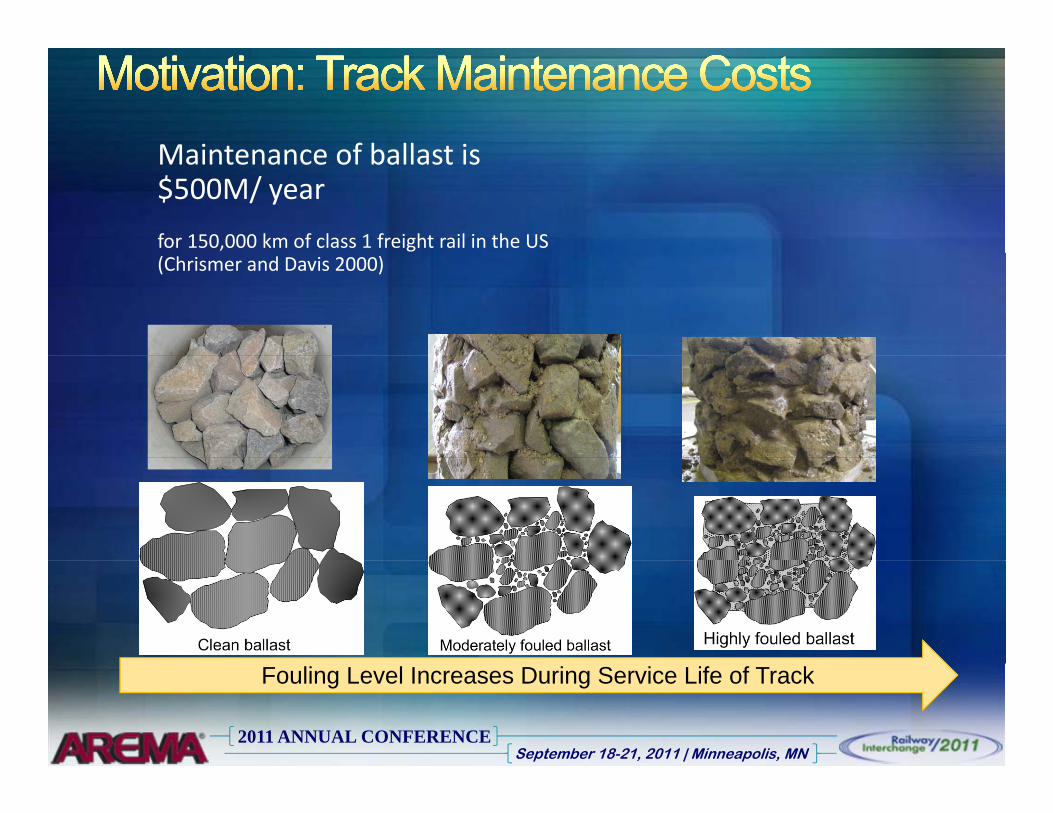
Maintenance of ballast isMaintenance of ballast is $500M/ year
for 150,000 km of class 1 freight rail in the US (Chrismer and Davis 2000)
2011 ANNUAL CONFERENCESeptember 18-21, 2011 | Minneapolis, MN
Railroad Safety Statistics, 2007 Annual Report, FRAFouling Level Increases During Service Life of Track
Surface Deviation
2011 ANNUAL CONFERENCESeptember 18-21, 2011 | Minneapolis, MN
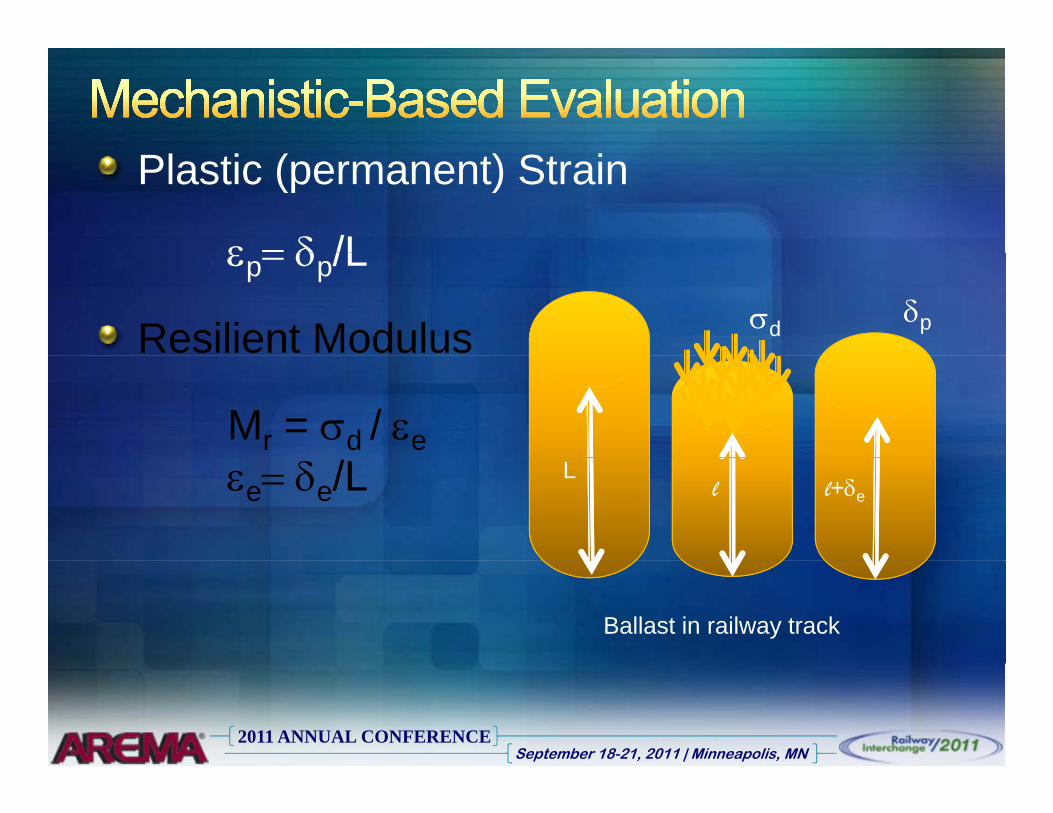
Plastic (permanent) Strain
ε = δ /L
Resilient Modulus σd
εp= δp/Lδp
Mr = σd / εeLεe= δe/L l l+δe
Ballast in railway track
2011 ANNUAL CONFERENCESeptember 18-21, 2011 | Minneapolis, MN
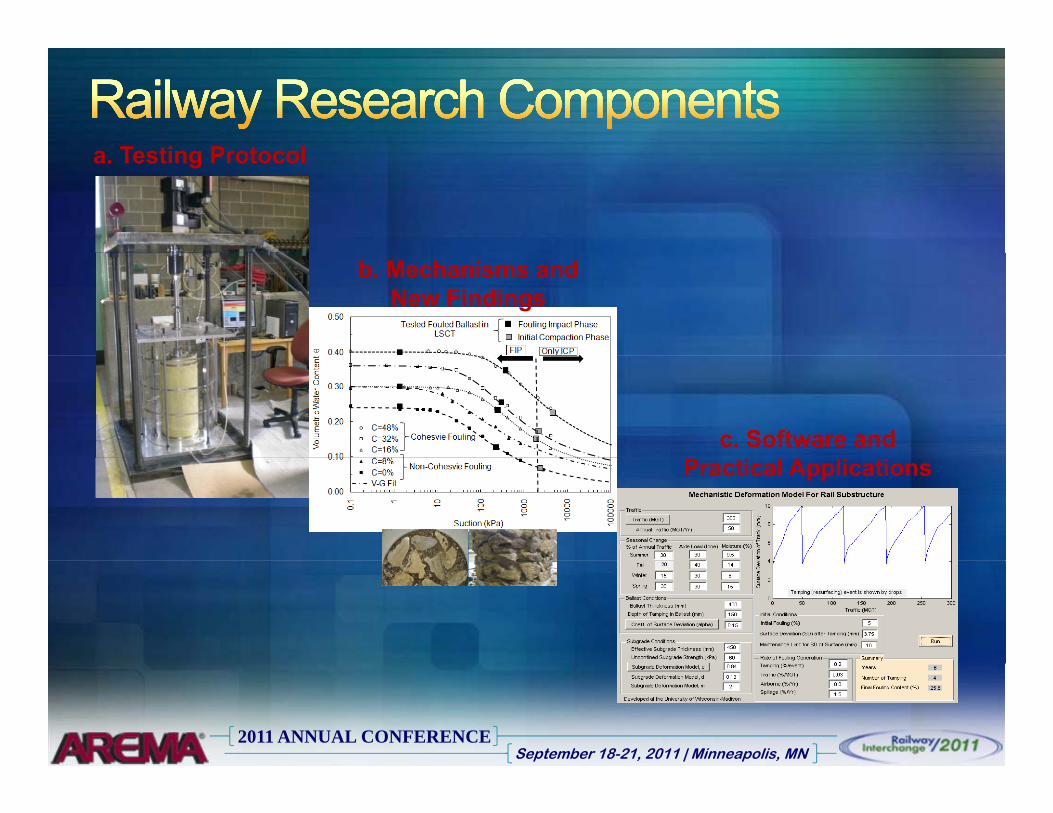
T ti P t la. Testing Protocol
b. Mechanisms and New Findings
c. Software and Practical Applications
2011 ANNUAL CONFERENCESeptember 18-21, 2011 | Minneapolis, MN
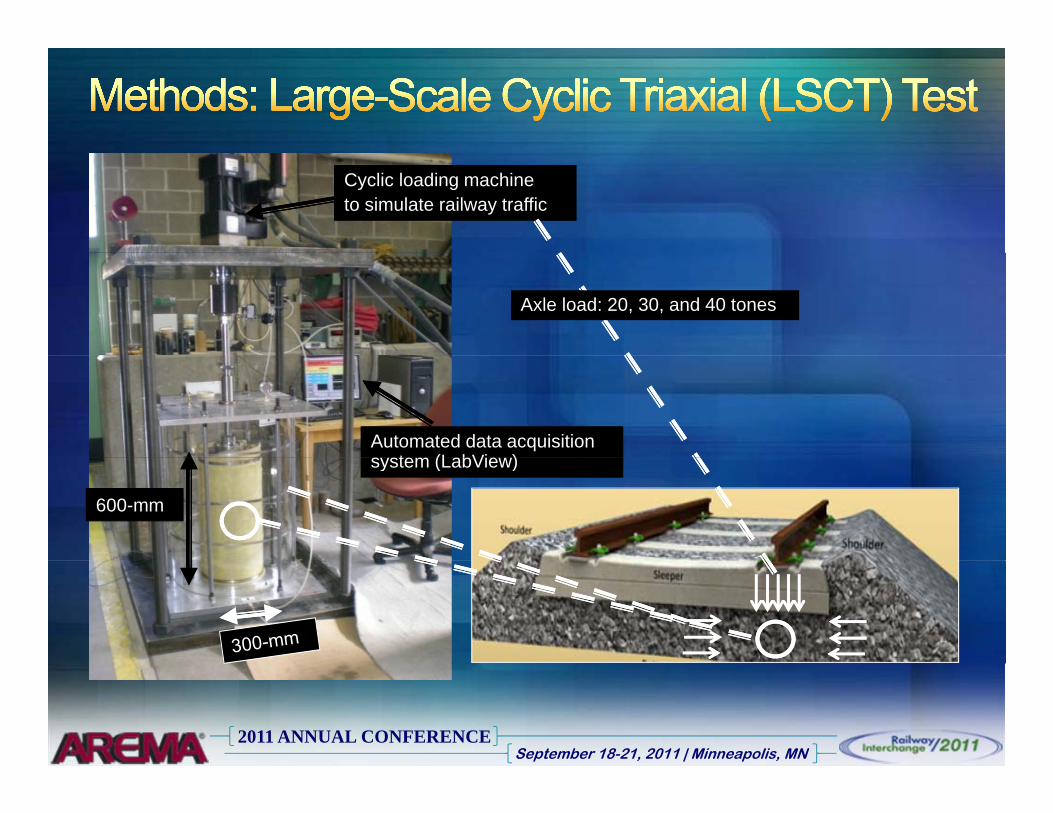
Cyclic loading machineto simulate railway traffic
Axle load: 20, 30, and 40 tones
Automated data acquisition system (LabView)
600-mm
system (LabView)
2011 ANNUAL CONFERENCESeptember 18-21, 2011 | Minneapolis, MN
2011 ANNUAL CONFERENCESeptember 18-21, 2011 | Minneapolis, MN
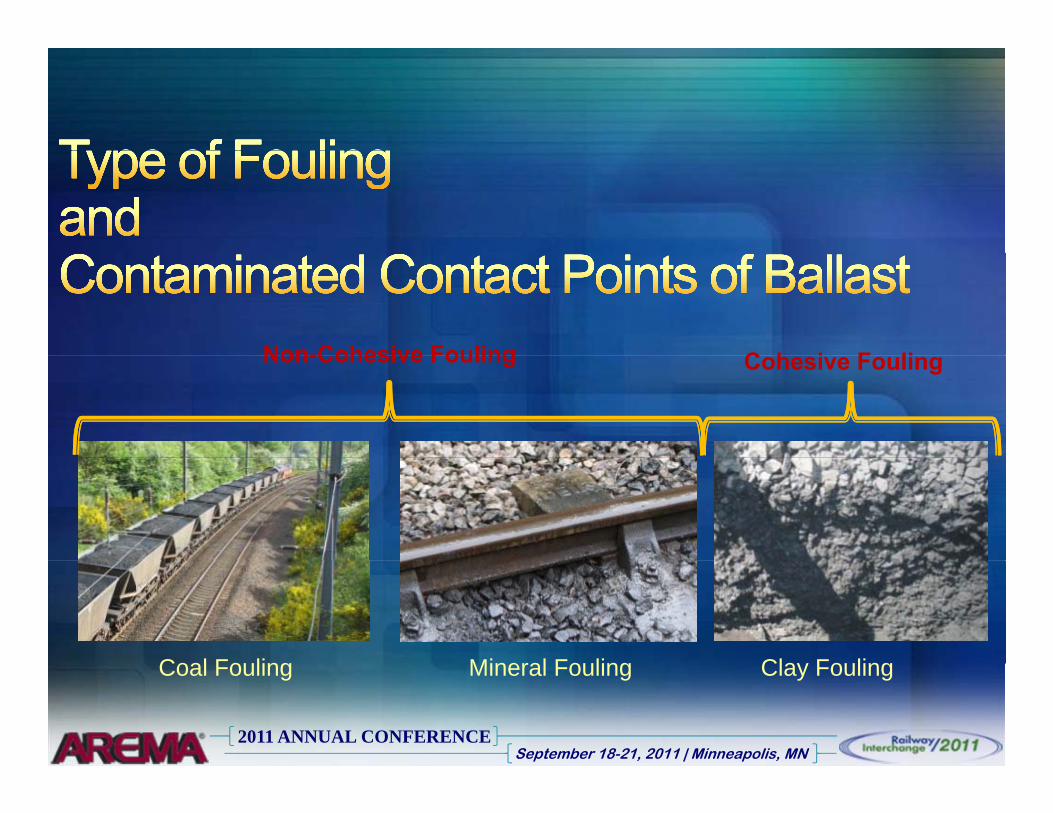
Non-Cohesive Fouling C h i F liNon-Cohesive Fouling Cohesive Fouling
Coal Fo ling Mineral Fo ling Cla Fo ling
2011 ANNUAL CONFERENCESeptember 18-21, 2011 | Minneapolis, MN
Coal Fouling Mineral Fouling Clay Fouling
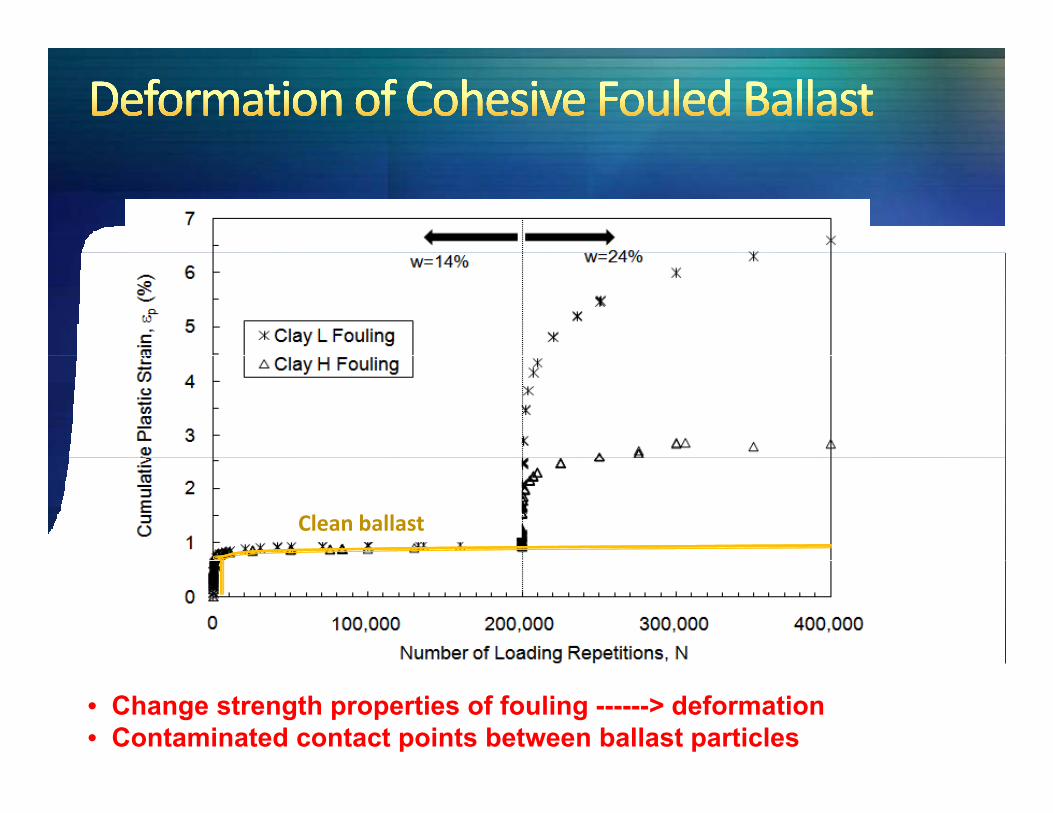
Clean ballast
• Change strength properties of fouling ------> deformation• Contaminated contact points between ballast particles
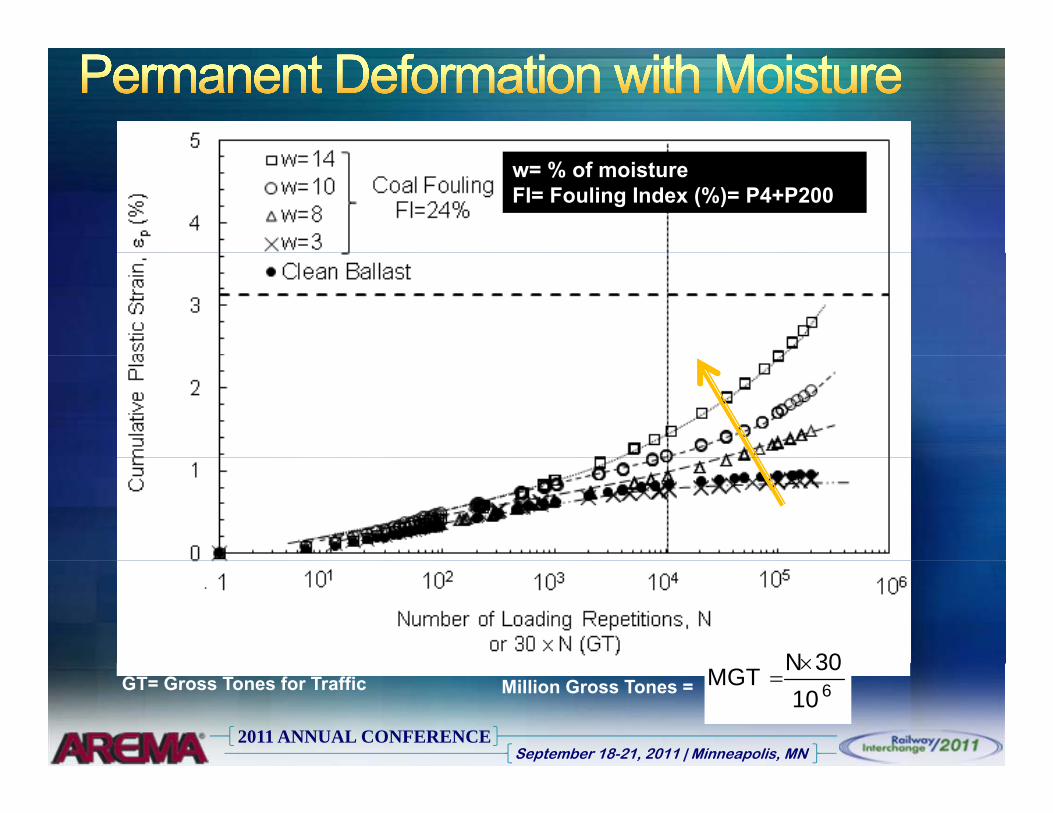
w= % of moistureFI= Fouling Index (%)= P4+P200
30N×
2011 ANNUAL CONFERENCESeptember 18-21, 2011 | Minneapolis, MN
GT= Gross Tones for Traffic 61030NMGT ×
=Million Gross Tones =
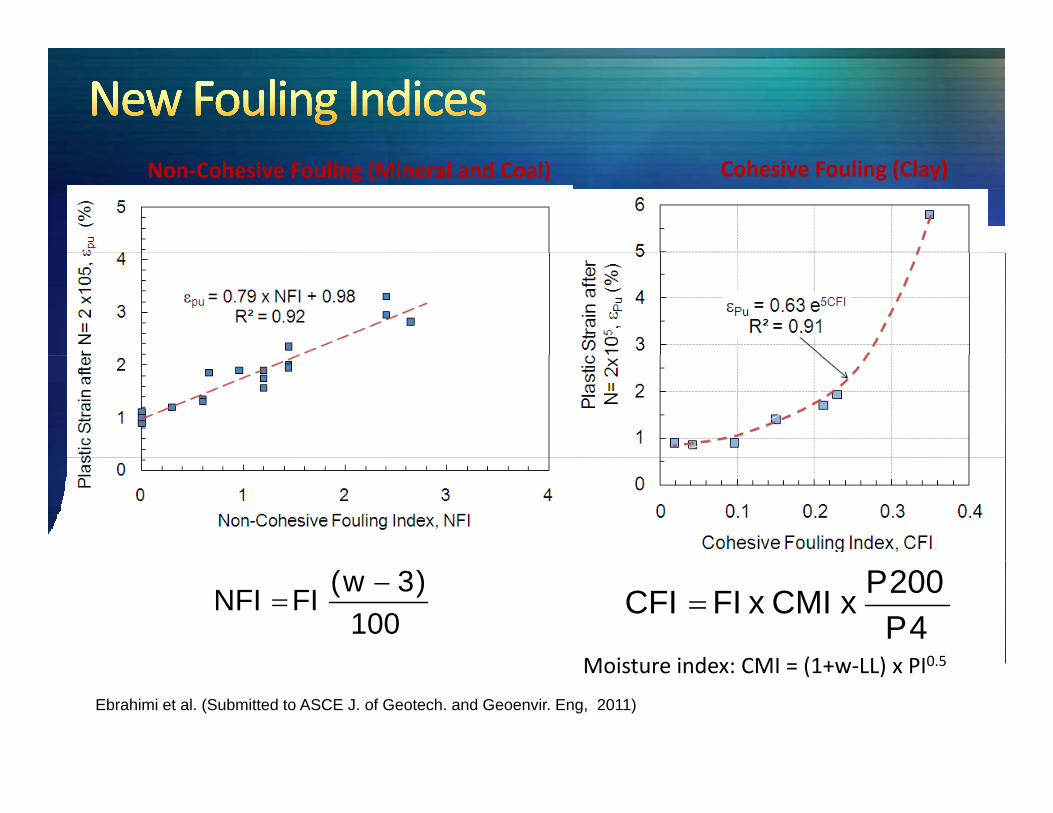
Cohesive Fouling (Clay)Non‐Cohesive Fouling (Mineral and Coal)
4P200PxCMIxFICFI =
Moisture index: CMI (1+w LL) x PI0 5100
)3w(FINFI −=
Ebrahimi et al. (Submitted to ASCE J. of Geotech. and Geoenvir. Eng, 2011)
Moisture index: CMI = (1+w‐LL) x PI0.5
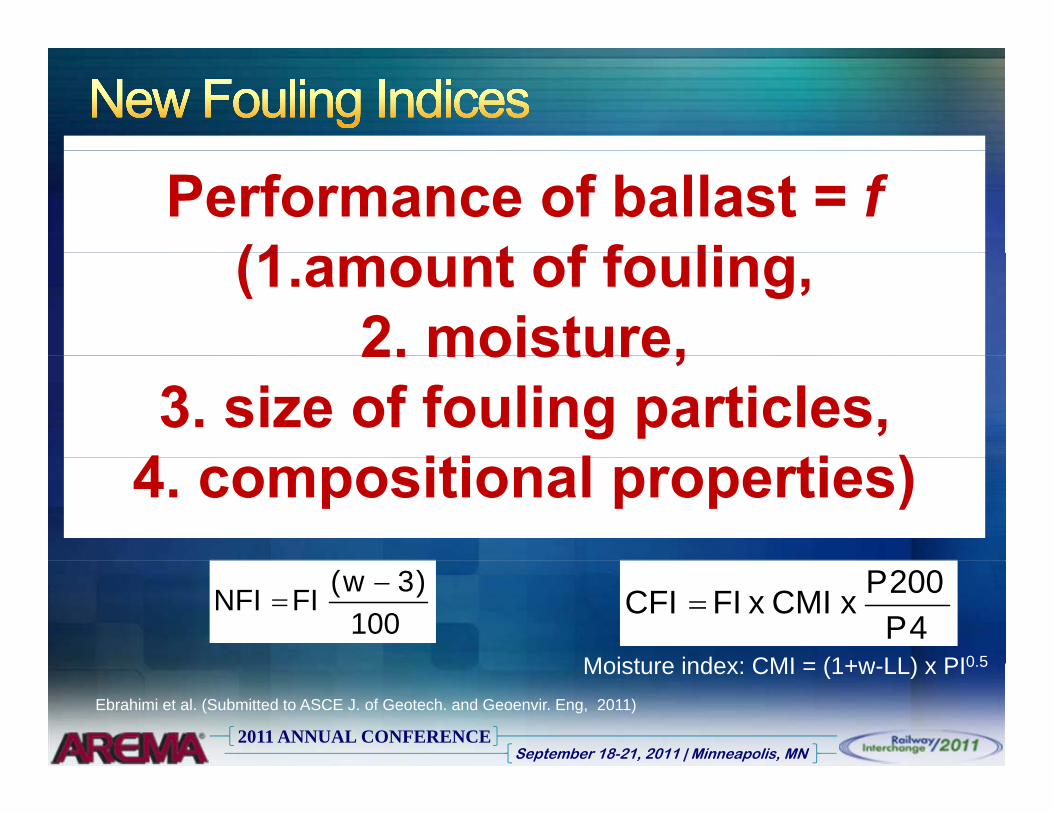
Performance of ballast = f (1 t f f li(1.amount of fouling,
2. moisture,2. moisture,3. size of fouling particles,
4 iti l ti )4. compositional properties)
4P200PxCMIxFICFI =
Moisture index: CMI = (1+w LL) x PI0 5
100)3w(FINFI −
=
2011 ANNUAL CONFERENCESeptember 18-21, 2011 | Minneapolis, MN
Ebrahimi et al. (Submitted to ASCE J. of Geotech. and Geoenvir. Eng, 2011)
Moisture index: CMI = (1+w-LL) x PI0.5
Exceeding limit
2011 ANNUAL CONFERENCESeptember 18-21, 2011 | Minneapolis, MN
Maintenance CycleMaintenance CycleMaintenance Cycle Maintenance Cycle
2. Mechanistic2. Mechanistic--Based Maintenance Based Maintenance M d lM d lModelModel
2011 ANNUAL CONFERENCESeptember 18-21, 2011 | Minneapolis, MN
2011 ANNUAL CONFERENCESeptember 18-21, 2011 | Minneapolis, MN
2011 ANNUAL CONFERENCESeptember 18-21, 2011 | Minneapolis, MN
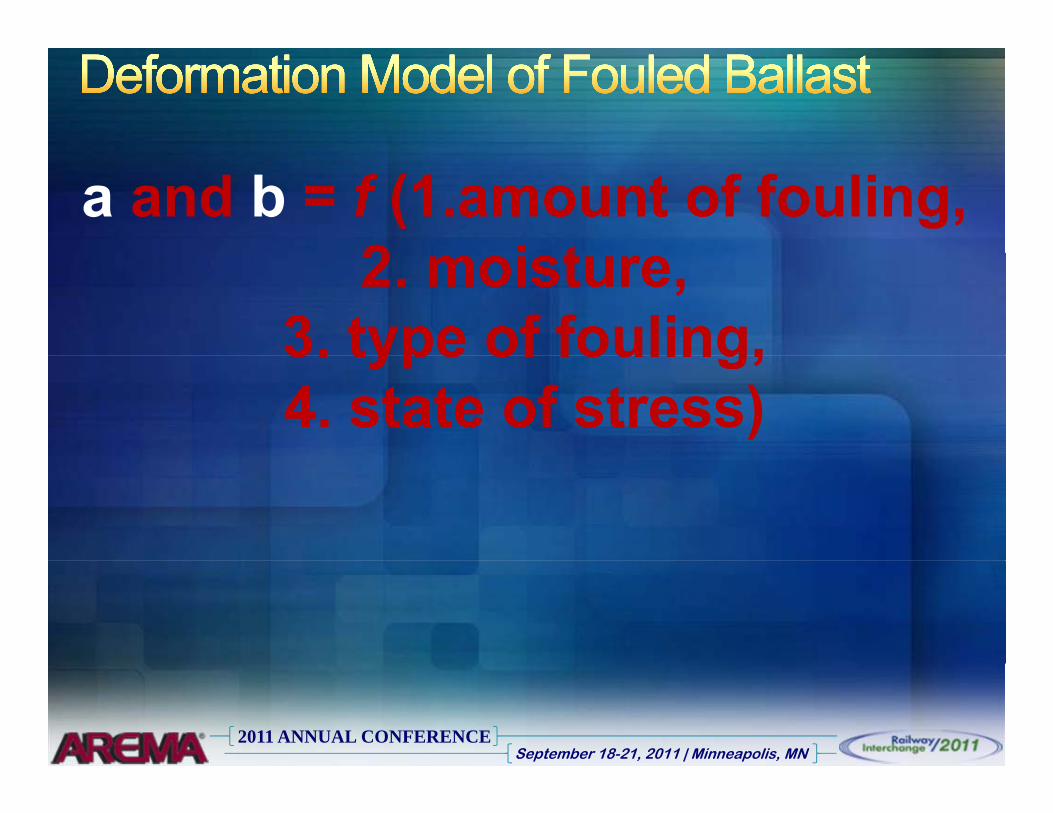
a and b = f (1.amount of fouling,2 i t2. moisture,
3. type of fouling,3. type of fouling,4. state of stress)
2011 ANNUAL CONFERENCESeptember 18-21, 2011 | Minneapolis, MN
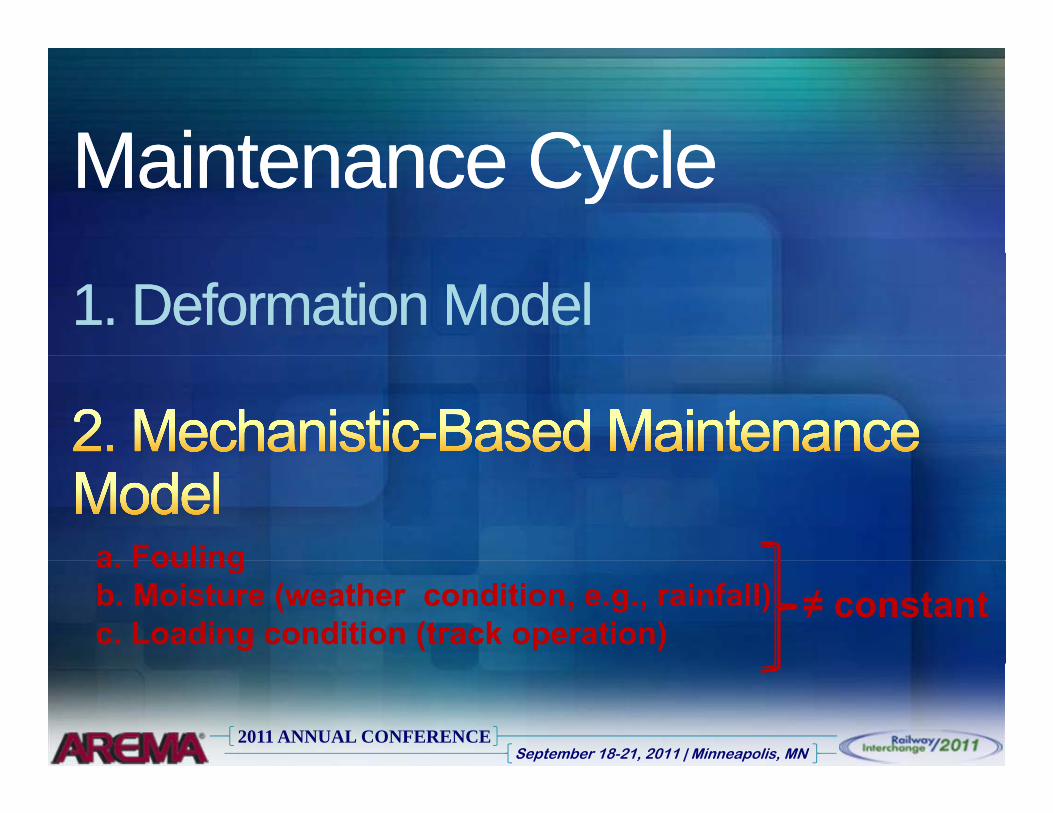
Maintenance CycleMaintenance CycleMaintenance Cycle Maintenance Cycle
1. Deformation Model1. Deformation Model
a Foulinga. Fouling b. Moisture (weather condition, e.g., rainfall)c. Loading condition (track operation)
≠ constant
2011 ANNUAL CONFERENCESeptember 18-21, 2011 | Minneapolis, MN

2011 ANNUAL CONFERENCESeptember 18-21, 2011 | Minneapolis, MN
2011 ANNUAL CONFERENCESeptember 18-21, 2011 | Minneapolis, MN
2011 ANNUAL CONFERENCESeptember 18-21, 2011 | Minneapolis, MN
Method for predicting maintenance cycle is developedp
This method need to be validated by field data
2011 ANNUAL CONFERENCESeptember 18-21, 2011 | Minneapolis, MN
2011 ANNUAL CONFERENCESeptember 18-21, 2011 | Minneapolis, MN