Embed Size (px)
Citation preview
energies
Article
Maintenance Tools applied to Electric Generators toImprove Energy Efficiency and Power Quality ofThermoelectric Power Plants
Milton Fonseca Junior 1,* ID , Ubiratan Holanda Bezerra 2, Jandecy Cabral Leite 1 andJorge Laureano Moya Rodríguez 1
1 Galileo Institute of Technology and Education of the Amazon, Institute Manaus, 69020-030 Amazonas,Brazil; [email protected] (J.C.L.); [email protected] (J.L.M.R.)
2 Department of Electrical Engineering—CEAMAZON, Federal University of Para, 66075-110 Belem, Para,Brazil; [email protected]
* Correspondence: [email protected]; Tel.: +55-92-99110-8096
Received: 14 June 2017; Accepted: 23 July 2017; Published: 26 July 2017
Abstract: This paper presents a specific method to improve the reliability of the equipment andthe quality of power supplied to the electrical systems with the frequency and voltage control of athermoelectric plant, to guarantee a more stable system. The method has the novelty of combiningTotal Productive Maintenance (TPM) using only four pillars, with Electrical Predictive Maintenancebased in failure analysis and diagnostic. It prevents voltage drops caused by excessive reactiveconsumption, thus guaranteeing the company a perfect functioning of its equipment and providing alonger life of them. The Maintenance Management Program (MMP) seeks to prevent failures fromcausing the equipment to be shut down from the electrical system, which means large financial losses,either by reducing billing or by paying fines to the regulatory agency, in addition to prejudice thereliability of the system. Using management tools, but applying only four TPM pillars, it was possibleto achieve innovation in power plants with internal combustion engines. This study aims to providemaintenance with a more reliable process, through the implantation of measurement, control anddiagnostic devices, thus allowing the management to reduce breakdown of plant equipment. Someresults have been achieved after the implementation, such as reduction of annual maintenance cost,reduction of corrective maintenance, increase of MTBF (Mean Time between Failures) and reductionof MTTR (Mean Time to Repair) in all areas. Probabilistic models able to describe real processes ina more realistic way, and facilitate the optimization at maximum reliability or minimum costs arepresented. Such results are reflected in more reliable and continual power generation.
Keywords: maintenance management engineering; electric generators; power quality; thermoelectricpower plants
1. Introduction
In the operation of power transmission systems, problems related to reactive voltage/powermay occur at any time due to contingencies and/or changes in demand. Therefore, adequate controldecisions are required over a relatively short period to improve the state of operation so as not tocompromise the safety and reliability of the electrical system. Some of these situations may requiresolutions based on specific knowledge of the operators with the electrical system or equipment. Thistype of knowledge is obtained from practical operational experience gained over the years. Therefore,control decisions must be done by combining the experience of the operators with the solutionsproposed by computational algorithms based on mathematical methods.
Currently, the possibility of storage and use of specific human knowledge acquired experimentallyis through expert systems. Several systems are proposed in the literature to support voltage/reactive
Energies 2017, 10, 1091; doi:10.3390/en10081091 www.mdpi.com/journal/energies
Energies 2017, 10, 1091 2 of 21
power control [1–3]. In this paper, it is applied a maintenance program with implementation of theTotal Productive Maintenance (TPM) to analyze some applications in the mode of operation of theAVR (automatic voltage regulator) to operate the system in the control of constant voltage (VoltageDroop). The implementation was based on the specific knowledge about the operation of the powergrid in voltage/reactive power control.
The voltage drop is the mode of operation in which the external system determines the voltage,which, once set the value of the voltage the Master Voltage Control (MVC), it tracks the voltage in thebar of the high voltage side, to minimize possible fluctuations. The MVC sends the set point and the(mA) signal to the PLC (Programmable Logic Controller) of each generator, which is converted to avoltage at the terminals of each Automatic Voltage Regulator (AVR) (UNITROL 1000, ABB SwitzerlandLtd., Turgi, Switzerland), so that the generators connected to the same bus share the reactive load,guaranteeing the voltage control.
Power factor is the mode of operation in which the machine is operating with a constant reactiveload and the load variations in the External System do not affect the value of the Reactive Power inwhich the Machine is working. In other words, in this mode of operation, the Voltage Regulator willnot control or contribute to the voltage variations of the external System. The value of the ReactivePower of the Machine can be controlled by the injection of more or less excitation current through thevalue of the power factor set in the PLC at the Control Room.
Disturbances in the energy system are increases or decreases in the voltage or frequency of thesystem, in addition to what is considered as normal tolerance. Changes in voltage can range fromcomplete lack of voltage (interruption), lasting for seconds, minutes, or even hours, to high voltagevalues (over voltages). Short pulses of the normal voltage of the system last no more than a fewthousandths of a second. Some of these disturbances may have an undesirable effect on equipmentconnected to the power system, including protection devices.
Voltage fluctuation is defined as a cyclic voltage variation, in amplitude not exceeding 10%. Thisvariation in amplitude is generally much lower than the equipment’s support limits, so that operationalproblems in the equipment will rarely occur due to the occurrence of fluctuation.
Frequency is one of the most important parameters in the operation of electrical systems. It mustbe unique to the entire electrical system, and this form requires centralized control, which usuallyoccurs in large generation plants. In the Network Procedures, the National Operator of the ElectricSystem (ONS) establishes two indicators to measure the performance of the system with respect tofrequency variations.
2. Literature Review
Much of the literature is concerned only with replacements, both after failures and duringmaintenance, and disregards the possibility of the type of maintenance where less improvementis achieved at lower cost. Among the oldest replacement schemes are the “age replacement” [4,5]and “total replacement” [6–8] policies. In the first one, a component is replaced at a certain age orwhen it fails, whichever occurs first. In the second one, all devices in a given class are replaced atpredetermined intervals, or when they fail.
The latter policy is easier to administer (especially if the component ages are not known) and maybe more economical than a policy based on individual substitution. More recent replacement schemesare often based on probabilistic models [9–11] and can be quite complex. In most electric utility dealers,however, maintenance is very limited and it is established as practicing the use of replacement models.In turn, the concept of simplicity in a company is associated with processes and technology solutions,whose characteristics and procedures are strictly necessary to meet the specific requirements that areeasy to implement, maintain and use, in addition to being developed within the Schedule [12].
For a thorough evaluation of the effects of a maintenance policy, it is necessary to know howmuch its application would extend the life of a component, measured, that is, the average time tofailure. To figure this out, a mathematical model of the component deterioration process is needed,
Energies 2017, 10, 1091 3 of 21
which is then combined with a model describing the maintenance effects. In the last ten years or more,several such models have been proposed [13–15].
The situation is quite different for the deterioration processes, where sometimes the newfault condition and the times between the subsequent stages of deterioration are not exponentiallydistributed [16,17]. In such a process, the risk function is increasing, and maintenance will bringimprovement regardless of the types of distribution between phases [18,19]. Thus, some type ofmonitoring (e.g., inspection) should be part of the model [8]. Other desirable characteristics arelisted in the course of the study. System identification, and the list of critical components and theirfunctions are very important for analyzing any system or process. It is necessary to establish the failuremode and effects for each selected component, determination of failure history, and calculation ofmean time between failures. The categorization of failure effects (using appropriate flowcharts) andthe determination of possible maintenance tasks can be appreciated in [20–22]. The assignment ofmaintenance tasks and the evaluation of the program, including cost analysis is offered in [23].
The so-called Preventive Maintenance Optimization (PREMO) is based on extensive task analysisrather than system analysis, with a capability to reduce drastically the number of required maintenancetasks in a plant [24–26]. Approaches such as PREMO have been very useful to ensure the economicaloperation of power plants. However, they do not provide all the benefits and flexibility of programsbased on mathematical models [13,27]. Many other approaches have been developed; many of themconcerned with power system applications [28–31]. In [31], a maintenance model is derived fromparallel branches of components in series, as frequently found in transformation stations, and in [32],maintenance and reliability of the standby units are studied. Both are, in essence, replacement models,where repair and maintenance are assumed to result “as new” conditions.
Thermal Power Plants consist of a set of mechanical and electrical systems that require constantmonitoring for energy production. The data obtained through the monitoring actions are required inthe operation, maintenance and evaluation of the performance of the plants. For this purpose, manytimes, so-called Distributed Control Systems (DCS) are used [33]
The obsolescence of this equipment (DCS) raises the risks of unavailability of the generating units,mainly in thermal plants, which have a high degree of mechanical wear, due to the high temperaturesand the chemical agents used for the production of electric energy [34]. In addition to technologicalobsolescence, maintenance costs over time increase due to the need to replace parts in DCS. Anotherobserved hindrance refers to the gradual decrease of technical support by the suppliers of these systemsas the manufacturer launches new similar systems. The renewal of these systems is therefore a sinequa non, imposing the need for new knowledge and technologies for the training and technologicaldevelopment of companies of this nature. Such a renewal/update offers the possibility of using newDCS systems based mainly on the free flow of data in real time without the need to integrate anyinterface into proprietary software architectures as has been practiced until now.
The basis of good maintenance engineering management is reliable information on the mostcritical aspects of maintenance, i.e., those elements that could result in a more substantial impact onexpenditure or income [16,35]. A maintenance plan can be established adopting, among others, thefollowing criteria: hours of operation and degradation of the insulation medium or cycle of equipmentoperation. In order to prove the savings obtained with an implanted maintenance plan, measures mustbe taken before and after its implementation.
The descriptions that define the process should enable its understanding and provide the basis forany critical examination necessary for the development of improvements. It is therefore essential thatthe descriptions of the procedure be precise, clear and concise [36]. “It is important that in a companyalready in operation the flow charts are established in a participatory way” [37].
Energies 2017, 10, 1091 4 of 21
3. Methodology
The research was carried out in four phases, starting with a detailed study of the national andforeign literature on the subject to be researched, to deepen understanding of the causes that couldprovoke faults, failures and unexpected stops of the equipment, as well as the methods and techniquesthat could be applied to meet the proposed objectives.
The second phase was carried out by means of an unstructured interview with the maintenanceleader, to diagnose the difficulties in controlling the equipment failures. At this stage, the documentarystudy of the standards and maintenance routines folders, the preventive maintenance registrationreports, and the basis for the checklist elaboration were also carried out. This was made to know thefulfillment of the aspects established at national and international level and to detect the causes ofpossible occurrences of undesirable events.
The third step consisted in the application of the simple direct observation technique, observingmotors, auxiliary equipment and generators together with the observation of the study environment,which allowed concretizing the reality expressed at the time.
In the fourth phase, measures were proposed that allow the monitoring of the chosen equipmentthrough vibration analysis, oil analysis and thermography. The implantations were also carried out infour phases:
• Phase 1—Diagnosis: Conducted by the specialist in the operational areas where the program willbe implemented, with the objective of collecting data from the operation, interviews and analysisof documents to serve as a basis for the Strategic Master Plan of Phase 2. After the Diagnostic,a report with the data collected, opportunities and recommendations for analysis, discussion,adaptations and approval was presented to the Company’s Management.
• Phase 2—Strategic Master Plan: The Strategic Master Plan contemplates the opportunities andobjectives defined and approved in the Diagnostic Report presented in Phase 1. Prepared bythe Consultant for presentation, analysis, adaptation and approval of the Board of Directors andManagement of the company and indicated persons involved in the Program to determine thespecific needs and objectives of the areas where the Program will be implemented.
• Phase 3—Training: This phase is necessary to improve the knowledge of the participants, who willbe responsible for developing internally the program, in the roles of Leaders, Pillar Coordinatorsand Steering Committee members.
• Phase 4—Follow-up: The Program was monitored by the Consultant in conjunction with theProgram’s General Coordinator, including meetings with the Pillar Coordinators, audits duringthe implementation phase and orientation of the activities, concepts, premises and methodologyof the Strategic Master Plan approved. Coordinators and Working Groups, with the Consultant,will develop the planned and recommended activities for each pillar internally. Necessary auditsand recommendations during the period determined in the contract will be done.
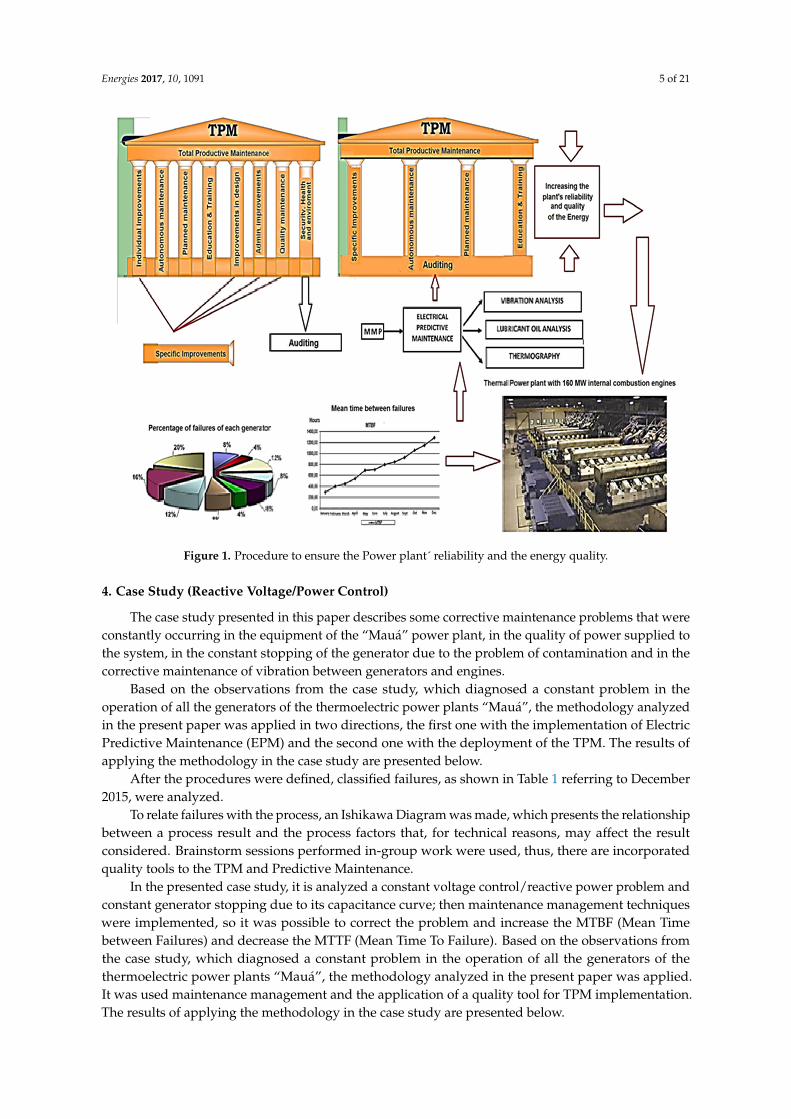
The general process is described in Figure 1, where the combination of TPM with Predictivemaintenance and diagnosis for improving the Power plant´ reliability and the energy quality is showed.
Energies 2017, 10, 1091 5 of 21
Figure 1. Procedure to ensure the Power plant´ reliability and the energy quality.
4. Case Study (Reactive Voltage/Power Control)
The case study presented in this paper describes some corrective maintenance problems that wereconstantly occurring in the equipment of the “Mauá” power plant, in the quality of power supplied tothe system, in the constant stopping of the generator due to the problem of contamination and in thecorrective maintenance of vibration between generators and engines.
Based on the observations from the case study, which diagnosed a constant problem in theoperation of all the generators of the thermoelectric power plants “Mauá”, the methodology analyzedin the present paper was applied in two directions, the first one with the implementation of ElectricPredictive Maintenance (EPM) and the second one with the deployment of the TPM. The results ofapplying the methodology in the case study are presented below.
After the procedures were defined, classified failures, as shown in Table 1 referring to December2015, were analyzed.
To relate failures with the process, an Ishikawa Diagram was made, which presents the relationshipbetween a process result and the process factors that, for technical reasons, may affect the resultconsidered. Brainstorm sessions performed in-group work were used, thus, there are incorporatedquality tools to the TPM and Predictive Maintenance.
In the presented case study, it is analyzed a constant voltage control/reactive power problem andconstant generator stopping due to its capacitance curve; then maintenance management techniqueswere implemented, so it was possible to correct the problem and increase the MTBF (Mean Timebetween Failures) and decrease the MTTF (Mean Time To Failure). Based on the observations fromthe case study, which diagnosed a constant problem in the operation of all the generators of thethermoelectric power plants “Mauá”, the methodology analyzed in the present paper was applied.It was used maintenance management and the application of a quality tool for TPM implementation.The results of applying the methodology in the case study are presented below.
Energies 2017, 10, 1091 6 of 21
Table 1. Failure Analysis in December 2015.
Tag Number Local/Reason Responsible Date
Generator Placed Withdrawal
20In Mechanical Forced Stop for changing the
coupling and aligning thegenerator with the motor.
Operator 2 September 2015 3 September 2015
21In Electric Forced Shutdown due to
uncontrolled voltage under frequency online 1 causing the circuit breaker opens
Operator 5 September 2015 5 September 2015
22 In Forced Stop due to high temperature ofthe bearing of the generator Supervisor 7 September 2015 7 September 2015
23 In Forced Stop for replacing thevaristor diode bridge Supervisor 10 September 2015 10 September 2015
24 In Electric Forced Stop for replacement ofthe generator bearing temperature sensor Supervisor 10 September 2015 10 September 2015
25 In forced stop electric fault reading of oilpressure transmitter lubricant Supervisor 13 September 2015 13 September 2015
26
In Force Stop for replacement of theAutomatic Voltage Regulator (AVR)
UNITROL 1000 (ABB Switzerland Ltd.,Turgi, Switzerland)
Supervisor 15 September 2015 15 September 2015
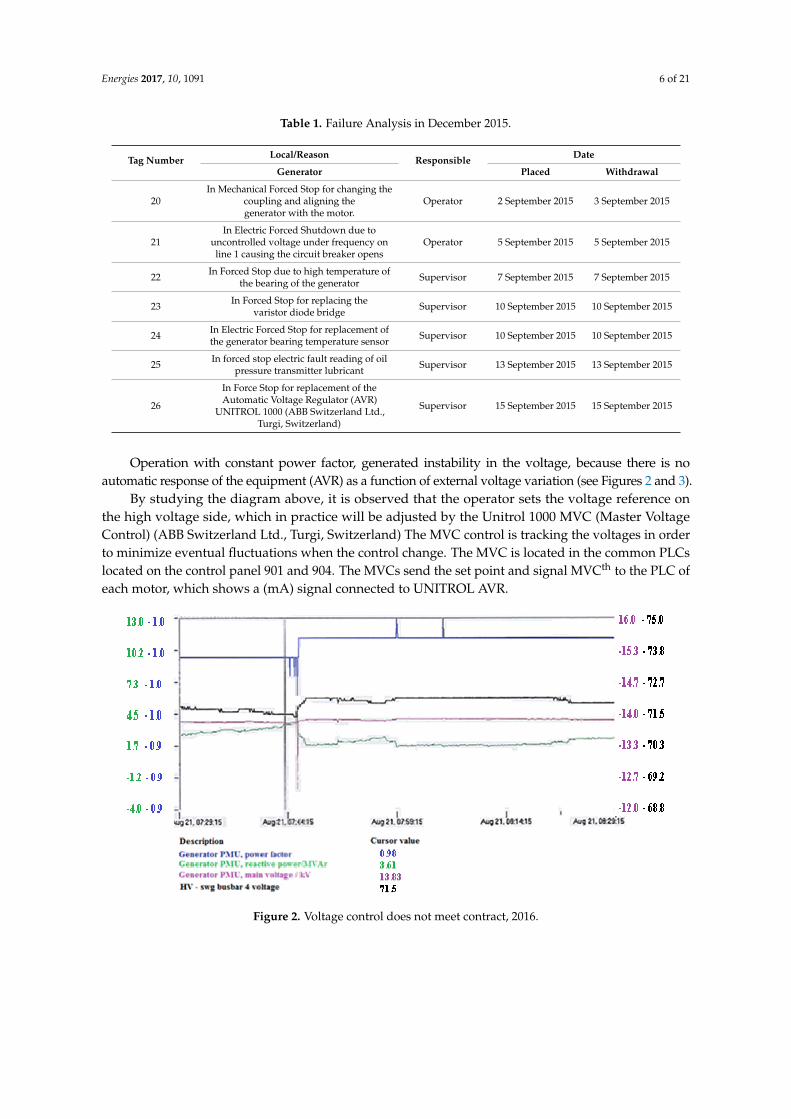
Operation with constant power factor, generated instability in the voltage, because there is noautomatic response of the equipment (AVR) as a function of external voltage variation (see Figures 2 and 3).
By studying the diagram above, it is observed that the operator sets the voltage reference onthe high voltage side, which in practice will be adjusted by the Unitrol 1000 MVC (Master VoltageControl) (ABB Switzerland Ltd., Turgi, Switzerland) The MVC control is tracking the voltages in orderto minimize eventual fluctuations when the control change. The MVC is located in the common PLCslocated on the control panel 901 and 904. The MVCs send the set point and signal MVCth to the PLC ofeach motor, which shows a (mA) signal connected to UNITROL AVR.
Figure 2. Voltage control does not meet contract, 2016.
Energies 2017, 10, 1091 7 of 21
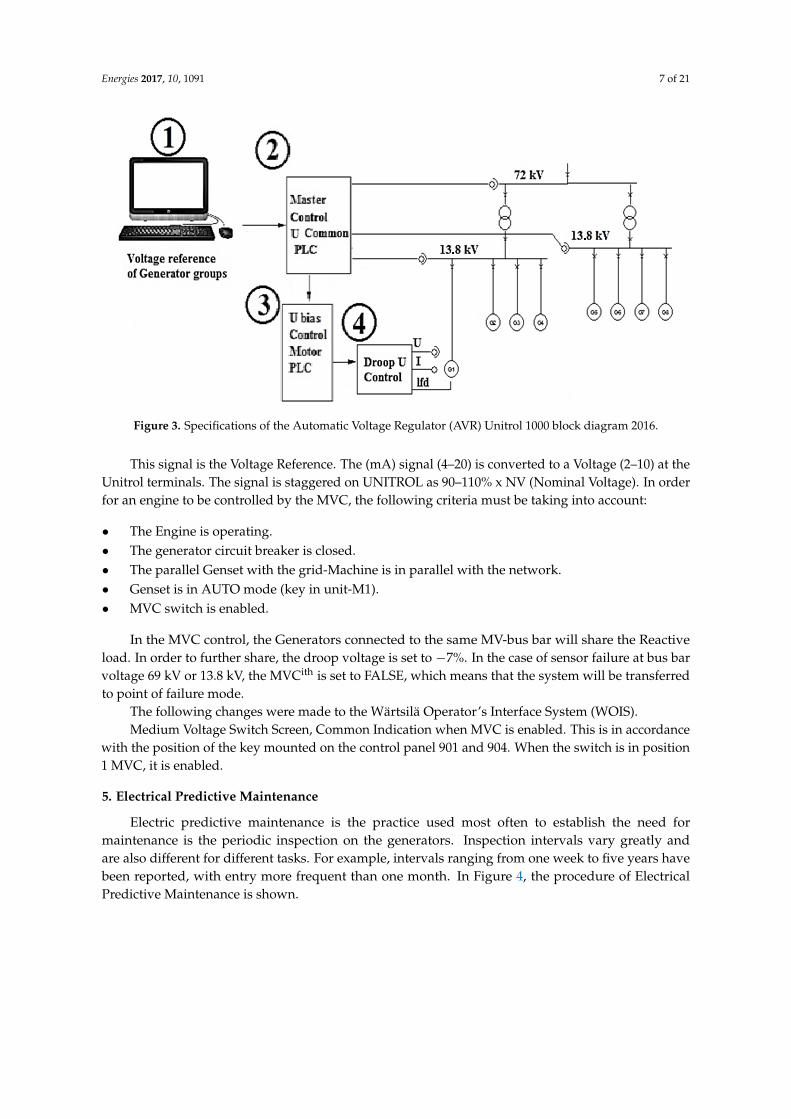
Figure 3. Specifications of the Automatic Voltage Regulator (AVR) Unitrol 1000 block diagram 2016.
This signal is the Voltage Reference. The (mA) signal (4–20) is converted to a Voltage (2–10) at theUnitrol terminals. The signal is staggered on UNITROL as 90–110% x NV (Nominal Voltage). In orderfor an engine to be controlled by the MVC, the following criteria must be taking into account:
• The Engine is operating.• The generator circuit breaker is closed.• The parallel Genset with the grid-Machine is in parallel with the network.• Genset is in AUTO mode (key in unit-M1).• MVC switch is enabled.
In the MVC control, the Generators connected to the same MV-bus bar will share the Reactiveload. In order to further share, the droop voltage is set to −7%. In the case of sensor failure at bus barvoltage 69 kV or 13.8 kV, the MVCith is set to FALSE, which means that the system will be transferredto point of failure mode.
The following changes were made to the Wärtsilä Operator’s Interface System (WOIS).Medium Voltage Switch Screen, Common Indication when MVC is enabled. This is in accordance
with the position of the key mounted on the control panel 901 and 904. When the switch is in position1 MVC, it is enabled.
5. Electrical Predictive Maintenance
Electric predictive maintenance is the practice used most often to establish the need formaintenance is the periodic inspection on the generators. Inspection intervals vary greatly andare also different for different tasks. For example, intervals ranging from one week to five years havebeen reported, with entry more frequent than one month. In Figure 4, the procedure of ElectricalPredictive Maintenance is shown.

Energies 2017, 10, 1091 8 of 21
Figure 4. Electrical Predictive Maintenance Methods.
5.1. Vibration Analysis
This practice is applied periodically and used to evaluate the vibration of the motors and rotatingequipment, being able to detect if the equipment needs alignment, balancing or change of bearingor parts.
The classification adopted for the vibratory severity is a function of the power of the drive, speedof rotation of the machine, and critical level for the production.
Each piece of equipment was carefully evaluated so that the vibration levels were compatibleand registered with maximum fidelity in the Software Prism 4 (version 4, GraphPad Software, Inc.,La Jolla, CA, USA), aiming at the management and control of the values for point analysis. In Figure 5,the points where vibrations measures were done are shown.
Figure 5. Vibration Analysis: The measuring points.
Based on the ISO 10.816-6 and ISO 8528-9 standards, we can classify the engines and generatorsinstalled in the “Mauá” Plant, as belonging to group 3 of the ISO 10.816-6 table. Following this table,it was found that the vibration levels should be below 18 mm/s (RMS—root mean square) to beconsidered satisfactory for unrestricted operation over long periods.
Energies 2017, 10, 1091 9 of 21
Analyzing the table of values, it can be noticed that none of the measured points exceeded thislimit of 18 mm/s (RMS), so it can be ensured that generators are in good operating state, beingclassified as satisfactory for operation use.
It has been found that most of the problems highlighted by the vibration analysis report isrelated to the engine coupling with the electric generator. The coupling was replaced with anotherfrom another firm with superior durability and improving the level of vibration and durability ofthe equipment.
5.2. Analysis of Water Content in Lubricating Oil
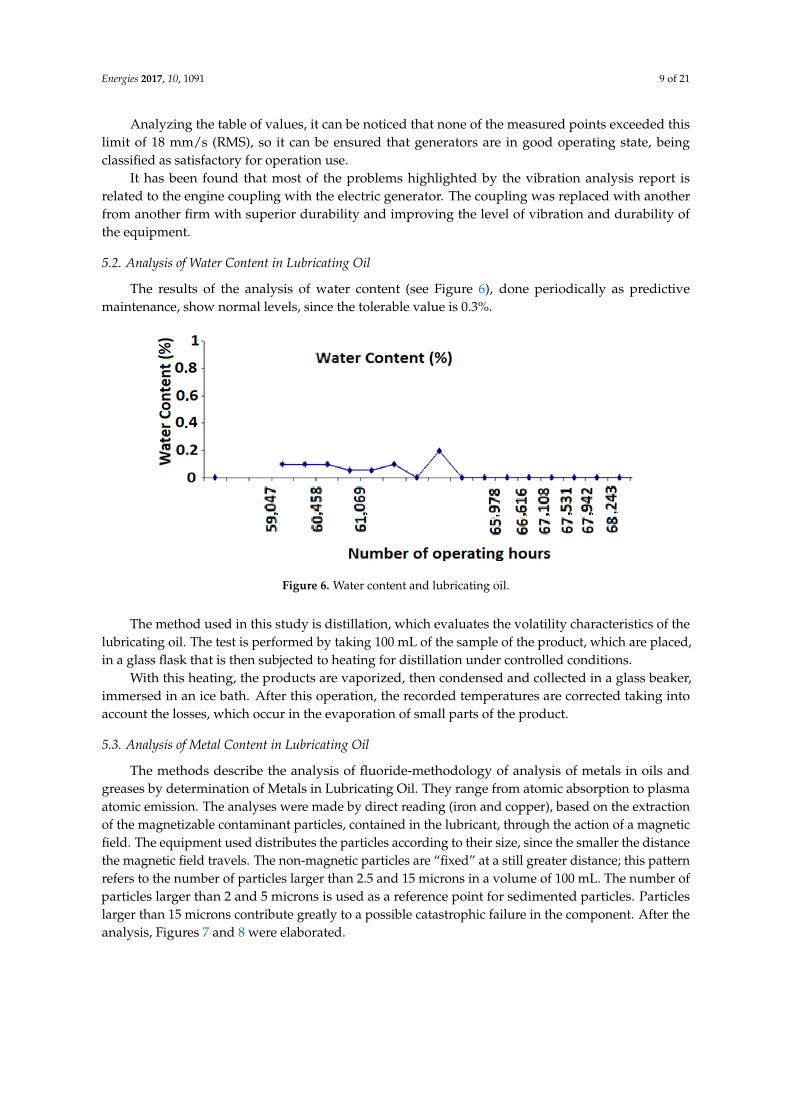
The results of the analysis of water content (see Figure 6), done periodically as predictivemaintenance, show normal levels, since the tolerable value is 0.3%.
Figure 6. Water content and lubricating oil.
The method used in this study is distillation, which evaluates the volatility characteristics of thelubricating oil. The test is performed by taking 100 mL of the sample of the product, which are placed,in a glass flask that is then subjected to heating for distillation under controlled conditions.
With this heating, the products are vaporized, then condensed and collected in a glass beaker,immersed in an ice bath. After this operation, the recorded temperatures are corrected taking intoaccount the losses, which occur in the evaporation of small parts of the product.
5.3. Analysis of Metal Content in Lubricating Oil
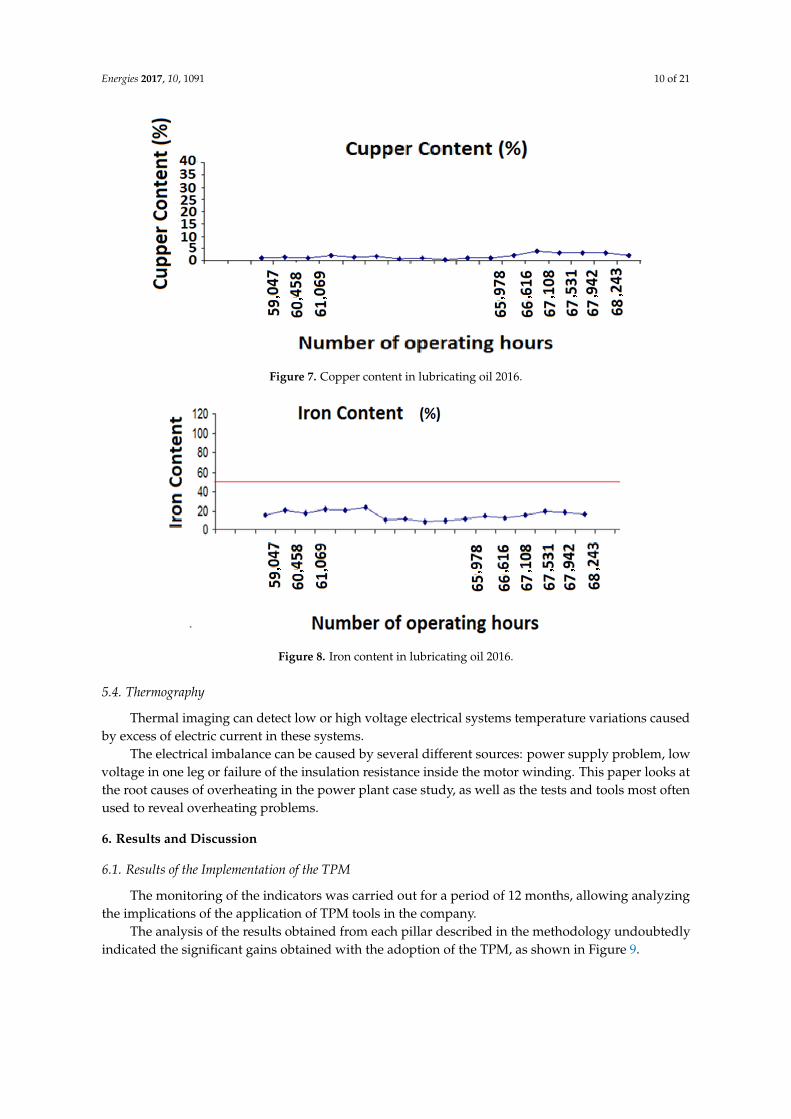
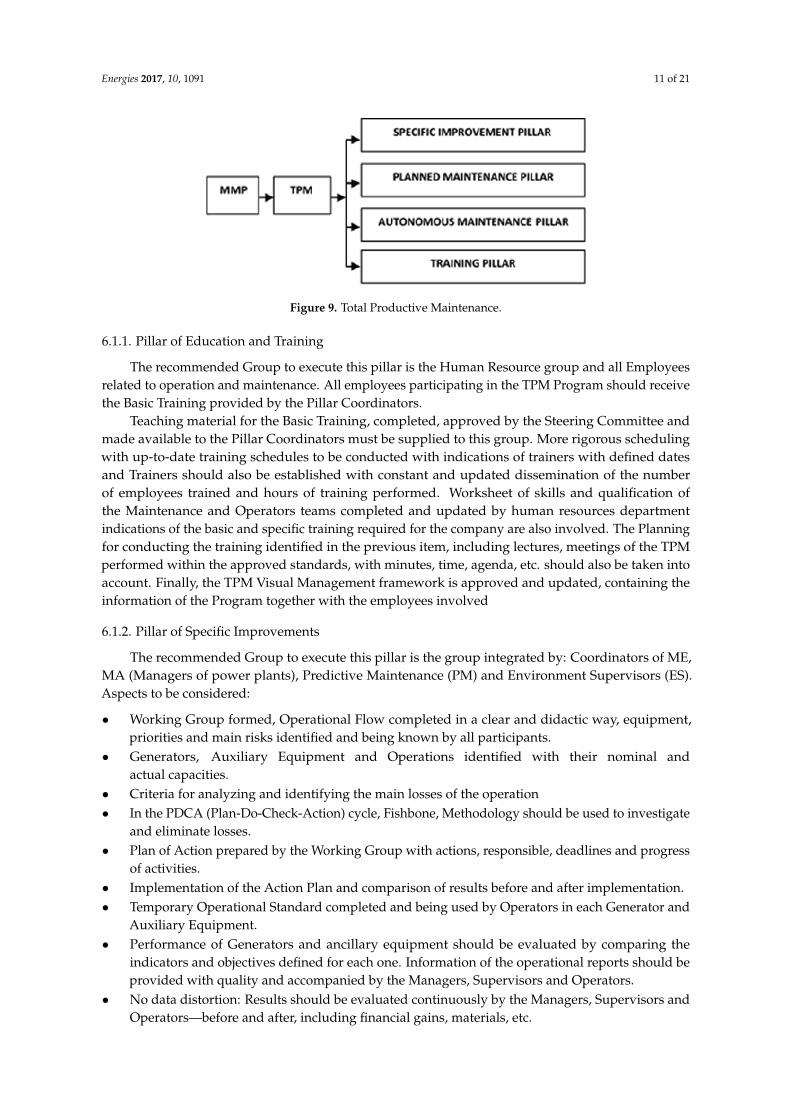
The methods describe the analysis of fluoride-methodology of analysis of metals in oils andgreases by determination of Metals in Lubricating Oil. They range from atomic absorption to plasmaatomic emission. The analyses were made by direct reading (iron and copper), based on the extractionof the magnetizable contaminant particles, contained in the lubricant, through the action of a magneticfield. The equipment used distributes the particles according to their size, since the smaller the distancethe magnetic field travels. The non-magnetic particles are “fixed” at a still greater distance; this patternrefers to the number of particles larger than 2.5 and 15 microns in a volume of 100 mL. The number ofparticles larger than 2 and 5 microns is used as a reference point for sedimented particles. Particleslarger than 15 microns contribute greatly to a possible catastrophic failure in the component. After theanalysis, Figures 7 and 8 were elaborated.
Energies 2017, 10, 1091 10 of 21
Figure 7. Copper content in lubricating oil 2016.
Figure 8. Iron content in lubricating oil 2016.
5.4. Thermography
Thermal imaging can detect low or high voltage electrical systems temperature variations causedby excess of electric current in these systems.
The electrical imbalance can be caused by several different sources: power supply problem, lowvoltage in one leg or failure of the insulation resistance inside the motor winding. This paper looks atthe root causes of overheating in the power plant case study, as well as the tests and tools most oftenused to reveal overheating problems.
6. Results and Discussion
6.1. Results of the Implementation of the TPM
The monitoring of the indicators was carried out for a period of 12 months, allowing analyzingthe implications of the application of TPM tools in the company.
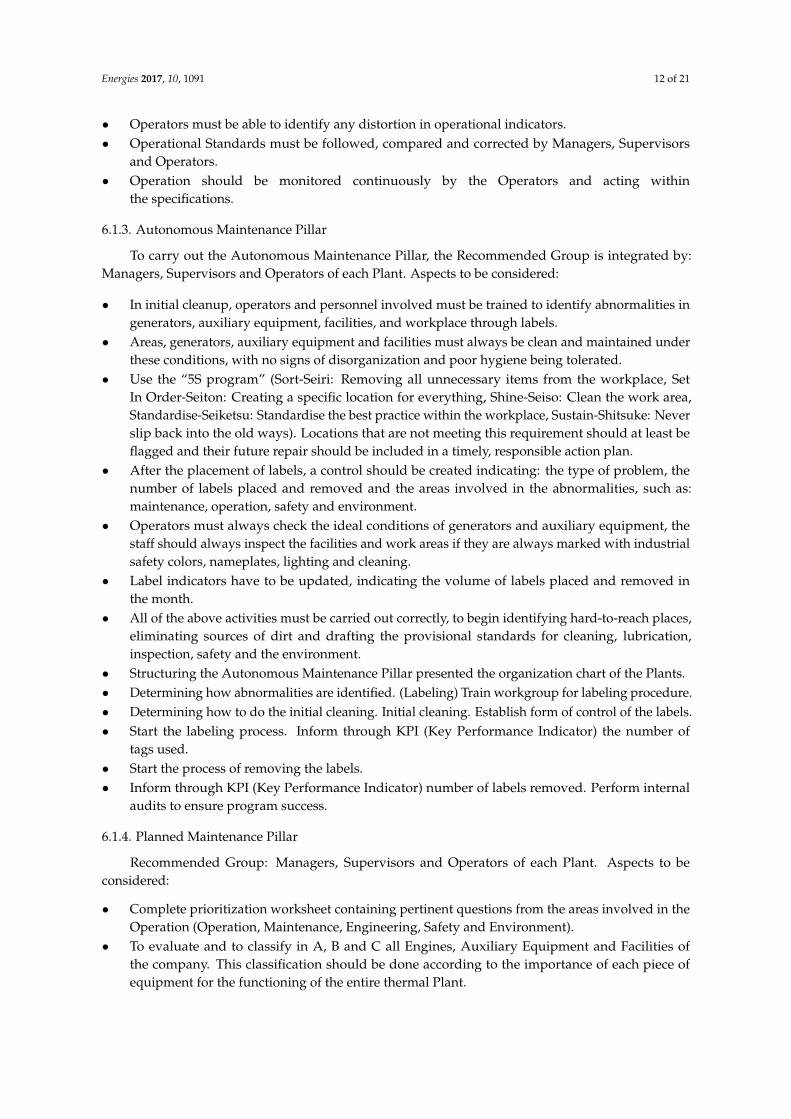
The analysis of the results obtained from each pillar described in the methodology undoubtedlyindicated the significant gains obtained with the adoption of the TPM, as shown in Figure 9.
Energies 2017, 10, 1091 11 of 21
Figure 9. Total Productive Maintenance.
6.1.1. Pillar of Education and Training
The recommended Group to execute this pillar is the Human Resource group and all Employeesrelated to operation and maintenance. All employees participating in the TPM Program should receivethe Basic Training provided by the Pillar Coordinators.
Teaching material for the Basic Training, completed, approved by the Steering Committee andmade available to the Pillar Coordinators must be supplied to this group. More rigorous schedulingwith up-to-date training schedules to be conducted with indications of trainers with defined datesand Trainers should also be established with constant and updated dissemination of the numberof employees trained and hours of training performed. Worksheet of skills and qualification ofthe Maintenance and Operators teams completed and updated by human resources departmentindications of the basic and specific training required for the company are also involved. The Planningfor conducting the training identified in the previous item, including lectures, meetings of the TPMperformed within the approved standards, with minutes, time, agenda, etc. should also be taken intoaccount. Finally, the TPM Visual Management framework is approved and updated, containing theinformation of the Program together with the employees involved
6.1.2. Pillar of Specific Improvements
The recommended Group to execute this pillar is the group integrated by: Coordinators of ME,MA (Managers of power plants), Predictive Maintenance (PM) and Environment Supervisors (ES).Aspects to be considered:
• Working Group formed, Operational Flow completed in a clear and didactic way, equipment,priorities and main risks identified and being known by all participants.
• Generators, Auxiliary Equipment and Operations identified with their nominal andactual capacities.
• Criteria for analyzing and identifying the main losses of the operation• In the PDCA (Plan-Do-Check-Action) cycle, Fishbone, Methodology should be used to investigate
and eliminate losses.• Plan of Action prepared by the Working Group with actions, responsible, deadlines and progress
of activities.• Implementation of the Action Plan and comparison of results before and after implementation.• Temporary Operational Standard completed and being used by Operators in each Generator and
Auxiliary Equipment.• Performance of Generators and ancillary equipment should be evaluated by comparing the
indicators and objectives defined for each one. Information of the operational reports should beprovided with quality and accompanied by the Managers, Supervisors and Operators.
• No data distortion: Results should be evaluated continuously by the Managers, Supervisors andOperators—before and after, including financial gains, materials, etc.
Energies 2017, 10, 1091 12 of 21
• Operators must be able to identify any distortion in operational indicators.• Operational Standards must be followed, compared and corrected by Managers, Supervisors
and Operators.• Operation should be monitored continuously by the Operators and acting within
the specifications.
6.1.3. Autonomous Maintenance Pillar
To carry out the Autonomous Maintenance Pillar, the Recommended Group is integrated by:Managers, Supervisors and Operators of each Plant. Aspects to be considered:
• In initial cleanup, operators and personnel involved must be trained to identify abnormalities ingenerators, auxiliary equipment, facilities, and workplace through labels.
• Areas, generators, auxiliary equipment and facilities must always be clean and maintained underthese conditions, with no signs of disorganization and poor hygiene being tolerated.
• Use the “5S program” (Sort-Seiri: Removing all unnecessary items from the workplace, SetIn Order-Seiton: Creating a specific location for everything, Shine-Seiso: Clean the work area,Standardise-Seiketsu: Standardise the best practice within the workplace, Sustain-Shitsuke: Neverslip back into the old ways). Locations that are not meeting this requirement should at least beflagged and their future repair should be included in a timely, responsible action plan.
• After the placement of labels, a control should be created indicating: the type of problem, thenumber of labels placed and removed and the areas involved in the abnormalities, such as:maintenance, operation, safety and environment.
• Operators must always check the ideal conditions of generators and auxiliary equipment, thestaff should always inspect the facilities and work areas if they are always marked with industrialsafety colors, nameplates, lighting and cleaning.
• Label indicators have to be updated, indicating the volume of labels placed and removed inthe month.
• All of the above activities must be carried out correctly, to begin identifying hard-to-reach places,eliminating sources of dirt and drafting the provisional standards for cleaning, lubrication,inspection, safety and the environment.
• Structuring the Autonomous Maintenance Pillar presented the organization chart of the Plants.• Determining how abnormalities are identified. (Labeling) Train workgroup for labeling procedure.• Determining how to do the initial cleaning. Initial cleaning. Establish form of control of the labels.• Start the labeling process. Inform through KPI (Key Performance Indicator) the number of
tags used.• Start the process of removing the labels.• Inform through KPI (Key Performance Indicator) number of labels removed. Perform internal
audits to ensure program success.
6.1.4. Planned Maintenance Pillar
Recommended Group: Managers, Supervisors and Operators of each Plant. Aspects to beconsidered:
• Complete prioritization worksheet containing pertinent questions from the areas involved in theOperation (Operation, Maintenance, Engineering, Safety and Environment).
• To evaluate and to classify in A, B and C all Engines, Auxiliary Equipment and Facilities ofthe company. This classification should be done according to the importance of each piece ofequipment for the functioning of the entire thermal Plant.
Energies 2017, 10, 1091 13 of 21
• The stock management has to be according to classification: (A) most important that must notbe missing in the inventory; (B) intermediary level that must be contained in the stock; and (C)minimal stock.
• The maintenance and operation team must carry out inspection planning on allequipment cataloged.
• Maintenance team should also review the generators and equipment of the facilities to meetthe maintenance standards as described by the manufacturer to rescue the desired conditions ofoperation of the equipment.
• Action plan has to be defined with: activities, materials, deadlines, estimated time in eachrepair activity and maintenance team in equipment A, B and C classified and with the type andrecommended maintenance plan completed.
• Perform planning and schedule of maintenance activities for Generators, Auxiliary Equipmentand Facilities.
• Report on completed and initiated maintenance activities. The engineering should perform criticalanalysis of the graphs and reports of the new documents indicating Mean Time Between Failure(MTBF)/TMEF (Average Time Between Failures) and MTTR (Average Time to Repair) per Engine.
6.2. Results Analysis of Voltage Quality
After the application of the developed procedure, the control of the voltage at 72.20 kV wasmaintained, with little voltage variation in the Electric Generators and consequently with the generationof Reactive Energy, ensuring the energy quality and maintaining the set value of 72.20 KV constantin the output bar (high voltage). When there is a disturbance in the System such as the output of aMachin, other Machines react and maintain the tension set on control.
It is very important to comply with the operative contract, contributing to the generation ofreactive power, to have a more stable voltage control system and to carry out real simulations ofrejection tests to guarantee the perfect functioning of the AVR Unitrol 1000.
6.3. Applied Improvements
Less consumption, and more quality energy: Reducing reactive power consumption results inimproved quality of power supply, which reduces voltage drops and electrical losses at Customer’sand the concessionaire’s premises.
Tension control should ensure a more stable system for industry and society in Manaus.Replacement of AVR (automatic voltage regulator) equipment, on the other hand, to be capableof operating in voltage control to reduce voltage drops caused by excessive reactive loads. Automaticvoltage control prevents voltage drops caused by consumption excessive of reactive, thus guaranteeingthe society a perfect functioning of its equipment and providing a longer useful life of the same.
To facilitate the analysis of the evolution of the results, tables were used as figures, presentingconsolidated values of Indicators used; focusing on the results before and after the application of TPM(Total Productive Maintenance) and the implementation of the PM (Predictive Maintenance), accordingto graphs. Thus, the improvements obtained in the results of the MTBF and MTTR maintenance areawas evidenced.
MTBF (Mean Time Between Failures) is a value assigned to a particular device or device todescribe its reliability. This assigned value indicates when a device failure may occur. The higher thisindex, the greater the reliability of the equipment and, consequently, maintenance will be evaluated inefficiency issues.
The MTBF calculation is done as follows. The manufacturer defines the number of parts testedsimultaneously and the number of hours that the test will be performed. By multiplying one by theother, it is obtained the total number of hours connected, which is divided by the total number of partsthat were defective in the period.
Energies 2017, 10, 1091 14 of 21
The average MTTR time for repair is a measure on the basis of repairable item maintenance.It represents the average time required to repair a component failure.
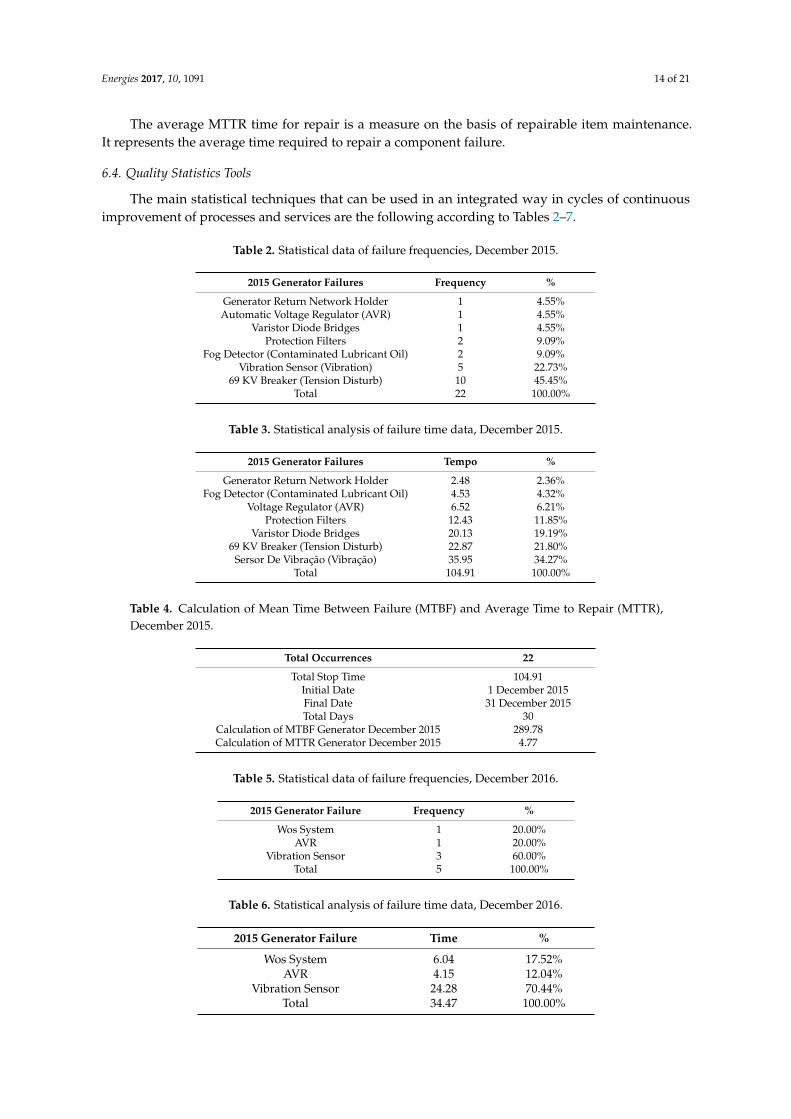
6.4. Quality Statistics Tools
The main statistical techniques that can be used in an integrated way in cycles of continuousimprovement of processes and services are the following according to Tables 2–7.
Table 2. Statistical data of failure frequencies, December 2015.
2015 Generator Failures Frequency %
Generator Return Network Holder 1 4.55%Automatic Voltage Regulator (AVR) 1 4.55%
Varistor Diode Bridges 1 4.55%Protection Filters 2 9.09%
Fog Detector (Contaminated Lubricant Oil) 2 9.09%Vibration Sensor (Vibration) 5 22.73%
69 KV Breaker (Tension Disturb) 10 45.45%Total 22 100.00%
Table 3. Statistical analysis of failure time data, December 2015.
2015 Generator Failures Tempo %
Generator Return Network Holder 2.48 2.36%Fog Detector (Contaminated Lubricant Oil) 4.53 4.32%
Voltage Regulator (AVR) 6.52 6.21%Protection Filters 12.43 11.85%
Varistor Diode Bridges 20.13 19.19%69 KV Breaker (Tension Disturb) 22.87 21.80%
Sersor De Vibração (Vibração) 35.95 34.27%Total 104.91 100.00%
Table 4. Calculation of Mean Time Between Failure (MTBF) and Average Time to Repair (MTTR),December 2015.
Total Occurrences 22
Total Stop Time 104.91Initial Date 1 December 2015Final Date 31 December 2015Total Days 30
Calculation of MTBF Generator December 2015 289.78Calculation of MTTR Generator December 2015 4.77
Table 5. Statistical data of failure frequencies, December 2016.
2015 Generator Failure Frequency %
Wos System 1 20.00%AVR 1 20.00%
Vibration Sensor 3 60.00%Total 5 100.00%
Table 6. Statistical analysis of failure time data, December 2016.
2015 Generator Failure Time %
Wos System 6.04 17.52%AVR 4.15 12.04%
Vibration Sensor 24.28 70.44%Total 34.47 100.00%
Energies 2017, 10, 1091 15 of 21
Table 7. Calculation of MTBF and MTTR, December 2016.
Total Occurrences 5
Total Stop Time 34.47Initial Date 1 December 2016Final Date 31 December 2016Total Days 30
Calculation of MTBF Generator December 2015 1289Calculation of MTTR Generator December 2015 6.88
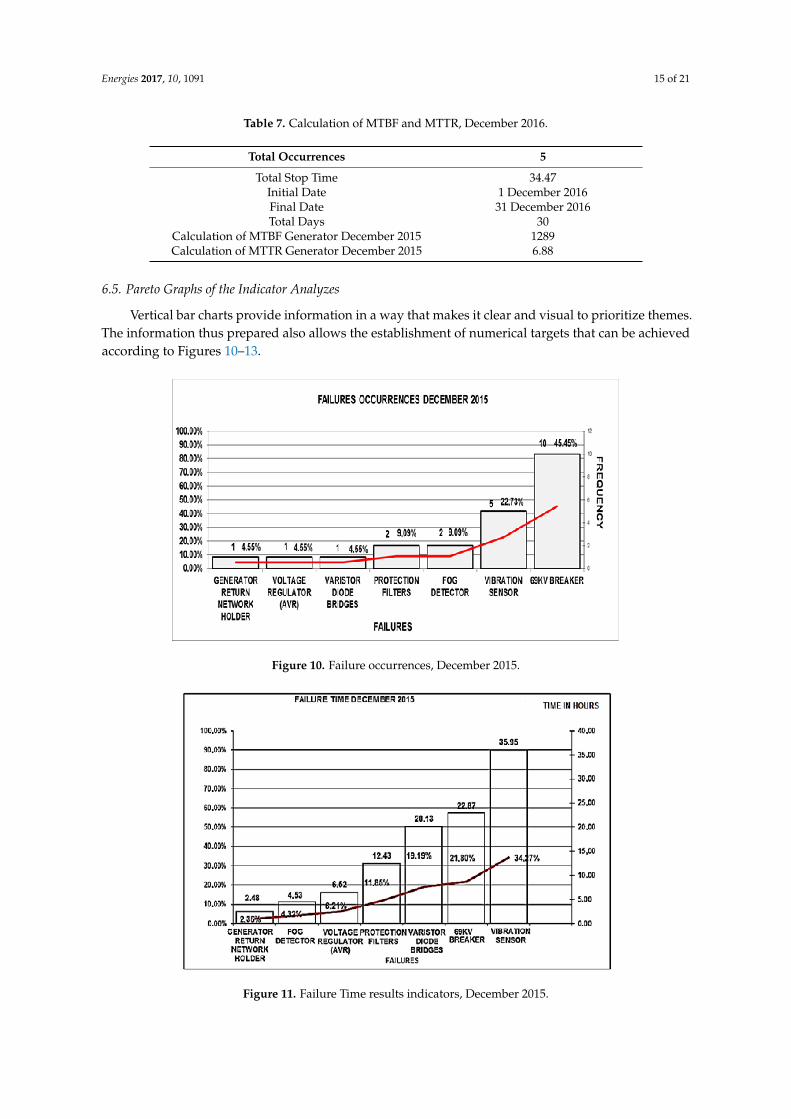
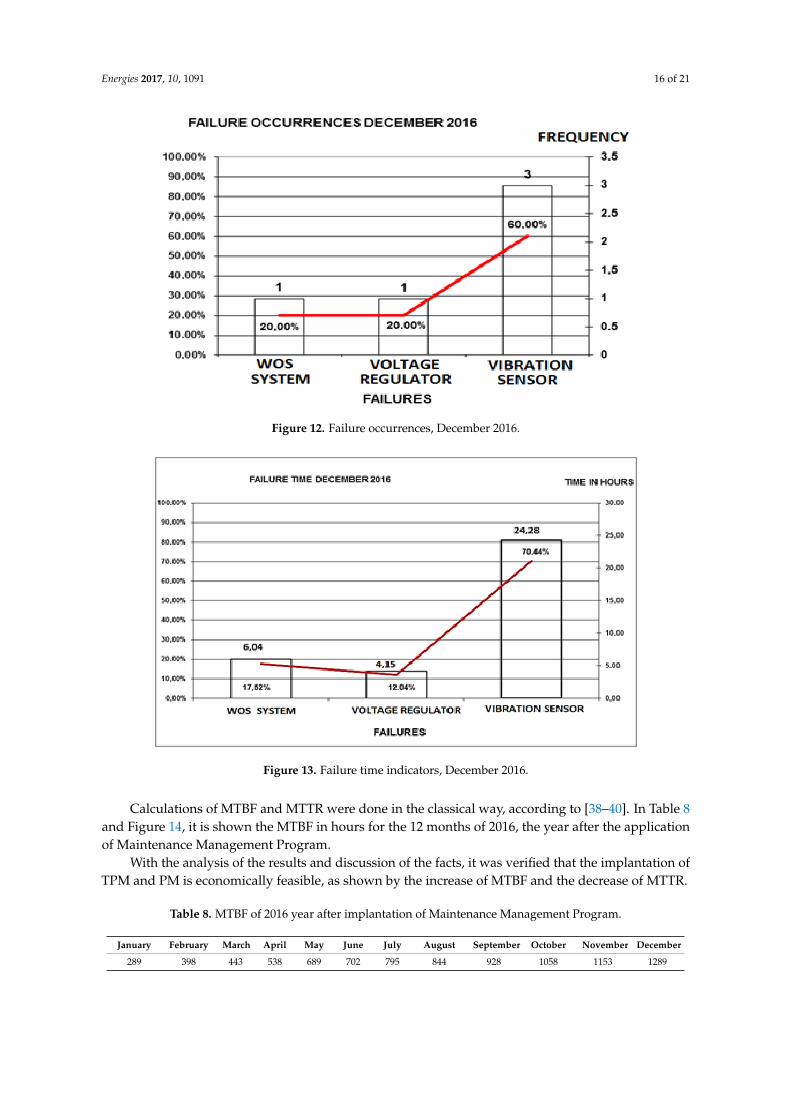
6.5. Pareto Graphs of the Indicator Analyzes
Vertical bar charts provide information in a way that makes it clear and visual to prioritize themes.The information thus prepared also allows the establishment of numerical targets that can be achievedaccording to Figures 10–13.
Figure 10. Failure occurrences, December 2015.
Figure 11. Failure Time results indicators, December 2015.
Energies 2017, 10, 1091 16 of 21
Figure 12. Failure occurrences, December 2016.
Figure 13. Failure time indicators, December 2016.
Calculations of MTBF and MTTR were done in the classical way, according to [38–40]. In Table 8and Figure 14, it is shown the MTBF in hours for the 12 months of 2016, the year after the applicationof Maintenance Management Program.
With the analysis of the results and discussion of the facts, it was verified that the implantation ofTPM and PM is economically feasible, as shown by the increase of MTBF and the decrease of MTTR.
Table 8. MTBF of 2016 year after implantation of Maintenance Management Program.
January February March April May June July August September October November December
289 398 443 538 689 702 795 844 928 1058 1153 1289

Energies 2017, 10, 1091 17 of 21
Figure 14. MTBF results indicators for the year 2016.
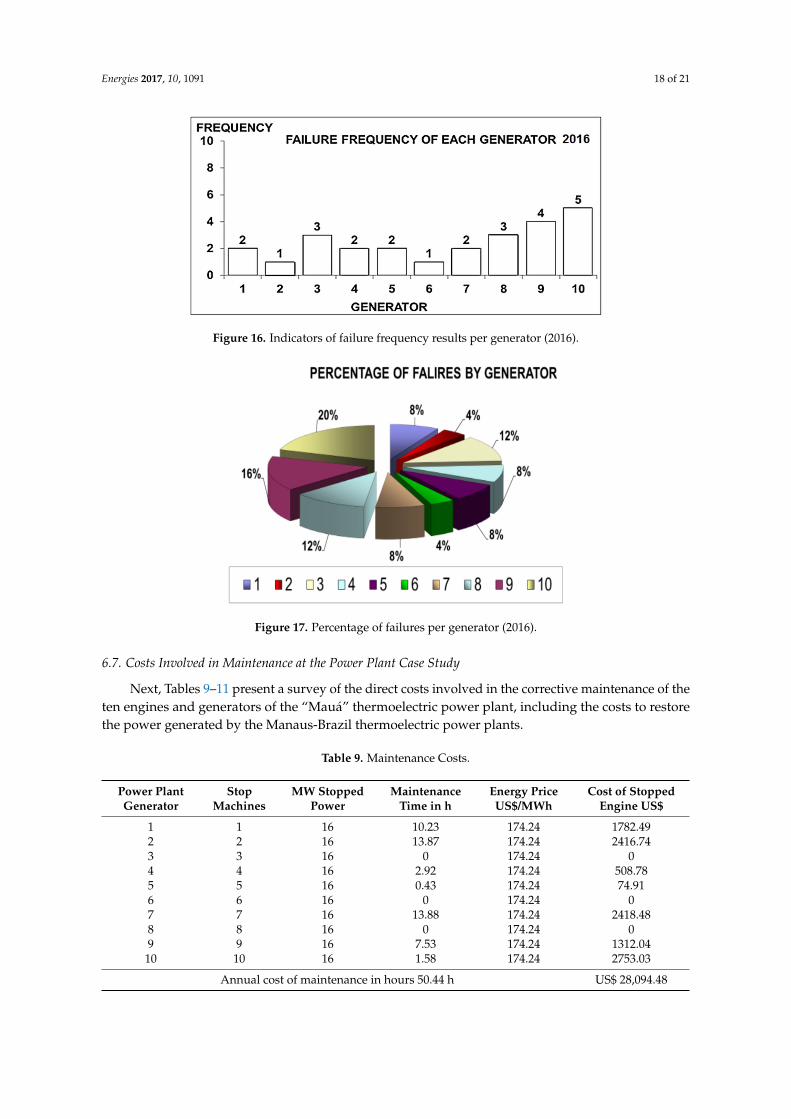
6.6. Frequency Failures by Generator in 2016
In Figures 15 and 16, the generators’ performance during 2016 is shown. Failures diminish inrelation to 2015. It can also be observed that generators 2 and 7 were critical related to the other onesconsidering the time they were unavailable. The frequency of failures of generators 9 and 10 werehigher, but the time that they were unavailable was lesser. In Figure 17, the percentage of failures ofeach generator during 2016 is shown.
After the implementation of the Maintenance Management Program, in 2016, an increase in theautonomous maintenance performed by the operators was verified, including an increase in predictivemaintenance and reduction of corrective maintenance in the 10 generators, the reduction of unavailabletime, the frequency of failures and the percentage of failures by generators.
Figure 15. Indicators of the failure time results per generator (2016).
Energies 2017, 10, 1091 18 of 21
Figure 16. Indicators of failure frequency results per generator (2016).
Figure 17. Percentage of failures per generator (2016).
6.7. Costs Involved in Maintenance at the Power Plant Case Study
Next, Tables 9–11 present a survey of the direct costs involved in the corrective maintenance of theten engines and generators of the “Mauá” thermoelectric power plant, including the costs to restorethe power generated by the Manaus-Brazil thermoelectric power plants.
Table 9. Maintenance Costs.
Power PlantGenerator
StopMachines
MW StoppedPower
MaintenanceTime in h
Energy PriceUS$/MWh
Cost of StoppedEngine US$
1 1 16 10.23 174.24 1782.492 2 16 13.87 174.24 2416.743 3 16 0 174.24 04 4 16 2.92 174.24 508.785 5 16 0.43 174.24 74.916 6 16 0 174.24 07 7 16 13.88 174.24 2418.488 8 16 0 174.24 09 9 16 7.53 174.24 1312.0410 10 16 1.58 174.24 2753.03
Annual cost of maintenance in hours 50.44 h US$ 28,094.48
Energies 2017, 10, 1091 19 of 21
Table 10. Cost of fuel for thermal generation per year.
Price of FossilFuel
ReplaceablePower
ThermalGeneration Time
SpecificConsumption Cost of Fuel
($/l) (MW) (h) (l/MWh) (US$)1.06 160 50.44 280 7,908,992.00
Cost of fuel per year US$ 2,396,664.24
Table 11. Cost of thermal generation per year with maintenance.
Number ofGenerators
ReplaceablePower
ThermalGeneration Time
Cost of Thermal Energywith Diesel Oil Cost of Fuel
- (MW) (h) (US$) (US$)10 160 50.44 52.8 1.06
Cost of fuel per year US$ 49,823,272.72
Yearly Annual Cost = (2,396,664.24 + 49,823,272.72) = US$ 51,613,876.36.
7. Conclusions
Based on the data for the thermal power plant in Brazil, it was possible to identify the causesof equipment shutdowns. It was verified the solution of a problem in real situation of the company,with this they were presenting gains with the two plans mentioned above, could be gauged on thebasis of the information of the case study, which, over time, presented a high number of occurrences ofcorrective maintenance.
Therefore, as soon as the problems were detected, the maintenance area of the companyproposed the implantation, first of a program of predictive maintenance; and, in a second step,the implementation of a total maintenance program. After the implementation of the programs,it was verified, through the improvement of maintenance indicators, the solution of a problem inreal situation with the continuous decrease of corrective maintenance in a period of one year in thecompany case study.
It can be concluded that, with little investment, the problem of corrective maintenance in thepower plant, without compromising the power production of the plant, safety and efficiency, canbe solved.
The implemented solution is friendly to the environment, maintaining the reliability of theManaus Electric System, without compromising the security of the facilities, at a cost always lowerthan the US$ 51,613,876.36 spent annually.
Acknowledgments: The authors gratefully acknowledge the support to this research done by FAPEAM; UFPA;CNPq Productivity of Research Funds Process 301105/2016-2; and ITEGAM.
Author Contributions: All of the authors have contributed to this research. Milton Fonseca Junior conceiveddesigned and performed the experiments; Ubiratan Holanda Bezerra, Jandecy Cabral Leite suggested the studyidea and shared in writing and revising the paper; Ubiratan Holanda Bezerra, Jandecy Cabral Leite, Jorge LaureanoMoya Rodríguez and Milton Fonseca Junior analyzed the data and interpreted the results. All of the authorsrevised and approved the manuscript.
Conflicts of Interest: All of the authors declare no conflict of interest.
References
1. Expósito, A.G.; Conejo, A.J.; Canizares, C. Electric Energy Systems: Analysis and Operation; CRC Press: BocaRaton, FL, USA, 2016.
2. Bouzid, A.M.; Guerrero, J.M.; Cheriti, A.; Bouhamida, M.; Sicard, P.; Benghanem, M. A survey on control ofelectric power distributed generation systems for microgrid applications. Renew. Sustain. Energy Rev. 2015,44, 751–766. [CrossRef]
Energies 2017, 10, 1091 20 of 21
3. Yoshida, H.; Kawata, K.; Fukuyama, Y.; Takayama, S.; Nakanishi, Y. A particle swarm optimization forreactive power and voltage control considering voltage security assessment. IEEE Trans. Power Syst. 2000,15, 1232–1239. [CrossRef]
4. Chien, Y.-H. The effect of a pro-rata rebate warranty on the age replacement policy with salvage valueconsideration. IEEE Trans. Reliab. 2010, 59, 383–392. [CrossRef]
5. Diaz, N.; Pascual, R.; Ruggeri, F.; Droguett, E.L. Modelling age replacement policy under multiple timescales and stochastic usage profiles. Int. J. Prod. Econ. 2017, 188, 22–28. [CrossRef]
6. Endrenyi, J.; Aboresheid, S.; Allan, R.N.; Anders, G.J.; Asgarpoor, S.; Billinton, R.; Grigg, C. The presentstatus of maintenance strategies and the impact of maintenance on reliability. IEEE Trans. Power Syst. 2001,16, 638–646. [CrossRef]
7. Balakrishnan, N. Handbook of the Logistic Distribution; CRC Press: New York, NY, USA, 1991.8. Jardine, A.K.; Tsang, A.H. Maintenance, Replacement, and Reliability: Theory and Applications; CRC Press:
Boca Raton, FL, USA, 2013.9. Kim, S.; Frangopol, D.M.; Soliman, M. Generalized probabilistic framework for optimum inspection and
maintenance planning. J. Struct. Eng. 2013, 139, 435–447. [CrossRef]10. Chalabi, N.; Dahane, M.; Beldjilali, B.; Neki, A. Optimisation of preventive maintenance grouping strategy
for multi-component series systems: Particle swarm based approach. Comput. Ind. Eng. 2016, 102, 440–451.[CrossRef]
11. Ab-Samat, H.; Kamaruddin, S. Opportunistic maintenance (OM) as a new advancement in maintenanceapproaches: A review. J.Qual. Maint. Eng. 2014, 2, 98–121. [CrossRef]
12. Arango-Serna, M.D.; Branch-Bedoya, J.W.; Londoño-Salazar, J.E. Enterprise architecture as tool for managingoperational complexity in organizations. Dyna 2014, 81, 219–226. [CrossRef]
13. Doostparast, M.; Kolahan, F.; Doostparast, M. A reliability-based approach to optimize preventivemaintenance scheduling for coherent systems. Reliab. Eng. Syst. Saf. 2014, 126, 98–106. [CrossRef]
14. Jardine, A.K. Introduction: Special issue on engineering economics in reliability, replacement andmaintenance, part 1. Eng. Econ. 2014, 59, 89–90. [CrossRef]
15. Wang, C.H.; Tsai, S.W. Optimizing bi-objective imperfect preventive maintenance model for series-parallelsystem using established hybrid genetic algorithm. J. Intell. Manuf. 2014, 25, 603–616. [CrossRef]
16. Ben-Daya, M.; Kumar, U.; Murthy, D.P. Introduction to Maintenance Engineering: Modelling, Optimization andManagement; John Wiley & Sons: West Sussex, UK, 2016.
17. Montanari, G.C.; Fabiani, D.; Morshuis, P.; Dissado, L. Why residual life estimation and maintenancestrategies for electrical insulation systems have to rely upon condition monitoring. IEEE Trans. Dielectr.Electr. Insul. 2016, 23, 1375–1385. [CrossRef]
18. Chemweno, P.K.; Pintelon, L.; Van Horenbeek, A.; Muchiri, P. Development of a risk assessment selectionmodel for asset maintenance decision making. In Proceedings of the Eighteenth International WorkingSeminar on Production Economics, Innsbruck, Austria, 24–28 February 2014.
19. Reichman, B.; Stein, J.; Loberg, D.; Anders, G.J. Application of a maintenance planning model for rotatingmachines. In Proceedings of the 35th International Conference on Large High Voltage Electric Systems,Cigre, Paris, France, 1994.
20. Duffuaa, S.O.; Raouf, A. Reliability-Centered Maintenance. In Planning and Control of Maintenance Systems;Springer: Cham, Switzerland, 2015; pp. 245–260.
21. Yssaad, B.; Khiat, M.; Chaker, A. Reliability centered maintenance optimization for power distributionsystems. Int. J. Electr. Power Energy Syst. 2014, 55, 108–115. [CrossRef]
22. Fontaine, M.D.; Green, D.M.; Webb, J.C.; Stoppello, P.A. IEEE/ESW applying reliability centered maintenance(RCM) to electrical equipment critical to worker safety. In Proceedings of the Electrical Safety Workshop(ESW), Dallas, TX, USA, 11–15 March 2013.
23. Zhang, T.; Nakamura, M. Reliability-based Optimal Maintenance Scheduling by Considering MaintenanceEffect to Reduce Cost. Qual. Reliab. Eng. Int. 2005, 21, 203–220. [CrossRef]
24. Su, C.; Wang, X. A two-stage preventive maintenance optimization model incorporating two-dimensionalextended warranty. Reliab. Eng. Syst. Saf. 2016, 155, 169–178. [CrossRef]
25. Belyi, D.; Popova, E.; Morton, D.P.; Damien, P. Bayesian failure-rate modeling and preventive maintenanceoptimization. Eur. J. Oper. Res. 2017, 262, 1085–1093. [CrossRef]

Energies 2017, 10, 1091 21 of 21
26. Lee, H.; Cha, J.H. New stochastic models for preventive maintenance and maintenance optimization. Eur. J.Oper. Res. 2016, 255, 80–90. [CrossRef]
27. Endrenyi, J.; Anders, G.; Da Silva, A.L. Probabilistic evaluation of the effect of maintenance on reliability.An application [to power systems]. IEEE Trans. Power Syst. 1998, 13, 576–583. [CrossRef]
28. Li, W. Risk Assessment of Power Systems: Models, Methods, and Applications; John Wiley & Sons: Hobokon, NJ,USA, 2014.
29. Allan, R.N. Reliability Evaluation of Power Systems; Springer Science & Business Media: New York, NY,USA, 2013.
30. Wang, Y.; Li, Z.; Shahidehpour, M.; Wu, L.; Guo, C.X.; Zhu, B. Stochastic co-optimization of midterm andshort-term maintenance outage scheduling considering covariates in power systems. IEEE Trans. Power Syst.2016, 31, 4795–4805. [CrossRef]
31. Billinton, R.; Pan, J. Optimal maintenance scheduling in a parallel redundant system consisting of seriescomponents in each branch. IEEE Trans. Power Deliv. 1999, 14, 928–933. [CrossRef]
32. Vaurio, J.K. A recursive framework for time-dependent characteristics of tested and maintained standbyunits with arbitrary distributions for failures and repairs. Reliab. Eng. Syst. Saf. 2015, 138, 154–162. [CrossRef]
33. Garcia, E.; Antsaklis, P.J.; Montestruque, L.A. Distributed Control Systems. In Model-Based Control ofNetworked Systems; Springer: Cham, Switzerland, 2014; pp. 327–352.
34. Decker, D. What is in store for DCS systems? Where are they headed? In Proceedings of the Pulp and PaperIndustry Technical Conference, Portland, OR, USA, 18–22 June 2001.
35. Blanchard, B.S. System Engineering Management; John Wiley & Sons: Hoboken, NJ, USA, 2004.36. De Mello Cordeiro, J.V.B. Reflexões sobre a Gestão da Qualidade Total: Fim de mais um modismo ou
incorporação do conceito por meio de novas ferramentas de gestão? Revista da FAE 2004, 7, 19–33.37. Campos, V.F. TQC: Controle Da Qualidade Total; Federal University of Minas Gerais: Belo Horizonte,
Brazil, 1992.38. Kullstam, P.A. Availability, MTBF and MTTR for repairable M out of N system. IEEE Trans. Reliab. 1981, 30,
393–394. [CrossRef]39. Fleischer, J.; Weismann, U.; Niggeschmidt, S. Calculation and optimisation model for costs and effects of
availability relevant service elements. In Proceedings of the LCE, Leuven, Belgium, 31 May–2 June 2006;pp. 675–680.
40. Murphy, P.M.; Twaha, S.; Murphy, I.S. Analysis of the cost of reliable electricity: A new method for analyzinggrid connected solar, diesel and hybrid distributed electricity systems considering an unreliable electric grid,with examples in Uganda. Energy 2014, 66, 523–534. [CrossRef]
© 2017 by the authors. Licensee MDPI, Basel, Switzerland. This article is an open accessarticle distributed under the terms and conditions of the Creative Commons Attribution(CC BY) license (http://creativecommons.org/licenses/by/4.0/).


![LINE LOAD APPLIED ALONG GENERATORS OF THIN-WALLED …€¦The problem of loads along generators was first solved by Finsterwalder [1] in 1932 in his investigation of the disturbance](https://img.pdfslide.net/doc/110x75/5e12c6d1204a016efb66865f/line-load-applied-along-generators-of-thin-walled-problem-of-loads-along-generators.jpg)


![Book, The Electric Generators Handbook Synchronous Generators[1]](https://img.pdfslide.net/doc/110x75/552a938b55034689428b46a1/book-the-electric-generators-handbook-synchronous-generators1.jpg)