Embed Size (px)
Citation preview

______________________________
_________________________________________________________________________________________________________
Major Event Trust Fund
Gain from U.S. Formula One Grand Prix
Austin, Texas
Don Hoyte, Ph.D. TexasEconomicImpact.com
6.19.2011
Prepared for
Circuit Events Local Organizing Committee 100 Congress Avenue, Suite 1300
Austin, Texas 78701‐2744
______________________________
TexasEconomicImpact.com
2
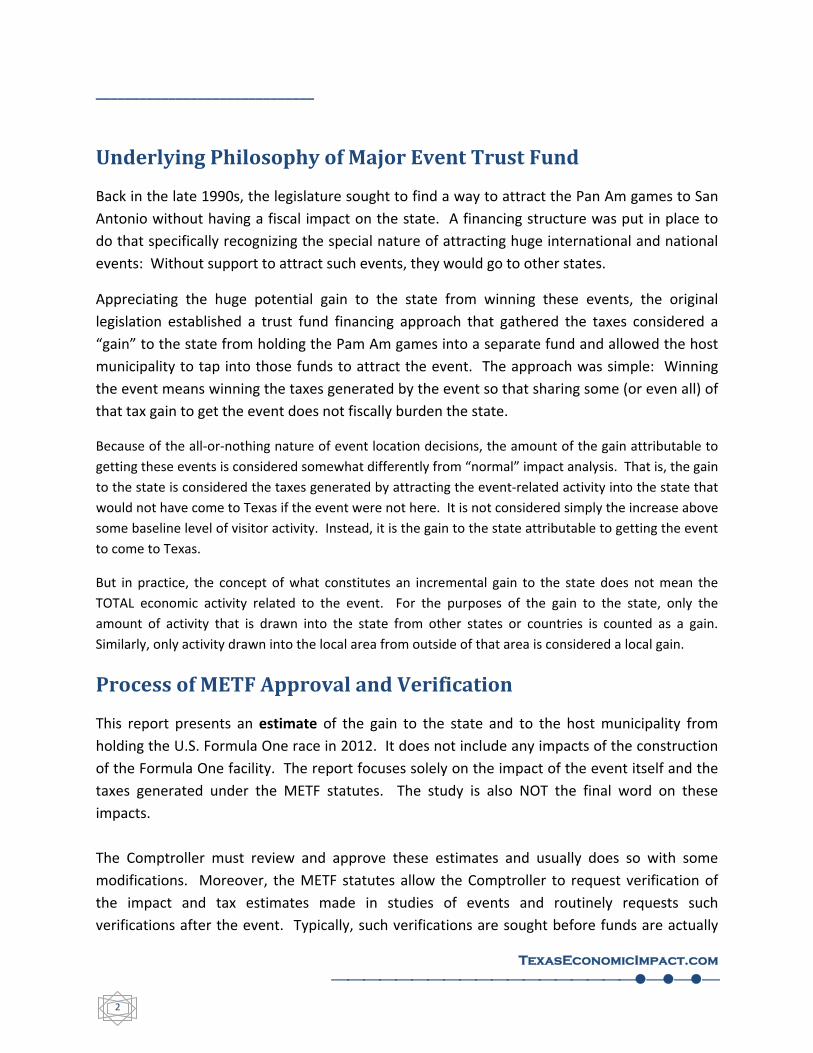
Underlying Philosophy of Major Event Trust Fund
Back in the late 1990s, the legislature sought to find a way to attract the Pan Am games to San
Antonio without having a fiscal impact on the state. A financing structure was put in place to
do that specifically recognizing the special nature of attracting huge international and national
events: Without support to attract such events, they would go to other states.
Appreciating the huge potential gain to the state from winning these events, the original
legislation established a trust fund financing approach that gathered the taxes considered a
“gain” to the state from holding the Pam Am games into a separate fund and allowed the host
municipality to tap into those funds to attract the event. The approach was simple: Winning
the event means winning the taxes generated by the event so that sharing some (or even all) of
that tax gain to get the event does not fiscally burden the state.
Because of the all‐or‐nothing nature of event location decisions, the amount of the gain attributable to
getting these events is considered somewhat differently from “normal” impact analysis. That is, the gain
to the state is considered the taxes generated by attracting the event‐related activity into the state that
would not have come to Texas if the event were not here. It is not considered simply the increase above
some baseline level of visitor activity. Instead, it is the gain to the state attributable to getting the event
to come to Texas.
But in practice, the concept of what constitutes an incremental gain to the state does not mean the
TOTAL economic activity related to the event. For the purposes of the gain to the state, only the
amount of activity that is drawn into the state from other states or countries is counted as a gain.
Similarly, only activity drawn into the local area from outside of that area is considered a local gain.
Process of METF Approval and Verification
This report presents an estimate of the gain to the state and to the host municipality from
holding the U.S. Formula One race in 2012. It does not include any impacts of the construction
of the Formula One facility. The report focuses solely on the impact of the event itself and the
taxes generated under the METF statutes. The study is also NOT the final word on these
impacts.
The Comptroller must review and approve these estimates and usually does so with some
modifications. Moreover, the METF statutes allow the Comptroller to request verification of
the impact and tax estimates made in studies of events and routinely requests such
verifications after the event. Typically, such verifications are sought before funds are actually
______________________________
TexasEconomicImpact.com
3
dispersed under the program. But, because an appropriation made in 2009 allows some funds
from the Trust Fund to be paid in advance of the F1 event, it might appear to some that the
protection usually afforded by post‐event verification prior to payment is not applicable to the
F1 event. But, since the F1 event is expected to be held annually, verification after the 2012
event will serve to define the availability of Trust Funds for 2013 so that failure to achieve the
estimates made in this study will likely reduce support for the event after 2012.
Structure of the Report
This report is divided into essentially two portions. First, to estimate the tax impact of the F1
event under the METF statutes, the first thirteen pages build on the economic impact estimates
presented in Appendix A (starting on page 14). This estimate includes consideration of relevant
tax rates and tax incidence of the taxes allowed to be contributed to the METF both by the
state and the host community. The first section of the report focus solely on developing the tax
gains from the economic gains in Appendix A.
Appendix A develops the economic impacts of holding the event in Texas for the state and the
host municipality. These economic impacts include fan spending, spending by drivers, media,
race teams and others associated with the event, and various corporate and TV spending levels.
Crucial to estimating this economic impact is the capacity limitation on hotel availability in the
Austin Metro region as the facilities will likely be able to accommodate only about 70 percent of
F1 fans during peak event days.
Major Event Trust Fund History: Formula One
In 2009, Senate Bill 1515 (SB1515) passed by the Texas Legislature and signed into law by the
Governor amended Article 5190.14, Vernon's Texas Civil Statutes by renaming what had been
the Other Events Trust Fund to become the Major Events Trust Fund and making some other
modifications to the calculations determining deposits of tax revenue into the fund for events.
One major change in the statute was to include Formula One races in the list of allowable
events which could receive funding under the Major Events Trust Fund statutes after
September 1, 2009. One step in securing that funding is for the host municipality or local
organizing committee to submit an economic impact study of the event detailing the tax gains
to the state and the host municipality from hosting the event. This study serves to estimate
those tax gains from a Formula One Grand Prix race to be held in the Austin Metropolitan area
in 2012.
______________________________
TexasEconomicImpact.com
4
This study is based on the economic impact estimates of the Formula One races contained in a
study of the event prepared for the primary race stakeholder, Accelerator Holdings, LLC of
Austin Texas. These estimates are based on a variety of other studies of similar events held in
Texas and of documented operating parameters for similar Formula One events throughout the
world. These estimates are discussed and presented in detail in Appendix A of this study.
This presentation generally will discuss the economic impact of hosting the Formula One Grand
Prix race from two perspectives. The first is the state’s gain in tax revenues from hosting the
event. This largely centers on economic activity brought in to the state by the event from
outside the state. As such, it excludes those impacts generated by Texans attending the event
either as fans or as media representatives. In addition, sales tax on admission tickets sold to
Texans is excluded for the gain to the state.
The second perspective is that of the gain to the metropolitan area containing and surrounding
the City of Austin. In that regard the economic impacts of Texans from outside of the Austin
Metro area attending the event‐‐‐including non‐Austin based media‐‐‐ are added to the out‐of‐
state economic impacts to estimate the tax gains to Austin from hosting the event. Tables 1, 2
and 3 of this report detail the economic and tax impacts of hosting the Formula One race based
on fan attendance, on team, FIA, FOM and Media attendance and on other miscellaneous
spending related to the event. Table 4 (page 11) rolls up these different economic gains into an
estimate of what the event should generate in state tax revenues for a Major Event Trust Fund
established for the Formula One race including indirect and induced tax impacts.
Table 5 (page 13) rolls up the different economic gains into an estimate of what the event
should generate in tax revenues for Austin including indirect and induced tax impacts.
Fan Economic Impact
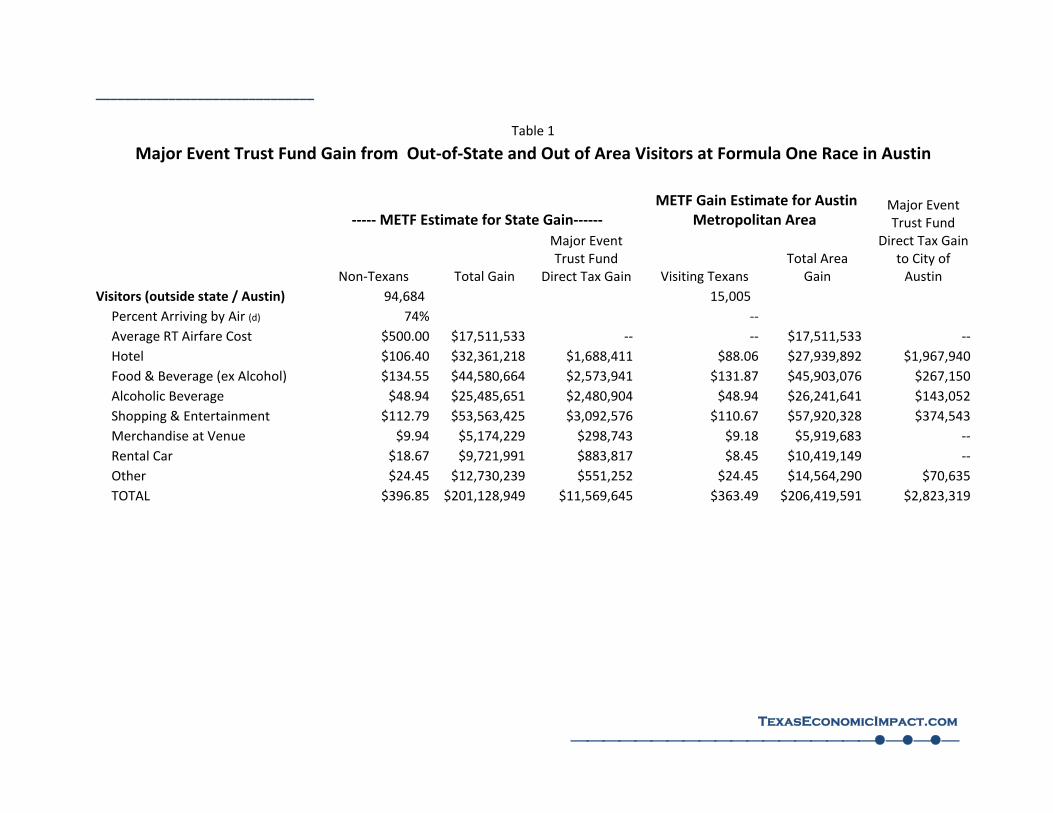
Table 1 presents a summary of the economic impacts of fan spending discussed in Appendix A
(in particular, see Tables 4 and 5 in Appendix A). In total, out‐of‐state fan spending is expected
to reach $201.1 million on the Formula One event. Based on the relevant state sales tax rate,
state hotel tax rate, state rental car tax rate and state alcoholic beverage taxes, it is estimated
that this level of direct event spending will generate $11.6 million in tax revenues from the gain
to the state under the applicable taxes allowed to be deposited into the Major Event Trust Fund
in support of this event.
______________________________
TexasEconomicImpact.com
5
Table 1 also indicates that total spending by both out‐of‐state visitors and Texans visiting the
Austin Metro area from other parts of the state should reach $206.4 million. This figure is
somewhat higher than that for Texas since under the METF, expenditures from other Texans
visting Austin can be considered a gain to the metro area, but are not considered a gain to the
state. Somewhat offsetting these additional visitors is the fact that not all of fan activity
(particularly hotel stays) will be in the Austin Metro area. Given this leakage outside the region
of some economic activity, the Austin taxes generated by the event that parallel those state tax
gains allowed to be deposited into the Major Event Trust Fund amounts to more than $2.8
million.
It should be noted that in estimating the local tax gains, only those portions of the relevant
metropolitan tax gains that will accrue to the City of Austin are considered in the $2.8 million.
In particular, estimated expenditures on food, beverages, alcohol and merchandise at the
venue were considered not taxed at the local level. Total tax gains will accrue to other
localities within the metro region but are not included in the tax local tax impacts in Table 1.
______________________________
TexasEconomicImpact.com
Table 1
Major Event Trust Fund Gain from Out‐of‐State and Out of Area Visitors at Formula One Race in Austin
‐‐‐‐‐ METF Estimate for State Gain‐‐‐‐‐‐ METF Gain Estimate for Austin
Metropolitan Area
Non‐Texans Total Gain
Major Event Trust Fund
Direct Tax Gain Visiting Texans Total Area
Gain
Major Event Trust Fund
Direct Tax Gain to City of Austin
Visitors (outside state / Austin) 94,684 15,005
Percent Arriving by Air (d) 74% ‐‐
Average RT Airfare Cost $500.00 $17,511,533 ‐‐ ‐‐ $17,511,533 ‐‐
Hotel $106.40 $32,361,218 $1,688,411 $88.06 $27,939,892 $1,967,940
Food & Beverage (ex Alcohol) $134.55 $44,580,664 $2,573,941 $131.87 $45,903,076 $267,150
Alcoholic Beverage $48.94 $25,485,651 $2,480,904 $48.94 $26,241,641 $143,052
Shopping & Entertainment $112.79 $53,563,425 $3,092,576 $110.67 $57,920,328 $374,543
Merchandise at Venue $9.94 $5,174,229 $298,743 $9.18 $5,919,683 ‐‐
Rental Car $18.67 $9,721,991 $883,817 $8.45 $10,419,149 ‐‐
Other $24.45 $12,730,239 $551,252 $24.45 $14,564,290 $70,635
TOTAL $396.85 $201,128,949 $11,569,645 $363.49 $206,419,591 $2,823,319
______________________________
TexasEconomicImpact.com
7
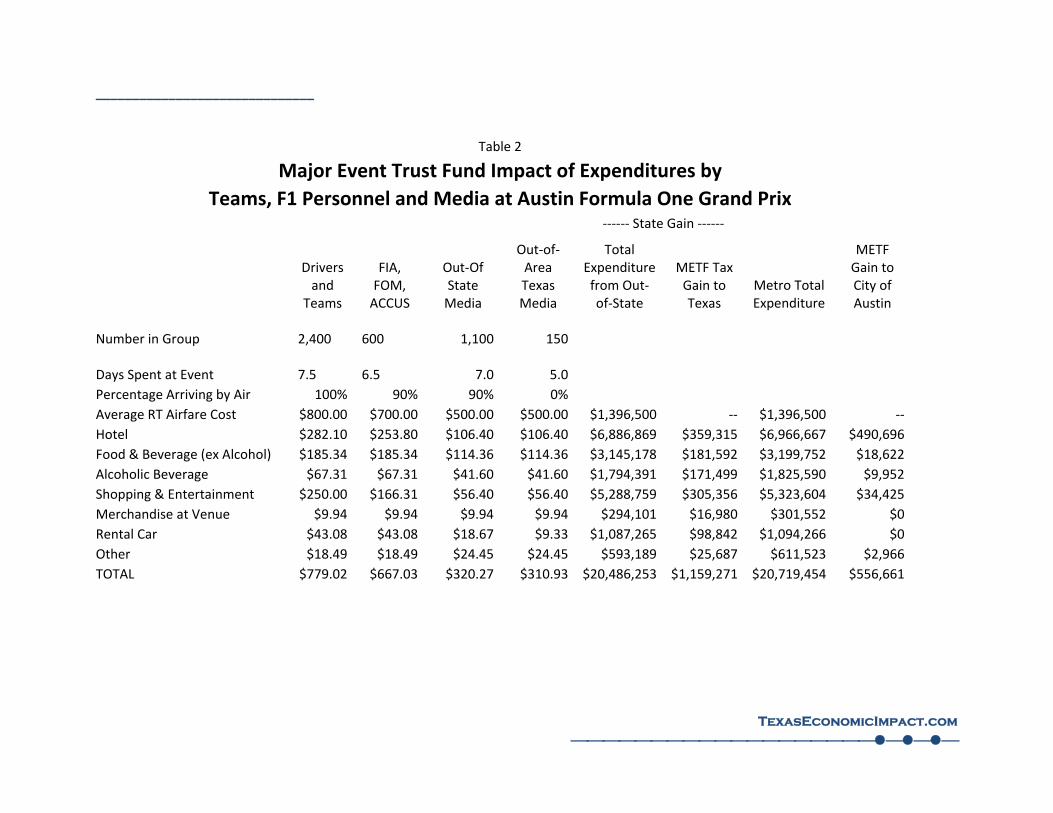
Team, FOM, FIA, ACCUS and Media Impacts
Table 2 presents the estimated economic impacts of the drivers, teams, Formula One
Management (FOM), Federation Internationale de l'Automobile (FIA), Automobile Competition
Committee for the United States (ACCUS) and media attending the Formula One Grand Prix in
Austin. Again, a distinction is made between those visitors from outside Texas versus those
Texans visiting Austin for the event from other parts of the state.
Overall the direct economic impact of hosting this event in Texas from out‐of‐state visitors in
these groups should reach about $20.5 million. In turn, these expenditures should drive state
tax gains under the Major Event Trust Fund of $1.2 million.
Since virtually all of the visitors in the groups considered in Table 2 are from outside Texas, the
economic impact differences between only out‐of‐staters and all visitors from outside the
Austin area is slight. As compared to the $20.5 million gain from only out‐of‐staters, other
Texas media visiting Austin for this event add only slightly to this total raising it to $20.7 million.
Based on this level of economic impact and the appropriate local tax rates for taxes generating
revenue under the Major Event Trust Fund, the gain to the City of Austin from drivers, teams,
FOM, FIA, ACCUS and media should be $556,661.

______________________________
TexasEconomicImpact.com
8
______________________________
TexasEconomicImpact.com
Table 2
Major Event Trust Fund Impact of Expenditures by
Teams, F1 Personnel and Media at Austin Formula One Grand Prix ‐‐‐‐‐‐ State Gain ‐‐‐‐‐‐
Drivers and
Teams
FIA, FOM, ACCUS
Out‐Of State Media
Out‐of‐ Area Texas Media
Total Expenditure from Out‐of‐State
METF Tax Gain to Texas
Metro Total Expenditure
METF Gain to City of Austin
Number in Group 2,400
600
1,100
150
Days Spent at Event 7.5
6.5
7.0
5.0
Percentage Arriving by Air 100% 90% 90% 0%
Average RT Airfare Cost $800.00 $700.00 $500.00 $500.00 $1,396,500 ‐‐ $1,396,500 ‐‐
Hotel $282.10 $253.80 $106.40 $106.40 $6,886,869 $359,315 $6,966,667 $490,696
Food & Beverage (ex Alcohol) $185.34 $185.34 $114.36 $114.36 $3,145,178 $181,592 $3,199,752 $18,622
Alcoholic Beverage $67.31 $67.31 $41.60 $41.60 $1,794,391 $171,499 $1,825,590 $9,952
Shopping & Entertainment $250.00 $166.31 $56.40 $56.40 $5,288,759 $305,356 $5,323,604 $34,425
Merchandise at Venue $9.94 $9.94 $9.94 $9.94 $294,101 $16,980 $301,552 $0
Rental Car $43.08 $43.08 $18.67 $9.33 $1,087,265 $98,842 $1,094,266 $0
Other $18.49 $18.49 $24.45 $24.45 $593,189 $25,687 $611,523 $2,966
TOTAL $779.02 $667.03 $320.27 $310.93 $20,486,253 $1,159,271 $20,719,454 $556,661
______________________________
TexasEconomicImpact.com
10
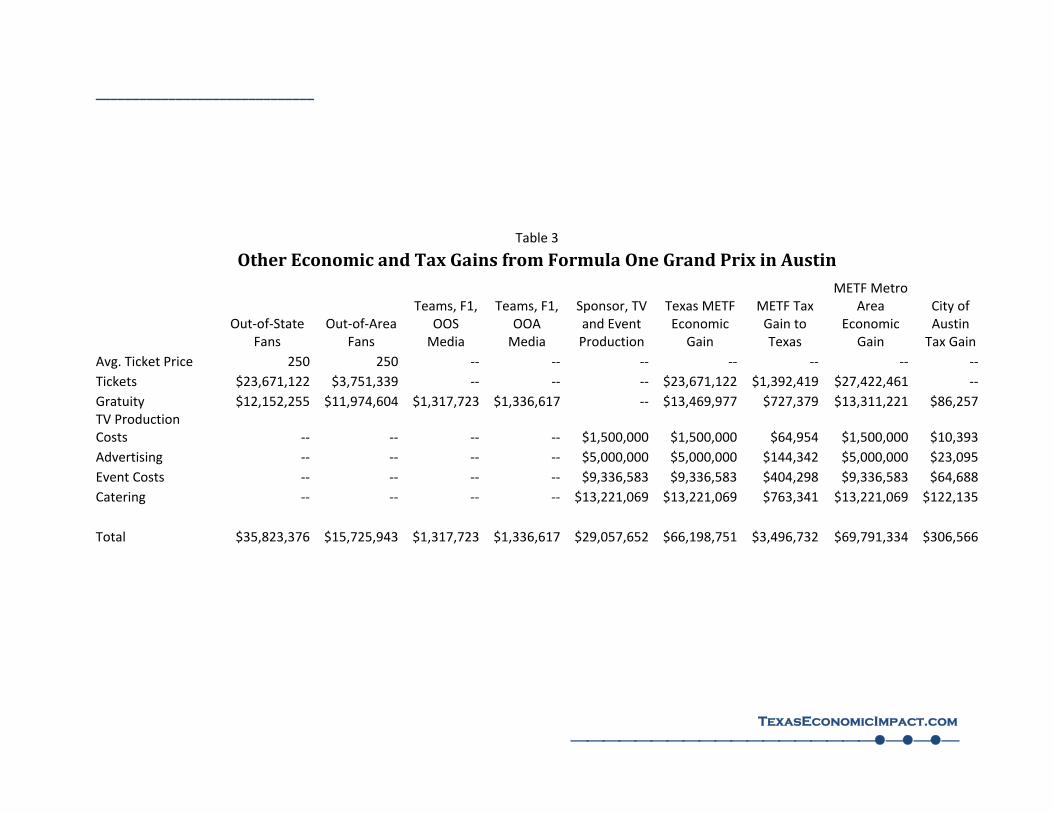
Other Major Event Trust Fund Revenues
In addition to spending driven mostly by individuals, a number of other spending categories will
generate direct economic and tax gains to the state and to the city of Austin related to the
Formula One Grand Prix race. Table 3 details those other economic and tax gains.
First of all, although ticket expenditures typically are not counted as a direct economic impact,
in this case those sales do serve to generate state tax revenues into the trust fund at the state
level. Since tickets to the Formula One event will be subject to state sales tax, this tax itself can
be considered as a gain to the state under the Major Event Trust Fund. On the other hand,
since sales tax on ticket revenues is determined by the site of the event and Elroy does not
impose a local sales tax, no local taxes will be generated from ticket sales.
Secondly, tips earned by service workers from helping at the event and related activities have
traditionally been considered as a direct economic gain of the event since they are earned
during the event itself. Moreover, based on expenditure patterns by lower‐income workers in
the state, direct event‐related earnings by service workers in the hospitality industry
attributable to the event are seen as generating direct sales tax gains as these workers spend
these earnings. In this case, the direct gain to the state from these earnings from out of state
visitors is $12.2 million plus an additional $1.3 million from out‐of‐state media, drivers, FOM,
FIA and ACCUS personnel.
Other significant expenditures by corporate sponsors, TV production and event sponsors
themselves also contribute significantly to the over economic and tax impact of the Formula
One event. Table 3 estimates that the total impact of this spending by out‐of‐state sources
should reach $66.2 million generating $3.5 million in state tax gains into the Major Event Trust
Fund. The local tax gains to the City of Austin should be more modest, yielding about $306,566.
______________________________
TexasEconomicImpact.com
Table 3
Other Economic and Tax Gains from Formula One Grand Prix in Austin
Out‐of‐State
Fans Out‐of‐Area
Fans
Teams, F1, OOS Media
Teams, F1, OOA Media
Sponsor, TV and Event Production
Texas METF Economic
Gain
METF Tax Gain to Texas
METF Metro Area
Economic Gain
City of Austin Tax Gain
Avg. Ticket Price 250 250 ‐‐ ‐‐ ‐‐ ‐‐ ‐‐ ‐‐ ‐‐
Tickets $23,671,122 $3,751,339 ‐‐ ‐‐ ‐‐ $23,671,122 $1,392,419 $27,422,461 ‐‐
Gratuity $12,152,255 $11,974,604 $1,317,723 $1,336,617 ‐‐ $13,469,977 $727,379 $13,311,221 $86,257TV Production Costs ‐‐ ‐‐ ‐‐ ‐‐ $1,500,000 $1,500,000 $64,954 $1,500,000 $10,393
Advertising ‐‐ ‐‐ ‐‐ ‐‐ $5,000,000 $5,000,000 $144,342 $5,000,000 $23,095
Event Costs ‐‐ ‐‐ ‐‐ ‐‐ $9,336,583 $9,336,583 $404,298 $9,336,583 $64,688
Catering ‐‐ ‐‐ ‐‐ ‐‐ $13,221,069 $13,221,069 $763,341 $13,221,069 $122,135
Total $35,823,376 $15,725,943 $1,317,723 $1,336,617 $29,057,652 $66,198,751 $3,496,732 $69,791,334 $306,566
______________________________
TexasEconomicImpact.com
______________________________
TexasEconomicImpact.com
13
Total Major Event Trust Fund Gain
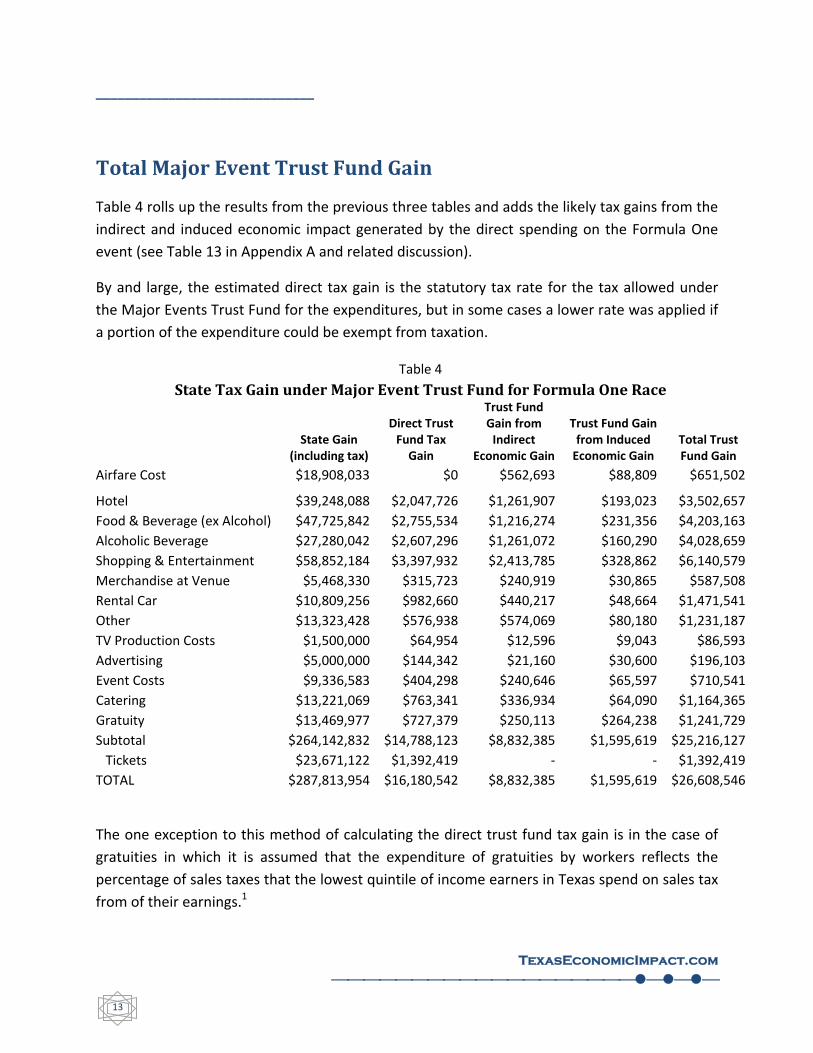
Table 4 rolls up the results from the previous three tables and adds the likely tax gains from the
indirect and induced economic impact generated by the direct spending on the Formula One
event (see Table 13 in Appendix A and related discussion).
By and large, the estimated direct tax gain is the statutory tax rate for the tax allowed under
the Major Events Trust Fund for the expenditures, but in some cases a lower rate was applied if
a portion of the expenditure could be exempt from taxation.
Table 4
State Tax Gain under Major Event Trust Fund for Formula One Race
State Gain
(including tax)
Direct Trust Fund Tax Gain
Trust Fund Gain from Indirect
Economic Gain
Trust Fund Gain from Induced Economic Gain
Total Trust Fund Gain
Airfare Cost $18,908,033 $0 $562,693 $88,809 $651,502
Hotel $39,248,088 $2,047,726 $1,261,907 $193,023 $3,502,657
Food & Beverage (ex Alcohol) $47,725,842 $2,755,534 $1,216,274 $231,356 $4,203,163
Alcoholic Beverage $27,280,042 $2,607,296 $1,261,072 $160,290 $4,028,659
Shopping & Entertainment $58,852,184 $3,397,932 $2,413,785 $328,862 $6,140,579
Merchandise at Venue $5,468,330 $315,723 $240,919 $30,865 $587,508
Rental Car $10,809,256 $982,660 $440,217 $48,664 $1,471,541
Other $13,323,428 $576,938 $574,069 $80,180 $1,231,187
TV Production Costs $1,500,000 $64,954 $12,596 $9,043 $86,593
Advertising $5,000,000 $144,342 $21,160 $30,600 $196,103
Event Costs $9,336,583 $404,298 $240,646 $65,597 $710,541
Catering $13,221,069 $763,341 $336,934 $64,090 $1,164,365
Gratuity $13,469,977 $727,379 $250,113 $264,238 $1,241,729
Subtotal $264,142,832 $14,788,123 $8,832,385 $1,595,619 $25,216,127
Tickets $23,671,122 $1,392,419 ‐ ‐ $1,392,419
TOTAL $287,813,954 $16,180,542 $8,832,385 $1,595,619 $26,608,546
The one exception to this method of calculating the direct trust fund tax gain is in the case of
gratuities in which it is assumed that the expenditure of gratuities by workers reflects the
percentage of sales taxes that the lowest quintile of income earners in Texas spend on sales tax
from of their earnings.1
______________________________
TexasEconomicImpact.com
14
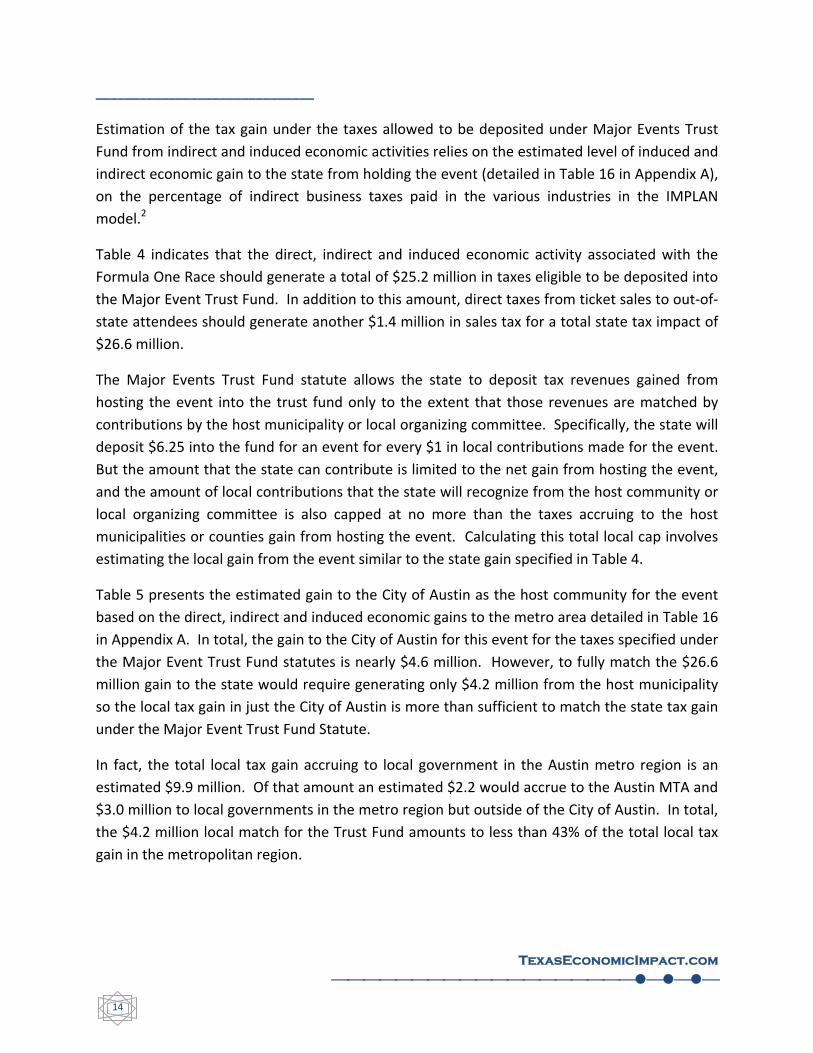
Estimation of the tax gain under the taxes allowed to be deposited under Major Events Trust
Fund from indirect and induced economic activities relies on the estimated level of induced and
indirect economic gain to the state from holding the event (detailed in Table 16 in Appendix A),
on the percentage of indirect business taxes paid in the various industries in the IMPLAN
model.2
Table 4 indicates that the direct, indirect and induced economic activity associated with the
Formula One Race should generate a total of $25.2 million in taxes eligible to be deposited into
the Major Event Trust Fund. In addition to this amount, direct taxes from ticket sales to out‐of‐
state attendees should generate another $1.4 million in sales tax for a total state tax impact of
$26.6 million.
The Major Events Trust Fund statute allows the state to deposit tax revenues gained from
hosting the event into the trust fund only to the extent that those revenues are matched by
contributions by the host municipality or local organizing committee. Specifically, the state will
deposit $6.25 into the fund for an event for every $1 in local contributions made for the event.
But the amount that the state can contribute is limited to the net gain from hosting the event,
and the amount of local contributions that the state will recognize from the host community or
local organizing committee is also capped at no more than the taxes accruing to the host
municipalities or counties gain from hosting the event. Calculating this total local cap involves
estimating the local gain from the event similar to the state gain specified in Table 4.
Table 5 presents the estimated gain to the City of Austin as the host community for the event
based on the direct, indirect and induced economic gains to the metro area detailed in Table 16
in Appendix A. In total, the gain to the City of Austin for this event for the taxes specified under
the Major Event Trust Fund statutes is nearly $4.6 million. However, to fully match the $26.6
million gain to the state would require generating only $4.2 million from the host municipality
so the local tax gain in just the City of Austin is more than sufficient to match the state tax gain
under the Major Event Trust Fund Statute.
In fact, the total local tax gain accruing to local government in the Austin metro region is an
estimated $9.9 million. Of that amount an estimated $2.2 would accrue to the Austin MTA and
$3.0 million to local governments in the metro region but outside of the City of Austin. In total,
the $4.2 million local match for the Trust Fund amounts to less than 43% of the total local tax
gain in the metropolitan region.
______________________________
TexasEconomicImpact.com
15
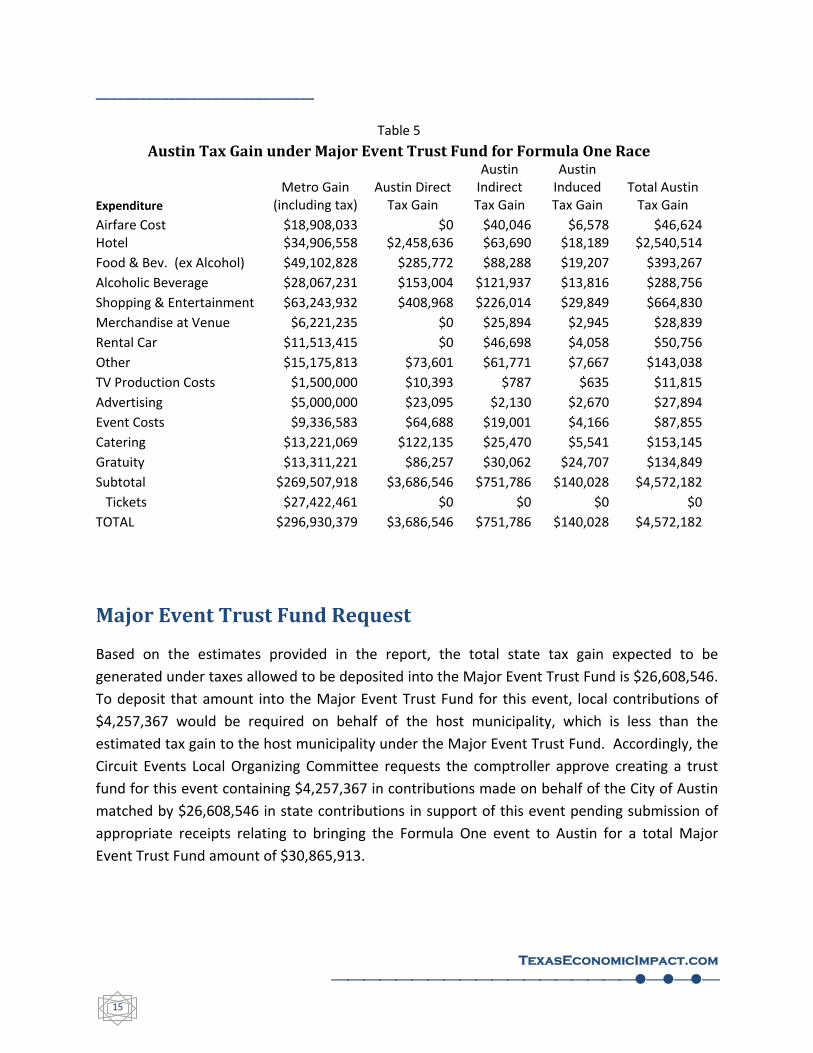
Table 5
Austin Tax Gain under Major Event Trust Fund for Formula One Race
Expenditure
Metro Gain (including tax)
Austin Direct Tax Gain
Austin Indirect Tax Gain
Austin Induced Tax Gain
Total Austin Tax Gain
Airfare Cost $18,908,033 $0 $40,046 $6,578 $46,624 Hotel $34,906,558 $2,458,636 $63,690 $18,189 $2,540,514
Food & Bev. (ex Alcohol) $49,102,828 $285,772 $88,288 $19,207 $393,267
Alcoholic Beverage $28,067,231 $153,004 $121,937 $13,816 $288,756
Shopping & Entertainment $63,243,932 $408,968 $226,014 $29,849 $664,830
Merchandise at Venue $6,221,235 $0 $25,894 $2,945 $28,839
Rental Car $11,513,415 $0 $46,698 $4,058 $50,756
Other $15,175,813 $73,601 $61,771 $7,667 $143,038
TV Production Costs $1,500,000 $10,393 $787 $635 $11,815
Advertising $5,000,000 $23,095 $2,130 $2,670 $27,894
Event Costs $9,336,583 $64,688 $19,001 $4,166 $87,855
Catering $13,221,069 $122,135 $25,470 $5,541 $153,145
Gratuity $13,311,221 $86,257 $30,062 $24,707 $134,849
Subtotal $269,507,918 $3,686,546 $751,786 $140,028 $4,572,182
Tickets $27,422,461 $0 $0 $0 $0
TOTAL $296,930,379 $3,686,546 $751,786 $140,028 $4,572,182
Major Event Trust Fund Request
Based on the estimates provided in the report, the total state tax gain expected to be
generated under taxes allowed to be deposited into the Major Event Trust Fund is $26,608,546.
To deposit that amount into the Major Event Trust Fund for this event, local contributions of
$4,257,367 would be required on behalf of the host municipality, which is less than the
estimated tax gain to the host municipality under the Major Event Trust Fund. Accordingly, the
Circuit Events Local Organizing Committee requests the comptroller approve creating a trust
fund for this event containing $4,257,367 in contributions made on behalf of the City of Austin
matched by $26,608,546 in state contributions in support of this event pending submission of
appropriate receipts relating to bringing the Formula One event to Austin for a total Major
Event Trust Fund amount of $30,865,913.
______________________________
TexasEconomicImpact.com
16
Appendix A
Austin Formula One Event Impact Study
______________________________
TexasEconomicImpact.com
17
Economic Gain from
U.S. Formula One Grand PrixAustin, Texas
Don Hoyte, Ph.D.
REVISED 6.17.2011
Prepared for
Accelerator Holdings, LLC Austin, Texas
______________________________
TexasEconomicImpact.com
18
Executive Summary
Formula One Grand Prix events are without a doubt one of the major sporting events held
throughout the world but because the U.S. market has not hosted a Grand Prix race in years,
this impact can go under‐appreciated. But lack of familiarity does not change the degree to
which a Formula One Grand Prix can support‐‐‐and possibly transform‐‐‐ a local economy.
Based on key parameters of Formula One races and similar events held recently in Texas, it is
estimated that the total direct, indirect and induced spending by out‐of‐state visitors to Texas
created by a Formula One Grand Prix in Austin would reach $482.1 million. This is composed of
a direct impact of $287.8 million from spending by out‐of‐state visitors spending time (and
money) in the Texas at the Grand Prix plus $194.3 million in indirect and induced spending.
Considering both out‐of‐state visitors and attendees from other parts of Texas at the event
staying in the Austin metro region changes this estimated impact to $296.9 million in direct
spending plus $151.1 million in indirect and induced spending.
The major portion of this spending comes from fans attending the event. Out‐of‐state fans at
an Austin Grand Prix are expected to spend $213.3 million at the event while fan spending in
the Austin metro region (including Texas fans attending the event from other parts of the state)
will amount to $218.4 million. Other significant sources of spending at the event come from
out‐of‐area media, drivers, teams, FIA, FOM and ACCUS personnel along with corporate
sponsors and event operations themselves.
These spending gains will serve to support jobs in the state, both from direct spending and from
indirect and induced spending. The direct spending gains from hosting the Formula One Grand
Prix should support 3,699 jobs in the Texas economy based on just visitors from out of state.
The indirect and induced gains from this out‐of‐state spending should support an additional
1,259 jobs for a total of 4,958 jobs.
______________________________
TexasEconomicImpact.com
19
Economic Gain of Formula One Race Events
There are relatively few events that compare in magnitude to hosting a Formula One Grand Prix
race. Certainly the month‐long World Cup soccer matches have more global interest, and in the
U.S. the Super Bowl is the “100‐year flood” that other sports shoot to achieve in the U.S. But
after those two events, Formula One races have been shown to have the largest global fan
base.
The economic impacts of Formula One races stem from many sources. Clearly the number of
race‐day visitors is the largest single manifestation. But other activities also generate strong
economic gains to the host community and the state as well. The earnings by temporary
workers needed to stage the race is significant. Corporate expenditures to host galas, parties
and attract media attention ranges into the millions of dollars. The mere logistics of staging a
race are huge. Media interest can bring more than 1,000 reporters, writers, commentators,
electronic media technicians and others into the state for four, five or even more days. The
divers, crews and others can often take up more than 100 hotel rooms each night from a single
team.
It is important to document and measure the both economic impact of the Formula One race
on Austin and on Texas. But it is crucial to estimate the economic GAIN to the region and the
state. There is an important distinction between economic impact and economic gain.
A dollar spent in a local or state economy generates an economic impact. If that dollar is used
to buy a shirt, part of the dollar goes to pay the salesperson’s salary, part to the wholesaler for
the shirt, part to the retail business’s overhead, part to pay accountants, lawyers, janitors and
others hired by the retailer. The portion going to the wholesaler goes in part to the shirt
manufacturer, who uses those earnings to pay for cloth, thread and even indirectly to the
farmer that raised the cotton.
The simple act of spending one dollar ripples through regions, states and nations. But whether
or not the act of spending that dollar represents a GAIN to a region, state or nation depends
crucially on where the dollar came from. If a local resident spends a dollar on a shirt locally,
that spending has a local economic impact, but is that impact a gain to the locality? Not in the
same sense that enticing or encouraging a resident from another region, state or nation to

______________________________
TexasEconomicImpact.com
20
spend their dollar on a shirt bought from a local retailer does. As soon as administrative
boundaries become relevant through tax‐base concerns or in concepts of local economic
welfare (such as being able to find a job to support a family without having to relocate), WHERE
the source of the dollar spent comes from becomes crucial in determining if a local expenditure
represents an economic gain to the administrative region or not.
To suppose that all of what is spent “would have been spent otherwise SOMEWHERE” so no
spending represents a true gain to a locality is a simplistic and near totally useless concept.
Governments make real investments in fixed infrastructure and abandoning that infrastructure
because of major shifts in demand is a real economic cost. People have real investments in
social networks of emotional support which cements society into efficient economic units.
Having to disrupt those networks to relocate in order to find work generates real social and
personal costs. WHERE expenditures are made matters.
So the purpose of this report is to gauge both the economic impact of the activities related to
hosting a Formula One event in Austin with a primary emphasis on the economic GAIN to the
region and to Texas. But there are some gains that range beyond the ability of this report to
accurately assess the long‐term economic value of Austin hosting the U.S. Formula One Grand
Prix. These are largely “psychic” gains in how the world views Texas and Austin as a result of
the media exposure of hosting this event. These gains are significant in contributing to how
Austin and Texas are seen by a much larger world community, but measuring the value of these
gains to the state and the city are beyond the scope of this report.
This report examines the magnitude and impact of various streams of direct spending
associated with hosting a Formula One event. These streams can range from the highly visible‐‐
‐such as tens of thousands of visitors reveling on race day‐‐‐to the more obscure such as media
spending. This report also gauges the indirect and induced economic gains for that direct
spending. But to properly appreciate these revenue streams it is important to first appreciate
the activity that comprises a Formula One Race
Anatomy of a Formula One Grand Prix3
Essential in estimating the impact of a Formula One Grand Pix event in Austin Texas is first understanding what such an event entails. A Formula 1 Grand Prix weekend is a lot more than just a 2‐hour race on Sunday afternoon and it's a lot more than just a weekend.
______________________________
TexasEconomicImpact.com
21
While race day on Sunday is no doubt the high point of the event, it is also the day when many people involved have the least to do. On the Monday before a race, crew members of the dozen teams will travel from the previous event to Austin. Some crew members arrive well before this time. Depending on the ultimate race schedule, the shortest trip would be from Montreal, although competing teams could be traveling from far more distant locales. Once here, the teams begin setting up the teams' garages. The racing cars arrive in pieces and mechanics put them together by Thursday, when they undergo inspection to make sure that they conform to the technical regulations. The race team crewmen also practice pit stops outside their garages. By Wednesday most of the drivers, and the media arrives. The International Automobile Federation, the sport's governing body, holds a press conference in the afternoon, with drivers or other team members. Teams also offer interviews with drivers which should prove to be particularly of interest for the first running of a race at a new site. Friday morning from 10:00 ‐ 11:30 marks the first free practice. It does not count for a grid position. The time is used to set up the cars for qualifying and for the race. Friday afternoon from 2:00 ‐ 3:30 is the second free practice to again help determine car set up and qualifying. Usually another FIA press conference takes place after the second practice. On Saturday from 11:00 ‐ 12:00 is Saturday free practice in preparation for qualifying. Later from 2:00 ‐ 3:00 is qualifying. Drivers try to set the fastest lap possible to obtain the best grid position for the race start based on a one‐hour qualifying session divided into three parts. For the first 20 minutes (Q1), all cars together on the track try to set the fastest time. The slowest seven cars are eliminated, earning grid positions 16 to 20. Q2 runs from 2:27 to 2:42 during which the 15 remaining cars do another round, their previous lap times having been cancelled. The slowest five cars are eliminated and take the grid positions 11 to 15. Finally, from 2:50 to 3:00 is Q3 with the 10 last cars fighting for the pole position, or No. 1 spot on the grid, and qualify no lower than 10th. On both Friday and Saturday, teams also allow the media to conduct interviews with their drivers and staff and hold special events with their sponsors, such as the launching of, say, a new Formula 1 video game‐‐‐or a new Formula 1 track!! At just about every Grand Prix location, the race takes place at 2:00 pm Sunday. Races run an average of 190 miles, which usually takes about 1 1/2 hours. If they are run during a rain storm, they take longer. But the rules stipulate that a race cannot run any longer than 2 hours, so even with several laps remaining a race will be stopped at that point and the leader is declared the winner.

______________________________
TexasEconomicImpact.com
22
After the race the top three drivers receive trophies on the victory podium, they then take part in a television press conference, followed by one for the print media. During the race itself, teams already begin to dismantle their garages and pack equipment into their trucks. But the process of packing up the paddock goes on into the next day and beyond, before the trucks head out to the next race site or back to the team factory
Fan Attendance
The most visible effects of hosting a Formula One race are the fans coming to view the
spectacle. While Formula One races have been held in the U.S. as recently as 2007 the
experience of the latter races in drawing a fan base is unlikely to a have much relevance today.
Earlier races that were well promoted and funded drew in excess of 225,000 fans, but later
races less well supported or publicized saw much smaller crowds.4 It is estimated that average
race day attendance the last six years of Formula One racing at Indianapolis was about
125,000.5
At least as relevant to the estimation of visitors to a Formula One race today are recent
international race experiences. From 2005 to 2008, average total attendance at Formula one
races range from about 190,000 to 207,000.6 Race‐day totals, though closely guarded numbers,
are often cited in local news media reports of the race. Based on these estimates, recent large
Formula One events have averaged in excess of 115,000 fans on race day (see Table 1).7 Clearly
attendance at Formula One events can easily exceed the 100,000 fans seen at some of Texas’
largest sporting events. For the first running of the U. S. Grand Prix in Austin, it is conservatively
estimated that fan attendance will reach 120,000 to 125,000 on race day.8
Table 1 Recent Fan Attendance Estimates at
Formula One Grand Prix Races
Year Grand Prix Location Attendance 2010 British Grand Prix Silverstone, England 115,000 2009 Australian Grand Prix Melbourne, Australia 105,000 2009 British Grand Prix Silverstone, England 128,000 2008 Spanish Grand Pix Barcelona, Spain 132,600 2008 British Grand Prix Silverstone, England 95,000 2007 Australian Grand Prix Melbourne, Australia 105,000 2007 Spanish Grand Pix Barcelona, Spain 140,300 2007 Canadian Grand Prix Montreal, Canada 120,000 2006 Australian Grand Prix Melbourne, Australia 103,000 2005 Australian Grand Prix Melbourne, Australia 118,200
______________________________
TexasEconomicImpact.com
23
Average 116,210
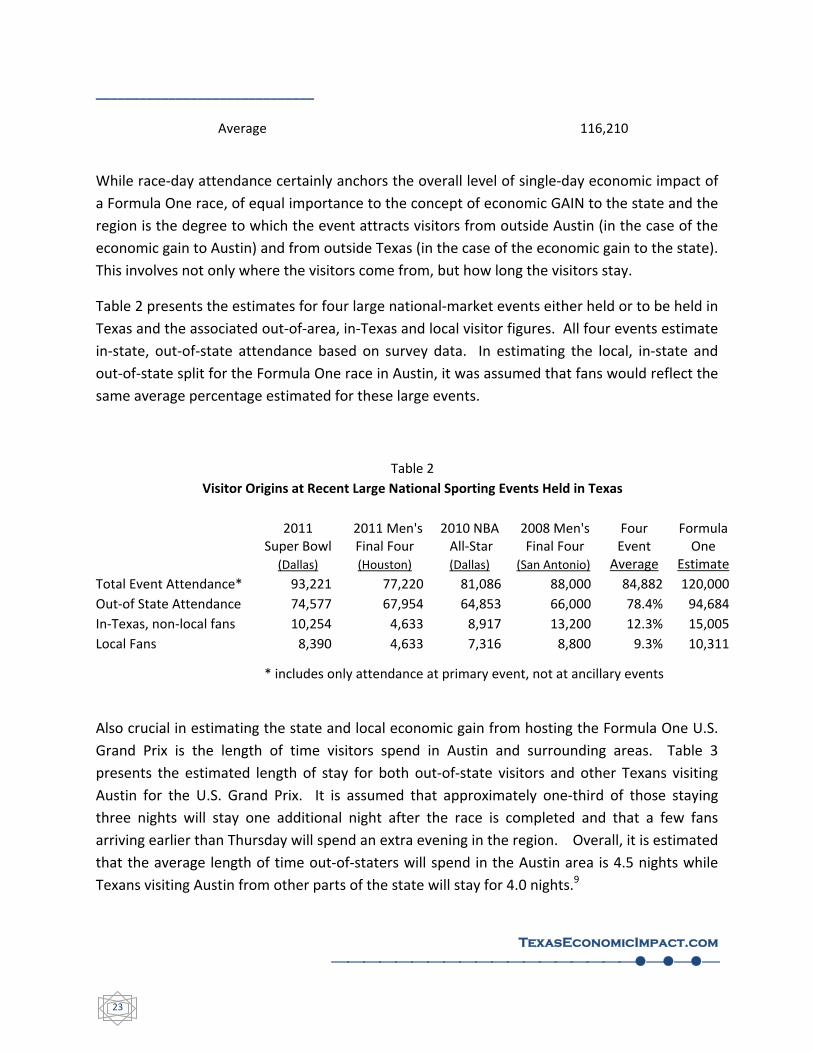
While race‐day attendance certainly anchors the overall level of single‐day economic impact of
a Formula One race, of equal importance to the concept of economic GAIN to the state and the
region is the degree to which the event attracts visitors from outside Austin (in the case of the
economic gain to Austin) and from outside Texas (in the case of the economic gain to the state).
This involves not only where the visitors come from, but how long the visitors stay.
Table 2 presents the estimates for four large national‐market events either held or to be held in
Texas and the associated out‐of‐area, in‐Texas and local visitor figures. All four events estimate
in‐state, out‐of‐state attendance based on survey data. In estimating the local, in‐state and
out‐of‐state split for the Formula One race in Austin, it was assumed that fans would reflect the
same average percentage estimated for these large events.
Table 2
Visitor Origins at Recent Large National Sporting Events Held in Texas
2011 2011 Men's 2010 NBA 2008 Men's Four Formula Super Bowl Final Four All‐Star Final Four Event One (Dallas) (Houston) (Dallas) (San Antonio) Average Estimate
Total Event Attendance* 93,221 77,220 81,086 88,000 84,882 120,000
Out‐of State Attendance 74,577 67,954 64,853 66,000 78.4% 94,684
In‐Texas, non‐local fans 10,254 4,633 8,917 13,200 12.3% 15,005
Local Fans 8,390 4,633 7,316 8,800 9.3% 10,311
* includes only attendance at primary event, not at ancillary events
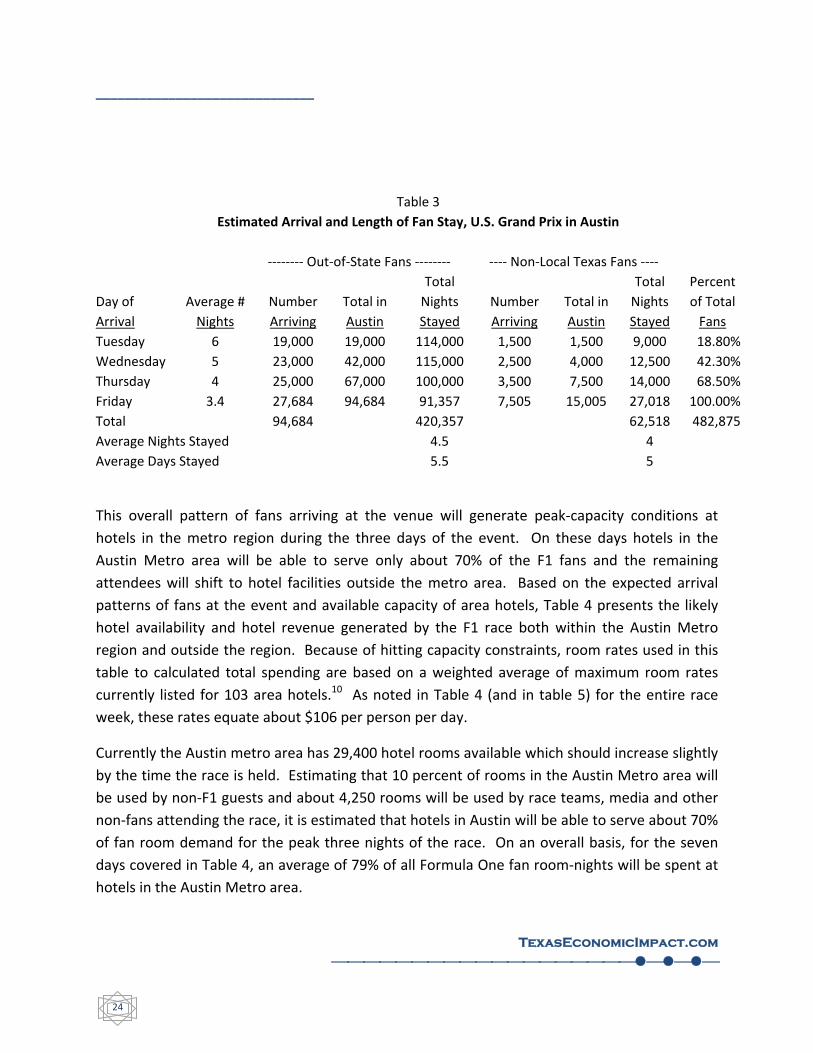
Also crucial in estimating the state and local economic gain from hosting the Formula One U.S.
Grand Prix is the length of time visitors spend in Austin and surrounding areas. Table 3
presents the estimated length of stay for both out‐of‐state visitors and other Texans visiting
Austin for the U.S. Grand Prix. It is assumed that approximately one‐third of those staying
three nights will stay one additional night after the race is completed and that a few fans
arriving earlier than Thursday will spend an extra evening in the region. Overall, it is estimated
that the average length of time out‐of‐staters will spend in the Austin area is 4.5 nights while
Texans visiting Austin from other parts of the state will stay for 4.0 nights.9
______________________________
TexasEconomicImpact.com
24
Table 3
Estimated Arrival and Length of Fan Stay, U.S. Grand Prix in Austin
‐‐‐‐‐‐‐‐ Out‐of‐State Fans ‐‐‐‐‐‐‐‐ ‐‐‐‐ Non‐Local Texas Fans ‐‐‐‐
Total Total Percent
Day of Average # Number Total in Nights Number Total in Nights of Total
Arrival Nights Arriving Austin Stayed Arriving Austin Stayed Fans
Tuesday 6 19,000 19,000 114,000 1,500 1,500 9,000 18.80%
Wednesday 5 23,000 42,000 115,000 2,500 4,000 12,500 42.30%
Thursday 4 25,000 67,000 100,000 3,500 7,500 14,000 68.50%
Friday 3.4 27,684 94,684 91,357 7,505 15,005 27,018 100.00%
Total 94,684 420,357 62,518 482,875
Average Nights Stayed 4.5 4
Average Days Stayed 5.5 5
This overall pattern of fans arriving at the venue will generate peak‐capacity conditions at
hotels in the metro region during the three days of the event. On these days hotels in the
Austin Metro area will be able to serve only about 70% of the F1 fans and the remaining
attendees will shift to hotel facilities outside the metro area. Based on the expected arrival
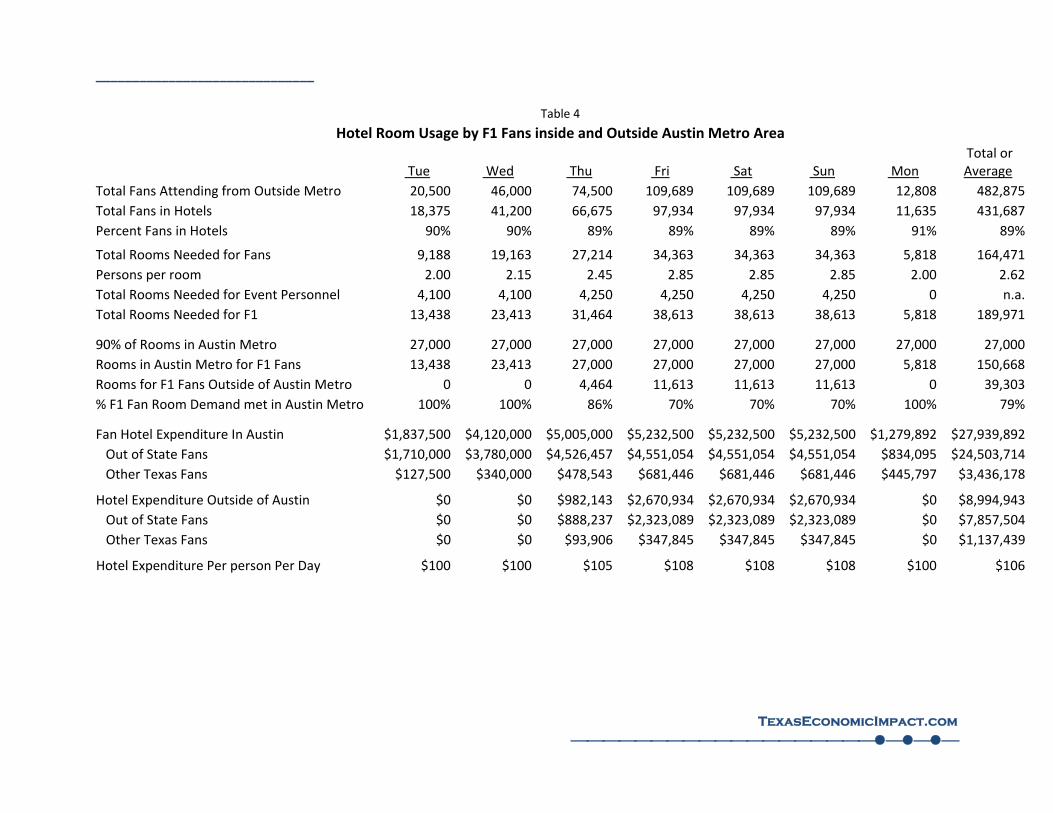
patterns of fans at the event and available capacity of area hotels, Table 4 presents the likely
hotel availability and hotel revenue generated by the F1 race both within the Austin Metro
region and outside the region. Because of hitting capacity constraints, room rates used in this
table to calculated total spending are based on a weighted average of maximum room rates
currently listed for 103 area hotels.10 As noted in Table 4 (and in table 5) for the entire race
week, these rates equate about $106 per person per day.
Currently the Austin metro area has 29,400 hotel rooms available which should increase slightly
by the time the race is held. Estimating that 10 percent of rooms in the Austin Metro area will
be used by non‐F1 guests and about 4,250 rooms will be used by race teams, media and other
non‐fans attending the race, it is estimated that hotels in Austin will be able to serve about 70%
of fan room demand for the peak three nights of the race. On an overall basis, for the seven
days covered in Table 4, an average of 79% of all Formula One fan room‐nights will be spent at
hotels in the Austin Metro area.

______________________________
TexasEconomicImpact.com
25
______________________________
TexasEconomicImpact.com
Table 4
Hotel Room Usage by F1 Fans inside and Outside Austin Metro Area
Tue Wed Thu Fri Sat Sun Mon Total or Average
Total Fans Attending from Outside Metro 20,500 46,000 74,500 109,689 109,689 109,689 12,808 482,875
Total Fans in Hotels 18,375 41,200 66,675 97,934 97,934 97,934 11,635 431,687
Percent Fans in Hotels 90% 90% 89% 89% 89% 89% 91% 89%
Total Rooms Needed for Fans 9,188 19,163 27,214 34,363 34,363 34,363 5,818 164,471
Persons per room 2.00 2.15 2.45 2.85 2.85 2.85 2.00 2.62
Total Rooms Needed for Event Personnel 4,100 4,100 4,250 4,250 4,250 4,250 0 n.a.
Total Rooms Needed for F1 13,438 23,413 31,464 38,613 38,613 38,613 5,818 189,971
90% of Rooms in Austin Metro 27,000 27,000 27,000 27,000 27,000 27,000 27,000 27,000
Rooms in Austin Metro for F1 Fans 13,438 23,413 27,000 27,000 27,000 27,000 5,818 150,668
Rooms for F1 Fans Outside of Austin Metro 0 0 4,464 11,613 11,613 11,613 0 39,303
% F1 Fan Room Demand met in Austin Metro 100% 100% 86% 70% 70% 70% 100% 79%
Fan Hotel Expenditure In Austin $1,837,500 $4,120,000 $5,005,000 $5,232,500 $5,232,500 $5,232,500 $1,279,892 $27,939,892
Out of State Fans $1,710,000 $3,780,000 $4,526,457 $4,551,054 $4,551,054 $4,551,054 $834,095 $24,503,714
Other Texas Fans $127,500 $340,000 $478,543 $681,446 $681,446 $681,446 $445,797 $3,436,178
Hotel Expenditure Outside of Austin $0 $0 $982,143 $2,670,934 $2,670,934 $2,670,934 $0 $8,994,943
Out of State Fans $0 $0 $888,237 $2,323,089 $2,323,089 $2,323,089 $0 $7,857,504
Other Texas Fans $0 $0 $93,906 $347,845 $347,845 $347,845 $0 $1,137,439
Hotel Expenditure Per person Per Day $100 $100 $105 $108 $108 $108 $100 $106
______________________________
TexasEconomicImpact.com
27
Fan Expenditures
Crucial figures for estimating the total economic impact on Austin of fan spending on the
Formula One race is, unfortunately, impossible to derive directly. Because there has been no
race of this type in the area‐‐‐or in Texas or even the U.S. in recent years‐‐‐fan expenditure
survey results are not available. Nor are survey results available for previous races in other
parts of the U.S.
Survey‐based expenditure estimates are however available for similar events held in Texas and
one large nation‐wide survey of expenditures by attendees at trade shows also contains some
relevant and confirming data.
There have been, or will be, four major sporting events that have provided expenditure
estimates of fans to the Comptroller’s office in the past three years. These studies include the
2008 NCAA Men’s Final Four in San Antonio11, the 2010 NBA All‐star Game in Dallas12, the
upcoming 2011 NFL Super Bowl in Dallas13 and the 2011 NCAA Men’s Final Four in Houston.14
In addition, a major survey effort of attendees at conferences in the U.S.15 provides confirming
figures to the Texas‐based event expenditures. Moreover, this survey provides other data
relevant to expenditures (such as airline ticket expenditures) that is missing from other studies.
Even though two of these events have yet to occur, the economic impact estimates of fan
spending all are grounded in surveys either of previous events held in Texas or previous events
of the same series.
For example, the estimates of fan spending at the 2011 NCAA Final Four in Houston heavily
utilize the results of an expenditure survey of attendees at the 2009 Final Four in Detroit.16 The
estimates in the 2011 Dallas Super Bowl Study were grounded in two separate consumer
surveys. One interviewed 500 attendees at the 2003 Super Bowl in San Diego and the other
was a telephone survey of 400 random households in the San Diego region area during Super
Bowl week.17 The 2007 Study of the San Antonio Final Four relied on several surveys. One was
conducted of attendees before, during and after at the 2004 Final Four in San Antonio18 and
another was survey results from the 2007 Final Four in Atlanta.19 Some survey results are also
cited in the 2010 NBA Basketball study.20 Finally, the ExPact Study surveyed 12,920 delegates at
approximately 1,000 conventions in the U.S. about their event‐related expenditures.21
In total, then, relevant estimates of fan expenditures at large sporting and corporate events
abound and they are all grounded in survey‐based estimates of consumer expenditure
behavior. But, these estimates have not been put on a consistent comparable basis for the
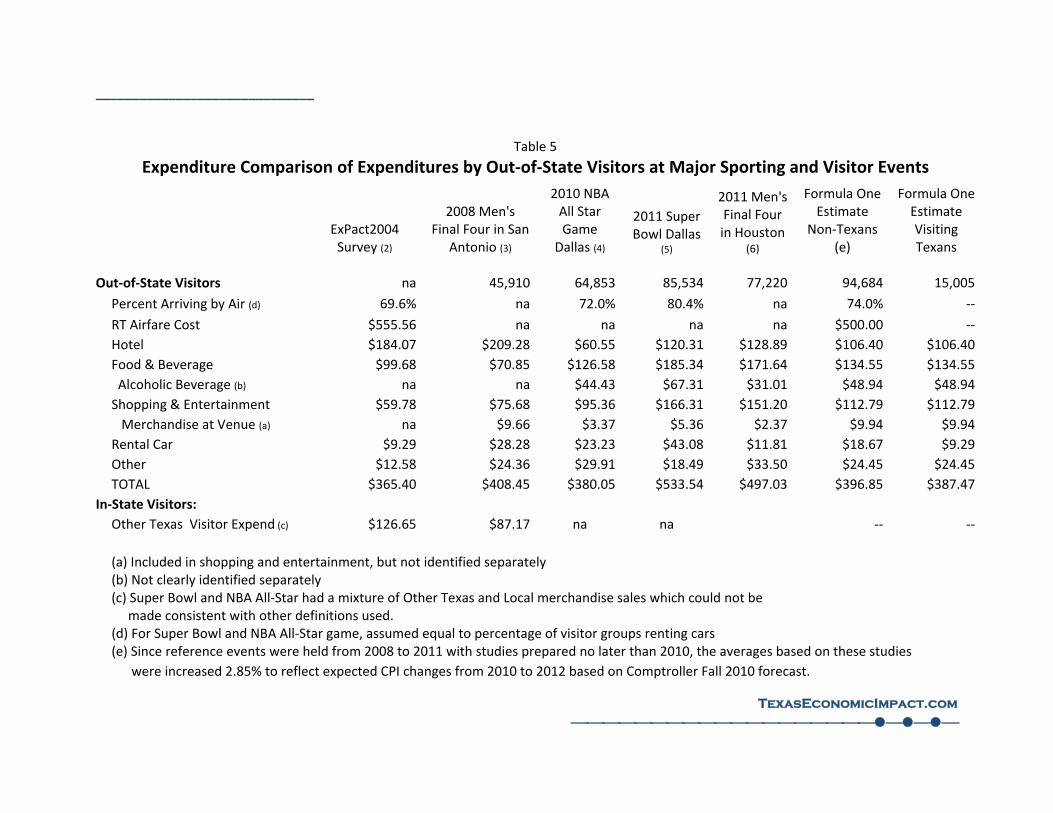
events examined. Table 5 collects and standardizes the estimates of fan expenditures from
different events to develop realistic estimates for fan expenditures at the future Formula One
______________________________
TexasEconomicImpact.com
28
race in Austin. This table presents per person per day expenditures at the four Texas events
and one national conference survey.22
Overall, expected average out‐of‐state fan expenditure at the Formula One race should reach
about $397 per day excluding airfare costs. This estimate is 12 percent below the average of
$449 (adjusted for inflation to 2011) for all five reference event studies and is more than 25%
less than the spending projected for the 2011 Super Bowl and 21% less than projected spending
at the 2011 Final four. The one area where expenditures are expected to reach relatively high
levels compared to the reference studies are in at‐event merchandise sales. These are
expected to match those seen in the 2008 survey of fans at the San Antonio Final Four when
adjusted for inflation.
Expenditures by other Texans at the Formula One race should reach about $387 per person per
day. While this is somewhat above the average expenditures by similar groups in the ExPact
survey,23 it is substantially below the more than $533 per day figure estimated for the North
Texas Super Bowl or the $497 at the Houston Final Four. Finally, it is assumed fans at hotels
and eating establishments will include gratuities in their expenditures at those locations.
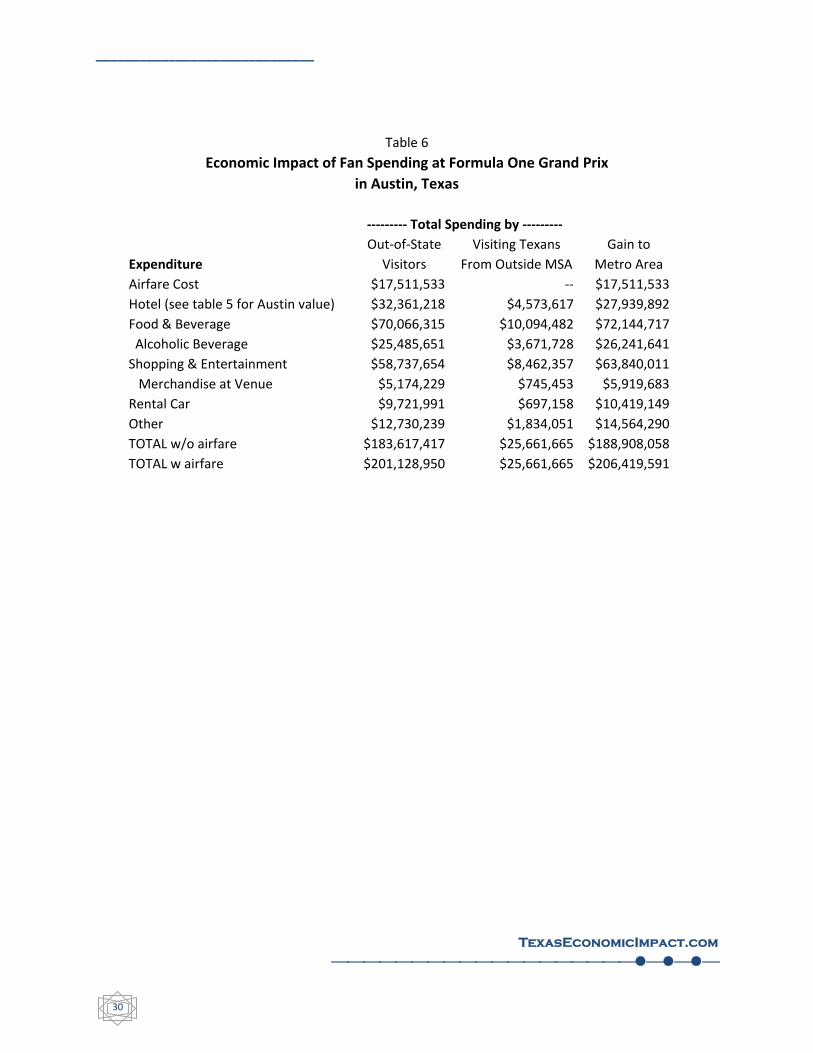
Based on the number of fans estimated in Table 2, the average length of stay of fans presented
in Table 3, pattern of stay in Table 4 and average expenditures per fan per day in Table 5, Table
6 presents the estimate of total fan spending at the Formula One Grand Prix race in Austin
Texas. Overall spending by both out‐of‐state fans and visiting Texas at the event should reach
nearly $226.8 million. The majority of these expenditures should come from out‐of‐state
visitors, accounting for $201.1 million of that total with visiting Texas accounting for another
$25.7 million. Because of capacity constraints largely due to hotel room availability, it is
estimated that the total direct gain from fan spending that will accrue to the Austin Metro
region will be $206.4 from out‐of‐state fans and visiting Texans.
______________________________
TexasEconomicImpact.com
Table 5
Expenditure Comparison of Expenditures by Out‐of‐State Visitors at Major Sporting and Visitor Events
ExPact2004 Survey (2)
2008 Men's Final Four in San
Antonio (3)
2010 NBA All Star Game
Dallas (4)
2011 Super Bowl Dallas
(5)
2011 Men's Final Four in Houston
(6)
Formula One Estimate
Non‐Texans (e)
Formula One Estimate Visiting Texans
Out‐of‐State Visitors na 45,910 64,853
85,534
77,220
94,684
15,005
Percent Arriving by Air (d) 69.6% na 72.0% 80.4% na 74.0% ‐‐
RT Airfare Cost $555.56 na na na na $500.00 ‐‐
Hotel $184.07 $209.28 $60.55 $120.31 $128.89 $106.40 $106.40
Food & Beverage $99.68 $70.85 $126.58 $185.34 $171.64 $134.55 $134.55
Alcoholic Beverage (b) na na $44.43 $67.31 $31.01 $48.94 $48.94
Shopping & Entertainment $59.78 $75.68 $95.36 $166.31 $151.20 $112.79 $112.79
Merchandise at Venue (a) na $9.66 $3.37 $5.36 $2.37 $9.94 $9.94
Rental Car $9.29 $28.28 $23.23 $43.08 $11.81 $18.67 $9.29
Other $12.58 $24.36 $29.91 $18.49 $33.50 $24.45 $24.45
TOTAL $365.40 $408.45 $380.05 $533.54 $497.03 $396.85 $387.47
In‐State Visitors:
Other Texas Visitor Expend (c) $126.65 $87.17 na na ‐‐ ‐‐
(a) Included in shopping and entertainment, but not identified separately (b) Not clearly identified separately (c) Super Bowl and NBA All‐Star had a mixture of Other Texas and Local merchandise sales which could not be made consistent with other definitions used. (d) For Super Bowl and NBA All‐Star game, assumed equal to percentage of visitor groups renting cars (e) Since reference events were held from 2008 to 2011 with studies prepared no later than 2010, the averages based on these studies
were increased 2.85% to reflect expected CPI changes from 2010 to 2012 based on Comptroller Fall 2010 forecast.
______________________________
TexasEconomicImpact.com
30
Table 6
Economic Impact of Fan Spending at Formula One Grand Prix
in Austin, Texas
‐‐‐‐‐‐‐‐‐ Total Spending by ‐‐‐‐‐‐‐‐‐
Out‐of‐State Visiting Texans Gain to
Expenditure Visitors From Outside MSA Metro Area
Airfare Cost $17,511,533 ‐‐ $17,511,533
Hotel (see table 5 for Austin value) $32,361,218 $4,573,617 $27,939,892
Food & Beverage $70,066,315 $10,094,482 $72,144,717
Alcoholic Beverage $25,485,651 $3,671,728 $26,241,641
Shopping & Entertainment $58,737,654 $8,462,357 $63,840,011
Merchandise at Venue $5,174,229 $745,453 $5,919,683
Rental Car $9,721,991 $697,158 $10,419,149
Other $12,730,239 $1,834,051 $14,564,290
TOTAL w/o airfare $183,617,417 $25,661,665 $188,908,058
TOTAL w airfare $201,128,950 $25,661,665 $206,419,591
______________________________
TexasEconomicImpact.com
31
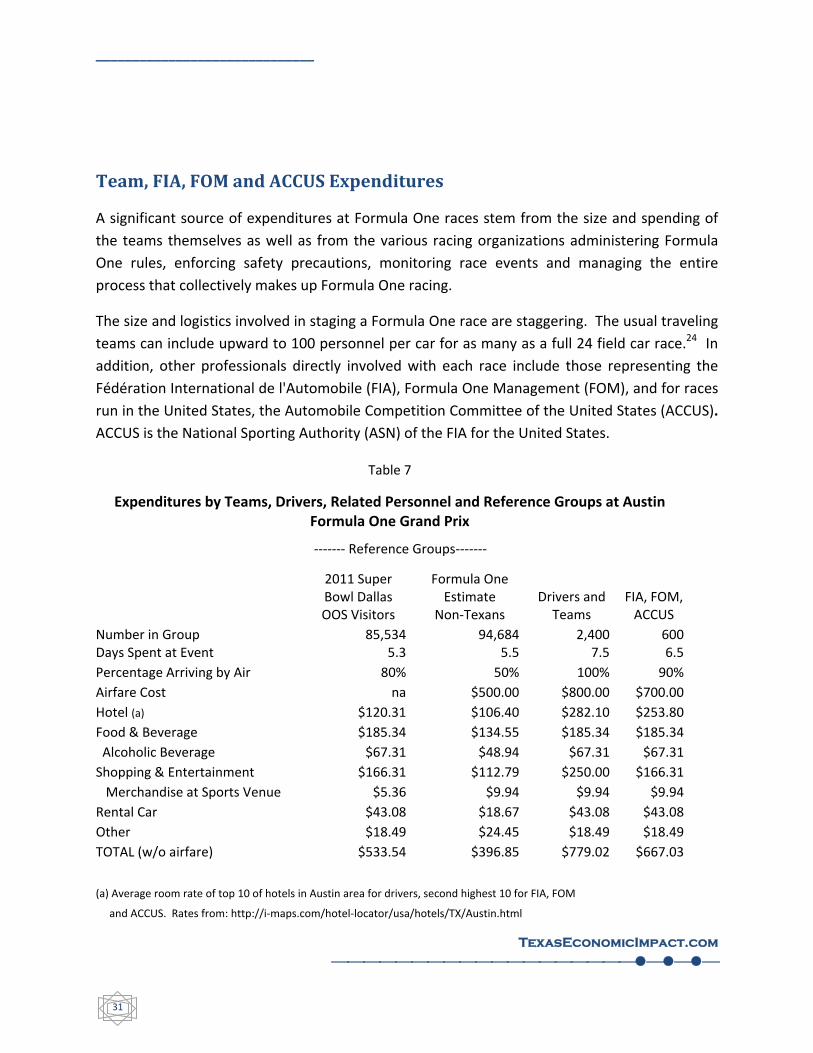
Team, FIA, FOM and ACCUS Expenditures
A significant source of expenditures at Formula One races stem from the size and spending of
the teams themselves as well as from the various racing organizations administering Formula
One rules, enforcing safety precautions, monitoring race events and managing the entire
process that collectively makes up Formula One racing.
The size and logistics involved in staging a Formula One race are staggering. The usual traveling
teams can include upward to 100 personnel per car for as many as a full 24 field car race.24 In
addition, other professionals directly involved with each race include those representing the
Fédération International de l'Automobile (FIA), Formula One Management (FOM), and for races
run in the United States, the Automobile Competition Committee of the United States (ACCUS).
ACCUS is the National Sporting Authority (ASN) of the FIA for the United States.
Table 7
Expenditures by Teams, Drivers, Related Personnel and Reference Groups at Austin Formula One Grand Prix
‐‐‐‐‐‐‐ Reference Groups‐‐‐‐‐‐‐
2011 Super Bowl Dallas OOS Visitors
Formula One Estimate
Non‐Texans Drivers and Teams
FIA, FOM, ACCUS
Number in Group 85,534 94,684 2,400 600Days Spent at Event 5.3 5.5 7.5 6.5
Percentage Arriving by Air 80% 50% 100% 90%
Airfare Cost na $500.00 $800.00 $700.00
Hotel (a) $120.31 $106.40 $282.10 $253.80
Food & Beverage $185.34 $134.55 $185.34 $185.34
Alcoholic Beverage $67.31 $48.94 $67.31 $67.31
Shopping & Entertainment $166.31 $112.79 $250.00 $166.31
Merchandise at Sports Venue $5.36 $9.94 $9.94 $9.94
Rental Car $43.08 $18.67 $43.08 $43.08
Other $18.49 $24.45 $18.49 $18.49
TOTAL (w/o airfare) $533.54 $396.85 $779.02 $667.03
(a) Average room rate of top 10 of hotels in Austin area for drivers, second highest 10 for FIA, FOM
and ACCUS. Rates from: http://i‐maps.com/hotel‐locator/usa/hotels/TX/Austin.html

______________________________
TexasEconomicImpact.com
32
Not only are the number of team members and other professionals involved in each Formula
One significant, but their spending patterns tend to be substantially above average. It is not
unusual for team members to be given per diems of upwards to $300 in addition to teams
paying for hotels, meals and incidentals. While this level of spending may seem high to some, it
constitutes only a minor part of the overall budgets for the teams. Altogether in 2006, Formula
One teams spent a mind‐boggling estimated 2.5 billion dollars.25
Table 7 presents the estimated number of drivers, team members, FIA, FOM and ACCUS staff
attending the Formula One Grand Prix in Austin along with their estimated patterns of
expenditures. For comparison, the estimated expenditure pattern for out‐of‐state attendees at
the Super Bowl and at the Formula One race is also presented. Per‐day hotel expenditure rates
reflect the current rates at the top 10 hotels in Austin for the driver and teams, and the top 20
hotels for FIA, FOM and ACCUS.
Table 8 presents these estimates on a total expenditure basis by expenditure category. In total,
drivers, teams, FIA, FOM and ACCUS personnel are expected to spend more than $17.8 million
at the U.S Grand Prix in Austin.
Table 8
Economic Impact of Driver, Team and Related Personnel at Formula One Grand Prix in Austin, Texas
‐‐‐‐‐‐ Total Spending by ‐‐‐‐‐‐
TOTAL
Expenditure Drivers and Teams
FIA, FOM, ACCUS SPENDING
Airfare Cost $960,000 $189,000 $1,149,000
Hotel $5,077,800 $989,820 $6,067,620
Food & Beverage $3,336,141 $722,831 $4,058,972
Alcoholic Beverage $1,211,578 $262,509 $1,474,086
Shopping & Entertainment $4,500,000 $648,614 $5,148,614
Merchandise at Venue $165,215 $35,797 $201,011
Rental Car $775,493 $168,023 $943,516
Other $332,844 $72,116 $404,960
TOTAL (w/o airfare) $14,022,278 $2,601,404 $16,623,682
TOTAL w airfare $14,982,278 $2,790,404 $17,772,682
______________________________
TexasEconomicImpact.com
33
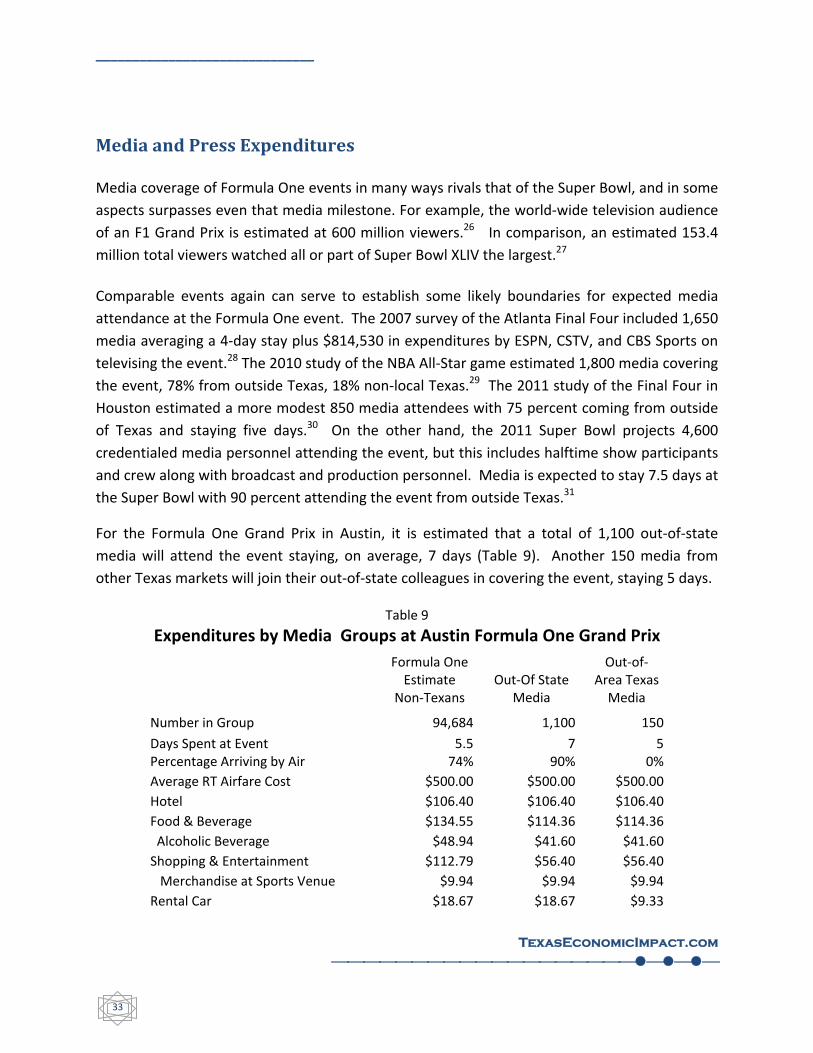
Media and Press Expenditures
Media coverage of Formula One events in many ways rivals that of the Super Bowl, and in some
aspects surpasses even that media milestone. For example, the world‐wide television audience
of an F1 Grand Prix is estimated at 600 million viewers.26 In comparison, an estimated 153.4
million total viewers watched all or part of Super Bowl XLIV the largest.27
Comparable events again can serve to establish some likely boundaries for expected media
attendance at the Formula One event. The 2007 survey of the Atlanta Final Four included 1,650
media averaging a 4‐day stay plus $814,530 in expenditures by ESPN, CSTV, and CBS Sports on
televising the event.28 The 2010 study of the NBA All‐Star game estimated 1,800 media covering
the event, 78% from outside Texas, 18% non‐local Texas.29 The 2011 study of the Final Four in
Houston estimated a more modest 850 media attendees with 75 percent coming from outside
of Texas and staying five days.30 On the other hand, the 2011 Super Bowl projects 4,600
credentialed media personnel attending the event, but this includes halftime show participants
and crew along with broadcast and production personnel. Media is expected to stay 7.5 days at
the Super Bowl with 90 percent attending the event from outside Texas.31
For the Formula One Grand Prix in Austin, it is estimated that a total of 1,100 out‐of‐state
media will attend the event staying, on average, 7 days (Table 9). Another 150 media from
other Texas markets will join their out‐of‐state colleagues in covering the event, staying 5 days.
Table 9
Expenditures by Media Groups at Austin Formula One Grand Prix
Formula One Estimate
Non‐Texans Out‐Of State
Media
Out‐of‐ Area Texas Media
Number in Group 94,684 1,100 150
Days Spent at Event 5.5 7 5Percentage Arriving by Air 74% 90% 0%
Average RT Airfare Cost $500.00 $500.00 $500.00
Hotel $106.40 $106.40 $106.40
Food & Beverage $134.55 $114.36 $114.36
Alcoholic Beverage $48.94 $41.60 $41.60
Shopping & Entertainment $112.79 $56.40 $56.40
Merchandise at Sports Venue $9.94 $9.94 $9.94
Rental Car $18.67 $18.67 $9.33
______________________________
TexasEconomicImpact.com
34
Other $24.45 $24.45 $24.45
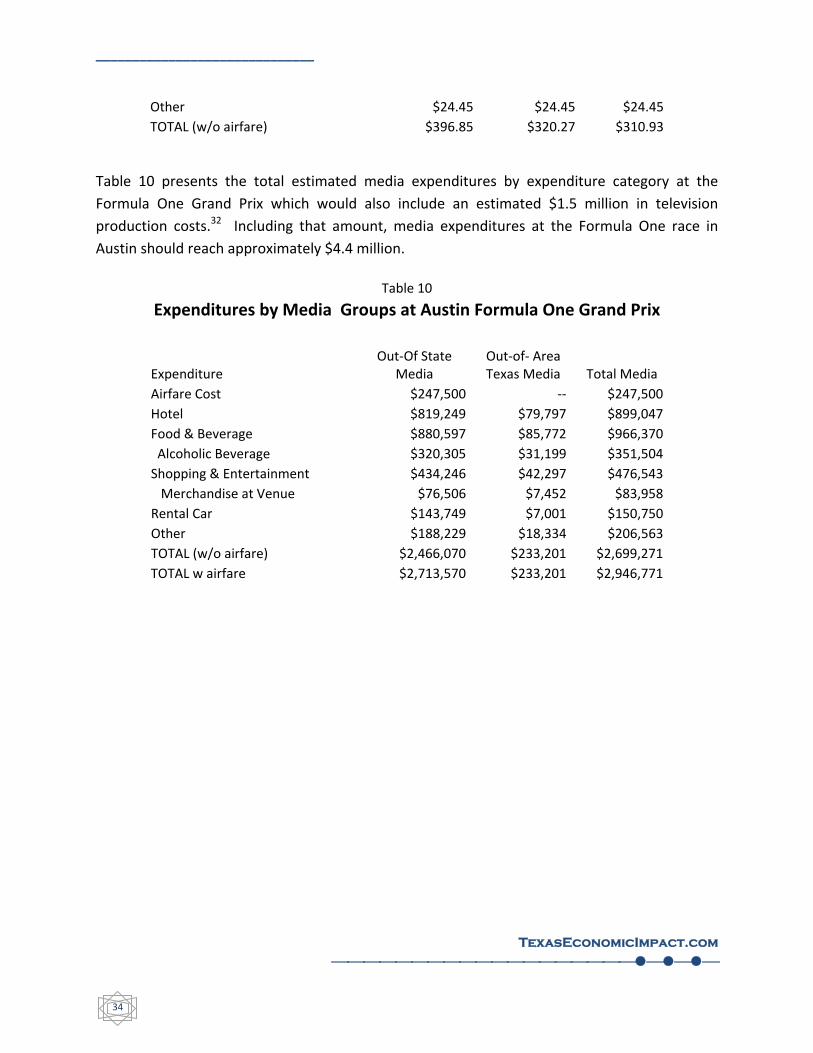
TOTAL (w/o airfare) $396.85 $320.27 $310.93
Table 10 presents the total estimated media expenditures by expenditure category at the
Formula One Grand Prix which would also include an estimated $1.5 million in television
production costs.32 Including that amount, media expenditures at the Formula One race in
Austin should reach approximately $4.4 million.
Table 10
Expenditures by Media Groups at Austin Formula One Grand Prix
Expenditure Out‐Of State
Media Out‐of‐ Area Texas Media Total Media
Airfare Cost $247,500 ‐‐ $247,500
Hotel $819,249 $79,797 $899,047
Food & Beverage $880,597 $85,772 $966,370
Alcoholic Beverage $320,305 $31,199 $351,504
Shopping & Entertainment $434,246 $42,297 $476,543
Merchandise at Venue $76,506 $7,452 $83,958
Rental Car $143,749 $7,001 $150,750
Other $188,229 $18,334 $206,563
TOTAL (w/o airfare) $2,466,070 $233,201 $2,699,271
TOTAL w airfare $2,713,570 $233,201 $2,946,771
______________________________
TexasEconomicImpact.com
35
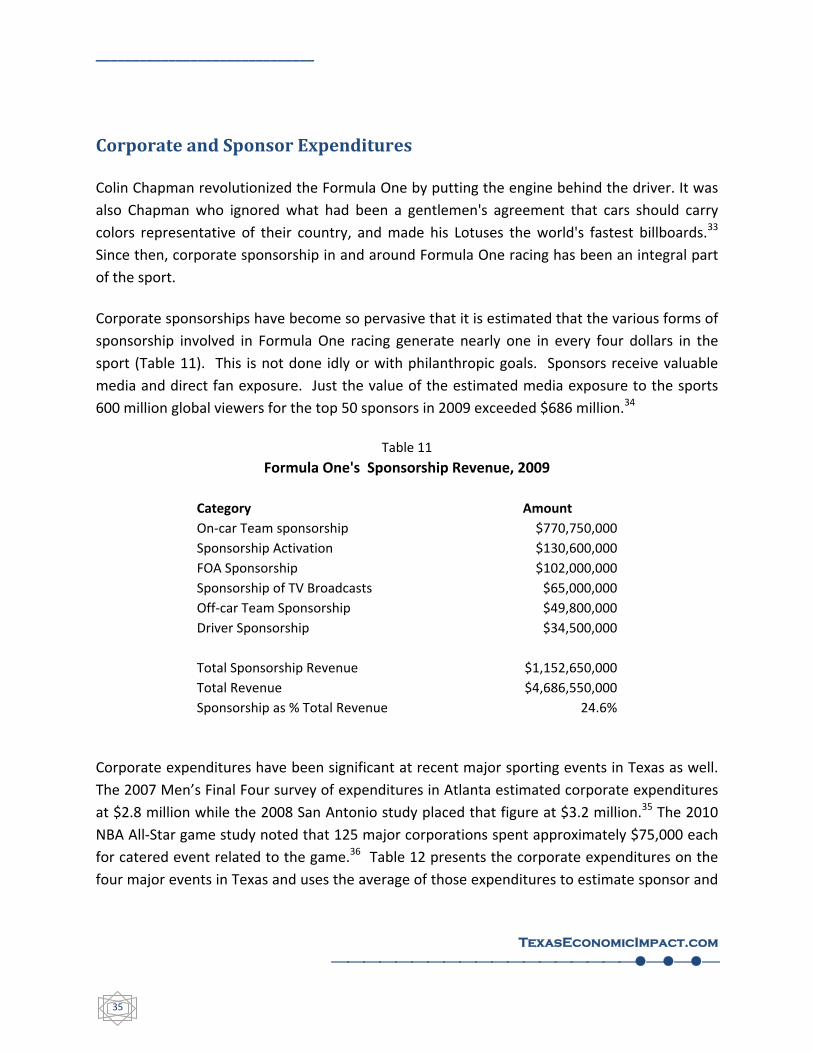
Corporate and Sponsor Expenditures
Colin Chapman revolutionized the Formula One by putting the engine behind the driver. It was
also Chapman who ignored what had been a gentlemen's agreement that cars should carry
colors representative of their country, and made his Lotuses the world's fastest billboards.33
Since then, corporate sponsorship in and around Formula One racing has been an integral part
of the sport.
Corporate sponsorships have become so pervasive that it is estimated that the various forms of
sponsorship involved in Formula One racing generate nearly one in every four dollars in the
sport (Table 11). This is not done idly or with philanthropic goals. Sponsors receive valuable
media and direct fan exposure. Just the value of the estimated media exposure to the sports
600 million global viewers for the top 50 sponsors in 2009 exceeded $686 million.34
Table 11
Formula One's Sponsorship Revenue, 2009
Category Amount
On‐car Team sponsorship $770,750,000
Sponsorship Activation $130,600,000
FOA Sponsorship $102,000,000
Sponsorship of TV Broadcasts $65,000,000
Off‐car Team Sponsorship $49,800,000
Driver Sponsorship $34,500,000
Total Sponsorship Revenue $1,152,650,000
Total Revenue $4,686,550,000
Sponsorship as % Total Revenue 24.6%
Corporate expenditures have been significant at recent major sporting events in Texas as well.
The 2007 Men’s Final Four survey of expenditures in Atlanta estimated corporate expenditures
at $2.8 million while the 2008 San Antonio study placed that figure at $3.2 million.35 The 2010
NBA All‐Star game study noted that 125 major corporations spent approximately $75,000 each
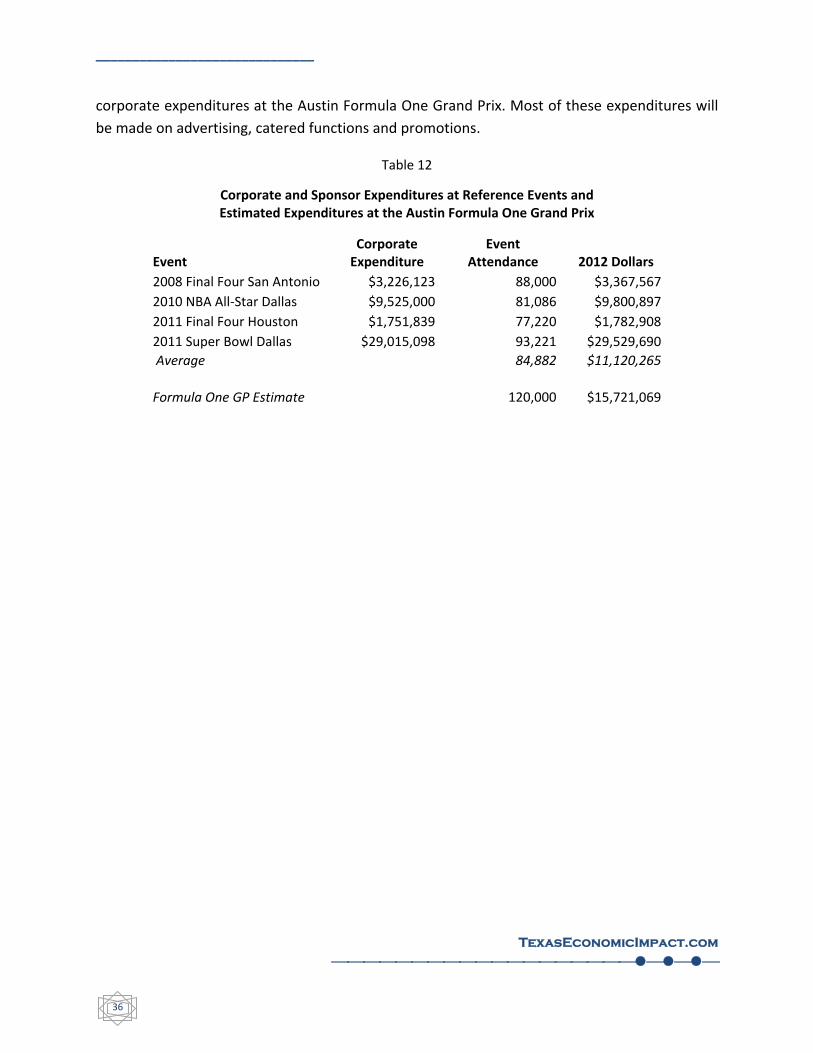
for catered event related to the game.36 Table 12 presents the corporate expenditures on the
four major events in Texas and uses the average of those expenditures to estimate sponsor and
______________________________
TexasEconomicImpact.com
36
corporate expenditures at the Austin Formula One Grand Prix. Most of these expenditures will
be made on advertising, catered functions and promotions.
Table 12
Corporate and Sponsor Expenditures at Reference Events and Estimated Expenditures at the Austin Formula One Grand Prix
Event Corporate Expenditure
Event Attendance 2012 Dollars
2008 Final Four San Antonio $3,226,123 88,000 $3,367,567
2010 NBA All‐Star Dallas $9,525,000 81,086 $9,800,897
2011 Final Four Houston $1,751,839 77,220 $1,782,908
2011 Super Bowl Dallas $29,015,098 93,221 $29,529,690
Average 84,882 $11,120,265
Formula One GP Estimate
120,000 $15,721,069
______________________________
TexasEconomicImpact.com
37
Event Costs
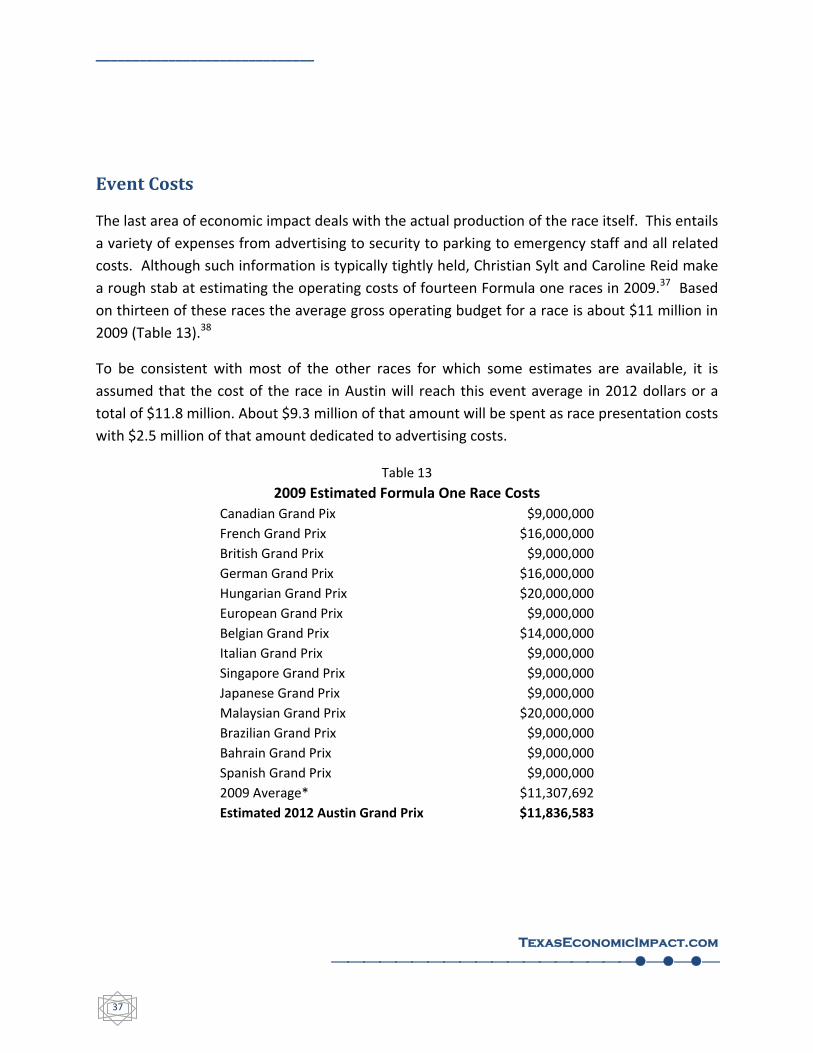
The last area of economic impact deals with the actual production of the race itself. This entails
a variety of expenses from advertising to security to parking to emergency staff and all related
costs. Although such information is typically tightly held, Christian Sylt and Caroline Reid make
a rough stab at estimating the operating costs of fourteen Formula one races in 2009.37 Based
on thirteen of these races the average gross operating budget for a race is about $11 million in
2009 (Table 13).38
To be consistent with most of the other races for which some estimates are available, it is
assumed that the cost of the race in Austin will reach this event average in 2012 dollars or a
total of $11.8 million. About $9.3 million of that amount will be spent as race presentation costs
with $2.5 million of that amount dedicated to advertising costs.
Table 13
2009 Estimated Formula One Race Costs
Canadian Grand Pix $9,000,000
French Grand Prix $16,000,000
British Grand Prix $9,000,000
German Grand Prix $16,000,000
Hungarian Grand Prix $20,000,000
European Grand Prix $9,000,000
Belgian Grand Prix $14,000,000
Italian Grand Prix $9,000,000
Singapore Grand Prix $9,000,000
Japanese Grand Prix $9,000,000
Malaysian Grand Prix $20,000,000
Brazilian Grand Prix $9,000,000
Bahrain Grand Prix $9,000,000
Spanish Grand Prix $9,000,000
2009 Average* $11,307,692
Estimated 2012 Austin Grand Prix $11,836,583
______________________________
TexasEconomicImpact.com
38
Direct Economic Gains
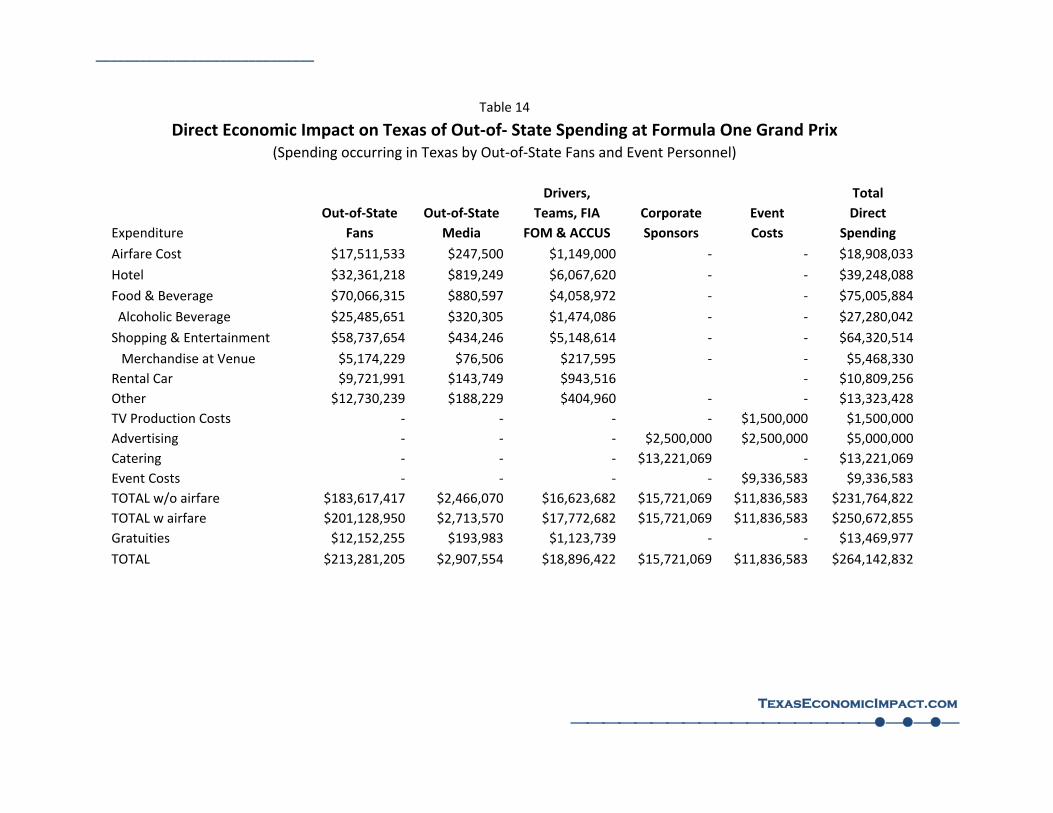
Based on the estimates contained in the previous tables, Table 14 presents the total direct
economic gain from out‐of‐state visitors to Texas for the Formula One Grand Prix race. Fans are
the biggest group contributing to this impact, accounting for $213.3 million of the total $264.1
million gain. From the perspective purely of the Austin region, the gain is a bit more based on
two opposing trends. On the one hand, some Texas fans will travel to Austin for the event that
are not counted in Table 14 since they are not from outside Texas. But, not all out‐of‐state or
Texans from outside Austin attending the event will be able or choose to stay within the greater
Austin area. Some will have to stay elsewhere taking at least part of their spending outside the
region. But, on net, adding these visiting Texans into the mix more than offsets leakage out of
the region so that the total direct economic gain to the Austin metro area is $269.5 million with
fans contributing $218.4 million of this gain (Table 15).

______________________________
TexasEconomicImpact.com
39
______________________________
TexasEconomicImpact.com
Table 14
Direct Economic Impact on Texas of Out‐of‐ State Spending at Formula One Grand Prix (Spending occurring in Texas by Out‐of‐State Fans and Event Personnel)
Drivers, Total
Out‐of‐State Out‐of‐State Teams, FIA Corporate Event Direct
Expenditure Fans Media FOM & ACCUS Sponsors Costs Spending
Airfare Cost $17,511,533 $247,500 $1,149,000 ‐ ‐ $18,908,033
Hotel $32,361,218 $819,249 $6,067,620 ‐ ‐ $39,248,088
Food & Beverage $70,066,315 $880,597 $4,058,972 ‐ ‐ $75,005,884
Alcoholic Beverage $25,485,651 $320,305 $1,474,086 ‐ ‐ $27,280,042
Shopping & Entertainment $58,737,654 $434,246 $5,148,614 ‐ ‐ $64,320,514
Merchandise at Venue $5,174,229 $76,506 $217,595 ‐ ‐ $5,468,330
Rental Car $9,721,991 $143,749 $943,516 ‐ $10,809,256
Other $12,730,239 $188,229 $404,960 ‐ ‐ $13,323,428
TV Production Costs ‐ ‐ ‐ ‐ $1,500,000 $1,500,000
Advertising ‐ ‐ ‐ $2,500,000 $2,500,000 $5,000,000
Catering ‐ ‐ ‐ $13,221,069 ‐ $13,221,069
Event Costs ‐ ‐ ‐ ‐ $9,336,583 $9,336,583
TOTAL w/o airfare $183,617,417 $2,466,070 $16,623,682 $15,721,069 $11,836,583 $231,764,822
TOTAL w airfare $201,128,950 $2,713,570 $17,772,682 $15,721,069 $11,836,583 $250,672,855
Gratuities $12,152,255 $193,983 $1,123,739 ‐ ‐ $13,469,977
TOTAL $213,281,205 $2,907,554 $18,896,422 $15,721,069 $11,836,583 $264,142,832
______________________________
TexasEconomicImpact.com
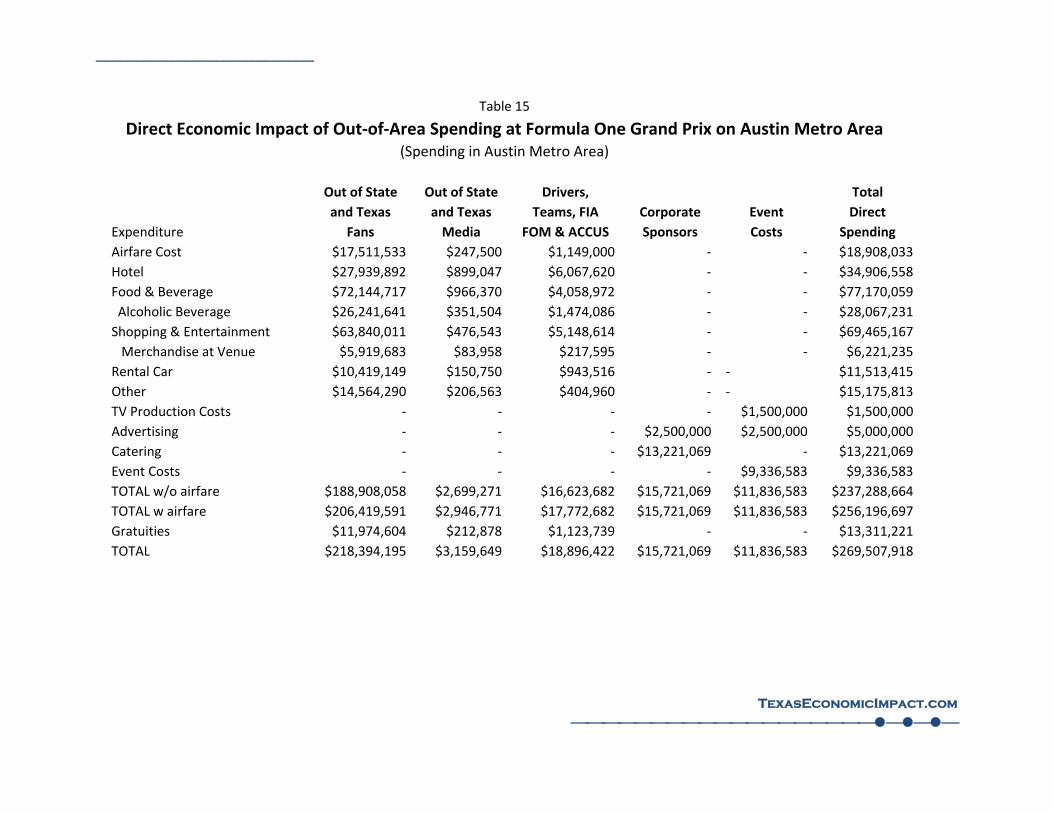
Table 15
Direct Economic Impact of Out‐of‐Area Spending at Formula One Grand Prix on Austin Metro Area (Spending in Austin Metro Area)
Out of State Out of State Drivers, Total
and Texas and Texas Teams, FIA Corporate Event Direct
Expenditure Fans Media FOM & ACCUS Sponsors Costs Spending
Airfare Cost $17,511,533 $247,500 $1,149,000 ‐ ‐ $18,908,033
Hotel $27,939,892 $899,047 $6,067,620 ‐ ‐ $34,906,558
Food & Beverage $72,144,717 $966,370 $4,058,972 ‐ ‐ $77,170,059
Alcoholic Beverage $26,241,641 $351,504 $1,474,086 ‐ ‐ $28,067,231
Shopping & Entertainment $63,840,011 $476,543 $5,148,614 ‐ ‐ $69,465,167
Merchandise at Venue $5,919,683 $83,958 $217,595 ‐ ‐ $6,221,235
Rental Car $10,419,149 $150,750 $943,516 ‐ ‐ $11,513,415
Other $14,564,290 $206,563 $404,960 ‐ ‐ $15,175,813
TV Production Costs ‐ ‐ ‐ ‐ $1,500,000 $1,500,000
Advertising ‐ ‐ ‐ $2,500,000 $2,500,000 $5,000,000
Catering ‐ ‐ ‐ $13,221,069 ‐ $13,221,069
Event Costs ‐ ‐ ‐ ‐ $9,336,583 $9,336,583
TOTAL w/o airfare $188,908,058 $2,699,271 $16,623,682 $15,721,069 $11,836,583 $237,288,664
TOTAL w airfare $206,419,591 $2,946,771 $17,772,682 $15,721,069 $11,836,583 $256,196,697
Gratuities $11,974,604 $212,878 $1,123,739 ‐ ‐ $13,311,221
TOTAL $218,394,195 $3,159,649 $18,896,422 $15,721,069 $11,836,583 $269,507,918
__________________________________________________
TexasEconomicImpact.com
42
Indirect and Induced Economic Gains
As is presented in Tables 14 and 15, the direct spending gain from hosting a Formula One Grand
Prix is substantial ranging from $264.1 million for the state primarily from just out‐of‐state
visitors to $269.5 which includes both out‐of‐staters as well as some Texans, but is limited to
just direct impacts in the Austin Metro Area.
But these direct spending gains are not the only impact which will be felt in Texas or in Austin. A
second economic gain accrues as the money spent on the direct impact is spent and re‐spent
within the economy driving further INDIRECT and INDUCED economic gains.
For example, the concrete used to build the Formula One facility is usually purchased locally so
that concrete companies employ additional workers to meet the new demand and purchase
additional sand and gravel. Workers at the concrete plant benefit as their hours are expanded
or new workers hired. Sand and gravel pits may also need to add more workers or increase
hours of existing workers. The earnings by those employees at concrete plants and sand and
gravel pits may go out to eat more often at local restaurants driving activity at those facilities or
new employees may feel secure enough to make larger purchases such as automobiles or
homes.
As the direct expenditures get spent and then re‐spent, the economy increases in size, wages
may rise and hours worked invariably increase.
In economics, flow of expenditures on goods and services are traced through input‐output
models. These models simplify and present the interdependencies between different branches
of regional economies or even between branches of different, often competing economies.
Input‐output models use a matrix representation of a nation's (or a region's) economy to
predict the effect of changes in one industry on others and by consumers, government, and
foreign suppliers on the economy. The models show how the output of one industry is an input
to each other industry. A given input is typically enumerated in the column of an industry and
its outputs are enumerated in its corresponding row. This format shows how dependent each
industry is on all others in the economy both as customer of their outputs and as supplier of
their inputs. Each column of the input‐output matrix reports the monetary value of an
industry's inputs and each row represents the value of an industry's outputs.
Turning the mathematical concept of an input‐output model into an analytical tool requires
vast data resources and consistent methods to update and manipulate that data. MIG, Inc.
(Formerly "Minnesota IMPLAN Group, Inc.") maintains IMPLAN (IMpact analysis for PLANning)
__________________________________________________
TexasEconomicImpact.com
43
data and software to create input‐output models of states, sub‐state regions and even multi‐
state regions based on county, state, zip code, and federal economic statistics. The models are
used to measure the effect on a regional or local economy of a given change or event in the
economy's activity.
While the changes in the flow of goods and services in a local economy in response to some
external shift can be very complex, the ultimate net effect of such changes can be succinctly
summarized in a “multiplier.” Multipliers are a numeric way of describing the secondary
impacts stemming from an initial change. For example, an industry‐employment multiplier of
1.8 suggests that by hiring 10 additional employees in an industry ultimately results in creating
8 additional jobs in other industries, such that 18 total jobs would be added to the given
economic region.
For a variety of purposes‐‐‐including tax revenue generation estimates‐‐‐the Texas State
Comptroller maintains an IMPLAN model for the state of Texas as well as for various regions of
the state, including the Austin Metropolitan region.39 Based on the Texas and Austin IMPLAN
models maintained by the Comptroller of Public Accounts, Table 16 presents the overall
economic impact of the Formula One race in on Texas and Table 17 presents the same analysis
for the impact on the Austin Metro Area.
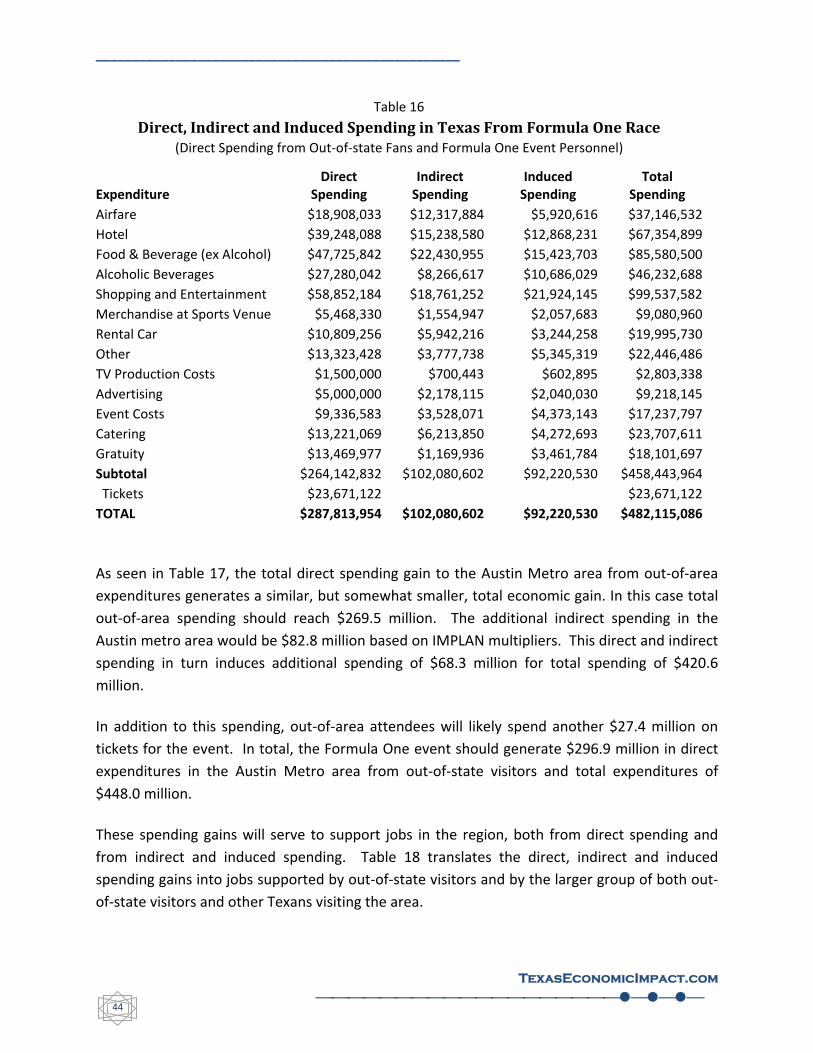
As seen in Table 16, the total direct spending gain to Texas from out‐of‐state expenditures of
$264.1 million generates additional indirect spending in Texas of $102.1 million based on
IMPLAN multipliers. This direct and indirect spending in turn induces additional spending of
$92.2 million for total spending of $458.4 million.
In addition to this spending, out‐of‐state attendees will likely spend another $23.7 million on
tickets for the event. However, because this spending will actually be used to support the
presentation of the event (including promotion and other event costs) the indirect and induced
effects of ticket expenditures are actually included in other spending categories so to include
them here as well would double count the effects of ticket expenditures.
In total, the Formula One event should generate $287.8 million in direct expenditures in Texas
from out‐of‐state visitors and total expenditures of $482.1 million.
__________________________________________________
TexasEconomicImpact.com
44
Table 16
Direct, Indirect and Induced Spending in Texas From Formula One Race (Direct Spending from Out‐of‐state Fans and Formula One Event Personnel)
Expenditure Direct
Spending Indirect Spending
Induced Spending
Total Spending
Airfare $18,908,033 $12,317,884 $5,920,616 $37,146,532
Hotel $39,248,088 $15,238,580 $12,868,231 $67,354,899
Food & Beverage (ex Alcohol) $47,725,842 $22,430,955 $15,423,703 $85,580,500
Alcoholic Beverages $27,280,042 $8,266,617 $10,686,029 $46,232,688
Shopping and Entertainment $58,852,184 $18,761,252 $21,924,145 $99,537,582
Merchandise at Sports Venue $5,468,330 $1,554,947 $2,057,683 $9,080,960
Rental Car $10,809,256 $5,942,216 $3,244,258 $19,995,730
Other $13,323,428 $3,777,738 $5,345,319 $22,446,486
TV Production Costs $1,500,000 $700,443 $602,895 $2,803,338
Advertising $5,000,000 $2,178,115 $2,040,030 $9,218,145
Event Costs $9,336,583 $3,528,071 $4,373,143 $17,237,797
Catering $13,221,069 $6,213,850 $4,272,693 $23,707,611
Gratuity $13,469,977 $1,169,936 $3,461,784 $18,101,697
Subtotal $264,142,832 $102,080,602 $92,220,530 $458,443,964
Tickets $23,671,122 $23,671,122
TOTAL $287,813,954 $102,080,602 $92,220,530 $482,115,086
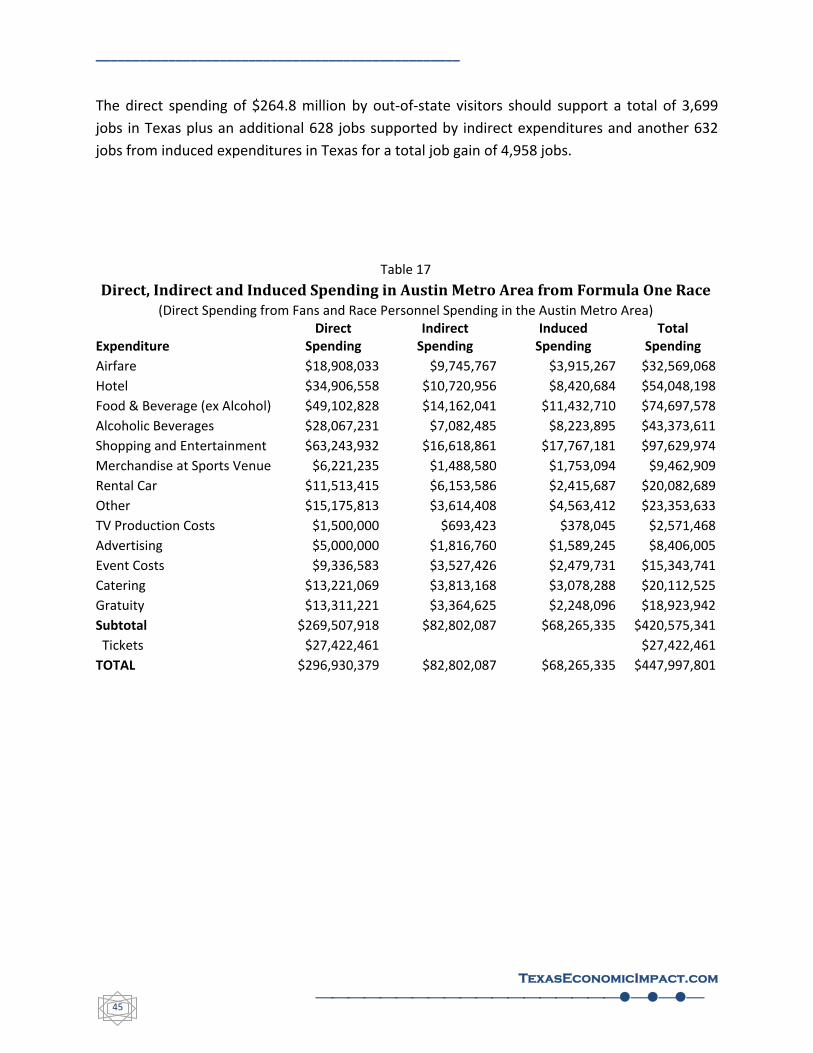
As seen in Table 17, the total direct spending gain to the Austin Metro area from out‐of‐area
expenditures generates a similar, but somewhat smaller, total economic gain. In this case total
out‐of‐area spending should reach $269.5 million. The additional indirect spending in the
Austin metro area would be $82.8 million based on IMPLAN multipliers. This direct and indirect
spending in turn induces additional spending of $68.3 million for total spending of $420.6
million.
In addition to this spending, out‐of‐area attendees will likely spend another $27.4 million on
tickets for the event. In total, the Formula One event should generate $296.9 million in direct
expenditures in the Austin Metro area from out‐of‐state visitors and total expenditures of
$448.0 million.
These spending gains will serve to support jobs in the region, both from direct spending and
from indirect and induced spending. Table 18 translates the direct, indirect and induced
spending gains into jobs supported by out‐of‐state visitors and by the larger group of both out‐
of‐state visitors and other Texans visiting the area.
__________________________________________________
TexasEconomicImpact.com
45
The direct spending of $264.8 million by out‐of‐state visitors should support a total of 3,699
jobs in Texas plus an additional 628 jobs supported by indirect expenditures and another 632
jobs from induced expenditures in Texas for a total job gain of 4,958 jobs.
Table 17
Direct, Indirect and Induced Spending in Austin Metro Area from Formula One Race (Direct Spending from Fans and Race Personnel Spending in the Austin Metro Area)
Expenditure Direct
Spending Indirect Spending
Induced Spending
Total Spending
Airfare $18,908,033 $9,745,767 $3,915,267 $32,569,068
Hotel $34,906,558 $10,720,956 $8,420,684 $54,048,198
Food & Beverage (ex Alcohol) $49,102,828 $14,162,041 $11,432,710 $74,697,578
Alcoholic Beverages $28,067,231 $7,082,485 $8,223,895 $43,373,611
Shopping and Entertainment $63,243,932 $16,618,861 $17,767,181 $97,629,974
Merchandise at Sports Venue $6,221,235 $1,488,580 $1,753,094 $9,462,909
Rental Car $11,513,415 $6,153,586 $2,415,687 $20,082,689
Other $15,175,813 $3,614,408 $4,563,412 $23,353,633
TV Production Costs $1,500,000 $693,423 $378,045 $2,571,468
Advertising $5,000,000 $1,816,760 $1,589,245 $8,406,005
Event Costs $9,336,583 $3,527,426 $2,479,731 $15,343,741
Catering $13,221,069 $3,813,168 $3,078,288 $20,112,525
Gratuity $13,311,221 $3,364,625 $2,248,096 $18,923,942
Subtotal $269,507,918 $82,802,087 $68,265,335 $420,575,341
Tickets $27,422,461 $27,422,461
TOTAL $296,930,379 $82,802,087 $68,265,335 $447,997,801
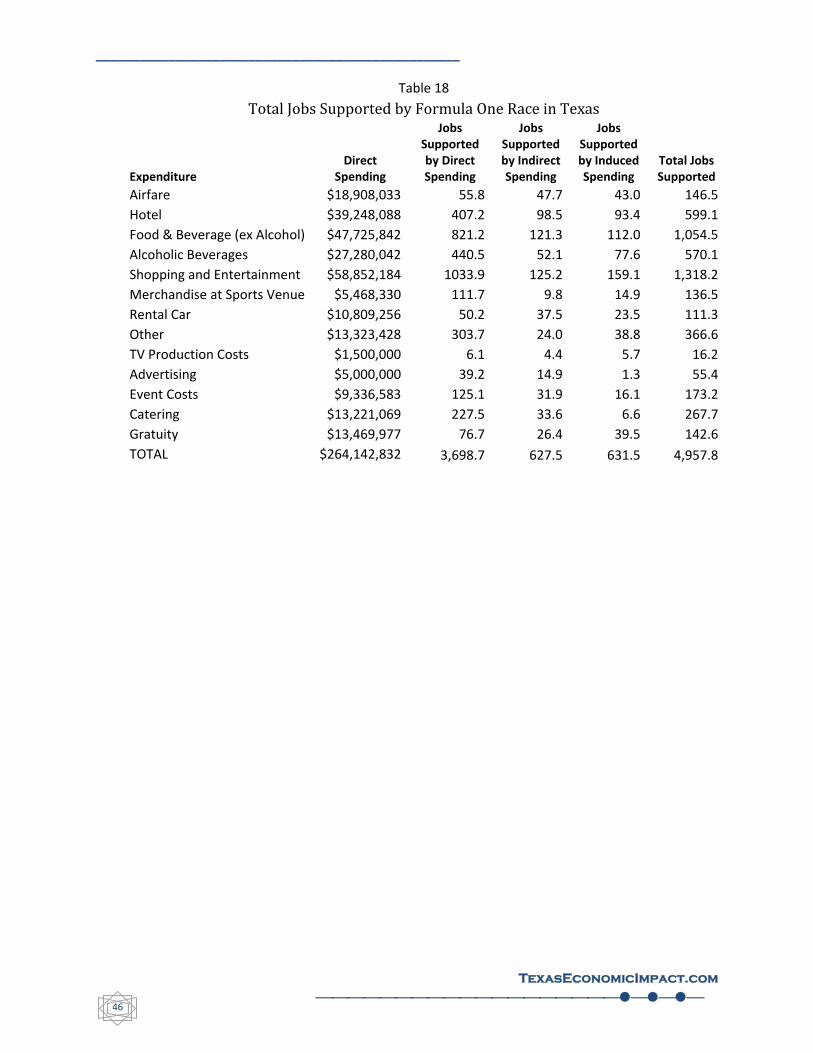
__________________________________________________
TexasEconomicImpact.com
46
Table 18
Total Jobs Supported by Formula One Race in Texas
Expenditure Direct
Spending
Jobs Supported by Direct Spending
Jobs Supported by Indirect Spending
Jobs Supported by Induced Spending
Total Jobs Supported
Airfare $18,908,033 55.8 47.7 43.0 146.5
Hotel $39,248,088 407.2 98.5 93.4 599.1
Food & Beverage (ex Alcohol) $47,725,842 821.2 121.3 112.0 1,054.5
Alcoholic Beverages $27,280,042 440.5 52.1 77.6 570.1
Shopping and Entertainment $58,852,184 1033.9 125.2 159.1 1,318.2
Merchandise at Sports Venue $5,468,330 111.7 9.8 14.9 136.5
Rental Car $10,809,256 50.2 37.5 23.5 111.3
Other $13,323,428 303.7 24.0 38.8 366.6
TV Production Costs $1,500,000 6.1 4.4 5.7 16.2
Advertising $5,000,000 39.2 14.9 1.3 55.4
Event Costs $9,336,583 125.1 31.9 16.1 173.2
Catering $13,221,069 227.5 33.6 6.6 267.7
Gratuity $13,469,977 76.7 26.4 39.5 142.6
TOTAL $264,142,832 3,698.7 627.5 631.5 4,957.8
__________________________________________________
TexasEconomicImpact.com
47
1 See Texas Comptroller of Public Accounts, “Tax Exemptions and Tax Incidence: A Report to the Legislature and the 81st Legislature,” (Austin, Texas) February 27, 2009, page 47. 2IMPLAN presents the proportion of production cost for each industry that goes to pay indirect business taxes. This is the amount that the comptroller has used to estimate the indirect tax impacts of events under the Major Events Trust Fund. The tax gain from induced effects applies a formula used by the Office of the Governor to determine the estimates sales taxes generated from consumer expenditures. This formula assumes that 80 percent of household income is used in the purchase of consumer goods and services and it is assumes that 30 percent of the consumer goods and services purchased is subject to sales taxes. These proportions are then multiplied by the state portion of the sales tax rate. 3 From Brad Spurgeon: http://formula1.about.com/od/seasonstructure/ss/f1anatomy_7.htm
4 http://www.autoracing.com/formula‐1/races/us/ 5 http://sports.espn.go.com/rpm/news/story?seriesId=6&id=2933630 6 Christian Sylt and Caroline Reid, “Formula One’s Financial Performance Guide,” published by Communications and Network Consulting, 2010. 7 See http://www.formula1.com/news/headlines/2010/10/11435.html and http://www.grandprixcities.com/raceattendances.html 8 The 120,000 figure is in‐line with ongoing traffic studies of the site while the higher 125,000 figure reflects possible addition of new satellite parking facilities near the site but away from heavily travelled access routes. 9 This pattern of arrivals is consistent with the data on the pattern of attendees at other F1 events, considering that many arrivals for the race with tickets to the race preliminaries may not actually go to the track. See, for example, the attendance at the Korean Grand Prix (http://www.formula1.com/news/headlines/2010/10/11435.html).
Because of multi‐day tickets and limited availability of hotel facilities, it is believed that while peak attendance at the race facility will not be reached until Sunday, arrivals in Austin will occur sooner as fans spend time at other area attractions.
10 http://www.i‐maps.com/hotel‐locator/usa/hotels/TX/Austin.html lists average and peak rates for 106 Austin region hotels. The Texas Comptroller’s hotel tax allocations records allows matching of 103 of these facilities with room counts so that a weighted‐average room rate can be calculated. Adjusting this rate to 2012 prices indicates a weighted average peak room rate of $221 per night (including tax), which is the average rate used in Table 4. For comparison purposes this rate is converted to a per person‐per night rate in Table 5. 11 Richard Irwin and Dan Rascher, 2008 NCAA Men’s Final Four: A Forecast of Economic and Fiscal Impact, (San Antonio Sports Foundation, San Antonio Texas), October 18, 2007. 12 Marketing Information Masters, Revenue and Tax Estimates Regarding the National Basketball Association’s 2010 All‐Stae Event: Estimates for the State of Texas and Local Market Area Cities and Counties, (All Star North Texas Basketball Local Organizing Committee, Inc., Dallas, Texas), September 1, 2009.

__________________________________________________
TexasEconomicImpact.com
48
13 Marketing Information Masters, Inc., Revenue and Tax Estimates Regarding the National Football Leagues’ Super Bowl XLV in 2011: Estimates for the State of Texas, and Market Area Cities and Counties, (North Texas Super Bowl XLV Host, Committee, Inc. Dallas Texas), February 3, 2010. 14 Marketing Information Masters, Inc. Revenue and Tax Estimates Regarding the 2011 NCAA Division I Men’s Basketball Final Four, (Houston NCAA Final Four Organizing Committee, Inc, Houston, Texas), April 28, 2010. 15 ExPact2004, Convention Expenditure and Impact Study, (International Association of Convention and Visitors Bureaus, Washington, D.C), February 2005. 16 2011 Houston Final Four Report, page 13. 17 2011 Super Bowl Study, pages 19 – 21. 18 2008 Men’s Final four in San Antonio, page 7 – 8 and page 14. 19 2008 Men’s Final four in San Antonio, page 8 and page 19. 20 2010 NBA All Star Study, page 21. 21 ExPact2004, page 3. 22 Although it is a little unusual, all figures‐‐‐including hotel expenditures‐‐‐are presented on a per person per day basis. More usual is to present hotel expenditures on a per person per night basis. 23 The ExPact Survey did not explicitly look at Texans spending on on‐state conventions but did look at expenditures by “local attendees” at these events as distinct from other visitors. 24 http://www.formula1.com/inside_f1/understanding_the_sport/5297.html 25 http://web.archive.org/web/20080209182616/http://www.f1i.com/content/view/4377/0/ 26 http://www.paddocktalk.com/news/html/modules.php?op=modload&name=News&file=article&sid=100719
also at "Formula 1's Global TV Audience Expands". paddocktalk.com/Global Broadcast Report. 27 http://tvbythenumbers.zap2it.com/2010/02/09/cbss‐super‐sunday‐super‐week/41551 28 2008 Men’s Final Four Study, page 21. 29 2010 Study of NBA All‐Star game, pages 6 and 21. 30 2011 Final Four Houston Study, page 15. 31 2011 Super Bowl Study, pages 6, 20 and 23. 32 This estimate of the costs of producing the television programming for the Formula One race was
provided by Carol Pirie, Deputy Director, Texas Film Commission in an e-mail on November 8, 2010.
33 http://articles.sun‐sentinel.com/1998‐03‐06/news/9803050488_1_f1‐team‐lotus‐alex‐zanardi
__________________________________________________
TexasEconomicImpact.com
49
34 Christian Sylt and Caroline Reid, “Formula One’s Financial Performance Guide,” pages 39 and 139‐140. 35 2008 San Antonio Final Four Study, page 19. 36 2010 NBA All Star study, page 28. 37 Christian Sylt and Caroline Reid, “Formula One’s Financial Performance Guide.” Section 6: Races. 38 Since the Hungarian Grand Prix is the only event held at that facility the entire year, higher operating costs incurred to pay for the facility with only one annual event‐‐‐a practice not used in any of the other facilities. This makes the Hungarian experience somewhat of an anomaly and it was not included in the overall average. 39 In a series of e‐mails from May 1, 2011 to May 24, 2011 Jojo Estrada at the Texas Comptroller of Public Accounts graciously and patiently provided statewide and some local output and job multipliers from the Comptroller’s IMPLAN model based on the industry expenditures considered in this analysis. His help in doing this is acknowledged and greatly appreciated.