Embed Size (px)
Citation preview

MAJOR TRAUMA AUDITNational Report 2016
Major Trauma AuditNCEC National Clinical Audit No. 1

Dominika BatorovaData AnalystHealthcare Outcomes Research Centre, RCSI
Louise BrentNational Major Trauma Audit CoordinatorNational Office of Clinical Audit
Aisling ConnollyCommunications & Events LeadNational Office of Clinical Audit
Marina CroninHead of Quality & DevelopmentNational Office of Clinical Audit
Dr Conor DeasyClinical LeadMajor Trauma Audit
Dr Rachael DoyleConsultant GeriatricianSt Vincent’s University Hospital
Fionnola KellyBiostatisticianNational Office of Clinical Audit
Tom LawrenceRegistry ManagerThe Trauma Audit & Research Network
Professor Jan SorensenDirectorHealthcare Outcomes Research Centre, RCSI
Mike YoungSystem AnalystThe Trauma Audit & Research Network
REPORT PREPARED WITH ASSISTANCE FROM MEMBERS OF THE MTA GOVERNANCE COMMITTEE
NATIONAL OFFICE OF CLINICAL AuDIT (NOCA)
NOCA was established in 2012 to create sustainable clinical audit programmes at national level. NOCA is funded by the Health Service Executive Quality Improvement Division and operationally supported by the Royal College of Surgeons in Ireland.
The National Clinical Effectiveness Committee (NCEC, 2015, p.2) defines national clinical audit as “a cyclical process that aims to improve patient care and outcomes by systematic, structured review and evaluation of clinical care against explicit clinical standards on a national basis”. NOCA supports hospitals to learn from their audit cycles.
Electronic copies of this report can be found at: https://www.noca.ie/publicationsBrief extracts from this publication may be reproduced provided the source is fully acknowledged.
Citation for this report:National Office of Clinical Audit, (2018)Major Trauma Audit National Report 2016. Dublin: National Office of Clinical Audit.
ISSN 2009-9673 (Print) ISSN 2009-9681 (Electronic)
This report was published on 31st January 2018.
National Office of Clinical Audit, 2nd Floor, Ardilaun House, 111 St Stephen’s Green, Dublin 2
Tel: + (353) 1 402 8577Email: [email protected]
DESIGNED By For more information about this report, contact:
ACKNOWLEDGING SIGNIFICANT CONTRIBuTIONS FROM THE FOLLOWING:
NOCA has engaged the internationally recognised Trauma Audit and Research Network (TARN) to provide its methodological approach for MTA in Ireland. TARN has been in operation in the UK since the 1990s and has been at the forefront of quality and research initiatives in trauma care. It is the largest trauma registry in Europe and is clinically led, academic and independent.
TARN use a standardised dataset for trauma patients, allowing review of care at both organisational and national level, thereby assuring the quality of and ultimately improving trauma care.
The Quality Improvement Division (QID) was established to support the development of a culture that ensures improvement of quality of care is at the heart of all services that the HSE delivers. HSE QID works in partnership with patients, families and all who work in the health system to innovate and improve the quality and safety of its care.
ACKNOWLEDGMENTS
NOCA would like to acknowledge the valuable contribution of all participating hospitals, as well as the MTA data coordinators and clinical leads. Without their continued support and input, this audit could not continue to produce meaningful analysis of trauma care in Ireland.
NATIONAL CLINICAL EFFECTIVENESS COMMITTEE (NCEC)
The National Clinical Effectiveness Committee (NCEC) is a Ministerial committee of key stakeholders in patient safety and clinical effectiveness. Its mission is to provide a framework for endorsement of guidelines and audit to optimise patient and service user care. The NCEC’s remit is to establish and implement processes for the prioritisation and quality assurance of clinical guidelines and clinical audit and subsequently recommend them to the Minister for Health for endorsement and mandating for national implementation. Major Trauma Audit
NCEC National Clinical Audit No. 1
NOCA would like to thank Mr Kieran Minihane; Mrs Aoife Minihane; RCSI; The National Ambulance Service; The National Emergency Medicine Programme; Cavan General Hospital; Cork University Hospital; Mater Misericordiae University Hospital and St James’s Hospital for supplying imagery used throughout this report.
Quality Improvement Division

Major Trauma AuditNational Report
2016

Major Trauma Audit National Report 2016
Dear Dr Deasy,
Many thanks for your presentation of the 2016 Major Trauma Audit National Report to the Board in November, and the follow up final report, which on behalf of the Board, I am pleased to endorse.
On behalf of the Board I commend you and your colleagues for the significantly improved data capture in 2016 and, in particular the confirmation of the high quality of the data entered at 96%.
I welcome the quality improvement initiatives based on the Major Trauma Audit National Report at a local level in several hospitals documented in the report.
We look forward to continued quality improvement initiatives by you and your colleagues to effect improvement in trauma care, benchmarked within the wider TARN network.
Congratulations and well done.
yours sincerely,
Professor Conor O’ Keane FFPath FRCPIChairNational Office of Clinical Audit Governance Board
Dr Conor DeasyClinical LeadMajor Trauma AuditNational Office of Clinical Audit2nd Floor, Ardilaun House111 St. Stephen’s GreenDublin 2
8th December 2017
National Office of Clinical Audit, 2nd Floor, Ardilaun House, 111 St Stephen’s Green, Dublin 2 Tel: + (353) 1 402 8577

MAJOR TRAuMA AuDIT NATIONAL REPORT 2016 05
This is the second national report for the Major Trauma Audit (MTA) and the first that includes data from 26 trauma-receiving hospitals. The MTA describes the care and clinical outcomes of patients who experience major trauma in Ireland. It focuses on data collected in 2016 for 4,426 patients. It is aimed at clinicians and healthcare staff who are delivering care and who are interested in improving the standard of trauma care. It will also be of interest to hospitals and Hospital Group Chief Executive Officers and Managers, Clinical Directors, Quality and Safety Managers, those commissioning trauma services, and to patient groups. This report summarises clinical findings at national level as well as patient outcomes.
The Major Trauma Audit National Report 2014-2015 highlighted that 40% of major trauma patients were aged 65 years and older and the most common cause of major trauma was falls from less than two metres, i.e. ‘low falls’ (NOCA, 2016). This report places a specific focus on age and how it relates to the incidence, processes and outcomes in trauma care. The age structure of the Irish population is changing; the Central Statistics Office (CSO) (2016) shows that the population aged 65 years and older has increased by 19.1% since 2011. This rise is expected to continue. By 2030, it is expected that there will be a 100% increase in those aged 85 years and over (WHO, 2011). Analysis suggests that if the current trends persist, people aged 75 years and over will make up the largest single group of patients with major trauma (Kehoe et al., 2015).
We need to celebrate our older population and prepare for the impact and challenges the changing age demographic will have on our healthcare services. Significant challenges exist in our current healthcare services and the ultimate goal of the MTA is to improve processes and outcomes for all patients. Improvements in outcomes from major trauma care may be expected if we develop a healthcare system that is configured to bring the right patient to the right hospital for the right treatment at the right time. Given that we have a large proportion of older people in the population, we must ensure that our health service is age attuned to meet older patients’ needs.
Last year’s report highlighted the large number (30%) of patients who attended hospitals that were unable to provide the necessary and appropriate care necessitating subsequent transfer for definitive treatment (NOCA, 2016). Strategic planning of a national trauma system is currently a priority for the Department of Health. This is welcomed by the National Office of Clinical Audit (NOCA) Major Trauma Audit Governance Committee which will help provide data to inform strategy and monitor outcomes.
We would like to take this opportunity to acknowledge all those involved in the provision of major trauma services in Ireland. We also wish to thank the Major Trauma Audit Clinical Leads and Data Coordinators, whose dedication and commitment is essential in driving quality assurance and improvement in the provision of trauma care in Ireland.
PREFACE
Dr Rachael DoyleConsultant GeriatricianSt. Vincent’s University Hospital and St. Columcille’s HospitalNational Clinical Programme for Older People
Dr Conor DeasyClinical LeadMajor Trauma Audit National Office of Clinical Audit

NOCA NATIONAL OFFICE OF CLINICAL AUDIT06
CONTENTS
0102
03
04
05
06
EXECuTIVE SuMMARY 10KEY FINDINGS 11REPORT HIGHLIGHTS 2016 12INTRODuCTION 17PATIENT STORY 18WHO IS THIS REPORT AIMED AT? 19HOSPITALS WE WORK WITH 20KEY RECOMMENDATIONS 22 CHAPTER 1: MTA METHODOLOGY 23 CHAPTER 2: DATA QuALITY 27Data for this MTA report 28
Quality assurance 28
Data completeness 28
Data accreditation by hospital 29
Data maturity 30
CHAPTER 3: WHO WAS INJuRED AND HOW WERE THEY INJuRED? 31Gender and age band 32
Pre-existing medical conditions 34
Mechanism of injury 35
Injuries sustained 36
Injury severity score 37
Place of injury 39
Type of road trauma 41
Injuries sustained at home 43
Head injuries 47
CHAPTER 4: THE PATIENT JOuRNEY 51Mode of arrival to hospital 52
Most senior pre-hospital healthcare professional 53
Transfer of patients 53
Traumatic Brain Injury (TBI) and admissions to a neurosurgical unit 54
CHAPTER 5: CARE OF MAJOR TRAuMA PATIENTS IN THE ACuTE HOSPITAL SERVICE 55Presentation by time of day 56
Pre-alert 57
Reception by a trauma team 58
Surgery 61
Hospital systems performance 63
CHAPTER 6: OuTCOMES FOLLOWING MAJOR TRAuMA 69Mortality 70
Glasgow Outcome Scale at discharge 75
Discharge destination after benchmarking 77
Risk-adjusted benchmarking: case mix standardised rate of survival for Ireland 2016 78
MAJOR TRAuMA AuDIT NATIONAL REPORT 2016 07
CHAPTER 7: MAJOR TRAuMA IN OLDER PEOPLE 81 CHAPTER 8: MTA QuALITY IMPROVEMENT INITIATIVES 87Cavan General Hospital 88
Cork University Hospital 88
Mater Misericordiae University Hospital 89
St James’s Hospital 90
REFERENCES 91 APPENDICES 95APPENDIX 1: INCLUSION CRITERIA 96
APPENDIX 2: GLOSSARy 100
APPENDIX 3: MTA GOVERNANCE COMMITTEE 102
APPENDIX 4: FREQUENCy TABLES 103
APPENDIX 5: MEDIAN TIME TO SURGERy By BODy REGION AND AGE BAND 118
0708

NOCA NATIONAL OFFICE OF CLINICAL AUDIT08
FIGURES
FIGuRE 1: Data completeness percentages per hospital 29
FIGuRE 2: Data accreditation percentages per hospital 29
FIGuRE 3: Data accreditation by key data fields 30
FIGuRE 4: Gender breakdown of major trauma patients (N=4,426) 32
FIGuRE 5: Gender breakdown of major trauma patients by age band (N=4,426) 33
FIGuRE 6: Charlson Comorbidity Index scores of major trauma patients (N=4,426) 34
FIGuRE 6A: Comorbidity of major trauma patients by age band (n=4,400) 34
FIGuRE 7: Mechanism of injury (N=4,426) 35
FIGuRE 7A: Mechanism of injury by age band (N=4,426) 35
FIGuRE 8: Injuries sustained by body region (N=6,524) 36
FIGuRE 9: Injury Severity Score (ISS) (N=4,426) 38
FIGuRE 9A: Injury Severity Score (ISS) by age band (N=4,426) 38
FIGuRE 10: Place of injury (N=4,426) 39
FIGuRE 10A: Place of injury by age band (N=4,426) 40
FIGuRE 10B: Place of injury by Injury Severity Score (ISS) group (n=4,204) 40
FIGuRE 11: Type of road trauma (n=807) 41
FIGuRE 11A: Position in vehicle of those involved in car accidents (n=407) 42
FIGuRE 11B: Type of road trauma by Injury Severity Score (ISS) group (n=797) 42
FIGuRE 12: Injuries at home by gender (n=2,077) 43
FIGuRE 12A: Injuries at home by gender and age band (n=2,077) 43
FIGuRE 12B: Injuries at home by mechanism of injury (n=2,077) 44
FIGuRE 13: Injuries at home by Charlson Comorbidity Index score (n=2,077) 44
FIGuRE 13A: Injuries at home by Charlson Comorbidity Index score and age band (n=2,068) 45
FIGuRE 14: Injuries sustained at home by Injury Severity Score (n=2,077) 45
FIGuRE 14A: Injuries sustained at home by Injury Severity Score and age band (n=2,077) 46
FIGuRE 15: Injuries at home by mortality (n=2,077) 46
FIGuRE 16: Head injury severity (AIS 3+) (n=1,000) 48
FIGuRE 16A: Head injury severity by age band and GCS (n=1,000) 48
FIGuRE 16B: Cause of injury in patients with severe Traumatic Brain Injury totals (n=155) 49
FIGuRE 16C: Cause of injury in patients with severe Traumatic Brain Injury by age band (n=155) 49
FIGuRE 17: Mode of arrival to hospital (n=3,194) 52
FIGuRE 18: Most senior pre-hospital healthcare professional (n=2,317) 53
FIGuRE 19: Patients transferred to another hospital (N=4,426) 53
FIGuRE 20: Care pathway of patients with TBI (n=1,000) 54
FIGuRE 20A: Severe TBI and admissions to a neurosurgical unit (n=155) 54
FIGuRE 21: Presentation by time of day (n=4,409) 56
FIGuRE 22: Pre-alerted by age band (n=207) 57
FIGuRE 23: Reception by a trauma team by age band (n=271) 58
FIGuRE 24: Grade of most senior doctor treating patient on arrival, by age band (n=3,194) 60
FIGuRE 25: Surgical intervention by body region (n=1,219) 61
FIGuRE 26: Median time (in hours) to surgery for patients having surgical intervention, by body area (n=1,195) 61
FIGuRE 27: Percentage of surgery within 24, 48 and 72 hours (n=1,195) 62

MAJOR TRAuMA AuDIT NATIONAL REPORT 2016 09
FIGuRE 28: Airway management of patients with Glasgow Coma Scale (GCS) <9 (n=130) 63
FIGuRE 29: Survival of shocked patients (n=285) 64
FIGuRE 30: Time to CT scan within one hour (n=251) 65
FIGuRE 31: Hospital length of stay by age band (N=4,426) 67
FIGuRE 32: Mortality by age band (n=193) 70
FIGuRE 33: Mortality by gender and age band (n=193) 71
FIGuRE 34: Mortality by mechanism of injury (n=193) 72
FIGuRE 34A: Mortality by mechanism of injury, by age band (n=193) 72
FIGuRE 35: Mortality by ISS category (n=193) 73
FIGuRE 36: Major trauma deaths by body area injured, by age band (n=193) 74
FIGuRE 37: Glasgow Outcome Scale by age band (N=4,426) 75
FIGuRE 37A: Glasgow Outcome Scale in patients with head injury by age band (n=1,161) 76
FIGuRE 37B: Glasgow Outcome Scale in patients with ISS>15 by age band (n=1,374) 76
FIGuRE 38: Discharge destination (N=4,426) 77
FIGuRE 38A: Discharge destination by age band (n=4,413) 77
FIGuRE 39: Irish hospital Ws scores, 2016 79
FIGuRE 40: Population pyramid for Ireland (Census 2006 versus 2016) 82
FIGuRE 41: Projected population change in Ireland 2016-2046 83
FIGuRE 42: Trauma injuries inclusion criteria 89
TABLESTABLE 1: MTA Clinical Leads and Data Coordinators 2016-2017 21
TABLE 2: Data analysis for MTA Report 2016 28
TABLE 3: Number of injuries sustained per patient 36
TABLE 4: ISS classification 37
TABLE 5: Reception by a trauma team 59
TABLE 6: Most senior doctor seeing the patient in the ED and those with ISS>15 60
TABLE 7: ICU Length of Stay (LOS) 66
TABLE 8: Length of Stay (LOS) for major trauma patients 67
TABLE 9: Probability of survival (PS) 78
TABLE 10: Median time to surgery by body region and age band 118

The National Office of Clinical Audit (NOCA) established the Major Trauma Audit (MTA) in 2013. This audit focuses on the care of the more severely injured trauma patients in our healthcare system. The Trauma Audit and Research Network (TARN) provides the methodological approach for the MTA in Ireland and all 26 eligible hospitals now submit data to the MTA.
In 2016, the MTA became the first national clinical audit endorsed by the National Clinical Effectiveness Committee (NCEC) and mandated by the Minister for Health. This second report presents findings on 2016 data.
PROGRESS SINCE THE LAST REPORT
In the previous report, it was recommended that a standardised document be developed for the reception of trauma patients by the multidisciplinary team. This work is ongoing and is discussed in Chapter 8.
Following the findings in the previous report regarding the proportion of older major trauma patients, NOCA engaged with the National Clinical Programme for Older Persons and sought a geriatrician representative for the MTA Governance Committee. This report focuses on major trauma across different age bands, with Chapter 7 focusing on the care of older major trauma patients.
Last year’s report identified that the most common mechanism of injury was ‘low falls’; NOCA is working with the HSE to provide data and support for the prevention and management of ‘low falls’.
Pre-hospital care data capture is evolving and moving to an electronic platform; it is anticipated that this will make pre-hospital data provision to the MTA more accessible.
THE VISION FOR MAJOR TRAuMA AuDIT
The MTA is a fundamental building block of any trauma system. MTA is now a well-established robust national clinical audit and as such is in a good position to measure the quality of care provided to patients sustaining major trauma in Ireland. This audit will continue to be a key source of data for the HSE and National Clinical Programmes to monitor changes in processes and outcomes associated with the development of major trauma networks. Work has commenced to include patient-reported outcome measures (PROMS), e.g. quality of life and functional outcomes as part of the MTA.
NOCA will continue to engage with hospitals to ensure that high-quality data are collected and appropriate supports are given for the collection of data. It will be used to drive improvements in the standard of trauma care delivery as Ireland moves to develop an integrated trauma system.
EXECUTIVE SUMMARy
NOCA NATIONAL OFFICE OF CLINICAL AUDIT10

MAJOR TRAuMA AuDIT NATIONAL REPORT 2016 11
MAJOR TRAUMA AUDIT 2016 Key FInDIngs
The median age of patients sustaining major trauma was 59 years. In the younger age categories, males were the predominant gender and in the older age bands, females were the predominant gender.
Twenty-eight per cent of patients had to be transferred to another hospital for ongoing care as their care needs could not be provided by the initial receiving hospital.
The mechanism of injury varies by age band, with road trauma and blows dominating the younger age bands and ‘low falls’ dominating the older age bands.
Advanced age correlates with higher numbers of comorbidities, making the clinical management of older major trauma patients more complex and difficult, and requiring a multidisciplinary approach.
Forty-seven per cent of major trauma occurred at home; 39% occurred in a public area and road.
Only 8% of patients were received by a trauma team on arrival to hospital.
Older patients were less likely to be pre-alerted and reviewed by a senior clinician.
Older patients are more likely to die and suffer higher levels of disability than younger major trauma patients with a similar injury severity score (ISS).
Only 62% of major trauma patients were discharged directly home. Older patients are less likely to be discharged home and more likely to be discharged to rehabilitation or long-term care compared to younger patients.
Four per cent of major trauma patients died in hospital as a result of their injuries.
The data completeness or data capture has significantly improved from 55% in 2015 to 74% in 2016 and there were nine hospitals that achieved the TARN Data Quality Standard of greater than 80% completeness.
The data accreditation for 2016 is 96%, meaning that when patients were identified for audit the relevant details were captured to an excellent standard.

NOCA NATIONAL OFFICE OF CLINICAL AUDIT12
Percentages shown are representative of the cases entered in MTA in 2016
REPORT HIGHLIGHTS 2016
COMpleTeness74% of MTA cases captured in 2016
pATIenT Age pROFIle55% of patients
were aged between 15 and 64 years
genDeR58% of patients
were male
genDeR42% of patients
were female
42%58%
55%
26 pARTICIpATIng HOspITAls
74%

MAJOR TRAuMA AuDIT NATIONAL REPORT 2016 13
REPORT HIGHLIGHTS 2016
sURgeRy69% of patients who
had surgery had surgery on a limb/s
MOsT COMMOn InJURy lOCATIOn
47% of patients sustained an injury in their own home
OUTCOMe96% of patients
survived
96%
MeDIAn lOsMedian length of stay was 9 days
9
MOsT COMMOn MeCHAnIsM
51% of patients had a ‘low fall’ of less than 2 metres
51%47% 69%

DATA QUALITy AND CLINICAL CARE 2016
NOCA NATIONAL OFFICE OF CLINICAL AUDIT14
DATA QuALITY
2016
Number of participating hospitals 26
Number of individual patients 4,426
Completeness 74%
Accreditation 96%
CLINICAL CARE
Percentage seen by an advanced paramedic* 33% n=760/2,317
Percentage seen by a consultant in the ED 22% n=706/3,194
Time to CT (hours) for head injury patients with Glasgow Coma Scale (GCS) <13 1.3 (0.9-2.3)
Median length of stay (LOS)† 9 (5-17 days)
Median Intensive Care Unit (ICU) LOS 3 (1-8 days)
Mortality 4%
*In 2016 - Number of paramedics – 2,071Number of advanced paramedics – 479 (PHECC)† LOS refers to calendar days. Median LOS for this report was calculated by:1) Summing the total length of stay for each MTA patient. For example, if a patient stayed in hospital A for two days and was then transferred to hospital B for five days, their total length of stay was calculated as seven days.2)The median LOS was then calculated from each patient’s total LOS.

“The MTA will drive quality improvement to achieve the best possible clinical outcomes for trauma patients in Ireland.”
AIM OF MAJOR TRAUMA AUDIT
• Tobenchmarktraumacarebothnationallyandinternationally.
• Topromotereflectiveclinicalpracticeandtoencouragepeerreviewat local and national level.
• Toprovidehigh-qualitydatatoenablepeer-reviewedresearch.
OBJECTIVES OF THE MAJOR TRAUMA AUDIT
MAJOR TRAuMA AuDIT NATIONAL REPORT 2016 15

NOCA NATIONAL OFFICE OF CLINICAL AUDIT16

MAJOR TRAuMA AuDIT NATIONAL REPORT 2016 17
Severely injured patients cannot select their preferred hospital. These injuries occur without warning and often far from a hospital suitable for treating such injuries. A patient’s route intothehealthcareservice isoften influencedbythe locationof thetrauma and the availability of services in that location, including the responding emergency personnel, emergency service, specialty services, critical care capacity and rehabilitation. Often, these patients require input and care from multiple specialities; Ireland does not currently have a coordinated, integrated trauma system with pre-determined, seamless patient pathways in place. No hospital in Ireland reaches major trauma centre designation criteria. Almost one in three MTA patients are transferred to another hospital to complete the treatment they require (NOCA, 2016).
The coordination and availability of the required trauma services can have an impact on the timeliness of care and intervention and therefore can determine patients’ outcomes and level of disability if they survive. To ensure that patients get the best opportunity for recovery and survival, many jurisdictions have developed an integrated trauma system. In the United Kingdom (UK) the development of trauma networks has reduced the mortality rate by 30% along with significantly improving survivors’ quality of life. To achieve this, health system resources have been strategically redistributed rather than massively increased (IAEM, 2014).
One of the key factors underpinning the success of an integrated trauma system is high-quality data to facilitate local, regional and national quality assurance and improvement initiatives. The Major Trauma Audit (MTA) in Ireland was established by NOCA in 2013. NOCA has engaged the internationally recognised TARN as the methodological approach for MTA in Ireland. Eligible trauma-receiving hospitals were identified by NOCA with the HSE National Emergency Medicine Programme. There are now 26 trauma-receiving hospitals participating in the MTA. This has been achieved since October 2013.
ABOuT THE TRAuMA AuDIT AND RESEARCH NETWORK (TARN)
TARN has been in operation in the UK since the 1980s and has been at the forefront of quality and research initiatives in trauma care. It is the largest trauma registry in Europe and is clinically led, academic and independent. TARN has been integral to the reconfiguration of trauma care delivery in England and monitors the effects of the changes implemented. TARN receives and analyses anonymised MTA submissions from participating Irish hospitals and reports back to these hospitals. This feedback from TARN and NOCA is supporting hospitals’ and clinicians’ learning and continuous improvement of care delivered to patients with major trauma.
INTRODUCTION

ROBERT*
Robert is an active 82-year-old man who was out for a walk and, as he crossed the road, he was knocked down by a vehicle and dragged some distance. An ambulance was called by passers-by and after a very short time, help arrived. Due to the nature of Robert’s injuries, an advanced paramedic (AP) was also dispatched to the scene in a rapid response vehicle.
The biggest issue facing Robert at the scene of the accident was blood loss because he was on medication to thin his blood. Both his legs were quite severely crushed. The AP and the paramedics worked hard to control the bleeding and make Robert more comfortable before he was transferred to hospital.
The hospital was notified that Robert was on his way and the trauma team was informed. Robert was assessed and treated using Advanced Trauma Life Support principles by a large team comprising emergency medicine, anaesthetic, surgical, radiology specialties, emergency nurses and radiographers. A whole-body CT scan revealed that Robert had no injuries to the head, thorax or intra-abdominal region; however, he had sustained significant damage to the skin, muscles, bones, nerves and blood vessels of his legs. He had also fractured his left forearm. In the operating theatre, skilled orthopaedic and plastic surgeons together salvaged his left leg; it was necessary to amputate his right leg below the knee. His forearm fracture was manipulated into a good position to heal and a cast was applied. After surgery, Robert was brought to the intensive care unit (ICU) as he had sustained significant blood loss which required careful monitoring.
After a period in the ICU, Robert was transferred to the orthopaedic ward. During this time, he had clinical input from surgeons, geriatricians, haematologists, rehabilitation specialists, physiotherapists, occupational therapists, social workers, nursing and care assistant staff, all supporting his rehabilitation and helping him to plan for his discharge.
COMMENT
Thanks to the competent and timely care received pre-hospital and within the emergency department (ED), Robert had the best possible outcome from a very complicated trauma. This case highlights the range of specialties required to ensure that a patient’s journey from roadside to recovery is as short as possible. Luckily, Robert got the right care at the right time; this meant he did not develop sepsis as a result of an open fracture. For example, he had safe and efficient management of his blood clotting, and he did not spend long periods of time in the acute hospital awaiting a prosthesis or for his home to undergo the necessary alterations to facilitate his safe discharge.
*Patients’ real name has not been used to maintain patient confidentiality.
PATIENT STORy
NOCA NATIONAL OFFICE OF CLINICAL AUDIT18

The work reported here is intended for the use of a wide range of individuals and organisations, including:
• Patients and carers
• Patient organisations
• Healthcare professionals
• Hospital managers
• Hospital Groups
• Policy-makers
The report has been designed in two parts:
1 The MTA National Report 2016 presents key findings on casemix, patient journey, care pathways and outcomes. This report follows the patient’s pathway from the scene of the trauma and pre-hospital care to the ED, radiology, critical care, surgery, specialty services, rehabilitation and discharge.
2 The MTA National Report 2016: Summary Report. This report highlights the main findings of the analysis of the MTA data and will be of particular interest to patients, patient organisations and the public.
WHO IS THIS REPORT AIMED AT?
MAJOR TRAuMA AuDIT NATIONAL REPORT 2016 19

NOCA NATIONAL OFFICE OF CLINICAL AUDIT20
HOSPITALS WE WORK WITHNOTE: Dublin hospitals have been displayed collectively by Hospital Group
SAOLTA uNIVERSITY HEALTH CARE GROuPLetterkenny University HospitalMayo University HospitalSligo University HospitalUniversity Hospital Galway
RCSI HOSPITALSBeaumont HospitalCavan General HospitalConnolly HospitalOur Lady of Lourdes Hospital, Drogheda
DuBLIN MIDLANDS HOSPITAL GROuPMidland Regional Hospital, TullamoreMidland Regional Hospital, PortlaoiseNaas General HospitalSt James’s Hospital, DublinTallaght Hospital (Adults)
IRELAND EAST HOSPITAL GROuPMater Misericordiae University HospitalRegional Hospital MullingarSt. Luke’s General Hospital, KilkennySt. Vincent’s University HospitalWexford General Hospital
THE CHILDREN’S HOSPITAL GROuPOur Lady’s Children’s Hospital CrumlinTallaght Hospital (Paediatrics)Temple Street Childrens University Hospital
uL HOSPITAL GROuPUniversity Hospital Limerick
SOuTH/SOuTH WEST HOSPITAL GROuPCork University HospitalMercy University HospitalSouth Tipperary General HospitalUniversity Hospital KerryUniversity Hospital Waterford

MAJOR TRAuMA AuDIT NATIONAL REPORT 2016 21
uL Hospitals Group
HOSPITAL MTA CLINICAL LEAD MTA DATA COORDINATOR
Letterkenny University Hospital Dr Sinead O’Gorman Patrick McGonagle Sarah MeagherMayo University Hospital Dr Ciara Canavan Paul Crisham Dr Andrew Jackson Dr Ann Shortt Sligo University Hospital Dr Kieran Cunningham Rosemary MaguireUniversity Hospital Galway Mr Alan Hussey Paul Crisham
Beaumont Hospital Dr Patricia Houlihan Anna Duffy Sarah ConnorCavan General Hospital Mr Ashraf Butt Eilish SweeneyConnolly Hospital Dr Emily O’Conor Therese yoreOur Lady of Lourdes Hospital, Drogheda Dr Niall O’Connor Deborah McDaniel
Midland Regional Hospital, Tullamore Dr Anna Moore Neil Perry Dr Sean O’RourkeMidland Regional Hospital, Portlaoise Dr Suvarna Maharaj Louise CookeNaas General Hospital Dr George Little Breda MurphySt James’s Hospital, Dublin Mr Niall Hogan Alison Reynolds Dr Geraldine McMahonTallaght Hospital (Adults) Dr Jean O’Sullivan Noel Redmond
Mater Misericordiae University Hospital Dr Tomás Breslin Marian Lynders Mr Seamus Morris Regional Hospital Mullingar Dr Sam Kuan Helen Evans Máire Maguire Wendy O’DohertySt. Luke’s General Hospital, Kilkenny Dr David Maritz Frances Walsh Dr Frank O’DwyerSt. Vincent’s University Hospital Dr John Cronin Jenny Beatty Sorcha Burns Brenda CormicanWexford General Hospital Dr Paul Kelly Mary Doyle Dr Michael Molloy Jennifer Power Shelagh Twomey
Our Lady’s Children’s Hospital Crumlin Dr Carol Blackburn Suzanne Byrne Mr Brian Sweeney Julie Hughes Louise PurcellTallaght Hospital (Paediatrics) Dr Ciara Martin Noel RedmondTemple Street Children’s Professor Alf Nicholson Jennifer Doyle University Hospital
University Hospital Limerick Dr Cormac Mehigan Eoin Barry Michael Fitzpatrick
Cork University Hospital Dr Sinead Ahern Karina Caine Mr James Clover Ann DeasyMercy University Hospital Dr Chris Luke Ann DeasySouth Tipperary General Hospital Mr Cyrus Mobed Susan RyanUniversity Hospital Kerry Dr Martin Boyd Esther O’Mahony Dr Niamh FeelyUniversity Hospital Waterford Dr Des Fitzgerald Margaret Mulcahy Mr Morgan McMonagle
SAOLTA uNIVERSITY HEALTH CARE GROuP
RCSI HOSPITALS
DuBLIN MIDLANDS HOSPITAL GROuP
THE CHILDREN’S HOSPITAL GROuP
IRELAND EAST HOSPITAL GROuP
uL HOSPITAL GROuP
SOuTH/SOuTH WEST HOSPITAL GROuP
TABLE 1: MTA CliniCAl leAds And dATA CoordinATors 2016-2017

NOCA NATIONAL OFFICE OF CLINICAL AUDIT22
MAJOR TRAUMA AUDIT NATIONAL REPORT 2016 Key ReCOMMenDATIOns
Reconfiguration of trauma services is required to provide timely, appropriate and optimal care to major trauma patients to ensure the right patient is brought to the right hospital for the right treatment at the right time.
A national definition and a standard on what should constitute a trauma team and activation criteria for such a team are required.
Pre-hospital carers and emergency medicine professionals should exercise a high level of suspicion of major trauma in older patients with low-energy mechanism injuries.
To support this approach to care:· Clinical assessment and triage tools should be adapted to suitably assess older patients. · Education programmes for pre-hospital carers and emergency medicine professionals
should include care for the older patient with low-energy mechanism injuries.
INFORMING TRAuMA POLICY:
MTA is an NCEC-accredited audit and the participating hospitals must support the resourcing of data collection for this audit. Data completeness of at least 80% and data accreditation of 95% are required to ensure good data quality and reporting.
NOCA will work with the Healthcare Pricing Office, TARN and hospitals to adjust the annualhospitaldenominatorstoreflectaccuratelythelevelofcompletenessofindividualhospitals’ data.
Functional and quality-of-life measures should be included in the future development of the audit.
DATA QuALITY:

CHAPTER 1MTA METHODOLOGY

NOCA NATIONAL OFFICE OF CLINICAL AUDIT24
DATA COlleCTIOn pROCess (INCLUSION CRITERIA)*
All trauma patients, irrespective of age
who fulfil one of the following length-of-stay (LOS) criteria
and whose isolated injuries meet one of the criteria identified in Appendix 1
gOVeRnAnCe sTRUCTURe
NOCA Governance Board
MTA Governance Committee
MTA Operational Team
Deaths including deaths
in emergency department, even if cause of death
is medical
Transferred out for specialist care
or repatriation (total LOS > 3days)
Transferred in for specialist care
or repatriation (total LOS >3 days)
Admitted to a critical care
area (regardless of LOS)
In hospital for >3 days
MTA METHODOLOGy
CHAPTER 1
* This report details all major trauma patients who fulfill the inclusion criteria, including those with all classifications of Injury Severity Score (ISS).
MAJOR TRAuMA AuDIT NATIONAL REPORT 2016 25
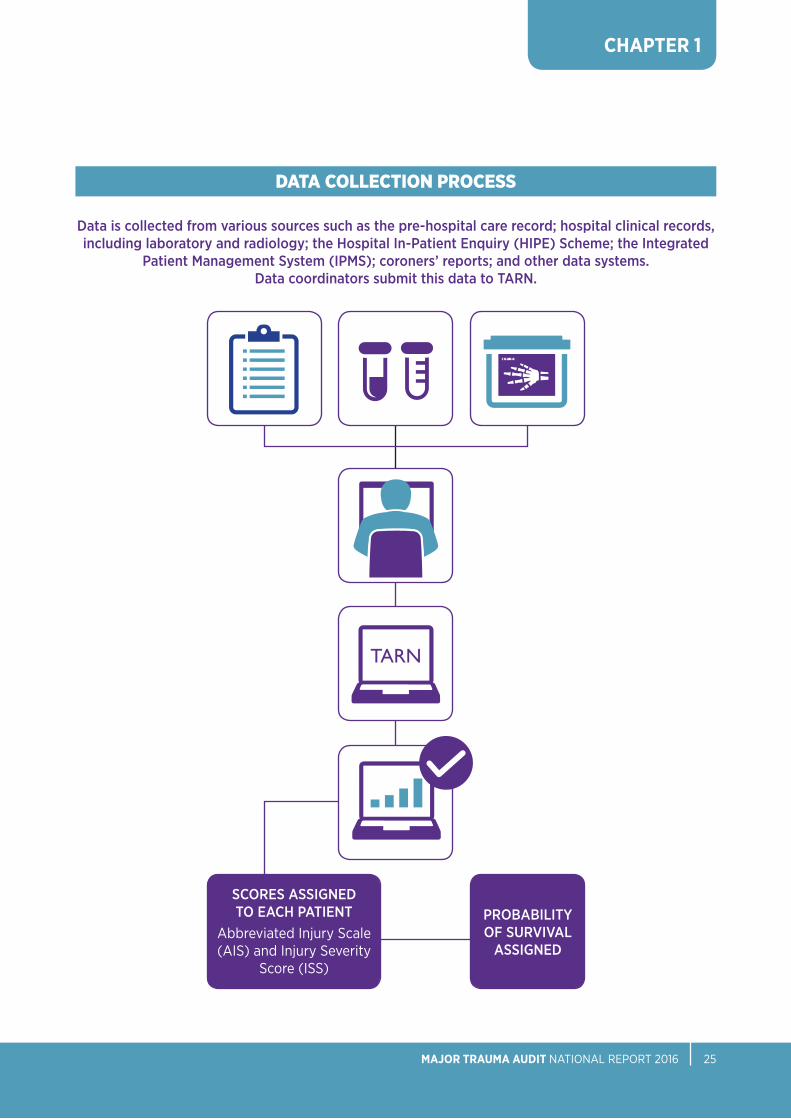
DATA COlleCTIOn pROCess
Data is collected from various sources such as the pre-hospital care record; hospital clinical records, including laboratory and radiology; the Hospital In-Patient Enquiry (HIPE) Scheme; the Integrated
Patient Management System (IPMS); coroners’ reports; and other data systems. Data coordinators submit this data to TARN.
SCORES ASSIGNED TO EACH PATIENT
Abbreviated Injury Scale (AIS) and Injury Severity
Score (ISS)
PROBABILITY OF SURVIVAL
ASSIGNED
TARN
CHAPTER 1


CHAPTER 2DATA QuALITY
74% DATA COMPLETENESS FOR 2016

CHAPTER 2
DATA FOR THIS MTA REPORT
Analysis for this report, as captured by TARN, includes patients who:I. Arrived for trauma care between 1st January 2016 and 31st December 2016II. Fulfilled the TARN eligibility criteria for inclusion (see Appendix 1)
QuALITY ASSuRANCE
TARN provides measures of data completeness and accreditation as a means of assessing the quality of MTA data.
DATA COMPLETENESS
The data completeness refers to the measure of major trauma cases with data entered against the overall expected number of cases (this is also referred to as ‘case ascertainment’ in TARN). The expected number of cases per hospital is estimated based on the Hospital In-patient Enquiry (HIPE) file for each hospital for the previous year. The TARN eligibility criteria for inclusion (Appendix 1) are applied to the national HIPE file for the previous year and an estimate of expected cases is then generated for each hospital. This methodology has limitations in that it over states the number of eligiblepatientsandinflatingthedenominator;NOCAiscurrentlyworkingtowardsasolution to resolve this problem.
The national completeness level for the 2016 MTA is 74%, (Figure 1), which is a considerable improvement from the 55% for 2015. Nine hospitals achieved the TARN Data Quality Standard for Data Completeness target of 80% completeness in 2016. Throughout the year, NOCA has provided hospitals and Hospital Groups reports which identify if completeness was below the expected standard. Hospitals should prioritise data collection and compliance with the MTA as it is a national clinical audit mandated by the Minister for Health. It demonstrates the quality of care provided within hospitals and acts as a comparator towards national and international standards of care.
DATA QUALITy
TABLE 2: DATA ANALYSIS FOR MTA REPORT 2016
2016
Number of participating hospitals 26
All TARN submissions1 5,088
Individual patients 4,426
Direct admissions (i.e. did not require transfer) 3,194
NOCA NATIONAL OFFICE OF CLINICAL AUDIT28
i Patients may have required transfer to another hospital and therefore may have multiple submission entries.

CHAPTER 2
MAJOR TRAuMA AuDIT NATIONAL REPORT 2016 29
FIGuRE 1: DATA COMPLETENESS PERCENTAGES PER HOSPITAL
FIGuRE 2: DATA ACCREDITATION PERCENTAGES PER HOSPITAL
D
99
W
98
V
95
B
98
X
97
Q
92
u
87
C
99
N
97
J
94
K
98
Z
96
M
94
A
99
O
98
P
95
R
98
S
96
I
95
H
98
E
97
F
92
T
98
Y
96
L
96
G
93
100%
50%
80%
30%
90%
40%
70%
20%
60%
10%
0%
DATA ACCREDITATION BY HOSPITALThe completion of key data fields is used as the second measure of data quality. TARN applies a standard of 95% for this measure. The national data accreditation level for the MTA is 96%, which is excellent (Figure 2). Twenty hospitals achieved the data accreditation national standard.
A
100
I
83
R
65
E
97
M
73
Y
38
Z
36
C
100
K
76
V
55
G
87
O
71
u
58
B
100
J
79
T
61
F
87
N
72
S
64
D
97
L
74
X
48
H
84
Q
69
P
71
W
54
100%
50%
80%
30%
90%
40%
70%
20%
60%
10%
0%
Completeness Target completeness
Accreditation Target accreditation
HOSPITALS
HOSPITALS
PER
CEN
TAG
ESPE
RCE
NTA
GES

CHAPTER 2
There has been ongoing education provided by NOCA to the data coordinators and clinical leads on maximising the capture of pre-hospital data and pupil reactivity, which contribute to the data accreditation score, (Figure 3).
DATA MATuRITY
As this audit and data mature, it is envisaged that individual hospital comparisons will be identified and presented in future reports.
NOCA NATIONAL OFFICE OF CLINICAL AUDIT30
FIGuRE 3: DATA ACCREDITATION BY KEY DATA FIELDS
100%
50%
80%
30%
90%
40%
70%
20%
60%
10%
0%Pre-
existing conditions
Incident/ 999 call details
GCS Transfer details
CT details
Pupil reactivity
Doctors in the ED
Injury detail
Operation details
Arrival time
Pre-existing conditions
Doctors in the ED
Pupil reactivity National Mean Accreditation
Arrival time
GCS
Incident/ 999 call details
Operation details
Injury detail
CT Details
Transfer details
KEY DATAFIELDS
PER
CEN
TAG
ES
51% OF MAjOR TRAUMA PATIENTS SUFFERED INjURY FROM A ‘LOw FALL’ (LESS THAN 2M)
CHAPTER 3WHO WAS INJuRED AND HOW WERE THEY INJuRED?

CHAPTER 3
WHO WAS INJURED AND HOW WERE THEy INJURED?
NOCA NATIONAL OFFICE OF CLINICAL AUDIT32
GENDER AND AGE BAND
This chapter provides a profile of the 4,426 patients included in the 2016 MTA and their injuries.
FINDINGSForty-two percent (n=1,843) of patients were female and 58% were male (n=2,583), (Figure 4).
FIGuRE 4: GENDER BREAKDOWN OF MAJOR TRAuMA PATIENTS (N=4,426)
58% 42%
58% 42%
MaleFemale

CHAPTER 3
MAJOR TRAuMA AuDIT NATIONAL REPORT 2016 33
FINDINGSThe mean age of patients was 55 years and the median age was 59 years. In the age categories from early childhood to 54 years, males were the predominant gender among patients and in those aged 55 years and over, females were the predominant gender (Figure 5).
For the analysis of this report, the age band for children will be presented for children aged under 15 years which differs from the last report. This has facilitated an analysis showing 10 year age bands. This data show us that children aged under 15 years represented 5% (n=219) of patients; for comparison with last year’s report and the national definition of a child, those aged under 16 represented 5% (n=237).
Fifty-five per cent (n=2,437) of patients were aged 15-64 years and in the working-age population.
Older adults, aged 65 years or over, represented 40% (n=1,770) of patients.
< 15 yEARS
25 - 34 yEARS
65 - 74 yEARS
15 - 24 yEARS
55 - 64 yEARS
35 - 44 yEARS
75 - 84 yEARS
45 - 54 yEARS
85+ yEARS
5% 9% 16%9% 16%10% 14%11% 10%
MaleFemale
FIGuRE 5: GENDER BREAKDOWN OF MAJOR TRAuMA PATIENTS BY AGE BAND (N=4,426)
100%
80%
60%
20%
40%
0%<15 45-5425-34 65-7415-24 55-6435-44 75-84 85+
37%
63%
23%
77%
72%
28%
60%
40%
47%
53%
45%
55%
30%
70%
17%
83%
22%
78%
AGE BAND
PER
CEN
TAG
ES

CHAPTER 3
Pre-exisTinG MediCAl CondiTions
FINDINGSThe Charlson Comorbidity Index (CCI) has been adapted and validated for predicting the outcome and risk of death for many comorbid diseases (Charlson et al., 1987). The CCI is used in statistical adjustment for comorbidities in TARN. Older patients will generally have a greater burden of significant pre-existing comorbidities. Half of the patients included in this report had no significant pre-existing comorbidities, 37% (n=1,623) of patients had mild comorbidities, and 2% (n=102) had severe comorbidities (Figure 6).
The distribution of comorbidities, when presented by age bands, clearly shows that the severity of comorbidities increases with age, (Figure 6A).
NOCA NATIONAL OFFICE OF CLINICAL AUDIT34
FIGuRE 6: CHARLSON COMORBIDITY INDEX SCORES OF MAJOR TRAuMA PATIENTS (N=4,426) i
No significant pre-existing comorbidities
Mild comorbidities (1-5)
Moderate comorbidities (6-10)
Severe comorbidities (>10)
Not recorded
1%
51%
37%
10%
2%
i Please note: Percentages may not sum to 100% due to rounding.* Patients with missing information on Charlson comorbidity index score (n=26) are excluded.
FIGuRE 6A: COMORBIDITIES OF MAJOR TRAuMA PATIENTS BY AGE BAND (n=4,400) i *
100%
80%
40%
60%
20%
0%<15 45-5425-34 65-7415-24 55-6435-44 75-84 85+
7%
39%
4%2%<1%
14%
41%
9%
4%
20%
<1%
48%
15%
2%
29%
2%1%
50%
22%
4%
52%
21%
4%
93%
55%
86%
47%
79%
35%
67%
25% 23%
Severe comorbidities
Moderate comorbiditiesNo significant pre-existing comorbiditiesMild comorbidities
AGE BAND
PER
CEN
TAG
ES

CHAPTER 3
MECHANISM OF INJuRY
FINDINGSFalls of less than 2 metres termed ‘low falls’ are the most frequent cause of injury (51%, n=2,272), followed by road trauma (18%, n=807) and falls of greater than 2 metres (13%, n=594), (Figure 7).
The mechanism of injury changes with age. In older patients, ‘low falls’ are most common; in younger age bands, road trauma and ‘blow(s)’ (this refers to blunt contact such as a punch or kick) are most prevalent, (Figure 7A).
Blunt trauma accounts for 96% (n=4,258) of trauma, of which 3% (n=154) was penetrating trauma, e.g. shootings and stabbings. Other, representing 2% (n=96) of cases, refers to cases of asphyxia due to hanging (n=34), drownings (n=8) and other cases.
MAJOR TRAuMA AuDIT NATIONAL REPORT 2016 35
FIGuRE 7: MECHANISM OF INJuRY (N=4,426) ii
Blows
Crush
Fall more than 2m
Road trauma
Stabbing
Burns/blasts
Fall less than 2m
Shooting
Other
51%
13%
2%
18%
10%2%
1%
1%<1%
FIGuRE 7A: MECHANISM OF INJuRY BY AGE BAND (N=4,426) ii
100%
80%
40%
60%
20%
0%<15 45-5425-34 65-7415-24 55-6435-44 75-84 85+
40%
21%
7%
23%
64%
17%
4%
12%
12%
12%
14%
35%
61%
18%
4%
14%
22%
10%
20%
26%
82%
7%3%
8%
90%
4%2%4%
10%
37%
13%
17%
23%
8%
31%
13%
8%
11%
37%
4%
27%
3%
22%
1% 1%
Blows
Falls less than 2m
Falls more than 2m
Other*
Road trauma
ii Please note: Percentages may not sum to 100% due to rounding.* ‘Other’ category contains: Burns/blasts, crush, stabbing and shooting.
AGE BAND
PER
CEN
TAG
ES

CHAPTER 3
NOCA NATIONAL OFFICE OF CLINICAL AUDIT36
FIGuRE 8: INJuRIES SuSTAINED BY BODY REGION (N=6,524)
1 All injures- all injuries to specific body region with AIS 1-62 Isolated body region- Body region e.g. head, pelvis, with AIS= 3-6 with no other injuries3 Body region and other associated injuries: Body region e.g. head, pelvis with AIS= 3-6 in addition to another injury AIS 1-6
INJuRIES SuSTAINED
HeAD lIMBFACe
All head injuries: 1,161 (18%)Severe head injuries: 1,022 (88%)Isolated2 severe head injuries: 570 (56%)Severe head injuries and other associated injuries3: 452 (44%)
All limb injuries: 1,652 (25%)Severe limb injuries: 1,016 (62%)Isolated severe limb injuries: 806 (79%)Severe limb injuries and other associated injuries: 210 (21%)
All face injuries: 583 (9%)Severe face injuries: 8 (1%)Isolated severe face injuries: 0Severe face injuries and other associated injuries: 8 (100%)
18% 9% 25%
spInAl
All spinal injuries: 1,021 (16%)Severe spinal injuries: 512 (50%)Isolated severe spinal injuries: 319 (62%)Severe spinal injuries and other associated injuries: 193 (38%)
16%
pelVIC
All pelvic injuries: 591 (9%)Severe pelvic injuries: 79 (13%)Isolated severe pelvic injuries: 21 (27%)Severe pelvic injuries and other associated injuries: 58 (73%)
9%
CHesT AnD ABDOMInAl
All chest and abdominal injuries: 1,293 (20%)Severe chest and abdominal injuries: 917 (71%)Isolated severe chest and abdominal injuries: 324 (35%)Severe chest and abdominal injuries and other associated injuries: 593 (65%)
20%
OTHeR
All other injuries: 223 (3%)Severe other injuries: 69 (31%)Isolated severe other injuries: 57 (83%)Severe other injuries and other associated injuries: 12 (17%)
3%
All injures1 recorded: 6,524
TABLE 3: NuMBER OF INJuRIES SuSTAINED PER PATIENT
NuMBER OF INJuRIES N %
1 3,049 69
2 895 20
3 306 7
4 126 3
5 39 1
6 9 <1
7 2 <1
Total 4,426 100

CHAPTER 3
MAJOR TRAuMA AuDIT NATIONAL REPORT 2016 37
INJuRY SEVERITY SCORE
When auditing the management of major trauma, it is important to have a method for grading the severity of trauma sustained by a patient. Each injury is scored between one and six based on its severity. An AIS score of one represents a minor injury; whereas an AIS score of six represents an injury that is not survivable (Appendix 1). This contributes to the overall Injury Severity Score (ISS) for that patient, which is rated on a scale from 0 to 75 (Gennarelli and Wodzin, 2008). Examples are presented in Table 4.
TABLE 4: ISS CLASSIFICATION
ISS CLASSIFICATION ISS SCORE EXAMPLES OF INJuRIES
low-severity injury 1-8 Fractured wrist and ankle Simple skull fracture Small bleed in liver
Moderate-severity injury 9-15 Fractured femur Small brain contusion (bruising)
Severe injury > 15 Large subdural haematoma (bleed between skull and brain) Fracture of the pelvis with significant blood loss Severe injuries to multiple body regions
FINDINGSA breakdown of the ISS across all injured patients is presented in Figure 9. This showsthat 42% (n=1,860) of major trauma patients suffered moderate severity injury and 31% (n=1,374) suffered severe injuries.
The distribution of ISS by age band is shown in Figure 9A. This distribution is similar across all age bands.

CHAPTER 3
NOCA NATIONAL OFFICE OF CLINICAL AUDIT38
Low-severity injury
Moderate-severity injury
Severe injury
FIGuRE 9: INJuRY SEVERITY SCORE (ISS) (N=4,426)
31%27%
42%
iii Please note: Percentages may not sum to 100% due to rounding.
FIGuRE 9A: INJuRY SEVERITY SCORE (ISS) BY AGE BAND (N=4,426) iii
100%
80%
40%
60%
20%
0%<15 45-5425-34 65-7415-24 55-6435-44 75-84 85+
31%
47%
22%
25%
57%
18%
40%
31%
29%
34%
42%
24%
36%
35%
29%
29%
42%
29%
23%
41%
36%
34%
43%
23%
33%
29%
37%
Low-severity injury Moderate-severity injury Severe injury
AGE BAND
PER
CEN
TAG
ES

CHAPTER 3
MAJOR TRAuMA AuDIT NATIONAL REPORT 2016 39
PLACE OF INJuRY
FINDINGSHome was the location where injury was sustained in 47% of patients (n=2,077). This includes 77 patients who were injured in ‘other home- not patient’s’. Thirty nine percent (n=1,714) of injuries occurred in a public place or road, (Figure 10).
The place of injury is presented by age in Figure 10A. Home is the most common place of injury overall; it is the predominant place of injury in the <15-year-old age band and those aged 55 years and older. Major trauma patients aged between 15 and 54 years are more likely to be injured on the public area and road.
Figure 10B describes the ISS score by place of injury.
iv Please note: Percentages may not sum to 100% due to rounding.
FIGuRE 10: PLACE OF INJuRY (N=4,426) iv
50%
40%
20%
30%
10%
0%
Home OtherPublic area and road
Institution* Farm Industrial
47%
39%
5% 4% 4%2%
* Institution includes hospitals, prisons, care homes and educational institutions such as schools.
PLACE OF INjURY
PER
CEN
TAG
ES

CHAPTER 3
NOCA NATIONAL OFFICE OF CLINICAL AUDIT40
FIGuRE 10A: PLACE OF INJuRY BY AGE BAND (N=4,426) v
100%
80%
40%
60%
20%
0%<15 45-5425-34 65-7415-24 55-6435-44 75-84 85+
44%
2%
1%
51%
1%
75%
4%14%1%7%
32%
8%
5%
52%
3%
53%
13%
5%
27%
2%
18%
2%
2%
72%
6%
68%
3%15%1%
13%
27%
6%
5%
60%
3%
46%
6%
37%
1%
10%
13%
2%
1%
69%
15%
100%
80%
40%
60%
20%
0%Farm Public area
and roadHome Industrial Institution
FIGuRE 10B: PLACE OF INJuRY BY ISS GROuP (n=4,204) v
31%
23%
46%
26%
26%
47%
38%
24%
38%
35%
22%
43%
35%
29%
36%
v Please note: Percentages may not sum to 100% due to rounding.
Farm
Home
Institution
Other
Public area and road
Low-severity injury Moderate-severity injury Severe injury
* Patients with place of injury classified as ‘Other’ (n=222) are excluded.
AGE BAND
PLACE OF INjURY*
PER
CEN
TAG
ESPE
RCE
NTA
GES
CHAPTER 3
MAJOR TRAuMA AuDIT NATIONAL REPORT 2016 41
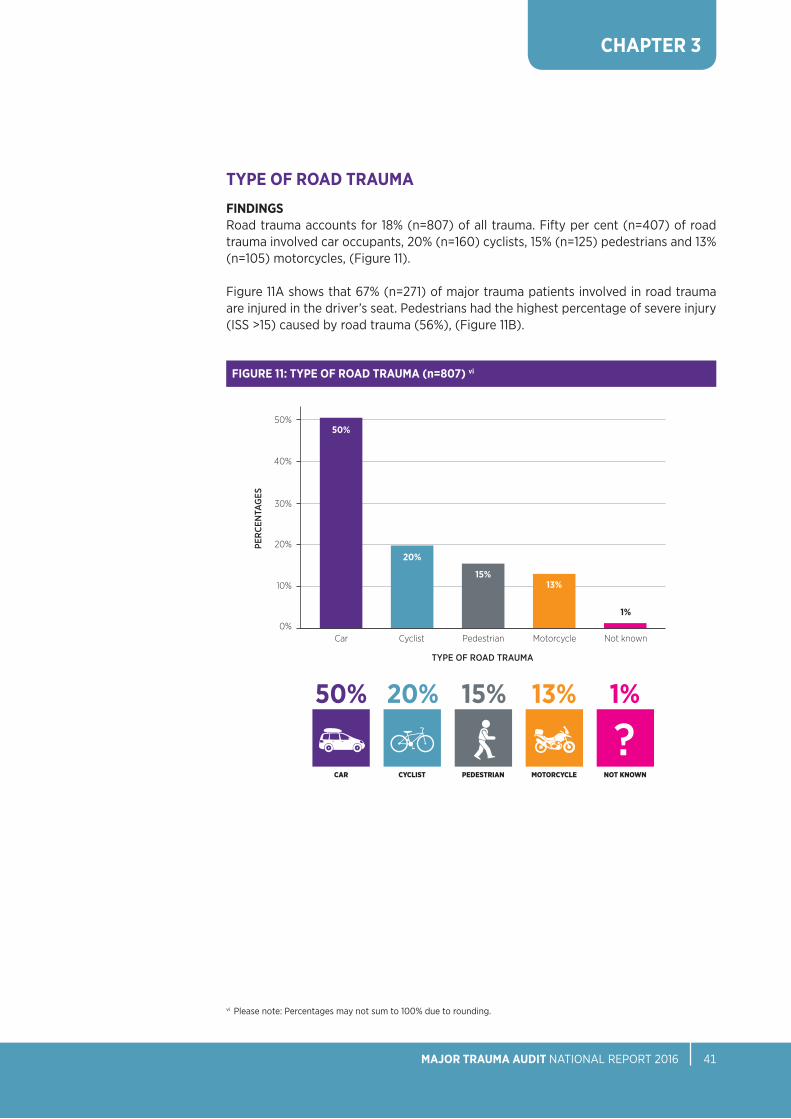
TYPE OF ROAD TRAuMA
FINDINGSRoad trauma accounts for 18% (n=807) of all trauma. Fifty per cent (n=407) of road trauma involved car occupants, 20% (n=160) cyclists, 15% (n=125) pedestrians and 13% (n=105) motorcycles, (Figure 11).
Figure 11A shows that 67% (n=271) of major trauma patients involved in road trauma are injured in the driver’s seat. Pedestrians had the highest percentage of severe injury (ISS >15) caused by road trauma (56%), (Figure 11B).
FIGuRE 11: TYPE OF ROAD TRAuMA (n=807) vi
50%
40%
20%
30%
10%
0%Car PedestrianCyclist Motorcycle Not known
50%
20%
15%13%
1%
vi Please note: Percentages may not sum to 100% due to rounding.
MOTORCyCle nOT KnOWnCAR peDesTRIAnCyClIsT
50% 15%20% 13% 1%TYPE OF ROAD TRAUMA
PER
CEN
TAG
ES

CHAPTER 3
NOCA NATIONAL OFFICE OF CLINICAL AUDIT42
FIGuRE 11A: POSITION IN VEHICLE OF THOSE INVOLVED IN CAR ACCIDENTS (n=407)
FIGuRE 11B: TYPE OF ROAD TRAuMA BY ISS GROuP (n=797) *
100%
80%
40%
60%
20%
0%Car PedestrianCyclist Motorcycle
43%
24%
33%
36%
16%
48%
29%
27%
44%
56%
22%
22%
Low-severity injury Moderate-severity injury Severe injury
4%
DRIVER BACK SEAT PASSENGER
FRONT SEAT PASSENGER
NOT KNOWN
67% 17% 12%
* Patients with missing information on mechanism of road trauma (n=10) are excluded.
PER
CEN
TAG
ES

CHAPTER 3
MAJOR TRAuMA AuDIT NATIONAL REPORT 2016 43
INJuRIES SuSTAINED AT HOME
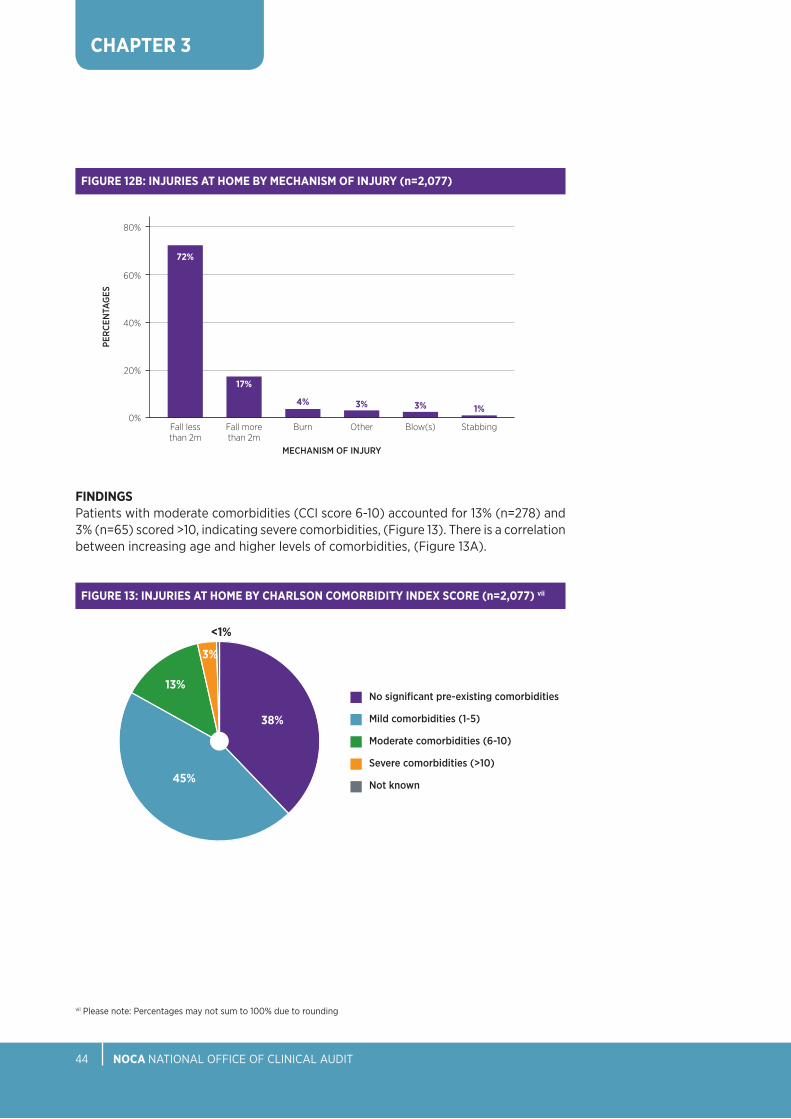
FINDINGSThe home was the most common location of injury, with 47% (n=2,077) of injuries sustainedthere,(Figure10).Inordertodeterminewhatfactorsmayinfluencesuchahigh incidence of injuries in this location, we examined the following - location of injury by gender, age-band, ISS band, comorbidity and mortality.
• 54%(n=1,131)ofmajortraumapatientsinjuredathomewerefemale,(Figure12).• Injuriesathomearemorecommoninfemalesaged75yearsandolder,(Figure12A).• ‘Lowfalls’werethemechanismofinjuryin72%(n=1,501)ofcases,(Figure12B).
Male
Female
FIGuRE 12: INJuRIES AT HOME BY GENDER (n=2,077)
54%
46%
MaleFemale
FIGuRE 12A: INJuRIES AT HOME BY GENDER AND AGE BAND (n=2,077)
100%
80%
60%
20%
40%
0%<15 45-5425-34 65-7415-24 55-6435-44 75-84 85+
36%
64%
24%
76%
75%
25%
65%
35%
52%
48%
57%
43%
39%
61%
24%
76%
26%
74%
AGE BAND
PER
CEN
TAG
ES
CHAPTER 3
NOCA NATIONAL OFFICE OF CLINICAL AUDIT44
FIGuRE 12B: INJuRIES AT HOME BY MECHANISM OF INJuRY (n=2,077)
80%
60%
40%
20%
0%Fall less than 2m
BurnFall more than 2m
Other Blow(s) Stabbing
72%
17%
4% 3%3% 1%
FINDINGSPatients with moderate comorbidities (CCI score 6-10) accounted for 13% (n=278) and 3% (n=65) scored >10, indicating severe comorbidities, (Figure 13). There is a correlation between increasing age and higher levels of comorbidities, (Figure 13A).
No significant pre-existing comorbidities
Mild comorbidities (1-5)
Moderate comorbidities (6-10)
Severe comorbidities (>10)
Not known
FIGuRE 13: INJuRIES AT HOME BY CHARLSON COMORBIDITY INDEX SCORE (n=2,077) vii
<1%
45%
38%
13%
3%
vii Please note: Percentages may not sum to 100% due to rounding
MECHANISM OF INjURY
PER
CEN
TAG
ES

CHAPTER 3
MAJOR TRAuMA AuDIT NATIONAL REPORT 2016 45
viii Please note: Percentages may not sum to 100% due to rounding.
FIGuRE 13A: INJuRIES AT HOME BY CHARLSON COMORBIDITY INDEX SCORE AND AGE BAND (n=2,068) viii*
Low-severity injury
Moderate-severity injury
Severe injury
FIGuRE 14: INJuRIES SuSTAINED AT HOME BY ISS (n=2,077) viii
26%26%
47%
FINDINGSInjuries at home resulted in a high percentage of moderate-severity injuries (47%, n=983) or severe injuries (26%, n= 547), Figure 14. The most severe injuries sustained at home are most predominant in the 15-24 and 25-34 age bands, (Figure 14A).
* Patients with missing information on Charlson index score (n=9) are excluded.
100%
80%
40%
60%
20%
0%<15 45-5425-34 65-7415-24 55-6435-44 75-84 85+
8%
47%
6%
5%27%
73% 45%
9%
5%
32%
1%
1%
51%
16%
2%
36%
5%
50%
22%
3%
52%
20%
5%
92%
42% 42%
65%
31%
59%
26% 23%
Moderate comorbidities
Severe comorbidities
No significant pre-existing comorbiditiesMild comorbidities
AGE BAND
PER
CEN
TAG
ES

CHAPTER 3
NOCA NATIONAL OFFICE OF CLINICAL AUDIT46
FINDINGSOf those injured at home (n=2,077), 5% (n=102) died during admission to hospital, (Figure 15).
ix Please note: Percentages may not sum to 100% due to rounding.
FIGuRE 15: INJuRIES AT HOME BY MORTALITY (n=2,077)
5%
95%
Alive
Dead
FIGuRE 14A: INJuRIES SuSTAINED AT HOME BY ISS AND AGE BAND (n=2,077) ix
100%
80%
40%
60%
20%
0%<15 45-5425-34 65-7415-24 55-6435-44 75-84 85+
53%
19%
65%
16%
36%
21%
43%
24%
35%
30%
46%
29%
41%
39%
48%
27%
28% 19%43% 33%35% 24% 19%25% 49%
24%
27%
Low-severity injury Moderate-severity injury Severe injury
AGE BAND
PER
CEN
TAG
ES

CHAPTER 3
MAJOR TRAuMA AuDIT NATIONAL REPORT 2016 47
HEAD INJuRIES
Head injuries, also referred to as traumatic brain injury (TBI), accounted for 18% (n=1,161) of all MTA injuries.
A marker of head injury on arrival of the patient at the ED is the level of consciousness measured by the Glasgow Coma Scale (GCS). There are three levels of consciousness recorded within head injury. A normal or minimally impaired consciousness level is given a score of 13-15, a moderate level is given a score of 9-12, with the most severe scoring 8 or lower. The majority of fatal outcomes are in the moderate or severe head injury group (NICE, 2014). Of those patients recorded with a GCS of 8 or lower in this report, 62% (n=96) survived.
FINDINGSThe percentage of head injuries categorised with a minimally impaired consciousness level, i.e. GCS 13-15, accounted for 75% (n=748), a further 10% (n=97) had moderate head injury (GCS 9-12) and 16% (n=155) were considered to have a severe head injury indicated with a GCS or 8 or less, (Figure 16).
Figure 16A shows that severe head injuries were more common in the younger age bands.
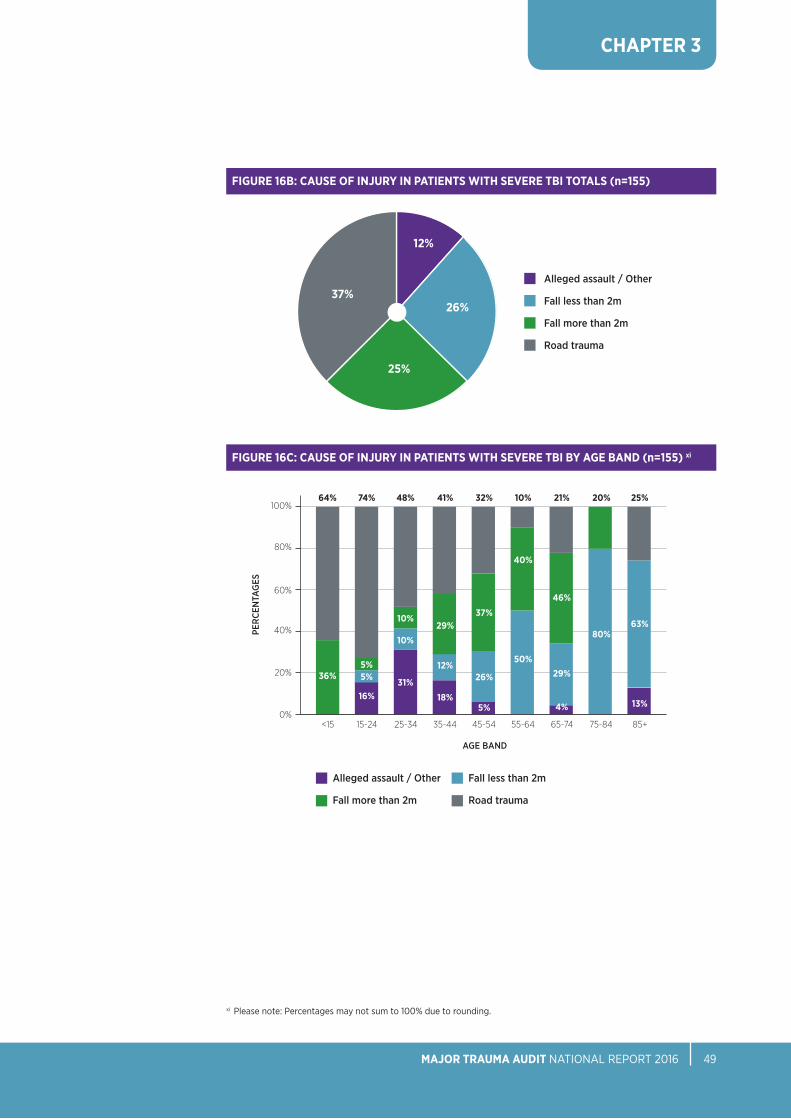
The predominant mechanism of injury in patients with severe TBI was road trauma (37%, n=58) followed by ‘low falls’ (26%, n=40) and falls of greater than 2 metres with (25%, n=39), (Figure 16B). The mechanism of injury varies considerably by age band, with road trauma being more prevalent in younger age bands and ‘low falls’ being most common for older people aged over 75 years, (Figure 16C).

CHAPTER 3
NOCA NATIONAL OFFICE OF CLINICAL AUDIT48
FIGuRE 16: HEAD INJuRY SEVERITY (AIS 3+) (n=1,000)*
x Please note: Percentages may not sum to 100% due to rounding.
* Patients with missing information on GCS (n=22) are excluded
10%15% 75%Low-severity injury
Moderate-severity injury
Severe injury
FIGuRE 16A: HEAD INJuRY SEVERITY BY AGE BAND AND GCS (n=1,000)x
100%
80%
40%
60%
20%
0%<15 45-5425-34 65-7415-24 55-6435-44 75-84 85+
64%
14%
69%
7%
61%
15%
67%
15%
70%
10%
81%
11%
78%
7%
84%
8%
22% 23% 24% 18% 20% 8% 15% 9% 9%
88%
3%
Low-severity injury Moderate-severity injury Severe injury
AGE BAND
PER
CEN
TAG
ES
CHAPTER 3
MAJOR TRAuMA AuDIT NATIONAL REPORT 2016 49
xi Please note: Percentages may not sum to 100% due to rounding.
FIGuRE 16C: CAuSE OF INJuRY IN PATIENTS WITH SEVERE TBI BY AGE BAND (n=155) xi
100%
80%
40%
60%
20%
0%<15 45-5425-34 65-7415-24 55-6435-44 75-84 85+
32%74%64% 10%48% 21%41% 20% 25%
Alleged assault / Other
Fall more than 2m
Fall less than 2m
Road trauma
37%
26%
5%
5%5%
16%
36%
40%
50%
10%
10%
31%
46%
29%
4%
29%
12%
18%
80%63%
13%
Alleged assault / Other
Fall less than 2m
Fall more than 2m
Road trauma
FIGuRE 16B: CAuSE OF INJuRY IN PATIENTS WITH SEVERE TBI TOTALS (n=155)
37%26%
25%
12%
AGE BAND
PER
CEN
TAG
ES


CHAPTER 4THE PATIENT JOuRNEY
28% OF PATIENTS HAD TO BE TRANSFERRED TO ANOTHER HOSPITAL

NOCA NATIONAL OFFICE OF CLINICAL AUDIT52
CHAPTER 4
THE PATIENT JOURNEyOptimal trauma care requires that every link in the chain of care is seamlessly joined up to ensure maximal survival and recovery of MTA patients.
MODE OF ARRIVAL TO HOSPITAL
FINDINGSAmbulance was the most common mode of transportation to hospital (71%, n=2,263). Thirteen percent (n=400) of patients arrived by car, 1% (n=25) arrived by helicopter and 2% (n=69) arrived on foot, (Figure 17).
FIGuRE 17: MODE OF ARRIVAL TO HOSPITAL (n=3,194)*
1%HELICOPTER
71%AMBuLANCE
2%WALKING
13%BY CAR
* Patients who were transferred to another hospital are excluded. Data on patients whose mode of transport to hospital was ‘Other’ or ‘unknown’ are not presented above.e.
1%HELICOPTER
AND CAR

CHAPTER 4
MAJOR TRAuMA AuDIT NATIONAL REPORT 2016 53
MosT senior Pre-HosPiTAl HeAlTHCAre ProFessionAl
Data capture relating to the pre-hospital part of the trauma patient’s journey has been challenging for major trauma audit; the National Ambulance Service is currently moving to an electronic patient care record that is expected to facilitate audit.
FINDINGSOf those major trauma patients attended to by a pre-hospital professional (n=2,317), 33% (n=760) were attended to by an advanced paramedic, (Figure 18).
TRANSFER OF PATIENTS
FINDINGSA fundamental principle in healthcare is getting the ‘right patient to the right service at the right time’ to optimise the outcome for that patient. In 2016, 28% (n=1,232) of patients were transferred at least once to another hospital for further care, (Figure 19). It is anticipated that the development of an integrated trauma system for Ireland, comprising major trauma centres and trauma units organised in networks, will reduce the number of patients who will need subsequent transfer for definitive care, as more patients will be transported directly to the ‘right’ hospital, and where transfer is required, it will be a more streamlined process.
Advanced paramedic
Doctor
Paramedic
Other
Not known
FiGUre 18: MosT senior Pre-HosPiTAl HeAlTHCAre ProFessionAl (n=2,317)* xii
55%
33%
11% 1%
<1%
FIGuRE 19: PATIENTS TRANSFERRED TO ANOTHER HOSPITAL (N=4,426)
No transfer
Transfer
* Only direct admissions by either ambulance or helicopter are included.
28%
72%
xii Please note: Percentages may not sum to 100% due to rounding.

NOCA NATIONAL OFFICE OF CLINICAL AUDIT54
CHAPTER 4
TRAuMATIC BRAIN INJuRY AND ADMISSIONS TO A NEuROSuRGICAL uNIT
FINDINGSOne thousand patients were recorded as having a significant TBI (AIS 3+, all GCS), (Figure 20). Of these, 11% (n=111) were admitted directly to a neurosurgical unit. A further 25% (n=245) were subsequently transferred to a neurosurgical unit.
There were 155 patients with a severe TBI (AIS3+, GCS<8), of those, 11% (n=17) were admitted directly to a neurosurgical unit, 44% (n=68) were transferred to a neurosurgical unit from another hospital and 45% (n=70) were not transferred, (Figure 20A). Research into the reason for these patients not being transferred to a neurosurgical unit is ongoing.
Direct admission to neurosurgical centre
Transfer to neurosurgical centre
Not transferred to neurosurgical centre
Direct admission to neurosurgical centre
Transfer to neurosurgical centre
Not transferred to neurosurgical centre
FIGuRE 20: CARE PATHWAY OF PATIENTS WITH TBI (n=1,000)
25%
64%11%
FIGuRE 20A: SEVERE TBI AND ADMISSIONS TO A NEuROSuRGICAL uNIT (n=155)
11%
44%
45%

CHAPTER 5CARE OF MAJOR TRAuMA PATIENTS IN THE ACuTE HOSPITAL SERVICE
8% OF MAjOR TRAUMA PATIENTS wERE RECEIVED BY A TRAUMA TEAM

NOCA NATIONAL OFFICE OF CLINICAL AUDIT56
CHAPTER 5
CARE OF MAJOR TRAUMA PATIENTS IN THE ACUTE HOSPITAL SERVICE
Reception, reconstruction and rehabilitation are key process measures in MTA that contribute to patient outcomes.
PRESENTATION BY TIME OF DAY
FINDINGSThere is very little variation in the rate of presentation of major trauma patients by day of week or month of year. However 58% of patients arrive between 4pm and 8am, and this is unchanged from the previous report, (Figure 21).
FIGuRE 21: PRESENTATION BY TIME OF DAY (n=4,409)*
6%
8%
4%
2%
0%
08:00-15:59 16:00-23:5900:00-07:59
* Patients with missing information on timepoint of admission (n=17) are excluded.
23:0
0
15:0
0
06:0
0
19:0
0
11:0
0
02:0
0
21:0
0
13:0
0
04:0
0
17:0
0
09:0
0
00:0
0
22:0
0
14:0
0
05:0
0
18:0
0
10:0
0
01:0
0
20:0
0
12:0
0
03:0
0
16:0
0
07:0
0
08:0
0
17% 41%42%
HOUR
PER
CEN
TAG
ES

MAJOR TRAuMA AuDIT NATIONAL REPORT 2016 57
CHAPTER 5
Pre-AlerT
Pre-alert is the system whereby the ambulance service communicates to the receiving hospital that it is bringing a patient to the emergency department, the nature of the patients injuries, the patient’s physiology, their expected requirements on arrival and an expected arrival time.
FINDINGSThis analysis includes major trauma patients who were admitted by ambulance or helicopter directly to hospital and not transferred subsequently to another hospital. A very low percentage of patients are documented as having been pre-alerted (9%, n=207/2,317). Figure 22 shows the proportion of patients who were pre-alerted, by age band. There is a significant difference in the proportion of patients aged 65 years and over being pre-alerted compared to those aged 64 years and younger (p<0.05). Those aged 65 years and over are less likely to be pre-alerted.
FiGUre 22: Pre-AlerTed, BY AGe BAnd (n=207)
20%
15%
10%
5%
0%
PER
CEN
TAG
ES
<15 45-5425-34 65-7415-24 55-6435-44 75-84 85+
AGE BAND
5%
15%
18%
13%13%12%12%
8%
4%

NOCA NATIONAL OFFICE OF CLINICAL AUDIT58
CHAPTER 5
RECEPTION BY A TRAuMA TEAM
Outcomes from the initial assessment and resuscitation of trauma patients is improved by an organised trauma team (Driscoll and Vincent, 1992). The NHS Clinical Advisory Group (2010) recommended that trauma teams in major trauma centres should be led by a consultant and by an experienced registrar at trauma units. In Ireland, the lack of clear national standards on what should constitute a trauma team or when such a team should be activated makes this challenging to measure. Currently, it is up to participating hospitals to define their trauma team and report if this definition of a trauma team was activated.
FINDINGSThis analysis includes major trauma patients who were admitted directly to hospital and not transferred subsequently to another hospital. Only 8% (n=271) of trauma patients were assessed by a trauma team. Those aged under 15 years and over 85 years were less likely to be treated by a trauma team, (Figure 23).
FIGuRE 23: RECEPTION BY A TRAuMA TEAM BY AGE BAND (n=271) xiii
15%
10%
5%
0%
6%
14%
15%
10%
11% 11%11%
14%
7%
<15 45-5425-34 65-7415-24 55-6435-44 75-84 85+
AGE BAND
PER
CEN
TAG
ES
xiii Please note: Percentages may not sum to 100% due to rounding.

MAJOR TRAuMA AuDIT NATIONAL REPORT 2016 59
CHAPTER 5
RECEPTION BY A TRAuMA TEAM
FINDINGSThe overall percentage of major trauma patients received by a trauma team remains low at 8% (n=271) (Table 5). This is comparable with the data in the previous report.
TABLE 5: RECEPTION BY A TRAuMA TEAM
2016
All patients received by a trauma team 8% (n=271 / 3,194)
Trauma team led by a consultant (at 30 minutes) 35% (n=94 / 271)
All severely injured patients (ISS>15) received by a trauma team 15% (n=130 / 895)
Severely injured patients (ISS>15): Trauma Team led by a 51% a consultant (at 30 minutes) (n=66 / 130)

NOCA NATIONAL OFFICE OF CLINICAL AUDIT60
CHAPTER 5
FINDINGSPatients aged 65 years and older were significantly (p<0.05) less likely to be reviewed by a senior clinician compared to those under the age of 65 years, (Figure 24). Eight per cent (n=256) of patients were seen by a consultant within 30 minutes of arrival in ED, (Table 6).
* Patients who were transferred to another hospital are excluded.xiv Please note: Percentages may not sum to 100% due to rounding.
Consultant 256 (8%) 706 (22%) 140 (16%) 284 (32%)
Associate specialist 0 (-) 3 (<1%) 0 (-) 0 (-)
Specialist registrar 1 (<1%) 491 (15%) 0 (-) 168 (19%)
Registrar 201 (6%) 1,451 (45%) 92 (10%) 349 (39%)
SHO 632 (20%) 433 (14%) 190 (21%) 75 (8%)
Intern 194 (6%) 2 (<1%) 38 (4%) 0 (-)
Other (not recorded) 23 (1%) 27 (1%) 4 (<1%) 4 (<1%)
Detail not captured at 1,887 (59%) 81 (3%) 431 (48%) 15 (2%) timepoint
Most senior Most senior Most senior Most senior doctor seeing doctor seeing doctor seeing doctor seeing patient on patient in ED patient on patient in arrival in ED after arrival arrival with with ISS>15 in <30mins ISS>15 in ED ED after <30mins arrival (n=3,194) (n=3,194) (n=895) (n=895)
TABLE 6: MOST SENIOR DOCTOR SEEING THE PATIENT IN THE ED AND THOSE WITH ISS>15*
FIGuRE 24: GRADE OF MOST SENIOR DOCTOR TREATING PATIENT ON ARRIVAL, BY AGE BAND (n=3,194) xiv
100%
80%
40%
60%
20%
0%<15 45-5425-34 65-7415-24 55-6435-44 75-84 85+
Consultant
Special registrar
Registrar
SHO
Other/no grade recorded
42%
16%
8%
44%
9%
35%
19%
18%
45%
16%
7%
43%
18%
16%
44%
15%
8%
46%
17%
15%
48%
14%
16%
52%
10%
24%23%34% 19%26% 25% 21% 18%
5%5%3% 2%6% 2%4% 3% 4%
AGE BAND
PER
CEN
TAG
ES
20%
13%
23%

MAJOR TRAuMA AuDIT NATIONAL REPORT 2016 61
CHAPTER 5
SuRGERY
FINDINGSOf the 1,219 surgeries performed, over two-thirds (69%, n=847) were performed on a limb or limbs, (Figure 25). Surgery was performed on 33% (n=450) of all severely injured (ISS>15) patients (n=1,347).
* Patients that were transferred to another hospital are excluded.† Patients with missing information on timepoint of surgery (n=24) are excluded.
BODY REGION
FINDINGSFigure 26 shows the median time in hours to surgery, by body region. This is surgery that occurred at any point during admission. Table 10 shows the median time to surgery, by body region and age band (see Appendix 5).
FIGuRE 26: MEDIAN TIME (IN HOuRS) TO SuRGERY FOR PATIENTS HAVING SuRGICAL INTERVENTION, BY BODY AREA (n=1,195)*†
FIGuRE 25: SuRGICAL INTERVENTION BY BODY REGION (n=1,219)*
80%
60%
40%
20%
0%Head and
brainSpineThoracic Skin/soft
tissueAbdomenGeneral Face Limbs
2% 2% 2% 4% 5% 7%9%
BODY REGION
PER
CEN
TAG
ES
100
70
30
90
50
10
60
20
80
40
0Abdomen Skin/soft
tissueHead and
brainFaceThoracicGeneral Limbs Spine
1925 26
7
19
6572
91
HO
UR
S
69%

NOCA NATIONAL OFFICE OF CLINICAL AUDIT62
CHAPTER 5
FINDINGSSeventy-eight percent (n=936) of surgeries were carried out within 72 hours of admission (Figure 27).
FIGuRE 27: PERCENTAGE OF SuRGERY WITHIN 24, 48 AND 72 HOuRS (n=1,195)*†
80%
60%
40%
20%
0%24 hours 48 hours 72 hours
67%
44%
78%
* Patients with missing information on timepoint of surgery (n=24) are excluded.† Patients who were transferred to another hospital are excluded.
TIME (IN HOURS)
PER
CEN
TAG
ES

MAJOR TRAuMA AuDIT NATIONAL REPORT 2016 63
CHAPTER 5
HOSPITAL SYSTEMS PERFORMANCE
The TARN audit is underpinned by clinical standards and systems indicators, which are intended to provide opportunities for learning and improvement.
1. PATienTs WiTH GCs <9 Pre-HosPiTAl or in THe ed HAVe DEFINITIVE AIRWAY MANAGEMENT PRE–HOSPITAL OR IN THE ED
International guidelines use a GCS of <9 as a criterion for the requirement of definitive airway management, i.e. endotracheal or tracheal intubation on arrival to an ED (Royal College of Surgeons in England, 1999).
FINDINGSThere were 130 patients with a recorded GCS of <9. Of these, 70% (n=103) were intubated, (Figure 28).
No intubation
Intubated - ED
Intubated - pre-hospital
Intubated - both ED and pre-hospital
Not known
FIGuRE 28: AIRWAY MANAGEMENT OF PATIENTS WITH GCS <9 (n=130)*†
* There are patients with a GCS<9 on presentation who may not require intubation due to their condition improving, intoxication, not-for-resuscitation (NFR) status, etc.
† Calculations for this Figure relate to the first hospital a trauma patient was received in.
68%1%
10%
18%
2%

NOCA NATIONAL OFFICE OF CLINICAL AUDIT64
CHAPTER 5
2. MANAGEMENT OF SHOCKED PATIENTS
Patients with blunt trauma admitted with a systolic blood pressure of less than 110mmHg have a significant increased risk of mortality (Hassler et al., 2011). The ‘crude survival’ does not attempt to adjust for differences in age, gender, comorbidities, etc. which can contribute to survival.
FINDINGSA total of 285 shocked patients were recorded (representing 6% of MTA patients). Of those, 95% (n=271) survived and 5% (n=14) died, Figure 29.
FIGuRE 29: SuRVIVAL OF SHOCKED PATIENTS (n=285)
95%
5%
Alive
Dead

MAJOR TRAuMA AuDIT NATIONAL REPORT 2016 65
CHAPTER 5
3. TIME TO CT FOR HEAD INJuRY PATIENTS
Injured patients with head injuries and an initial GCS of <13 should have a CT head scan within one hour (NICE, 2014). There were 251 patients who required a CT (having head injuries and an initial GCS of < 13) but only 33% (n=82) of patients received within one hour, (Figure 30).
There was no difference in time to CT across the week.
FINDINGSThe median time to CT scan for head injury patients with GCS of <13 was 1.3 hours (IQR 0.9-2.3 hours).
FIGuRE 30: TIME TO CT SCAN WITHIN ONE HOuR (n=251)*
67%
33%No
Yes
* Patients with missing information on timepoint of CT scan (n=10) are excluded.

NOCA NATIONAL OFFICE OF CLINICAL AUDIT66
CHAPTER 5
4. INTENSIVE CARE uNIT ADMISSION
In Ireland, the modern Intensive Care Unit (ICU) or High Dependency Unit (HDU), where critically ill patients receive critical care, is described as a critical care service by the Joint Faculty of Intensive Care Medicine of Ireland (JFICMI) ‘National Standards for Adult Critical Care Services 2011’.
Critical care encompasses both Intensive care and high dependency care. In practice, level 2 is high dependency (HDU) and level 3 is intensive care (ICU) level of critical care.critical care units provide life-sustaining treatment for critically ill patients with acute organ dysfunction due to potentially reversible disease. It is the purpose of the Unit to support the patient’s failing organs and diagnose and treat the underlying cause. Patients at risk of organ dysfunction due to chronic disease processes or other temporary reversible circumstance (e.g. after trauma), may also benefit from critical care in the perioperative period.
Patients sustaining major trauma are admitted to an intensive care unit for many reasons including ongoing resuscitation, organ support and/or closer monitoring. The length of stay(LOS)inanICUcanbeinfluencedbytheavailabilityofICUbeds,theneedsofthepatient and/or the availability of step down beds.
Table 7 shows that 17% (n= 758) of MTA patients were admitted to an ICU, with a median length of stay in the unit of three days for all patients. The MTA should be used to inform national ICU bed capacity requirements.
N 758 478 120
Median (IQR) 3 (1-8) 4 (2-9) 5 (1-12)
ICU bed days 4,843 3,713 911
TABLE 7: ICu LOS
ICu LOS FOR ALL ICu LOS FOR MTA ICu LOS FOR MTA PATIENTS MTA PATIENTS PATIENTS ISS>15 WITH SEVERE TBI

MAJOR TRAuMA AuDIT NATIONAL REPORT 2016 67
CHAPTER 5
5. HOSPITAL LENGTH OF STAY
Hospital length of stay for trauma patients is dependent on the nature and severity of the injuries sustained, the baseline health of the patient, the efficiency of the hospital in delivering care and the ability of the hospital to discharge the patient to an appropriate setting when they have recovered. Access to rehabilitation, step-down facilities, and homeandcommunitysupportsinfluencethelengthofstayattheacutehospitalforseverely injured patients. The median length of stay for all major trauma patients was nine days, (Table 8). Figure 31 shows the median LOS for major trauma patients by age band.
LOS for all major trauma patients Median (IQR) 9 (5-17)
LOS for major trauma patients if ISS>15 Median (IQR) 10 (5-22)
TABLE 8: HOSPITAL LOS FOR MAJOR TRAuMA PATIENTS
FIGuRE 31: HOSPITAL LENGTH OF STAY BY AGE BAND (N=4,426)
14
8
12
6
10
4
2
0
5
7
6
10
6
88
13 13
<15 45-5425-34 65-7415-24 55-6435-44 75-84 85+
AGE BAND
MED
IAN
LEN
GTH
OF
STAY
(D
AYS)

96% OF MAjOR TRAUMA PATIENTS SURVIVED
CHAPTER 6OuTCOMES FOLLOWING MAJOR TRAuMA

CHAPTER 6
MORTALITY
Mortality is a crude measure of quality of care in major trauma patients. Ninety-six per cent (n=4,233) of MTA patients survived while 4% (n=193) were recorded as having died during their hospital admission.
FINDINGSThe highest proportion of deaths occurred in patients who were aged 75 years and over, (Figure 32).
OUTCOMES FOLLOWING MAJOR TRAUMA
NOCA NATIONAL OFFICE OF CLINICAL AUDIT70
FIGuRE 32: MORTALITY BY AGE BAND (n=193)
25%
20%
15%
5%
10%
0%<15 45-5425-34 65-7415-24 55-6435-44 75-84 85+
2%
7% 8%
3%
7%9%
16%
24% 24%
AGE BAND
PER
CEN
TAG
ES

CHAPTER 6
MAJOR TRAuMA AuDIT NATIONAL REPORT 2016 71
In Figure 33, Figure 34A and Figure 36, age band have been condensed into three bands so that there are sufficient numbers in each band for comparison purposes.
FINDINGSFigure 33 shows the percentage of deaths by age band and gender. The highest percentage of deaths occurred in males.
MaleFemale
FIGuRE 33: MORTALITY BY GENDER AND AGE BAND (n=193)
100%
80%
60%
20%
40%
0%35-64<34 65+
25%
75%
50%
50%
33%
67%
AGE BAND
PER
CEN
TAG
ES

CHAPTER 6
NOCA NATIONAL OFFICE OF CLINICAL AUDIT72
MORTALITY BY CAuSE OF INJuRY
FINDINGSThe highest proportion of deaths is attributable to falls less than 2 metres (55%) (Figure 34). Figure 34A shows that the leading cause of mortality in major trauma patients aged under 34 is attributable to ‘other’ (56%) (other may refer to asphyxiation / drowning / and amputation). In patients aged 65 and over, the leading cause of mortality is ‘low falls’ (76%).
xv Please note: Percentages may not sum to 100% due to rounding.
FIGuRE 34: MORTALITY BY MECHANISM OF INJuRY (n=193) xv
60%
40 %
50 %
30%
20%
10%
0%Falls less than 2m Falls more than 2m OtherRoad trauma
19%16%
11%
55%
MECHANISM OF INjURY
PER
CEN
TAG
ES
FIGuRE 34A: MORTALITY BY MECHANISM OF INJuRY, BY AGE BAND (n=193) xv
100%
80%
60%
20%
40%
0%35-64<34 65+
41%
3%
56%
10%
6%
76%
9%31%
14%
31%
25%
AGE BAND
PER
CEN
TAG
ES
Falls less than 2m
Other
Falls more than 2m
Road trauma

CHAPTER 6
MAJOR TRAuMA AuDIT NATIONAL REPORT 2016 73
MORTALITY BY ISS BAND
FINDINGSOf those patients who died, 78% (n=151) had an ISS of greater than 15, indicating severe trauma, (Figure 35).
FIGuRE 35: MORTALITY, BY ISS BAND (n=193)
90%
80%
50%
40%
70%
60%
10%
30%
20%
0%Low-severity injury Moderate-severity injury Severe injury
6%
78%
16%
ISS CATEGORY
PER
CEN
TAG
ES

CHAPTER 6
NOCA NATIONAL OFFICE OF CLINICAL AUDIT74
MORTALITY, BY BODY REGION
FINDINGSFigure 36 shows that head injuries were the predominant cause of death for those aged 65 years and over (66%).
xvi Please note: Percentages may not sum to 100% due to rounding.
Chest
Head
Limbs
Multiple
Other
Spine
FIGuRE 36: MAJOR TRAuMA DEATHS BY BODY AREA INJuRED, BY AGE BAND (n=193) xvi
100%
80%
60%
20%
40%
0%35-64<34 65+
6%
28%
3%
13%
50%
14%
4%5%6%
6%
66%
8%
44%
11%
14%
22%
AGE BAND
PER
CEN
TAG
ES

CHAPTER 6
MAJOR TRAuMA AuDIT NATIONAL REPORT 2016 75
GLASGOW OuTCOME SCALE AT DISCHARGE
The Glasgow Outcome Scale (Jennett et al., 1981) applies to patients with a brain injury and allows an assessment of their recovery in five categories ranging from ‘death’ to ‘good recovery with resumption of normal activities’ although there may be minor neurological or psychological deficits.
FINDINGSOlder patients (75-84 and 85+ years age bands) have higher levels of disability and mortality than younger patients following major trauma (p<0.05) across all injuries (Figure 37).
More patients in the 75–84 and the 85+ age bands with head injury (Figure 37A) and severe injury (Figure 37B) died following trauma than patients in other age bands. More patients with head injury (Figure 37A) and severe injury (Figure 37B) were discharged with severe disability in the 15-74years age bands, with the greatest presentation in the 35-44 age band. More paediatric patients (< 15 years age band) made a good recovery across all injuries (Figure 37), head injuries (Figure 37A) and severe injuries (Figure 37B).
xvii Please note: Percentages may not sum to 100% due to rounding.
FIGuRE 37: GLASGOW OuTCOME SCALE BY AGE BAND (N=4,426) xvii
100%
80%
60%
20%
40%
0%<15 45-5425-34 65-7415-24 55-6435-44 75-84 85+
7%
3%4%
2%
84%
5%
34%
6%
12%
43%
8%
30%
5%
49%
7%
25%
8%
55%
5%
7%
23%
63%
5%
3%7%
15%
69%
6%
11%
16%
67%
6%
3%8%
11%
72%
6%
3%6%
10%
74%
Good recovery
Death
Moderate disability
Other/not recorded
Severe disability
AGE BAND
PER
CEN
TAG
ES
8%5%3%1%

CHAPTER 6
NOCA NATIONAL OFFICE OF CLINICAL AUDIT76
FIGuRE 37B: GLASGOW OuTCOME SCALE IN PATIENTS WITH ISS >15 BY AGE BAND (n=1,374) xviii
xviii Please note: Percentages may not sum to 100% due to rounding.
FIGuRE 37A: GLASGOW OuTCOME SCALE IN PATIENTS WITH HEAD INJuRY BY AGE BAND (n=1,161) xviii
Good recovery
Death
Moderate disability
Other/not recorded
Severe disability
AGE BAND
100%
80%
60%
20%
40%
0%<15 45-5425-34 65-7415-24 55-6435-44 75-84 85+
8%
4%3%4%
82%
4%
25%
9%
24%
38%
10%
20%
8%
19%
43%
9%
13%
9%
15%
54%
8%
9%
12%
16%
55%
9%
6%
13%
11%
61%
10%
1%
18%
21%
51%
10%
5%
16%
8%
61%
8%
2%
13%
7%
69%
PER
CEN
TAG
ES
100%
80%
60%
20%
40%
0%<15 45-5425-34 65-7415-24 55-6435-44 75-84 85+
5%
5%3%5%
81%
4%
29%
9%
26%
33%
7%
20%
8%
18%
46%
8%
12%
13%
17%
50%
8%
8%
15%
11%
58%
7%
11%
14%
11%
57%
10%
3%
24%
14%
50%
8%
8%
16%
9%
59%
9%
9%
16%
10%
56%
Good recovery
Death
Moderate disability
Other/not recorded
Severe disability
AGE BAND
PER
CEN
TAG
ES

CHAPTER 6
MAJOR TRAuMA AuDIT NATIONAL REPORT 2016 77
xix Please note: Percentages may not sum to 100% due to rounding.
DISCHARGE DESTINATION
FINDINGSOver half of major trauma patients were discharged directly home (62%, n=2,732).An additional 11% (n=475) were discharged to a nursing home and 8% (n=353) were discharged to a rehabilitation setting (Figure 38).
younger patients are more likely to be discharged home. A higher proportion of older patients were discharged to either a rehabilitation setting or long-term care compared to younger patients (Figure 38A).
DISCHARGE DESTINATION
FIGuRE 38: DISCHARGE DESTINATION (N=4,426) xix
70%
60%
40%
50%
30%
20%
10%
0%Home Rehab-
ilitationOther acute
hospital
Other institution
Not knownMortuaryNursing home
62%
11%13%
8%4% 2% 1%
PER
CEN
TAG
ES
FIGuRE 38A: DISCHARGE DESTINATION BY AGE BAND (N=4,413)
100%
80%
60%
20%
40%
0<15 45-5425-34 65-7415-24 55-6435-44 75-84 85+
Home
Other acute hospital
Nursing home
Rehabilitation
Mortuary/not known
Other Institution
84%
AGE BAND
PER
CEN
TAG
ES
29%75%
6%
56%
14%
13%
10%5%
78%
15%2%
42%
10%
23%
16%
7%
74%
19%1%
66%
11%
7%
11%
1% 4%2% 2%2% 2%2% 2%1%
80%
15%10%
12%
38%
7%
12%<1%2% 2%3%1%3%3%
1% 3%1%
13%

CHAPTER 6
NOCA NATIONAL OFFICE OF CLINICAL AUDIT78
Risk adjustment is a process that allows data to be compared, adjusting for confounding factors (i.e. age, gender, severity of injury, pre-existing comorbidities and GCS) that influence the outcome.Within TARN, this is done at an individual patient level aswell as at a hospital level. From approved TARN submissions, a risk-adjusted survival rate is calculated for Ireland for 2016. This is based on all approved submissions from participating hospitals and is adjusted for case mix. This is referred to as the Ws value. Ireland’s Ws value of 1.4 (95% confidence interval 0.67 - 2.13) (Table 9) means that for every 100 major trauma patients treated in Ireland there are 1.4 more survivors than the TARN statistical model predicts (Bouamra et al., 2015). With overall data completeness at 74% for 2016, the Ws value for Ireland should therefore not be over-interpreted.
risk-AdjUsTed BenCHMArkinG: CAse Mix sTAndArdised RATE OF SuRVIVAL FOR IRELAND, 2016
95 - 100 2,998 2,979 2,959.36 0.66 0.67 0.44
90 - 95 541 518 503.18 2.74 0.16 0.43
80 - 90 274 252 235.21 6.13 0.08 0.52
65 - 80 134 100 98.45 1.16 0.04 0.04
45 - 65 59 36 32.50 5.93 0.02 0.13
25 - 45 46 14 16.87 -6.23 0.02 -0.10
0 - 25 33 3 4.47 -4.46 0.01 -0.06
Total 4,085 3,902 3,850.04 1.27 1.40 (0.67-2.13)
TABLE 9: PROBABILITY OF SuRVIVAL (PS)*
PS Band n Survivors Expected W TARN Ws 95% CI Survivors Fraction
* Only cases with a known outcome are eligible for this calculation (cases that are transferred out for further care where the matching submission hasn’t been received are excluded) so the total will be less than the overall number of cases in the dataset.

MAJOR TRAuMA AuDIT NATIONAL REPORT 2016 79
SD = Standard deviation
The hospital Ws score is calculated where there are over 50 approved TARN submissions, but becomes more reliable with over 200 approved submissions. In 2016, 22 hospitals with more than 50 approved submissions were included. The number of discharges ranged from 50 to 448 per hospital, with 16 hospitals having less than 200 approved submissions, Figure 39.
Risk-adjusted survival does not take account of the potential high personal and societal costs when patients are delayed or prevented from returning to their pre-trauma functional status or quality-of-life. Functional and quality of life patient outcomes should be incorporated into major trauma audit. In Victoria, Australia, a structured telephone questionnaire is used to measure functional and quality of life outcomes at six, 12 and 24 months. Information about functional ability and health-related quality of life is collected during the interviews (Department of Health and Human Services (State of Victoria, Australia), 2016).
CHAPTER 6
FIGuRE 39: IRISH HOSPITAL WS SCORES, 2016
-20
10
-15
-10
-5
0
5
15
20
HO
SPIT
ALS
Ws Average Ws +3 SD-2 SD +2 SD -3 SD


CHAPTER 7MAJOR TRAuMA IN OLDER PEOPLE

CHAPTER 7
This chapter focuses on major trauma in older patients. Emerging evidence shows that the proportion of major trauma victims who are in the older age bands is rapidly increasing and the most common mechanism of injury is now ‘low falls’ (Fisher, Bates and Banerjee, 2017). The MTA 2016 National Report corroborates this evidence, showing that older patients (aged 65 years and older) now represent a large cohort of MTA patients (40%). ‘Low falls’ was the major cause of injury in patients aged 65 years and older in this report. The majority of incidents happened in the patient’s home. Advanced age correlates with higher numbers of comorbidities, frailty and dementia, making management of older major trauma patients more complex and difficult. The leading cause of death in major trauma patients aged 64 years and under is road trauma and in those aged 65 years and over it is ‘low falls’. Older patients are more likely to die or to suffer higher levels of disability than younger major trauma patients with a similar Injury Severity Score (ISS). Older patients are less likely to be reviewed by a senior clinician.
Major trauma in older people is becoming increasingly recognised as a significant challenge to modern healthcare systems. Kehoe et al (2015) demonstrated an increase in the mean age of trauma patients from 36.1 years in 1990 to 53.8 years in 2013. There was also a three-fold increase in the proportion of major trauma accounted for by individuals aged over 75 years, from 8.1% in 1990 to 26.9% in 2013.
In Ireland, the average life expectancy is 81.4 years (WHO, 2011). The population aged over 65 years has increased by 19.1% since 2011. This is especially evident in the male population which rose by 53,523 (22%) to 296,837 compared with an increase of 48,651 (16.7%) to 340,730 for females. For the population aged over 85 years, the male population increased by 24.8% to 23,062, whereas the female population increased by 11.4% to 44,493 (CSO, 2016) in the same period.
Figure 40 illustrate the number of men and women for each age band in 2016, and the blue and purple lines illustrate the number of men and women for each age band in
MAJOR TRAUMA IN OLDER PEOPLE
NOCA NATIONAL OFFICE OF CLINICAL AUDIT82
FIGuRE 40: POPuLATION PYRAMID FOR IRELAND (CENSuS 2006 V 2016)
05
1015
20253035404550556065707580859095
100
Age
Gro
up
40,000 30,000 20,000 10,000 0 10,000 20,000 30,000 40,000Number of persons
2016 Men 2016 Women
2006 Men 2006 Women
Data from Central Statistics Office
AG
E BA
ND
TOTAL POPULATION
2016 Men2006 Men
2016 Women2016 Women

2006. These population counts have been conducted by the Central Statistics Office (CSO) based on the Census 2016 and 2006. The total population consisted of 4.8 million people in 2016, which is 12.3% more people than the 4.2 million in 2006. The traditional age pyramid pattern is clearly apparent for the age bands over 35 years (there are fewer people in the older age bands). The age groups below 35 years have fewer individuals, with fewest individuals aged between 20 and 25 years. There is a small peak in the five- to-eight-year-old groups, but these age bands are considerably smaller than the largest group of 35 year olds.
Figure 40 shows that the 2016 population distribution has shifted by 10 years from the 2006 population, with the most noticeable difference being the peak in the five- to-eight-year-old groups. The number of people aged over 85 years increased by 41% during the decade.
The CSO have developed eight scenarios for future population development. Data from the scenario considered to be most likely (M2F2) are presented in Figure 41, which shows the projected change in different age bands during the next 30 years. For ease of interpretation, the 2016 population has been standardised to index=100. An index of 120 thus indicates that there is expected to be 20% more people in an age band in comparison with the 2016 population.
Figure 41 illustrates that the number of people aged over 65 years is expected to grow significantly. During the next decade, the age group between 65-74 is expected to grow by 28%, while 75-84 and 85+ age bands are expected to grow by 50%. In absolute numbers, this means that the number of people aged over 75 years will increase from 261,000 to 391,000 persons. These growth expectations continue during the 30-year period shown; by 2036 the 65-74 age band is expected to grow by 58% (from 363,000 to 572,000), and the 75-84 and 85+ age bands are expected to grow by 100% (from 191,000 to 381,000) and 150% (from 70,000 to 178,000) respectively.
CHAPTER 7
MAJOR TRAuMA AuDIT NATIONAL REPORT 2016 83
FiGUre 41: ProjeCTed PoPUlATion CHAnGe in irelAnd, 2016-2046
40038036034032030028026024022020018016014012010080604020
0
2045204020352030202520202015
IND
Ex (
2016
=100
)
<15 25-44 45-64 65-74 75-84 85+
YEAR

CHAPTER 7
NOCA NATIONAL OFFICE OF CLINICAL AUDIT84
Age increases the likelihood of falls due to physiologic changes of ageing, decreases in bone mass, balance, reaction time and an increase in frailty and comorbidities. Advancing age plays a big role in the mechanism of injury which is most commonly a fall from less than 2 metres. Location of injury and processes around the timeliness ofassessment,interventionsandultimatelyoutcomesmayalsobeinfluencedbyageand the risk of serious injury also increases. Many older patients do not return to their previous functional status following even moderate trauma. Problems particular to older patients include diminished respiratory and cardiovascular reserve, frailty, pre-existing comorbidities and medications.
It is clearly shown in this report that older major trauma patients represent a challenge in terms of their comorbidities, in addition to the trauma they have suffered. No older person should be considered ‘just trauma’. Older people compensate for changes in aging but have limited physiologic reserve if they become unwell due to stress, trauma or illness. Post-trauma mortality is increased in older patients. Clement, Tennant and Muwanga (2010) have shown an inpatient mortality ranging from 5.2% to 11.3% in those aged 65 years and over compared to 2.3% to 7.2% in those aged under 65 years. A study by Bouamra et al. (2015) showed that age and comorbidities independently affect outcome.
In 2010, the Royal College of Physicians of Ireland in partnership with Health Services Executive set up the National Clinical Programme for Older Persons (NCPOP) in Ireland. This clinically led group developed and published ‘Specialist Geriatric Services Model of Care, Part 1: Acute Service Provision’ in 2012 (HSE and RCPI, 2012). The model of care published in 2012 is a key component in the care journey for older people and recommends that older people should have access, if required, to the following services in secondary care (medical or surgical need): dedicated in-patient specialist geriatric wards (SGW), specialist geriatric teams (SGT), a comprehensive geriatric assessment (CGA) for all those identified as frail, at risk or in the older age bracket. This is to ensure that their individual needs are fully assessed and that they have access to the services they require, such as in-patient rehabilitation facilities, ambulatory day hospital services and improved links with community-based services (residential care and home supports) (HSE and RCPI, 2016).
CGA is fundamental to the assessment, planning and intervention required to meet the health and social care needs of the older person who is frail, at risk of frailty, or is recovering from medical illness or surgery. Rather than the traditional way of working separately, CGA facilitates nurses, physiotherapists, occupational therapists, social workers, doctors and other members of the team to work closely together to ensure an integrated assessment and response to the older person’s individual needs. With adequate resources, this can be available to an older person in the community or in the hospital. CGA has the potential to improve the care people receive in hospital and to reduce unnecessary hospital admissions, lengths of stay and re-admissions (Ellis et al., 2011).
Healthcare has progressed so much over the past number of decades. Advanced imaging also allows detection of previous occult injuries. Surgical intervention and treatments are much more widely available to older patients. Hip fracture registries including the Irish Hip Fracture Database (IHFD) have demonstrated that collaborative care between orthopaedic surgery and geriatric medicine specialists can significantly

CHAPTER 7
MAJOR TRAuMA AuDIT NATIONAL REPORT 2016 85
improve care processes and outcomes for older patients. This approach now needs to extend to patients who suffer major trauma.
Older major trauma patients present a unique challenge as they do not raise the sameclinicalflagsasyoungerpatientsandacriticalearlystepinthemanagementofmajor trauma is the recognition that a patient has potentially sustained major trauma. Physiologically, older patients show misleading parameters when triaged, for example presenting GCS is higher in older patients or for patients with intracranial injuries (Kehoe et al., 2016). To use haemodynamic status as a predictor of mortality in older patients who suffer blunt-force trauma is less predictable (Heffernan et al., 2009). Pre-existing comorbidities and medications can alter a patients expected response to shock, pain and hypoxia and the result is an under-triage of older patient’s with major trauma. Currently, many standard triage criteria have poor sensitivity in identifying severe injuries in older patients (Ichwan et al., 2015). Early identification of injuries in older people may lead to better and more timely decision making, earlier access to treatment and a more co-ordinated period of recovery and rehabilitation and ultimately reduced length of stay and complications.
We need an age-attuned healthcare system fit to care for the biggest proportion of healthcare services users: older patients. Older patients are more vulnerable to suffering harm and complications from either overly intensive or delayed management and there is a challenge to get this balance right in order to prevent avoidable harm. The reduction and prevention of fails and fractures involves CGA and intervention, coupled with effective bone health prevention and treatment.
Collaboration in a manner similar to some orthogeriatric models would enhance our ability to select a high-risk group of patients, who require more intensive post-trauma management, early in the course of their presentation. This would decrease complications and reduce mortality in this group. Targeted rehabilitation on a dedicated trauma / rehabilitation unit would lead to improved outcomes similar to those seen in orthopaedic units with embedded orthogeriatric services and stroke units. In addition, our ability to understand, recognise, identify and manage frailty in older people through multidisciplinary team work will be increasingly important in delivering improved outcomes for patients. Trauma networks should ensure that geriatricians are involved in the development and or review of local elderly trauma policies and guidance.
This report highlights the following for consideration in relation to older patients suffering major trauma:• Fortypercent(n=1,770)ofmajortraumapatientsareaged65yearsandolder.• Themainmechanismofinjurywas‘lowfalls’inolderagebands.• Advancedagecorrelateswithhighernumbersofcomorbidities,makingtheclinical
management of older major trauma patients more complex and difficult.• Patientsaged65yearsandolderwere less likely than thoseaged64yearsand
under to be pre-alerted or received by a trauma team.• Olderpatients (age65yearsandolder) are less likely tobe reviewedby senior
clinicians compared to major trauma patients aged 64 years and younger.• Older patients are more likely to die and suffer higher levels of disability than
younger major trauma patients with a similar Injury Severity Score (ISS).

CHAPTER 8MTA QuALITY IMPROVEMENT INITIATIVES

CHAPTER 8
Quality improvement is: “the combined and unceasing efforts of everyone - healthcare professionals, patients and their families, researchers, payers, planners and educators - to make the changes that will lead to: better patient outcomes, better systems performance and better professional development (Batalden and Davidoff, 2007)”. A prerequisite for engagement in the MTA, through NOCA, by hospitals in Ireland was that they would have a trauma governance committee, comprised of key stakeholders in trauma care in their hospital to ensure audit findings from were acted upon.
NOCA, as the national audit body for major trauma in Ireland, is encouraged that local hospitals use their data from the MTA to measure their care and drive improvements in that care.
Below are examples of some QI initiatives and projects that have taken place.
CAVAN GENERAL HOSPITAL
Cavan General Hospital’s major trauma documentation for the ED was reviewed and updated by the local trauma group to include documentation of:• Promptto involveStJames’sHospital,OurLady’sChildren’sHospitalCrumlinand
Mater Misericordiae University Hospital for certain complex haematological conditions.• Chartsweredevelopedforquickdocumentationofburnsandlacerations.• Checklistforremovalofdrains/tubes.• Coronerchecklist.• TheprocurementofadditionalequipmentforEDincluding:EndTidalCo2monitor
and a pneumatic tourniquet.
RESuLTS: The new documentation has improved the recording of vital information and acts as a prompt for staff. Monthly meetings are held with the ED multidisciplinary team in conjunction with the radiologists to perform an in-depth analysis of cases.
CORK uNIVERSITY HOSPITAL
Using major trauma data locally, several projects were undertaken around the following aspects of care:• Reviewofallplasticspatientsincludingburnsfrom2013-2015.• ReviewoftraumapatientswhowereadmittedtoICU.• ReviewofthecarepathwayofpatientswithaTBIfromtimeofinjurytodischarge.• ReviewofCTscanningfortraumapatients-datafromOctober2013-2015compared
for pre-and post-introduction of a CT protocol.• ReviewofCTfeaturesofhypovolaemia,usingpatientsidentifiedbyTARN.
MTA QUALITy IMPROVEMENT INITIATIVES
NOCA NATIONAL OFFICE OF CLINICAL AUDIT88

CHAPTER 8
MAJOR TRAuMA AuDIT NATIONAL REPORT 2016 89
MATER MISERICORDIAE uNIVERSITY HOSPITAL
Considerable work has been done to maximise the use of existing ICT system to meet the demands of trauma care provision, data capture and audit.
A poster was adapted from Furness General Hospital, Cumbria England and displayed in key locations within the hospital to raise awareness of the types of injuries that are captured in TARN. Education was provided locally to staff by the MTA data coordinator. A designated icon has been added to the hospitals Flow System identifying major trauma patients.
FIGuRE 42: TRAuMA INJuRIES INCLuSION CRITERIA
FACe
Fractures documentedas significantly displaced,open, comminuted. All LeFort #s. All Panfacial #s, All Orbital blow out #s
FeMUR FRACTURes
Under 65 years - all femurfracturesOver 65 years - only head,subtrochanteric, shaft anddistal fractures are eligible
FOOT AnD HAnD
Total crush or amputationinjuries only.No digit fractures
uPPER AND LOWER LIMBS
Any single open fractureAny 2 limb closed fractures or dislocations
HeAD
All brain and skull injuries
spInAl
All trauma injuries
pelVIC RIng/ ACeTABUlUM
FRACTURes
Under 65 years - all pubic ramus fractures
(single/multiple)
Over 65 years - Only multiple pubic
rami fractures.All isolated fractures of
Ischium/Sacrum/CoccyxIleum/ Acetabulum
neCK
Any organ/vascular injury/ Hyoid fracture
ALL INTERNAL
ABDOMINAL INJuRIES
ALL INTERNAL THORATIC INJuRIES
OTHeR InJURIes
NERVE Any injury to sciatic, facial, femoral or cranial nerve
BuRNS/INHALATION Any full thickness burn or partial superficial burn ≥ 10%TBSA or inhalation injury not treatedin a burns unit
SKIN Laceration/penetrating injury with blood loss >20% (1000mls). Major degloving injury
VESSEL All injuries to femoral, neck, facial, cranial, thoracic or abdominal vasculature
ALL Severe frostbite, asphyxia, drowning with LOC, cardiac arrest, explosion, electrical injuries

CHAPTER 8
ST. JAMES’S HOSPITAL
A project was undertaken in St. James’s Hospital to develop a standard approach to trauma documentation in line with TARN:• Atraumaclinicalproformawasdeveloped,implementedandpilotedatStJames’s
Hospital and subsequently at Cork University Hospital.• Baseline data from the clinical working report on St James’s Hospital data
highlighted some inadequacies in documentation.• Thetraumaproformawasre-engineeredasadecisionsupportdocumentationtool
to optimise critical actions and documentation and refined through iterative PDSA (Plan, Do, Study, Act) cycles.
• Introduction of the tool has been associated with improved data capture. It isenvisaged that this trauma decision support and documentation tool could be adapted by each Emergency Department in Ireland. Engagement with NOCA (National Office of Clinical Audit) and the IAEM (Irish Association for Emergency Medicine) Guidelines Committee to nationalise the document is ongoing.
MTA QUALITy INITIATIVES
NOCA NATIONAL OFFICE OF CLINICAL AUDIT90

REFERENCES

REFERENCES
Batalden, P. and Davidoff, F. (2007). What is “quality improvement” and how can it transform healthcare?. Quality and Safety in Health Care, 16(1), pp.2-3.
Bouamra, O., Jacques, R., Edwards, A., yates, D., Lawrence, T., Jenks, T., Woodford, M. and Lecky, F. (2015). Prediction modelling for trauma using comorbidity and ‘true’ 30-day outcome. Emergency Medicine Journal, 32(12), pp.933-938.
Central Statistics Office (2016). Census of Population 2016 - Preliminary Results [Online]. Available from: www.cso.ie [Accessed: 18/09/2017].
Charlson, M., Pompei, P., Ales, K. and MacKenzie, C. (1987). A new method of classifying prognostic comorbidity in longitudinal studies: Development and validation. Journal of Chronic Diseases, 40(5), pp.373-383.
Clement, N., Tennant, C. and Muwanga, C. (2010). Polytrauma in the elderly: predictors of the cause and time of death. Scandinavian Journal of Trauma, Resuscitation and Emergency Medicine, 18(1), p.26.
Department of Health and Human Services (State of Victoria, Australia) (2016). Victorian State Trauma System and Registry Annual Report, 1 July 2014 to 30 June 2015 [Online]. Available from: https://www2.health.vic.gov.au/about/publications/annualreports/victorian-state-trauma-registry-summary-report-2014-15 [Accessed: 18/09/2017].
Driscoll, P. and Vincent, C. (1992). Variation in trauma resuscitation and its effect on patient outcome. Injury, 23(2), pp.111-115.
Ellis, G., Whitehead, M., Robinson, D., O’Neill, D. and Langhorne, P. (2011). Comprehensive geriatric assessment for older adults admitted to hospital: meta-analysis of randomised controlled trials. BMJ, 343(oct27 1), pp.d6553-d6553.
Fisher, J., Bates, C. and Banerjee, J. (2017). The growing challenge of major trauma in older people: a role for Comprehensive geriatric Assessment?. Age and Ageing, 46(5), pp.709-712.
Gennarelli, T. and Wodzin, E. (2008). Abbreviated injury scale 2005. Barrington, Ill.: Association for the Advancement of Automative Medicine.
Hasler, R. Nuesch,. E. Jüni, P. Bouamra, O. Exadaktylos,A. and Lecky, F. (2011) Systolic blood pressure below 110 mm Hg is associated with increased mortality in blunt major trauma patients: multicentre cohort study. Resuscitation. 82(9):1202-7.
Heffernan, D., Thakkar, R., Ravindran, R., Adams, C., Kozloff, M., Gregg, S. and Cioffi, W. (2009). Normal presenting vital signs are unreliable in geriatric blunt trauma victims. Journal of the American College of Surgeons, 209(3), p.S55.
HSE and RCPI (2012). Specialist Geriatric Services, Acute Model of Care Part 1: Acute Service Provision [Online]. Available from: http://www.hse.ie/eng/about/Who/clinical/natclinprog/olderpeoplepro-gramme/geriatric.pdf [Accessed: 18/09/2017].
HSE and RCPI (2016). Specialist Geriatric Team Guidance on Comprehensive Geriatric Assessment (CGA) [Online]. Available from: http://www.hse.ie/eng/about/Who/clinical/natclinprog/olderpeople-programme/resources/CGADocument.pdf [Accessed: 18/09/2017].
Ichwan, B., Darbha, S., Shah, M., Thompson, L., Evans, D., Boulger, C. and Caterino, J. (2015). Geriatric-Specific Triage Criteria Are More Sensitive Than Standard Adult Criteria in Identifying Need for Trauma Center Care in Injured Older Adults. Annals of Emergency Medicine, 65(1), pp.92-100.e3.
Irish Association of Emergency Medicine (2014). An Integrated Trauma System for Ireland [Online]. Available from: http://www.iaem.ie/wp-content/uploads/2014/12/IAEM_Position_Paper_-_An_Integrated_Trauma_System_for_Ireland_171214.pdf [Accessed: 18/09/2017].
REFERENCES
NOCA NATIONAL OFFICE OF CLINICAL AUDIT92

REFERENCES
Jennett, B., Snoek, J., Bond, M. and Brooks, N. (1981). Disability after severe head injury: observations on the use of the Glasgow Outcome Scale. Journal of Neurology, Neurosurgery & Psychiatry, 44(4), pp.285-293.
Joint Faculty of Intensive Care Medicine of Ireland (JFICMI) and The Intensive Care Society of Ireland (ICSI) (2011). National Standards for Adult Critical Care Services 2011 [Online]. Available from: https://www.anaesthesia.ie/attachments/article/57/JFICMI_Minimum_Standards%20Rev-01.pdf [Accessed: 18/09/2017].
Kehoe, A., Smith, J., Edwards, A., yates, D. and Lecky, F. (2015). The changing face of major trauma in the UK. Emergency Medicine Journal, 32(12), pp.911-915.
National Clinical Effectiveness Committee (2015). Prioritisation and Quality Assurance for National Clinical Audit [Online]. Available from: http://health.gov.ie/patient-safety/ncec/national-clinical-audit/ [Accessed: 24/10/2017].
Kehoe, A., Smith, J., Bouamra, O., Edwards, A., yates, D. and Lecky, F. (2016). Older patients with traumatic brain injury present with a higher GCS score than younger patients for a given severity of injury. Emergency Medicine Journal, 33(6), pp.381-385.
National Institute for Health and Care Excellence (NICE) (2014). Head Injury: assessment and early management - Clinical Guideline [CG176] [Online]. Available from: http://www.nice.org.uk/guidance/cg176/ [Accessed: 24/10/2017].
National Office of Clinical Audit (2016). Major Trauma Audit National Report 2014-2015 [Online]. Available from: https://www.noca.ie/wp-content/uploads/2016/12/Major-Trauma-Audit-National-Re-port-2014-2015-FINAL.pdf [Accessed: 18/09/2017].
NHS Clinical Advisory Groups Report (UK) (2010). Regional Networks for Major Trauma [Online]. Available from: http://www.ukemtrauma.com/uploads/3/0/6/6/30664511/major_trauma_report_final_1.pdf [Accessed: 18/09/2017].
Royal College of Surgeons of England (1999). Royal College of Surgeons of England, Report of the working party on the management of patients with head injuries. London: Royal College of Surgeons of England.
World Health Organisation (2011). Global health and Aging [Online]. Available from: http://www.who.int/ageing/publications/global_health.pdf [Accessed: 18/09/2017].
MAJOR TRAuMA AuDIT NATIONAL REPORT 2016 93


APPENDICES

The decision to include a patient should be based on the following 3 points:1. ALL TRAuMA PATIENTS IRRESPECTIVE OF AGE2. WHO FuLFIL ONE OF THE FOLLOWING LENGTH OF STAY CRITERIA
DIRECT ADMISSIONS
Trauma admissions whose length of stay is 3 days or more
ORTrauma patients admitted to a High
Dependency Area regardless of length of stayOR
Deaths of trauma patients occurring in the hospital including the Emergency Department
(even if the cause of death is medical)OR
Trauma patients transferred to other hospital for specialist care or for an ICU/HDU bed.
PATIENTS TRANSFERRED IN
Trauma patients transferred into your hospital for specialist care or ICU/HDU bed whose
combined hospital stay at both sites is 3 days or more
ORTrauma admissions to a ICU/HDU area
regardless of length of stayOR
Trauma patients who die from theirinjuries (even if the cause of death is medical)
Patients transferred in for rehabilitation only should not be submitted to TARN.
APPENDIX 1: INCLUSION CRITERIA
NOCA NATIONAL OFFICE OF CLINICAL AUDIT96
3. AND WHOSE ISOLATED INJuRIES MEET THE FOLLOWING CRITERIA
BODY REGION OR SPECIFIC INJuRY
INCLuDED – IN ISOLATION (EXCEPT WHERE SPECIFIED)
EXCLuDED – IN ISOLATION (EXCEPT WHERE SPECIFIED)
HEAD All brain or skull injuries LOC or injuries to scalp
THORAX All internal injuries
ABDOMEN All internal injuries
SPINE Cord injury, fracture, dislocation Spinal strain or sprain. or nerve root injury.
FACE Fractures documented as: Significantly Fractures documented as Closed and Displaced, open, compound or comminuted. simple or stable. All Lefort fractures All panfacial fractures. All Orbital Blowout fractures
NECK Any Organ or vascular injury or hyoid fracture Nerve Injuries Skin Injuries
FEMORAL All Shaft, Distal, Head or Subtrochanteric Isolated Neck of femur or Inter/Greater FRACTuRE fractures, regardless of Age. trochanteric fractures ≥ 65 years. Isolated Neck of Femur or Inter/ Greater trochanteric fractures <65 years old
FOOT OR HAND: Crush or amputation only. Any fractures &/or dislocations, JOINT OR BONE even if Open &/or multiple
FINGER OR TOE None All injuries to digits, even if Open fractures, amputation or crush &/or multiple injuries.

BODY REGION OR SPECIFIC INJuRY
INCLuDED – IN ISOLATION (EXCEPT WHERE SPECIFIED)
EXCLuDED – IN ISOLATION (EXCEPT WHERE SPECIFIED)
LIMB – BELOW Any Open injury. Any Closed unilateral injury fractures, KNEE (EXCEPT Any 2 limb fractures &/or dislocations. (including multiple closed fractures & or FEET/TOES) dislocations or the same limb)
LIMB – BELOW Any Open injury. Any Closed unilateral injury fractures, KNEE (EXCEPT Any 2 limb fractures &/or dislocations. (including multiple closed fractures & or FEET/TOES) dislocations or the same limb)
PELVIS All isolated fractures to Ischium, Sacrum, Single pubic rami fracture >65 years old. Coccyx, Ileum, acetabulum. Multiple pubic rami fractures. Single pubic rami fracture <65 years old. Any fracture involving SIJ or Symphysis pubis.
NERVE Any injury to sciatic, facial, femoral or All other nerve injuries, single or multiple. cranial nerve.
VESSEL All injuries to femoral, neck, facial, cranial, Intimal tear or superficial laceration or thoracic or abdominal vessels. perforation to any limb vessel. Transection or major disruption of any other vessel.
SKIN Laceration or penetrating skin injuries Simple skin lacerations or penetrating injuries with with blood loss >20% (1000mls) blood loss < 20% (1000mls); single or multiple. Major degloving injury. (>50% body region) Contusions or abrasions: single or multiple. Minor degloving injury. (<50% body region)
BuRN Any full thickness burn or Partial/superficial Partial or superficial burn <10% body surface area. burn >10% body surface area
INHALATION All included
FROSTBITE Severe frostbite Superficial frostbite
ASPHYXIA All None
DROWNING All None
EXPLOSION All None
HYPOTHERMIA Accompanied by another TARN eligible injury Hypothermia in isolation
ELECTRICAL All None
MAJOR TRAuMA AuDIT NATIONAL REPORT 2016 97

INJuRY DETAIL
Injury detail is of paramount importance to any TARN submission, therefore all injuries sustained by a patient must be recorded on every submission.
Information relating to injuries should be obtained from the following sources: clinician’s notes, nursing notes, radiology reports, operative notes, discharge summaries and post mortem reports.
Guidelines to help with injury documentation, record:• Length,depthorgradeoflacerations(especiallytointernalorgans)• Depth,sizeandlocationofhaemorrhagesandcontusions(especiallyinthebrain)• Openorclosedfractures• Stability&siteoffractures(e.g.comminuted/displacedshaft/proximal/distalfracture)• Articular(joint)involvement(e.g.intra-articular,extra-articular)• Bloodloss• Vesseldamage• Location&numberofribfractures• Compressionoreffacementofventricles/brainstemcisterns• Neurologyassociatedwithspinalcordinjuries• Instability,bloodloss,jointinvolvementorvasculardamageassociatedwithpelvicfractures• Cardiacarrestassociatedwithasphyxiaordrowning
uNCONFIRMED INJuRIES
Injuries should only be recorded when the diagnosis is confirmed.Never record possible, probable or suspected injuries.
rAdioloGY rePorTs And PosT-MorTeMs
The user should paste a radiology report into the relevant imaging section of any electronic data collection and reporting (EDCR) submission.
When a report is pasted into an EDCR submission, it will automatically appear on the AIS coding section, thus ensuring that the TARN coder has all the information in front of them before assigning AIS codes.
Post mortem results should be used whenever available even if this results in a delay in dispatching your submission.
All injury coding using AIS is done centrally at TARN, but users can see every AIS code issued by TARN by clicking into the AIS coding section once a submission has been approved.
Accurate and detailed injury descriptions will enable a more precise Injury Severity Score and therefore a more accurate Probability of Survival calculation.
NOCA NATIONAL OFFICE OF CLINICAL AUDIT98
ANATOMICAL INJuRY DESCRIPTIONS

CODING STRuCTuRE EXPLAINED
BODY TYPE OF SPECIFIC SPECIFIC LEVEL LEVEL AIS REGION ANATOMICAL ANATOMICAL ANATOMICAL STRuCTuRE STRuCTuRE STRuCTuRE 4 5 0 2 0 2 2
All existing codes on the TARN database that were coded with AIS98 (previous version of Dictionary) were successfully mapped to corresponding AIS2005 codes, so continuing comparisons can be made.
BACKGROuND INFORMATION
A.I.S. was first published in 1969 by the Association for the Advancement of Automotive Medicine (A.A.A.M.). The latest edition (AIS2005) is now available from the AAAM website: www.AAAM..org at cost of $250 per dictionary.
STRuCTuRE
• Basedonanatomicalinjury.• AsingleAISscoreforeachinjury.• Morethan1500injurieslisted.• Scoresrangefrom1to6,thehigherthescorethemoreseveretheinjury.• Theintervalsbetweenthescoresarenotalwaysconsistente.g.thedifferencebetweenAIS3andAIS4isnot
necessarily the same as the difference between AIS1 and AIS2.
EXAMPLE AIS CODES
INJuRY NuMERICAL IDENTIFIER AIS SEVERITYFracture 1 rib 450201 1 MinorFractured 2 ribs 450202 2 ModerateHaemopneumothorax 442205 3 SeriousBilateral lung lacerations 441450 4 SevereBilateralflailchest 450214 5 CriticalMassive chest crush 413000 6 Maximum
MAJOR TRAuMA AuDIT NATIONAL REPORT 2016 99
ABBREVIATED INJuRY SCALE (AIS)

NOCA NATIONAL OFFICE OF CLINICAL AUDIT100
AIS
Charlson Comorbidity Index (CCI)
Data Completeness
Data Accreditation
Direct admissions
ED
GCS
HIPE
Individual TARN submissions/ patients
IPMS
IQR (interquartile range)
ISS
‘Low falls’
Major Trauma Centre
Mean
Median
MTA
Multidisciplinary
Abbreviated Injury Scale score. A value between 1 (minor) and 6 (very severe) can be assigned to each injury. TARN currently uses the AIS 2005 system Association for the Advancement of Automotive Medicine (2005).
The Charlson Comorbidity Index predicts the one-year mortality for a patient who may have a range of comorbid conditions, such as heart disease, AIDS, or cancer (a total of 22 conditions). Each condition is assigned a score of 1, 2, 3, or 6, depending on the risk of dying associated with each one.
Also known as case ascertainment; meaning the number of cases eligible for inclusion in the audit with data captured.
The quantity of data entered per individual case.
Describes care in the first treating hospital.
Emergency Department
Glasgow Coma Scale (a measure of the level of consciousness)
Hospital In-Patient Enquiry
Individual TARN submissions are those where there is no transfer between hospitals and where transfers have been matched by TARN.
In-Patient Management System
Range of values within a selection of data excluding the top 25% and bottom 25%. This filters out unusually high and unusually low values and shows where the most significant values in the data range are concentrated.
Injury Severity Score. A score ranging from 1, indicating minor injuries to 75, indicating very severe injuries that are very likely to result in death. An ISS between 9 and 15 is considered moderate. An ISS of 16 or more is considered severe. ISS is calculated using the Abbreviated Injury Scale (AIS).
Falls of 2 metres and less
A Major Trauma Centre (MTC) is a multi-specialty hospital, on a singlesite, optimised for the provision of trauma care. It is the focus of the trauma network and manages all types of injuries, providing consultant-level care NHS Clinical Advisory Groups Report (UK) (2010).
This value is determined by adding all the data points in a population and then dividing the total by the number of points. The resulting number is known as the mean or the average.
The middle value in a range. Less easily distorted by very high or very low values than other aggregation methods, such as the mean.
Major Trauma Audit
A group of people of different professions including medical personnel from potentially multiple specialties i.e. emergency medicine, orthopaedics, cardiothoracics etc, nursing, physiotherapist, occupational therapists, other allied healthcare professionals with job plan responsibilities for the assessment and treatment of major trauma patients, and who convene (including face to face or virtually) collaboratively to discuss patient treatment and care and plan shared clinical care goals.
APPENDIX 2: GLOSSARy

MAJOR TRAuMA AuDIT NATIONAL REPORT 2016 101
NCEC
NICE
PCR
PHECC
PROMS
TARN
TBI
Trauma unit
Ws
National Clinical Effectiveness Committee
National Institute for Health and Care Excellence. This organisation sets standards for patient care including for severe head injury, trauma service delivery.
Patient Care Record
The Pre-Hospital Emergency Care Council (PHECC) maintains a statutory register of all pre-hospital emergency care practitioners, such as paramedics and advanced paramedics, who meet their standards.
Patient Reported Outcome Measures
Trauma Audit and Research Network
Traumatic brain injury
A trauma unit (TU) is a hospital in a trauma network that provides care for most injured patients (NHS Clinical Advisory Groups Report (UK)(2010).
A measure of excess deaths or survivors (W) standardised according to hospital case mix using the TARN fraction. A hospital with the same case mix as the overall TARN population will have identical W and Ws values. A hospital whose case mix differs from the overall TARN population will have different W and Ws values.

NOCA NATIONAL OFFICE OF CLINICAL AUDIT100 NOCA NATIONAL OFFICE OF CLINICAL AUDIT102
ROLE NAME
National Board for Ireland of the College of Emergency Medicine (Clinical Lead and Chair of MTA Governance Committee) Dr Conor Deasy
Royal College of Surgeons in Ireland - Neurosurgery Programme Mr David Alcutt1
NOCA IHFD and MTA Coordinator Ms Louise Brent
Irish Association for Emergency Medicine Dr Tomás Breslin
Emergency Medicine Nursing Interest Group Ms Ann Calvert
Royal College of Surgeons in Ireland - Neurosurgery Programme Mr Darach Crimmins
NOCA Head of Quality & Development Ms Marina Cronin
National Ambulance Service Mr Vincent Daly
HSE National Clinical Programme for Older People Dr Rachael Doyle
Data manager with Trauma Audit experience Ms Anna Duffy
Senior Accountable Health Manager Mr Gordon Dunne
Pre-Hospital Emergency Care Council Ms Jacqueline Egan
Public Representative - Patient Focus Ms Orlaith Ferguson
Royal College of Physicians Ireland - Pathology Dr Joan Fitzgerald
National Emergency Medicine Programme Lead Dr Una Geary
Royal College of Physicians Ireland - Pathology Dr Patrick Hayden1
Irish Association for Emergency Medicine Dr Patricia Houlihan1
Hospital HIPE Manager Ms Nora Hourigan
Royal College of Surgeons in Ireland - General Surgery Mr Dara Kavanagh
Irish Committee for Emergency Medicine Training Chair / Nominee Dr Gerry Lane
National Emergency Medicine Programme Nominee for MTA Dr George Little
Royal College of Surgeons in Ireland - Faculty of Radiologists Dr Peter MacMahon
Paediatric Emergency Medicine Dr Ciara Martin
Royal College of Physicians Ireland - Public Health Dr Caroline Mason Mohan
Emergency Medicine Nursing Interest Group Ms Fiona McDaid1
Royal College of Physicians Ireland - Rehabilitation Medicine Dr Jacinta McElligott
Royal College of Surgeons in Ireland - Irish Association of Vascular Surgeons Mr Morgan McMonagle
Royal College of Surgeons in Ireland - General Surgery Mr Ken Mealy1
Joint Faculty of Intensive Care Medicine of Ireland Nominee - Critical Care Dr Jeanne Moriarty
Irish Institute of Trauma and Orthopaedic Surgeons - Trauma and Orthopaedic Programme Mr Brendan O’Daly
Data manager with HIPE experience Mr Des O’Toole
Therapy Representative Ms Rosie Quinn
HSE Office of Nursing and Midwifery Services Ms Geraldine Shaw
NOCA Executive Director Ms Collette Tully
Patient / Public Representative Awaiting Nomination
Irish Association of Plastic Surgeons Awaiting Nomination1 Resigned from the MTA Governance Committee during 2016/2017.
NOCA wish to acknowledge the contribution and support of the members of the MTA Governance Committee.
APPENDIX 3: MTA GOVERNANCE COMMITTEE

MAJOR TRAuMA AuDIT NATIONAL REPORT 2015-2016 101MAJOR TRAuMA AuDIT NATIONAL REPORT 2016 103
APPENDIX 4: FREQUENCy TABLES
FIGuRE 1: COMPLETENESS PERCENTAGES PER HOSPITAL
Hospital N %D 414 99%A 151 99%C 138 99%H 146 98%B 255 98%R 453 98%K 423 98%T 103 98%W 114 98%O 295 98%N 34 97%E 92 97%X 188 97%S 50 96%Z 64 96%L 338 96%y 26 96%V 52 95%I 429 95%P 334 95%M 359 94%J 309 94%G 107 93%F 68 92%Q 25 92%U 121 87%Ireland 5,088 96%
FIGuRE 2: DATA ACCREDITATION PERCENTAGES PER HOSPITAL
Key Data fields N %Pre-existing conditions 5,088 100Arrival time 5,088 100Operation details 2,158 99CT details 3,444 99Doctors in the ED 4,645 97Glasgow Coma Scale (GCS) 5,070 97Injury detail 5,088 96Transfer details 1,987 96Pupil reactivity 1,264 93Incident/ 999 call details 5,088 89National mean accreditation 97
FIGuRE 3: DATA ACCREDITATION BY KEY DATAFIELDS
Hospital N %A 151 100%B 255 100%C 138 100%D 414 97%E 92 97%F 68 87%G 107 87%H 146 84%I 429 83%J 309 79%K 423 76%L 338 74%M 359 73%
N 34 72%O 295 71%P 334 71%Q 25 69%R 453 65%S 50 64%T 103 61%U 121 58%V 52 55%W 114 54%X 188 48%y 26 38%Z 64 36%Ireland 5,088 74%

NOCA NATIONAL OFFICE OF CLINICAL AUDIT104
Gender N %Female 1,843 41.64Male 2,583 58.36Total 4,426 100.0
FIGuRE 4: GENDER BREAKDOWN OF MAJOR TRAuMA PATIENTS
Charlson score N %1 - 5 1,623 36.676 - 10 429 9.69>10 102 2.30No significant PMC 2,246 50.75Not recorded 26 0.59Total 4,426 100.00
FIGuRE 6: CHARLSON COMORBIDITY INDEX SCORES OF MAJOR TRAuMA PATIENTS
Age 1-5 6-10 >10 No significant PMC Total <15 6.57 0.00 0.00 93.43 100.00 15-24 13.67 0.25 0.00 86.08 100.00 25-34 20.00 0.67 0.22 79.11 100.00 35-44 29.10 2.49 1.49 66.92 100.00 45-54 38.99 3.98 2.31 54.72 100.00 55-64 40.60 9.04 3.59 46.77 100.00 65-74 48.37 14.54 1.96 35.13 100.00 75-84 49.64 21.54 3.99 24.82 100.00 85+ 51.88 20.53 4.19 23.40 100.00 Total 36.89 9.75 2.32 51.05 100.00
FIGuRE 6A: COMORBIDITIES OF MAJOR TRAuMA PATIENTS BY AGE BAND
Age Female Male Total <15 36.99 63.01 100.00 15-24 22.78 77.22 100.00 25-34 22.47 77.53 100.00 35-44 17.49 82.51 100.00 45-54 30.23 69.77 100.00 55-64 45.49 54.51 100.00 65-74 47.06 52.94 100.00 75-84 59.89 40.11 100.00 85+ 71.65 28.35 100.00 Total 41.64 58.36 100.00
FIGuRE 5: GENDER BREAKDOWN OF MAJOR TRAuMA PATIENTS BY AGE BAND
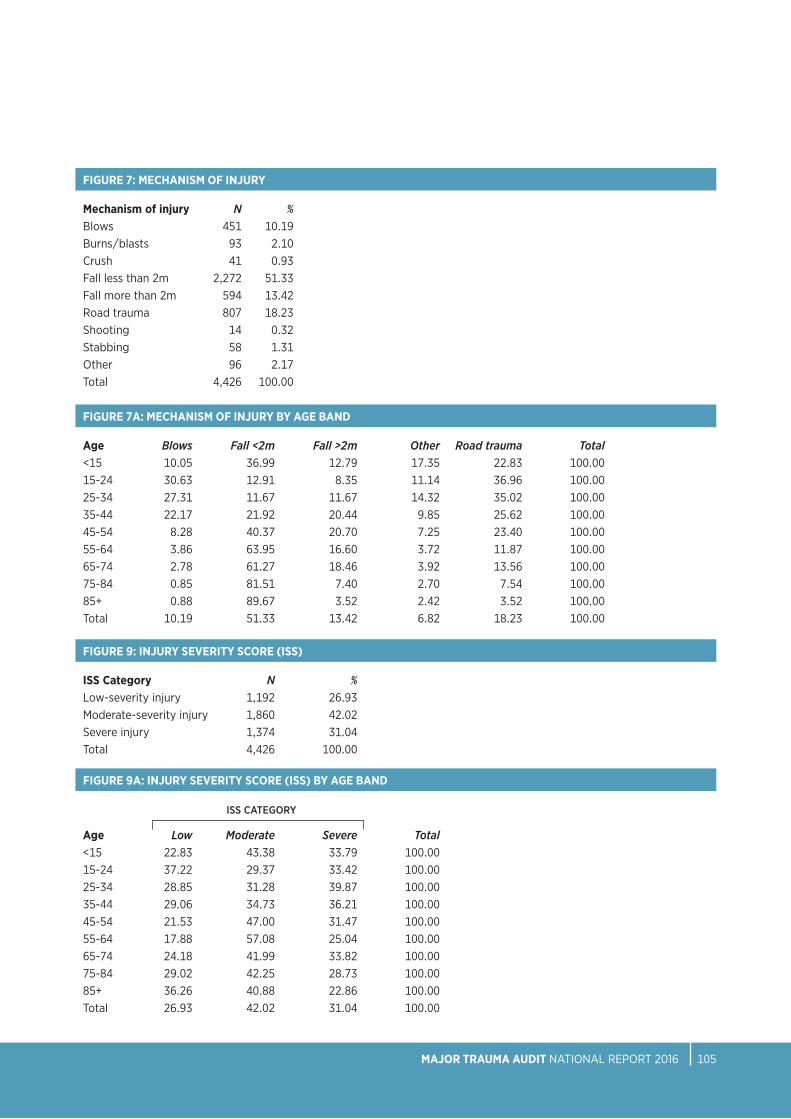
MAJOR TRAuMA AuDIT NATIONAL REPORT 2016 105
FIGuRE 7A: MECHANISM OF INJuRY BY AGE BAND
Age Blows Fall <2m Fall >2m Other Road trauma Total<15 10.05 36.99 12.79 17.35 22.83 100.00 15-24 30.63 12.91 8.35 11.14 36.96 100.00 25-34 27.31 11.67 11.67 14.32 35.02 100.00 35-44 22.17 21.92 20.44 9.85 25.62 100.0045-54 8.28 40.37 20.70 7.25 23.40 100.0055-64 3.86 63.95 16.60 3.72 11.87 100.0065-74 2.78 61.27 18.46 3.92 13.56 100.0075-84 0.85 81.51 7.40 2.70 7.54 100.0085+ 0.88 89.67 3.52 2.42 3.52 100.00 Total 10.19 51.33 13.42 6.82 18.23 100.00
FIGuRE 9: INJuRY SEVERITY SCORE (ISS)
ISS Category N %Low-severity injury 1,192 26.93Moderate-severity injury 1,860 42.02Severe injury 1,374 31.04Total 4,426 100.00
FIGuRE 9A: INJuRY SEVERITY SCORE (ISS) BY AGE BAND
Age Low Moderate Severe Total<15 22.83 43.38 33.79 100.00 15-24 37.22 29.37 33.42 100.00 25-34 28.85 31.28 39.87 100.00 35-44 29.06 34.73 36.21 100.00 45-54 21.53 47.00 31.47 100.00 55-64 17.88 57.08 25.04 100.00 65-74 24.18 41.99 33.82 100.00 75-84 29.02 42.25 28.73 100.00 85+ 36.26 40.88 22.86 100.00 Total 26.93 42.02 31.04 100.00
ISS CATEGORY
Mechanism of injury N %Blows 451 10.19Burns/blasts 93 2.10Crush 41 0.93Fall less than 2m 2,272 51.33Fall more than 2m 594 13.42Road trauma 807 18.23Shooting 14 0.32Stabbing 58 1.31Other 96 2.17Total 4,426 100.00
FIGuRE 7: MECHANISM OF INJuRY

NOCA NATIONAL OFFICE OF CLINICAL AUDIT106
FIGuRE 10A: PLACE OF INJuRY BY AGE BAND
Age Farm Home Institution Other Public area Total /road<15 1.37 50.68 1.37 2.28 44.29 100.00 15-24 4.05 13.92 0.76 6.58 74.68 100.00 25-34 2.64 15.42 1.10 12.56 68.28 100.00 35-44 5.42 26.60 2.22 12.81 52.96 100.00 45-54 5.59 37.27 1.45 9.52 46.17 100.00 55-64 4.58 52.07 2.58 8.30 32.47 100.00 65-74 4.90 59.80 2.61 5.72 26.96 100.00 75-84 1.56 72.26 6.12 2.42 17.64 100.00 85+ 0.88 69.23 14.95 2.20 12.75 100.00 Total 3.55 46.93 3.89 6.91 38.73 100.00
PLACE OF INjURY
FIGuRE 10B: PLACE OF INJuRY BY ISS GROuP
Place of injury Low Moderate Severe TotalFarm 22.93 45.86 31.21 100.00Home 26.34 47.33 26.34 100.00Industrial 23.81 38.10 38.10 100.00Institution 22.09 43.02 34.88 100.00Public area and road 28.65 35.88 35.47 100.00Total 26.93 42.25 30.83 100.00
ISS CATEGORY
FIGuRE 11: TYPE OF ROAD TRAuMA
Vehicle position N %Car 407 50.43Cyclist 160 19.83Motorcycle 105 13.01Pedestrian 125 15.49Not known 10 1.24Total 807 100.00
FIGuRE 10: PLACE OF INJuRY
Place of injury N %Farm 157 3.55Home 2,077 46.93Industrial 84 1.90Institution 172 3.89Public area and road 1,714 38.73Other 222 5.02Total 4,426 100.00

MAJOR TRAuMA AuDIT NATIONAL REPORT 2016 107
FIGuRE 11B: TYPE OF ROAD TRAuMA BY ISS GROuP
Vehicle position Low Moderate Severe TotalCar 23.83 32.92 43.24 100.00Cyclist 26.88 44.38 28.75 100.00Motorcycle 16.19 47.62 36.19 100.00Pedestrian 21.60 22.40 56.00 100.00Total 23.09 35.51 41.41 100.00
ISS CATEGORY
FIGuRE 12: INJuRIES AT HOME BY GENDER
Gender N %Female 1,131 54.45Male 946 45.55Total 2,077 100.00
FIGuRE 11A: POSITION IN VEHICLE OF THOSE INVOLVED IN CAR ACCIDENTS
Vehicle position N %Driver 271 66.58 Front-seat passenger 70 17.20 Back-seat passenger 48 11.79 Position not known 18 4.42 Total 407 100.00
Age Male Female Total <15 63.96 36.04 100.00 15-24 76.36 23.64 100.00 25-34 74.29 25.71 100.00 35-44 75.93 24.07 100.00 45-54 61.11 38.89 100.00 55-64 43.13 56.87 100.00 65-74 47.81 52.19 100.00 75-84 34.84 65.16 100.00 85+ 25.40 74.60 100.00 Total 45.55 54.45 100.00
FIGuRE 12A: INJuRIES AT HOME BY GENDER AND AGE BAND

NOCA NATIONAL OFFICE OF CLINICAL AUDIT108
FIGuRE 14: INJuRIES SuSTAINED AT HOME BY ISS
ISS category N %Low-severity injury 547 26.34Moderate-severity injury 983 47.33Severe injury 547 26.34Total 2,077 100.00
FIGuRE 12B: INJuRIES AT HOME BY MECHANISM OF INJuRY
Mechanism N %Blow(s) 52 2.50Burn 77 3.71Fall less than 2m 1,501 72.27Fall more than 2m 360 17.33Other 65 3.13Stabbing 22 1.06Total 2,077 100.00
FIGuRE 13: INJuRIES AT HOME BY CHARLSON COMORBIDITY INDEX SCORE
Charlson Comorbidity Index Score N %1 - 5 937 45.116 - 10 278 13.38>10 65 3.13No significant PMC 788 37.94Not known 9 0.43Total 2,077 100.00
Age No significant PMC 1-5 6-10 >10 Total <15 91.59 8.41 0.00 0.00 100.00 15-24 72.73 27.27 0.00 0.00 100.00 25-34 65.22 31.88 1.45 1.45 100.00 35-44 59.26 36.11 4.63 0.00 100.00 45-54 41.90 47.49 5.59 5.03 100.00 55-64 41.76 44.51 8.79 4.95 100.00 65-74 30.60 51.37 15.85 2.19 100.00 75-84 25.69 50.00 21.74 2.57 100.00 85+ 22.93 52.23 19.75 5.10 100.00 Total 38.10 45.31 13.44 3.14 100.00
FIGuRE 13A: INJuRIES AT HOME BY CHARLSON COMORBIDITY INDEX SCORE AND AGE BAND

MAJOR TRAuMA AuDIT NATIONAL REPORT 2016 109
FIGuRE 16A: HEAD INJuRY SEVERITY BY AGE BAND AND GCS
Age 13-15 9-12 <9 Total <15 64.06 14.06 21.88 100.00 15-24 69.14 7.41 23.46 100.00 25-34 61.16 14.88 23.97 100.00 35-44 67.02 14.89 18.09 100.00 45-54 69.79 10.42 19.79 100.00 55-64 80.83 10.83 8.33 100.00 65-74 78.26 6.83 14.91 100.00 75-84 83.53 7.65 8.82 100.00 85+ 88.17 3.23 8.60 100.00 Total 74.80 9.70 15.50 100.00
GCS CATEGORY
FIGuRE 15: INJuRIES AT HOME BY MORTALITY
Outcome n %Alive 1,973 95.04Dead 104 4.96Total 2,077 100.00
FIGuRE 16: HEAD INJuRY SEVERITY (AIS 3+)
GCS category N %GCS 13-15 748 74.80GCS 9-12 97 9.7GCS 3-8 155 15.50Total 1,000 100.00
FIGuRE 14A: INJuRIES SuSTAINED AT HOME BY ISS AND AGE BAND
Age Low Moderate Severe Total<15 27.03 47.75 25.23 100.00 15-24 27.27 23.64 49.09 100.00 25-34 21.43 35.71 42.86 100.00 35-44 29.63 35.19 35.19 100.00 45-54 18.89 53.33 27.78 100.00 55-64 16.48 64.56 18.96 100.00 65-74 24.04 43.17 32.79 100.00 75-84 29.33 46.26 24.41 100.00 85+ 39.37 41.27 19.37 100.00 Total 26.34 47.33 26.34 100.00
ISS CATEGORY

NOCA NATIONAL OFFICE OF CLINICAL AUDIT110
FiGUre 18: MosT senior Pre-HosPiTAl HeAlTHCAre ProFessionAl
Most senior pre-hospital healthcare professional N %Advanced paramedic 760 32.80 Doctor 17 0.73 Other 5 0.22 Paramedic 1,278 55.16 Not known 257 11.09 Total 2,317 100.00
FIGuRE 16B: CAuSE OF INJuRY IN PATIENTS WITH SEVERE TBI
Mechanism of injury N %Alleged assault 18 11.61Fall less than 2m 40 25.81Fall more than 2m 39 25.16Road trauma 58 37.42Total 155 100.00
FIGuRE 16C: CAuSE OF INJuRY IN PATIENTS WITH SEVERE TBI BY AGE BAND
Age Alleged Fall Fall Road Total assault <2m >2m trauma<15 0.00 0.00 35.71 64.29 100.00 15-24 15.79 5.26 5.26 73.68 100.00 25-34 31.03 10.34 10.34 48.28 100.00 35-44 17.65 11.76 29.41 41.18 100.00 45-54 5.26 26.32 36.84 31.58 100.00 55-64 0.00 50.00 40.00 10.00 100.00 65-74 4.17 29.17 45.83 20.83 100.00 75-84 0.00 80.00 20.00 0.00 100.00 85+ 12.50 62.50 0.00 25.00 100.00 Total 11.61 25.81 25.16 37.42 100.00
MECHANISM OF INjURY
FIGuRE 17: MODE OF ARRIVAL TO HOSPITAL
Mode of arrival N %Ambulance 2,263 70.85 Ambulance and helicopter 29 0.91 Car 400 12.52 Helicopter 25 0.78 Not applicable 24 0.75 Other 18 0.56 Walking 69 2.16 Not known 366 11.46 Total 3,194 100.00

MAJOR TRAuMA AuDIT NATIONAL REPORT 2016 111
FIGuRE 21: PRESENTATION BY TIME OF DAY
TIme of day N % Cumulative00 112 2.54 2.5401 126 2.86 5.4002 102 2.31 7.7103 94 2.13 9.8404 106 2.40 12.2505 75 1.70 13.9506 72 1.63 15.5807 68 1.54 17.12
08 107 2.43 19.5509 171 3.88 23.4310 210 4.76 28.1911 264 5.99 34.1812 281 6.37 40.5513 279 6.33 46.8814 260 5.90 52.7815 292 6.62 59.40
16 251 5.69 65.0917 240 5.44 70.5418 264 5.99 76.5319 266 6.03 82.5620 218 4.94 87.5021 208 4.72 92.2222 180 4.08 96.3023 163 3.70 100.00
Total 4,409 100.00
FIGuRE 20: CARE PATHWAY OF PATIENTS WITH TBI
Transfer type N %Direct admission to neurosurgical centre 111 11Transfer to neurosurgical centre 245 25Not transferred to neurosurgical centre 644 64Total 1,000 100.00
FIGuRE 20A: SEVERE TBI AND ADMISSIONS TO A NEuROSuRGICAL uNIT
Transfer type N %Direct admission to neurosurgical centre 17 11Transfer to neurosurgical centre 68 44Not transferred to neurosurgical centre 70 45Total 155 100.00
FIGuRE 19: PATIENTS TRANSFERRED TO ANOTHER HOSPITAL
Transfer type N %No transfer 3,194 72.16Transfer 1,232 27.83Total 4,426 100.00

NOCA NATIONAL OFFICE OF CLINICAL AUDIT112
FIGuRE 23: RECEPTION BY A TRAuMA TEAM BY AGE BAND
Age N %<15 16 5.90 15-24 31 11.44 25-34 40 14.76 35-44 31 11.44 45-54 37 13.65 55-64 31 11.44 65-74 28 10.33 75-84 39 14.39 85+ 18 6.64 Total 271 100.00
FIGuRE 24: GRADE OF MOST SENIOR DOCTOR TREATING PATIENT ON ARRIVAL BY AGE BAND
Age Consultant Spec. Reg Registrar SHO Other/No grade Total <15 33.94 19.27 34.86 9.17 2.75 100.00 15-24 22.51 20.35 43.72 8.23 5.19 100.00 25-34 26.33 17.79 42.70 7.47 5.69 100.00 35-44 25.39 17.19 46.09 7.81 3.52 100.00 45-54 23.70 16.18 41.62 13.29 5.20 100.00 55-64 18.95 16.32 44.84 17.64 2.25 100.00 65-74 22.61 15.00 44.35 15.87 2.17 100.00 75-84 20.51 13.50 48.21 15.04 2.74 100.0085+ 18.07 9.67 52.16 15.78 4.33 100.00 Total 22.10 15.37 45.43 13.56 3.54 100.00
MOST SENIOR DOCTOR
FiGUre 22: Pre-AlerT BY AGe BAnd
Age N %<15 10 4.83 15-24 27 13.04 25-34 37 17.87 35-44 25 12.08 45-54 32 15.46 55-64 25 12.08 65-74 26 12.56 75-84 16 7.73 85+ 9 4.35 Total 207 100.00

MAJOR TRAuMA AuDIT NATIONAL REPORT 2016 113
FIGuRE 26: MEDIAN TIME (IN HOuRS) TO SuRGERY FOR PATIENTS HAVING SuRGICAL INTERVENTION BY BODY AREA
Operation type MedianAbdomen 6.6Face 72.2General 19.0Head and brain 18.8Limbs 25.4Skin/soft tissue 26.0Spine 90.5Thoracic 65.2Total 28.1
FIGuRE 27: PERCENTAGE OF SuRGERY WITHIN 24, 48 AND 72 HOuRS
Cumulative Time N %24 hours 520 4448 hours 795 6772 hours 936 78
FIGuRE 28: AIRWAY MANAGEMENT OF PATIENTS WITH GCS <9
Airway management N %No intubation 3 2Intubated- ED 89 68Intubated- pre-hospital 1 1Intubated both at ED 13 10and pre-hospitalNot known 24 18Total 130 100
FIGuRE 25: SuRGICAL INTERVENTION BY BODY REGION
Operation type N %Abdomen 59 4.84 Face 110 9.02 General 22 1.80 Head and brain 19 1.56 Limbs 847 69.48 Skin/soft tissue 90 7.38 Spine 52 4.27 Thoracic 20 1.64Total 1,219 100.00

NOCA NATIONAL OFFICE OF CLINICAL AUDIT114
FIGuRE 32: MORTALITY BY AGE BAND
Age N % <15 4 2.07 15-24 13 6.74 25-34 15 7.77 35-44 5 2.59 45-54 14 7.25 55-64 17 8.81 65-74 31 16.06 75-84 47 24.35 85+ 47 24.35 Total 193 100.00
FIGuRE 33: MORTALITY BY GENDER AND AGE BAND
Age Female Male Total<34 25.00 75.00 100.00 35-64 33.33 66.67 100.00 65+ 50.40 49.60 100.00 Total 43.01 56.99 100.00
FIGuRE 31: HOSPITAL LENGTH OF STAY FOR MAJOR TRAuMA PATIENTS BY AGE BAND
Age Median LOS<15 515-24 625-34 635-44 845-54 755-64 865-74 1075-84 1385+ 13Total 9
FIGuRE 29: SuRVIVAL OF SHOCKED PATIENTS
Outcome N % Alive 271 95.09Dead 14 4.91Total 285 100.00
FIGuRE 30: TIME TO CT SCAN WITHIN ONE HOuR
N %yes 82 32.67No 169 67.33Total 251 100.00

MAJOR TRAuMA AuDIT NATIONAL REPORT 2016 115
FIGuRE 34A: MORTALITY BY MECHANISM OF INJuRY BY AGE BAND
Age Fall <2m Fall >2m Other Road trauma Total<34 0.00 3.13 56.25 40.63 100.00 35-64 30.56 25.00 30.56 13.89 100.00 65+ 76.00 8.80 5.60 9.60 100.00 Total 54.92 10.88 18.65 15.54 100.00
FIGuRE 35: MORTALITY BY ISS BAND
ISS N % Low 11 6Moderate 31 16Severe 151 78Total 193 100
FIGuRE 34: MORTALITY BY MECHANISM OF INJuRY
Cause of Injury N % Fall less than 2m 106 55Fall more than 2m 21 11Road trauma 30 16Other 36 19Total 193 100
FIGuRE 36: MAJOR TRAuMA DEATHS BY BODY AREA INJuRED BY AGE BAND
Age Chest Head Limbs Multiple Other Spine Total <34 6.25 28.13 3.13 12.50 50.00 0.00 100.00 35-64 8.33 44.44 11.11 13.89 22.22 0.00 100.00 65+ 5.60 65.60 13.60 4.00 4.80 6.40 100.00 Total 6.22 55.44 11.40 7.25 15.54 4.15 100.00

NOCA NATIONAL OFFICE OF CLINICAL AUDIT116
FIGuRE 37: GLASGOW OuTCOME SCALE BY AGE BAND
Age Good Moderate Severe Death Other/ Not Total Recovery Disability Disability recorded <15 84.47 4.11 2.74 1.83 6.85 100.00 15-24 74.18 10.38 6.08 3.29 6.08 100.00 25-34 71.59 11.23 7.71 3.08 6.39 100.00 35-44 66.50 15.76 10.84 1.23 5.67 100.00 45-54 68.94 15.11 7.25 3.31 5.38 100.00 55-64 62.52 23.46 6.87 2.58 4.58 100.00 65-74 54.74 24.84 8.01 5.23 7.19 100.00 75-84 48.93 30.16 5.41 7.97 7.54 100.00 85+ 43.30 33.63 6.15 11.65 5.27 100.00 Total 61.43 20.76 6.94 4.77 6.10 100.00
GOS CATEGORY
FIGuRE 37A: GLASGOW OuTCOME SCALE IN PATIENTS WITH HEAD INJuRY BY AGE BAND
Age Good Moderate Severe Death Other/ Not Total Recovery Disability Disability recorded <15 82.28 3.80 2.53 3.80 7.59 100.00 15-24 69.07 7.22 13.40 2.06 8.25 100.00 25-34 60.77 7.69 16.15 5.38 10.00 100.00 35-44 50.89 20.54 17.86 0.89 9.82 100.00 45-54 60.75 11.21 13.08 5.61 9.35 100.00 55-64 54.55 16.08 11.89 9.09 8.39 100.00 65-74 54.30 14.52 9.14 13.44 8.60 100.00 75-84 42.86 18.88 8.16 20.41 9.69 100.00 85+ 37.84 24.32 9.01 25.23 3.60 100.00 Total 54.95 14.56 11.20 10.77 8.53 100.00
GOS CATEGORY
FIGuRE 37B: GLASGOW OuTCOME SCALE IN PATIENTS WITH ISS>15 BY AGE BAND
Age Good Moderate Severe Death Other/ Not Total Recovery Disability Disability recorded <15 81.08 5.41 2.70 5.41 5.41 100.00 15-24 56.06 9.85 15.91 9.09 9.09 100.00 25-34 59.12 8.84 16.02 7.73 8.29 100.00 35-44 49.66 13.61 23.81 3.40 9.52 100.00 45-54 57.24 10.53 14.47 10.53 7.24 100.00 55-64 57.71 11.43 14.86 8.00 8.00 100.00 65-74 50.24 17.39 12.56 12.08 7.73 100.00 75-84 45.54 18.32 8.42 20.30 7.43 100.00 85+ 32.69 25.96 8.65 28.85 3.85 100.00 Total 53.28 13.76 13.61 11.72 7.64 100.00
GOS CATEGORY

MAJOR TRAuMA AuDIT NATIONAL REPORT 2016 117
FIGuRE 38: DISCHARGE DESTINATION
Discharge destination N %Home 2,732 61.73 Other acute hospital 554 12.52 Nursing Home 475 10.73 Rehabilitation 353 7.98 Mortuary 193 4.36 Other institution 87 1.97 Total 4,426 100.00
FIGuRE 38A: DISCHARGE DESTINATION BY AGE BAND
Age Home Other Acute Nursing Rehabilitation Mortuary Other Total Hospital Home Institution<15 84.86 11.93 0.00 0.46 1.83 0.92 100.00 15-24 80.36 14.54 0.00 1.02 3.32 0.77 100.00 25-34 77.97 15.20 0.00 2.20 3.08 1.54 100.00 35-44 73.76 18.56 1.49 3.22 1.24 1.73 100.00 45-54 74.69 13.18 1.46 5.65 2.93 2.09 100.00 55-64 65.76 11.37 7.48 10.94 2.45 2.01 100.00 65-74 56.23 14.10 12.95 9.51 5.08 2.13 100.00 75-84 42.11 9.99 23.01 16.06 6.66 2.17 100.00 85+ 29.33 6.67 38.22 11.78 10.44 3.56 100.00 Total 62.18 12.61 10.81 8.03 4.39 1.98 100.00

NOCA NATIONAL OFFICE OF CLINICAL AUDIT118
APPENDIX 5: MEDIAN TIME TO SURGERy By BODy REGION AND AGE BAND
TABL
E 10
: MED
IAN
TIM
E TO
Su
RGER
Y (I
N H
Ou
RS) B
Y BO
DY R
EGIO
N A
ND
AG
E BA
ND
<15
15-2
4
25
-34
35-4
4
45
-54
Body
regi
on
Med
ian
IQR
N
Med
ian
IQR
N
Med
ian
IQR
N
Med
ian
IQR
N
Med
ian
IQR
N
Abd
omen
10
0.9
5.6-
196.
1 2
5.3
2.8-
8.6
13
6.6
4.6-
15
19
3.6
2.8-
5.1
5 5.
8 3.
9-47
.2
4
Face
58
.5
43.8
-73.
2 2
63
45.8
-87.
8 34
68
.8
43.6
-111
27
72
.3
54.5
-149
.1 27
10
3.8
50.7
-144
.4
10
Gen
eral
15
.9
15.9
- 15.
9 1
7 .4
0 .7-
14.1
2 6.
4 6.
4-6.
4 1
8.3
3.3-
128.
5 3
17.9
9 .
7-34
4
Hea
d an
d br
ain
2.1
1 .6-2
.6
2 6 3
.1 12
-191
4
3 9.7
2.
8-5 7
4.9
3 3.
5 1 .5
-5.5
2
3.3
3.3-
3.3
1
Lim
bs
3 5.8
14
.9- 7
0.2
40
29.8
16
. 1-47
.7
3 5
2 6.3
18
.8-4
6.6
5 5
20.1
14. 3
-44
6 7
21.9
16
.5- 3
3.8
113
Skin
/sof
t tiss
ue
54.3
4.
7-85
.8
10
18.9
12
-41.7
15
24
.9
17.9
-45.
7 7
20.6
14
-40.
9 14
51
.5
24.3
-74.
3 9
Spin
e 0
0
0
57
.1 26
.6-6
5.2
5 14
4.7
61.4
-228
2
67.4
20
.2-9
6.5
6 85
.8
67.2
-139
.6
6
Thor
acic
0
0
0
0
0
0
49
.6
4.25
-10
4.6
4 29
8 62
.2-4
86.4
4
177.
7 27
.7-1
91.4
3
55-6
4
65
-74
74-8
4
>8
5
A
ll pa
tient
s
Body
regi
on
Med
ian
IQR
N
Med
ian
IQR
N
Med
ian
IQR
N
Med
ian
IQR
N
Med
ian
IQR
N
Abd
omen
15
.4
3.6-
47
6 8.
1 2.
5-13
.1 4
140.
9 23
.4-2
58.3
2
252.
5 19
7.1-
307.
9 2
6.6
3.6-
24.8
57
Face
92
.6
70.3
-186
.7
5 50
.4
50.4
-50.
4 1
0
0
0
0
0
0
72.2
50
.4-1
11.2
10
6
Gen
eral
19
.1 18
.8-2
2.6
5 36
4.3
364.
3-36
4.3
1 11
0.2
24.7
-263
.9
4 40
9.4
409.
4-40
9.4
1 19
6.
4-95
.9
22
Hea
d an
d br
ain
35.3
10
.4-4
36.8
4
145.
3 14
5.3-
145.
3 1
0
0
0
233.
8 23
3.8-
233.
8 1
18.8
3.
3-14
5.3
18
Lim
bs
25.3
19
-46.
5 23
4 28
.6
19.5
-53.
9 92
28
.9
20.8
-61.7
11
5 27
.1 18
.8-4
8.5
84
25.4
17
.8-4
8.4
835
Skin
/sof
t tiss
ue
24.5
18
.4-4
6.3
14
61.5
14
.2-9
5.4
8 18
2.3
66.7
-20
3.2
5 23
15
.2-1
56.8
4
26
15.5
-71.5
86
Spin
e 68
.1 27
.2-7
8.4
9 11
1 60
.7-1
31.8
9
177.
5 75
.7-2
97.2
12
15
3.9
124-
428.
6 3
91
52.4
-143
.9
52
Thor
acic
4.
7 4.
7-4.
7 1
98.6
13
-459
.1 3
23.8
20
-45.
4 4
0
0
0
65.2
13
-177
.7
19

MAJOR TRAuMA AuDIT NATIONAL REPORT 2016 119
NOTES

NOTES
NOCA NATIONAL OFFICE OF CLINICAL AUDIT120

NOTES
MAJOR TRAuMA AuDIT NATIONAL REPORT 2016 121

NOTES
NOCA NATIONAL OFFICE OF CLINICAL AUDIT122

NOTES
MAJOR TRAuMA AuDIT NATIONAL REPORT 2016 123

+353 1 4028577 [email protected] @noca_irl www.noca.ie