Embed Size (px)
Citation preview
Make the most of your energy
Make the most of your energySM
Add application photo in this area
Need monitoring and control software for your critical application?
PowerLogic® Data Center Offer
Copyright © Schneider Electric 2008. All rights reserved.2
PowerLogic – Who Are We?Over 2 million meters installed ranging from basic power meters to complex PQ/Revenue meters ...
Over 75,000 Ethernet communications interfaces (includes those on the meters); of which, 50% are web-enabled ...
Over 12,000 power monitoring and control systems worldwide ...20 Years of History in metering and monitoringInternational Presence with 3 Base Locations
Grenoble, France,Victoria, British ColumbiaLavergne, Tennessee
Over 1,100 Employees whose sole focus is metering & monitoringHosted software solutions with over 100,000 End Users using our solution for demand response, emissions monitoring, cost allocation and energy efficiency.
Copyright © Schneider Electric 2008. All rights reserved.3
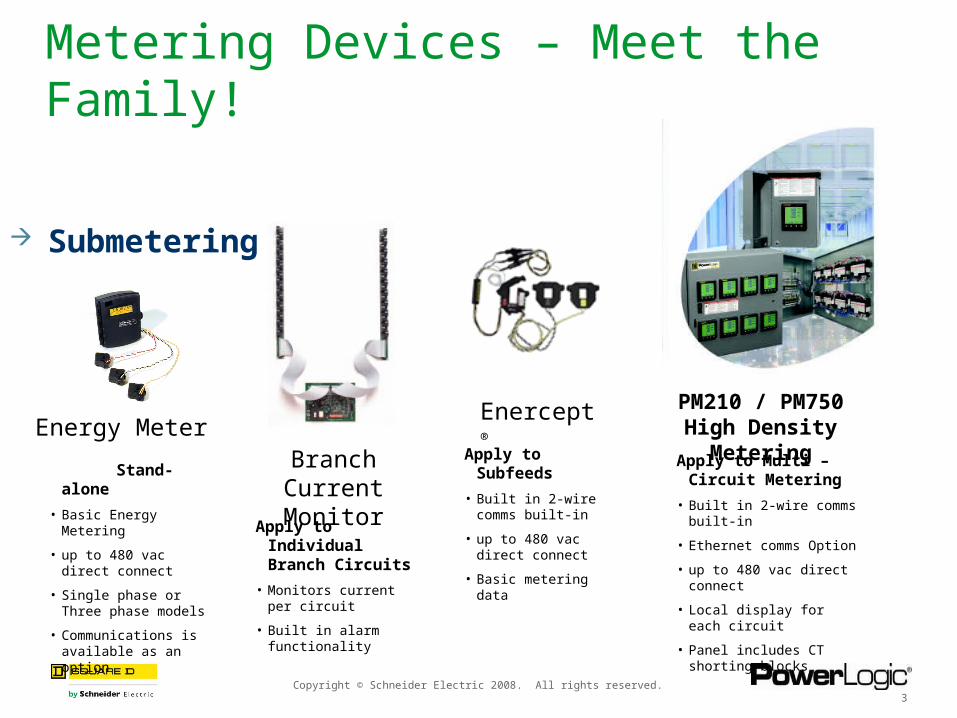
Metering Devices – Meet the Family!
Enercept®
Apply to Subfeeds
• Built in 2-wire comms built-in
• up to 480 vac direct connect
• Basic metering data
Energy Meter
Stand-alone
• Basic Energy Metering
• up to 480 vac direct connect
• Single phase or Three phase models
• Communications is available as an option
PM210 / PM750 High Density Metering
Apply to Multi – Circuit Metering
• Built in 2-wire comms built-in
• Ethernet comms Option
• up to 480 vac direct connect
• Local display for each circuit
• Panel includes CT shorting blocks
Branch Current Monitor
Apply to Individual Branch Circuits
• Monitors current per circuit
• Built in alarm functionality
Submetering
Copyright © Schneider Electric 2008. All rights reserved.4
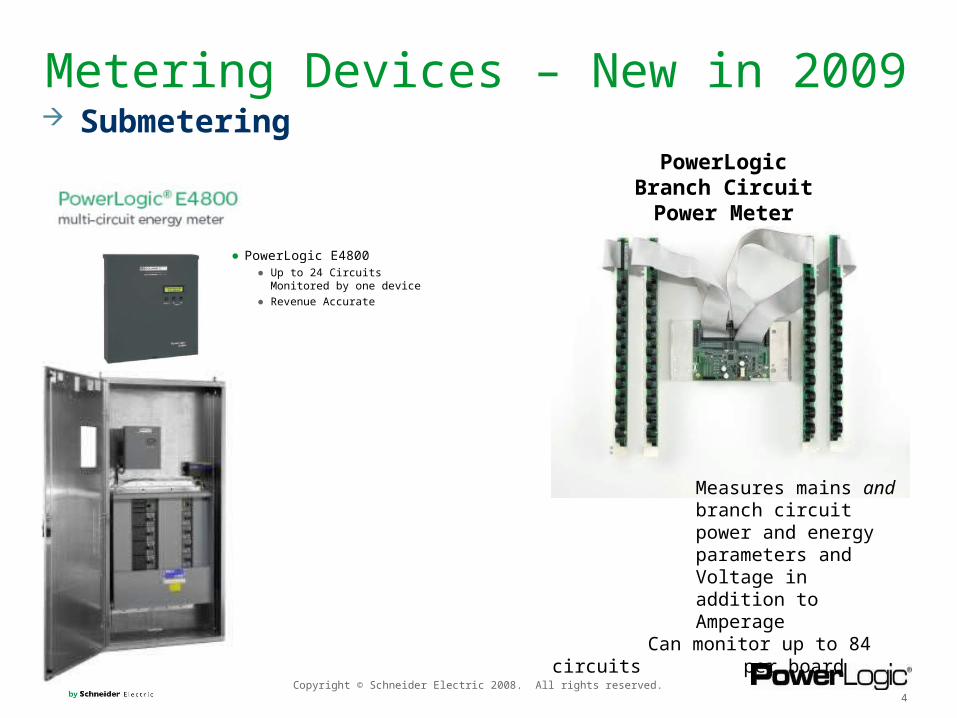
Submetering
Metering Devices – New in 2009
● PowerLogic E4800● Up to 24 Circuits Monitored
by one device● Revenue Accurate
PowerLogic Branch Circuit Power Meter
Measures mains and branch circuit power and energy parameters and Voltage in addition to Amperage
Can monitor up to 84 circuits per board
Copyright © Schneider Electric 2008. All rights reserved.5
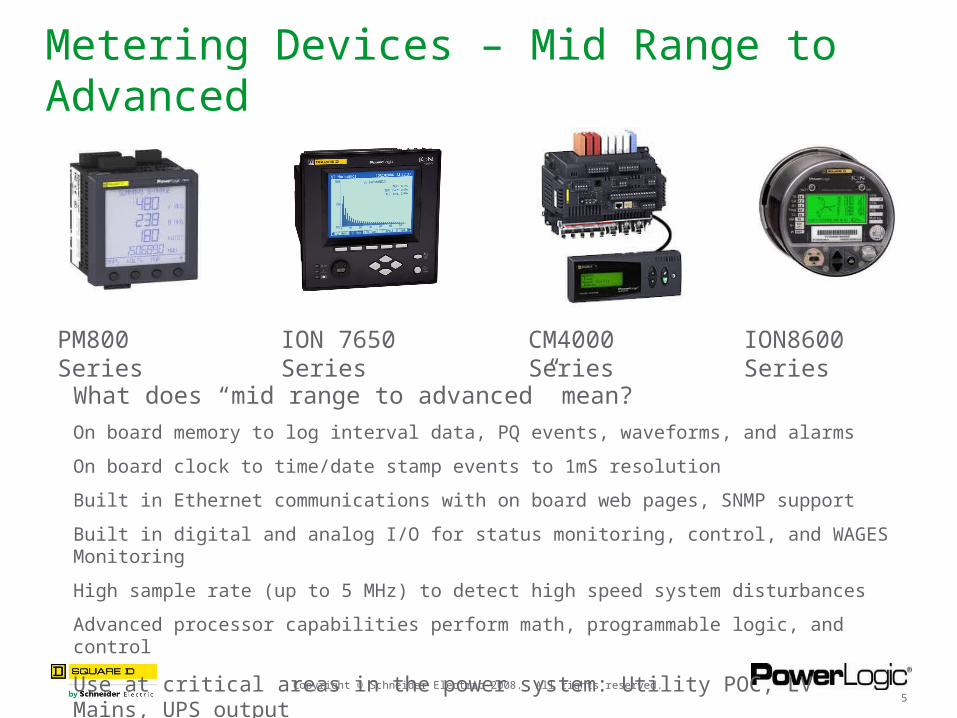
Metering Devices – Mid Range to Advanced
PM800 Series ION 7650 Series CM4000 Series ION8600 Series
What does “mid range to advanced” mean?
On board memory to log interval data, PQ events, waveforms, and alarms
On board clock to time/date stamp events to 1mS resolution
Built in Ethernet communications with on board web pages, SNMP support
Built in digital and analog I/O for status monitoring, control, and WAGES Monitoring
High sample rate (up to 5 MHz) to detect high speed system disturbances
Advanced processor capabilities perform math, programmable logic, and control
Use at critical areas in the power system: Utility POC, LV Mains, UPS output
Copyright © Schneider Electric 2008. All rights reserved.6
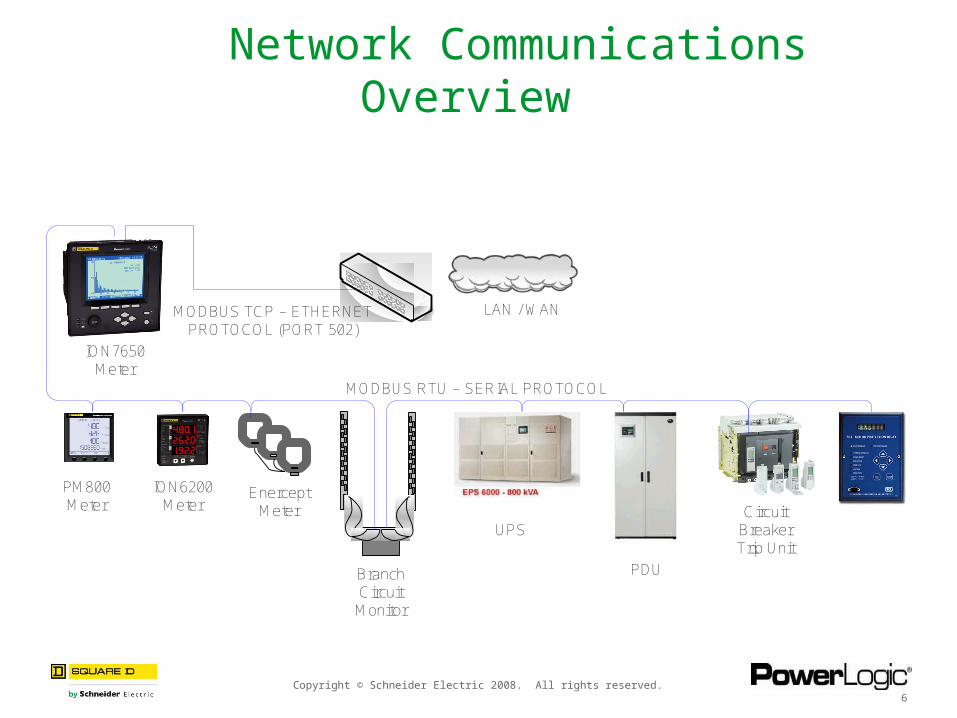
Network Communications Overview
PM800 Meter
ION6200 Meter
Enercept Meter
Branch Circuit Monitor
UPS
PDU
Circuit Breaker Trip Unit
MODBUS RTU – SERIAL PROTOCOL
ION7650 Meter
MODBUS TCP – ETHERNET PROTOCOL (PORT 502)
LAN / WAN
Copyright © Schneider Electric 2008. All rights reserved.7
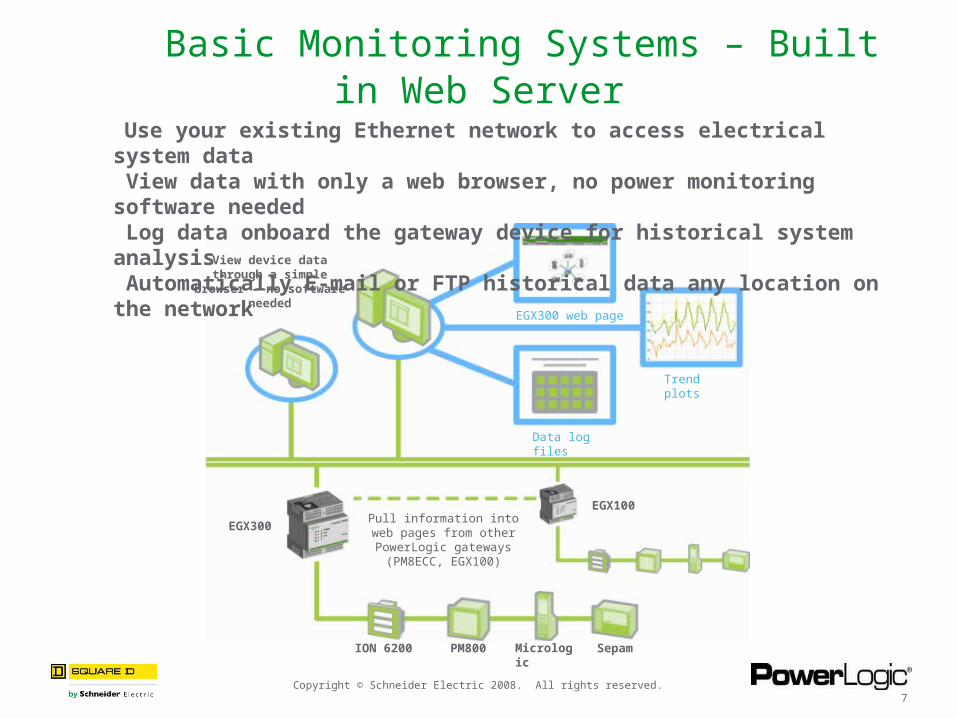
Basic Monitoring Systems – Built in Web Server
View device data through a simple
browser – no software needed
EGX300 web page
Trend plots
Data log files
EGX100
EGX300Pull information into web
pages from other PowerLogic gateways (PM8ECC, EGX100)
ION 6200
PM800 Micrologic
Sepam
Use your existing Ethernet network to access electrical system data View data with only a web browser, no power monitoring software needed Log data onboard the gateway device for historical system analysis Automatically E-mail or FTP historical data any location on the network
Copyright © Schneider Electric 2008. All rights reserved.8
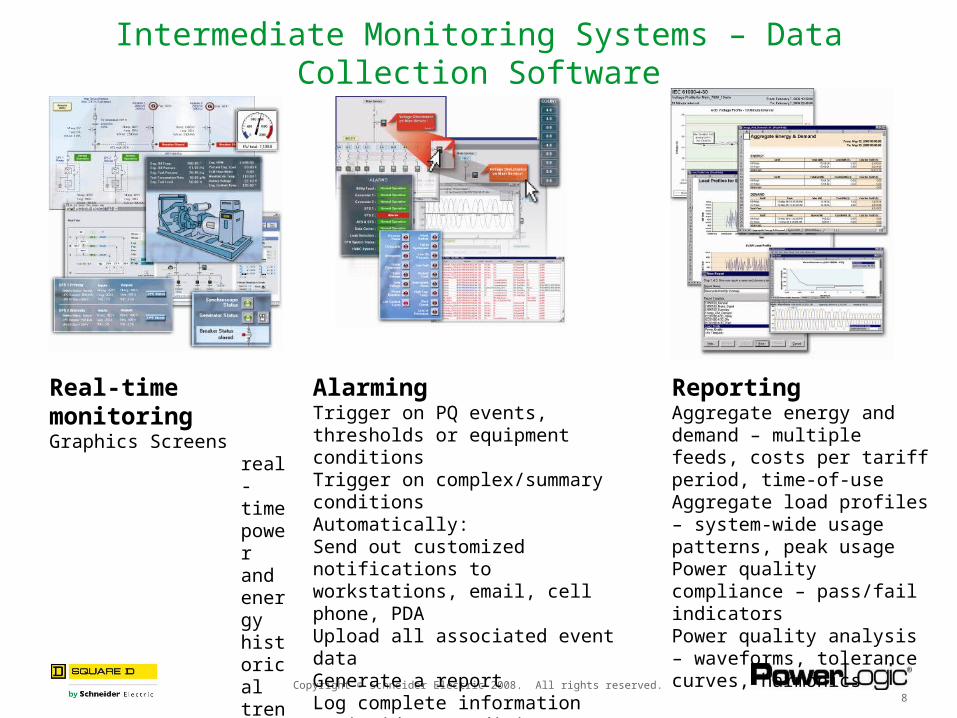
Intermediate Monitoring Systems – Data Collection Software
Real-time monitoringGraphics Screens
real-time power and energyhistorical trends and data logsalarm conditionsequipment statuscontrol triggersanalysis tools
ReportingAggregate energy and demand – multiple feeds, costs per tariff period, time-of-useAggregate load profiles – system-wide usage patterns, peak usagePower quality compliance – pass/fail indicatorsPower quality analysis – waveforms, tolerance curves, harmonics
AlarmingTrigger on PQ events, thresholds or equipment conditionsTrigger on complex/summary conditionsAutomatically: Send out customized notifications to workstations, email, cell phone, PDAUpload all associated event dataGenerate a reportLog complete information (coincident conditions, waveforms, timestamps)
Copyright © Schneider Electric 2008. All rights reserved.9
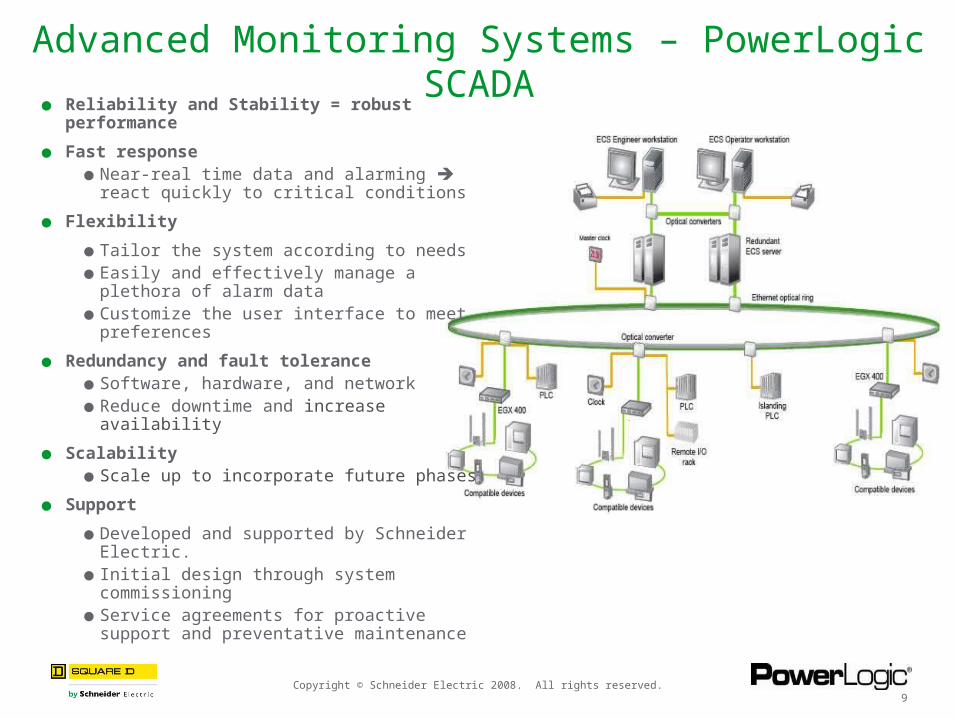
Advanced Monitoring Systems – PowerLogic SCADA
● Reliability and Stability = robust performance
● Fast response
● Near-real time data and alarming react quickly to critical conditions
● Flexibility
● Tailor the system according to needs
● Easily and effectively manage a plethora of alarm data
● Customize the user interface to meet preferences
● Redundancy and fault tolerance
● Software, hardware, and network
● Reduce downtime and increase availability
● Scalability
● Scale up to incorporate future phases
● Support
● Developed and supported by Schneider Electric.
● Initial design through system commissioning
● Service agreements for proactive support and preventative maintenance
Copyright © Schneider Electric 2008. All rights reserved.10
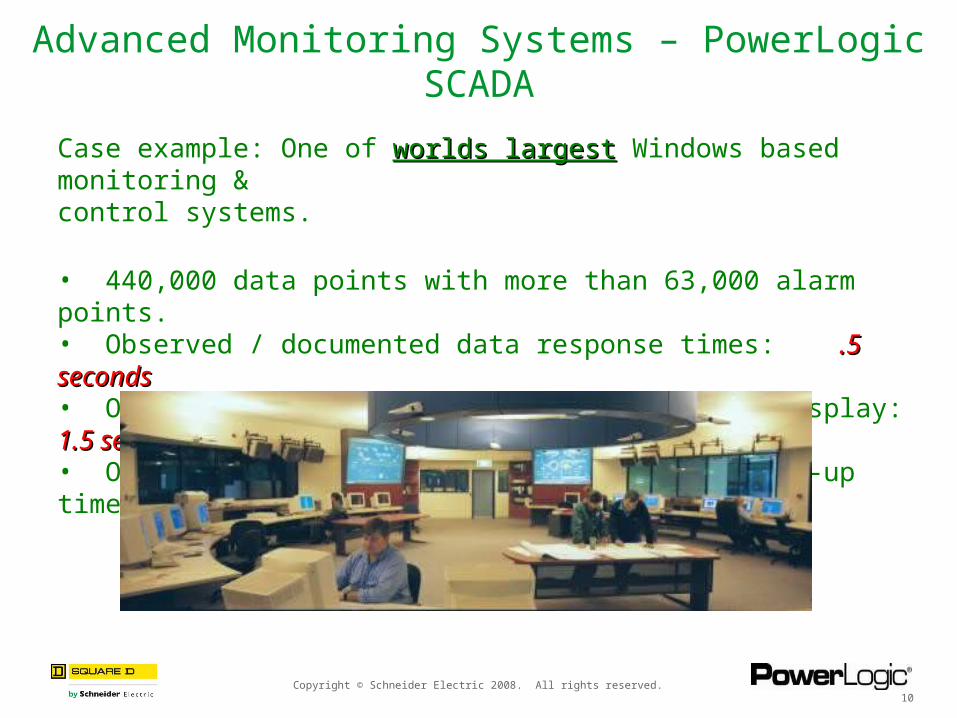
Advanced Monitoring Systems – PowerLogic SCADA
Case example: One of worlds largestworlds largest Windows based monitoring & control systems.
• 440,000 data points with more than 63,000 alarm points.• Observed / documented data response times: .5 seconds.5 seconds• Observed / documented graphic screen data display: 1.5 1.5 secondsseconds• Observed / documented historical report call-up time: 4 4 secondsseconds.
Copyright © Schneider Electric 2008. All rights reserved.11
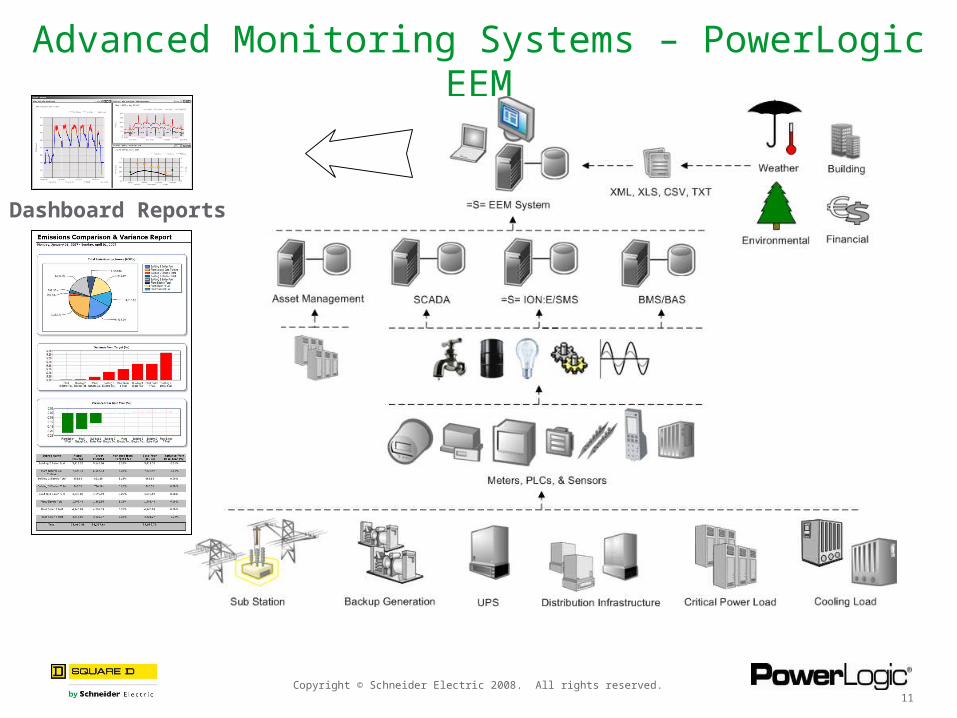
Advanced Monitoring Systems – PowerLogic EEM
Dashboard Reports
Copyright © Schneider Electric 2008. All rights reserved.12
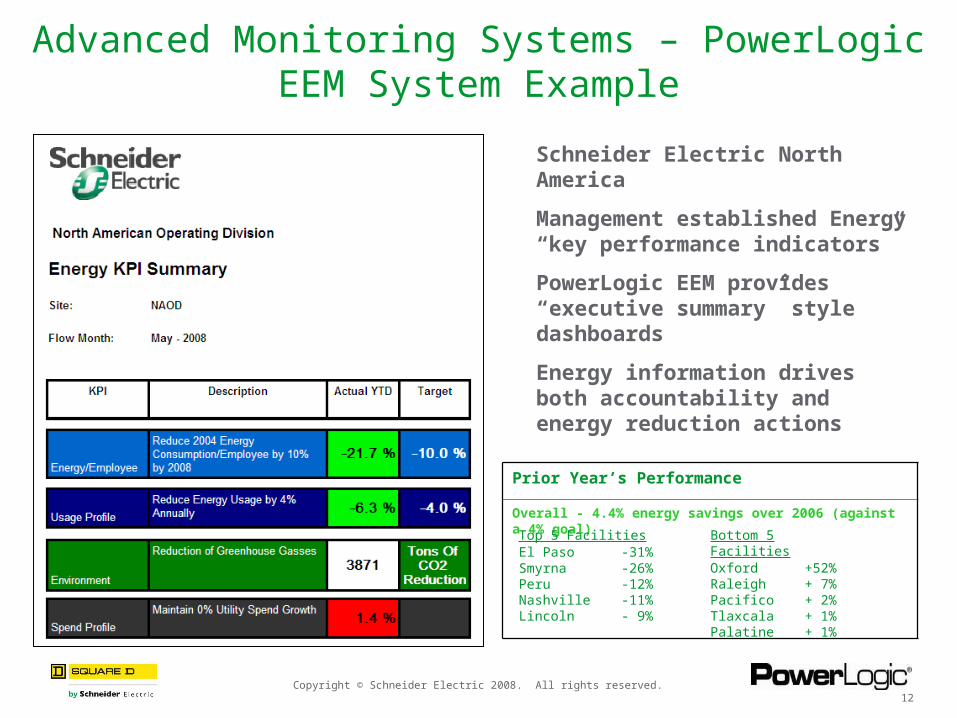
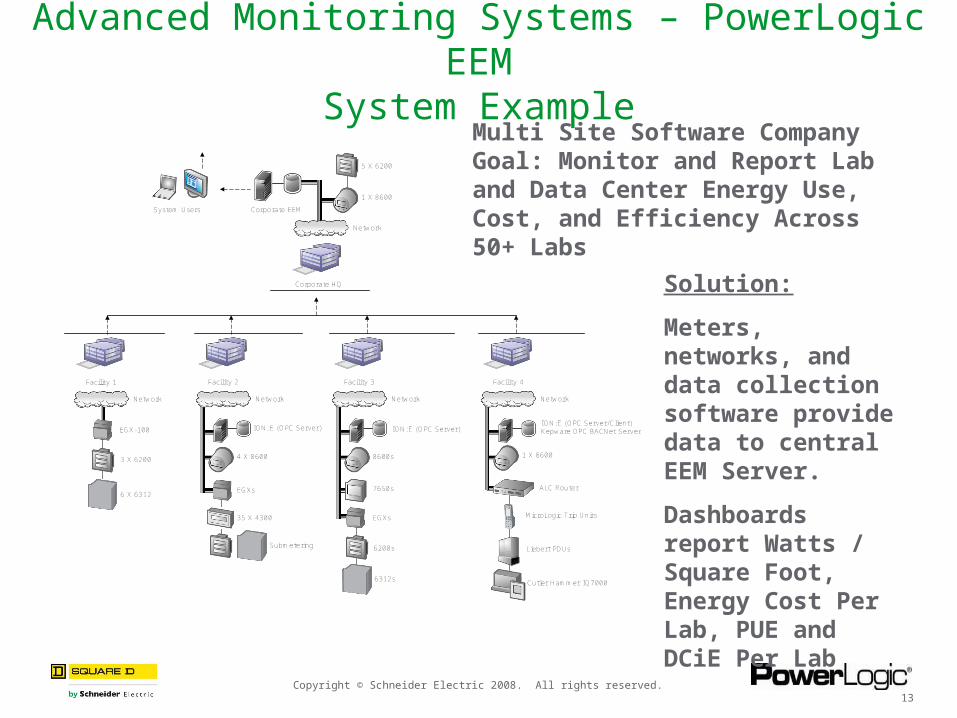
Advanced Monitoring Systems – PowerLogic EEM System Example
Schneider Electric North America
Management established Energy “key performance indicators”
PowerLogic EEM provides “executive summary” style dashboards
Energy information drives both accountability and energy reduction actions
Prior Year’s Performance
Overall - 4.4% energy savings over 2006 (against a 4% goal)
Top 5 FacilitiesEl Paso -31%Smyrna -26%Peru -12%Nashville -11%Lincoln - 9%
Bottom 5 FacilitiesOxford +52%Raleigh + 7%Pacifico + 2%Tlaxcala + 1%Palatine + 1%
Copyright © Schneider Electric 2008. All rights reserved.13
Advanced Monitoring Systems – PowerLogic EEM
System Example
4 X 8600
Corporate EEMSystem Users
Facility 1
Network
EGX-100
3 X 6200
6 X 6312
Facility 2
Network
EGXs
35 X 4300
ION:E (OPC Server)
Submetering
Corporate HQ
5 X 6200
1 X 8600
8600s
Facility 3
Network
EGXs
ION:E (OPC Server)
7650s
6200s
6312s
1 X 8600
Facility 4
Network
ION:E (OPC Server/Client)Kepware OPC BACNet Server
ALC Router
MicroLogic Trip Units
Liebert PDUs
Cutler Hammer IQ7000
Network
Multi Site Software Company Goal: Monitor and Report Lab and Data Center Energy Use, Cost, and Efficiency Across 50+ Labs
Solution:
Meters, networks, and data collection software provide data to central EEM Server.
Dashboards report Watts / Square Foot, Energy Cost Per Lab, PUE and DCiE Per Lab
Copyright © Schneider Electric 2008. All rights reserved.14
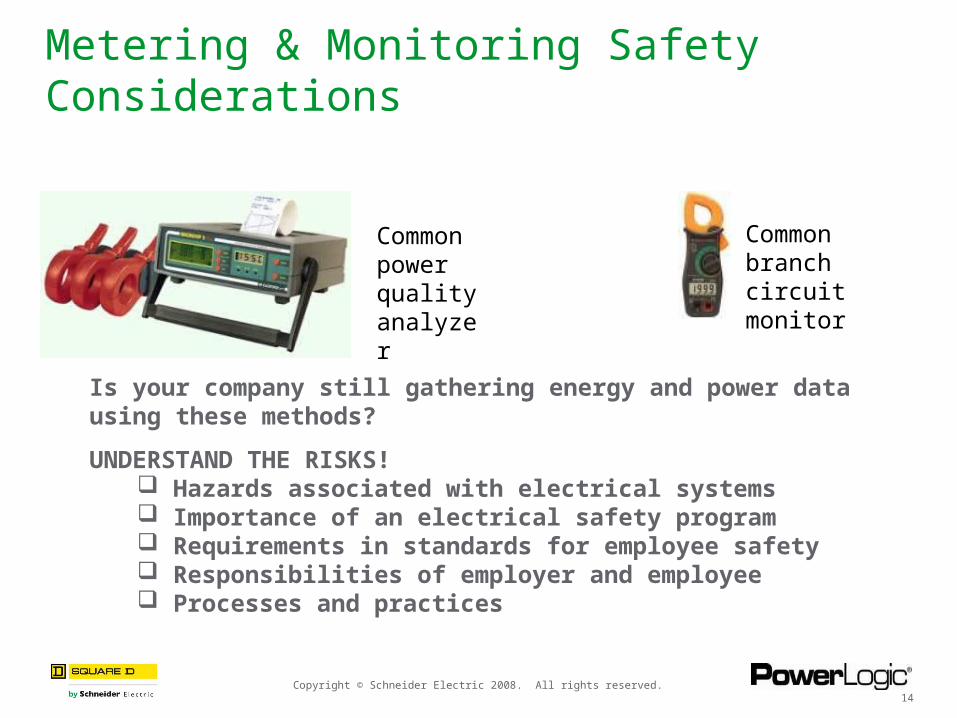
Metering & Monitoring Safety Considerations
Common branch circuit monitor
Common power quality analyzer
Is your company still gathering energy and power data using these methods?
UNDERSTAND THE RISKS! Hazards associated with electrical systems Importance of an electrical safety program Requirements in standards for employee safety Responsibilities of employer and employee Processes and practices

Copyright © Schneider Electric 2008. All rights reserved.15
Metering & Monitoring Safety Considerations●NFPA 70E and NEC state that facilities must provide:
●Safety program with defined responsibilities●Calculations for arc flash hazard degree●Personal protective equipment (clothing) for workers●Training for workers●Tools for safe work●Warning labels on equipment
WHICH
IS
SAFER?