Embed Size (px)
Citation preview
Annual School Development Report Page 1
“Making A Difference Together”
Annual School Development Report Page 2
A Message From
DARRIN PIKE CEO/DIRECTOR OF EDUCATION
This school development report for the 2012-13 school year outlines your school’s successes and highlights in matters such as student achievement and professional development. The planning and execution of a school development plan is an important process that must be undertaken by the entire school community. A thorough plan lays the foundation for a productive and successful school year and will be beneficial to every member of the school community, most importantly the students of your school. As we move ahead with the development of a new strategic plan for the Newfoundland and Labrador English School District I thank our administrators, teaching staff, school councils and school communities for their efforts in developing and implementing the previous plans to ensure student success and achievement. Such collaboration is important to grow together as a school community for the betterment of our education system. I look forward with great enthusiasm to the progress we are going to make as we build upon these school development plans and continue to provide a quality education for every student in our province. Sincerely, Darrin Pike CEO/Director of Education
Annual School Development Report Page 3
Message from Principal I am pleased to present the Annual Report for the school year 2012-2013. This document includes the newly developed multi-year plan and a detailed plan for the current school year. This plan is designed to guide instruction for optimal student performance. Also the reading results for grades one and two and the provincial assessment results for English Language Arts in grades three and six are included. An analysis will be provided of the results for each of these grades. The report encompasses the major thrusts of our school district, namely the promotion and improvement of literacy and numeracy in a safe and caring school environment. I would like to thank all stakeholders of our Cabot school community for their contribution to the school growth and development process throughout the last school year.
Gerard Murphy Principal
Annual School Development Report Page 4
Message from School Council
Cabot Academy School Council consists of eight parents and two teacher representatives under the guidance of our principal. Throughout 2012-2013 we held seven meetings, with an average attendance of eight per meeting. We had the opportunity to work with our wonderful staff and children on many issues throughout the school year. We assisted with Terry Fox Run, Recycling Program, Book Fair, Santa’s Visit and Breakfast, among several other school events. We participated in the schools External Review, attended a Stakeholders Consultation on Bullying at the district office and we are very proud of the success of our five day breakfast program offered throughout the year. It was a very enjoyable and productive year for our school council. We look forward to continued growth and development into the 2013-2014 school year.
Annual School Development Report Page 5
Overview of School
Our School Community
Cabot Academy is located in Western Bay. The catchment zone for Kindergarten to Grade Six extends from Caplin Cove to the north and Kingston to the south encompassing the area known as the “north shore”. Our grades Kindergarten to Six comes from 14 communities in a rural setting. Last year’s enrolment was 94 students. For the school year 2012-2013 Cabot Academy was allocated 9.30 professional staff which includes administration, classroom teachers, special services teacher and a guidance counselor. Our support personnel consisted of an allocation of one student assistant unit, one full time custodian and as well full time secretarial support. In addition district office staff and professional itinerant services were available from our regional office. The average class size was 13.43 students with each group receiving individual classroom instruction.
Grade K 1 2 3 4 5 6 Total
Enrollment 17 17 12 18 9 11 10 94
Key Highlights/Special Projects
Kinderstart Various Staff Committees Annual Science Fair Anti-bullying Program Education Week 100th Day Celebration National Volunteer Week Thanksgiving Assembly Recycling Parent Volunteers Terry Fox Run Literacy Program Work Place Safety Pre-School Program Tutoring for Tuition Annual Heritage Fairs Janeway Day Math Day Grounds Beautification Remembrance Day Assembly Story Time Grade Six Celebration Healthy Commotions Day Harvest Run Public Speaking Gr. 4,5,6 Christmas Concert School Tournaments Intramural Program D.A.R.E. Program Breakfast Program Cultural Connections Visiting Artist Program North Shore Fire Dept. North Shore Ambulance Presentation Safe & Caring Schools Committee
Annual School Development Report Page 6
Partnerships
Breakfast Program:
For the school year 2012-2013 our Breakfast Program was in its second year of operation, providing a five day service for students. The program operates under the direction of teachers and school council. Funding for the program is provided by our Cabot school community and a partnership with the “Kids Eat Smart Foundation”. This program provides students the opportunity to avail of a healthy breakfast and socialize with fellow students. Cafeteria Service:
We have been fortunate to partner with Burden’s Foodtown to provide a canteen and lunch cafeteria service on a five day basis. This partnering provides onsite prepared pre-ordered lunches for students in keeping with our school districts nutrition policy. School Milk Foundation:
Cabot Academy in partnership with the school milk foundation provides a subsidized program for students to purchase this healthy food choice. Recycling Program:
In partnership with Multi-Materials Stewardship Board our school continues to operate an extremely successful recycling program both in terms of environmental awareness and protection and as a very valuable fundraiser for our school. Last year in excess of 57,443 recyclables were collected from our school community for a total of $5987.70. D.A.R.E. Program: In partnership with the RCMP our grades five and six class participated in the Drug Awareness Resistance Education Program. The program consisted of weekly sessions with assigned homework and student participants took part in a graduation ceremony.
Annual School Development Report Page 7
Summary Report on the School’s Most Current Data
Provincial Assessment Data
Reading Records for Grades 1 and 2
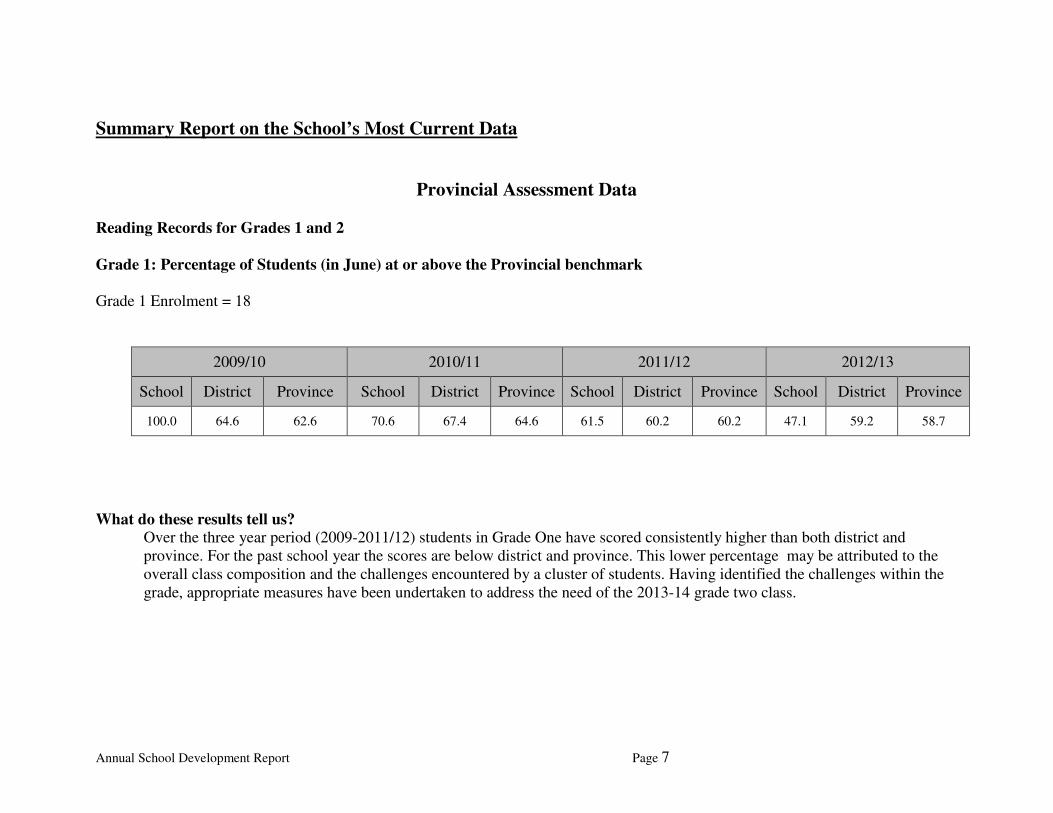
Grade 1: Percentage of Students (in June) at or above the Provincial benchmark
Grade 1 Enrolment = 18
2009/10 2010/11 2011/12 2012/13
School District Province School District Province School District Province School District Province
100.0 64.6 62.6 70.6 67.4 64.6 61.5 60.2 60.2 47.1 59.2 58.7
What do these results tell us?
Over the three year period (2009-2011/12) students in Grade One have scored consistently higher than both district and province. For the past school year the scores are below district and province. This lower percentage may be attributed to the overall class composition and the challenges encountered by a cluster of students. Having identified the challenges within the grade, appropriate measures have been undertaken to address the need of the 2013-14 grade two class.
Annual School Development Report Page 8
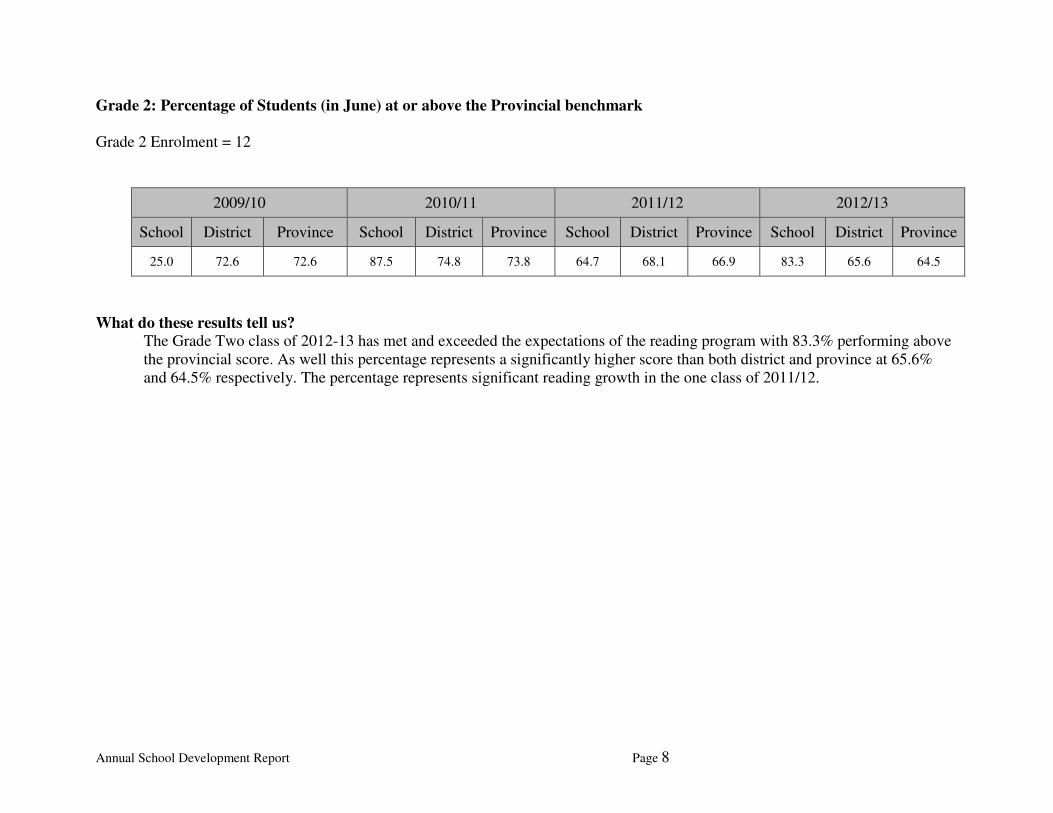
Grade 2: Percentage of Students (in June) at or above the Provincial benchmark
Grade 2 Enrolment = 12
2009/10 2010/11 2011/12 2012/13
School District Province School District Province School District Province School District Province
25.0 72.6 72.6 87.5 74.8 73.8 64.7 68.1 66.9 83.3 65.6 64.5
What do these results tell us?
The Grade Two class of 2012-13 has met and exceeded the expectations of the reading program with 83.3% performing above the provincial score. As well this percentage represents a significantly higher score than both district and province at 65.6% and 64.5% respectively. The percentage represents significant reading growth in the one class of 2011/12.
Annual School Development Report Page 9
Provincial Assessment data by strand for grades 3 and 6
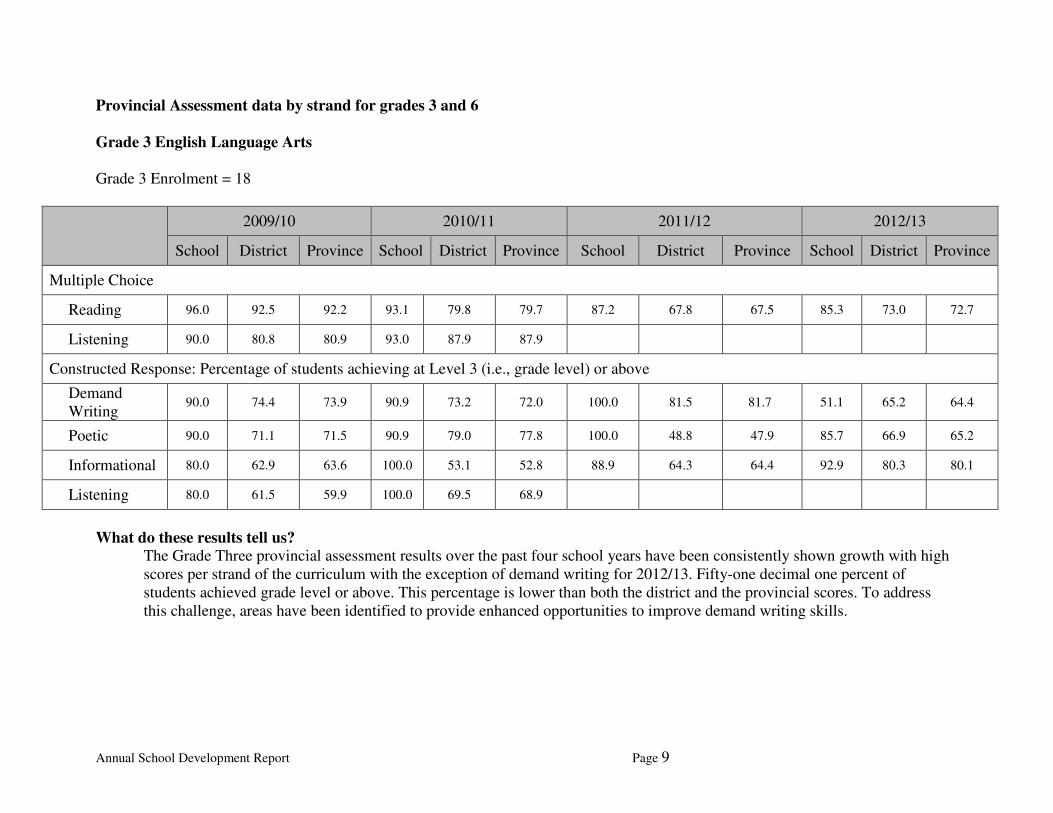
Grade 3 English Language Arts
Grade 3 Enrolment = 18
2009/10 2010/11 2011/12 2012/13
School District Province School District Province School District Province School District Province
Multiple Choice
Reading 96.0 92.5 92.2 93.1 79.8 79.7 87.2 67.8 67.5 85.3 73.0 72.7
Listening 90.0 80.8 80.9 93.0 87.9 87.9
Constructed Response: Percentage of students achieving at Level 3 (i.e., grade level) or above
Demand Writing
90.0 74.4 73.9 90.9 73.2 72.0 100.0 81.5 81.7 51.1 65.2 64.4
Poetic 90.0 71.1 71.5 90.9 79.0 77.8 100.0 48.8 47.9 85.7 66.9 65.2
Informational 80.0 62.9 63.6 100.0 53.1 52.8 88.9 64.3 64.4 92.9 80.3 80.1
Listening 80.0 61.5 59.9 100.0 69.5 68.9
What do these results tell us?
The Grade Three provincial assessment results over the past four school years have been consistently shown growth with high scores per strand of the curriculum with the exception of demand writing for 2012/13. Fifty-one decimal one percent of students achieved grade level or above. This percentage is lower than both the district and the provincial scores. To address this challenge, areas have been identified to provide enhanced opportunities to improve demand writing skills.
Annual School Development Report Page 10
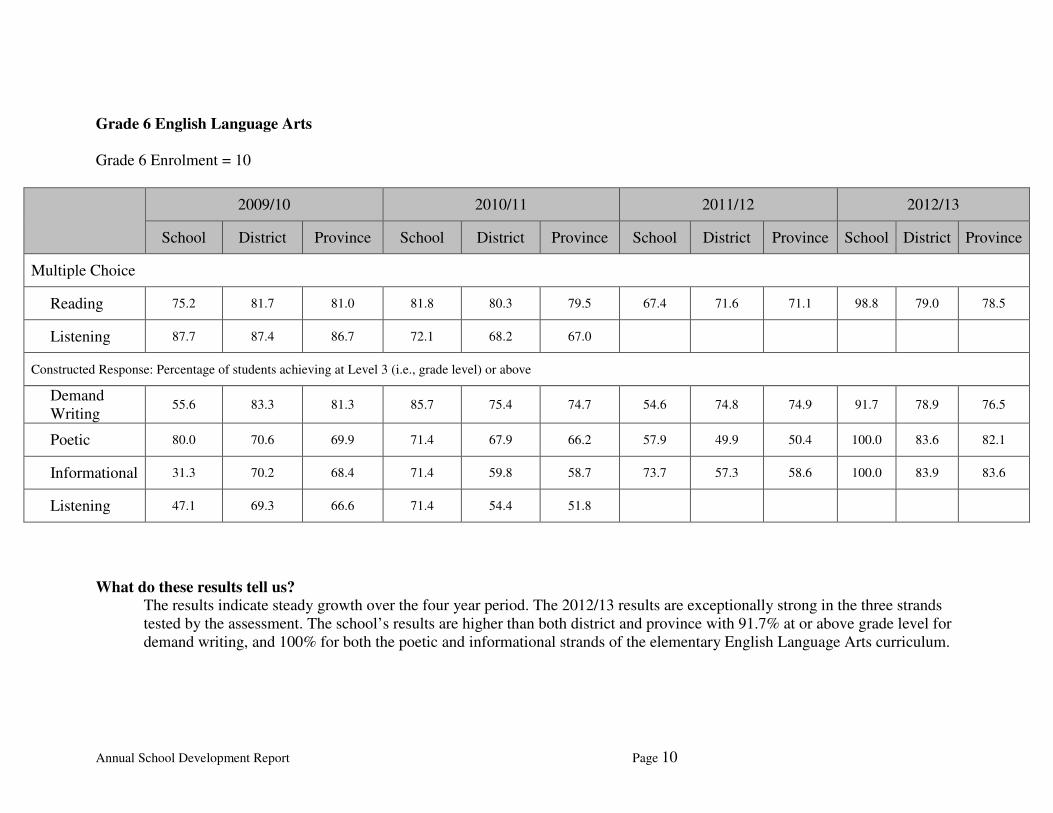
Grade 6 English Language Arts
Grade 6 Enrolment = 10
2009/10 2010/11 2011/12 2012/13
School District Province School District Province School District Province School District Province
Multiple Choice
Reading 75.2 81.7 81.0 81.8 80.3 79.5 67.4 71.6 71.1 98.8 79.0 78.5
Listening 87.7 87.4 86.7 72.1 68.2 67.0
Constructed Response: Percentage of students achieving at Level 3 (i.e., grade level) or above
Demand Writing
55.6 83.3 81.3 85.7 75.4 74.7 54.6 74.8 74.9 91.7 78.9 76.5
Poetic 80.0 70.6 69.9 71.4 67.9 66.2 57.9 49.9 50.4 100.0 83.6 82.1
Informational 31.3 70.2 68.4 71.4 59.8 58.7 73.7 57.3 58.6 100.0 83.9 83.6
Listening 47.1 69.3 66.6 71.4 54.4 51.8
What do these results tell us?
The results indicate steady growth over the four year period. The 2012/13 results are exceptionally strong in the three strands tested by the assessment. The school’s results are higher than both district and province with 91.7% at or above grade level for demand writing, and 100% for both the poetic and informational strands of the elementary English Language Arts curriculum.
Annual School Development Report Page 11
Internal Assessment Data Overall the majority of students are achieving three or above scores on report cards. A number of students from grade three and up are scoring lower on the provincial rubric in writing and representing as compared to higher scores for viewing and reading. There is a connection in areas and grade levels with students scoring below curriculum expectations and those receiving special services support in these areas. Students from grade three and up are scoring lower in problem solving and much higher in the other strands of mathematics. The majority of Elementary students are meeting or exceeding curriculum expectations in English Language Arts and Mathematics, indicating growth in areas as student’s progress through the grade levels. What do these results tell us?
It is required to further challenge students in the areas of writing, mathematical reasoning and problem solving. For example: problem of the week/day, mental math strategies, opportunities to communicate their math, etc. To continue to provide students with various writing experiences, with an emphasis on the quality of their finished product. Prior to the referral of students for special services support, teachers are required to ensure progress reporting is an accurate reflection of the student’s level of achievement. As well classroom teachers must have provided classroom interventions (good teaching practices) in trying to meet individual needs of all learners.
Annual School Development Report Page 12
Report on School Development Plan for Previous Year Cabot Academy’s three year school Growth & Development plan was completed in June 2012. Throughout the school year 2012-2013 the focus was to develop a multi-year plan for our school. This process involved the collection and analysis of both internal and external data. A detailed plan was developed through both the internal and external review process resulting in the formulation of goals and objectives. Through a consensus of staff and school council the plan was approved for implementation. Throughout the school year 2012-2013 the previous multi-year plan was carried forward and used to guide both planning and instruction with the continuing use of goals, objectives and strategies of success through the use of our action planning teams to promote literacy and numeracy.
Annual School Development Report Page 13
Actions for Change
For the school year 2012-2013 the process of review was taking place. In the interim the staff of Cabot Academy carried forward the completed multi-year plan for one additional year. Therefore an examination of changes in strategies will not be given explanation until the end of the current year. The School Growth & Development Plan is newly implemented with stated goals, objectives and strategies of success and will be closely monitored and evaluated to be included in the ASR for this current year 2013.
Annual School Development Report Page 14
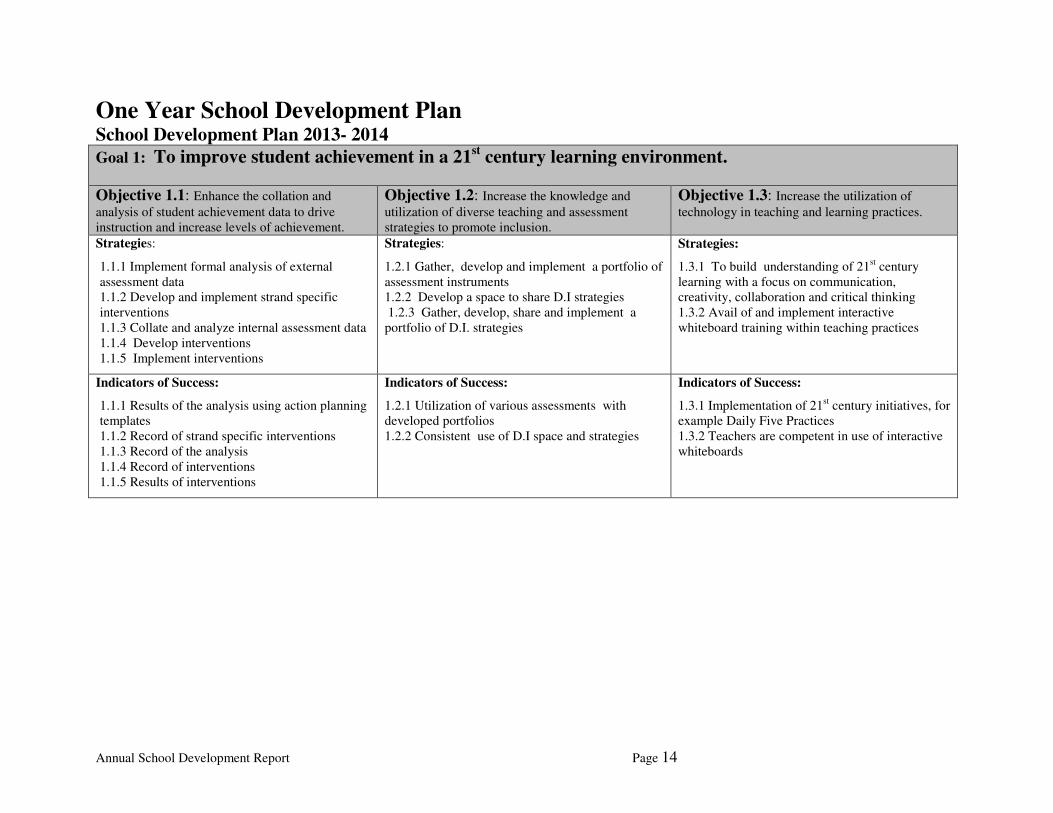
One Year School Development Plan
School Development Plan 2013- 2014
Goal 1: To improve student achievement in a 21st century learning environment.
Objective 1.1: Enhance the collation and
analysis of student achievement data to drive instruction and increase levels of achievement.
Objective 1.2: Increase the knowledge and
utilization of diverse teaching and assessment strategies to promote inclusion.
Objective 1.3: Increase the utilization of
technology in teaching and learning practices.
Strategies:
1.1.1 Implement formal analysis of external assessment data 1.1.2 Develop and implement strand specific interventions 1.1.3 Collate and analyze internal assessment data 1.1.4 Develop interventions 1.1.5 Implement interventions
Strategies:
1.2.1 Gather, develop and implement a portfolio of assessment instruments 1.2.2 Develop a space to share D.I strategies 1.2.3 Gather, develop, share and implement a portfolio of D.I. strategies
Strategies:
1.3.1 To build understanding of 21st century learning with a focus on communication, creativity, collaboration and critical thinking 1.3.2 Avail of and implement interactive whiteboard training within teaching practices
Indicators of Success:
1.1.1 Results of the analysis using action planning templates 1.1.2 Record of strand specific interventions 1.1.3 Record of the analysis 1.1.4 Record of interventions 1.1.5 Results of interventions
Indicators of Success:
1.2.1 Utilization of various assessments with developed portfolios 1.2.2 Consistent use of D.I space and strategies
Indicators of Success:
1.3.1 Implementation of 21st century initiatives, for example Daily Five Practices 1.3.2 Teachers are competent in use of interactive whiteboards
Annual School Development Report Page 15
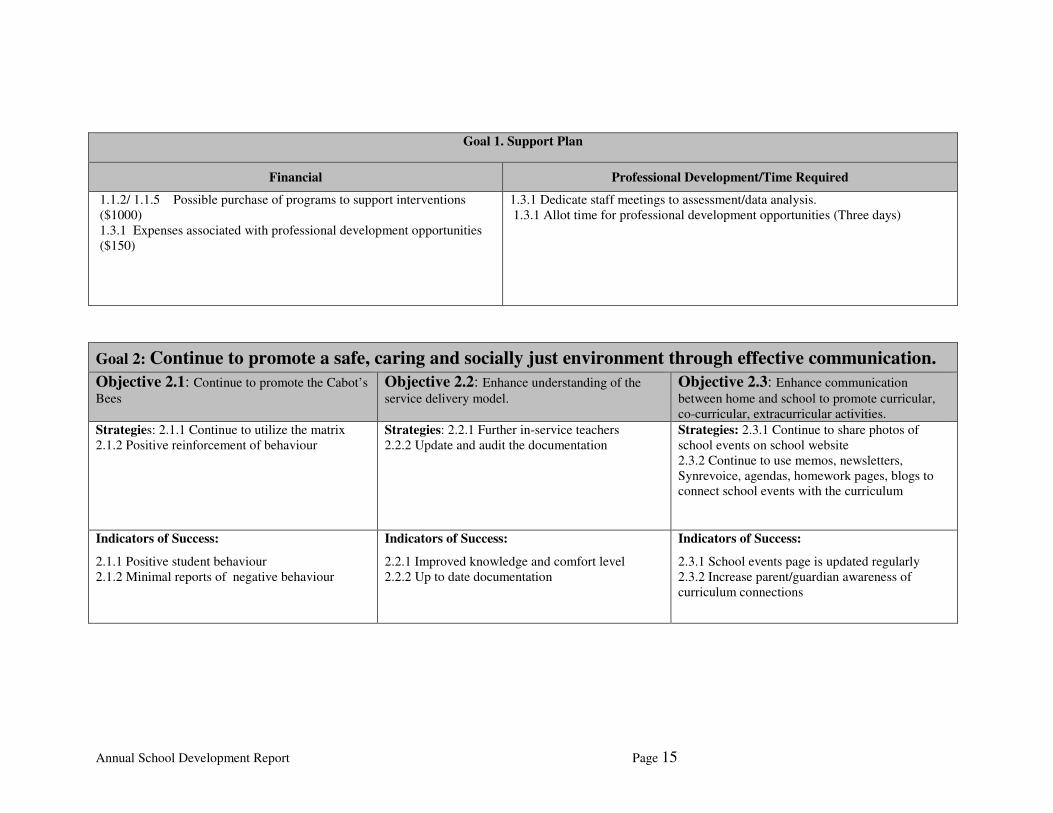
Goal 1. Support Plan
Financial Professional Development/Time Required
1.1.2/ 1.1.5 Possible purchase of programs to support interventions ($1000) 1.3.1 Expenses associated with professional development opportunities ($150)
1.3.1 Dedicate staff meetings to assessment/data analysis. 1.3.1 Allot time for professional development opportunities (Three days)
Goal 2: Continue to promote a safe, caring and socially just environment through effective communication.
Objective 2.1: Continue to promote the Cabot’s
Bees Objective 2.2: Enhance understanding of the
service delivery model. Objective 2.3: Enhance communication
between home and school to promote curricular, co-curricular, extracurricular activities.
Strategies: 2.1.1 Continue to utilize the matrix 2.1.2 Positive reinforcement of behaviour
Strategies: 2.2.1 Further in-service teachers 2.2.2 Update and audit the documentation
Strategies: 2.3.1 Continue to share photos of school events on school website 2.3.2 Continue to use memos, newsletters, Synrevoice, agendas, homework pages, blogs to connect school events with the curriculum
Indicators of Success:
2.1.1 Positive student behaviour 2.1.2 Minimal reports of negative behaviour
Indicators of Success:
2.2.1 Improved knowledge and comfort level 2.2.2 Up to date documentation
Indicators of Success:
2.3.1 School events page is updated regularly 2.3.2 Increase parent/guardian awareness of curriculum connections
Annual School Development Report Page 16
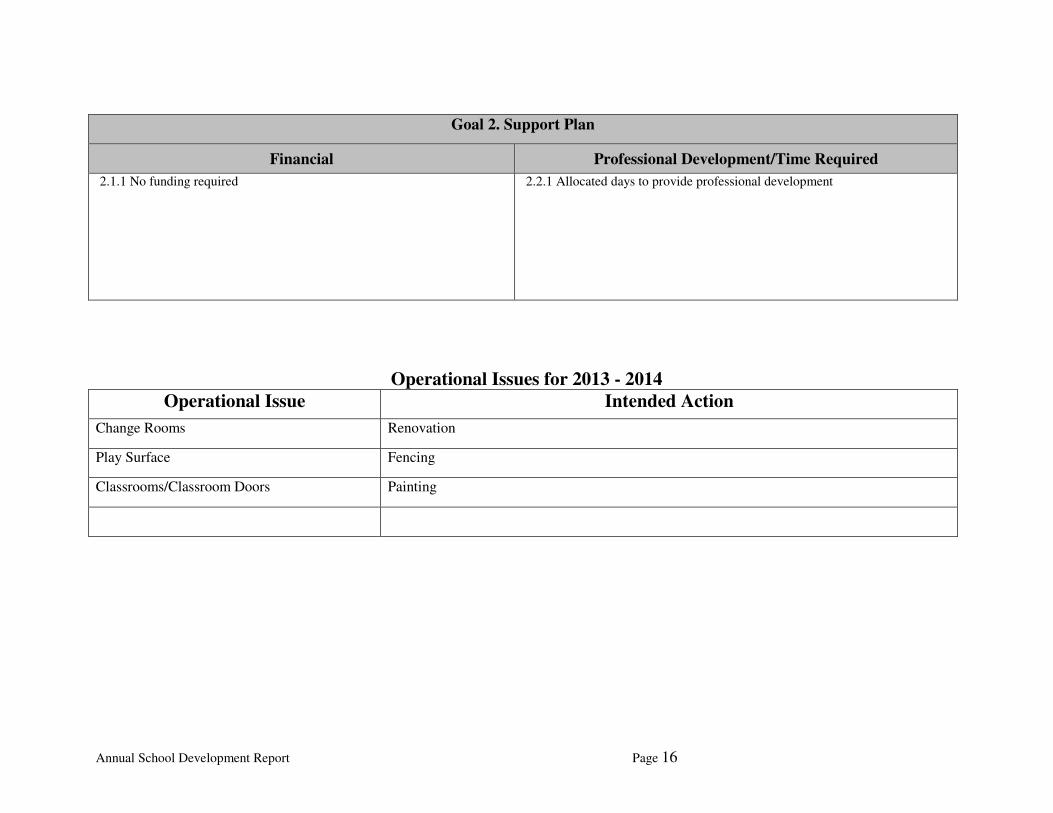
Goal 2. Support Plan
Financial Professional Development/Time Required
2.1.1 No funding required 2.2.1 Allocated days to provide professional development
Operational Issues for 2013 - 2014 Operational Issue Intended Action
Change Rooms Renovation
Play Surface Fencing
Classrooms/Classroom Doors Painting