Embed Size (px)
Citation preview

Making Green Development A Choice
China Human Development Report 2002
United Nations Development Programme

China Human Development Report i
China Human Development Report 2002
Making Green Development a Choice
produced by
Stockholm Environment Institute
in collaboration with
United Nations Development Programme (UNDP) China
Oxford University Press2002

UNDPii
Oxford University Press
Oxford New YorkAuckland Bangkok Buenos Aires Cape Town ChennaiDar es Salaam Delhi Hong Kong Istanbul Karachi KolkataKuala Lumpur Madrid Melbourne Mexico City Mumbai NairobiSão Paulo Shanghai Singapore Taipei Tokyo Toronto
and associated companies in Berlin Ibadan
Oxford is a registered trade mark of Oxford University Press
Copyright © 2002 United Nations Development Programme, China2 Liangmahe Nanlu, Beijing 100600, Chinawww.unchina.org/undp
All rights reserved. No part of this publication may be reproduced,stored in a retrieval system, or transmitted, in any form or by any means,without the prior permission in writing of Oxford University Press,or as expressly permitted by Law, or under terms agreed with the appropriatereprographics rights organization. Enquiries concerning reproductionoutside the scope of the above should be sent to the Rights Department,Oxford University Press, at the address below.
You must not circulate this book in any other binding or coverand you must impose the same condition on any acquirer.
British Library Cataloguing in Publication Dataavailable
Library of Congress Cataloging-in-Publication-Dataavailable
Printed in Hong KongPublished by Oxford University Press (China) Ltd18th Floor, Warwick House East, Taikoo Place, 979 King’s Road, Quarry BayHong Kong
ISBN 0-19-592744-3
First published in 2002This impression (lowest digit)1 3 5 7 9 10 8 6 4 2
Cover photographs by Lynn Yen, Beijing, UNDP China, and Karl Hallding, SEIReport layout by Lisetta Tripodi, SEICover layout by Arno Rosemarin and Karl Hallding, SEI

China Human Development Report iii
Foreword
This third China Human Development Report (CHDR) deals with China’s challenge at the crossroads towardssustainable development. China’s development is central to global stability. Annual growth rates have been averag-ing nearly 10% the last 20 years. Also government reforms over the last 20 years have reduced poverty for a quarterof the population. China’s rapid transition towards a market-based economy and entry into the WTO are changingthe global scene. And the world has never witnessed such a fast pace of urban modernization that we see today inChina. The challenges of fulfilling a vision of green development in China are monumental, requiring a complexorchestration of policies and activities at a scale of operation the world has never seen. There is commitment, andthere is awareness but still the right choices have to be made to achieve green development.
The UNDP commissioned Stockholm Environment Institute to produce this CHDR in order to ensure that thereport would raise the central questions surrounding sustainable development and the critical options at hand. Thereport is also well timed since it arrives while the world is preparing for the World Summit on Sustainable Develop-ment 2002 in Johannesburg.
It is thus timely that the CHDR examines the general system of societal, environmental and economic factors thattogether make what China is today and what it can become in the future. The report is an assessment of modernChina and some of the bottlenecks requiring attention in the manifestation of a greener agenda. This is not a state ofthe environment report but a critical assessment of progress made and challenges and choices remaining. The reportpresents options and attempts to ask the “right” questions. In this way it tries to stimulate a healthy debate onidentifying suitable solutions. It also takes a candid look at the past to draw upon the most useful lessons fordetermining what could be done now for the future.
The report describes the physical and geographical challenges that this country presents to its populace. Theseare obviously central factors in determining the limits of human development. It also examines China’s people andtheir history and culture as the resource and foundation to build and modernise this vast land. It describes the perilsof the current state of the environment including status of land, water, air and biological resources. It examines theassociated impacts of development on human health and welfare. It provides an assessment of the drivers andlinkages between society and environment, and two scenarios – one based on current trends and one based on agreener future. The main message of the report is that there is a real opportunity at hand to green China’s develop-ment agenda but that critical choices must be made by China’s leaders, policy makers and interested stakeholders forthis to happen.
___________________________ _______________________Kerstin Leitner Roger KaspersonResident Representative Executive DirectorUnited Nations Development Programme in China Stockholm Environment Institute

UNDPiv

China Human Development Report v
This report has been developed over the past two years (2000-2002); a period during which China has undergonemany significant changes. We have been trying to capture the main changes with regard to the environment andsustainable development, while at the same time providing the reader with an overall impression of where China istoday, how it evolved to the present situation, and what options there are for the future. This is not a state of theenvironment report but a more pointed analysis of the interaction between environment, society and governmentand the policy challenges therein.
Chapter 1 provides an overall introduction to the report including the overall contents of each chapter and thefinal chapter 5 summarizes the main issues. The reader is also encouraged to examine the Scenario Boxes that runthrough the report as a background element in revealing the two alternative paths of development, the perilous pathand the green reform path. The Scenarios have been adapted for China on the basis of the East Asia Scenarios fromthe GEO-3 (Global Environmental Outlook) process, for the use of which we owe gratitude to the UNEP.
A few words on how we have worked with various data sources are also in order. Availability and reliability of datais a key challenge for anyone who has been assigned the task of describing China. Being more of a continent thana country, and with various conditions changing dramatically across the country, any attempt to try describingChina in terms of average, aggregate numbers runs the risk of missing some of the crucial information. As an example,China has on the average a little bit more than 2,200 cubic metres of freshwater available per capita per year, puttingChina on par with countries like Germany, the UK, Nigeria or Sri Lanka, where water is indeed a limited resource, butnot scarce. What the average of 2,200 cubic metres fails to recognise is that almost 600 million people in China’s northare living in areas that belong to the most water scarce locations on earth, and that many places may suffer from bothflooding and drought within the same year. The same can be said for resources such as arable land, grasslands,forests and erosion areas. Countrywide average per capita data do not reveal the hot spots nor the critical issues. Wehave therefore taken a critical look at the various regions within China and examined the highly skewed distributionof human settlements and natural resources.
Another problem is the lack of comprehensive and reliable datasets covering the whole country. Crucial data thathave been collected through Chinese government statistical systems through decades, sometimes centuries, arecharacterised by serious quality and systematic errors. One illustrative example is the acreage of arable land, whichused to be estimated at roughly 90 million hectares, or less than 10 percent of the Chinese landmass, but which dueto new and better methods, using remote sensing and geographical information systems, is now estimated at morethan 130 million hectares. These types of broad-based errors in the range of 50 percent that relate to key resourcesmay of course have considerable implications on the entire policy situation and development strategy.
So, in outlining the course of China’s environmental and societal development and the prospects for futuresustainability we have had to rely on both the available routine data, but also on “common sense”, based onreasoning supported by anecdotal evidence, media reports, monitoring campaigns with limited geographic or the-matic coverage, and by sound professional judgement. Our attempt has been to provide the story about the environ-mental situation and opportunities in China where the context is more important than just the individual data. Thislargely qualitative approach has been supported by a broad reviewing process including Chinese officials andexperts, as well as international experts.
This report is aimed at a wide audience, and in doing so there will always be some readers who find certain partssuperfluous, too detailed or plain incomprehensible. Spanning as wide academic fields as environmental sciences,sinology, and social sciences, as well as methodologies for envisioning different future options, there is also a riskthat some readers will be challenged by some of the particular topics. In order to help, we have ensured that alltechnical aspects of the report are written as simply as possible. When it comes to the world of acronyms andterminology, we have provided a list of abbreviations with explanations for those that have been used in the report.
Preface and Acknowledgements

UNDPvi
For those with more specific interests relating to the Human Development Index, the Annex chapter containsrelevant datasets. A new item is the Health Risk Index, which has never been attempted before in a UNDP HumanDevelopment Report.
A note regarding Chinese various transcriptions of names is worth raising here in order to facilitate cross referenc-ing with other literature. We have tried to be consistent in using standard pinyin transcriptions only, so China’sCapital is spelled Beijing and not Peking, which is straight forward for most readers today. But there are other namesthat are more ambiguous, in particular geographical names such as rivers. China’s greatest river, the Changjiang, isreferred to in the report by its older international name the Yangtze River. The famous Huanghe we have referred toas such, in addition to using the English translation, the Yellow River. Furthermore there is an issue of whether or notto combine the names of the rivers. The northern river that empties near Tianjin is referred to in the literature as Haiheor Hai He, but since the word he means river it is also sometimes referred to as Hai River. This ambiguity applies tomost names of rivers. Similar problems arise with the word shan meaning mountain, hu meaning lake, and haimeaning sea.
Chinese history, not least the modern period, is full of important milestones, which we have referred to in differentcontexts throughout the report, the most important one being the period from when Deng Xiaoping seized thecontrol of China’s development following after Mao Zedong’s death and the downfall of the Gang of Four in 1976.This is commonly referred to as the reform period, which stretches from late 1978 until today. Other periods worthexplanation are “Post liberation” or “Communist” China, which is the period after 1949 when the People’s Republicof China was established. The Maoist period usually refers to the years up till Mao’s death 1976.
The process of developing this report involved two groups of writers over the two-year period. The first groupconsisted of some of China’s best specialists in geography, biological diversity, energy resources, water and airpollution, solid waste, health, related policy reforms and HDI statistics. They were assigned the task of writingsummaries of the present data and knowledge in their respective fields. Plus a large database of human developmentand environmental statistics was assembled. Following this, a team of generalists was assembled to write the finalreport, providing the critical balance between descriptive detail and pointed analysis.
Team leader for the project was Arno Rosemarin at SEI. Zhu Hua at UNDP, Beijing, provided managerial assist-ance and co-ordination in China throughout the whole process. Karl Hallding at SEI has been the lead author of thereport, but the entire and invaluable core team of writers have been deeply involved in the process of drafting,commenting and revising the whole report. The core team included:
• Dennis Fenton, formerly UNDP China• Changhua Wu, former Director for China Studies, World Resources Institute• Jintao Xu, Professor, Center for Chinese Agricultural Policy, Chinese Academy of Sciences• Guoyi Han, SEI• Annette Huber-Lee, SEI (mainly responsible for Scenarios)• Arno Rosemarin, SEI
The group of excellent experts that provided written input include:
• Li Shi (Professor) Institute of Economics, Chinese Academy of Social Sciences (Annex)• Liu Pei Zhe (Director) and Esther Deng, Waste Management Asia (China) (air and water pollution)• Niu Wenyuan (Professor) Chinese Academy of Sciences (geography)• Shi Han (Director) Center for Environmentally Sound Technology Transfer, ACCA 21 (policy aspects)• Wang Sung (Professor) and Dr. Xie Yan, Institute of Zoology, Chinese Academy of Sciences (biodiversity)

China Human Development Report vii
• Zhou Dadi (Director-General) and Senior Staff Dai Yande, Jiang Kejin, Gao Shixian, Yu Cong and Dai Lin,Energy Research Institute of the State Development Planning Commission (energy)
• Zhou Qiulin (Professor) State Oceanic Administration (water resources)• Jonathan Sinton, University of Berkeley (energy)• Michael Lazarus, Stockholm Environment Institute (SEI) (energy)• Eric Kemp-Benedict, SEI (scenarios)• Input from the UNDP-WHO study Environment and People’s Health in China carried out by Institute of
Environmental Health & Engineering (Chinese Academy of Preventive Medicine), Institute of Quantitative& Technical Economics (Chinese Academy of Social Science), Ministry of Health and State EnvironmentalProtection Administration (health aspects)
Valuable comments were provided by:
• Roger K. Raufer, University of Pennsylvania• Peter J. Schei, Directorate for Nature Management, Norway• Martin Linde-Rahr, University of Gothenburg• Thomas B. Johansson, UNDP and University of Lund• Yannick Glemarec, formerly UNDP China (now UNDP Bangladesh)• Christine Loh, Civic Exchange, Hong Kong• Monica Gullberg, SEI• Aaron Maltais, SEI• Kerstin Leitner, UNDP China• Macleod Nyirongo, UNDP China• Anita Nirody, SURF, UNDP Bangkok• Environment and Energy staff, UNDP China• Shuqin Liu, Beijing
The maps used were provided by IIASA. Source: Heilig, G.K. (1999): Can China Feed Itself? A System for Evalu-ation of Policy Options. CD-ROM, Laxenburg, Austria, International Institute for Applied Systems Analysis.
Photos were taken by Lynn Yen of Beijing.
Layout was carried out by Lisetta Tripodi of SEI.
The translation into Mandarin was performed by Changhua Wu (also core group author).
Funding for this project was provided from the UNDP China, Swedish International Development CooperationAgency (Sida), and SEI. Special thanks go to Ericsson (China) Company Ltd., Shell (China) Ltd., Jun Yao Group ofChina, BP China Ltd. and Cisco Systems (China) for their kind sponsorship.
The project was managed independently by SEI in collaboration with UNDP China.
This report is based on an objective analysis of facts and figures readily available from databases, libraries andknowledge institutions in China and around the world. The opinions or interpretations given in this report are thoseprimarily of the authors and not official policy of the UNDP or Sida. The data accessed in this report do not includeTaiwan, Hong Kong Special Administrative Region or Macao Special Administrative Region.
Arno Rosemarin PhD Karl HalldingCommunications Director Programme DirectorStockholm Environment Institute Stockholm Environment [email protected] [email protected]

UNDPviii

China Human Development Report ix
ContentsForeword iiiPreface and Acknowledgements vTables, Figures and Boxes xAnnex Contents List xiAbbreviations xii
1 Setting the Scene: Grounds for Green Reform 11.1 People and the Environment in China 11.2 Chinese Landscapes—the Diversity of
AContinent 21.3 Tracing A Historic and Cultural Foundation 71.4 Seeking A Sustainable Future? 11
2 State of the Environment 172.1 Land Resources 172.2 Biodiversity 222.3 Water Resources 242.4 Air Quality 262.5 Solid Waste 302.6 Human Health Impacts 312.7 Impacts on the Economy 342.8 Regional Impacts 36
3 The Society–Environment Nexus 393.1 Population Growth and Migration 393.2 Economic Growth and Development 413.3 Poverty, Equity, and Environmental Justice 453.4 Environmental Awareness 483.5 Consumption 493.6 Technological Development 503.7 Water as a Social Good 513.8 Energy 553.9 Transportation 583.10Agriculture and Food Production 603.11Globalisation 623.12Governance and Institutions 67
4 Ongoing Response: Towards a SustainableFuture? 75
4.1 China’s Environmental Administration 754.2 Government Response 784.3 Non-government Response 86
5 Human Choice and the Path Ahead 935.1 Finding the Optimal Response 935.2 The Choice Ahead 96
References 101
Annex A1
UNDPx
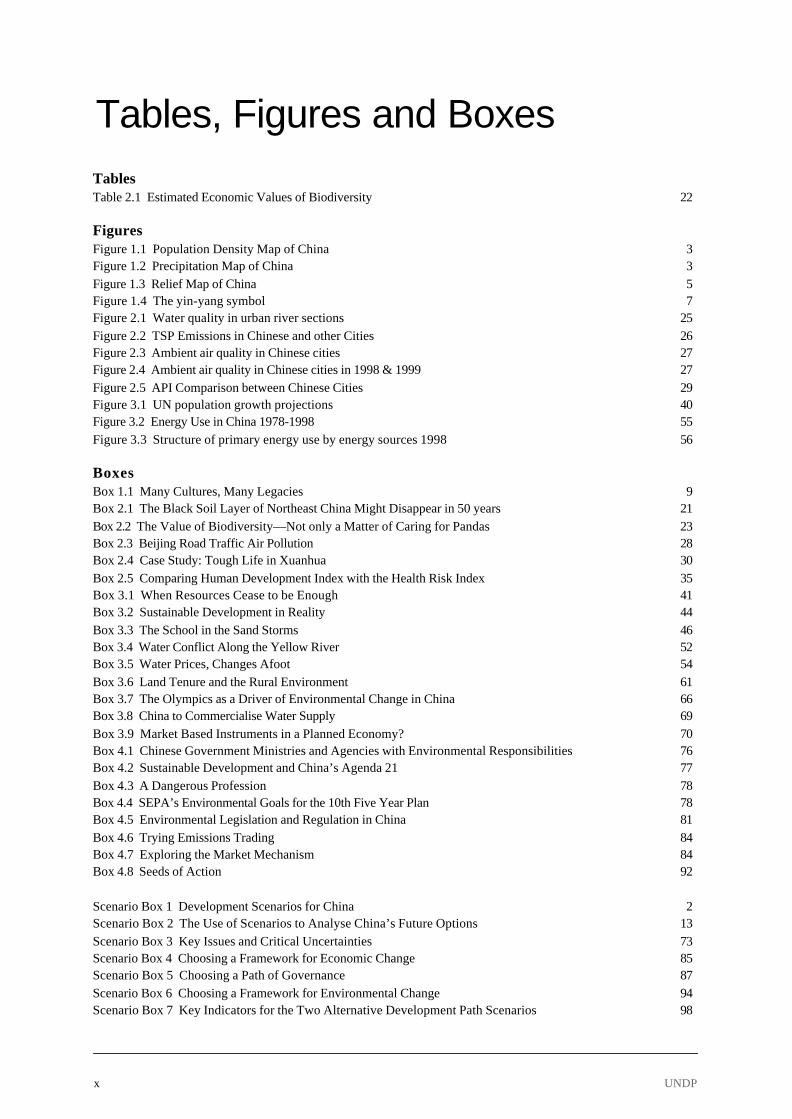
TablesTable 2.1 Estimated Economic Values of Biodiversity 22
FiguresFigure 1.1 Population Density Map of China 3Figure 1.2 Precipitation Map of China 3Figure 1.3 Relief Map of China 5Figure 1.4 The yin-yang symbol 7Figure 2.1 Water quality in urban river sections 25Figure 2.2 TSP Emissions in Chinese and other Cities 26Figure 2.3 Ambient air quality in Chinese cities 27Figure 2.4 Ambient air quality in Chinese cities in 1998 & 1999 27Figure 2.5 API Comparison between Chinese Cities 29Figure 3.1 UN population growth projections 40Figure 3.2 Energy Use in China 1978-1998 55Figure 3.3 Structure of primary energy use by energy sources 1998 56
BoxesBox 1.1 Many Cultures, Many Legacies 9Box 2.1 The Black Soil Layer of Northeast China Might Disappear in 50 years 21Box 2.2 The Value of Biodiversity—Not only a Matter of Caring for Pandas 23Box 2.3 Beijing Road Traffic Air Pollution 28Box 2.4 Case Study: Tough Life in Xuanhua 30Box 2.5 Comparing Human Development Index with the Health Risk Index 35Box 3.1 When Resources Cease to be Enough 41Box 3.2 Sustainable Development in Reality 44Box 3.3 The School in the Sand Storms 46Box 3.4 Water Conflict Along the Yellow River 52Box 3.5 Water Prices, Changes Afoot 54Box 3.6 Land Tenure and the Rural Environment 61Box 3.7 The Olympics as a Driver of Environmental Change in China 66Box 3.8 China to Commercialise Water Supply 69Box 3.9 Market Based Instruments in a Planned Economy? 70Box 4.1 Chinese Government Ministries and Agencies with Environmental Responsibilities 76Box 4.2 Sustainable Development and China’s Agenda 21 77Box 4.3 A Dangerous Profession 78Box 4.4 SEPA’s Environmental Goals for the 10th Five Year Plan 78Box 4.5 Environmental Legislation and Regulation in China 81Box 4.6 Trying Emissions Trading 84Box 4.7 Exploring the Market Mechanism 84Box 4.8 Seeds of Action 92
Scenario Box 1 Development Scenarios for China 2Scenario Box 2 The Use of Scenarios to Analyse China’s Future Options 13Scenario Box 3 Key Issues and Critical Uncertainties 73Scenario Box 4 Choosing a Framework for Economic Change 85Scenario Box 5 Choosing a Path of Governance 87Scenario Box 6 Choosing a Framework for Environmental Change 94Scenario Box 7 Key Indicators for the Two Alternative Development Path Scenarios 98
Tables, Figures and Boxes

China Human Development Report xi
Annex Contents ListAnnex: Human Development Index and Environmental Indicators in China A1
1. Introduction A1
2. What is New in the HDI A1
3. Data Description A1
4. Methods for Computing HDI A1
5. Illustration of the HDI Methodology A2
6. Table A.1 HDI and its Components by Province 1999 A3Fig. A.1 Provincial Human Development Index 1999 A4Fig. A.2 Provincial Life Expectancy Index A4Fig. A.4 Provincial Income Index 1999 A5Fig. A.3 Provincial Education Index 1999 A5Table A.2 Life Expectancy by Province 1995 A6Table A.3 GDP per Capita and Income Index by Province 1999 A7Table A.4 Education Index and Enrolment Rate in Provinces A8Table A.5 Population Statistics in Provinces 1999 A9Fig. A.5 Provincial Natural Growth Rate of Population 1999 A10Fig. A.6 Provincial GDP per Capita 1999 A10Table A.6 Provincial GDP per Capita and its Components, 1999 A11Table A.7 Proportion of Employees with Different Education Level 1999 A12Fig. A.7 Provincial Illiterate Ratio 1999 A13Fig. A.8 Provincial Illiterate Ratio of Female Population in 1999 A13Table A.7a Proportion of Male Employees with Different Education Level 1999 A14Table A.7b Proportion of Female Employees with Different Education Level 1999 A15Table A.8 Fiscal Revenue and Expenditure by Province 1999 A16Fig. A.9 Per Capita Fiscal Revenue and Expenditure by Province 1999 A17Fig. A.10 Household Income per Capita in Rural and Urban Areas 1999 A17Table A.9 Urban Household Income per Capita and its Components 1999 A18Table A.10 Rural Household Income per Capita and its Components 1999 A19Table A.11 Number of Selected Durable Consumer Goods Owned in Rural Areas 1999 A20Table A.12 Number of Selected Durable Consumer Goods Owned in Urban Areas 1999 A21Table A.13 Tap Water Supply in Cities by Province, 1999 A22Table A.14 Supply and Use of Gas in Cities by Province 1999 A23Table A.15 Sanitation Statistics in Cities by Province 1999 A24Table A.16 Public Facilities in Cities by Province 1999 A25Fig. A.11 Per capita Daily Residential Consumption of Tap Water in Cities 1999 A26Fig. A.12 Percentage of Population with Access to Gas in Cities 1999 A26Table A.17 Consumption of Chemical Fertilizers in Rural Areas by Province 1999 A27Table A.18 Areas Covered and Affected by Natural Disasters by Province 1999 A28Table A.19 Environmental Protection Agencies and Staff by Province 1999 A29Table A.20 Discharge and Treatment of Industrial Wastewater by Province 1999 A30Table A.21 Emission and Treatment of Industrial Waste Gas by Province 1999 A31Table A.22 Discharge, Treatment and Utilization of Industrial Solid Wastes by Province 1999 A33Table A.23 Pollution Accidents by Province 1999 A35Table A.24 Discharge of Pollutants from Daily Life by Province 1999 A36Fig. A.13 Volume of Wastewater Discharged from Domestic Sources by Province A37

UNDPxii
Fig. A.14 Consumption of Oxygen by Domestic Wastewater by Province A37Table A.25 Investment in Industrial Anti-pollution Projects by Province A38Fig. A.15 Emission of sulfur dioxide from domestic souces by Province A40Fig. A.16 Emission of dust from domestic sources by Province A40Table A.26 Areas of Planting Trees by Province A41
7. Provincial Health Risk Index for China A42Introduction A42Methods A42Calculation of index for each province/city A42Example of the HRI Methodology A42Table A.27 Data Tabulation for Provincial Health Risk Index A44Table A.28 Summary of Provincial Health Risk Index A46Table A.29 Major Laws, Measures and Regulations in China for Conserving Biodiversity A47
AbbreviationsABC ammonium bicarbonate (fertilisers)ACCA21 Administrative Centre of China’s Agenda 21ADB Asian Development BankAEZ Agro Ecological Zones (IIASA)API Air Pollution Indexbcm Billion cubic metresBEDI Beijing Environment and Development InstituteBP British PetroleumBWG Biodiversity Working Group (CCICED)CAS Chinese Academy of ScienceCCICED China Council for International Co-operation on Environment and DevelopmentCDIAC Carbon Dioxide Information Analysis CentreCEN China Environmental NewsCGT China Green TimesCHDR China Human Development ReportCO2 Carbon dioxideCOD chemical oxidation demand (water pollution load indicator)COPD chronic obstructive pulmonary diseaseCRED Centre for Renewable Energy DevelopmentEIA Environmental Impact AssessmentEPB Environmental Protection Bureau (local level environmental administrative units)ERI Energy Research InstituteERM Environmental Resources ManagementERPC Environmental and Resources Protection Committee under the NPCFAO Food and Agriculture OrganizationFDI Foreign Direct InvestmentFON Friends of NatureG77 Group of 77 Developing CountriesGDP Gross Domestic ProductGEO Global Environmental Outlook (UNEP)GMO Genetically Modified OrganismGNP Gross National ProductGONGO government non-governmental organisationHC hydrocarbonHDI Human Development Index

China Human Development Report xiii
HRI Health Risk IndexIED Institute of Environment and Development (China)IIASA International Institute for Applied Systems AnalysisISO International Organization for StandardizationkWh kilowatt-hoursLEAD Leadership for Environment and DevelopmentLNG liquid natural gasMBI Market based instrumentsMOST Ministry of Science and TechnologyNBS National Bureau of StatisticsNEPA National Environmental Protection Agency, predecessor of SEPANGO non-government organisationNOx Nitrous oxides, includes nitrogen dioxide (NO2), nitrogen monoxide (NO), and dinitrogen oxide (N2O)NPC National People’s CongressODS ozone-depleting substanceOECD Organization for Economic Co-operation and DevelopmentPAH polyaromatic hydrocarbonsPRC People’s Republic of ChinaR&D research and developmentRMB Renminbi Chinese currency (yuan)RTCCCCS Research Team of China Climate Change Country StudySDPC State Development Planning CommissionSEI Stockholm Environment InstituteSEPA State Environmental Protection AdministrationSETC State Economic and Trade CommissionSida Swedish International Development Cooperation AgencySO2 Sulphur dioxideSSB State Statistical BureauSSTC State Science and Technology CommissionTCM Traditional Chinese MedicineTFR total fertility ratesTSP total suspended particulateTVE township and village enterprisesUNDP United Nations Development ProgramUNEP United Nations Environment ProgramUNFCCC United Nations Framework Convention on Climate ChangeUSD United Sates dollars (currency)USEPA United States Environmental Protection AgencyVOC volatile organic carbonWCED World Commission on Environmentat and DevelopmentWHO World Health OrganizationWRI World Resources InstituteWWF World Wildlife Fund

China Human Development Report 1
Setting the Scene: Grounds for Green Reform
Chapter 1
Setting the Scene: Grounds forGreen Reform
China enters the new millennium with “favourable tim-ing, terrain, and unity of people”, as the old Chinesesaying goes. After two decades of double-digit growth,China’s economy continues to be one of the most dy-namic in the world. Hosting the 2008 Olympics in Beijingwill grant China extraordinary opportunity for interna-tional attention and scrutiny. Accession to the WorldTrade Organisation (WTO) is certain to provide theworld’s most populous country with unprecedented ac-cess to world markets.
The promises for growth and development, however,rest against a backdrop of persistent environmental deg-radation. Population pressure continues to trap the coun-try in vicious cycles, challenging the world with its mostdaunting environmental and social problems. Ever-wors-ening industrial pollution is affecting human health. In-come disparities, particularly between the fast-develop-ing areas along the eastern coast and the underdevel-oped western inland regions, are widening. The combi-nation of poverty and unemployment poses a potentialthreat to social stability.
“History has left little manoeuvring room to us and toour posterity; the time we have to make change is short;and the conditions we will have to accept are arduous”(National Conditions Analysis Group, 1988). Nearly fif-teen years after the Chinese Academy of Sciences, in itsreport on national conditions, cautioned that “China isnow faced with multiple simultaneous crises”, the situa-tion has not improved substantially. Population, land,environment, and food supply, as identified in the 1988report, persist as the four major impediments restrainingChina’s long-term economic and social development.
Recent actions across China show that its govern-ment and people are trying hard to grapple with the envi-ronmental challenges, realising more and more that envi-ronmental constraints on economic growth and socialdevelopment matter crucially to the nation and its peo-ple. For better or worse, changes in China’s ecologicalenvironment and the living standards of its 1.3 billioncitizens will have significant repercussions on the coun-try and the rest of the world.
The opportunities for greening development in Chinaare significant and so are the attendant challenges. Acloser look at the complexities of the country, its diverseenvironment, and its people will help readers understandthe potentials and constraints. With this in mind, wehave given the China Human Development Report: Mak-ing Green Development a Choice an underlying themelinking people to the environment.
1.1 People and the Environment in ChinaPrevious editions of the China Human Development Re-port (UNDP, 1998a and 2000) examined the great transi-tions that Chinese society has undergone and the majorforces shaping China’s path of development. Theseforces include the transition from a planned to a marketeconomy, pursuit of economic growth, rapid integrationwith the world economy, and institutional and govern-ance reforms.
The present report examines environmental trends anddegradation, which at first blush, can be rationalised asresults of past and ongoing development, although thereport goes on to demonstrate that the environment isnot simply a passive recipient of impacts. On the con-trary, environmental degradation has now become soacute that it is one of the main factors forcing futuremulti-faceted change. Indeed, environmental factors arelikely to constrain, or even reverse, social and economicprogress.
The main objectives of the current report are to re-view the environmental challenges in today’s China, toexamine the people-environment nexus on how environ-mental changes affect people’s health and livelihoods,to see how people’s choices can change the environ-ment, and to explore possible options for a sustainablefuture. Underpinning the report is a fundamental beliefthat although real opportunities exist for stopping andeven reversing environmental degradation in China, un-leashing those opportunities requires firm choices to bemade now. Notably, the dynamism in the economy andsociety, the advances in economic, technical and gov-ernance spheres, and the increasingly international na-

Chapter 1
UNDP2
ture of China, all contribute to the solid foundation onwhich China can build a sustainable future.
This introductory chapter discusses the themes run-ning through the report. These include the interactionsbetween China’s people and its environment, the vastdiversity and variations across the country, the philo-sophical and cultural foundation and the changing per-spectives on environment and development, and the ne-cessity to shift the development paradigm in order tofind the path towards a sustainable future. China candecline towards environmental catastrophe, or it canbecome a leading environmental model. Throughout thereport, the case is made that good governance, com-bined with a committed populace, can set China firmlyon a sustainable path. If this can be done, protecting thenatural resource base will contribute to economic growthand social stability.
Chapter 2 provides a snapshot of the status of Chi-na’s environment, illustrating how the activities of peo-ple have affected the environment and how environmen-tal decline is affecting people and the economy. It alsonotes that problems attributable to limited and unevenlydistributed land, water, and forest resources, already abottleneck to development, are compounded by severelypolluted air and water, further damaging health, agricul-ture and other sectors of the economy.
Whereas chapter 2 looks at indicators and the impactof environmental decline, chapter 3 examines the forcesand trends that determine environmental change, dis-cussing the major future uncertainties surrounding Chi-na’s development path over the next half century. Thesedrivers include population growth and changing popu-lation patterns, economic growth, changing civil soci-ety, and technological advances. Other drivers, such asinternational co-operation or global environmentalchange, may originate outside China.
The shift to a sustainable future requires strategicand immediate choices and actions. In recent years Chi-nese leaders and people have stepped up their responses
to environmental challenges. Chapter 4 critically investi-gates those responses and discusses their merits andinadequacies. Even as we witness an increase in com-mitment and awareness among leaders and the public, itis important to confront two overall weaknesses in theresponses. First, there is too much reliance on the stateto address problems. Second, the responses in somecases have been too reactive, with a focus on costlycleanup rather than effective prevention. In general, theresponses have mainly focused on environmental im-pacts (reviewed in chapter 2) rather than underlying en-vironmental drivers (reviewed in chapter 3).
Chapter 5 concludes that for China’s leadership—and,to an increasingly important extent, Chinese people—the time to make the right choices is now. Today’s deci-sions—or absence of decisions—will have significantinfluence on the degree of sustainability in China’s fu-ture development for many years to come.
1.2 Chinese Landscapes—the Diversity of AContinentChina, a land of diversity, stereotypes, and extremes, isin many aspects more like a continent than an individualcountry. Hemmed in by major mountain ranges in thesouthwest and west, with deserts and steppes to thenorth and the Pacific Ocean to the east, China’s heart-land is very much an enclosed geographical entity. Nev-ertheless, the ecological stress created by a populationthat is approaching 1.3 billion, in combination with thepressures generated by the country’s rapid economicdevelopment, make China’s environment a global con-cern.
China covers almost 10 million square kilometres—the same size as the United States, or Europe to theUrals—and its physical conditions, climate, precondi-tions for human settlements, and culture vary tremen-dously across the vast territory. In order to understandChina’s environmental situation, one must explore thewhole spectrum of environmental problems—from glo-
SCENARIO BOX 1 DEVELOPMENT SCENARIOS FOR CHINA
The report provides alternative scenarios to help illustrate two possible development paths—both outcomes of develop-ment policy choices. The Perilous Path sketches development based on reactive policies, where downright bad decisionsare not so much a problem as the absence of more proactive, reform-oriented policies. Although absence of publicparticipation or policies that put the market to work for the environment might not affect short-term economic growth, itwould lead to serious, continued degradation of the environment and depletion of natural resources, leaving large parts ofthe Chinese population behind in the development process. This path is perilous in that it reduces the Chinese society’sresilience to withstand uncertain future developments, undermines China’s mid- and long-term growth potential, andincreases the risk for social unrest and political instability. In short, it points to increased vulnerability. The Green ReformPath builds on proactive environmental policies and the development of social partnerships, as well as policies to sharemore equitably the benefits of the changing economy. Although some of the damages to ecosystems from previousdecades, in particular biodiversity losses, are irreversible, some restoration has occurred, and the human impact on theenvironment has decreased as a result of the integrated economic and environmental policies.

China Human Development Report 3
Setting the Scene: Grounds for Green Reform
Figure 1.1 Population Density Map of China (Heilig, 1999)
Figure 1.2 Precipitation Map of China (Heilig, 1999)

Chapter 1
UNDP4
bal issues to local problems—while taking into accountthe preconditions and the limitations set by its naturalendowments in interplay with human development.
China’s environmental situation is closely connectedto a high population pressure on scarce resources. Popu-lation density averages 120 people per square kilometre.Although this figure is slightly higher than Europe’s 96,it does not, in itself, reveal the full severity of the situa-tion.
Being mountainous and with a harsh and very dryclimate, the major part of China’s western half—the Ti-bet-Qinghai plateau, and the Gobi and Taklamakandeserts—can support only limited populations. Instead,it is the river valleys and fertile river plains in the easternparts of China that have offered favourable climatic andphysical conditions for human settlements, and they arewhere the first Chinese civilisations developed. Today,some of the world’s most densely populated and inten-sively utilised resource bases are situated here. Cumula-tive calculations of the distribution of China’s land areaand population density show that:• nearly 115 million people—10% of the population—
live on a total area of just 50,000 square kilometres,merely 0.5% of China’s total landmass, an area thataccounts for the most densely populated countiesand cities with an average of ca. 2,500 people persquare kilometre;
• half of China’s population occupies less than one-tenth of the country’s total land area with an averagepopulation density of 740 people per square kilome-tre;
• more than 90% of China’s population is concentratedin less than one-third of the country, where the aver-age density of 350 people per square kilometre equalsthat of the most densely populated countries in Eu-rope (Heilig, 1999).
Given this diversity, and given the size of China, anyattempt to describe and analyse its environmental situa-tion begins by reducing the country into a manageableset of homogeneous zones and regions. This is no easytask. This section focuses on the prevailing physical(topographic, climatic, and geological) influences acrossChina.
Topographical FeaturesIn many respects, China’s physical relief and basic geo-graphical conditions dictate the scope and limitationsfor its development.
The relief of China may be divided into three levels,moving from west to east. The first level includes theTian Shan Mountains, the Pamir and the Qinghai-TibetPlateau, the latter of which is located in both the TibetAutonomous Region and the province of Qinghai and
with an average elevation of well over 4,000 metres abovesea level, is the highest upland area in the world. Themountains descend sharply to heights of between 2,000and 1,000 meters, after which basins intermingle withplateaus. This second level includes the Mongolian Pla-teau, the Tarim Basin, the Loess Plateau, the SichuanBasin, and Yunnan-Guizhou highland region. The thirdlevel—the eastern China lowlands—extends to the ChinaSea, almost the whole area made up of hills and plainslying less than 500 meters above sea level. The generaldecrease in altitude from west to east means that mostrivers flow eastward, connecting China’s interior with itscoastal areas.
The rolling and rugged land surface makes ecosys-tems and human settlements increasingly vulnerable tochanging conditions in, for example, land-use patterns,or climate. In addition, the jagged relief—emphasised bya mean elevation of no less than 1,500 meters, or twicethe world average—puts extra strain on developmentefforts, particularly infrastructure development, and in-creases the energy intensity of transportation consider-ably. Energy-efficient railway systems are particularlydifficult to develop.
A particular effect of China’s geomorphology is thelocking of its northwestern half into an interior drainagebasin that has no connection to the sea and correspond-ing roughly to the area that receives less than 400 mmprecipitation per year, i.e. the yellow/orange part in Fig-ure 1.2. The combination of lack of sea drainage andvery low precipitation adds to the fragility of ecosys-tems and societies in China’s western areas.
Climatic InfluenceThree climatic zones can also be identified that corre-spond to a limited extent with the topographical zones.Using climatic features, China can be divided into threemajor areas: the East Monsoon Region, the NorthwestInterior Region, and the Qinghai-Tibet Plateau.
The East Monsoon RegionThe East Monsoon Region, the Chinese heartland andhome for 95% of the population, has two main character-istics. First, the climate is dominated by the East Asianmonsoon, which governs both the spatial and seasonalprecipitation patterns. In general, rainfall decreases fromthe southeast towards the northwest, concentrated dur-ing the warm half of the year. The high variability of themonsoon frequently leads to floods and droughts in thearea. Second, the Region contains all major low-lyingalluvial plains in China – the Northeast Plain, North ChinaPlain, Middle and Lower Yangtze Plains, Pearl River Delta,and Sichuan Red Soil Basin, all belonging to the mostintensively cultivated and densely populated areas inthe world. With few exceptions, the landscape of the

China Human Development Report 5
Setting the Scene: Grounds for Green Reform
East Monsoon Region has been altered by millennia ofagricultural activities. As a result very little natural veg-etation is left, and the extreme population density pro-duces enormous human pressure on most resources.
The climate ranges from subtropical and tropical inthe far south, to temperate and cold-temperate in thenorthernmost parts. Summers are warm and humid allalong the eastern lowlands with July mean temperaturesgenerally above 25ºC, and the temperature range betweenNorth and South China is quite small with the July iso-therms roughly running parallel to the coastline. Thenortheast is cooler with mean July temperatures 15–25ºC.The Siberian air mass, which dominates the climate dur-ing the winter half of the year is quite stable, extremelycold and dry, and often has temperature inversions. Win-ters in China are therefore cold for its latitudes and verydry. Mean temperatures in the far south still do not fallbelow 15ºC in January, while the northeast has –10ºCand below. The cold winter climate, in combination withthe common temperature inversions that hinder air cir-culation, make the air masses in North China’s cities par-ticularly vulnerable to air pollution.
A north-south divide within the eastern monsoon re-gion corresponds roughly to a line along the QinlingMountains and the Huai River. The northern half, withits flat relief and long history of agriculture, containsalmost two-thirds of China’s cultivated land. However,
the northern half receives only about one-sixth as muchrain as the national average. This imbalance betweennorth and south in allotment of water resources and farm-land has led to a situation where the northern half of theEast Monsoon Region is one of the most water-scarceareas in the world, a situation which is even more criticalsince more than half a billion people live in the area. Thelack of water makes societies and ecosystems exceed-ingly fragile and vulnerable to new and increasing envi-ronmental pressures.
The Northwest Interior RegionThe Northwest Interior Region comprises an unbrokenrampart of territory that has served through history toseparate and protect the Chinese heartland from its north-ern and western neighbours. Covering about one-thirdof the country, the Region is sparsely populated andcontains only a small percentage of the total population.
Located deep in the Eurasian Continent, the North-west Interior Region is a vast, semiarid or arid territorycharacterised by mountain ranges, desert plateaus andbasins. Summers are hot with July mean temperaturesreaching above 25ºC, particularly in the deserts. Wintersare very cold with January averages below –12ºC for mostof the territory and large areas reaching below –20ºC.Water is scarce, with limited rainfall. Most rivers are notperennial, and with almost the whole area belonging to
Figure 1.3 Relief Map of China (Heilig, 1999)

Chapter 1
UNDP6
the interior drainage basin, rivers disappear into the sandor discharge into salt marshes or saline lakes, the mainexception being the areas watered by the Yellow River’snorthernmost bend.
Apart from the massive mountain ranges and vastdeserts, the rest of the Northwest Interior Region con-sists of more or less fertile plateaus with grasslands andsteppes. The traditional livelihood, particularly amongthe indigenous populations such as Mongolians andUygurs, has been herding—cattle, sheep, horses, goats,donkeys, and camels—rather than agriculture. Agricul-ture has been limited to areas with somewhat secure watersupply, wheat and corn being the most important staplecrops, but with substantial orchard production, espe-cially along the middle and lower reaches of the peren-nial rivers where snow-melt water from the mountainssupports oasis farming.
Northwest arid China is an area with harsh living con-ditions and the human impact has been limited, mainlydue to the low population pressure. Up to now, the re-gion has had limited economic importance, but recentevidence of a wealth of natural resources, has sparkedbold development plans. There are many problems as-sociated with developing a vast, desolate, and jaggedregion, where the sheer geographical conditions makeany infrastructure development effort both cumbersomeand delicate. In addition, most of the ecosystems arefragile and natural limitations, such as chronic lack ofwater, reduce the capacity to support larger populations.
The Qinghai-Tibet PlateauKnown as “the roof of the world”, the Qinghai-TibetPlateau is a mountain wilderness that occupies one-quar-ter of China, but is the home of less than one per cent ofthe population. With an average elevation of more than4,000 metres, the plateau itself is the highest in the world.Most of the area belongs to the interior drainage basin,but the Qinghai-Tibet Plateau is nevertheless the sourceof six of the world’s longest and most legendary rivers:Indus, Brahmaputra, Ganges, Mekong, Yangtze, and Yel-low.
Extreme altitude gives the Qinghai-Tibet Plateau anarray of very special characteristics, including a thin at-mosphere, extreme difference between day and night tem-peratures, large areas of permafrost, strong solar radia-tion, and strong winds. Due to the special conditionsthat prevail in different altitude zones, the Qinghai-TibetPlateau has rich fauna and flora, with many rare speciesthat are peculiar to the very special ecological condi-tions. Still, natural conditions are unfavourable to hu-man activities, not only because the harsh climate isinconducive to supporting larger societies but even morebecause the Tibetan Plateau is so rugged that simplygetting there and back again sets its own limits.
Key ZonesMany, perhaps an infinite number, of unique areas areidentifiable within China. Taking into account the above-described climatic and topographic factors, and impos-ing on them the development and political factors, a se-ries of zones can be identified and analysed from anenvironmental point of view. Most of China falls into atleast one of five such zones, proposed below. It is impor-tant to note that each zone includes industrial and agri-cultural areas; modern cities and remote, “backward”communities; and developed and undeveloped areas.There is, also, an inevitable overlap among these zones.
The “West”The “west” covers more than half of China—includingthe provinces of Gansu, Guizhou, Ningxia, Qinghai,Sichuan, Shaanxi, Tibet, Yunnan, and Xinjiang. Many ofthese provinces and autonomous regions are the samesize (in terms of population and area) as many Asiancountries. And as can be seen from the Annex, in termsof Human Development, some would belong to the cat-egory of least-developed nations. These areas generallyalso have low population density, high populations ofminority groups, large mineral deposits, and fragile envi-ronments. The development of this area is currently oneof the most fundamental development objectives of theChinese government for the next decades—the so-calledWestern Development Strategy. Much of this area suf-fers from severe land degradation, in part due to the aridconditions, although the southernmost extremity—Yunnan and Guizhou—is naturally lush and green.
The “Northeast”The “northeast” consists of Heilongjiang, Jilin, andLiaoning provinces. This area was the industrial heart-land of China for the first decades after 1949, and is hencethe home of the heavy, old, high-polluting, low-efficiencyindustries. As industry restructures and many state-owned enterprises lose competitive advantage, unem-ployment has become a problem. This same area alsoincludes China’s largest grain-producing region and largefloodplains.
The Central and Southern Coastal ProvincesOver the past two decades, the central and southerncoastal provinces that stretch from Shandong toGuangdong, including Jiangsu, Shanghai, Zhejiang,Fujian, and Hong Kong, have experienced the most rapideconomic growth. New industrial sectors, often high-tech, have been spurred on by economic reform, foreigninvestment, and export-oriented strategies. Rapid eco-nomic growth has made this area a magnet for invest-ment and migrant workers. In these densely populatedeastern areas, some of the regions of interwoven urban,suburban, industrial, and agricultural areas are as large

China Human Development Report 7
Setting the Scene: Grounds for Green Reform
as some European countries. Population pressure hasgrown to a level where per capita availability of mostresources—including basic necessities such as water—are among the lowest in the world. Unchecked pollutionfrom industry and agriculture is mirrored in mortality sta-tistics of pollution-related diseases. This area covers theYangtze and Pearl River estuaries, and two of the mainrice-growing regions of the country. Economic growthhas focussed on cities and towns, and many people liv-ing in rural and mountainous areas have not benefitedfrom these developments.
Southern Central ChinaSouthern central China includes Anhui, Chongqing,Hubei, Hunan, Jiangxi, and Sichuan provinces, stretch-ing along the Yangtze River valley from glistening, mod-ern Shanghai to the Tibetan Plateau. The region is hometo a large population and extensive rice-growing areas.Mountainous and hilly regions contain ecosystems withhigh biodiversity, whereas low-lying lands are subjectto regular inundation by the Yangtze. Hence there aregreat, low-lying lakes.
The Dry, Densely Populated “North”This area covers primarily Beijing, Hebei, Henan, Shanxi,and Tianjin provinces and municipalities, with small partsof adjacent provinces. Lying close to the bed of the Yel-low River, this area is often considered the cradle of Chi-nese civilisation. The region has fared reasonably wellin economic terms since 1949, both before and after thereforms. However, land degradation and water shortagesthreaten to undo most of the social and economic ad-vances made in the region.
1.3 Tracing A Historic and CulturalFoundationHuman attitudes towards nature and the way humansocieties have affected natural systems in the past arecrucial elements for our understanding of what is goingon in with the environment and which options are avail-able (Ludwig, 2001). Five millennia of unique cultural,economic, social, and political development have shapedthe Chinese society as it enters the new millennium. Thelast two centuries involved dramatic changes, originat-ing in the decline and final breakdown of Imperial Chinain 1911 and leading up to the establishment of the Peo-ple’s Republic of China in 1949. This legacy influencesthe way individuals think and act, it affects priorities andthe way groups form, and it affects how governmentoperates. In short, it affects the environment.
As far back as the 2nd century BC, the Qin Dynasty inChina had a Farmland Law that actually prohibitedagainst felling trees, filling up of dams, burning grass, orcatching fish before and during the reproductive periodin the spring and early summer (Zhang, 1999). This and
similar examples show how traditional Chinese philoso-phies were built on a reverence for nature. More inter-estingly, it reflects a deeper understanding of the valueof protecting natural resources against overexploitation.But despite this strong foundation in Chinese philoso-phy of nature as something to be treasured and caredfor, China has failed to escape environmental problemsthroughout ancient and modern history.
This section traces the relationship between the hu-man society and the natural environment through Chi-nese history. After reviewing how the understanding ofnature has been reflected in human behaviour, and insocial and political structures, the section examines howthe traditional human – nature relationship played out inmodern Chinese history, and how it could play a role inthe pursuit of sustainable development.
Traditional Ideas of NatureTwo concepts are essential for our understanding of thetraditional Chinese view of the universe: yin-yang, thetwo complementary forces known through the yin-yangsymbol in figure 1.4; and wu xing, the five elements,metal, wood, water, fire, and earth. Yin and yang—firstdescribed in the ancient classic Yi-Ching (the Book ofChanges)—are seen as two cosmic forces that shapeand balance all cosmic matter, including human exist-ence. As opposites—yin literally meaning “the moon”and yang “the sun”—the yin and yang forces are incontinuous, dynamic interaction. The resulting flux andtension produces the five elements, which in turn makeup the basic components out of which all things in theuniverse are composed. In the traditional Chinese un-derstanding, the cosmic order—and thereby also thesocial order—is secured by maintaining the balance be-tween yin and yang and the proper mix and relationsamong the five elements. Central concepts of this an-cient view include strong notions of coexistence and
Figure 1.4 The yin-yang symbol

Chapter 1
UNDP8
coevolution in the relationships of humans with nature(Cortner and Moote, 1999).
The human relationship with nature in traditional Chi-nese philosophy was defined and interpreted with theyin-yang principle as a basic concept. Yin and yang forcesare present everywhere in nature, such as water beingyin and fire yang, and through human interaction withnature these natural forces had to be managed in orderto preserve the delicate balance. The art of acting inharmony with the yin and yang forces was laid downthrough the practice of Feng-shui, or geomancy, whichprescribes how to act not to disturb the natural flow ofyin and yang in the landscape.
In the human–nature relationship, nature is under-stood as yin and therefore the receptive part, while hu-man is yang and the active part. Accordingly, any ag-gressive human action upon nature would violate theprinciple of balance, and excessive behaviour would beconsidered unnecessary and potentially damaging. Feng-shui—which is still actively practiced in China, for exam-ple, during the construction of skyscrapers in the largercities—thus describes a way of living harmoniously with,rather than conquering, the natural world. The idea ofyin-yang balance, therefore, provides a basic principlefor treading more gently on the earth.
Three broad philosophical traditions—Taoism, Con-fucianism, and Buddhism—prevail in China. Confucian-ism and Taoism share the same fundamental ideas, basedon yin-yang and wu xing, of a cosmic harmony thatevolved from the ancient Chinese view of the universe.Buddhism, however, entered China from India at a laterstage, and although it enjoyed an interregnum as a domi-nant philosophy in the middle of the first millennium,lost its influence during the later Tang dynasty, in themid-eighth century, while Confucianism grew to a statusof “imperial philosophy”. Yet, Buddhism is still practicedin China, particularly as a folk religion with many simi-larities to, and often mixed, with Taoism. Although Con-fucianism became the guiding principle of Chinese civi-lisation in the course of the last millennium, Chineseunderstanding of nature still reflects a mix of Confucianand Taoist ideas. An old Chinese saying portrays thetypical imperial official as abiding by strict Confucianrules during professional service, while devoting privatelife to Taoist virtues of seeking the heart of natural mys-ticism through poetry and arts. Similarly, Chinese soci-ety’s relation to nature has been dominated by valuesrooted in Confucianism, whereas Taoist beliefs havebeen nurtured in the private sphere.
Taoism—nature as a sacred pattern for societyAlthough the pursuit of harmony, balance, and order arecentral to both Confucianism and Taoism, the two phi-losophies differ when it comes to “how” and “why”.
“Tao” means “the way” and in relation to travel, Taoismteaches that the journey is more important than the des-tination—that “the way” people act is as important oreven more important than the reason for acting. “Theway” people are to live their lives is in coexistence andbalance with each other and with nature, following theexample that, according to Taoists, is set by nature itself.Taoism thus seeks accommodation with nature and be-lieves and advocates harmony between “heaven andhumankind” (Tickell, 2001).
For a Taoist, nature is sacred and animated, and byliving simply and within the scope of blessings offeredby nature, with a maximum of well-being but a minimumof consumption, humans may liberate their souls. Tao-ism preaches that material wealth in itself is no hindranceto liberation of the soul, rather, it is human attachment towealth and the craving for pleasurable things, rather thantheir enjoyment, that are problematic.
Given its minimalist principles of a simple life in har-mony with nature, coupled with a sober, slightly anar-chic distrust of society, Taoism was not the spiritual rawmaterial on which to build a state philosophy. It is scarcelysurprising, then, that Confucianism, with its well-devel-oped social structures, roles, and moral codes becamethe guiding principle of the Chinese state.
Confucianism—nature as a reflection of the social orderFor Confucians the social order is embedded in a largercosmic order that builds on a number of hierarchical so-cial relations, the top one being the “mandate of heaven”according to which the emperor was granted the right torule “under heaven”. In the Confucian understanding ofthe world, nature is not a sacred model for human behav-iour; instead the natural environment and the societyare viewed as each other’s reflections. Any human ac-tion on nature is thus understood and evaluated in rela-tion to its social implications, and activities with the pur-pose to improve nature are seen as beneficial also tosociety. It is on the basis of this pragmatic and humancentred view that the Chinese civilisation has grown andthe Chinese landscape has been altered for thousandsof years, and extension of agriculture, felling of forestsfor building material and for improving the defenceagainst hostile northern tribes, dredging of channels fortransport, are only a few of the processes that have en-tirely changed the landscape of eastern China.
At the same time the environmental consequenceshave been far-reaching. First, the Confucian principlesproved so efficient in utilising nature for improving so-cial conditions that mounting population pressuresstarted threatening both the natural basis for society, aswell as the social order itself. After having been the ar-guably most advanced and prosperous country in theworld by the late 18th century, China entered a century of

China Human Development Report 9
Setting the Scene: Grounds for Green Reform
turmoil that ended only with the Communist takeover in1949—a turmoil that except for blatant political misman-agement was caused by natural catastrophes in combi-nation with sharpening competition for scarce resources.Second, once the basic principles for the social orderchanged from the traditional Chinese view of harmonyand balance to the set of values that were to govern thesocial order after 1949, the pragmatic view of utilisingnature to serve the social order became a foundation formassive environmental destruction.
The War Against NatureAfter a century of devastating turmoil China had revertedfrom a position among the most prosperous countries inthe world by year 1800 to one of the worst mismanagedand poorest countries by mid 20th century. One of thebloodiest civil wars yet seen in the world may have killedas many as 80 million people in China throughout the19th century, at the same time as the coastal area of thecrumbling empire was exploited by western powers. Po-litical mismanagement and ruthless exploitation of peo-
ple and resources had impoverished the country andmade wide areas of eastern China increasingly vulner-able to the natural pattern of repeated flooding anddrought, which has been a basic condition for the devel-opment of the Chinese civilisation during thousands ofyears. In 1911, imperial China collapsed, and with it theconcept of the emperor’s “heavenly mandate” to rule.Chinese intellectuals argued that there must be some-thing inherently wrong with the basic concepts on whichthe Chinese civilisation had been built, and when theCommunists came to power in 1949 they did so with amandate to build a new China—a China that was to chal-lenge and break with most central aspects of the Chi-nese cultural tradition.
The break with the “old cultural evils” was inspiredby ideas rooted in Marxism-Leninism, where conflict,contradiction, and struggle were held not only as a natu-ral feature of society, but also as important means ofradical progress. The combination of Marxist-Leninistpolitical ideology and the traditional Confucian concept
Box 1.1 Many Cultures, Many Legacies
China is the home to many ethnic groups, often living in biodiversity rich areas. Their cultures often reflect the naturalenvironment, worshipping nature and attending to biodiversity. For example, most Chinese minorities have the concept ofso-called “fengshuilin” (geomantic omen forest). The Dai, Miao, Buyi nationalities and some other nationalities esteemsome mountain forests as “shenshan” (divine hill), longshan (dragon hill) and shengshan (sacred hill) where gods reside.Wildlife in these forests is regarded as the companions of gods and felling, hunting, browsing and reclamation isprohibited except for the rearing of medicinal plants and other minor products. Some “fengshuilin” traditions date backmore than a 1000 years.
The Dong nationality, living in the remote mountainous areas of the Hunan, Guangxi, and Guizhou provinces, is alsoaccustomed to planting “fengshuilin”. These “fengshuilin” vary in size up to 8 hectares. They reflect local peoples’worship of nature, but also provide many ecological functions such as water conservation, soil conservation, climaticadjustment and improvement, protection of rare and endemic species, and countryside beautification.
To protect the indispensable vine resource, Hali villages have vine forest reserves. Often over 100 years old, theseforests contain a diversity of biological species and compare favourably with local virgin forests. In addition, the Yaonationality and other minorities in the Dayaoshan Mountain also have the tradition of making agreements by engravingstones. This is called the “stele law” and includes regulations on protecting forests.
Many minorities’ religions are influenced by animalism - worshipping mountains, rivers, forests, animals or totems. Forexample, the Tibetans deem that trees hanging religious flags and the surrounding forests can not be destroyed; theKhalkhas worship Snow Leopards and cattle; totem worship prevails among the Gaoshan people and they highly praisetrees, bamboo, calabash, stone, soil, snakes, dogs, birds, insects, eggs and the Sun. Many plants are related withBuddhist doctrines, and among them the most important is the “bodhi tree”. Due to the varying natural conditions andreligious succession, “bodhi trees” are different in different nationalities and regions, but they mostly are local rarespecies such as gingko, bass (including “Nanjing Bass” and “Manchurian Linden”), jasmine, honeysuckle, megranate,clove, soapberry, palm, peony, and chrysanthemum (Jiao Yali and Zhang Yijun, 2000).
The Mongolia and Kazakstan nationalities living in the northern drought and semiarid regions and the nomadic Tibetantribes all have the custom of “Daochang” browsing (browsing in shifts), which helps to lighten the grazing pressureresulting in the sustainable use of pastures. In recent years pointing grazing has often been carried out, and a newmethod of protecting “glass Kulun” (meadow) has been developed by the pastoral people. This means meadows canrenew more quickly, and the carrying capacity is increased.
Not all minority practices have positive impacts on biodiversity. For example, hunting is popular among minorities living inmountains. The Green Peacock, a first grade nationally protected animal, was once widely distributed in the ZixishanMountains of Yunnan province but hunting by the Yi peoples contributed to its dramatic reduction (Long Chunlin et al.,1999).

Chapter 1
UNDP10
of man as the active part in the man – nature relationshipresulted in a confrontation between society and nature,where a nature portrayed as vicious and deceitful wasdeliberately set against the prospect of prosperousprogress of the human society. Nature had to be “con-quered” and “defied”—words reappearing in propa-ganda at the time, showing the aspiration to manipulatenature in order to boost agricultural production. Newsheadings from the early 1960s speak for themselves:“Chairman Mao’s Thoughts are Our Guide to ScoringVictories in the Struggle Against Nature”, “The LongBattle to Control the Huai River”, and “The United Willof the People can Transform Nature” (Hallding, 1991).
Although the fateful path that environmental devel-opment came to take after 1949 was largely influencedby communist ideology, the Chinese cultural tradition,particularly Confucianism, provided a deep-rooted foun-dation for the idea of human control over nature.
Environment? Not Our ProblemThe conviction that Chinese civilisation could and shouldmaster nature became a cornerstone in the socialist de-velopment project, paving the way for several decadesof polices that were either detached from any notion ofnatural limits, or ignorant about the risks associated withdevelopment efforts outside the scope offered by na-ture.
After a century of ruinous chaos with corruptive mis-government, civil and international wars, and endlessnatural catastrophes, economic reconstruction becamethe overriding goal when Mao Zedong’s communistgovernment took office in 1949. But already the first five-year plan, which envisioned China catching up with theUnited States in terms of total industrial productionwithin ten years, revealed a blatant lack of reality in theChinese future planning. “The Mass Movement for Eco-nomic Development” and “the Great Leap Forward” weremass campaign policies of the 1950s, which were so de-tached from the realities of the war-ridden country that—quite on the contrary to their fanciful goals—they re-sulted in large-scale capital destruction, economic de-cline, serious overexploitation of people and resources.
But the mad, zealous ambitions for catch-up-devel-opment did not stop even with the failure and humantragedy of millions dead that resulted from famine andthe Great Leap Forward at the dawn of the 1960s (Becker,1998). Although the worst insanities were halted, the1960s and 70s saw new development policies with littleor no foundation on basic natural conditions, such asextension of wet rice in water scarce areas, felling offorests far beyond regrowth, integration of severely pol-luting industries in residential and agricultural areas, andirrigation with polluted, often toxic industrial wastewaterleading to severe pollution of water sources and soils.
Among Mao’s headstrong policies, the idea that aChina with more people would provide defence againsta world of enemies is the one that left the most far-reach-ing consequences in terms of sustainable development.Mao paid little attention to the call from academic circlesthat limiting the growth of China’s population and imple-menting family planning should be part of the overalleconomic development strategy (Duan, 2000). From the1950s till the late 1970s, married couples were encour-aged by the government to have more children, and popu-lation jumped from 500 million in 1949 to one billion in1978, generating exacerbated pressure on farmland, for-ests, grassland and freshwater systems. When thesepolicies were finally reversed a quarter of century ago, apopulation momentum had already been created whichwill continue driving the population growth for severalgenerations to come (see further in section 3.1).
During the Cultural Revolution, industrial pollutionbecame rampant; in most cities, groundwater was se-verely polluted, and the ambient air concentration ofparticulates was exceedingly high. Ecological destruc-tion was beyond any parallel. Soil and water erosioncaused tremendous loss of nutrient and land productiv-ity. As an example the Dongting Lake, one of the largestfreshwater lakes in China, shrank nearly a third in size.
At the same time, environmental pollution was de-scribed by the government as “the vicious conse-quences” of capitalist societies in their drive to achievewealth—growth for the rich at the expense of the poor.Socialist countries like China, according to the rhetoricat the time, should not need to worry about the environ-ment because as propaganda bluntly put it “it is not ourproblem”. Along that line, the call to preserve environ-mental qualities and natural resources—even if it werefor strictly internal reasons—was muted (Duan, 2000).
The legacy of central planning, as illustrated in chap-ter 2, includes a staggering cleanup bill for the advancedstate of environmental deterioration. The pollution dauntsefforts to achieve true development for years to come.
Stockholm and AfterwardsChina’s environmental awakening came around 1972.When the Chinese government sent its first delegationto the United Nations Conference on the Human Envi-ronment in Stockholm, Sweden, that year, China was stilla very much self-enclosed society in the middle of theCultural Revolution turmoil.
Thirty years later, the Chinese government sees thevalue of employing the market to make environmentalprotection profitable and motivate a knowledgeable popu-lation to control compliance and environmental quali-ties. The Chinese people, especially the younger gen-eration, have become more conscious than ever of theimportance of having a clean environment and a decent

China Human Development Report 11
Setting the Scene: Grounds for Green Reform
quality of life. Over three decades, substantial changeshave taken place in both the system and public mental-ity.
The 1972 Stockholm Conference served to make theChinese delegation realise that China shared the prob-lems of environmental degradation with the rest of theworld. It was followed up, a year later, by the conveningof the first National Conference on Environmental Pro-tection in Beijing, and in 1974, the establishment by theState Council of the Group on Environmental Protection.These events, followed by a series of legislative effortsin the late 1970s, marked the beginning of the govern-ment’s efforts to place environment protection on thenational agenda.
Deng Xiaoping launched the economic reform in late1978, and the revised Constitution from the same yeardeclares, for the first time, “the State shall protect theenvironment and natural resources”. The 1979 promul-gation of China’s Law on Environmental Protection rep-resented the beginning of environmental legislative ef-forts that are still ongoing today.
Since 1983, environmental protection, along withpopulation control, has been described as a “fundamen-tal national policy” in official documents. In the past fewyears, the government has issued new guidelines stat-ing that “pollution prevention should be primary focus”for all industries; and “combining prevention and envi-ronmental remedy should be the basic policy”. Mostrecently, the term “sustainable development” has beenused as part of the national strategy. The governmenthas been experimenting with market-oriented tools inenvironmental protection management. The regulatorshave learned how to price drinking water and utilities,based on market values, how to trade sulphur dioxidepollution rights, and how to use taxation to regulate pol-lution-heavy industries. The concept of environmentalgovernance has become part of national discourse toencourage information disclosure and public participa-tion.
Notwithstanding these promising developments, thereis a long way to go before China could be said to be ona sustainable path. China is certainly not alone in facingpressing environmental problems, nor the only countrythat must deal with it from relative poverty and limitedcapacity. But the combination of a high and increasingpopulation pressure on already scarce resources, an al-ready critical environmental situation, and a bold pushfor economic growth—all these aspects add up to anuniquely incompatible situation. Therefore the environ-mental awakening since 1972, and the featuring of envi-ronmentally prudent development concepts in recentnational policies and strategies, must now be followedby a choice to implement sustainable development; a
choice that would increase the chances that Chinaachieves its future goals without sacrificing already con-strained natural resources and a deteriorating environ-ment, and without threatening the survival and develop-ment of future generations.
Listen to the Past; Learn from OthersAs the twentieth century drew to a close, it became in-creasingly clear that growth has its ecological limits.Developed countries learned the lesson through a cou-ple of centuries’ industrialisation, urbanisation, and blindbelief in the efficacy of exponential growth of both thehuman population and human economy. China, as theworld’s largest developing country, has learned its les-son dearly by following the footsteps of many devel-oped countries.
With increasing awareness worldwide, governmentsand peoples are moving towards sustainable develop-ment—the art of satisfying “the needs of the presentwithout compromising the ability of future generationsto meet their own needs”, to quote the 1987 BrundtlandReport (WCED, 1987). China is no exception.
At the dawn of the 21st century, China is wrapped upin the midst of rapid and fundamental societal, economic,and even political transition. At the same time China issearching its soul. The visions of bright and prosperousfutures are there, but the path that should lead the Chi-nese civilisation there is not clear.
In order to find the right track China needs to listen toits own past, while at the same time learning from theexperiences and findings of others.
1.4 Seeking A Sustainable Future?China’s future will be shaped by the choices made by itsleaders and the Chinese people. Although there is aninfinite number of possible futures for China, two op-tional pathways stand out on the basis of the previouslydescribed historical and cultural foundations. ScenarioBox 2 describes how a scenario-based approach hasbeen used in this report to assess China’s long-rangefuture options—involving such unpredictable aspectsas ignorance, surprise and volition—with the goal tosketch pictures about alternative futures for China tothe mid 21st century.
One possibility is a “growth-first future” called theperilous path. Based on trends in the last decades of the20th century the perilous path sketches a future Chinashaped by the ongoing process of globalisation, and acontinued, gradual spread of the dominant economicvalues and consumption patterns of industrial societies.
The other possibility is a “balanced-growth future”called the green reform path. Based on a firm choice tocontinue and deepen reforms, the green reform pathpaints a future China where traditional Chinese values

Chapter 1
UNDP12
for nature and the environment become a foundation forsustainable development, and where China continues tointegrate with the international community, learning frombest practices and gradually developing its own sus-tainable models.
The Perilous PathUnder the perilous path, China in the first decades ofthe 21st century faces two serious perils: continued so-cial instability and environmental degradation. These twotrends interact and reinforce as the poor suffer most fromthe degraded environment, and at the same time contrib-ute to further environmental stress in their desperationto eke out livelihoods. Human well-being and standardsof living improve slowly, but the degree of inequity con-tinues to increase. The economic growth continues, butthe pace is much slower than the last decades of the 20th
century—and, more importantly, the risks increase ofending up with considerably lower growth.
At the same time, the environmental impact per unitof activity decreases as technology becomes more effi-cient and pollution control improves. But the exponen-tial growth in the scale of activity overwhelms these im-provements and the overall demand for resources andlevel of environmental pressure continues to rise. Theemphasis on economic growth allows vested interestsof Chinese society, which benefit from market-drivengrowth, to maintain a strong influence along with thecentral government. Concerned with the threat to theirincomes, these interests successfully thwart major ef-forts to reduce environmental degradation. The publiccontinues to perceive environmental protection as a roleof the state, not individual responsibility. All these trans-late into very significant, negative impacts on the envi-ronment.
The Green Reform PathThe green reform path charts a different future. Thegradual deepening of environmental and social stressesprompt a popular outcry for a new development strat-egy. The engagement of civil society is reflected in amushrooming of NGOs seeking to promote transparencyand participatory processes in the governing of the na-tion. Citizens start taking own initiatives to improve en-vironmental qualities, empowered by a greater recogni-tion from the government, and feeling they have a greaterstake in the well-being of their environment because ofthe return to traditional Chinese values for nature andenvironment. The aspiration for Western lifestyle is tem-pered by these new values and a respect for non-mate-rial values—the beauty of the environment, personalfulfilment and the importance of community.
The government responds by looking for mechanismsto increase the degree of partnership with citizens, cor-
porations, and NGOs. The partnership emerges into poli-cies that are pro-active on environmental issues, andstress increasing equity in sharing the benefits of a chang-ing economy. Although some of the ecosystem andbiodiversity losses from the previous decades are irre-versible, development and implementation of integratedeconomic and environmental policies will help reducethe human impact on the environment. As a result, natu-ral ecosystems start recovering, and biodiversity lossesare halted or even reversed. The impact of industrialisa-tion and urbanisation on the environment is tackled by aseries of forceful policy reform packages. These alterna-tive futures are illustrated in figure 1.5 below.
The Choice for a Green FutureThe choice is clear. Chinese people desire a sustainablefuture. Sustainable development is now adopted as theguiding strategy for national development. Environmen-tal protection, family planning, and education have be-come fundamental national policies. The government isbeginning to encourage public participation. The cen-tral authorities have begun to appreciate an articulate,knowledgeable population to help strengthen the en-forcement of regulations and policies.
Chinese people start taking actions for positivechanges. With more and more people awakening to thefact of reduced numbers of urban blue-sky days, water-ways turning into stinking puddles, suburban garbagedumps, and the environment-related health problems,they demand changes. Student groups have begunemerging on campuses to organise activities, such asgetting styrofoam containers banned on campus, andpublishing newsletters to raise public consciousness ofthe value of saving on water. When Beijing and a coupleother large cities started phasing out leaded gasoline,people in Dalian and Xiamen dialled their mayors’hotlines to request the same measures be adopted intheir own cities, because they want their children to growup healthy.
But uncertainties do abound—worries about the wayevents might unfold and the way people might respondto these events. The uncertainties have cultural, eco-nomic and environmental dimensions. For example, therise of inequality is beginning to surface in various formsof social unrest. What if conflict reaches a critical leveland social stability is threatened? Consumption patternsare undergoing a shift in Chinese society. What if con-sumption patterns gradually replicate those in the UnitedStates? From a cultural standpoint, responsibility forenvironmental protection is currently perceived to lielargely in the hands of the government. What if environ-mental awareness increases among the general public,and personal responsibility for the environment becomespervasive in Chinese society?
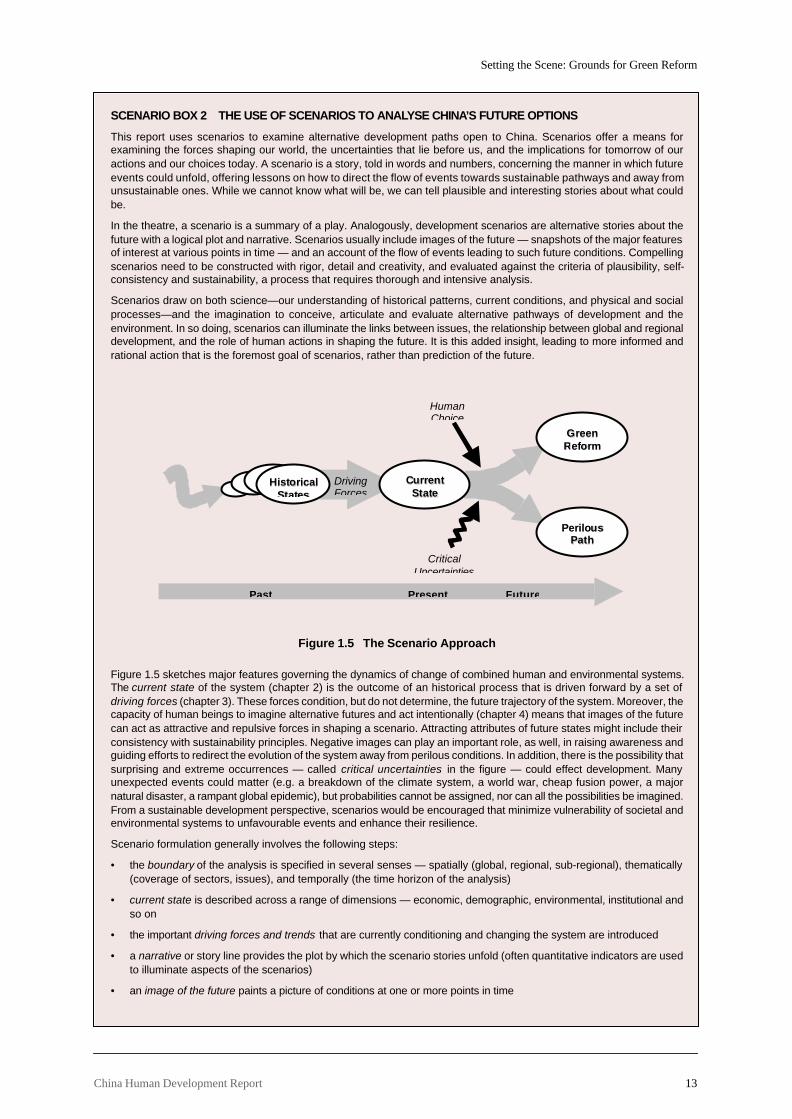
China Human Development Report 13
Setting the Scene: Grounds for Green Reform
SCENARIO BOX 2 THE USE OF SCENARIOS TO ANALYSE CHINA’S FUTURE OPTIONS
This report uses scenarios to examine alternative development paths open to China. Scenarios offer a means forexamining the forces shaping our world, the uncertainties that lie before us, and the implications for tomorrow of ouractions and our choices today. A scenario is a story, told in words and numbers, concerning the manner in which futureevents could unfold, offering lessons on how to direct the flow of events towards sustainable pathways and away fromunsustainable ones. While we cannot know what will be, we can tell plausible and interesting stories about what couldbe.
In the theatre, a scenario is a summary of a play. Analogously, development scenarios are alternative stories about thefuture with a logical plot and narrative. Scenarios usually include images of the future — snapshots of the major featuresof interest at various points in time — and an account of the flow of events leading to such future conditions. Compellingscenarios need to be constructed with rigor, detail and creativity, and evaluated against the criteria of plausibility, self-consistency and sustainability, a process that requires thorough and intensive analysis.
Scenarios draw on both science—our understanding of historical patterns, current conditions, and physical and socialprocesses—and the imagination to conceive, articulate and evaluate alternative pathways of development and theenvironment. In so doing, scenarios can illuminate the links between issues, the relationship between global and regionaldevelopment, and the role of human actions in shaping the future. It is this added insight, leading to more informed andrational action that is the foremost goal of scenarios, rather than prediction of the future.
Figure 1.5 The Scenario Approach
Figure 1.5 sketches major features governing the dynamics of change of combined human and environmental systems.The current state of the system (chapter 2) is the outcome of an historical process that is driven forward by a set ofdriving forces (chapter 3). These forces condition, but do not determine, the future trajectory of the system. Moreover, thecapacity of human beings to imagine alternative futures and act intentionally (chapter 4) means that images of the futurecan act as attractive and repulsive forces in shaping a scenario. Attracting attributes of future states might include theirconsistency with sustainability principles. Negative images can play an important role, as well, in raising awareness andguiding efforts to redirect the evolution of the system away from perilous conditions. In addition, there is the possibility thatsurprising and extreme occurrences — called critical uncertainties in the figure — could effect development. Manyunexpected events could matter (e.g. a breakdown of the climate system, a world war, cheap fusion power, a majornatural disaster, a rampant global epidemic), but probabilities cannot be assigned, nor can all the possibilities be imagined.From a sustainable development perspective, scenarios would be encouraged that minimize vulnerability of societal andenvironmental systems to unfavourable events and enhance their resilience.
Scenario formulation generally involves the following steps:
• the boundary of the analysis is specified in several senses — spatially (global, regional, sub-regional), thematically(coverage of sectors, issues), and temporally (the time horizon of the analysis)
• current state is described across a range of dimensions — economic, demographic, environmental, institutional andso on
• the important driving forces and trends that are currently conditioning and changing the system are introduced
• a narrative or story line provides the plot by which the scenario stories unfold (often quantitative indicators are usedto illuminate aspects of the scenarios)
• an image of the future paints a picture of conditions at one or more points in time
CCuurrrreenntt SSttaattee
PPeerriilloouuss PPaatthh
GGrreeeenn RReeffoorrmm
Past Present Future
Driving Forces
Human Choice
Critical Uncertainties
HHiissttoorriiccaall
SSttaatteess
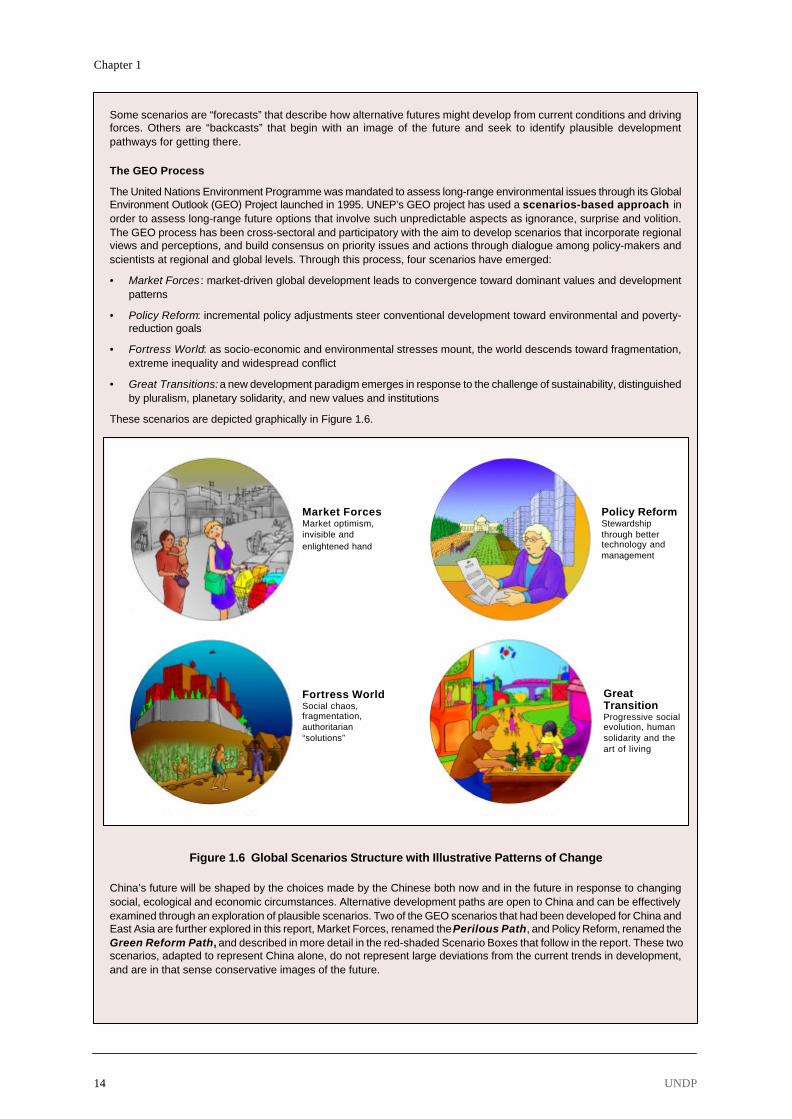
Chapter 1
UNDP14
Some scenarios are “forecasts” that describe how alternative futures might develop from current conditions and drivingforces. Others are “backcasts” that begin with an image of the future and seek to identify plausible developmentpathways for getting there.
The GEO Process
The United Nations Environment Programme was mandated to assess long-range environmental issues through its GlobalEnvironment Outlook (GEO) Project launched in 1995. UNEP’s GEO project has used a scenarios-based approach inorder to assess long-range future options that involve such unpredictable aspects as ignorance, surprise and volition.The GEO process has been cross-sectoral and participatory with the aim to develop scenarios that incorporate regionalviews and perceptions, and build consensus on priority issues and actions through dialogue among policy-makers andscientists at regional and global levels. Through this process, four scenarios have emerged:
• Market Forces : market-driven global development leads to convergence toward dominant values and developmentpatterns
• Policy Reform: incremental policy adjustments steer conventional development toward environmental and poverty-reduction goals
• Fortress World: as socio-economic and environmental stresses mount, the world descends toward fragmentation,extreme inequality and widespread conflict
• Great Transitions: a new development paradigm emerges in response to the challenge of sustainability, distinguishedby pluralism, planetary solidarity, and new values and institutions
These scenarios are depicted graphically in Figure 1.6.
Figure 1.6 Global Scenarios Structure with Illustrative Patterns of Change
China’s future will be shaped by the choices made by the Chinese both now and in the future in response to changingsocial, ecological and economic circumstances. Alternative development paths are open to China and can be effectivelyexamined through an exploration of plausible scenarios. Two of the GEO scenarios that had been developed for China andEast Asia are further explored in this report, Market Forces, renamed the Perilous Path, and Policy Reform, renamed theGreen Reform Path, and described in more detail in the red-shaded Scenario Boxes that follow in the report. These twoscenarios, adapted to represent China alone, do not represent large deviations from the current trends in development,and are in that sense conservative images of the future.
Market ForcesMarket optimism,invisible andenlightened hand
GreatTransitionProgressive socialevolution, humansolidarity and theart of living
Policy ReformStewardshipthrough bettertechnology andmanagement
Fortress WorldSocial chaos,fragmentation,authoritarian“solutions”

China Human Development Report 15
Setting the Scene: Grounds for Green Reform
Also environmental change in itself imposes a largedegree of uncertainty on China’s future. As chapter 2illustrates, many of China’s environmental changes areclose to critical thresholds, where natural resources, aswell as land and water ecosystems begin to deterioraterapidly. This perilous trend constitutes threats to Chi-na’s future development. The positive signal is that thegovernment and Chinese people are responding to thesethreats. But are the responses adequate, and are theysufficient to halt and reverse the negative trend? A closerexamination of the current state of the environment, thedriving forces behind those changes, and the on-goingresponses, will help the world’s most populous countrymeet these challenges and uncertainties and embark ona sustainable path.

Chapter 2
UNDP16

China Human Development Report 17
State of the Environment
Chapter 2
State of the Environment
It takes little insight to recognise that the large and stillincreasing population, the unevenly distributed and rap-idly depleting resource stocks, and the widespread de-terioration of environmental conditions are inextricablyrelated in China.
This chapter outlines the current state of the environ-ment in China by looking at how the natural environ-ment is affected by and is affecting various human proc-esses, human health included. The chapter starts with ageneral account of the land resources, followed by abroad description of the current status in terms ofbiodiversity, water, air quality, solid waste, and their im-pacts on human health. The chapter rounds up with abrief summary of the socio-economic costs, and the re-gional variations of the environmental impacts.
2.1 Land ResourcesThroughout history, the relationship between land re-sources and human development in China has beenmultifaceted.
On the one hand, history shows an element of resil-ience. For longer than any other agrarian civilization,farmers have tilled and tamed China’s soil, tapped itswater resources and used its forest and pastures, creat-ing a legacy of abundance and sustainable land use.Despite a population of nearly 1.3 billion, China has har-nessed its resource base to fuel the drive toward mod-ernization, providing most of its citizens with sufficientfood, clothing and housing, as well as a wealth of rea-sonably priced products for its rapidly growing urbanand industrial economy.
But on the other hand, this development has con-curred with a disquieting widespread degradation of landresources. With one-fifth of the world population andover two-thirds of the country’s land area as mountainsand deserts, China has always been stressed by scarcityof land suitable for human settlement and development.In recent decades—largely as a result of rapid economicgrowth, and despite numerous remedial government pro-grammes—this already strained people–land relationshiphas been further intensified and alarmingly worsenedwith widespread grassland destruction and
desertification, deforestation, soil erosion, salinisation,land pollution and biodiversity loss.
Grasslands“Lambs and cows are spotted everywhere when the windlowers the grass”.
This childhood pastoral poem evokes the image ofChina’s northwestern grasslands for many middle-agedChinese. But the image no longer holds in reality. Thegrasslands of the northwest have been receding at a rateof about one million hectares every year. China still has40 percent of its territory classified as natural grasslands.But 90 percent of this has been degraded to varyingdegrees (SEPA, 2001).
China has a total of close to 400 million hectares ofnatural grasslands, distributed mainly in the arid andsemi-arid north, northeast and northwest where annualprecipitation is less than 400 mm (see precipitation mapin figure 1.2). Constrained by the limited and highly vari-able rainfall, high slopes and elevation, most of thegrasslands in China are either of low productivity or dif-ficult to access.
About 100 million people live in grassland regions, ofwhich 11 million are herders, whose livelihoods dependon grassland. Nearly three-quarters of the grassland isused for livestock grazing, and roughly one-fifth for har-vesting of hay. Because of low productivity—merely one-third of the world average—and the Chinese preferencefor pork and poultry above beef, grassland contributesless than 10 percent to the meat production in China,compared with 70 percent in the US which has a compa-rable size of pastureland (Liu Jiang and Zou Lianwen,2000).
Widespread degradation has reduced the grasslandbiomass by 30-50 percent since 1950. It also has decreasedbiodiversity, and the grassland capacity for watershedprotection, contributing to ecological imbalances wellbeyond the grassland areas themselves. An example isthe increasing occurrence of sand storms in the Beijingregion during recent years, and the fact that they are soextensive that sand can now be tracked eastwards byweather satellite across the Pacific Ocean.

Chapter 2
UNDP18
The situation is critical over large areas, driven by anumber of concurrent, destructive processes includingconversion of grassland to cropland, overgrazing, tran-sition from nomadic to sedentary pastoralism, changingdiet, and unclear property rights.
Conversion of Grassland to CroplandThe rural roots of the Chinese Communist Party and theneed to feed a starving and continuously increasingpopulation have made policies to boost agricultural pro-duction a centrepiece of the Chinese development strat-egy since the early 1950s. By single-minded promotionof crops, almost 20 million hectares of grassland—orfive percent of the present grasslands—were convertedto croplands, by state-owned farms, state-owned for-estry operations, and other state-owned enterprises.Labelled “newly claimed virgin croplands” in the 1950s,these are now severely degraded. The trend continuedover the last few decades. Recent government surveysby the Ministry of Agriculture in 34 counties in eastInner Mongolia indicate that, between 1986 and 1996, atotal of almost one million hectares of grasslands wereconverted to irrigated crop production. Conversionsnationwide have resulted in desertification of a stagger-ing estimate of eight million hectares of grassland (Wuet al., 1999).
OvergrazingGrassland in China, mostly regarded as common prop-erty, suffers a schoolbook case of the “tragedy of thecommons”: overgrazing is widely held to contribute todestruction of grassland ecosystems, which in turn leadsto reduced capacity to raise livestock in the future. Still,there is no incentive for the individual herder to limitgrazing to what would be sustainable as long as othersbenefit from the free pastoral resources. Estimates of thelevel of overgrazing range from about 30 percent abovecarrying capacity in northern China as a whole (ZhaoYongxi, 1998), to 15 percent in Qinghai, 60 percent inInner Mongolia, 130 percent in north Shaanxi, 150 per-cent in northwest Shanxi, and a staggering 250 percentabove carrying capacity in Ningxia. The total sheep popu-lation grew from 170 million in 1978 to 256 million in 1997,at the same time as the grasslands were continuouslydegraded. However, the debate surrounding carryingcapacity of grasslands in northern China is not resolved.
From Nomadic to Sedentary PastoralismPartly contributing to grassland degradation in China isthe shift of pastoralism—from traditionally mobile to amore settled operation. This has been a governmentpolicy aimed at improving the living standards of no-madic herders. By settling down, herding families getbetter access to water, energy supply, and other infra-
structure, as well as to markets. Over the short term,stationary herders also tend to have more livestock—adisplay of affluence. Mobile herding on the other hand,though appearing harsh on herders’ lives can givegrasslands time to rejuvenate. The damage to thegrasslands due to settled herding has been evident inInner Mongolia and other Central Asia regions.
Transition in Diet StructureAlthough international trends are in favour of more veg-etarian diets, access to meat in China still means a betterlife. Chinese people are consuming an increasing amountof meat. It is estimated that from 1980 to 1998, the annualconsumption of meat including pork, poultry, beef, andlamb increased 2.5 times. Pork still accounts for morethan half of consumption, but shows the lowest growth(Ma Hengyun, 2000). The rising demand has pushed upprices, therefore creating incentives to raise more live-stock.
Property Rights AmbiguityThe rural Household Responsibility System, establishedin the early 1980s, was not well adapted for herding.Livestock and other mobile means of production wereredistributed from the collective to the household level,while pastoral land remained a freely accessible collec-tive resource. No controls were imposed on how muchlivestock could be raised on a particular piece ofpastureland. With increasing demand for meat and ris-ing prises, there were strong incentives for herders toraise livestock at levels far above the carrying capacityof the pastureland.
Incentives are now in place to help stop grasslandconversion, and policies are redirected towards promot-ing livestock and animal husbandry. In the late 1980swhen grassland degradation worsened, the governmentdeveloped national programmes including promotion ofartificial grasslands, setting up of grassland reserves, aswell as numerous attempts to restore degradedgrasslands, both through active and usually labour-in-tensive interventions, and by fencing off degraded landto let it recover naturally.
In the 1990s individual property rights have beenstrengthened through allocation of grassland to indi-vidual herders using long-term contracts. Herders cannow plan over the longer term with more incentive toinvest in the land and manage it in a more sustainableway. By the end of 1995, about half of the country’spastoral areas had been contracted out to pastoral house-holds (SEPA, 2000). The transaction costs, however, turnout to be very high. They include monitoring, enforcingand delineation of boundaries, adjudication of disputes,and monitoring and enforcement of contractual provi-sions related to grassland management.

China Human Development Report 19
State of the Environment
ForestsFive millennia of Chinese civilisation have had a pro-found impact on forests, and there is no clear picturetoday of the changes of forest coverage that have oc-curred through history. It is still reasonable to assessthat most of the original forests have been lost to agri-culture and urban use. Much of this land conversionoccurred centuries ago, and in some cases the land haschanged further into grasslands or barren areas.
While in the past, major causes of deforestation wereextension of agriculture, felling for construction materi-als, but also campaigns of burning of forests for militarydefence purposes. Presently, the major cause is the un-sustainable exploitation of forest products, mainly wood.Chen (1998) claims that every year, over 1.1 million hec-tares, or about one percent, of forest disappear due toover-extraction. For example, over-extraction reducedforest coverage on the upper reaches of the Yangtzefrom 30 to 40 percent in the 1950s to only 10 percent by1998.
From forest coverage in 1949 as low as 85 million hec-tares (less than one-tenth of the country), China nowhas about 160 million hectares covering about 17 per-cent of its land surface (China Statistical Yearbook, 2001).Even though the overall trend is increasing, the per capitaforest coverage in China is still very low, at approximately0.1 hectares, less than one-fifth of the world average,one-tenth of the US average, and one-twenty-fifth ofthat of the former USSR (FAO, 1997).
Geographically, more than two-thirds of China’s for-est resources are located in the northeast and south-west of the country (see figure 1.3) and most of the re-maining areas are scattered in the south-central zone. Interms of distribution among provinces, HeilongjiangProvince has the largest forested land area, accountingfor 12 percent of the national total. In terms of timberstock, Tibet owns more than one-fifth of the nationaltotal.
The Continuous Reforestation StruggleSince 1949, and especially during the past two decades,continuous efforts have been made in China on refor-estation. About 50 million hectares were planted between1980 and 1993 alone. In recent decades, the primary goalshave been broadened from solely increasing growth pro-duction to maintaining and enhancing various ecologi-cal functions such as preventing desertification, coastalerosion, and reducing runoff in river basins. Efforts toincrease forest cover received a further boost in 1998 aswidespread deforestation in the upper reaches of theYangtze River was identified as one of the main contrib-uting factors to the devastating floods in the middle andlower reaches.
Official figures state that a total of 250 million hec-tares are classified as suitable for forest plantation andgrowth. If all this area were to be forested, which is along-term goal for ecological reconstruction, a quarterof the Chinese land area would be forested—a changethat would have far reaching consequences for China’sentire ecological situation. However, even with a totalpopulation not exceeding 1.5 billion, per capita forestcover would be a mere 0.17 hectares, still very low com-pared to the world average. And moreover, China is veryfar from carrying out such an impressive reforestationeffort, even if it would be feasible.
The Declining Quality of ForestsNotwithstanding an increase in forest coverage of eightpercent, half a century of backbreaking reforestation ef-forts has not improved the quality of forests; in factthere is evidence of the contrary. It is common knowl-edge that the large, ambitious reforestation programmeslaunched in succession since the 1970s have reaped poorresults. This is partly due to lack of management, par-ticularly the need to care for saplings once planted.
A commonly accepted indicator of quality is the ageof standing trees. Official figures from four consecutiveforest censuses from 1973 to 1993 show that the per-centage of mature trees in forest stands declined fromover 36 percent to less than 28 percent (National ForestResource Statistics, Forestry Dept of China). Still, manyexperts believe these figures significantly underestimatethe decline in China’s forest quality. Smil (1993) con-cluded that there is probably very little mature forest leftin China at all, and that the wood mass volume per squarekilometre is only one-third of that of natural forests.
The picture thus evolves that China loses high qual-ity mature forests in the northeast and southwest, whileat the same time trees are planted in other parts of thecountry, but for other purposes. A large part of the refor-estation campaigns have been carried out to protectagainst erosion, and have mainly been directed to mar-ginal, agricultural land in hilly, desiccated areas such asShaanxi, Inner Mongolia and Yunnan.
Another important issue that has been raised morerecently concerns the lack of attention to biodiversityissues when carrying out large-scale reforestation. Muchof China’s forests are monocultures, a result of large-scale planting of single species. Lacking diversity, suchforests do not provide the same range of ecological serv-ices as natural forests do and are much more sensitive tofire, climate fluctuations and disease.
From Timber to Biodiversity ServicesForest degradation affects families and rural communi-ties whose livelihoods may be threatened by direct or

Chapter 2
UNDP20
indirect consequences of the declining forestry quali-ties, but also the regulations imposed in order to protectunsustainable use of forestry products. However, in thelarger societal picture, forest degradation is intimatelylinked with land degradation, leading to a vicious down-ward cycle including lower agricultural productivity, watershortages, soil erosion, and the inability of degradedand denuded forests to hold water and help buffer flood-ing.
The contributions of forests to the economy are of-ten long-term, intangible and informal, and hence diffi-cult to value in monetary terms. However, some figurescan be linked to the contribution of forests to China’seconomy. With a consumption level of about 300 millioncubic metres of standing stock, China is the world’s third-largest consumer of timber. FAO estimates that Chinaimports approximately 12 million cubic metres of timber,at a value of over USD 5.5 billion, while exports are esti-mated at a mere USD 824 million (FAO www.fao.org).
The biggest commercial users are the pulp and paper,and construction industries. Other estimates suggest thattwo-thirds of the wood harvested in China is burned asnon-commercial fuel (FAO, www.fao.org). In 1995, ap-proximately 15 percent of the energy supply for China’s880 million rural people was provided by wood (fromZhou Dadi, SDPC).
Implementation of a nationwide logging ban has re-duced timber production dramatically in the last twoyears. Domestically, this reflects a shift in the functionof forests from supplier of timber to supplier of water,biodiversity, and a stable climate. At the same time, how-ever, it shifts the problem of deforestation to countriesthat do not have effective law enforcement mechanisms.The Russian Far East, Southeast Asia and Brazil,amongst others, have become increasingly important tim-ber and forest products suppliers for China.
Management and MismanagementMost forests in China are owned by the state or by col-lectives. Managers of state-owned forests are chargedwith the contradictory goals of making profit while at thesame time keeping large workforces employed. Forestrymanagement is not well monitored, and there are strongincentives for managers to sell products through theblack market. The combination of perverse incentivesand poor regulation is part of the explanation for theserious degradation of state-owned forests. Collectivelyowned forests have fared a little better.
Forestry management is presently going through amajor restructuring in line with the basic principles ofthe rural Household Responsibility System. Researchshows that given adequate incentives and basic tenurerights, these measures can increase productivity whileat the same time improve protection of forest resources.
The institutional forces affecting deforestation and thenational response to these forces are discussed in moredetail in chapters 3 and 4.
Cultivated LandArable land is scarce, with only 13 percent of the totalland area—about 135 million hectares—being used foragriculture (Heilig, 1999). With only 0.1 ha of arable landper capita, China’s population pressure on agriculturalland is among the highest in the world, compared withthe world average of 0.24 and the European Union allot-ment of 0.22 ha per capita (World Bank, 2001).
The overall quality of cultivated land in China is lowwith almost four-fifths being classified as medium andlow productivity. About 30 percent of the cultivated landsuffers from various degree of soil erosion, and only 40percent has access to irrigation (Liu Jiang and ZouLianwen, 2000).
The trend for cultivated land in China is the shrinkingof high yield land and expansion of low yield land. Theoverall change is still under debate but consensus existswith regard to the structural change. In the northwestand northeast of China, the area of cultivated land isincreasing. Cultivating more land is still the means tofeed more people there. In the coastal areas of East China,however, cultivated land, especially the fertile land, isbeing converted to industrial and urban development.The overall land productivity is thus dropping.
Despite the land scarcity and the trend to shrink highquality cultivated land, current land use is far from beingeconomic and careful. The land is often under-valued,and there exist plenty of examples of land misuse. Ac-cording to a survey in 1997, the land purchased by thegovernment but left unattended, amounted to 116,000hectares, more that half of which was valuable cultivatedland (Liu Jiang and Zou Lianwen, 2000). Another form ofland misuse has been the conversion of forests and grass-land into cultivated cropland in ecologically fragile ar-eas, which has led to increased soil erosion anddesertification. With the further economic growth linkedto WTO entry, management of cultivated land in Chinaprobably will have an increased focus on enhancing landproductivity to reduce the need for more land.
Land DegradationAccompanying its rapid economic growth, China todaysuffers from severe land degradation, the extent of whichhas few parallels in the rest of the world. Erosion,desertification, salinisation, and pollution further reducethe usability of land resources that are already conspicu-ously scarce in relation to China’s large population.
ErosionWith about two-thirds of its territory classified as moun-tainous, much of China’s land is inherently vulnerable to

China Human Development Report 21
State of the Environment
Box 2.1 The Black Soil Layer of Northeast ChinaMight Disappear in 50 yearsThe black soil region in northeast China is one of the threemajor black soil regions in the world. It is mainly distributedin the provinces of Heilongjiang and Jilin, with a total areaof 117,800 km2. The highly fertile soil contains one of themajor grain belts in China, producing about 10 million tonnesof commodity grains per year. Due to water scarcity anddestructive human activities, soil erosion in this regionhas created ecological deterioration.
The Ministry of Water Resources report water-relatedsoil erosion in the region has impacts on 44,700 km2, or38% of the total area, with top soil losses averaging 0.3to 1 centimetre per year. Back in the 1950s the black soillayer had a depth of 60 to 70cm; more than half of whichis now gone. In areas where the entire black topsoil layerhas been eroded, the land has lost most of its productivity.It is estimated that the existing black soil layer of thefarmlands will be completely eroded within half a centuryshould current rates of soil erosion continue.
Annual economic losses due to lower soil fertility areestimated at between USD 50 and 100 million. In addition,the erosion has resulted in ecological deterioration andmore frequent floods, drought and sand storms. Theserious floods in the Songhuajiang and Nenjiang Riverbasins in the summer of 1998 caused direct economiclosses of USD 8 billion. Apart from the enormous rainfall,a major contributing cause was the serious water andsoil erosion in the upstream and middle stream areas ofthe rivers.
Source: Wang Libin, Daily Tele-Messages , p. 1, 2000-07-26, Beijing. Xinhua News Agency.
erosion due to high slopes and sensitive soil. Areas thatfit this description cover most of the seriously erodedlands in China, including the Loess Plateau and the redsoil area in the southwest. Soil erosion in the Loess Pla-teau—amounting to more than 2 billion tons of top soilbeing washed away each year—is mainly due to the soilbeing inherently low in organic matter and clay content,which makes it easy to cultivate but highly susceptibleto water and wind erosion.
Much exacerbated by human activities, the soil ofChina makes it one of the most seriously eroded coun-tries in the world. Nearly two-fifths of the total land area,suffers from various degrees of soil erosion—an areathat includes half of the country’s cultivated land (Yan,1994), and more than two-thirds of its grassland. Evenmore worrisome is the increasing trend. All existing stud-ies show that, in the last decade, land that suffers ero-sion has increased significantly, by somewhere between20 to 30 percent. The most rapid increase has occurred insouthwest China and the region along the mid-lowerreaches of the Yangtze River.
Erosion has posed enormous threats to the limitedland resources and reduced productivity further. Alongwith the eroded soil, millions of tons of nutrients are lostto the coastal zones each year. As a result, more thanhalf of the cultivated land is potassium-deficient; abouthalf does not contain adequate trace elements; and morethan three-quarters is deprived of nutrient renewal (seebox 2.1). As much as poverty has driven land erosion,land erosion has forced people into poverty. Official re-ports point out that more than 85 percent of the poverty-ridden counties are located in serious land erosion re-gions.
DesertificationMore than a quarter of China’s land area is desertified.Except for natural deserts such as the Taklamakan wherevery few people live, roughly 40 percent of China’sdeserts are located in areas with high population den-sity and intensive human activities. In addition almost 4million hectares of farmland and 5 million hectares ofgrassland are threatened by desertification.
Recent decades has witnessed an increased rate ofdesertification. Between the 1950s and 1970s about 1,500km2 of land each year have become desertified. In the1980s, the rate has increased to more than 2,000 km2 an-nually, and now China loses alarmingly 2,500 km2 of landto desert every year (Liu Yingqiu, 1999).
Desertification often occurs where agriculture andhusbandry meet, partly the consequence of policies,which for years favoured agriculture over husbandry.
SalinisationFarmland salinisation causes significant decline in pro-ductivity. Recent estimates put the salinised land area in
China somewhere between 80 and 100 million hectares,about ten percent of which is cultivated land. This ismostly concentrated in the flat, water-scarce andgroundwater-irrigated areas in the North China Plain, andthe northwest dry areas, such as Xinjiang and InnerMongolia. Salinisation in these regions is usually theresult of poorly developed irrigation systems, either in-adequate application of water or low-standard drainage.North China Plain—mainly covering Beijing, Tianjin, andthe provinces of Hebei, Henan, and Shandong—sufferthe most serious salinisation. Though covering only fourpercent of the country’s total land area, the salinisedland in this region accounts for 30 percent of the na-tional total. Provinces or autonomous regions with morethan one million hectares of salinised land are Xinjiang,Hebei and Shandong.
PollutionAbout 10 million hectares of farmland in China are pol-luted, leading to an annual loss of 20 billion kilograms ofstaples worth USD 1.5 billion per year (Liang, 1999).Among the major sources of pollution are industrial andmunicipal solid wastes, acid rain, wastewater used forirrigation, remains of plastic film, and excessive use ofchemical fertilizer and pesticides.

Chapter 2
UNDP22
Solid wastes, commonly dumped in suburbs of large cit-ies, have caused pollution in 20,000 hectares of farmland(Wang Junping, 1999). Acid rain now affects about one-quarter of the total land area in the country (SEPA, 2000).Wastewater irrigation, a practice in China for a long time,has caused serious soil contamination. With most of in-dustrial and municipal wastewater still discharged di-rectly into water bodies without prior treatment, nearly aquarter of the rivers in China fail to meet irrigation stand-ards (Liu Jiang and Zou Lianwen, 2000).
Excessive use of chemical fertilisers and pesticidescauses serious soil pollution. Pesticides, when appliedinappropriately, pollute agricultural products. Accord-ing to a sample survey conducted by the Ministry ofAgriculture, almost 20 percent of inspected livestockproducts fail to meet state contamination standards. Pes-ticide residues have been found in more than half of thefoods grown and produced in suburbs of large cities(Shao Wenjie and Deng Min, 2000).
Plastic film is now widely used in China to increaseplant productivity. However, the remains of film pollutefarmland and stunt the growth of crops, reducing cropproduction up towards 20 percent (Zhang Chengyuan,2000). As much as 20 percent of the film is left on farm-land after use. China has an average amount of 60 kilo-grams per hectare plastic film residue (SEPA, 2000).
2.2 BiodiversityChina’s flora and fauna are among the richest in the world;yet biodiversity is under severe pressure from popula-tion growth and economic development.
China accounts for one-tenth of the world’s animaland plant species. The richness of biodiversity rests ona wide variety of habitats and ecosystems, largely re-sults of China’s vast territory, complex climate, variedgeography, large river networks, numerous lakes, andlong coastlines. In addition, China holds a number ofrare, precious species of animals and plants that are ex-tinct in other parts of the world, including the giant panda,the Yangtze River dolphin, the dawn redwood, and theCathay silver fir.
China’s ecosystem diversity comprises a variety ofbiotopes including forest, scrubland, meadow, steppe,savannah, desert, tundra, marsh, marine, rivers, and lakes.It is the combination of diversity in species and ecosys-tems that provides the foundation for rich genetic diver-sity—between different species and within the samespecies. And this genetic diversity is vital for the abilityof both ecological and social systems to adapt and evolvewhen faced with environmental changes.
The Value of BiodiversityThe affluence in biodiversity has played a decisive rolein shaping China’s cultural diversity, providing an out-
standing range of products and valuable ecological serv-ices.
Estimates of the monetary value of ecological serv-ices associated with biodiversity indicate the vital im-portance of preserving biodiversity. A conservative es-timate of the total value of both ecological products andservices in China arrives somewhere between USD 257and 421 billion per year ( BWG/CCICED, 1996). Table 2.1breaks down the various values associated withbiodiversity in China.
Table 2.1 Estimated Economic Values ofBiodiversity (BWG/CCICED, 1996)
Item billion USD/yr
Carbon sequestration of forest 140 – 200
Soil and water conservation of forest 20 – 48
Recreation and Tourism 20 – 30
Agriculture production 6 – 8
Direct harvest of foods from nature 5 – 7
Firewood supply 5 – 12
Medicinal plants/animals 5 – 20
Timber and construction wood 8 – 15
Rattan/bamboo 4 – 6
Wildlife heritage and keystone effect 4 – 7
Fisheries 15 – 20
Contribution to animal husbandry 4 – 6
Carbon sequestration by rangelands 7 – 17
Environmental cleaning services 14 – 25
Total products and services 257 – 421
Biodiversity LossesPreservation of biodiversity is indispensable to sustain-able development, and the loss of diversity at any level—species, ecosystem, or genetic—reduces the ability ofnatural and social systems to respond to changes in theenvironment. Biodiversity in China is seriously threat-ened by human activities including deforestation, over-exploitation of animal and plant resources, pollution, andintroduction of invasive species. Estimates from China’sRed Data Book of endangered species show that morethan one-tenth, or more than 500 vertebrate species andabout 15-20 percent, or about 4,000-5,000 species ofhigher plants are endangered (Biodiversity Committee/CAS, 1992). The dominating causes of biodiversity lossesare biotope destruction, pollution, and wildlife trade.
Destruction of BiotopesLogging and land reclamation are two of the most seri-ous causes of biotope destruction in China. The sharpreduction in natural forests directly threatens the sur-

China Human Development Report 23
State of the Environment
vival of plants from lichen and moss to higher order spe-cies (Chen et al., 1993; MacKinnon et al., 1996). In addi-tion, logging is responsible for creating fire-prone grass-land that in turn, produces forest fires. Over the past 25years, China has lost 8.6 million hectares of forestbiotopes to fire.
Reclamation of forest and wetlands for agriculture andconstruction is another cause of biotope destruction.As much as one-third of China’s current farmland mayhave been developed by reclaiming virgin forests, a prob-lem which is particularly serious in the tropical areas ofChina.
Wetlands cover 25 million hectares and include someof the most biologically diverse, yet threatened ecosys-tems in Asia. Through the increasing pressures of hu-man activities, wetlands have been closed off to extendagriculture, filled to accommodate urban development,and polluted by municipal, industrial, and agriculturaleffluents. Over the past half century, half of the coastalwetlands area has been transformed, and from 1950 to1980 one-tenth of the total lake area in China disappeared.
Pollution of Biotopes and Poisoning of OrganismsPollution is a significant cause of biodiversity loss, par-ticularly in freshwater and marine ecosystems. Dis-charges of nutrients and organic matter from municipal,industrial, and agricultural sources cause eutrophicationthat leads to overgrowth of shallow water biotopes andwetlands. Chemical fertilisers, pesticides, heavy metalsand other dangerous toxins from industrial and agricul-tural sources poison aquatic life, thwarting reproduc-
tion, causing genetic defects and killing aquatic organ-isms.
The decline of China’s marine fishery resources be-gan in the mid-1960s. During the 1970s, along with thelarge-scale exploitation of petroleum as well as the in-crease of industry and wastewater discharges, the pol-lution of coastal fishery waters became increasingly se-rious. Today, the total marine fishing area has been re-duced by one-third. Pollution has also caused marineeutrophication, repeatedly setting off red tides and algalblooms that kill large numbers of fish, shrimp, and shell-fish.
Trade in Endangered SpeciesIn recent years wildlife trade has had a significant impacton biodiversity in China. With the increasing demandson wildlife mainly for food, traditional medicine, and fash-ion, illegal trade has increased dramatically and is nowthreatening the survival of several endangered speciesand diminishing populations of non-listed species.
The Consequences of Damaged EcosystemsRecent as well as long-term changes over different partsof China reflect how loss of biodiversity reduces theability of ecosystems to support human society. Theflooding that hit large parts of eastern China in 1998 ispartly explained by the loss of ecological services offorest biotopes to moderate the impact of heavy rainfall.Silting up of reservoirs, carrying enormous costs in termsof lost capacity and reconstruction, is partly the resultof successive destruction of a naturally diverse vegeta-
Box 2.2 The Value of Biodiversity—Not only a Matter of Caring for Pandas
The value of biodiversity goes far beyond caring for threatened species as such, and includes innumerable examples ofproducts and services that are essential for human society.
Making use of a rich resource of wild crop strains more than 5,000 new varieties of 41 crops were bred in China from1949 to 1992, and have contributed significantly to improving agricultural yields (Hou Xiangyang and Gao Weidong, 1999).Today, half of the rice-producing areas are planted with hybrid crops developed from wild kindred species. At the sametime the elaboration of new species or varieties of species is always associated with the risk of creating invasivespecies, which proves so strong that they take over and threaten to destroy entire ecosystems.
The WWF estimates that currently, over 40 percent of the drugs prescribed worldwide are based on natural resources.In China the medical benefits from biodiversity are particularly important given the important role of traditional Chinesemedicine. A recent large-scale national survey indicates that there are over twelve thousand types of traditional Chinesemedicine, most of which come from wild sources that depend on the existence of a natural ecosystems. But theincreasing interest in, and demand for Chinese medicine pose a serious threat to biodiversity. In the last five years the saleof Chinese traditional medicine in Britain increased 70 percent, while that in America increased 280 percent in the last tenyears, and 28 out of the 426 medicinal plants that appear in the 1995 Chinese Encyclopaedia of Medicine are listed in theChinese red list of endangered plants (Zhang Endi and Zheng Hanchen, 2000; BWG/CCICED, 1997 and 1999).
Biodiversity also provides the backbone for tourism, and is a prerequisite for eco-tourism. By the end of 1999, China hadestablished more than one thousand nature reserves, covering more than 8 percent of the national territory. In 1994, thetotal tourism income of all Chinese nature reserves was 30-50 million yuan, while forest parks received revenues of halfa billion yuan. Tourism in general is an important source of income for China, and in 1999 the total tourism revenue was 400billion yuan (Lu Dadao et al., 2001). But tourism is also a threat to biodiversity, including penetration of ecologically fragileareas, and the considerable amounts of pollutants generated not least from transportation.

Chapter 2
UNDP24
tive cover to protect soils from eroding. Sharply reducedfish catches in coastal areas can be attributed to theimpacts of pollution on marine habitats and spawningareas.
2.3 Water ResourcesWater is arguably China’s most critical resource. Nearly700 million Chinese lack access to safe water, and con-sume drinking water contaminated with animal and hu-man waste that exceeds the applicable maximum permis-sible levels for faecal coliform bacteria. With an averageannual availability of just over 2,200 cubic metres of freshwater per capita, China does not qualify on the WorldBank’s list of water scarce countries. Still, China sufferssome of the most extreme water shortages in the world.
Regional Disparities in Water AccessChina suffers from substantial regional disparities in wateraccess, a problem exacerbated by an unfortunate alloca-tion of most of the arable land to the water scarce parts.The eastern part and the areas south of the Yangtze Riveraccount for 34 percent of the total land area, but have 81percent of the water resources. Regions north of theYangtze account for 47 percent of the land area, but onlyseven percent of the water resources; the semi-arid andsemi-humid central and middle regions have 19 percentof the land area and access to 12 percent of the water.The distribution of groundwater resources is similarlyskewed with the south having four times moregroundwater deposits than the north.
Nearly half of China’s population, 550 million people,live in critically water scarce areas in the northern half ofthe Eastern Monsoon Region—the river basins ofHeilongjiang, Songhua Jiang, Liaohe, Haihe, Huaihe, andHuanghe; each basin providing annually less than 750cubic metres per capita. This is also where most (58 per-cent) of the arable land is located with a correspondingneed for irrigation. Still, a closer look reveals that the 130million people in the Haihe River basin, where Beijingand Tianjin are located, and the 200 million in the HuaiRiver basin share a mere 355 and 515 cubic metres percapita per year, respectively. The water situation in theseareas matches the most water scarce areas in the world,with the alarming difference that in northern China thereare several hundreds of millions facing absolute waterscarcity (Johnson et al. 1997; World Bank, 1999).
The northern water scarcity is the result of monsoonclimate that produces most precipitation in the south-east, where 2,000 mm per year is not unusual, with adecreasing gradient towards the northwest, where thereare parts that may receive no rain at all over several years(see Precipitation Map, figure 1.2). Another feature ofthe monsoon is that almost the entire annual rainfall oc-curs during summer, leading to repeated occurrences of
floods, such as the critical situation that developed overlarge areas of China during summer 1998. Large inter-annual variations add to the problem such that thoseareas subjected to flooding one year, may suffer droughtthe next, and that water shortages may strike areas alsoin China’s less water-scarce southern regions.
A peculiar aspect of China’s water resource situationis the fact that the western half of China lacks drainageto the sea. This interior drainage basin coincides roughlywith the area with less than 400 mm annual precipitation,where rain fed agriculture is virtually impossible (seefigure 1.2). The lack of drainage in combination with lowprecipitation and high evaporation make water resourcesin the west even more fragile and susceptible to pollu-tion.
Water UsageThere is a battle going on that no one can win—thatbetween increasing water demands and limited availablewater resources. Groundwater levels over large parts ofthe North China Plain have fallen due to over-extractionof water for irrigation and urban supply; water tables innorthern towns and cities are falling in the order of onemeter per year, and 300 out of 640 major cities face watershortages—in 100 cities the situation is severe (Wu etal., 1999; WRI, 1999). Many rivers in the North typicallyrun dry during several months of the year. As a conse-quence, competition for water is increasing, particularlyin the northern river basins, between urban, industrial,and agricultural consumption, and between upstreamand downstream users.
The bulk of available water is used in agriculture, whichconsumes more than three-quarters of total withdraw-als, mainly for irrigation. Yet, the increase in agriculturalwater consumption has been remarkably low, or less than4 percent between 1980 and 1993. Industry is the secondlargest water user and accounts for just under one-fifthof total withdrawals. Between 1980 and 1993 water use inindustry almost doubled, and in Southern China morethan tripled. Municipal supply accounts for no more than5 percent of the total, but shows the highest increase,2.5 times, between 1980 and 1993 (Heilig, 1999).
China is wasting large amounts of water. Water-useefficiency is very low in all sectors, but particularly inirrigation, where traditional flood irrigation causes lossesthrough evaporation of well over half of the preciouswater. There are also significant water losses due to out-dated water supply infrastructure, bad maintenance, andpoor management practices.
Water PollutionWhat goes in must come out. The major part of indus-trial and municipal withdrawals is discharged back torivers and lakes, polluted with bacteria, organic matter,

China Human Development Report 25
State of the Environment
nutrients, and toxic substances. Agricultural withdraw-als are consumed largely by biomass production, butthe remaining agricultural drainage water contains ever-increasing amounts of pollutants such as fertilisers andpesticides.
The combination of scarce water resources and highpollution pressure is lethal—for ecological systems, forthe economy, and for human health. More than 90 per-cent of urban river sections are polluted to the extentthat the water is unsuitable for human contact; morethan half of the river sections do not meet the lowestChinese surface water standards, meaning that the wa-ter is not even suitable for irrigation (figure 2.1). North-ern rivers show the most degradation.
Industry is the largest source of water pollution inChina accounting for more than half of the totalwastewater discharge not including unmonitored town-ship and village enterprises (TVEs) and smaller indus-tries. An absolute majority of industrial wastewater isuntreated or has passed only a rudimentary pre-treat-ment process. Facilities for treating industrial wastewaterare poorly maintained, often operating with outdatedtechnology, and recycling of process water is minimal.Statistics show a slight decrease in pollution dischargesfrom regulated industry starting from the mid-1980s—afigure, however, that ignores the substantial increase inpollution discharges from TVEs that has accompaniedbooming rural industry.
Less than one-tenth of municipal wastewater receivessome kind of treatment, while three-quarters of all urbanareas lack adequate water supply systems (Johnson etal., 1997; Heilig, 1999). Municipal discharges tripled from1981 to 1995—a 7 percent annual increase. China has atotal of over 600 cities, but only less than 300 municipalsewage treatment plants, adding up to a capacity of barely15 percent of the total discharges. Roughly 200 millionpeople live in 20,000 small towns without any sanitationother than maybe pipes that lead wastewater to the near-est ditch.
And on top of this comes agricultural sources, in-cluding pollution from crop production and animal hus-bandry, as well as discharges from numerous country-side point sources such as TVE agro industries. Agri-cultural pollution varies across the country, but a studyof Hangzhou Bay shows that agricultural sources wereresponsible for an absolute majority of the total organicpollution load to the Bay in 1994 (Johnson et al., 1997).The use of fertilisers and pesticides has doubled sincereforms started. Fertiliser application now is three timesthe world average and higher than the European Un-ion’s (World Bank, 2001). Yet, the effectiveness of ferti-lisers is low, mainly because of overuse of low quality,fast ammonia bicarbonate, so called ABC fertilisers that
are cheap and easy to apply, but just as easily washedaway.
Livestock production has tripled since reforms startedin the beginning of the 1980s—faster than almost anyother country—and much of the manure finds its wayinto streams and waters instead of being utilised as amuch needed fertiliser and soil improvement agent.
Sinking Groundwater TablesExcessive extraction of groundwater in China hasbrought about a funnelling effect causing sinkingground, fissures, seawater intrusion, and other seriousenvironmental problems (Hongkong Far East EconomyReview, 2000). There are over 50 areas in the countrywhere this funnel phenomenon extends over 100 km2. InBeijing, Shanghai and some other major cities, the fun-nel effect covers an area of over 1,000 km2. The worstcase is in the region of Wuxi, Changzhou and Suzhou inJiangsu province, where the funnel effect covers a totalarea of over 5,000 km2, which seriously threatens thesocial and economic growth of this region.
Rapidly sinking ground water tables have also causedsubsiding ground level, a serious problem in cities wherehouses and other construction works are not built onbedrock. This is often the case for cities like Tianjin andShanghai which are located in estuaries that rest onmighty flood sediments.
All major cities in northern China are critically de-pendent on groundwater, and the fact that thesegroundwater sources are sinking shows that the situa-tion is not sustainable. If the trend continues, which it is
Figure 2.1 Water Quality in Urban River Sections(note grades 4 and 5 are not suitable for human con-tact) (WRI, 1998).
0%
20%
40%
60%
80%
100%
Northern Rivers Southern Rivers
above grade 5 grade 5 grade 4 grade 3 grade 2

Chapter 2
UNDP26
likely to do, the groundwater sources will be increas-ingly expensive to extract, and finally will be exhausted.In conclusion, this means that sooner or later northernChina will have to rely on precipitation for water supply,the alternatives being expensive water transfer from thesouth or similarly expensive and energy consumingdesalination of sea water.
Coastal and Marine SituationAll major Chinese rivers drain to the coastal zone and sodo the mix of pollutants they contain. China’s 20,000plus kilometre-long coastline has suffered its most se-vere damage and degradation over the last two decades.Estuaries and coastal areas are threatened by increas-ingly intensive occurrences of red tides, oil spills andpollution from inland sources. The East China Sea andBohai Sea have experienced worsening water quality inthe last few years. The year 2000 witnessed the worstcoastal water quality along the coasts of Shanghai,Zhejiang, Liaoning, Tianjin and Jiangsu with 28 occa-sions of red tides affecting about 10,000 square kilome-tres.
Pollution raises concerns over fish kills, seafood safetyand public health, when more Chinese people are shift-ing their diet towards more seafood. One example is thevast wetlands to the east of the Jiaozhou Bay inShandong Province. Once an important habitat for anumber of shellfish species, uncontrolled discharge ofindustrial and household sewage into the coastal areashas damaged the wetland and almost completely de-pleted the biodiversity. Another example, from Shanghaiand eastern Jiangsu Province, is the 1988 outbreak ofHepatitis A from consumption of contaminated mussels.
Recent reports have also mentioned sharp drops infish catches from coastal waters (FAO, www.fao.org),most likely a combined result of pollution and over-fish-ing. The total fishing capacity of Chinese vessels in theEast China Sea increased seven-fold between the 1960s
and 1990s, at the same time as catch-per-unit declinedthree-fold. In coastal seas such as the East China andYellow Seas, there has been a shift in catches from largehigh-valued fish to lower-valued smaller fishes, fromdemersal and pelagic predator fishes to pelagic plank-ton-feeding fishes, and from mature fish to immature fish.Reduction of fishing effort in some areas is consideredan urgent priority.
Environmental problems affecting fisheries in the re-gion include land reclamation, impacts of extensivemariculture, heavy metal pollution and oil spills. In theYellow Sea, virus and bacterial epidemics are causingmortality of cultured shrimp.
2.4 Air QualityOf all China’s environmental challenges, the appallinglevels of air pollution are the most obvious to foreignvisitors as they step off the plane into almost any Chi-nese city. This instant recognition contrasts sharply withthe standard response of the average resident of Chi-nese cities who is so used to the situation that it is nolonger noticed, except on extreme days—and also whenair pollution-related mortality statistics are released.
Air quality in many Chinese cities falls well belowinternational standards. World Development Indicators(World Bank, 2001) shows that 16 of the world’s 20 toppolluted cities are Chinese. Although such ranking ischanging constantly and depends very much on themonitoring system, it can be safely assumed that Chi-nese citizens are exposed to many of the worst air pollu-tion levels. Figure 2.2 gives the example of how China’surban TSP (Total Suspended Particulate) levels compareto levels in London, Tokyo and Brussels.
A combination of conditions makes the situation theworst of all in the northern parts. Due to the cold climate,heating and energy needs are greater in the north. Win-ters in northern China are characterised by stable cli-matic conditions, leading to inversions—an atmospheric
Figure 2.2 TSP Emissions in Chinese and other Cities
0
200
400
600
1973 1974 1975 1976 1977 1978 1979 1980 1981 1982 1983 1984 1985
TSP ug/L
Beijing
Chinese cities(average)Tokyo
London
Brussels
year (Chinese cities)
90 91 92 93 94 95 96 97 98 99
year (developed countries)

China Human Development Report 27
State of the Environment
lid—that can cover northern cities for weeks leading toair pollution accumulating to extreme concentrations.
Status and Trends in Air PollutionThere is no standard or simple way to measure air qual-ity. The Chinese authorities have developed a compos-ite indicator—the Air Pollution Index, (API)—to indi-cate general air quality as a function of the levels ofsulphur dioxide, nitrous oxides and total suspendedparticulates. The State Standards system is based onthe API, with Grades I and II being considered suitablefor long-term living conditions, Grade III acceptable forshort-term exposures, while Grades IV and V are unsuit-able for humans.
The three pollutants in the API have different sources,trends and impacts, and using a composite indicator canmask individual trends and dangers. It is quite possiblefor a site to have a safe API level, but at the same timedangerously high levels of one of the three pollutants,or indeed other pollutants not considered in the com-posite. In particular the API fails to capture the singlemost important factor to measure health impact, which isthe amount of very small particles in the air, usually meas-ured as PM2.5, PM5 or PM10, each measuring the amountsof particles smaller than 2.5, 5, and 10 microns, respec-tively. The smaller the particles, the deeper they can pen-etrate into the human respiratory system, and monitor-ing campaigns in Beijing show episodes of very highPM2.5 levels, particularly during periods of smog accu-mulation in the summer.
Of the 335 Chinese cities regularly monitored, only 33percent met either Grades I or II in 1999, with over 40percent falling into Grades IV and V (see figure 2.3). Hencealmost half of Chinese cities monitored are unsafe byChinese API standards. This percentage would certainlyrise if the figures for each pollutant were known, andmost Chinese cities experience unsafe levels of at leastone pollutant. For example, using a different measuringsystem, only Haikou (Hainan), Sanya (Hainan), Xiamen(Fujian) and Beihai (Guangxi) met the WHO air qualitydirective.
The general trend in API levels across China shows asmall improvement (figure 2.4) over recent years. De-spite general progress, there are still many unacceptablecases of air quality in China, with, for example, Tai Yuancity having TSP levels 8 times higher than WHO stand-ards. Also, there is reason to believe that some pollut-ants, such as TSP and SO2 are being brought under con-trol in some areas, whereas levels of others like NOx areincreasing. There is reason to fear that the recent trendsare towards lower aggregate levels of pollutants, butthat more harmful pollutants may increase, such as toxicand carcinogenic pollutants, or those small enough topenetrate the human respiratory system.
GB 3 standard26.3%
GB 2 standard29.3%
GB 1 standard3.9%below GB 3
standard40.5%
Figure 2.3 Ambient Air Quality in Chinese cities (GBis short for Guo Biao or State Standard).
0
10
20
30
40
Grade 1 Grade 2 Grade 3 >3
19981999
grade of air quality
number of cities
Figure 2.4 Ambient Air Quality in Chinese cities in1998 & 1999.
Sources of Air PollutionThe principal sources of outdoor air pollution in Chinaare power generation, energy use in industry, small-scaleheating and cooking, road transport, construction, andecological degradation—each having different causes,characteristics, and impacts.
The Traditional Evil—Energy, Heavy Industry, Heatingand CookingFor both industrial energy and power generation it is thelarge-scale, inefficient utilisation of poor quality andpoorly prepared coal that leads to large emissions ofpollutants. The main pollutants are sulphur dioxide (SO2),carbon dioxide (CO2) and soot. With the gradual imple-mentation of sharper construction and discharge stand-ards, newer facilities do generally show higher energyefficiency and have better pollution control equipment.
At the other end of traditional sources of air pollut-ants is small-scale heating and cooking, which used tofill Chinese streets with thick, sticky smoke saturatedwith soot and a mix of other pollutants. With the gradual,ongoing modernisation of Chinese cities, fuels haveshifted from coal to coal gas or even natural gas, resi-dential boilers have been upgraded, and street stall cook-ing on open coal fires is prohibited, while gas-basedcooking is encouraged. As a result, the street canyon

Chapter 2
UNDP28
levels of pollutants have decreased dramatically, withlower exposures to people as a result.
The New Evil—Increasing Motor TrafficWhile urban areas have begun to alleviate air pollutionassociated with coal burning, they are gradually seeinga shift in air pollution sources. Since 1980, the number ofvehicles has been growing annually at a rate of 20 per-cent in many urban areas. It is estimated that there arecurrently about 20 million motor vehicles in China, andthe figure is expected to reach upwards of 50 million by2010 (He, 2001; Wu, 2000). With the exception of green-house gas emissions, the main pollutants in transportexhausts are nitrogen oxides (NOx), but given the poorlevel of maintenance, a wide range of toxic substancesincluding lead, carbon monoxide, and hydrocarbons arevery much a concern. As an example by 2010, Shanghaiis expected to experience 75 percent of its total nitrogenoxide (NOx) emissions, 94 percent of total carbon mon-oxide (CO) emissions, and 98 percent of total hydrocar-bons (HC) coming from vehicular emissions.
A recent study in Beijing revealed that at all monitor-ing points within the Third Ring Road—roughly delin-eating the downtown area—CO levels exceeded the na-tional standard of 4 micrograms per cubic metre persist-ing over a day. During the summer, ozone concentra-tions, which are measured on an hourly basis, repeat-edly exceeded the national standard. In addition, con-centrations of N2O have almost doubled over the pastdecade. Besides forming secondary particles, vehicularexhausts also cause “photochemical smog”. First wit-nessed in Los Angeles, such smog irritates the eyes andrespiratory system. Most larger cities in China experi-ence similar episodes.
So far there is only one area where Chinese authori-ties have really taken action to solve the problem—the
phasing-out of leaded gasoline. Started in late 1997 in afew big cities, the programme is now implemented na-tionwide, and no leaded gasoline is supplied in citiesany more. But this does not eliminate the effects of leadexposure from the past. China does not perform routinemonitoring of environmental concentration or blood leadlevels and only a few studies exist. These data suggestthat ambient lead levels in the urban area of major citiessuch as Beijing are usually 1 to 1.5 micrograms per cubicmeter—the national standard is 1 microgram per cubicmeter. In some areas, ambient lead levels can reach ashigh as 14 to 25 micrograms per cubic meter. The healtheffects are significant, in particular to child development.
Blowing in the Wind—Dust from Construction Sites andEcological DegradationConstruction is widespread and poorly regulated in China,leading to huge emissions in total suspended particulates(TSP), and in some localised cases more dangerous pol-lutants—although few figures exist describing this phe-nomenon. In addition to construction, ecological destruc-tion is another main contributor to high levels of TSP inmuch of north China, as sand storms have become morefrequent as witnessed in northern cities like Beijing.
Acid RainAcid rain is the result of SO2, CO2 and NOx emissionsdissolving in atmospheric water to form acids, which aredeposited in the form of rain, fog or mist. In the 1980s,areas affected by acid rain covered large parts ofGuangdong, Guangxi, Sichuan, and Guizhou. By the1990s, this area had grown considerably, and includedlarge parts of Hunan, Jianxi, Fujain, Shanghai andShangdong provinces. By 2000, nearly one-third ofChina was affected.
Box 2.3 Beijing Road Traffic Air Pollution
Beijing is a typical case where traffic causes serious airpollution. The number of vehicles registered in Beijingreached 930,000 in 1995 which was the highest in China(Song Ruijin et al., 1998). In 1991, automobile exhaustcontributed to 58% of the CO concentration in theatmosphere, 69% of the NO2 concentration and 87% of theHC concentration. At 8 traffic crossings in Beijing,measurements in 1998 by the China Preventive MedicalScience Academy (Song Ruijin et al., 1998) showed thatCO exposure levels were as high as 41 mg/l or 13 times theambient CO level (3.1-3.5 mg/l). CO2 was as high as 0.612mg/l or 12 times the WHO air quality index. Size of automobileexhaust particles were mainly below 2 microns, smallenough to deeply penetrate the respiratory system. Usingdose-response relationships, the life expectancy of trafficpolice in Beijing has been calculated to be roughly 40 years.
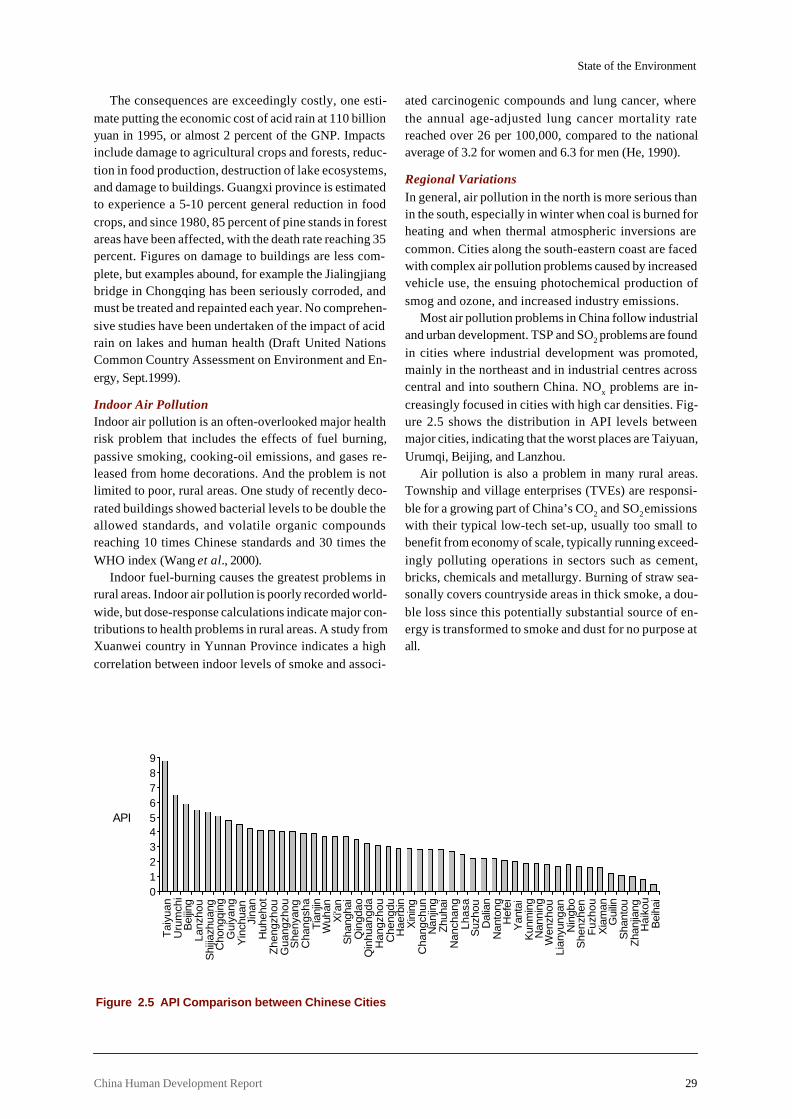
China Human Development Report 29
State of the Environment
The consequences are exceedingly costly, one esti-mate putting the economic cost of acid rain at 110 billionyuan in 1995, or almost 2 percent of the GNP. Impactsinclude damage to agricultural crops and forests, reduc-tion in food production, destruction of lake ecosystems,and damage to buildings. Guangxi province is estimatedto experience a 5-10 percent general reduction in foodcrops, and since 1980, 85 percent of pine stands in forestareas have been affected, with the death rate reaching 35percent. Figures on damage to buildings are less com-plete, but examples abound, for example the Jialingjiangbridge in Chongqing has been seriously corroded, andmust be treated and repainted each year. No comprehen-sive studies have been undertaken of the impact of acidrain on lakes and human health (Draft United NationsCommon Country Assessment on Environment and En-ergy, Sept.1999).
Indoor Air PollutionIndoor air pollution is an often-overlooked major healthrisk problem that includes the effects of fuel burning,passive smoking, cooking-oil emissions, and gases re-leased from home decorations. And the problem is notlimited to poor, rural areas. One study of recently deco-rated buildings showed bacterial levels to be double theallowed standards, and volatile organic compoundsreaching 10 times Chinese standards and 30 times theWHO index (Wang et al., 2000).
Indoor fuel-burning causes the greatest problems inrural areas. Indoor air pollution is poorly recorded world-wide, but dose-response calculations indicate major con-tributions to health problems in rural areas. A study fromXuanwei country in Yunnan Province indicates a highcorrelation between indoor levels of smoke and associ-
ated carcinogenic compounds and lung cancer, wherethe annual age-adjusted lung cancer mortality ratereached over 26 per 100,000, compared to the nationalaverage of 3.2 for women and 6.3 for men (He, 1990).
Regional VariationsIn general, air pollution in the north is more serious thanin the south, especially in winter when coal is burned forheating and when thermal atmospheric inversions arecommon. Cities along the south-eastern coast are facedwith complex air pollution problems caused by increasedvehicle use, the ensuing photochemical production ofsmog and ozone, and increased industry emissions.
Most air pollution problems in China follow industrialand urban development. TSP and SO2 problems are foundin cities where industrial development was promoted,mainly in the northeast and in industrial centres acrosscentral and into southern China. NOx problems are in-creasingly focused in cities with high car densities. Fig-ure 2.5 shows the distribution in API levels betweenmajor cities, indicating that the worst places are Taiyuan,Urumqi, Beijing, and Lanzhou.
Air pollution is also a problem in many rural areas.Township and village enterprises (TVEs) are responsi-ble for a growing part of China’s CO2 and SO2 emissionswith their typical low-tech set-up, usually too small tobenefit from economy of scale, typically running exceed-ingly polluting operations in sectors such as cement,bricks, chemicals and metallurgy. Burning of straw sea-sonally covers countryside areas in thick smoke, a dou-ble loss since this potentially substantial source of en-ergy is transformed to smoke and dust for no purpose atall.
0123456789
Tai
yuan
Uru
mch
iB
eijin
gLa
nzho
uS
hijia
zhua
ngC
hong
qing
Gui
yang
Yin
chua
nJi
nan
Huh
ehot
Zhe
ngzh
ouG
uang
zhou
She
nyan
gC
hang
sha
Tian
jinW
uhan
Xi'a
nS
hang
hai
Qin
gdao
Qin
huan
gda
Han
gzho
uC
heng
duH
aerb
inX
inin
gC
hang
chun
Nan
jing
Zhuh
aiN
anch
ang
Lhas
aS
uzho
uD
alia
nN
anto
ngH
efei
Yan
tai
Kun
min
gN
anni
ngW
enzh
ouLi
anyu
ngan
Nin
gbo
She
nzhe
nF
uzho
uX
iam
anG
uilin
Sha
ntou
Zhan
jiang
Hai
kou
Bei
hai
API
Figure 2.5 API Comparison between Chinese Cities
API

Chapter 2
UNDP30
2.5 Solid WasteWell into the beginning of the 1990s the rate of sponta-neous reuse of solid waste in China was high and gar-bage was a minor problem. With the recent rapid eco-nomic development, new consumption patterns havefollowed, and during the latter half of the 1990s piles ofgarbage began appearing in suburban and countrysidelocations. Today, when travelling through China, it isnot unusual to see cities surrounded by their own gar-bage; smelly dumps litter riversides, back streets andcommons; most suburban areas have been overburdenedand worst hit by the flux of wastes from the city centres;and piles of industrial waste leach toxic substances intosurface and ground waters.
Municipal WasteWith improving living standards, the traditional thrifti-ness has been much compromised by increasing con-sumerism, which has resulted in a rapid increase in mu-nicipal waste over the past two decades. Municipal solidwaste reached almost 150 million tons in 1998, corre-sponding to a daily waste generation of about 1 kg perurban citizen—a figure well in level with cities in devel-oped countries, with Stockholm at 1.2 kg, and somewhathigher than Indian cities (SEPA, 1999; World ResourcesInstitute, 1998). Generation of waste in large Chinesecities grows by the order of 10 percent annually (LiShichao, 2000), far ahead of urban population growth at
Box 2.4 Case Study: Tough Life in Xuanhua
Xuanhua County (northwest of Hebei Province) is situated in a harsh zone with stony hills and sandy soils with sandstorms. When the Yang River dries out each year, farmers must rely on rainwater. Besides wind and sand, Xuanhua hasalways had industries. There are the steelworks, chemical factory, paper mill and pesticide plant, fertilizer plant and so on,altogether more than 10 major industries. Most of these were built right after the Liberation in 1949, and are heavypolluters. On entering the County, one can see, almost touch, the smog of all colours in the atmosphere, smell the distinctirritating stench and be amazed by the thousands of pieces of plastic trash brought by the wind and hanging on the trees.
Liu Zhiwei (a lawyer and ex-high school history teacher) and his wife, Yin Shuling (works in the county governmentoffice, ex-math teacher) live in the town. “They say that Beijing is thinking of moving its huge Capital Steel Plant toXuanhua.” Mr. Liu smiles with bitterness. “Air pollution along with the sand storms bring everyday thick layers of dust inthe house; it is useless trying to remove it. But what is most worrisome is the bad effect on our health.” Ms. Yin says:“They say that the whole zone has high occurrences of cancer, mostly lung and liver cancer. If you are told by a doctorfrom Zhangjiakou or Xuanhua: ‘Go consult a doctor in Beijing’, then in 95 percent of the cases, it is cancer.” How do theXuanhua people feel? The couple says: “The Chinese people are cows, they eat grass and they give milk; their livingenvironment, they accept and feel helpless.”
The pollution in Xuanhua not only affects the local people. Its air pollution spreads with the help of the sand storms to theneighbouring regions; and its industrial wastewater even affects the water supply of Beijing. The recently closed-downpaper plant is an example of this.
The couple thinks that Xuanhua alone, being one of the poorer counties in the Province, is not able to change its situation.If one closes down the plants, there will be the problem of laid-off workers. Perhaps with the help of Beijing, the situationcan be changed.

China Human Development Report 31
State of the Environment
just 3 percent (projections for the period 2000-2005 fromWorld Resources Institute, 1998).
Today, less than half the total amount of municipalwaste is reported to be treated—a figure that is up fromonly a few percent during the mid-1980s. About a thirdof this is labelled as landfill, but given the fact that Chinahas only a handful of decent standard landfills, the con-clusion is that garbage is actually dumped at a site thatmay or may not have been allocated for that purpose,and most likely not designed to be a landfill. Just below10 percent is composted, but with low quality in thecomposting process and high risk for toxic pollution,composting proves difficult to sell on the market.
Industrial WasteIndustrial expansion, not least the mushrooming town-ship and village enterprises, in combination with lack ofregulation and economic incentives, have led to rapidlyincreasing amounts of industrial waste products. Moreo-ver, the changing composition of solid wastes has madetraditional small-scale “recycling-by-reusing” increas-ingly difficult and problematic in itself. Chinese industrygenerates five times as much waste as its municipalities,or about 800 million tons in 1998, of which less than 10percent was reported as “discharged” (SEPA, 1999). Theremaining 90 percent is categorised as “treated”, “recy-cled”, or “stored”, the area occupied by industrial wastestorage alone totalling 557 km2, including 30 km2 of ar-able land in 1994 (Zhang Lijun, 1996). Information on theaccuracy of these figures is scarce, but it is reasonableto believe that these categories include a considerableamount of uncontrolled industrial waste dumping, lead-ing to pollution of land as well as adjacent surface andgroundwater sources and air.
Hazardous Solid WasteSEPA (1999) provides a figure of just below 10 milliontons of hazardous waste generated in 1998 or roughly 1percent of the total industrial wastes. Other sources es-timate 20–40 million tons. Beijing authorities estimatethat less than half of the hazardous waste is treated to areasonable degree or re-used—the rest joins the uncer-tain fate of other industrial solid waste streams (Stover,2000).
2.6 Human Health ImpactsThe Chinese population is living much longer andhealthier than 50 years ago, when the average life ex-pectancy was only 35 years and when hunger, malnutri-tion, lack of primary health care, and infectious and para-sitic diseases were common ailments. Today, the aver-age life expectancy of nearly 71 years is very close tothat in developed countries. Also official statistics indi-cate that China’s infant mortality has dropped dramati-
cally over the last half century, from 200 per 1,000 to 31per 1,000 (Ministry of Public Health in China, 1996). In-fectious diseases, though still a serious problem, par-ticularly in some parts of the country, currently accountfor a rather small share of total deaths.
The remarkable turnaround is generally credited tothe government’s efforts in improving the health caresystem, raising people’s living standards, and in par-ticular the Chinese system of rural health care providers,where the “barefoot doctors” have been trained to treatepidemics and common diseases.
However, in the coming decades, China’s deteriorat-ing environment threatens to undermine the gains thatrising incomes would otherwise bring. The rapid indus-trialisation, urbanisation, and economic growth are con-tributing to the increase in incidences of respiratory dis-eases and chronic illnesses such as cancer. Levels ofparticulate air pollution from energy and industrial pro-duction in several of China’s megacities, such as Beijing,Shanghai and Shenyang, are already among the highestin the world, leading to corresponding problems of lungdisease. The seriousness of water pollution in some re-gions, such as in the Huai River Valley, cannot be over-emphasized.
Air Pollution Health EffectsAir pollution is having serious and widespread affectson human health, although comprehensive data is notavailable. Based on the Chinese Air Pollution Index (API)data, there are currently at least 270 million urban resi-dents experiencing air with a quality below what is con-sidered acceptable by the Chinese ambient air qualitystandard. Epidemiological surveys in China have estab-lished a correlation between air pollution and respira-tory diseases. These numbers can be extrapolated toshow that each year, air pollution causes 1.5 million casesof bronchitis, and 23,000 and 13,000 deaths from respira-tory and heart diseases, respectively (Wang Huijiong etal., 1999). Wu (2000) also reported that for the year 2000,there were 600,000 premature deaths, 5.5 million cases ofchronic bronchitis, and 20 million cases of respiratoryillness due to air pollution. Figures from Chongqing andChangsha cities show that deaths from lung cancer are4.7 and 8.8 times higher in highly polluted areas than inclean areas (Draft United Nations Common Country As-sessment on Environment and Energy, Sept. 1999).
Coal burning is a major culprit of air pollution. Chinarelies on coal for roughly two-thirds of its energy sup-ply. Coal burning exposes the population to high levelsof benzopyrene, a known human carcinogen,particulates, and sulphur dioxide (SO2). An investiga-tion of 26 cities between 1976 and 1981 found strongpositive correlation between concentrations of particlesand benzopyrene, and death from lung cancer. SO2 is

Chapter 2
UNDP32
associated with respiratory disease, irritating the liningof the airways and causing inflammation that could leadto a variety of chronic and acute respiratory conditions.The impact is particularly severe to children’s health. Arecent investigation in China found that the incidence ofasthma among children in Chinese cities has been rising.Henan, for instance, has seen an increase of three-foldcompared with ten years ago (China Environment News,1998).
Air pollution is thought to be one of the leading riskfactors for respiratory diseases, such as chronic obstruc-tive pulmonary disease (COPD), lung cancer, pulmonaryheart disease and bronchitis, diseases that are the lead-ing causes of death in China. Although only a limitednumber of epidemiological studies have been conducted,air pollution has clearly contributed to both excess mor-tality and morbidity in China. Based on dose-responsefunctions from studies conducted within China and inother countries, the World Bank has estimated thenumber of deaths and diseases associated with air pol-lution among urban populations. Using the Chinesestandards as a benchmark, they estimate the number ofdeaths that could be prevented if air pollution were re-duced to those levels. According to their calculations,approximately 178,000 deaths, or 7 percent of all deathsin urban areas, could be prevented each year. Anothermeasure of the health impact of air pollution is the numberof hospital admissions from respiratory diseases. Thisstudy found 346,000 hospitalisations associated with theexcess levels of air pollution in urban areas (Johnson etal., 1979)
Air pollution is also a major aesthetic problem, hav-ing negative impacts on morale as many cities includingBeijing, experience very few truly sunny days. Yet, nostudies have been undertaken into this area.
Indoor Air PollutionRecent studies tend to identify indoor air pollution as amore important factor in respiratory diseases than out-door pollutants. Most humans, particularly women,spend most of their time in the home, particularly nearcooking stoves. People living in the north spend evenmore hours exposed to indoor pollution during the win-ter months.
Well over half of the Chinese population use coal intheir homes, and about one-fifth of rural homes rely oncoal for domestic fuel (Karasov, 2000). The effects ofcoal burning are magnified because coal often is notwashed before its use, and it is burned in poorly ventedstoves. Cooking with tainted coal can expose people toarsenic, fluorine, lead, and mercury. A 1993 study con-firms that indoor concentration of SO2, particulates, andbenzopyrene are frequently much higher than outdoorlevels of the same pollutants. In winter months, indoor
pollutant concentrations can rise up to ten-fold oversummer month concentrations (Chen Y. et al., 1993). Astudy by Wang Lihua (1988), a senior professor of envi-ronmental health at Beijing University’s Medical School,demonstrates that Beijing women in coal-burning fami-lies have more respiratory symptoms than those in natu-ral gas-dependent families.
SmokingCompounding the situation is smoking. China has anestimated 300 million smokers, the largest number of anycountry, including about 63 percent of adult men and 3.8percent of women. China consumes 30 percent of theworld’s cigarettes, and is the largest producer of ciga-rettes in the world. Smoking not only directly affectssmokers’ health, but also indirectly threatens women andchildren’s health. Tobacco contains many carcinogens,like polycyclic aromatic hydrocarbons (PAHs). Chineseofficial statistics over recent years indicate a rising curveof lung disease-related morbidity and mortality, in par-ticular lung cancers. Some Chinese studies have alsofound correlations between passive smoking and pre-mature births and birth defects. The Journal of AmericanMedical Association reports that at current smokingrates, by 2025, two million smoking-related deaths wouldoccur in China each year (McGregor, 2001).
Water and Human HealthWater pollution and water scarcity affect human healthin three primary ways:• First, access to a minimum per capita amount of water
is necessary to ensure physical survival and promotehygiene.
• Second, contaminated water serves as a pathway forexposure to microbial and contagious diseases. There-fore, drinking or bathing in water contaminated byanimal or human excreta facilitates transmission andproliferation of disease vectors. China’s water pollu-tion exacerbates water-borne infectious and parasiticdiseases such as hepatitis A, diarrhoeal diseases, ty-phoid, roundworm, guinea worm, leptospirosis, andschistosomiasis.
• Third, surface and groundwater can act as sinks ortransportation routes for chemicals, heavy metals, al-gal toxins, and organic substances that producechronic systemic illnesses, malignancies, and birthdefects, and impair immune system function as a re-sult of direct or indirect exposure.
As countries begin to industrialise, they often undergoa health risk transition. Changes in environmental con-ditions alter the type of environmental health risks towhich a population is exposed, and over time, influencethe overall pattern of disease in the population. Thistransition usually encompasses a shift from a predomi-

China Human Development Report 33
State of the Environment
nance of traditional infectious and parasitic diseases toa predominance of modern diseases, such as cancers,heart disease, and respiratory diseases. However, Chi-na’s modernisation has been unique in creating a combi-nation of traditional environmental health risks, such assewage irrigation, and modern environmental health risks,such as increased use of pesticides and fertilizers, creat-ing a double health burden.
Access to Safe Drinking WaterThe health of China’s people depends, to a great extent,on the quantity and quality of its drinking water supply,the quality of which is largely determined by sources ofincoming water, modes of water supply, and the level ofwater treatment. The majority of Chinese urban and somesuburban residents now have access to tap water, whilethe largest portion of the rural population still relies onhand- or motor-pumped wells, or they fetch water di-rectly from rivers, lakes, ponds, or wells, with little or notreatment at all. Large rivers are the most common sourceof urban drinking water, as well as the major source forrural residents in many parts of the country.
The Human Development Index (HDI – see the An-nex) shows that only 19 percent of the total populationhave access to tap water in China. And yet in only 6 ofChina’s 27 largest cities does drinking water quality meetstate standards. Groundwater does not meet state stand-ards in 23 of these cities.
Waterborne Infectious DiseasesAlthough the incidence of waterborne diseases is stillhigh compared with many other countries, effective medi-cal care has kept mortality low, averaging less than 0.1per 100,000. Still, the population still suffers from anumber of diseases associated with inadequate drinkingwater quality and sanitation.• For the past two decades, diarrhoeal diseases and vi-
ral hepatitis—both associated with faecal pollution—have been the two leading infectious diseases in China.Hepatitis, however, was almost reduced by half throughthe first half of the 1990s, down to 63 cases per 100,000.
• After a sharp drop from 1991 and 1992, the incidenceof dysentery has risen since 1994, in part because ofthe deterioration of water quality.
• A sudden upswing in the incidence of typhoid feverin 1991 and a large outbreak in some provinces in 1992were also partly attributed to the poor drinking waterquality in rural areas. In 1991, typhoid fever incidencereached as high as 10.6 per 100,000.
Industrial and Chemical Water PollutionIt is more difficult to establish the impacts of industrialand chemical water pollution on human health than thosecaused by sewage and human waste. However, recentepidemiological studies suggest that exposure to organic
and inorganic chemicals in drinking water may signifi-cantly contribute to chronic disease. In July 2000, a sur-vey in Zhejiang Province published by the Chinese Pre-ventive Medicine Journal found five to eight times moremorbidity of intestine cancer caused by microcystin tox-ins in water than among people who have access tocleaner drinking water (Zhou Lun et al., 2000).
Liver and stomach cancers are the leading causes ofcancer mortality in rural China. Since the 1970s, deathsfrom liver cancer have doubled, and China now has thehighest liver cancer death rate in the world. In southernChina, where some of the population has long dependedon ponds for drinking water, the rates of digestive-sys-tem cancers are very high. An investigation of 560,000people in 23 villages and towns showed that between1987 and 1989, cancer mortality was 172 per 100,000, whichis much higher than the average mortality rates in ruralChina. Further research is needed to confirm this linkand identify the specific pollutants at fault.
Irrigation with WastewaterTo use wastewater for irrigation has been a common prac-tice in many parts of China throughout history. Nowa-days this practice is especially common in the northernregions, where water is scarce. Pollutants, including or-ganics, heavy metals and other carcinogens, enter thefood chain in the irrigation process affecting humanhealth.
Numerous studies since the 1970s have shown sig-nificant increases in cancer rates and deaths, as well asbirth defects, in areas that have relied on wastewater forirrigation. For example, the incidence of intestinal infec-tions and enlargement of the liver in Shenyang andFushun was 49 percent and 36 percent higher, respec-tively in the irrigated areas than in the control area. Therewere twice as many cancer patients in the sewage-irri-gated area (Wu et al., 1999).
Township-and Village Enterprises (TVEs)A conservative estimate holds that the TVEs dischargemore than half of all industrial wastewater in China. MostTVEs have no wastewater or hazardous waste treatmentfacilities, and since TVEs are widely scattered acrossvast rural areas, their wastes endanger the health of manypeople.
A 1989–1991 investigation of the 10 leading TVE in-dustries in seven provinces and municipalities showedthat industrial wastes were customarily discharged with-out any treatment and control. An analysis of the healthof 860,000 people in these areas revealed that the inci-dence rate of chronic diseases was between 12 and 29percent, much higher than the national average for ruralareas, which is approximately 9 percent. Total mortalityin polluted areas averaged 4.7 per 1,000, higher than theaverage 3.6 in the control area. Life expectancy in the

Chapter 2
UNDP34
polluted areas was 2 years lower than the control (Wu etal., 1999). Although not definitive, evidence suggeststhat industrial pollution from TVEs could become a ma-jor threat to human health in China.
Pesticides and Chemical FertilizersLack of knowledge and information has resulted in over-use and misapplication of chemical fertilizers and pesti-cides. In addition to affecting water, land, and quality offood products, they also cause public health effects. A1989 survey in 30 Chinese cities found worrisome levelsof both DDT and BHC residues in mother milk. An eight-year continuous monitoring of DDT levels in mother’smilk in Beijing concluded that it could take 15 to 20 yearsfor levels to be lowered to the 1980s levels found in mostdeveloped countries (Wu et al., 1999).
Epidemiological studies in some other countries havedemonstrated strong associations between chlor-dimeform—a popular crop and cattle insecticide—andthe incidence of urinary bladder cancer. Surveys in Chinafound up to seven-fold increases in mortality among farm-ers who used this compound (Xu, 1999). A 1973–1975survey found a mortality rate in urinary bladder cancerof less than 1 in 100,000—by 1997 it had increased to 1.4.The increase is particularly high in rural China.
With recent increase in public awareness of environ-mental and health concerns, China banned the produc-tion and use of DDT, benzex (hexachlorocyclohexane),chlordimeform, and other highly potent farming chemi-cals in the early 1990s. Still, some TVEs continue pro-duction due to inadequate control and lack of monitor-ing mechanisms. And the public health nightmares lin-ger on because of their long-lasting effect and bio-accu-mulation in food chains.
The implications of the combined set of traditionaland modern risks to China’s environmental health tran-sition are significant. More efforts and resources are re-quired for both the Chinese government and Chinesepeople to grapple with these daunting problems.
2.7 Impacts on the EconomyBeing one of the poorest and most polluted countries inthe world, China faces harsh economic allocation deci-sions between present development goals and long-termsustainability. Where and when shall its populationforego present consumption in favour of future welfareincrements? China’s impressive reconstruction of itseconomy since 1978 and the convergence towards amarket-based economic system is undisputed. The ac-companying economic growth has brought a dramaticreduction in poverty and improvements in living stand-ards. However, despite decades of successful economicdevelopment, there has been a serious toll of environ-mental damage, mainly due to under-priced natural re-
sources. Pollution, natural resource depletion, and eco-system destruction are costly in terms of health prob-lems and reduced productivity of labour and land, whichmeans in the end these environmental side effects havenegative repercussions also on people’s welfare.
Premature deaths of 178,000 people in major cities eachyear due to pollution, children’s high blood-lead lev-els—up to 80 percent above critical levels—and the 7.4million working days that are lost to health problemsrelated to air pollution, are all grave examples of health-related costs of environmental problems that are inflictedon society. Also seriously affected is the agriculturalsector where both desertification and polluted water af-fect grain production negatively. It is estimated that in1993 approximately 8 percent of the agricultural area usedwater unfit for agricultural purposes, which resulted inan estimated loss of grain production of 1 million tons.The World Bank (Johnson et al., 1997) has estimatedthat if wastewater treatment were increased from the cur-rent 20% to 50% coverage, total grain production couldincrease by 24 million tons by 2020.
The list of the effects described above is by no meansexhaustive and other impacts include irreparable dam-age to invaluable assets—for which there is no substi-tution available, or for which alternatives are extraordi-narily costly. These include, for example, microclimatesthat are destroyed by deforestation and subsequentdesertification to the point where these areas becomeuninhabitable, or on a global scale, the hazard to thestratospheric ozone layer.
The Cost of UnsustainabilityNon-market values are difficult to measure, and carefuleconomic analysis might call for non-market valuation.The World Bank (Johnson et al., 1997) estimates that airand water pollution costs between 3.5 to 8 percent of thenation’s GDP. The largest impacts are from health lossesrelated to air pollution, indoor air pollution and chronicdisease from water pollution. Yet, the estimates lack anumber of high cost candidates, such as damage to cropsfrom ground level ozone and loss of agricultural produc-tion due to drought, flooding and chronic water short-ages. The World Bank underscores that the estimatesare conservative.
Gross Domestic Product (GDP) is the most commonpoint of reference for measuring economic development.Still, it does not take into account most environmentaldamages. Several attempts have been made to calculatea corrected value of economic development, for exam-ple, UNDP’s Human Development Index (HDI), and theWorld Bank’s Genuine Domestic Savings Index. The lat-ter index is based on standard national accounting onnet domestic savings that has been adjusted to reflectresource depletion, and damage due to carbon dioxide

China Human Development Report 35
State of the Environment
Box 2.5 Comparing Human Development Index with the Health Risk Index
Traditionally in the UNDP Human Development Reports, HDI or the Human Development Index has been used to monitordevelopmental progress around the world. HDI is based on three major indices: life expectancy, education, and income.Since the HDI doesn’t directly delve into health and environmental factors, an additional index has been suggested. ThisChina Human Development Report is the first attempt to calculate the so-called HRI or Health Risk Index which is composedof four factors, air pollution, water pollution, nutrition, and access to health services. In order to see how the two indicescompare, we took the HDI and HRI for each province of China and performed a series of correlations. Figure 1 shows anegative relationship between the two indices in that HRI drops as HDI increases. The relationship is not 1 to 1, but closerto 1 to 2. It was also of interest to see what contributing factor or factors affect these indices most. In the case of the HDI,the income index has a larger influence than the education or longevity indices (Figure 2). In the case of the HRI, waterpollution and poor nutrition are clearly the two factors that influence the HRI most, followed by access to health care(Figure 3). Air pollution had the lowest correlation. A preliminary observation from this analysis is that improvements inenvironmental quality, nutrition and health should be positively correlated with increases in income. For more details on HDIand HRI see the Annex chapter.
Fig 1 HDI vs HRI (Chinese Provinces)
y = -0,8649Ln(x) + 0,0278R2 = 0,5631
0
0,1
0,2
0,3
0,4
0,5
0,6
0,7
0,8
0,5 0,55 0,6 0,65 0,7 0,75 0,8 0,85 0,9HDI
Fig 2 HDI vs HDI factors (Chinese provinces)
R2 = 0,9036R
2 = 0,7731
R2 = 0,695
0,3
0,4
0,5
0,6
0,7
0,8
0,9
1
0,6 0,65 0,7 0,75 0,8 0,85 0,9
HDI
Life expectancy index
Education index
Income index
Linear (Income index)
Linear (Lifeexpectancy index)Linear (Educationindex)
Fig 3 HRI vs HRI Factors (Chinese provinces)
R2 = 0,0142
R2 = 0,5289
R2 = 0,429
R2 = 0,7592
0,00
0,20
0,40
0,60
0,80
1,00
1,20
0,1 0,3 0,5 0,7 0,9
HRI
Air Pollution
Water pollution
Poor nutrition
Access to health service
Linear (Air Pollution )
Linear (Poor nutrition)
Linear (Access to healthservice )Linear (Water pollution )

Chapter 2
UNDP36
emissions. The index is also adjusted for human capitalinvestments. There are still significant gaps, however, inthe composition of the Genuine Domestic Savings Indexreflected by the lack of important environmental costs.But also lack of reliable data furthermore aggravates theproblem. Thus, a true evaluation of the Genuine Domes-tic Savings Index is limited to what is possible to meas-ure through standard national accounting systems.
China’s Genuine Domestic Savings for 2000 are re-duced by some 10 percent as compared to the conven-tional measure of Gross Domestic Savings (World Bank,2001). Still on the face of it, with Genuine Domestic Sav-ings at 13.7 percent of GDP, China does not appear at allworrisome. However, the shortcomings of the Index callfor caution in using Genuine Domestic Savings as asustainability measurement for China, in particular sinceit does not at present reflect central problems, such asover-exploitation of scarce water resources, or extremelevels of air and water pollution.
In general, China seems to undervalue its natural re-sources, at least from a historical perspective. Presently,there is a growing concern over the negative economiceffects from environmental degradation, and attemptsare being made to upgrade the pollution levy systemeven though political resistance is making it difficult.
Despite the grim picture presented here, there arepositive trends in terms of decreasing pollutant dis-charges per produced output. These trends must not betaken as a sign of sustainability, however, since they arenot related to carrying capacity.
To calculate the cost of the environmental side ef-fects resulting from Chinese economic development isextremely complex; still to make no attempt would besimilar to say that the cost of pollution and environmen-tal degradation is negligible. Therefore, present effortsfrom international organisations and increasingly alsofrom Chinese environmental economists, to internalisethe costs associated with environmental problems arehighly valuable.
2.8 Regional ImpactsChina’s environmental situation varies tremendouslyacross the vast country. From the east coast to the westinland, the geographical condition for permanent humansettlements rapidly deteriorates, as climate turns fromhumid to arid, with narrow low-lying fertile fluvial plainsbeing replaced by the mosaic of plateaus and basins,long mountain ranges and vast deserts. Consequently,the east is densely settled, intensively developed, richer,and more urbanised with aggravating environmentalpollution threatening human health and quality of life,while most of the west remains poor, facing severe eco-system destruction.
While the geographical settings of the land have laidthis foundation, the regional differences are further com-plicated and diversified by various human processes.This includes the rural-urban division, industrialisationand technology development, cultural variety, the con-tradiction between traditional practices and modern tech-nology, and the unbalanced economic development thathas resulted in a wide rich-poor equity gap. For the pasttwo decades, the entire country has been experiencinghistorical transitions in both economy and society, butthe departure points and the rate of change among re-gions vary considerably across the country. It is at theregional level one can begin to appreciate the complex-ity of the nexus of development and environment and itsinteractive impacts on the environment and the people.
The East Monsoon RegionCorresponding to the key zones identified in section 1.3,the East Monsoon Region roughly encompasses theNortheast, the dry, densely populated North, the centraland southern Coastal Provinces, and much of SouthernCentral China.
The NortheastThe forests in the Northeast are one of China’s majortimber sources while the fertile black soil belt supports arich grain-producing region called China’s “Grain Barn”.Both resources are being depleted or destroyed due toexcessive extraction and land degradation. During thepast half century, at least one-third of the natural matureforest in the area has been cleared out, and the blacksoil, researchers warn, may vanish within the next halfcentury if the current trend of destructive use contin-ues.
The dream of becoming industrialised has been a fe-rocious force transforming the Chinese landscape sincethe 1950s. Its impact probably is more evident in theNortheast than elsewhere in the nation. From the 1950sthrough the 1960s, with the assistance of the former So-viet Union and blessed by the discovery of the Daqingoil field, the Northeast became a major base for heavyindustry, oil extraction and refining. Expeditious devel-opment without a clear awareness of environmental im-pacts created cities with suffocating air, rivers andstreams seriously contaminated and sometimes void oflife, and agricultural lands irrigated with wastewater dan-gerously polluted with heavy metals. Today, while envi-ronmental pollution continues, deeper social impacts startto emerge as the strategic adjustment of the economicstructure unfolds. One of such impacts is the increasingnumber of urban unemployed, laid off from large andpoorly managed state-owned enterprises. According to1999 data (SSB, 2000), annual urban household incomeper capita in Heilongjiang, Jilin, and Liaoning averages

China Human Development Report 37
State of the Environment
4,680 RMB, among the lowest in the country. Increasingurban poor compounded with surplus labourers fromrural areas pose a sensitive issue for social stability anda formidable challenge furthering the on-going economicreform.
The Urbanised East CoastThe Beijing–Tianjin–Tangshan, the Nanjing–Shanghai–Hangzhou, and the Guangzhou–Zhuhai–Shenzhen met-ropolitan areas are China’s three major modern urbanindustrial regions. While air pollution and water con-tamination are major environmental concerns for all three,the causes and degree of impacts vary. Located on theNorth China plain with heavy dependence on coal burn-ing for residential heating, Beijing suffers severe air pol-lution. The situation has worsened in recent years dueto vehicular exhaust from the rapidly increasing numberof vehicles, and from the recurring sand storms originat-ing in the ecologically degraded areas in the Northwest,the North, and the Northeast. Problems with water inBeijing are mainly a matter of quantity, although main-taining the quality is also troubled by upstream-down-stream confrontation with neighbouring province, Hebei,where developmental pressure is tremendous.
The location of the Nanjing–Shanghai–Hangzhouarea on the Yangtze River Delta in the middle of eastChina and the Guangzhou–Zhuhai–Shenzhen area onthe Pearl River Delta to the south, exposes both metro-politan areas to other environmental challenges. Theproximity to the sea allows both to enjoy fair air quality,and the main concerns are to maintain and improve wa-ter quality. Heavy pollution in Shanghai’s Huangpu Riverhas already forced the City to spend billions of yuan torelocate its water supply further upstream.
It is noteworthy that these metropolitan areas haveattracted most of the limited national budget for envi-ronment protection and improvement. It is also in thesecities where public environmental awareness has startedto awaken.
The Drying-out North China PlainHighly variable monsoon rains and chronic water short-age in the North China Plain, combined with rapid indus-trialisation and urbanisation and China’s recent acces-sion to the WTO, are creating for agriculture and mil-lions of farmers a precarious future. The temperate cli-mate and mild winter in the region supports triple crop-ping every two years, though this high yield is sustainedby irrigation. Henan and Shandong, for example, are twomain agricultural provinces in the North China Plain, andtheir irrigation systems depend heavily on the YellowRiver. Since 1972, due to the increasing demand for ur-ban and industrial water and excessive extraction fromthe upper and middle reaches, part of the lower reach of
the Yellow River dries out completely for part of the year,the so-called “Duanliu” phenomenon. In 1997, the worstyear by far, the Yellow River had no flow reaching thesea for 226 consecutive days.
Floods Remain an Enormous ThreatWhile recurring droughts harm much of northern andwestern China, floods are the most costly natural haz-ard. Much of the East Monsoon Region, with its sevenmajor rivers seeking paths to drain excessive runoff tothe sea, is threatened by floods. Proportionately, a mere8 percent of China’s total land area is categorised asflood-prone. Yet this 8 percent coincides with the mostdensely settled and economically developed areas inChina, containing over 40 percent of the cropland wherethe nation’s food security rests, half of its 1.3 billionpopulation, most of the major cities, producing 70 per-cent of the nation’s GDP. Through history, floods havebeen a natural feature of eastern China and a prerequi-site to the renewal and development of agricultural prac-tices. On average, each year, over three thousand peo-ple have lost their lives to floods, and millions of acres ofcropland inundated. In recent decades, flood damageshave been escalating. Four of the world’s 20 worst flooddisasters in the 1990s occurred in China, with an averagedirect economic loss of 20 billion USD each (Munich Re,2000). The main causes for the increases in floods areattributed to human activities, such as narrowing rivercourses, converting lakes to agricultural lands and set-tlements, and increasing siltation due to deforestationand cultivation on hills in the upper streams. Given themaximum stream flow of the 1998 flood in the middle andlower reaches of Yangtze River, the flood water level couldhave been 1 meter lower if the natural capacity of theriver system for draining floodwater had remained thesame as in 1954 when a similar disastrous flood occurred.Still, the casualties in 1954 counted over 50,000 dead,while the victims of 1998 flood was limited to less than4,000.
The Northwest Interior RegionWith the beginning of the new century, China is launch-ing a major development effort in the west, the so-called“Great Western Development Programme”. Given thehigh sensitivity of the ecosystems and the current stateof the environment, caution flags have been raised atthe heated western development strategy, calling forcareful planning with attention to biodiversity protec-tion and the involvement of the people of the region.
The Dryland of NorthwestThe arid and semi-arid northwest has experienced an-other set of regional impacts from change and develop-ment. In the Gobi Desert and the oases of Xinjiang andGansu province, urban and industrial development has

Chapter 2
UNDP38
caused pollution and ecological degradation, mainly asa result of over demands on limited surface and groundwater resources. For example, petroleum exploration andoil field development along with agricultural water ex-traction in the upper and middle reaches of the TarimRiver have caused rapid disappearance of riparian forestin the river basin. Since water is the main limiting factorfor development in most arid areas, competition for wa-ter between urban and industrial uses on the one hand,and agriculture and ecological maintenance in the oasison the other constitutes the overarching problem foreconomic development and environmental protection ofthe region. Grassland resources in this region are alsounder pressure due to economic and demographicchange.
The grasslands of Inner Mongolia are being trans-formed and rapidly degraded by changing forms of pas-toralism (described in section 2.1), mainly escalating graz-ing pressure in combination with decreasing mobility ofthe herds and herding population as they are confinedto private plots. Technology for improving the qualityand productivity of pastoral lands focuses on develop-ing irrigated artificial pastures. Yet, decreasinggroundwater levels and limited, unreliable surface waterflow render such approaches a short-term remedy thathinder the development of a long-term sustainable pas-toral development strategy.
Desertification has occurred widely across the region,while success in combating desertification is limited to afew places where large investments in money and labourhave been made available. A Ministry of Science andTechnology task force estimated that desertificationcosts China about USD 2 to 3 billion annually. An esti-mated 110 million people suffer first-hand from the im-pacts of desertification and, by official reports, another2,500 square kilometres turn to desert each year. Ulti-mately, people’s livelihoods in pastoral regions are atstake. The capacity of the grasslands to support animaland human population is indisputably decreasing, whiledemands from the grassland communities are increasingdue to increasing populations and improved standard ofliving.
Dryland farming on the loess plateau is facing diffi-culties also due to short water supply. As soil erosionprevails, the already unproductive agricultural landsbecome less fertile, and sediment deposited downstreamhas caused damage to the east China region. Irrigationdistricts along major river systems experience decliningproductivity caused by salinisation and lack of irriga-tion water. In the impoverished farming areas, farmers,left at the mercy of nature, mine the lands that their entirelivelihood depends on to meet subsistence needs. In-dustrial development, coal-mining in particular, causes
air and water pollution, as well as harming the local eco-systems.
The Qinghai-Tibet PlateauWith an average elevation over 4,000 metres above sealevel and an extremely rugged terrain, the Qinghai-TibetPlateau offers harsh physical conditions for human set-tlement, rendering the region the least developed area inthe country. 1999 data show that GDP per capita in Tibetis only 4,262 yuan, roughly one-seventh that in Shang-hai. In terms of education, primary school enrolment isthe lowest in China, less than 80%, and merely half of theschool children enrol in secondary school. As a result,as much as two-thirds of the adult population is illiter-ate. These statistics are echoed by China’s highest birth-rate and a natural population growth rate of about 15percent. Life expectancy for Tibetans is only just over 60years; about 10 years lower than the national average. Itis no surprise that Tibet has the lowest Human Develop-ment Index (0.52) among all provinces, autonomous re-gions, and provincial-level cities (see Annex).
While enjoying the lowest potential exposure to out-door air pollution, people in Tibet suffer the highest levelof indoor air pollution due to the high coal consumptionper household. Although living in a place where fourmajor rivers in Asia originate, more than 80 percent ofthe population in Tibet is exposed to unsafe drinkingwater.
Prevailing poverty is the result as well as the driver ofincreasing ecological destruction in the region.Overgrazing in the highland pasture has forced peopleto migrate, and the resulting erosion has raised concernsfor the millions downstream along the Yellow and Yang-tze rivers whose water supply depends on clean, richsources. In addition, large-scale forestry, not unoftenillegal, has been denuding the slopes on the Himalayanfoothills for a quarter of a century, however not provid-ing much benefit to the poor populations that live in theharsh conditions on the Qinghai-Tibet Plateau.

China Human Development Report 39
The Society–Environment Nexus
Chapter 3
The Society–Environment Nexus
The previous chapter described the perilous state ofChina’s environment. It identified many of the immediatesources of China’s environmental problems—such asheavy industry and forestry production. However, theorigin of China’s environmental challenge is far morecomplex than these immediate causes. It lies in the broadertrends and forces, which shape people and society, suchas population growth, economic reform, andglobalisation. This chapter looks behind and beyondthe visible environmental situation with the aim to as-sess the critical trends and forces. This is not a one-wayprocess. Environmental constraints, such as air pollu-tion and water shortages, are shaping Chinese society,at the same time as society and its institutions set thepreconditions for environmental sustainability.
This chapter addresses six broad development issuespopulation growth, economic development, poverty,awareness, consumption and technology developmentbefore turning to brief sector reviews of water, energy,transportation, and agriculture. The final two sectionsfocus on important roles played by globalisation andgovernance in understanding China’s future options.
Each of the following sections outlines significantsectoral trends, and concludes with a sketch of possiblefuture development paths, as well as the uncertaintiesthat are critical in order to understand the wide span ofpossible futures that China may develop towards.
3.1 Population Growth and MigrationPopulation pressure on conspicuously scarce resourcesis one of the main forces behind China’s environmentalpredicament. This situation is set to become even morechallenging, as the population grows, the age structurechanges, migration rates increase, and the populationcompetes for increasingly scarce resources.
Population GrowthAt the founding of the People’s Republic of China (PRC)in 1949, the country had a population of about 540 mil-lion. Within three decades, that figure had increased to
more than 800 million. This created a strong populationmomentum that is still driving China’s demographicgrowth. The number of adults of reproductive age (20–49) should peak at some 660 million by around 2010, andthe two decades around this peak are critical to futuregrowth patterns. For twenty years, China has imple-mented successful family-planning campaigns, and it isworth pondering that, without these, the populationcould have been 200 million more than it is now.
Most projections of China’s population estimate anincrease to 1.5 billion before levelling out and possiblybeginning to decrease. Even in these medium projec-tions, which assume a continuation of historically lowTotal Fertility Rates (TFR), the first quarter of the 21stCentury will witness an increase of 250 million people—equal to the population of United States (Heilig, 1999).Higher projections, based on higher (but still not high)TFR, have China’s population topping 1.7 billion by 2050(see figure 3.1).
Population growth is distributed unevenly betweenregions, ages and gender. The natural growth rate var-ies from minus 1.1 percent in Shanghai to over 14 per-cent in Guizhou and Tibet (see Annex). In some cases,this uneven natural growth rate may be balanced by rural-to-urban migration. In other cases, the migration mayexacerbate the imbalance—for example, Guangdong’snatural growth rate is almost 10 percent, and the prov-ince also attracts migrants. The age pyramid illustratesthat China’s population is set to age dramatically in thecoming decades, with the consequence that there are tobe proportionally many more old people. The genderratio is also skewed, with almost 103 males for every 100females—rising to almost 111 in Hainan province (seeAnnex). These dynamics mean the make-up of the Chi-nese population is set to change; different age groups,genders, and regions impose differing demands on theenvironment, and these complex population dynamicsmake sustainable management of natural resources evenmore challenging.

Chapter 3
UNDP40
Fewer Resources, More PollutionDespite significant natural resource deposits, the highpopulation results in the fact that the resources per capitaare often very low. For freshwater, cropland and forest,the average Chinese citizen has between 15 and 30 per-cent of the world average.
Regional variations serve to exacerbate this situation.People in the dry northern provinces including Beijing,Tianjin, Ningxia, Hebei, Henan, Shandong and Shanxihave less than one-quarter of the Chinese average wa-ter availability. Per capita availability in these areas iscomparable with North African and Arab states. Andeven in Heilongjiang province, which overall is relativelywell endowed, almost one in five people face water short-ages. With regards to arable land, Jiangsu province hasmore than 70 million people and a population densitythat exceeds 700 per km2, which is almost equal to Bang-ladesh—922 per km2 in 1996 (WRI, 1998).
The mounting population has also contributed to in-creased water, air, solid waste and noise pollution. Thecurrent population is already overwhelming the capac-ity of the ecosystems to absorb emissions in vulnerableareas throughout the country and in the densely popu-lated areas in the east. Patterns of consumption and eco-
nomic development exacerbate the problem (see sections3.2 and 3.5).
Urbanisation and MigrationUntil the beginning of the 1990s, China was successfulin applying strict controls to avoid wide-scale internalmigration and related problems. Liberalisation and de-regulation have brought a relaxation of the controls ontravelling and resettlement. Two overall and growingmigration trends are evident, superimposed on the popu-lation challenge. First, as in most countries, there is themove from rural to urban areas, including both tempo-rary and permanent migrants. Second, there is a generalmove down the slopes from west China to the generallyricher eastern areas. Taken together these trends resultin large migrations from rural western areas towards thecoastal cities.
Low per capita access to resources and environmen-tal degradation help drive this migration. Shortages ofresources in rural areas, including access to good landand clean water, lead to poverty and unemployment. In-creased opportunities for travel prompt unemployed andpoor people to move to urban areas in search of a betterlife for their families. This general process is exacerbatedby sudden disasters, such as the 1998 floods, which ledto “economic displacement” of large numbers of youngpeople from flood-affected areas. Many other forces arecontributing to migration, notably of course, the chanceto improve one’s economic and social status.
Most migration in China is to urban areas. During1980–1998 urbanisation levels grew from 19 to 30 per-cent —a net movement of well over 100 million people.The level of urbanisation is forecasted to grow to 45percent by 2010 (United Nations Team in China, 2000).Thus, within the next 10 years, over 200 million peoplewill move to the already stretched urban areas. There arealso inter-rural migrants, but these are less significant interms of impact on the environment.
Once in cities, migrants add to the growing environ-mental challenges, partly because the recipient urbanareas lack the management capacity requisite to absorbthe newcomers. Even without the influx of migrants, mostcities in China already face huge challenges in deliver-ing basic services such as clean water and air. If theanticipated additional 200 million people arrive, this maywell result in truly atrocious living conditions—in termsof water, air, and noise pollution. Although the migrantswill undoubtedly suffer the worst of these conditions,many of the most vulnerable original city dwellers willalso suffer. Deteriorating living conditions will in turnhave an impact on health and, possibly, social stability.Migration to cities also has an impact on land use. InChina’s eastern cities escalated demand for housing has
Figure 3.1 UN population growth projections (Heilig,1999)

China Human Development Report 41
The Society–Environment Nexus
resulted in converting prime agricultural land around thecities to residential areas.
Migration often causes severance from traditionalcustoms and practices. Migrants usually leave behindsocial, religious, or communal obligations—includingthose related to the environment. Having arrived in thenew urban area they have fewer rights (if any) than localcitizens and may therefore also have less respect, under-standing, and ownership for the environment than thosewho have been living there for generations. This couldbe particularly true for the estimated 100 million “float-ing population”. Why bother keeping the air and streetsclean, if you have no local rights and may anyway haveto move on?
The search for employment adds to migration withinChina. For example, the large numbers of constructionschemes—dams, roads and airports—displace peopleby attracting them to new workplaces. Theseaccumulatively lead to significant numbers of peoplemoving across China. Hundreds of millions of peoplemoving large distances to new areas, often shipping theirbelongings and returning home every year, create a hugedemand for transport, which in turn has environmentalconsequences (see section 3.6).
With almost half of China’s population living underconditions of severe water scarcity in the northern riverbasins, having even less water will affect people’s liveli-
hoods, if not survival. Degrading environmental condi-tions and an emerging awareness are factors that maydecrease fertility rates. One only has to go back to theGreat Leap Forward of 1958-1960 to see what dramaticconsequences an evil combination of ignorant policies,bad governance and water scarcity can have on demog-raphy. Figure 3.1 illustrates how TFR was affected bythe combination of mismanagement and environmentallyrelated stresses during these years. For a present dayexample, one only needs to look at Russia, where a com-plex combination of environmental, economic and politi-cal instability has led to a dramatic decline in populationgrowth over a short period.
Future Trends and UncertaintiesBecause of China’s enormous population, even slightvariations in fertility and mortality assumptions are boundto yield wide differences in long-term population projec-tions, particularly in absolute numbers. UN’s mediumvariant prediction for 2050 projects an additional 200million Chinese. But as figure 3.1 shows, the span be-tween the low variant of a decreasing population of just1.25 billion by 2050, and the high variant of a still in-creasing population of almost 1.7 billion, amounts nearlyto a staggering half billion people in the balance.
3.2 Economic Growth and DevelopmentStrategiesEconomic growth, the mainstay of Chinese developmentpolicy in the post-reform period beginning in 1979, re-mains at the top of the priority list. This growth has beena driver of declining environmental conditions in China,but economic growth is not inherently detrimental to theenvironment. Rather, environmental degradation is afunction of the content of the growth and how well envi-ronmental considerations are integrated with economicdevelopment. Whereas governance aspects of thesetrends are further discussed in section 3.12 (Governanceand Institutions), this section reviews the approachesand perceptions underlying China’s growth model, dis-cusses the kinds of environmental consequences thisgrowth model may entail, and looks finally into futuretrends and uncertainties, and the ways in which devel-opment strategies are incorporating environmental con-cerns.
Economic Growth as a Key Development StrategyIn retrospect, the development strategies that took formin the wake of the Mao era and the subsequent decadeof turmoil during the Cultural Revolution, placing eco-nomic reform and growth at its heart, have been verysuccessful.
In terms of the global economy, China has grown froman economic dwarf with limited overseas trade in the1970s, to its present position as an emerging world
Box 3.1 When Resources Cease to be Enough
Can China support an additional quarter of a billion peo-ple within just a quarter of a century? Food supply iscrucial and has been discussed intensively over thelast years, notably Lester Brown’s Malthusian report ofChina’s food demands draining world food markets(Brown, 1995). A more recent and comprehensive con-tribution to this ongoing debate is “Can China FeedItself?” (Heilig, 1999) which arrives at the more positiveconclusion that China can feed itself under certain con-ditions: family planning has to be effective in keepingpopulation development down; water needs to be uti-lized more efficiently; and there must be better floodcontrol. Heilig also notes that large-scale water trans-fers from the south to the north may be inevitable, butpoints out that in economic, environmental and socialterms, a favourable alternative is that water-thirsty eco-nomic and urban sectors migrate slowly southwards.
What if we reverse the question and ask: “could envi-ronmental problems affect population development?”Due to environmental constraints, Heilig’s conditions maynot hold. For example, what would happen if waterefficiency does not improve, if water demand in thenorth is not reduced, if supply is not increased or ifprecipitation decreases, due to natural fluctuations orclimate change?

Chapter 3
UNDP42
economy, with a year 2000 GDP of 1.099 billion USD—twice the Indian, more than half the German, and morethan a tenth the US economies (Economist IntelligenceUnit, 2001a). Measured in terms of its relative purchas-ing power instead of the exchange value, China’seconomy would be ranked the third largest in the world,growing more than twice as fast as the OECD countries.With the recent WTO entry and as host of the 2008 Ol-ympics, China’s global role is likely to become even morepronounced.
When the reform-oriented leaders under DengXiaoping came to power in the late 1970s, they showedan interest in China’s East Asian neighbours as formida-ble examples of effective development strategies. Japan,South Korea, Taiwan, and to some extent Hong Kongand Singapore, all had followed a similar developmentpath. The cases of Taiwan and South Korea, among theabsolutely poorest countries in the world as late asaround 1960, are particularly striking (Hallding, 1991).
This miraculous development formula applied by Chi-na’s neighbours had started with land reforms that cre-ated incentives to increase agricultural production andgenerated surplus among broad groups of farmers. Withsome spare money in hand, farmers started demandingsimple products, first to increase agricultural output andsecond to improve living standards. In the early stagesof this development strategy, import substitution policyprotected domestic producers from international com-petition by means of various kinds of trade barriers,thereby giving domestic industry leeway to develop.Later on, the government switched to a developmentstrategy of export-led growth, through which compa-nies that had grown competitive on the domestic marketreceived government support to boost exports. One ex-ample of the latter, copying Taiwan and South Korea, isthe establishment of special export zones along the Chi-nese coastline, to enable foreign companies to set upjoint ventures and benefit from low taxes.
The economic records for the last half-decade, withan average GDP growth of 8.3 percent between 1996 and2000 (Economist Intelligence Unit, 2001b), is evidence ofthe remarkable strength that China’s economy hasgained. Seen in an East Asian context, China was theonly country in the region that was seemingly unaffectedduring the 1997-98 Asian Crisis, and now China has de-veloped into a stabiliser and important driver of the over-all Asian economy.
The Treacherous “Get-Rich-Fast, Clean-Up-Later”StrategyFrom a somewhat broader sustainable development per-spective, this miraculous economic growth took place atthe cost of severe environmental degradation—conse-
quences that were not unknown to the Chinese decisionmakers.
“China is a developing country. Its financial resourcesare limited in the face of the heavy task of full-scale eco-nomic reconstruction. Therefore the state cannot affordto make lavish appropriations for environmental protec-tion for some time to come.” This 1988 statement fromQu Geping, then head of China’s National Environmen-tal Protection Agency speaks tellingly to the level ofambition of Chinese environmental policy-makers—itshould be done, somehow, but it must not cost any-thing, at least not now. Throughout the reform period atendency has prevailed among Chinese leaders at differ-ent levels to see environmental problems as an unpleas-ant side effect of economic development, a necessaryevil that one has to live through as the nation growsrich, and only then can start thinking about cleaning up(Hallding, 1991).
Indeed, the “get-rich-fast – clean-up-later” strategywas precisely the environmental development model thatChina’s East Asian neighbours had followed duringmuch of the latter half of the 1900s. Japan, the ultimatesuccess story, once having reached the height of themad dash for economic development, became renownedfor its notoriously polluted environment, with urban citi-zens inhaling oxygen from street corner automats, andimages of maimed victims of Minamata mercury poison-ing filling news media. For more than a decade Japaneseenvironmental controls have been among the strictest inthe world—now when they can and must afford them.
Several indications suggest that the “get-rich-fast –clean-up-later” strategy is inappropriate and even dan-gerous for China. First, it ignores significant technologi-cal advances that render environmental investmentsmuch cheaper today than previously. Second, the abilityof a country to “clean up” depends on its geography.China, with its vast territory and long river systems, willnot be easy to restore. Third, the people who favour thisstrategy are not usually the ones who suffer from theresulting pollution and environmental degradation. Fi-nally, this approach goes against the generally acceptedprecautionary principle—i.e. there is a point of no re-turn, it is not known where this point is, so stay on theside of caution.
In combination, these objections make the “get richfast – clean up later” strategy particularly treacherousfor China. Important parts of the ongoing environmentaldegradation may be irreversible. Once biodiversity is lost,river ecosystems destroyed, arable land desertified, andgroundwater contaminated, there is no going back, atleast not at a feasible cost. At best, the “get-rich-fast –clean-up-later” strategy is the least cost-effective ap-

China Human Development Report 43
The Society–Environment Nexus
proach. At worst, it becomes a “get-rich-and-dirty—stay-dirty-get-poor” approach.
The Inside View: How Economic Growth hasAffected the EnvironmentDuring the Maoist period until 1979, China’s economywas centrally planned and supply driven. Prices of mostbasic resources as well as many commodities were set atartificially low levels in relation to the cost of produc-tion, and without relevance to the costs of pollution ordepletion of natural resources stocks. The result waslow efficiency in resource use and an economy charac-terised by low output and relatively high levels of re-source consumption. Add the fact that few effectiveenvironmental regulations were in place, and the groundwas laid for an economy in which further growth wasdestined to cause serious, widespread environmentaldegradation. The fact that the pre-1979 economy oper-ated on a modest level, with negligible competition andlittle trade, reduced somewhat the scale of the negativeenvironmental consequences at the time.
Since then, China’s economic output has quadrupledover a two-decade economic surge, running an outstand-ing 8 percent annual average growth (Ziegler, 2000). Thisperiod of economic growth first resulted in heavy exploi-tation of natural resources with direct negative environ-mental impacts. Following on from the legacy of the Maoera, there was little concern for environmental conse-quences, with exploitation of natural resources far be-yond carrying capacities. This has continued largely una-bated and unregulated for many years. In the absence ofregulatory controls, competition in certain sectors—stock chemicals and cement to mention two—has pro-moted a “race to the bottom” in terms of who can mostquickly exploit human and natural resources in order tomake profit and attract investment.
Pervasive economic subsidies have moreover con-tinued to distort the prices of water, energy, and otherbasic natural resources. Scarcity and environmental ex-ternalities have not been reflected in the prices of theseessential goods. Water is a good example where pricesare artificially low and price increases, in most cases,have not provided enough incentive to enhance waterconservation or to finance treatment of dirty water.
Finally, competition, both internally and with foreignproducers, has been limited to a few sectors—a situa-tion bound to change with China’s WTO membership.Monopolies are common and privatisation has a longway to go still, so many enterprise managers and deci-sion makers are inclined to increase production and em-ployment rather than improve competitiveness. A con-siderable part of economic development occurred in aneconomic environment that permitted entrepreneurs tobenefit from cheap inputs of material and labour, without
having to pay for chemical discharges or workers’health—an unsustainable growth model carrying enor-mous social costs.
Ameliorating this negative trend, however, have beenthe market-oriented reforms that instigated economicgrowth and also set off positive environmental side ef-fects. With prices increasingly reflecting scarcity of re-sources and true production costs, quality and efficiencyin resource utilisation have improved considerably. Atthe same time, privatisation of state-owned enterprisesand the growth of a substantial private sector have cre-ated a more profit-oriented, and thus more cost- and re-source-efficient industry. In addition, the opening-up ofinternal and external trade has increased competition,providing further incentives for resource efficiency. Fi-nally, with a shift away from the planned economy, muchof the heavy supply-side industries are no longer needed.There has been a corresponding macro-level economicrestructuring, as these polluting industries have been tosome extent closed and replaced by higher-tech and serv-ice industries—albeit situated in other parts of the coun-try. From the late 1970s to 1998, the service sector in-creased its share of GDP from one-quarter to one-third.These new sectors consume fewer resources and emitfewer pollutants per unit of GDP.
Sustainable Growth in Theory and PracticeThe Chinese leadership finds it easy to embrace con-cepts of sustainable economic development and“economy and environment developing in tandem.” Thehard part comes in trying to put this into practice. Asubstantial part of Chinese society, notably leaders atprovincial levels and below, and industry managers, stillfavour the “get-rich-fast – clean-up-later” approach.Also, when tough choices need to be made, it may re-main easier to sacrifice the long-term environment in fa-vour of short-term economic or political gains. For exam-ple, current preferences for employment over environ-mental considerations reveal that authorities are con-cerned about the effects of huge unemployment figures.
So, a crucial gap exists between theory and practice,and herein lies the key uncertainty as to how the eco-nomic growth model will affect China’s sustainability inthe future. China is faced with a sharp trade-off betweenthe requirement for long-term sustainable growth, anddemands for short-term economic returns. To a large ex-tent this is an outcome of the different realities betweenthe level of macroeconomic policymaking, and themicroeconomic level where day-to-day decisions actu-ally take place.
Seen from the local point of view, one new low-end,polluting factory can boost the local economy by pro-viding labour for an unemployed agricultural workforce,causing only minor environmental problems. The sec-
Chapter 3
UNDP44
ond and third factories that follow would make environ-mental consequences more of a concern but still man-ageable. By say the “seventh” plant, the environmentalstress could well have exceeded tolerable limits puttinga stranglehold on further economic development. Andvice versa if one locality puts the “seventh” plant online and causes a local environmental catastrophe, it isstill only a local problem. But when a larger number oflocalities build beyond carrying capacity, they can jeop-ardize the sustainability of an entire region. A disquiet-ing number of Chinese localities are operating danger-ously close to the “seventh” plant, where short-termgains imperil all future economic growth.
Yet as the market approach becomes more widespread,and as people, industry and government think increas-ingly in terms of market forces, many new opportunitiesfor environmental protection will unfold. To set the tone,these opportunities will have to be initiated at the macro-economic level, for example in terms of fiscal, tax andtrade policy, and green accounting. Many other oppor-tunities are to be found at the sectoral level. China isalready moving in this direction, with pollution taxes,experiments with emissions trading, and slowly increas-ing prices with some consideration of environmental ex-ternalities. As the market framework becomes more com-prehensive, and as market forces truly permeate all cor-ners of the economy, and as more detailed and reliableinformation becomes available, Chinese authorities can
develop a full array of market-based incentives, includ-ing fees, fines, permits, emissions trading and green taxesto promote clean behaviour and generate revenue to fi-nance costly clean-up and prevention. Market-basedinstruments provide incentives to the private sector tofinance environmental protection. The way forward inthis respect is outlined in chapter 4.
Future Trends and UncertaintiesThe major trend so far indicates that growth has beenbad for the environment. Although resource use andpollution discharge per unit of output in the Chineseeconomy have decreased as a result of market-orientedreforms over the past decade (SEPA, 1999, 2000, 2001),economic growth has been so strong that total levels ofemissions and resource extraction have increased. Thekey question, therefore, is to what extent will market eco-nomic reform prove powerful enough to internalise envi-ronmental costs, so that future economic growth—cru-cial as it is to improve the living conditions for severalhundred millions of poor Chinese—can become trulysustainable. As section 2.7 (Impacts on the Economy)indicates, the costs of environmental degradation dis-count considerably the value growth that has occurredover the past decades.
The Chinese economy is expected to grow substan-tially in the future, although how much and how fast, isimpossible to predict. It is also safe to assume that inter-
Box 3.2 Sustainable Development in Reality
One interesting way of understanding how future economic development will evolve could be to look at how recent andcurrent development programmes manage to internalise environmental costs without creating environmental deficits.
The Great Western Development Strategy is a central development activity that takes a market-oriented approach todeveloping the poorer western provinces. On paper, it has ecological conservation and sustainable development at itsheart. Although translating this into practice is an enormous challenge, the strategy offers obvious opportunities formerging growth and environmental protection. For example, the west is rich in renewable energy resources, and these,rather than fossil fuels, could be put at the centre of development. And cleaner sector activities can be stimulated toprovide much of the employment and economic growth. Information and communication technology may also provideopportunities for the west to avoid many of the industrial environmental problems experienced in China’s east. But thereare far less alternative sustainable development paths for how to utilise the vast west. Improved transport infrastruc-ture—a central aspect of the western development—could be a mechanism for transferring pollution-intensive industriesto the west, such as paper, low-tech chemical manufacturing, coke and steel, while at the same time emptying thewestern provinces of their natural resources. Such a strategy is likely to generate economic growth, and possibly alsoprovide room for environmental improvement in China’s coastal provinces. But the result for the west would be long-term,devastating environmental problems.
The Beijing Green Olympics strives, as the name indicates, to position itself as the first Olympic Games with a strongenvironmental focus. And it would be surprising indeed if Beijing itself did not come through as a much more environmentaland “green” city in 2008 that it is now. With monumental construction projects, upgrading of transport systems, and otherlarge economic undertakings, the preparations for the Games are bound to generate economic growth. The question is towhat extent is it possible to promote this growth in a more sustainable way, and whether Beijing in 2008 will prove to bea more sustainable urban system than Beijing 2002. The Beijing Olympics represent a showcase opportunity to demon-strate how economic development, modernisation, and environmental improvements can all be part of the same sustain-able package. But if the greening of the Olympics amounts only to ostentatious construction projects relying on hefty one-time government subsidies and over-utilisation of water resources at the expense of surrounding water-scarce areas,then the Olympics would not only fail to be “green” in the sense of “sustainable” but moreover would cause yet morepressures on the already heavily stressed ecological system in the larger Beijing capital area.

China Human Development Report 45
The Society–Environment Nexus
nalisation of environmental costs and efficiency gainsfrom a more market-oriented economy will not suffice toneutralise the environmental toll generated by economicgrowth yet for many years to come. In the foreseeablefuture, therefore, economic growth in China will con-tinue to have an overall negative impact on the environ-ment. Furthering governance reform, as outlined in sec-tion 3.12 (Governance and Institutions), is crucial forChina’s ability to generate high economic growth whileminimising the environmental impacts.
But there are also risks for environmental backlashesto the economy, particularly if areas in eastern Chinathat stimulate the economy, exceed environmental thresh-olds, creating, e.g. chronic water shortage, or are struckby natural catastrophes. Such events, depending on theirmagnitude and context, could trigger a downward spiralwith slumping growth and unfortunate social repercus-sions leading further into economic stagnation.
With China’s global and regional economic importanceon the rise, the global economy and international tradeissues affect China’s path into the future more than everbefore. Therefore, China’s response to the WTO entry islikely to have far-reaching effects on its opportunities toachieve sustainable growth.
3.3 Poverty, Equity, and EnvironmentalJusticePoverty is often simply considered to be a cause of envi-ronmental decline, but the causal relationships are verycomplex, and poverty is more often a result of environ-mental degradation. This degradation can reach a pointof no return, after which poverty and social instabilityare inevitable. A large proportion of the Chinese popula-tion is likely to remain poor for many decades to come,and ensuring they have adequate access to environ-mental resources may be essential to maintaining stabil-ity and economic growth.
Inequity and Poverty in Modern ChinaAs a result of previous policies to promote rural devel-opment, social welfare, basic education and support ofwomen, China used to be a poor but by internationalstandards relatively equitable society. However, manyinequities do exist, and these have grown substantiallysince the reforms took off in the early 1980s. These ineq-uities appear as economic and social disparities amongand within provinces and cities, between rural and ur-ban areas, between east and west, between the Han andminorities, and between men and women. Whereas manyresidents in China’s eastern provinces enjoy a high stand-ard of human development, more than 140 million Chi-nese people live in provinces that, if classed as inde-pendent countries, would fall into the low-end category(see Annex).
Some official figures illustrate these discrepancies.GDP per capita in Shanghai in 1999 exceeded 14,000 USD,more than 10 times that of Guizhou at 1185 USD. Ruralfemales in five provinces (Ningxia, Gansu, Qinghai,Guizhou and Tibet) experience adult illiteracy rates over40 percent, compared to under three percent for males inmost cities (see Annex). Even within relatively wealthyFujian province, adult illiteracy levels vary from underfour percent for men in cities to over 30 percent for womenin rural areas (UNDP, 2000).
In terms of poverty, the country still has about 50million people living in absolute poverty in rural areas,with an annual income of less than 635 yuan (about 75USD), and 12 million urban people with an annual in-come of 2,000 yuan (240 USD) or less. China accountsfor one-quarter of the 900 million poor people in Asia.Although the poor often live in the inland provinces, inrural and remote areas, and in areas with large minoritygroups, the picture is becoming more complex. There arenew types of poor such as the urban poor, laid-off work-ers, and the environmental poor. Most provinces in Chinahave significant numbers of both rural and urban poor,enough to threaten social stability.
Inequity and Poverty Create EnvironmentalDegradationSome evidence exists that poverty and inequity are driv-ing factors in creating environmental degradation. Par-ticularly in rural areas, in combination with inappropriateeconomic and social policies, poverty can force peopleto exploit land and forest resources in unsustainable waysthat may result in land degradation, deforestation,biodiversity loss, and water shortages. From a local per-spective, the point of no return is quickly reached, bothfor the environment and for the people, who are forcedto move on. Educational poverty can also contribute.For example, farmers who out of ignorance inappropri-ately use pesticides and fertilisers can inadvertently harmthemselves, their families, and the soils and water onwhich they depend.
One-sided policies dealing with poverty can also leadto increased environmental stress. In the 1970s, to over-come rural poverty and promote Mao’s policy of localself-sufficiency, the government initiated the townshipand village enterprises (TVEs). Extremely successful inboosting the rural economy, this strategy has proveddevastating to the local environment, consuming re-sources—notably coal and water—very inefficiently,emitting large volumes of air, water, and solid waste pol-lution, including much toxic waste. By 1999, TVEs em-ployed well over 100 million people (State StatisticalBureau, 2000), but were responsible for 50 percent ofindustrial water and air pollutant emissions (SEPA, 2000).Up to 20 million hectares of arable land has also been

Chapter 3
UNDP46
polluted by TVEs (Research Group of Sustainable De-velopment and Comprehensive Productivity in ChineseAgriculture, 1995). This conflict continues, as the na-tional authorities close down many enterprises on thegrounds of pollution, and the local authorities re-openthem, partly to avoid fall-out in terms of poverty, ineq-uity, and social unrest.
Environmental Degradation Feeds Poverty andInequityPoor people usually have less access to natural re-sources. As the environment degrades, there are evenless resources, and in most cases it is the poor who arethe first to suffer. This “environmental poverty” contrib-utes further to economic poverty and increased ineq-
uity, and could be a ticking time bomb for China’s soci-ety.
Environmental Justice for AllEnvironmental justice, in general terms, implies that nogroup of people, including all racial, ethnic, and socialgroups, suffer disproportionately from the negative en-vironmental consequences of industrial, municipal, andcommercial operations, or the execution of federal, state,local, and tribal programmes and policies (USEPA, 2001).Injustice occurs in cases where some people benefit sig-nificantly from activities that cause ecological damage,at the expense of others who are subjected to the envi-ronmental costs of the damage. One obvious example isthe large-scale, unchecked, and often illegal felling of
Box 3.3 The School in the Sand Storms
Xuanhua Secondary High School is situated in Xuanhua County in Hebei Province 180 kilometres from Beijing. It is about10 kilometres from Huangyangtan, one of the sources of the sand found in Tiananmen Square in March 2000, after one ofthe worst sand storms. Xuanhua people have a rhyme: “Twice a year it blows; six months lasts each blow”. Sand andwind are part of everyday life for the students in Xuanhua Secondary High School.
“The wind starts in February each year and it lasts about a week each time. The sand saturates the atmosphere andmakes walking to school a hard task”, one of the students says. Nonetheless, the schooling and outdoor exercises go on.It seems that the windy conditions have gotten worse the last couple of years. “We plant trees each year around theschool, and we are told the importance of environmental protection. But we feel our force and help are very limited to fightagainst the wind”.
The deputy principal, Mr. Xue acknowledges that the tree-planting has little impact against the strong north wind. “Besides,the general environmental consciousness is low and many new trees are destroyed. There used to be more trees in thearea; lots of them were cut down by the farmers, after the land reform, for construction and furniture making”.
Sand storms cast shadows over the lives of Xuanhua people. At the school gate, candy-stick peddler Guo Runxi recountsthat he cannot sell candy sticks when the wind is strong. For about one to two months, between early spring and June,he cannot do business. He attributes the worsening situation to the development of the west. “The hills are flattened andthe storms become fiercer without their protection”. Walking out from the school, postman Sun Wanping adds that the sandstorm last year was so strong that it prevented him from opening his eyes. “To deliver post, I had to push the bicycle.Although there is reforestation in the County, there is not enough follow-up to ensure survival of the trees”.
In Xuanhua, people sing: “A tree in the spring, a dry twig in the fall; every year we plant trees, never to become timber”.They say that with all the trees planted in China, it should be covered several times with forest.

China Human Development Report 47
The Society–Environment Nexus
trees, which destroys old ecosystems that have providedsustainable services including food and housing to peo-ple for hundreds of years. Another example is when afactory pollutes air and water leaving local people withhealth problems, depriving farmers of their land, whilethe factory owners increase their wealth.
In many cases, however, it is very difficult to correctthings through enacting environmental justice. Thereare often two sides to every story, as the following exam-ples illustrate:• Emerging middle class Shanghai families live in clean,
air-conditioned apartments, enjoy a secure energysupply and sometimes even own a car. Nearby, re-cently arrived migrant workers sleep outdoors, lacktoilet facilities and access to water, breathe dirty air,and cannot sleep for the noise and mosquitoes. Allthis seems like an injustice, as the migrant workerswere probably already the victims of poor policiesand resource over-exploitation in their original placesof residence. However, Shanghai’s residents, who mayhave invested time, energy and finances over severalgenerations to improve their city and society, mayargue that the migrant workers have less right to thecity’s facilities and cleaner areas. Who then has therights to local environments?
• When farmers in upstream areas of the Yellow Riveroverdraw the limited water resources for local irrigatedfarming, downstream farmers and city dwellers suffer,as they no longer have a secure supply. To whomdoes the water belong?
• The Three Gorges Dam case involves the relocationof several million people, denying them access to eco-systems that have long served as their primary sourceof livelihood, often for several generations. At thesame time, the dam is to generate “clean” energy, notpolluting the air, reinforcing millions of other people’sright to fresh air. Which is most justifiable, land rights,or clean air?
Each of these cases is a result of a series of linkedcircumstances that are the subject of this report. Leav-ing the contextual issues behind for a moment, however,what these examples illustrate is that although questionsof environmental justice are clearly involved, these ques-tions are not so clear-cut as either side usually portraysthem.
What the conflicts over rights associated with envi-ronmental qualities actually reflects is China’s weak gov-ernance framework, in particular the lack of channels forvarious groups or individuals to voice their views, theabsence of transparency in the decision making proc-ess, and the lack of mechanisms to balance interests andoffer compensation.
Adding the global perspective, one might argue thatall people in developing countries suffer from environ-mental injustices, as they are the victims of global envi-ronmental problems they have not caused themselves—climate change being an obvious and topical example.
GenderMen and women are exposed to different environmentalstresses. Their work environment often differs, a factthat may have considerable health consequences givenChina’s dismal occupational health situation. Also,women are more exposed to high levels of indoor airpollution due to the fact that they spend more time athome, especially in the kitchen. As agriculture is increas-ingly the work of women, it seems reasonable that theyshould be more involved than men in questions sur-rounding the sustainability of agriculture. Yet, strongpatriarchal traditions prove counterproductive to this,and Chinese media have recently reported that womenfarmers have been denied equal rights to contract land(ADB, 2000). Women farmers will be increasingly sub-ject to the ill health effects of pesticides and fertilisers.
Future Trends and UncertaintiesGiven increasing pressures on limited resources, envi-ronmental inequity in China is a growing concern. Thehaves, those with water, clean air, and access to land arethe environmental elite. These haves are likely to con-tinue to increase their consumption, displacing their en-vironmental damage to areas where the poor live. Thehave-nots, living in dirty, smelly, conditions, withoutaccess to land, have fewer and fewer alternatives otherthan further damaging the environment, further reduc-ing their access to land and water, increasing their expo-sure to pollution and worse poverty.
Given China’s critical environmental situation, onecould easily imagine catastrophes followed by increas-ing social instability, should nothing be done to breakthe evil circle. A widening inequity gap would also likelyhave negative impact on the economic growth potential,since although environmental problems can contributeto the poor getting poorer—they may not necessarilycontribute to the rich getting richer. To gradually narrowthe gap between the haves and have-nots will requirereforms in Chinese society that go beyond what nor-mally falls under environmental policies. Equity is there-fore an important factor associated with high uncertaintyfor assessing China’s future options.
Certain groups of people, depending on natural con-ditions as well as the social context in which they live,will prove to be more vulnerable to changes in the soci-ety–environment nexus. For example, the threshold thatdetermines when people choose to uproot and seek bet-ter living conditions elsewhere, may depend on condi-

Chapter 3
UNDP48
tions such as availability of water, the local labour mar-ket, and education. The magnitude of groups with pro-nounced vulnerability to the large-scale environmentalthreats that China faces is an important factor when evalu-ating its path into the future.
3.4 Environmental AwarenessPublic awareness of the condition of the environment,and of the social and economic impacts of environmen-tal degradation, has probably been, worldwide, the mostimportant driving force for environmental improvement.A well-informed and articulate population, and a diversi-fied cadre of well-educated environmental experts, areessential conditions for environmental improvements. Itis usually the public, supported by well-informed andarticulate experts, not the government and certainly notbusinesses that have put the environment on the agenda.
Raising Awareness and the Importance of MediaUntil as little as five years ago, public awareness of envi-ronmental issues was very low in all parts of China. Inresponse to the growing environmental challenge, andto some key events such as the 1998 floodings and thecampaign to host the 2008 Olympics, this is changing.This growing public awareness is mostly the result of anincreasingly active media, but is also in part due to theproactive measures of the government. Equally impor-tant is the establishment of a social climate that not onlyallows but also encourages public debate.
China has massive media coverage—more than 300million radios, 250 million television sets, and no lessthan 5,500 different newspapers. These media are takingan increasing interest in the environmental situation.Until recently the focus was on the action being taken tocurb pollution. This seems to be changing, as testifiedby recent news stories on the health impact of pollution,illegal logging, consumption of wildlife, poaching, andthe water crisis.
Realising the watchdog power of the public, the gov-ernment supports raising awareness, and uses this aware-ness to implement regulations. For example, in some prov-inces, an award system has even been set up to encour-age the public’s reporting of infringements. This andother incentives have mobilised more people to look forand report environmental violations.
Environmental Expertise in Short SupplyLed by the slogan “better red than expert”, respect forlearning suffered heavily during the Cultural Revolutionera. Despite changes since 1979, primary education isjust average compared with other populous nations. Theshortage of personnel with understanding of anythingfrom environmental engineering to environmental eco-nomics—particularly necessary in a market economy—is severe.
At the same time a positive trend towards better edu-cation shows that Chinese universities are graduatingincreasing numbers of young professionals with degreesin a wide array of environmental disciplines. The increas-ing international exchange, with considerable numbersof Chinese undergraduate students doing their masteror doctoral degrees at academic institutions around theworld, is also helping to improve the level of Chineseenvironmental expertise, as do the elevated position ofexpert institutions.
Still, the future will witness a deficiency of environ-mental experts in general, and people with a broad un-derstanding for the societal aspects of environmentalproblems in particular.
Health as a Driver for ChangeIn western countries, health concerns lie behind manyenvironmental concerns. When the health impacts ofenvironment degradation are understood and becomecommon knowledge, environment moves from being amarginal to a central concern. When a child’s health is atstake, parents push for change. In general, this requiresspecialised knowledge, information systems and strongco-ordination between the health and environment sec-tors, in governments and in research institutes. In China,knowledge of the impacts on health is limited, and infor-mation is difficult to obtain and analyse. For these rea-sons, health awareness is low, and the potential to usehealth to push for environmental change remains vastlyunder-exploited.
Does Increasing Awareness Have an Impact?Some anecdotal evidence suggests that public aware-ness has already had impact.• A popular saying states that local polluters are not
afraid of government inspections but of media expo-sure.
• The daily air-quality reports, covering 47 cities since1997, have attracted enormous public attention andimposed tremendous pressure on local officials to takemeasures. As a result, air quality has improved in somelocations, and demand for further actions has in-creased.
• A pilot programme in the cities of Zhenjiang and Hohotused the colours black, red, yellow, and green as sim-ple indicators to communicate to the public the pollu-tion-control efforts taken by enterprises. As well asraising public awareness, this provided a feedbackmechanism to government and enterprises, and as aresult, some enterprises now go to the media to makepublic commitments about improving their perform-ance.
One result of increased environmental awareness is thatit spurs people on to protect the environment and theirown health and welfare. Complaints filed by the public

China Human Development Report 49
The Society–Environment Nexus
to local Environmental Protection Bureaus are increas-ing. People are also better organised as is well illustratedby the emerging and nascent environmental NGO move-ment in China (see chapter 4).
Future Trends and UncertaintiesDespite recent advances, some forces limit public pres-sure and its impact on environmental change. First, ingeneral, the public continues to view environmental pro-tection as the government’s responsibility. As long asthis perception persists, awareness may remain low andineffective. Second, the public tends to accept the argu-ment that environmental problems are inevitable sideeffects of economic development and can be cleaned uplater. Even when made aware, the public tend not to de-mand action. Third, although awareness is on the rise,the basic understanding of environmental problems re-mains very low, and so the public may be unable to pushfor appropriate responses. Finally, government officialsin some economic sectors and at local levels, and mostenterprise managers, do not consider public awarenessa constructive force.
Given the strong impact that public awareness has onenvironmental actions, the degree to which the Chinesepopulation becomes better informed and more knowl-edgeable about causes and effects of environmental prob-lems is likely to play a decisive role in the solution of thepresent environmental predicament. Yet, awareness andknowledge will not be enough if the political climate isnot responsive to public pressures, and if no channelsexist for people to voice their views.
3.5 ConsumptionHigh growth rates, along with export promotion and theincrease of domestic consumption are key current strat-egies for maintaining economic growth in China. Con-sumption, in turn, is essential for maintaining employ-ment levels and social stability but can have major im-pacts on the environment. The direction of demands forindustrial products and energy, plastic products, dyes,and electronics, will necessitate an increase in the flowof resources through the economy and exert increasingpressure on the natural resource base. Moreover, aswealth increases, more and more families will demand anincreasingly materialistic way of life.
Consumption is an important mechanism throughwhich the rich, middle class and urban population haveimpacts on the environment. The impacts are indirect,often displaced geographically, and more often than not,it is the poor who suffer a disproportionate share of theburden.
Consumption LevelsIn the past, Chinese people consumed much less thanthe world average for most products, and even today,
per capita consumption remains relatively low. For exam-ple, per capita electric power consumption in 1997 wasless than 1,000 kWh in China, almost 2,500 kWh for theworld, and more than 13,000 kWh in the US. But a grow-ing middle class and spiralling economic growth arechanging things, and the signs are that consumptionwill move along paths similar to North America and Eu-rope. The following figures illustrate how overall con-sumption has grown in China:• The number of private vehicles quadrupled from 1991
to 1997 to now over 20 million, and could reach asmany as 50 million by 2010.
• Between 1980-1998, beef consumption per capita in-creased an estimated 2.3 times, and consumption ofpoultry an estimated 4.8 times (Ma Hengyun, 2000).
Most consumer products are following similar paths.Given the prospect of a certain rise in current low percapita levels of consumption, and a huge homogeneouspopulation, China has the potential to consume signifi-cant amounts of the world’s products in the coming dec-ades.
Consumption PatternsA look at regional consumption suggests that it too willrise in the coming years. On average, urban areas havemore than 10 times as many refrigerators as rural areas.While almost 100 percent of homes in urban Shanghai,Beijing, Tianjin and Guangdong have washing machines,less than 1 in 20 households have this appliance in ruralChongqing, Guangxi, Hainan, Jiangxi, and Tibet (seeAnnex). These figures suggest that owing to urbanisa-tion and increasing economic wealth, consumption maywell increase by orders of magnitude.
Of course, it is possible for consumption to rise with-out a corresponding increase in the negative impacts onthe environment. China, to some extent, has alreadyachieved a significant “de-linking” of environmental im-pact from GDP growth, notably in the energy sector (seesection 3.8 on Energy). The concept of “green consum-erism” has also begun to take hold in China, as reflectedin a growing interest in organic food, energy-saving lightbulbs and household appliances, and biodegradableproducts. Meanwhile, however, counter-forces are alsoin play, as urban consumers require more sophisticatedand complete packaging, and as consumers with increas-ing spare cash purchase more and more non-essentialgoods. Also, whereas recycling in rural areas is high,traditional recycling systems are apt to function less ef-fectively in urban, middle-class areas.
Consumer PressuresThe consumption equation also has another positiveside—consumer pressure for an improved environment.Middle-class consumers pay more attention to what theyconsume, and to its origin. The demand for environmen-

Chapter 3
UNDP50
tally clean products carries every potential to grow inline with awareness, and, as in Europe and North America,may one day become a force for better environmentalpractices.
Nothing suggests that Chinese consumers would beless concerned about the environment than people else-where, or less responsive to making environmentallyfriendly choices. On the contrary, certain cultural andtraditional aspects point to a considerable potential forthe evolution of consumer pressures in China. Thechange from low per capita consumption with a highlevel of reuse and low waste generation did not startuntil the 1980s and took off only in the 1990s. Insofar asChinese society has not yet cemented a high consump-tion pattern, it is possible to implement more resource-efficient development alternatives from scratch. Anotherpositive factor is the importance that Chinese peopleassign to what they eat, and in particular the traditionallink between food and health, which has the potential oftranslating into strong consumer pressures.
For consumer pressures to develop into a real forcefor change, it is essential to provide accurate informa-tion on the environmental impacts of products, so thatconsumers can make informed choices. Ongoing initia-tives to develop green labels for consumer products arediscussed in section 4.3.
Future Trends and UncertaintiesTwo divergent trends are driving consumption in China.The first is a combination of higher per capita levels ofconsumption, consumption patterns with more wear-and-waste mentality, and an increase in consumer products.The second shows up in an increasing attention to whatone consumes and heightened awareness of the envi-ronmental impacts. At present, the first trend far outpacesthe second, and the environmental impacts from increas-ing consumption are potentially at a similar level of im-portance as is the growing population pressure. Never-theless, a clear opportunity beckons to change tracks tomore resource-efficient consumption, although thischange would demand an active intervention by gov-ernment to set rules that would promote the evolution ofa market for green products.
3.6 Technological DevelopmentThe development and deployment of new technologies,and an assessment of their appropriateness to Chinaand the Chinese ecosystems, will be major factors in thesustainability of China’s development. Technology de-velopment is assumed, overall, to be a positive force.New and improved technologies are more efficient, con-sume fewer resources, and produce fewer emissions perunit of output. At the same time, however, new tech-nologies also facilitate economic growth and access to
new areas, such as the fragile ecosystems of westernChina. Also, new technologies may bring with them en-tirely new environmental challenges, with unknown orunproven consequences.
Hard or Soft TechnologyIt is not only hard technology that will drive China’seconomy and environment. Soft technology is equallyimportant. For example, urban planning is a form of softtechnology that has evolved rapidly in past years. AsChina develops new towns, great potential exists for tech-nological leapfrogging. China is already experimentingwith new forms of urban planning, such as wide-scalegreening campaigns in Beijing, and, notably, through itsnational small-town development pilot programme. Thiskind of technology, at little cost, can help ensure thatfuture cities in China resemble Sydney, not Bangkok.
China’s Technological FutureChina continues to depend on imports to a large extentfor high technology and for technological upgrades.Over the past two decades, China has emphasised sci-entific development as a driver for positive change. Thisstrategy will continue particularly in the areas of agricul-ture, grain, population, health, energy, environment andefficiency, although China invests only 0.6 percent ofGDP in research and development (R&D), compared with2-3 percent in the US, Japan, and European Union coun-tries.
Questions also hang over the quality of Chinese R&D.Approximately 70 percent of R&D spending comes fromgovernment, whereas in the US, Japan and Germany, in-dustry is responsible for over 70 percent (SSTC, 1994,1995). Assuming that industry is commercially orientedand thus more likely to develop technologies that havecommercial applications, there is a danger that ChineseR&D will not lead to the development of applicable tech-nologies. The more China can shape its own technologi-cal future, the more the technology will be appropriate toChinese conditions and the less expensive it will be toupgrade.
In a market-oriented economy, government interven-tion to push and pull technology development is essen-tial. China is already taking steps in this direction. Forexample, it has developed safety labels for electrical ap-pliances, established environmental standards, and pro-vided extensive government investment in experimenta-tion and commercialisation of renewable energies.
Human resources and capacity development offeranother domain in which government can intervene, andChinese leaders are increasingly interested in foreignco-operation, particularly in ensuring capacity related tosoft technologies. In preparation for the World Summiton Sustainable Development in Johannesburg in Au-gust/September 2002, the State Development Planning

China Human Development Report 51
The Society–Environment Nexus
Commission has launched a programme to send a largernumber of central and provincial level planners on inter-national study tours to learn about sustainable develop-ment practices abroad.
Areas of Critical Future Technology DevelopmentEnergy technology is a crucial area, and some futuredevelopments of relevance to China are discussed insection 3.8. Renewable energy technologies comprisean area in which China could well become a world leader,and given its extensive renewable resources, thepaybacks could be considerable. Chinese governmentand enterprises have the financial capacity to invest indeveloping and commercialising these technologies. If,over the next century, renewable sources become thedominant energy-generation technologies, Chinese en-terprises could well belong to the world’s leading en-ergy companies by the middle of this century.
Information technology will drive economic and tech-nology development in all sectors. China is well placedto take full advantage of this, as well as the sustainabledevelopment opportunities that are associated with in-formation technology.
Biotechnology is a controversial area, with advocatessaying it can increase food productivity thereby reduc-ing pressure on land resources, and opponents saying itis the porter of future calamities. Either way, China isagain well advanced in this area.
Environmental technologies will be decisive. Owingto limited production capacity at present, China importsexpensive technology, often not fully appropriate toChinese conditions. For example, China imports expen-sive SO2 removal systems, which are more efficient thanChina can afford and do not function well with Chineseboilers. With appropriate incentives, this nascent indus-try could develop substantially, producing technologythat prevents pollution, and employs large numbers ofpeople.
Future Trends and UncertaintiesTechnology is crucial to China’s pursuit of sustainabledevelopment. Still, technology is not an end in itself, nordoes it develop and thrive in a vacuum. China is wellpositioned in various technology areas, and has a longerway to go in others. What is most important as a driverfor development of sustainable technologies, however,is the establishment of an environment in which tech-nology development can prosper. With regard to envi-ronmental technologies, the key is to create a demandfor them by putting a price on environment and internal-ising environmental costs in production.
Other technologies where China has already a goodstart will have to rely initially on availability of govern-mental and/or private R&D financing and increasinglyalso on risk capital. Here China’s failure to come close to
matching the spending in developed countries is obvi-ous, which bodes poorly for the future.
Another important but wholly uncertain factor is theability of China to reduce the “brain-drain” and to attractwell-educated people from around the world to take partin technology development for China’s benefit. Chinahas a record of significant loss of talented experts, whichhowever, is beginning to show signs of decline as Chi-nese intellectuals more often than before, return homeafter completing their higher education abroad.
3.7 Water as a Social GoodShortage of good-quality water is undoubtedly one ofChina’s most serious problems. Basic facts with regardto water quality and quantity have been presented inchapter 2. On top of the direct environmental impacts ofwater scarcity and pollution, there are potentially seri-ous societal consequences of China’s water problemssuch as user conflicts, constrained economic develop-ment, and migration. In short, societal water-related prob-lems are contributing increasingly to political and socialinstability.
The seriousness of the problem is recognised at thehighest level. Premier Zhu Rongji has warned of “seri-ous limitations” if China neglects its water resources.Vice-Premier Wen Jiabao emphasised that “China has towork hard to deal with its insufficiency of water resources,worsening water pollution, and threats of floods anddrought.” This awareness is relatively new. Until recently,all China’s water policy focused on increasing supplyand getting more water to more users. There was nosense that water could become seriously polluted or tapsrun dry. Unfortunately this new awareness is limited tosome levels and sectors of government and is only nowbeing translated into action.
Water-related ConflictConflict over water is not new to China. The control ofwater resources and their allocation has been a centralpower issue throughout history, with numerous accountsof how droughts, caused by a combination of low pre-cipitation and failure to maintain collective waterworks,have led to open conflict, even armed uprisings. Giventhe critical northern situation, particularly in the Haiheriver basin, where almost 100 million people live on amere 300 cubic metres per capita annually, it is remark-able how well Chinese society has managed to cope withan increasing water stress without major overt water-related conflicts occurring. By the same token, however,water scarcity is decidedly a major destabilising factorfor future prosperous development, particularly in north-ern China.
China’s major water conflicts run along three lines:

Chapter 3
UNDP52
• upstream–downstream, especially in China’s northand northeast
• north–south• between different users, particularly thirsty Chinese
agriculture and polluting industry/urban areas
Upstream-DownstreamThe upstream-downstream conflict is a direct conse-quence of declining flows along most Chinese rivers andattendant pressures from mounting population and agri-cultural practices that require more and more irrigation(see box 3.4). This growing upstream–downstream con-flict reflects part of the larger development tension be-tween coastal China and its interior. In the rapid eco-nomic development process, the coastal areas have hadthe advantage of a favourable geographical location, theproximity to the sea providing a sink for waste products,while sufficient amounts of reasonably clean water camedown from less developed, and thus less polluting, up-stream areas. With the drive to develop China’s interior,upstream areas withdraw more water and discharge morepollutants, thereby threatening basic water supplies incoastal areas. The risk of conflict escalates, with poten-
tially far-reaching consequences for economic develop-ment and political stability both in coastal and inlandareas.
North-SouthThe north- south conflict falls back on China’s southernhalf having abundant water supplies, whereas the northsuffers from water scarcity. Until now, the north has man-aged to achieve rapid economic development by over-taxing groundwater supplies. In order to meet future de-mands in the north, transfer of large amounts of waterfrom the Yangtze River basin to the Yellow River and upto the North China Plains is under serious considera-tion. Plans exist to redirect more than 100 km3 of waterper year from the Yangtze basin, or roughly speaking 10percent of the total flow of the river. Let alone the directconsequences for people living in the Yangtze River val-ley, including a variety of possible ecological distur-bances, or the waste of water due to evaporation in thetransferring process, the project involves large-scale,complicated engineering, and the construction costs willdivert large amounts of financing thereby diverting pub-lic finances from other important undertakings.
Box 3.4 Water Conflict Along the Yellow River
Upstream–downstream conflict is well illustrated by the Yellow River, which currently runs dry, not reaching the sea forabout half the year.
For centuries, farmers on fertile land in Shandong province have benefited from the Yellow River’s nutrient rich water,which due to the elevation of the riverbed more than ten meters above the farmland level, has been an excellent sourceof irrigation. Recently, with the lower stretches of the Yellow River running dry for longer and longer periods, theShandong farmers have to rely increasingly on local precipitation for agriculture, resulting in lower yields.
At the same time, further upstream, along the middle stretches of the Yellow River, large-scale irrigation schemes havebeen extended over the past two decades, the purpose being to provide sufficient irrigation to areas that would normallybe too dry even for traditional rain-fed agriculture. One example, a large irrigation scheme on the Hetao plains in InnerMongolia supplies almost 6,000 km2 of farmland with irrigation, without which only marginal farming would have beenpossible. The Hetao irrigation scheme withdraws 5 km3 of water each year from the Yellow Riversometimes swallow-ing half of the riverwater that would otherwise have been available to Shandong farmers.

China Human Development Report 53
The Society–Environment Nexus
Agriculture-IndustryThe conflict between agricultural and industrial usesis visible all over China, with agriculture being threat-ened by industrial and municipal pollution, and indus-trial activities being constrained by lack of a secure wa-ter supply, since agriculture takes the lion’s share. Thisconflict is sharpening, and may lead to large areas beingunsuitable for agriculture and/or industrial activities, withfar-reaching economic and political consequences.
Increasing Vulnerability to Water ScarcityThe interrelated processes of declining water sources,intensified water pollution, and degraded ecological con-ditions mean that increasing numbers of people are be-coming more vulnerable to water scarcity. Already a sub-stantial group of “water refugees” are among the over100 million migrant labour force—people who have losttheir basic livelihoods as a result of continuous droughtand environmental degradation. Most of the people inthis group come from marginal lands in dry, fragile eco-systems. Although this group is bound to increase, itsnumbers are limited.
As water shortages intensify, they may affect largergroups of people. One such group is the water-intensivefarmers in the lower reaches of the northern rivers. Ifwater for irrigation runs out or becomes too polluted tosupport farming, they may have to move on in search ofother livelihoods in other places. An even larger groupof people is the urban population in coastal areas. Cur-rently, they receive water from upstream areas, but, asmore water is diverted for upstream development pur-poses, basic conditions in these urban areas will changeand large groups of urban people may lose their liveli-hoods.
At the societal level, shortage of good quality wateraffects industrial and agricultural production acrossChina and limits the options for urban as well as ruraldevelopment. Many cities, including important centressuch as Beijing and Shanghai, claim lack of water to be asignificant factor restricting economic growth.
Drivers of Water UseThree factors make up the main drivers of inefficient wateruse in China: artificially low water prices, a formidablewater management bureaucracy, and agricultural self-sufficiency policies.
Artificially Low Water PricesA typical water price in northern China as of 1998 was0.031 yuan per cubic metre, or the equivalent of 0.3 UScents, which covers about one-tenth of the actual costto supply the water. As a consequence, little or no in-centive exists for users to save on water by investing inwater-efficient technologies and no driving forces callfor a market that will develop water-saving appliances or
commercial recycling of water. There is even less eco-nomic support for a much needed structural adjustmentin the direction of water-efficient agricultural and indus-trial production.
This explains the paradox that one of the world’s mostwater-scarce areas shows such low water efficiency. Irri-gation in many regions wastes two-thirds of the pre-cious water in the process, for example by sprinklingwater during hot summer days, not an uncommon sighton the North China Plains. Drip irrigation, invented inChina thousands of years ago, is applied to a mere one-tenth of a percent of Chinese farmland, compared to Is-rael where half of the farmland is supplied with water-efficient irrigation. The industrial situation is the same,with Chinese industry using up to ten times the amountthat Western factories allocate for similar activities.
The Multi-headed Water DragonThe water sector is managed by many conflicting agen-cies—resulting in a multi-headed water dragon. Water ismanaged by the Ministry of Water Resources and bylocal governments. Pollution falls under SEPA, and soilerosion under the Ministry of Agriculture and the StateForest Administration. The State Power Company andregional authorities share the administration ofhydropower stations. Blurred division of responsibili-ties results in fighting over control of water managementand conservation. The legal framework is equally filledwith loopholes and contradictions. The existing laws andregulations fail to tackle effectively ecological destruc-tion and aging and out-of-date water conservation works.The Water Law, promulgated in 1988, is skewed towardsagricultural water use.
River basin commissions have been established forlarge drainage areas, but as yet, they enjoy limited coor-dinating power, especially over provincial governors.Distribution of water resources in river basins that spanseveral provinces is solved through negotiation of pro-vincial quotas, but upstream provinces are allegedly with-drawing more than their allotment, leaving downstreamusers without water. The river authorities have no pow-ers to act against violators, and so upstream users con-tinue to take as much as they can afford, the only limitbeing the cost for pumps and piping.
Agricultural Self-Sufficiency PoliciesChina’s agricultural policies since 1949 have developedand cemented an agricultural production system that isfar more water intensive than what is sustainable evenfor the short- or medium-term future. Since the 1990s, theChinese government has been increasingly concernedwith grain production not keeping pace with demand, asfarmers have turned to more profitable agricultural pro-duction such as fruits and vegetables. The “grain bag”policy of the 1990s, which aimed at regaining govern-

Chapter 3
UNDP54
ment command and control over a boost in grain pro-duction, has put further pressure on already over-uti-lised water sources (see section 3.10 Agriculture andFood Production).
Reform of Water Policy and ManagementAlthough the scale and combination of water problemsin China may seem uniquely incompatible, alternativesand management solutions to many of the conflicts andchallenges do exist, although hard choices are inevita-ble. As the preceding paragraphs have illustrated, thepresent pricing and institutional framework and existingprocesses for long-term and large-scale planning havenot been conducive to mitigating the water challenge.Consequently, these are areas in which one might seekthe basis for a solution.The need for more efficient water management as well asthe country’s WTO accession should provide impetusfor China to look for foreign investment and firms toparticipate in dealing with its water challenges. This is adramatic departure from the past when such sensitivesectors were closed to outside participation. Already,foreign firms are active in building water supply and sani-tation utilities in China—one European water firm hasbuilt 106 waterworks in China in the last two decades
of by irrigated acreage, as is the prevailing practice,water consumption might fall considerably.
• Extending powers to river basin authorities to man-age conflicts and to manage existing water resourceswithin the given amount of renewable water in eachriver basin, and developing capacity to do this in aparticipatory manner.
• Corporatising or privatising water supply and distri-bution, initially in city areas can lead to efficiencyimprovements. However, existing institutional weak-nesses, and low prices, provide a disincentive to pri-vate-sector investments in what could be a very prof-itable sector of the economy.
• Providing incentives for agriculture to develop in awater-efficient way based on local conditions, whileindustrial development should benefit from recent ad-vances in clean and efficient production techniques.
• Introduction of ecological sanitation solutions in or-der to save water, prevent water pollution, improvehuman health and recycle nutrients is a particularlypromising area of growth.
So, the direction is set, but the social changes that mayride the wake of these reforms are as far-reaching as theyare hard to imagine. With water inefficient agriculturebeing at the core of the problem, any realistic attempt toimprove the situation will have to fundamentally changethe conditions for Chinese agriculture, and with that, theentire foundation of rural China. In a sense, the dilemmaof subsidised water for the Chinese agricultural sector issimilar to that of subsidised financing to keep alive theheavy state-owned industry sector. How to then phaseout the subsidies without causing social unrest?
The WTO entry is another wild card in making as-sumptions about China’s water future, most of it relatedto the agricultural changes, as Chinese grain farmers,particularly in the north, will have a hard time competingwith grain farmers in countries with better grain-produc-ing conditions, such as abundant water supply. CouldChinese agriculture find overseas markets for more la-bour-intensive but water-efficient crops?
Yet another critical future uncertainty surrounds pos-sible impacts of climate change. Marginally lower pre-cipitation in northern China could jeopardise the liveli-hoods of millions of people, whereas increasing variabil-ity of rainfall would put larger population groups at riskof both drought and flooding. Calculations from the MaxPlanck Institute indicate that the 50-year peaks of todaycould become as common as five-year peaks by 2050,which means one flooding at the 1998 magnitude everyfive years.
In conclusion, there are no easy fixes to solve China’swater situation. Business-as-usual would lead to increas-ing conflicts, which could well lead to overt conflict andcentrifugal effects. At the same time the reforms needed
Box 3.5 Water Prices, Changes Afoot
A successful story in Hunan and Hubei provinces sig-nals some hope. In 1993, some farmers were groupedinto water-supply companies and water-user associa-tions called self-financing irrigation and drainage dis-tricts. Run by farmers elected by secret ballot, thesegroups made it easier to establish prices for water. Thereality shows that when farmers pay by volume, theywaste less. There is an immediate 20 percent drop inwater use on average. Many cities have adopted feecharge systems, and urban residents now have to paynot only for use of water, but increasingly also for sew-age discharge. Levels of charges vary among differentcities.
and directly manages ten of them. Foreign companiesoperate almost 50 water utilities now in China.
Future Trends and UncertaintiesAlthough politically difficult to implement, the solutionsto many of China’s water problems are known, and Chinais already experimenting with them. These include:• Full pricing of water, including environmental exter-
nalities, will greatly reduce water wastage, water use,and water pollution. Experience from northern Chinashows that if farmers were charged by volume instead

China Human Development Report 55
The Society–Environment Nexus
to solve the water problems will inevitably cause othersocial problems.
3.8 EnergyEnergy use is set to increase up to six-fold by 2050, andenergy-related environmental stress could increase like-wise. A key challenge is how to provide essential en-ergy services without incurring unacceptable damage tohuman health and the environment.
Energy and the Environment in ChinaUntil the 1980s, energy policy in China focused on pro-duction, mainly of coal, oil, and electricity. Once produc-tion was relatively assured, policy turned towards effi-ciency and power generation. Other important objectivesof energy policy include ensuring equitable access toelectricity, and facilitating strategic foreign investmentand trade in energy commodities. Environmental protec-tion policies are increasingly integrated with energy poli-cies.
China has access to all the energy resources knownto humanity, including fossil fuels (coal, oil and gas),biomass (wood, straw and other agricultural by-prod-ucts), other renewable sources (hydropower, wind, solarand geothermal), and nuclear power. Energy distributionacross China is not homogeneous, however. For exam-ple, coal is concentrated to the northwest, andhydropower resources to the southwest. Wind and so-lar energy sources are often found in remote areas.
All methods of producing energy in China have animpact on the environment. Notably, burning fossil fuelsleads to emissions of SO2, NOX, CO2, hydrocarbons, andother pollutants, causing localised, national, and globalair pollution. In China, as in many countries, fossil fuelenergy is one of the main environmental stress factors.Even renewable energy resources can have serious im-pacts; large-scale hydropower plants require dams, dis-turbing hydrological flows and destroying terrestrial andaquatic ecosystems. Other renewable sources also causeenvironmental challenges, although these are generallyconsidered to be localised and small in scale.
The Scale of China’s Energy SectorChina is the world’s second largest consumer of energy,using about one-third the amount the US does (BP, 2001;CDIAC, 2001). It is the world’s largest producer and con-sumer of coal, although China’s production has fallenslightly, and probably temporarily, behind the US since1998. China is second only to India in its consumption ofbiomass fuels (China Energy Group, 2001). The energyintensity of China’s economy has been and remains highby international standards. Although between 1980 and1994, the amount of energy needed to produce 1 USD of
GDP in China was reduced by more that 50 percent, thiswas still double that of India, and four times that of in-dustrialised countries (UNDP, 1998b).
At the same time, per capita energy use in China islow by international standards, equivalent to only halfthe world average, and only 10 percent of the per capitaenergy use in the US (China Energy Group, 2001). Hence,although energy use has fallen somewhat since the mid-1990s following a continuous increase since the late 1970s(figure 3.2), a variety of reasons, including slower eco-nomic growth and widespread factory closures, render itlikely that China’s appetite for energy will keep growing,and the country may displace the US as the world’snumber one energy user by the middle of this century(Sinton and Fridley, 2001). Recent long-term scenariosproject that energy use by 2050 may be 1.5 times or evendouble current US levels (Zhou and Zhou, 1999), whichis 5-6 times the present consumption figures!
Where Does the Energy Come From?
CoalCoal accounts for the majority of China’s energy, anddespite vigorous efforts to develop other sources, mostof the growth in energy supply can come only from coal(figure 3.3). Twenty years ago, most coal in China wasused directly by consumers and in industrial applica-
MT
CE
tions, residential boilers, locomotives, and householdstoves. Today, only a third is used directly, with the restused largely for electrical power generation. As peoplemove from traditional housing into newer centrally heatedapartment buildings, for example, gas stoves and waterheaters replace small coal stoves. This trend has posi-tive consequences for human health, since it relocatesthe products of fuel combustion away from the kitchensand living rooms where people spend much of their time.
Figure 3.2 Energy Use in China 1978-1998 (ERI, SDPC)
500
600
700
800
900
1000
1100
1200
1300
1400
1978 1985 1987 1989 1991 1993 1995 1997

Chapter 3
UNDP56
Clean coal technologies, ranging from improved fuelquality to more efficient conversion and end-use equip-ment, and better control of particulates and other pollut-ants—e.g. desulphurisation and advanced boiler tech-nologies—should also reduce impacts where coal con-tinues to be burned. Transformation of the coal industryis key, since the very small mines that account for a large
OilOil production has stagnated in China since 1990. Mean-while, demand continues to grow, particularly for trans-port fuels, and for fuel oils for industry and power gen-erators in southern China. Hence, by 1999, China’s netoil imports were one-fifth of the total oil consumed (NBS,2000), and China is set to rapidly become a major oilimporter. In spite of current high oil prices, the prospectsfor strong growth in oil-hungry sectors like transportand petrochemicals suggest that net imports should ac-count for half of the total consumption before 2010.
BiomassBiomass remains a significant source of energy for muchof China’s rural population, and the total amount used isapproximately equivalent to the total national oil con-sumption. Unlike oil, however, biomass use has beendropping since the 1980s, as greater supplies of coal andelectricity have become available to rural residents. Be-tween 1991 and 1996, the ratio of biomass energy use tocommercial energy use in rural areas fell from 0.26 to 0.15(SSB, 1998). Biogas use has been rising, but it still ac-counts for less than one percent of biomass energy. Useof biomass fuels for household cooking and heating isassociated with a variety of ills, from high levels of pol-lution exposure for women and children, to excess har-vesting of marginal biomass resources. Switching to coaloften trades one set of problems for another since, forexample, exposure to the products of coal combustioncan be extremely harmful, and the toll on coal miners isheavy.
Renewable SourcesOther renewable energy sources are available in mostareas of China. More than most developing countries,China has made significant and relatively successful ef-forts to promote renewable energy use, particularly asan adjunct to the overall programmes for rural develop-ment and electrification. One-quarter of China’s energyis presently supplied by renewable sources, includingelectricity from large hydropower projects, direct use ofbiomass fuels and solar heating of water and buildings(RTCCCCS, 1999). Although renewable sources are un-likely to substitute for coal and other fossil fuels on alarge scale, there is hope that over the next 20 years theywill break out of niche markets and represent a growingshare of total energy, This, however, requires continuedsupport for the development of renewable energy mar-kets and industries.
Energy EfficiencyEnergy efficiency improvements are equivalent to install-ing new energy production units. Technological improve-
fraction of current total output, produce low-quality,highly polluting coals. Substituting cleaner coals fromlarge mines will require substantial changes in marketand regulatory institutions as well as in transport infra-structure. Unavoidably, however, the reliance on coalwill contribute to increase carbon dioxide emissions.
Natural GasNatural gas is considered the fuel of choice for replacingcoal in boilers, power plants, and other applications be-cause it is so much cleaner and more efficient. Naturalgas has long accounted for only about 2 percent of thetotal energy supply, and until recently, received little at-tention in China. Most was used to produce fertilisers,but China has now made expansion of natural gas sup-plies a major strategic goal, and is planning to exploitdomestic onshore and offshore resources, as well as toimport large quantities via pipeline and LNG terminals.
Current plans call for raising natural gas use from thecurrent level of about 25 billion cubic meters (bcm) peryear to 200 bcm by 2020 (NBS, 2000). Although this wouldconstitute only 6 percent of projected energy use in 2020,if it were directed to the household sector, the benefitsto human well-being could be substantial. Future sup-plies of natural gas, especially to households, will de-pend on numerous uncertain factors: economic compe-tition with other fuels and sectors, availability of tech-nology and financing to develop the necessary gas in-frastructure—pipelines, terminals, and distribution sys-tems—and stable political relations with nearby gas-richnations.
coal70,7%
oil22,7%
natural gas3,2%
hydropower3,4%
Figure 3.3 Structure of primary energy use by energysources 1998 (ERI, SDPC)

China Human Development Report 57
The Society–Environment Nexus
ments and changes in sectoral structure, driven by tar-geted policies as well as economic growth and transfor-mation, have improved the efficiency of energy use innearly every application, from biomass and coal stovesto giant furnaces. Since the early 1980s, China has insti-tuted laws, regulations and standards, created new ad-ministrative structures, formed new channels of invest-ment, and established a nationwide network of technicalassistance centres, all aimed at promoting energy effi-ciency. Investments in energy efficiency have consist-ently been equivalent to 5 to 10 percent of investment inenergy supply, an impressive record even among devel-oped nations (China Energy Group, 2001). Energy effi-ciency policies could reduce future energy use by asmuch as one-third by 2020 (Joint Study Team, 1996).
Forces Driving Changes in Energy Supply and UseChina’s rate of growth, integration into global markets,technological change, and transformation of institutionsof economic and political governance should continueto be chief factors shaping the national energy system.Some of the major themes directly impacting on energyand human development are pointed out below.
Economic RestructuringThe economic restructuring has been a major force forchange over the past two decades, and continues to beso. It has profoundly altered the economics and incen-tives of energy markets. Hidden and direct subsidieshave been reduced or removed, competition introduced,price controls lifted, and soft budget constraints hard-ened. At the same time that more forms of energy havebecome more widely available, users have become moresensitive to the economic consequences of using them.Rising energy prices relative to the prices of other goodshave helped promote efficiency. Reforms in enterprisemanagement, permitting failing enterprises to go bank-rupt, have helped weed out some of the most inefficientones, and allowed successful ones to grow larger andattain greater economies and efficiencies of scale.
UrbanisationChina’s rural energy economy differs greatly from itsurban economy. The rural economy is dependent onbiomass and direct coal burning while the urban economyrelies on grid electricity. Rural and urban differences inenergy use are prominent.
Rural residents consume less than 40 percent of thecommercial energy used by their urban counterparts (SSB,1998). However, if biomass is included, the average per-son in the countryside uses nearly one-third more en-ergy than a city dweller. But much of this is lost in theinefficient and often highly polluting combustion ofbiomass and coal for cooking, heating, and other basic
needs, which takes a particularly heavy toll on womenas fuel collectors and consumers.
As part of its integrated rural development efforts,China has already taken major strides in expanding ruralelectricity grids to reach over 96 percent of rural house-holds and in developing mini-hydroelectric facilities,biogas technologies, cleaner and more efficient stoves,and wood-fuel plantations (Deng, 1995; China ElectricPower Yearbook, 1999).
The proliferation of small coal mines across China—despite the recent campaign that has ostensibly closedseveral tens of thousands of them—has given rural in-dustry and households access to unprecedented sup-plies of energy—and exposed suppliers, users, and theenvironment to all of the consequences associated withobtaining, distributing and using coal.
Urbanisation is likely to accelerate the demand forenergy; biomass and direct use of coal will fall to bereplaced by gas and central heating, while new electric-ity uses will rise. Burgeoning power demand for homesand commerce will keep the pressure on to build moreand larger power plants, so that impacts will be deter-mined by how that need for power will be met.
Technological DevelopmentA consistent theme expressed by China’s top decisionmakers in recent years, to support continued and sus-tainable economic development, has been the call fortechnological development. Among China’s prioritieswithin the energy sector are:• improved fossil fuel recovery technologies, includ-
ing advanced oil extraction and deep-water naturalgas recovery techniques;
• cleaner and more efficient ways of generating elec-tricity with coal, such as large circulating fluidised-bed boilers and integrated gasification combined-cy-cle plants;
• new and renewable energy technologies, for examplefuel cells, improved batteries, large wind turbines, solarthermal and photovoltaic technologies, and technolo-gies for using medium-temperature geothermal re-sources; and
• a wide range of energy-efficient technologies, includ-ing motors, lights, industrial process equipment, ap-pliances, stoves, and motor vehicles.
Developing and deploying new technologies is a com-plex business, and acquiring technologies and makingthem available takes money and time.
Government Capacity and Policy-MakingGovernment capacity to drive sustainable energy devel-opment is crucial given energy’s central role in societyand its need to be centrally co-ordinated. As in mostcountries, China’s energy production agencies have tra-

Chapter 3
UNDP58
ditionally been strong and well staffed. In contrast, thoseresponsible for energy conservation and environmentalprotection are weak and capacity is low. There has beensome change recently, in part due to public pressure foran improved environment, but also due to foreign in-volvement.
The Chinese government’s ability to develop policiesthat muster both to support a gradual improvement ofexisting energy systems, and at the same time to pro-mote renewable energy will be crucial in shaping theenergy sector in general and in new power plants in par-ticular. While China has encountered problems in imple-menting environmental laws and regulations, it has al-ready been largely successful in controlling emissionsof some energy-related air pollutants, especiallyparticulate matter from large facilities.
Policies that are currently being put into place couldhave large effects on the health and environmental im-pacts of energy use. For example, the two legislativelymandated “sulphur dioxide control zones”, establishedto control acid precipitation in the southern zone andsulphur dioxide pollution in the northern zone, are help-ing to create markets for lower-sulphur coal, flue-gasdesulphurisation equipment, and more efficient, lesspolluting production technologies. Pilot programmeshave introduced sulphur dioxide emissions fees, which,while currently set too low to have a significant impact,may in future be an important tool in encouraging tech-nological change. Prospective technology-forcing poli-cies directly in the energy arena may also have an impacton energy structure, e.g., the Renewable Portfolio Stand-ard now being considered.
Future Trends and UncertaintiesChina’s per capita energy use is low by internationalstandards, and with further economic development asthe main driver, energy consumption may increase fiveto six times by the middle of the century. This would addconsiderably to global CO2 emissions, cause seriousdeterioration of already inferior urban and rural air qual-ity in China, and accelerate acidification should energycontinue to be generated in the same way as today.
But considerable efficiency gains are yet untapped.Although China has reduced the energy needed to pro-duce 1 USD of GDP by more than half since the reformsset off, energy efficiency is still only one-quarter theperformance of industrialised countries. Therefore, en-ergy generation need only increase by half in order tosatisfy a six times higher demand by mid-century shouldChina manage to reach the energy efficiency standardsof industrialised countries.
When it comes to the way energy is generated thereis also considerable room for improvements. Althoughcoal is in ample supply and the cheapest and most ac-
cessible source of domestic energy, China has access toa wide selection of energy, with considerable potentialfor renewables, not least in the more than half of thecountry that is included in the Great Western Develop-ment Strategy. Still the main addition in power genera-tion comes from coal, but other alternatives are availableat least to cover some of the demands for power. With amajor breakthrough in technology improvements, solarenergy, for example, could prove accessible on a largescale.
So, although the future prospects do not look all toogloomy, there are major uncertainties in terms of the de-mands for more energy. This depends largely on eco-nomic growth and improved energy efficiency, a matterof both governance and knowledge, but also the shareof renewables in the energy mix. Technology improve-ments could provide a major breakthrough, but requireaccess to appropriate knowledge.
The crucial point is the government capacity to pro-mote sustainable energy development. With economicrestructuring a major force for change, and environmen-tal protection policies increasingly integrated with en-ergy policies, momentum is increasing to improve en-ergy efficiency and promote renewable sources of en-ergy.
3.9 TransportationTransport activity has surged in the last 10 years. Dur-ing the 1990s, the transport sector’s share of energy usenearly doubled. Oil is expected to be the fastest growingform of primary energy used in China, propelled by thissurge in transport.
Modernisation and Changing TransportationPatternsBefore Deng Xiaoping’s reforms took off around 1980,China had pursued a development model based on localself-sufficiency, with strict regulation on travel, let alonerelocation. With little pressure for transportation, thenetworks were weak with a small number of road vehi-cles, all belonging to enterprises or other work units, arailway with capacity and accessibility similar to late 19th
century US, and a few air connections between Beijingand the provincial capitals, mostly operated with out-dated Soviet airplanes. In the urban setting, walking wasa dominant mode of transport, with buses hopelesslyovercrowded, and bicycles being treasured objects forfamilies to save up for. The remarkable economic growthof the past 20 years had not been possible if transporta-tion had not been given top priority.
Now, ever-growing numbers of mainly urban familiesare able to afford private motor vehicles and motorcy-cles. Where once trains and ships were the main ways ofmoving people and goods from place to place, long-dis-

China Human Development Report 59
The Society–Environment Nexus
tance buses and trucks are starting to become the domi-nant mode. More people are travelling further; passen-ger turnover for all transport modes rose about seventimes as fast as population during the 1990s.
With growing demand for speed and comfort, air travelhas become commonplace, with regional carriers com-peting for passengers. New high-speed rail lines are be-ing built; one has already been completed running fromBeijing to Guangzhou, and Shanghai has even commis-sioned a mag-lev train to run from downtown to the air-port.
The gradual improvement in the nation’s transportinfrastructure means that it is now much easier to movegoods around, fulfilling one of the necessary conditionsfor truly national markets. Although strong local protec-tionism still presents obstacles to free trade, real poten-tial now exists for achieving economies of scale in pro-duction and distribution of agricultural, industrial andconsumer goods, which would give more people accessto a wider variety of cheaper, higher-quality productsand services.
Mobility as a Development ForceImproved transportation of people and goods was cru-cial for maintaining China’s economic development overthe past two decades. It will play a key role in China’sfuture development process as well.
The increased ability to travel has been one of thefactors behind the greater mobility of people seekingemployment. The buses and trains pouring into citiesare filled with people from the countryside looking forwork, providing the low-cost labour that has helped fuelthe economic expansion of recent years, swelling urbanpopulations, and providing remittances back to the coun-tryside, where incomes have fallen further and furtherbehind those in the cities. The urbanisation and migra-tion patterns described in section 3.1 would not be pos-sible without this improved transportation system. Al-ternatively, economic reform and relaxed restrictions ontravel have fed migration, which in turn has created astrong demand for transport.
Similarly, the way transportation systems develop willbe a key factor in whether or not the Great Western De-velopment Strategy achieves its aim of environmentalsustainability. The western environment is fragile, andlarge transportation projects such as gas pipelines, rail-ways and roads could have a direct, negative impact onthe environment. Transport infrastructure will also pro-mote and facilitate new economic activities in the west,and the question remains to what extent the new meansof transportation will favour low polluting, low resourceuse activities, or high polluting, high extraction activi-ties.
The Environmental Consequences of IncreasingTransport VolumesThe explosion of transport activity has not come with-out cost, however. With the rapid motorisation of theChinese transport system, vehicles are superseding coalburning as the main source of air pollution in many ar-eas. Section 2.4 provides further information on air pol-lution trends. But transportation has other effects onthe sustainability of the development process. With newtransportation networks come indirect impacts such asadded penetration of fragile ecosystems.
And yet another aspect, particularly in the urban set-ting, is space. In the past, pedestrians, bicycles, cartsdrawn by animals, and a few buses filled the streets ofChina’s cities. Now traffic congestion has become a factof life, which reduces transport efficiency and increasespollution discharges per travelled kilometre dramatically.It also causes other problems such as maddening noisepollution, or the increasing numbers of cars that occupynot only streets but also bicycle lanes and paved areas.
The Road AheadThe outlook for transport is tied to expectations abouteconomic development. With continued strong growth,cars and trucks appear poised to carry China into thefuture. As people get wealthier, ownership of privatecars—the new middle-class status symbol—is likely torise tremendously, particularly in the mega-cities.
Greater overall demand for goods and services willkeep pushing both rail and road freight volumes up. Withlittle alternative to the internal combustion engine avail-able in the near future, gasoline and diesel will probablyfuel most vehicles.
Introduction of more efficient engines, other technolo-gies and better emissions controls, along with com-pressed natural gas- and liquefied petroleum gas-fuelledvehicles and, potentially, fuel cell vehicles, could be ap-plied to avoid the worst impacts that have befallen othercountries that have relied heavily on motor vehicles. Buttechnology solutions will not last long without under-growth of skilled mechanics and quality repair shops,both in short supply today.
The scale of environmental impacts from further mo-torisation will, however, depend largely on such aspectsas improved inspection, better traffic flow management,and, above all, urban planning that has as one goal, thereduction of dependence on motor vehicles.
Lack of Alternative VisionsChinese decision-makers appear surprisingly indifferentto alternatives to motor vehicles. One explanation maybe found in the fascination for cars as symbols of mod-ernisation, and a belief that increasing demand for pri-
Chapter 3
UNDP60
vate cars would drive the development of a domestic carindustry. Throughout the reform period, different prod-ucts have successfully been targeted as suitable familyinvestments with the goal to drive domestic demand.Examples include bicycles and sewing machines in themid-1980s, over to television sets and stereos, to wash-ing machines and refrigerators in the 1990s.
These and other products have served to generate ademand for increasingly more high-tech products thathas supported the development of domestic industries,many of which have later developed into major export-ers. There have certainly been hopes among Chineseleaders that the same formula could be used both togenerate domestic growth and to prepare the Chinesecar industry for international competition.
Another factor explaining the limited extension ofpublic transport alternatives such as subways, trams,and light-rail is that development and operation of rail-based public transport would require co-operation be-tween different agencies and bureaus, several of whichhave conflicting interests. To further complicate the pic-ture the real estate situation in Chinese cities is unclear,with different bureaucratic organisations such as minis-tries, agencies, bureaus, universities, institutes, as wellas state-owned companies claiming sovereignty to ur-ban land parcels that have been at the particular organi-sation’s disposition from before reforms began. This is aclassical prisoner’s dilemma case, where each organisa-tion is reluctant to engage in, or consent to a venturewhere the dividends for the own organisation is unclear.
Instead, future visions posted on mammoth size bill-boards in Chinese cities portray futuristic urban areaswith elaborate road traffic apparatus and fancy cars withno bicycles. Nowadays bicyclists are commonly blamedfor causing traffic jams, although a bike occupies a frac-tion of the space that a car does, and space is one re-source in short supply in Chinese cities.
Still, there are urban areas in the richer eastern andcoastal regions where development of improved publictransport systems, including subways, could take offsince these areas will be best able to afford such solu-tions to congestion and air pollution.
Future Trends and UncertaintiesUntil now, environmental concerns have had little influ-ence over development of the transport sector. Trans-port systems have been guided by the strong develop-ment symbol that the motorised society represents.
Solutions to urban air pollution, which is increasinglycaused by car traffic exhaust, are sought rather in tech-nical improvements than in alternative transport systems;and problems of space and public transport capacityhave not yet received much attention among Chinesetraffic planners. Examples include recent Beijing traffic
management initiatives, which have addressed the seri-ous air pollution by banning older vehicles and intro-ducing taxis and busses fuelled with liquid petroleumgas, in combination with efforts to increase traffic flowaround the third ring road. Similarly at the national level,there is a ban on leaded petrol. However, should trans-portation approach western European or North Ameri-can levels, even large investments in the cleanest tech-nologies are not sufficient to solve the urban transportproblem.
Demand for a clean environment, and the harness oneconomic development that is soon created by chronictraffic congestion, could influence transport develop-ment, particularly in the increasingly crowded wealthiercities. Given that the government could channel demandsfor alternative transport solutions, this could lead toclean, integrated transit schemes appropriate for a grow-ing middle class and lessen dependence on private vehi-cles.
3.10 Agriculture and Food ProductionBy the year 2025, China may have an additional 250 mil-lion mouths to feed. Environmental constraints, mainlyscarcity of water, may make it impossible to feed China’sentire population from domestic agriculture. Balancedagricultural development towards sustainable food pro-duction will be possible only with clever use of policyand practices to result in dramatic changes in the agri-cultural production system. Failure to reform agriculturemay lead to severe repercussions for the environment.
Past and Present Food PolicyFor the first decades after 1949, the underlying strategywas food self-sufficiency and each area was expected toprovide sufficient food for its own population. Only sur-pluses could be sold, and then at controlled prices. Un-able to purchase food through trade, many localities wereforced to grow crops on unsuitable land, often with littleunderstanding of carrying capacity, thereby contribut-ing to many ecological problems, notably water short-ages and land degradation.
The strategy of food self-sufficiency has been re-placed by a strategy of food security. Within China, foodcan be legally bought and sold freely, and most pricesare set by the market. However, strong local and nationaltendencies against importing food persist. This is linkedto a set of incentives and subsidies in the agriculturesector. One effect is that crops are still grown in inappro-priate places. Also, agricultural inputs such as water,fertiliser and pesticides, continue to be subsidised. Thisleads to short-term higher productivities, at the likelycost of later pollution, overuse of water and land degra-dation. For example:

China Human Development Report 61
The Society–Environment Nexus
• Numbers of livestock are often well above establishedcarrying capacities, e.g. more than double the capac-ity in northern Shaanxi, and more than triple in Ningxia(Zhao Yongxi, 1998).
• Average fertiliser consumption in China is higher thanany other country, double world averages, and pesti-cide use is similarly high.
Drivers of Changing Food ProductionSlowly, transformation towards an open market seems tobe underway, even in rural and agricultural areas. TheWTO entry may speed up this process, even though itwill remain very slow. Important components and driv-ers of this transformation include privatisation of land,termination of subsidies, development of sustainableagriculture, and urbanisation.
Privatisation of Agricultural LandHistory shows that ownership of land is a fundamentalcomponent in making it worthwhile for farmers to under-take the investments and laborious work needed to en-sure long-term agricultural development. This generallyunleashes increases in productivity, efficiency andsustainability. The case for privatisation of agriculturalland is even stronger in China, given the present situa-tion with a large number of very small farms unable totake advantage of economies of scale, thereby prevent-ing further agricultural modernisation. Box 3.6 delves intothe pros and cons of land tenure and the rural environ-ment.
Removing Subsidies and Other DistortionsIf water prices are adjusted to reflect scarcity, and theenvironmental costs of fertilisers and pesticides are in-ternalised into the price of food, food production wouldchange from highly water-consuming and fertiliser-de-pendent crops, to water-efficient and naturally resistantcrops, better adapted for local circumstances.
Development of a Sustainable Food Production SystemGiven the scarcity of water in China’s vast northern ag-ricultural areas, grain production could be substitutedby increased imports, in favour of high value crops suchas vegetables, fruits and nuts which may be exported.An important task here is for the government to providethe infrastructure that is needed to give agricultural ar-eas access to markets and to promote agricultural exten-sion services.
UrbanisationA massive wave of migration from rural to urban areas ischanging the basic structure of rural China, from havingbeen a predominantly agricultural society based on sub-sistence farming with low productivity, to a commercialsystem for food production. In the future, a reducingnumber of farmers will have to supply a growing numberof people.
With migration, economic development, and gradu-ally deregulated agriculture come lifestyle changes, in-cluding a change towards a more diversified diet with
Box 3.6 Land Tenure and the Rural Environment
Who owns the natural resources is a key factor influencing management methods and long-term objectives for landexploitation, ultimately affecting land and environment. This is especially true in rural areas. It is often observed that whenfarm households have secure, long-term control over land and water resources, they take long-term action towards landuse and protection, especially investing in agricultural land.
In rural China, in order to stimulate economic growth and improve farmers’ living standards, the Household ResponsibilitySystem was initiated in the early 1980s, where farmers were guaranteed the right to lease given land for fifteen-yearperiods. The government is now moving into the next stage of rural land ownership reform, prolonging land-use rights tothirty years. The new law also allows farmers the rights of inheriting, transferring and using their land as mortgage asset.The reform is also extended to cover grassland use rights, by introducing the herdsman contract responsibility system.Potentially, up to 200 million farm households could be stimulated to invest in long-term soil protection and protectivemeasures related to water and air pollution reduction, irrigation, drainage, and soil improvement (Wu, 2000).
Although still in the early stages, evidence to date suggests that farmers with signed copies of the new land-use contractfelt their power had increased, with more control over land-use decisions and long-term tenure security. This is incontrast with farmers who either had not signed a contract, or had signed but not received a copy. The written contracthas the potential effect of taking power over land-use decisions out of the hands of local cadres and transferring it tofarmers. And yet, some preliminary studies show that most farmers suspected there would still occur unexpected landreadjustments during the 30-year term. This implies that farmers still lack the assurance of tenure security, the basis foradditional land investments (Bledsoe and Prosterman, 2000).
This may have negative impacts on other rural goals. For example, the government hopes to increase food productivity byachieving economies of scale in grain production by converting household production units into large-scale agriculturalunits. This “conversion” would be most efficiently achieved by the market, but this cannot happen if long-term land tenureis not in place.

Chapter 3
UNDP62
more meat, but also more vegetables, fruits, and fish.These trends are likely to drive specialisation in foodproduction and the development of food markets. It willalso provide a push for higher agricultural productivity,which, in turn, may have both positive and negative en-vironmental impacts.
The trend towards changing diet is likely to coincidewith the rise of much more environmentally concernedand quality oriented consumers, whose requirements maypush agriculture towards more qualitative and ecologi-cally sound production.
Environmental Constraints on Food Production andPolicyThe lack of arable land was long regarded as one of themain bottlenecks for food security in China. This led toconversion of unsuitable land, former forests, wetlandsand grasslands, to agriculture, and ultimately led to thedegradation of much of this land. New estimates fromthe Chinese State Land Administration, however, showthat agricultural land was under-reported by almost 50percent. Today an estimated 132 million hectares are cul-tivated, but detailed analyses of agro-ecological zonescarried out by FAO suggest that another 30 million hec-tares may be suitable for agriculture.
However, the importance of water as an input to agri-culture has still not been fully recognised. Water is un-evenly distributed and a larger part of the available farm-land is located in the water scarce northern China. Water,not land, is the major constraint on food production.This leads to two challenges: how to best utilise theconsiderable acreage in southern China that has suffi-cient water resources for farming, and how to adapt dryagriculture in China’s northern and western parts to max-imise production value per unit of water.
Water quality is also an issue as toxic substancesenter the food chain from polluted water and soils, notleast from the habit of irrigating with sewage water. Withnumerous cases of agricultural produce being severelypolluted by non-degradable toxics, such as cadmium andarsenic, there is a danger of large areas being declaredunsuitable for food production.
Although water is the main environmental constrainton productivity, there are many others, some of whichare nationwide issues. The major ones are erosion,salinisation and nutrient deficiencies. Others includepollution from pesticides and fertilisers, industrial andmunicipal solid wastes, acid rain, and the remains of plas-tic film. Collectively these factors considerably lessenthe productivity of vast areas of China’s farmland.
Future Trends and UncertaintiesMost of the environmental problems associated withagriculture and food production are results of past and
present misguided agricultural policies and programmes,which have led to inappropriate choices of crops, live-stock, and practices. Agriculture has been its own worstenemy in China.
A steady trend in the agriculture and food sectorssince the very beginning of the reforms has been theshift from centrally planned collectives to household-based agriculture that was initiated with the agriculturalreforms in the early 1980s. Since then, agricultural landhas been leased to the farmer; and tenancy contractshave been extended from 15 to 50 years with the right ofinheritance. It is therefore likely to anticipate further de-regulation and privatisation, and today, full-fledged pri-vatisation of land is being discussed, although it seemspolitically hard to digest.
The WTO entry could have far-reaching impact onthe structure of China’s domestic food production, withcompetition from international grain production makingcommercial agriculture on marginal land a loss-makingbusiness. Most likely is that China adapts to the situa-tion by a gradual shift to other agricultural production—a change, however, that would require a combination offurther privatisation and forward looking, active agricul-tural policies, with promotion of markets for green agri-cultural products, development of agricultural extensionservices, and propagation of water-efficient irrigationtechniques. Still, particularly in the case of increasinginequity, there is a risk that large groups of redundantlabour are left without livelihood and forced to take upsubsistence farming on marginal land.
Climate change is a major uncertainty for China’s ag-riculture and food production system. Climate modelsfor China indicate increasing precipitation in the waterscarce north, which would be positive for agriculture,however the risk of increasing variability makes it un-clear if more rain would indeed be favourable for foodproduction.
3.11 GlobalisationGlobalisation and China’s opening up mean that Chinais increasingly interacting with its neighbours and withthe rest of the world. These economic, political and sci-entific interactions are happening at all levels and playimportant roles in pushing environmental and societalchange in China. Vice versa, with China increasingly in-tegrated with the rest of the world, and with its economicactivities growing steadily, China is rapidly becomingone of the most important players on the global environ-mental scene.
Foreign Direct InvestmentIn 1998, Foreign Direct Investment (FDI) in China to-talled over 45 billion USD (China, 1999) making Chinaone of the world’s largest recipients of FDI and the larg-

China Human Development Report 63
The Society–Environment Nexus
est recipient among developing countries. FDI can fa-cilitate the deployment and import of hard and soft tech-nology. This newer technology is generally cleaner thanthe existing technology in China. Often FDI from indus-trialised countries is subject to the same environmentalstandards as in the company’s home country—whichare usually stricter than China’s. International compa-nies’ investments are usually competitive, and introducemanagement processes focusing on efficiency and ethi-cal awareness. For these reasons, FDI does stimulateimprovements in environmental performance in China’sdomestic enterprises. Local politicians and enterprisescan learn from these investments, and are stimulated tocompete with the economic and environmental perform-ance of the FDI investor.
There is a negative side to FDI. When investing incountries with a weak regulatory and administrativeframework, some companies may install technologies andprocesses that are not allowed in other countries, in-cluding their home country. There is some evidence thatin the early years after the opening up, FDI—particu-larly through Hong Kong, Taiwan, Korea and someSoutheast Asian countries—brought much environmen-tal damage. This no longer seems to be the case, prob-ably due to China’s strong FDI legislation, and the rela-tively effective implementation of its regulations.
FDI in China has been largely focussed into severalsmall geographical areas, mostly along the eastern coast,in some cases into special zones, although almost allprovincial capitals have received some significant in-vestments. FDI has been a major factor in the economicsuccess of these areas, whereas many remote and inlandcounties and provinces that have not received FDI re-main poor. The environmental impact of the FDI has beenmixed, in general pollution per unit output has dropped,but greatly increased output has led to overall increasesin pollution in many areas, and in some cases more com-plex forms of pollution are associated with the highertech investments. The increase in prosperity in the areasbenefiting most from FDI has led to increased consump-tion, but also increased financial capacity to improve thelocal environment, as can be witnessed in cities such asShenzhen and Fujian.
Recently the international and domestic communityassembled to establish the China Business Council forSustainable Development, along lines similar to the WorldBusiness Council for Sustainable Development and toCouncils in other countries. In China, the members ofthe council are the heads of Chinese and FDI enterprises.These Councils enable the visionary elements in thebusiness community to co-operate and play a more di-rect role in shaping a cleaner, better society. They canprovide training, equipment, and guidelines for otherenterprises in Chinese society and represent businesses
in interactions with government. They can help ensurethat environmental improvement does not come at theexpense of jobs or competitiveness.
International Trade and China’s WTO EntryChina’s entry into the WTO is anticipated to have a sig-nificant impact on Chinese society, but what will be itsimpact on the environment? Experts differ as to the over-all effect of WTO—positive or negative. It is generallyrecognised that the WTO-entry, rather than create newtrends, will speed up and intensify existing ones.
By opening China to international trade in a numberof areas, the WTO entry is likely to generate greatercompetition within China’s domestic markets. In gen-eral, international competition may decrease domesticproduction of commodities that use intensively China’sscarce resources, while production of commodities thatuse abundant resources may expand. This may causeChina to import more resource-intensive products, suchas water-intensive agricultural products, pulp and pa-per, petroleum and natural gas, and shift domestic pro-duction towards more labour-intensive products suchas aquaculture, livestock, vegetables and fruits, textiles,and toys. Given outdated technology, low productivity,and inefficiency in much of China’s manufacturing in-dustry, items such as autos, chemicals, and machineryare likely to be either imported or manufactured by mul-tinationals in China.
On the positive side, increasing imports of water andland-intensive agricultural products, such as grains, cot-ton, edible oil, and sugar, may lead to a reduction ofwater-intensive agriculture and also have positive ef-fects on agricultural pollution. Increased imports of pulpand paper products would reduce the severe environ-mental problems caused by the highly polluting and in-efficient domestic pulp and paper industry. This wouldalso reduce pressure on scarce and expensive domesticpulpwood, and make possible alternative use of agricul-tural residuals, presently used for straw pulp. Moreover,reduction of industrial pollution is anticipated when out-dated manufacturing is substituted by either imports orestablishment of modern production units.
On the negative side, increasing production of labour-intensive goods—such as textiles, vegetables and fruits,livestock and aquatics—could become sources of newenvironmental problems. There is also likely to be anincrease in diffuse source pollution associated with thelivestock industry, e.g. annual growth rates from 2000 to2005 for pork and fish production are forecasted to be3.4 and 5.9 percent, respectively ( Chen Chunlai andHuang Jikun, 1999). Vegetable and fruit plantations usechemical fertiliser and pesticides intensively, and thereis considerable risk that soil pollution may rise signifi-cantly.

Chapter 3
UNDP64
The aim of WTO is to establish international compe-tition globally under equal conditions. To be competi-tive, Chinese industry will have to become more effi-cient, which, at least in the long run may lead to im-proved utilisation of resources, conservation, and theimport of cleaner, efficient technology. However, compe-tition will increase pressure to cut production costs, andin the short term can lead to increases in pollution dis-charges and greater exploitation of natural resources.The key here is to ensure that domestic Chinese legisla-tion, enforcement, and practices keep pace with the newcompetitive situation. WTO obligations promote greaterpublic participation in standards setting and clear andeffective notice of environmental standards, as well asthe strengthening of these standards particularly in de-veloping countries (Ferris et al., 2000). This could wellprove to play an important role in reforming environ-mental governance structure (see section 3.12). Also,WTO accession should increase contacts between Chinaand the international community at all levels. This couldlead to increasing the inflow of ideas and informationacross China’s borders—also with possible impacts onsociety and the environment.
Regional environmental changes in various parts ofthe world will also influence China. As China’s economybecomes more integrated into the world economy, it willbecome more responsive to global consumers. There issome evidence that such consumers are becoming in-creasingly sophisticated, for example demanding not justgreen products, but also that production processes beclean. In order to compete in such an increasingly so-phisticated market, Chinese enterprises will have to com-ply with these forces. It will become necessary for mostChinese companies with large export markets to abideby ISO 14001 standards for environmental reporting.
International ConventionsChina plays an active and dynamic role in the prepara-tion and implementation of international environmentalconventions. China has ratified all relevant environmentconventions, including the Vienna Convention for theProtection of the Ozone Layer (and subsequent Mon-treal Protocol), the UN Framework Convention on Cli-mate Change, the UN Convention on Biological Diver-sity, and UN Convention to Combat Desertification. Theprocess of ratifying and implementing global conven-tions has been influential in placing environment issueshigh on the national political and development agenda.
By signing a convention, China commits to takingmeasures leading to the protection of environmental re-sources, including current state assessments, sharingof information, engagement in international co-opera-tion, preparation of national action plans, and integra-tion of environmental protection with general develop-
The Montreal Protocol targets phasing out of pro-duction and consumption of ozone depleting substances(ODS). This has already been achieved in industrialisedcountries and China remains one of the largest produc-ers and consumers of ODS. The Protocol has madesignificant funds and technology available to help phaseout the use and production of ODS in Chinese state-owned and private enterprises. This has led to increasedenvironmental awareness at the political, enterprise andpublic levels. Offending technologies are replaced withnew technologies that are not only ozone-friendly, butoften more environment-friendly and economical.
ment plans and programmes. The convention work raisesawareness, generates commitment to environmental pro-tection, and helps identify options that are good for theglobal and local environments and economy. In manycases, China is stimulated to go beyond the minimal re-quirements, for example by protecting sites of highbiodiversity, and acting to reduce greenhouse gas emis-sions.
Development Co-operationDevelopment co-operation has been a major catalyst ofchange in China, providing not only financing but evenmore so a channel to the international community lead-ing to import of new technology. Given the huge in-creases in trade and foreign direct investment volumesover the past two decades, funds channelled throughdevelopment co-operation are now marginal in relationto overall international investment volumes, and devel-opment co-operation has focused on a limited number ofcritical areas. Environment and sustainable developmentis one of these high priority areas, where most donorsare active.
The Chinese government uses development co-op-eration to obtain new technologies, ideas and expertise,examples of lessons learned from other countries, andfor experimenting with policies, techniques, and skills.But development co-operation has also been influentialin paving the way for changes that have met resistance,such as the introduction of integrated management ap-proaches, strengthened co-ordination among govern-ment agencies, private-public partnerships, and allow-ing civil and non-governmental organisations to play arole in the governance process.
In the mid-to-late 1990s, several donor projects sup-ported reform within the water sector, introducing at anexperimental scale the need for full costing and privati-sation. This led to the introduction of the new water lawin 1999. The donor projects also helped build capacity inthe water sector, thus ensuring the ability to respond tohigh-level political demands. Similarly, the donor com-munity played a major role in moving air pollution to the
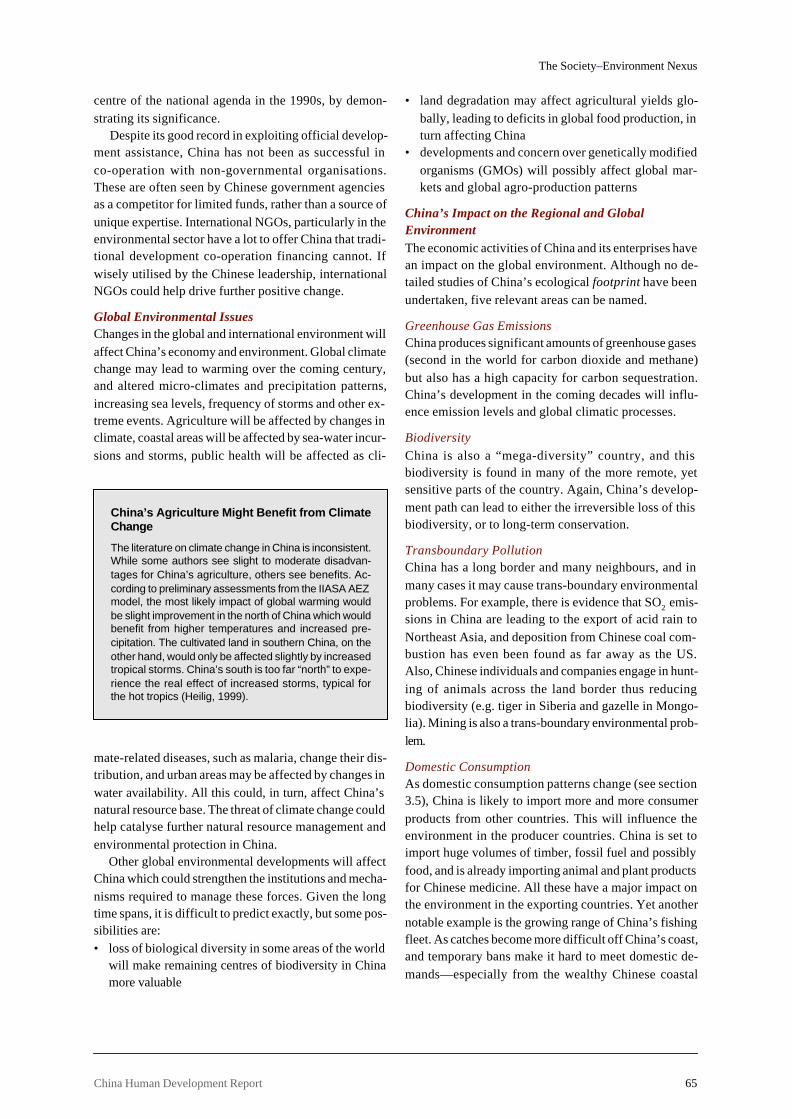
China Human Development Report 65
The Society–Environment Nexus
centre of the national agenda in the 1990s, by demon-strating its significance.
Despite its good record in exploiting official develop-ment assistance, China has not been as successful inco-operation with non-governmental organisations.These are often seen by Chinese government agenciesas a competitor for limited funds, rather than a source ofunique expertise. International NGOs, particularly in theenvironmental sector have a lot to offer China that tradi-tional development co-operation financing cannot. Ifwisely utilised by the Chinese leadership, internationalNGOs could help drive further positive change.
Global Environmental IssuesChanges in the global and international environment willaffect China’s economy and environment. Global climatechange may lead to warming over the coming century,and altered micro-climates and precipitation patterns,increasing sea levels, frequency of storms and other ex-treme events. Agriculture will be affected by changes inclimate, coastal areas will be affected by sea-water incur-sions and storms, public health will be affected as cli-
• land degradation may affect agricultural yields glo-bally, leading to deficits in global food production, inturn affecting China
• developments and concern over genetically modifiedorganisms (GMOs) will possibly affect global mar-kets and global agro-production patterns
China’s Impact on the Regional and GlobalEnvironmentThe economic activities of China and its enterprises havean impact on the global environment. Although no de-tailed studies of China’s ecological footprint have beenundertaken, five relevant areas can be named.
Greenhouse Gas EmissionsChina produces significant amounts of greenhouse gases(second in the world for carbon dioxide and methane)but also has a high capacity for carbon sequestration.China’s development in the coming decades will influ-ence emission levels and global climatic processes.
BiodiversityChina is also a “mega-diversity” country, and thisbiodiversity is found in many of the more remote, yetsensitive parts of the country. Again, China’s develop-ment path can lead to either the irreversible loss of thisbiodiversity, or to long-term conservation.
Transboundary PollutionChina has a long border and many neighbours, and inmany cases it may cause trans-boundary environmentalproblems. For example, there is evidence that SO2 emis-sions in China are leading to the export of acid rain toNortheast Asia, and deposition from Chinese coal com-bustion has even been found as far away as the US.Also, Chinese individuals and companies engage in hunt-ing of animals across the land border thus reducingbiodiversity (e.g. tiger in Siberia and gazelle in Mongo-lia). Mining is also a trans-boundary environmental prob-lem.
Domestic ConsumptionAs domestic consumption patterns change (see section3.5), China is likely to import more and more consumerproducts from other countries. This will influence theenvironment in the producer countries. China is set toimport huge volumes of timber, fossil fuel and possiblyfood, and is already importing animal and plant productsfor Chinese medicine. All these have a major impact onthe environment in the exporting countries. Yet anothernotable example is the growing range of China’s fishingfleet. As catches become more difficult off China’s coast,and temporary bans make it hard to meet domestic de-mands—especially from the wealthy Chinese coastal
China’s Agriculture Might Benefit from ClimateChange
The literature on climate change in China is inconsistent.While some authors see slight to moderate disadvan-tages for China’s agriculture, others see benefits. Ac-cording to preliminary assessments from the IIASA AEZmodel, the most likely impact of global warming wouldbe slight improvement in the north of China which wouldbenefit from higher temperatures and increased pre-cipitation. The cultivated land in southern China, on theother hand, would only be affected slightly by increasedtropical storms. China’s south is too far “north” to expe-rience the real effect of increased storms, typical forthe hot tropics (Heilig, 1999).
mate-related diseases, such as malaria, change their dis-tribution, and urban areas may be affected by changes inwater availability. All this could, in turn, affect China’snatural resource base. The threat of climate change couldhelp catalyse further natural resource management andenvironmental protection in China.
Other global environmental developments will affectChina which could strengthen the institutions and mecha-nisms required to manage these forces. Given the longtime spans, it is difficult to predict exactly, but some pos-sibilities are:• loss of biological diversity in some areas of the world
will make remaining centres of biodiversity in Chinamore valuable

Chapter 3
UNDP66
southern cities—the fleet has to go further a field, af-fecting stocks across the Pacific Ocean.
Chinese Overseas InvestmentsChinese enterprises are starting to invest heavily acrossthe world. By 1999, accumulated investments had to-talled 6.33 billion USD (China, 1999) in 160 countries.This will have environmental impacts in those countries,which could be positive or negative.
Global GoodwillChina plays two related roles in international relations.First, it provides a model for many developing countries,as illustrated by its position within the group of 77 de-veloping countries (G77). Second, it is an important po-litical player, having one of the five permanent seats onthe UN Security Council.
In order to improve its international reputation andprovide a good model to developing countries, China ismotivated to develop a clean, sustainable developmentpath and reduce its export of environmental problems. Itis keen as well to participate in and implement environ-mental conventions. Another example is Beijing’s appli-cation to host the 2008 Olympic Games.
Future Trends and UncertaintiesChina’s open door policy, which has been a central com-ponent of the reforms for more than two decades, is verylikely to continue, with China playing an increasinglyimportant global role. China’s WTO entry and contin-ued growth of the Chinese economy are additional fac-tors. As a result, China’s environment and its choice ofdevelopment path—sustainable or unsustainable—willbe increasingly interlinked with global developments.
Box 3.7 The Olympics as a Driver of Environmental Change in China
Beijing narrowly missed being selected as host of the 2000 Olympic Games and launched a successful bid to host themfor 2008.
Selection for the 2000 Games took place in 1993. Although the reasoning of the individual voters on the InternationalOlympic Committee is kept secret, it is widely believed that Beijing’s poor environment—notably horrendous air pollution—was one of the reasons why the bid failed.
The failure threw Beijing’s environment into the limelight resulting in considerable media coverage and high-level politicaldiscussions, and the attention led to a general increase in environmental awareness at all levels across the country. It alsoled to an increased commitment towards environmental improvement.
When Beijing prepared the second bid, it had learned its lesson, and the national and city authorities had initiatedenvironmental improvements in Beijing in time for the visit of the Inspection Committee. These measures included removalof polluting industries and vehicles, planting of trees and greening of parts of the city. Beijing’s air quality is affected bymunicipal, industrial and agricultural activities in the surrounding region, so to improve quality also required regional co-operation. The selection Committee’s inspection took place in 2001, and some members informally commented on theimprovements. In July 2001, Beijing was officially selected as the host.
To further strengthen the bid’s environmental profile, Beijing coined it the “Green Olympics”, or the first Olympic Games tobe truly environmental. As such, Beijing has invited the whole world to follow the preparations and to evaluate theenvironmental impacts of the games. (photo shows home-made kite depicting the Olympic Games logo)

China Human Development Report 67
The Society–Environment Nexus
The most noticeable manifestation of China’s increas-ing impact on the global environment is that China isforecasted to pass the US as the world’s largest emitterof greenhouse gases within the coming decades. Giventhe fact that there is considerable room for reducinggreenhouse gas emissions in China without compromis-ing energy requirements, makes active involvement inthe Kyoto process with binding commitments an oppor-tunity to showcase China as a model for greenhouse gasreductions.
Equally important is China’s role as a haven for a con-siderable part of the world’s collective biodiversity.Present trends are not too bright, however, with a largenumber of threatened species on Chinese territory. Aswith greenhouse gas emissions, the future is largely de-pendent on which development path China chooses.
Apart from direct impacts of discharges of global pol-lutants, the major part of China’s global environmentalinteractions will be connected to changing trade pat-terns and increasing international competition—both inChinese markets, where Chinese producers will be chal-lenged by more cost- and resource-efficient production,and in international markets, where consumers’ demandsfor “green products” and more stringent product-ori-ented regulation will require Chinese producers to com-ply in order to access the markets.
But there are many uncertainties on how China’s de-velopment will come to interact with the environmentaround the world. In a world where everything is con-nected, it is not necessarily so that environmental im-provements in China mean a better global environment.When production leaves China for other places, it maylead to serious environmental problems in those coun-tries, and the resulting increased trade may mean in ef-fect that China is exporting environmental problems.
A more disquieting uncertainty with potentially largeregional and global repercussions is the risk for environ-mentally-related disasters or continued unsustainabledevelopment leading to large areas losing carrying ca-pacity and populations their livelihoods. Given China’slarge population and high population densities in theeastern provinces, seemingly marginal changes in e.g.precipitation, in combination with other developmentproblems such as poverty and inequity could triggersocial unrest with regional or global implications, andmigration pressures involving tens of millions of people.
3.12 Governance and InstitutionsThroughout the different sections of this chapter a re-curring theme has been the element of choice when as-sessing the different paths that China’s developmentcould take. Also, China’s future relies largely on how itsgovernance and institutions are structured or very
broadly speaking, the way decisions are formulated andimplemented.
Although more cautiously than in the economic arena,governance has undergone reform in recent years inChina, with large potential benefits for the environment.This section discusses the current trends as well as fu-ture prospects and uncertainties concerning China’senvironmental governance structure. This section linksto the discussion in chapter 4 on how China addressessustainable development within governmental andnongovernmental sectors.
A Legacy of Arbitrary, Top-down GovernanceTraditionally in Chinese society, decisions were takenby influential or respected individuals, rather thanthrough laws or regulations. The Chinese term guanxisignifies the power of individual influence. Guanxi isthe Chinese word for “relation”, but in a deeper senseguanxi denotes a network of informal personal relation-ships that forms an invisible bond between differentadministrative and political bodies. Governance in Chinaappeared quite differently than what it looked like onpaper. Hence, to have guanxi, or to be “well connected”carried more weight than formal rules, and the contexthad a significant impact on how rules were interpreted.The precedence of having good connections, and theprimacy of circumstantial concerns over rules continuedwhen the People’s Republic was formed, but with theideology of “Marxism, Leninism, and Mao-Zedong-thought” forming the basis for decisions (Hallding, 1991).
The system had its positive aspects, such as the “cam-paign approach” (further discussed in section 4.2) bywhich the Party mobilised large numbers of human re-sources for a cause. For example, it has always beenpossible for the central and provincial governments tomobilise large numbers of people in back-breaking tree-planting programmes. But the problem has been thatwithout proper consultation and a direct stake in thetree-planting endeavour, people tend not to maintain thetrees, leaving meagre results in terms of sustainable for-ests. The Party’s network at the grassroots has also pro-vided a mechanism, albeit uneven, to feed public con-cerns into decision-making. Still, it is safe to assert thatthe heavy top-down governance structure that prevailedthrough the first half-century of the People’s Republicby and large has proven counterproductive to sustain-able development.
The past two decades, however, have seen continu-ing changes in governance and institutional structures,characterised by:• rule of law instead of rule by man• growing separation between rule-making institutions
and rule-implementing functions
Chapter 3
UNDP68
• slow but sure integration between sectoral strong-holds
• decentralisation giving local leaders increasing power• increasing reliance on the market instead of command-
and-control instruments• a gradual shift from collective to private ownership• broadening participation in rule-making and in moni-
toring implementation• strengthened technical/academic sector
These factors combine to ensure more responsivedecision-making and implementation of environmentalprogrammes, with potentially large benefits for the envi-ronment, but also with considerable risks for backlashesand adverse environmental side effects.
Rule of LawSince 1979, the Chinese government has addressed theold way of arbitrary decision-making by gradually sepa-rating the lawmaking process from the political agenda,in order to develop rule of law. Although there is now afairly comprehensive set of rules and laws, traditionalbehaviours do not change overnight, and many deci-sions are still made by important individuals without duerespect to the law. A large part of environmental prob-lems being the result of market failures, loyalties, orshortsighted and narrow-minded aims for quick returns,the absence of rule of law will make it difficult to come togrips with China’s environmental problems. For exam-ple, a local official might ignore the fact that an enter-prise is violating air pollution laws if his cousin or friendis the manager. Local officials are also often more con-cerned with the immediate economic welfare of their com-munities than with long-term environmental well-being,and decisions frequently go in the direction of allowingpollution to continue, in direct contradiction to the legalset-up.
Although there are still considerable influences fromsubjectivity in environmental decision-making in China,the trend towards rule of law for more than 20 years isfirmly on track. Firstly, an Environmental Committee hasbeen set up under the National People’s Congress, whichhas real authority over environmental legislation. Sec-ondly, environmentally harmful decisions and obviousmisconduct that would have been impossible to pros-ecute only a decade ago, are now being brought to court,which is mirrored in the increasing number of environ-mental legal cases.
There is a firm conviction within central leadershipthat legal institutions need to be further strengthened.Still, however, there is a clear tendency to believe in com-mand-and-control regulation and rule by decrees, ratherthan taking advantage of market forces (see section 4.1Government Response).
Growing Separation between Rule-making andImplementationIn addition to the politicised and often arbitrary deci-sion-making culture of the Mao era, there has, until re-cently, been little formal distinction between rule formu-lation and rule implementation. In general, the organisa-tion responsible for formulating rules was also responsi-ble for implementing and monitoring these. For example,the Ministry of Forestry was responsible for setting for-estry objectives for a large part of forestry productionand for monitoring the forestry sector. This system wastop-down, non-participatory, and provided a hotbed forcorruptive behaviour. Decisions were often taken in thenational and provincial capitals, with little input fromconcerned stakeholders. As a result, production (e.g. ofsteel or timber) became the over-riding objective andthose affected by environmental impacts were unable toinfluence the processes.
There is now a clear distinction between rule-makingby government departments on the one hand, and im-plementation by enterprises on the other. There is also aclear distinction between exploitation of natural resourceson the one hand—still under the supervision of sectoralministries—and protection of natural resources and en-vironment on the other, which is entrusted increasinglyto the separate and increasingly strong SEPA. SEPA nowhas a clear mandate and incentive to protect the envi-ronment, something no agency had 25 years ago. This isillustrated by the number of environmental impact as-sessments being carried out, over 78,000 in 1998 (XieZhenhua and Song Ruixiang, 1999).
Integration of Sectoral Strongholds, theStreamlining of Environmental ManagementThe basis of China’s more or less unbroken line of strongadministrative governance can be traced all the way backto 221 B.C. during the reign of the first emperor of theQin Dynasty. Through the centuries a deeply stratifiedform of bureaucratic governance emerged and after 1949,the Communist regime linked to this tradition, setting upa centrally planned vertical power structure geared to-wards boosting production within a number of minis-tries, bureaus, agencies, and departments (Hallding,1991).
With its strong sectoral stratification, this govern-ance model proved effective at preventing and dealingwith such environmental disasters as floods, but lesssuccessful in managing new or cross-sectoral issues suchas sustainable development. When it came to situationswhere several administrative units were involved withthe same issues, and where co-operation would servethe public good best, the traditional administrative gov-ernance structure put different bureaucratic strongholds

China Human Development Report 69
The Society–Environment Nexus
into conflict with each other. This pattern has been ob-served in numerous cases since environmental manage-ment typically relies on co-operation from several agen-cies.
The development of Chinese bureaucracies into some-thing close to “independent kingdoms” has been com-pounded by the procedure of letting sectoral agencies,not neutral bodies, lead the development of laws andregulations. Each agency develops its own laws pertain-ing to the resources it manages, and each attempts touse the law to strengthen its mandate and increase itsregulatory powers.
Gradually the reform process has led to a dismantlingof the old sectoral strongholds, and the number of dif-ferent production-oriented sectoral ministries has beenreduced considerably. At the same time, authorities withcross-cutting responsibilities in the area of environmentand sustainable development were strengthened afterthe major 1998 government reform, with the promotionof SEPA to its present semi-ministerial status, and theclear mandate to the SDPC to lead China’s sustainabledevelopment efforts in close collaboration with a numberof ministries and agencies.
A related trend is marked by the efforts to establish amore efficient and responsive organisational structurein managing public utilities. The UNDP-led 21st CenturyUrban Water Management Project (box 3.8) illustratesthe largely untapped potential for making managementof both water supply and sanitation considerably moreefficient by reducing the number of departments involvedand moving towards a straight forward demand-responsemanagement strategy.
Decentralisation, the Central–Local Power StruggleChina has a centralised power structure and a deep ad-ministrative hierarchy including provinces, cities, coun-ties, towns and a number of other organisational units.Still, the central government has far less influence overthe provinces than what could be expected from such acentralised state. Economic reforms have had furtherdecentralising effects mainly as a result of the disband-ing of collective agriculture and decreasing the share ofstate-owned companies.
Local governments have been given not only the au-thority necessary to reform local industries, but also thepower to control financial resources at the local level. Asa result, local governments have attained new bargain-ing powers, which have developed a tendency to side-step or ignore rules handed down by the central govern-ment. Since pressures on local governments to promotedevelopment are enormous, central environmental au-thorities have difficulties imposing environmental regu-lations, which often justifiably, are seen as impedimentsto local economic development. It is not always quiteclear who is in authority—the central or the local level—and the picture is further muddled by the existence ofvarious local, provincial, and central regulations, guide-lines, standards, and other more or less legal documents.SEPA, being a central authority with limited power, andwithout provincial or local representatives, has particu-lar difficulties in promulgating environmental regulations.The result is that provincial and local units bluntly ig-nore SEPA’s decrees.
Decentralisation as such is a necessary process toreach sustainable development in a country of China’s
Box 3.8 China to Commercialise Water Supply
Shijiazhuang, capital city of northern China’s Hebei Province adjacent to Beijing, is trying to commercialise water supply todeal with serious water shortages.
A project called China’s Urban Water Management in the 21st Century is being carried out in the city with assistance fromUNDP and the Australian government. Shijiazhuang has become the first city in China to seek ways to resolve its watershortage through organizational reform.
The project aims to regulate water management in urban China by reforming the administrative structure and price ofwater (ref. Ying Ruozhi, the project coordinator).
Traditionally there has always been more than one department in charge of water supply in urban China. Taking Shijiazhuangas an example, nine governmental departments have been involved in water management. To produce a medium- or long-term demand and supply plan proved difficult since there was no centrally responsible administration.
Shijiazhuang will have one single department of water management within the next 10 years, according to Ying Ruozhi.“We have worked out a reform plan for government consultation.”
Shijiazhuang is among 30 cities in China that suffer most from water shortage. The city’s annual water requirement is 400million cubic meters. To meet this demand, an additional 140 million cubic metres must be further exploited.
Shanghai and Shenzhen are also undertaking similar reforms.
Source: People’s Daily Online, November 14, 1999

Chapter 3
UNDP70
size, and there are many examples of local governmentstaking their own initiatives to improve the environmen-tal situation. There is active work to develop localAgenda 21s for a number of counties and municipalities.Still, command-and-control governance requires reformin order to promote sustainable development at the locallevel, and the changing role of SEPA to more of a policyformulating body is one step towards that end.
From Command-and-Control Towards Market ForcesWell into the early 1990s China was predominantly aplanned economy and most decisions were taken in acommand-and-control setting. Seen from an environmen-tal perspective this has had two main consequences.
First, prices of basic commodities were decided uponin the plan and geared towards boosting production,which meant low natural resource prices and freedom topollute. As a result there was little incentive to save onscarce resources and no reason to treat pollutants be-fore discharging them. Second, production was largelysupply-side driven with centrally planned public invest-ment decisions—both in terms of labour and capital—aiming to supply society with goods and services. Onceinvestments were in place, however, there was little in-centive to care for maintenance, operation, or manage-
ment, with the result that environmental investmentsperformed sluggishly. The long list of poorly function-ing environmental investments includes giant reforesta-tion programmes, where saplings once planted were leftwithout maintenance resulting in high losses. Also arethe all too often crumbling, poorly performing environ-mental installations such as water works, wastewatertreatment plants and air scrubbers. Once built, thesenever perform up to design specifications due to lack ofoperating and maintenance capacity. They are often leftto decay, one of the more well-known traits of the plannedeconomy.
Market reform has been the hallmark of the changesthat China has undergone over the last couple of dec-ades, with substantial efficiency gains. China’s GDP hasincreased faster than major emissions (Johnson et al.,1997), reflecting some positive environmental effects frommarket reform. Still, there is a long way to go before envi-ronmental governance through market-based instru-ments will make its effects felt in China. To a large extent,the economic boom of the last two decades has occurredat the expense of environmental values, and a consider-able part of the economic growth has been generated inan economic environment where entrepreneurs havebenefited from cheap inputs of materials and labour, with-
Box 3.9 Market Based Instruments in a Planned Economy?
Western countries, over many decades, introduced a variety of command and control measures to protect air quality in theurban environment, culminating in a series of far-reaching mandates in the 1960s and 1970s. Although broadly success-ful, not all environmental goals were achieved. Starting in the late 1970s, as it became more and more expensive to reachever-smaller emission levels, and as government downsizing became the mode around the world, governments began toshift towards economic efficiency. In this context, pollution is often seen as a “market imperfection” correctable usingmarket-based instruments (MBIs). Such economic thinking predominates today. However, command-and-control mecha-nisms have not been abandonedindeed they usually remain the basis for the regulatory infrastructure.
In some ways, environmental management in China has followed a similar path. All traditional measures in the centralplanning system can be viewed as command/control measures. Tentative modification to this approach began in the late1970s, starting with the pollution levy system. However, there is a fundamental difference between the Chinese and theWestern experience in this area. Starting in the 19th Century, Western economies first achieved resource efficiencythrough market pressures, and then developed a comprehensive regulatory framework for environmental management,and only then introduced MBIs. By contrast, China is attempting to introduce MBIs before most of its industries areanywhere close to international efficiency levels, and before there is a comprehensive regulatory framework. Will thiswork?
For example, Benxi looks to today’s Pittsburgh as an example of what can be accomplished environmentally in an iron/steel producing, resource-intensive city. But over several decades, Pittsburgh’s steel producers experienced reductionsin performance, and were forced to shut down when they become too inefficient in market terms. They also madepollution control decisions in that context, shutting down units if capital investments for pollution control of older technol-ogy was simply not warranted. Benxi’s State Owned Enterprises (SOEs) are also changing and making capital invest-ments, but they are not subject to the same market pressures. They are driven firstly by demands to maintain steelproduction and to keep hundreds of thousands of employees. Economic efficiency and environmental protection are stillsecondary concerns.
There surely is a role for market-based instruments. But Chinese policy makers must consider their implications beforerelying too heavily on them, and first create a mix of MBIs appropriate to China’s market and regulatory framework. Also,MBIs often require strong information databases and effective monitoring systems, and most of China does not yet havethese.
Source: Raufer and Wang, 1999

China Human Development Report 71
The Society–Environment Nexus
out having to pay for effluent discharges or worker’shealth.
Thus, in a sense China is trapped in between the worstof two worlds: on the one hand a socialist heritage ofunder-priced natural resources and free right to pollute,and on the other an unrestrained embrace of a marketeconomy where, as Deng Xiaoping stated “it is gloriousto be rich”.
From Collective Towards Private OwnershipThe transition from command-and-control towards mar-ket-based governance is intimately related to the shiftfrom collective to private ownership. China’s double-digit growth over the past two decades was initiated byincreased agricultural output when collective farmingwas dissolved in the beginning of the 1980s in favour ofa household-based land tenure system, the so-calledHousehold Responsibility System. This was followedby industrial productivity gains in return for allowingcapital and labour to flow into low-end production in thebooming non-state industrial sector. All it took to un-leash a surge of entrepreneurial spirit was for the gov-ernment to soften conditions for collective ownership ofproduction units, favouring the individual’s right to de-cide what to produce and to keep part of the profits, butwhere formal ownership in a legal sense was still collec-tive although with increasingly fuzzy edges. What fol-lowed from this governance revolution could in manycases best be described as unrestrained growth, on theone hand generating remarkable development of theeconomy, and on the other causing the large-scale ad-verse environmental consequences that have beenspelled out above.
The degree of privatisation has increased dramati-cally throughout the 1980s and 1990s and today wellover half of the industrial output is generated in the non-state sector, with the private sector showing the highestgrowth. Corporative and private enterprises tend to bemore profit oriented, and therefore more efficient. Thiseffect has been reinforced by the opening-up of internaland external trade, leading to increased competition andsome increases in efficiency.
In the agricultural sector, the Household Responsi-bility System has been gradually reformed, and land ten-ure contracts now run for 30- to 50-year terms with in-creased leeway to trade contracts and hand on land ten-ure rights to heirs. The ownership of land, however, isstill in the hands of the state, and the question of realestate reform is crucial in view of the governance of Chi-na’s land resources (see box 3.6 for aspects relating torural China). A key issue in this respect, with potentiallyfar reaching consequences for sustainable development,is how rural China will cope with increased international
competition in agricultural products (see section 3.11 onGlobalisation).
Privatisation is a hydra, which in the right market-based regulatory context can improve resource use effi-ciency, but without strong market-based regulation cancause overexploitation of people and natural resources,unchecked pollution and increased inequity. So far, thetransition from collective towards private ownership inChina—for all its dividends in terms of economicgrowth—has to a large extent come about at the expenseof environmental qualities. Still, if sustainable develop-ment is the objective, the future does not lie in a return tocollective ownership, but towards stronger market-basedgovernance.
Broadening ParticipationOne of the most powerful and promising trends in Chinain the next few decades may be an increasingly strongercivil society, and environmental authorities are now be-ing both challenged and assisted in its tasks by a risingnew force—public participation. The former environ-mental administrator, Qu Geping, has stated that publicparticipation in project approval, as well as consumerand investor interest in clean products and enterprises,will be promoted.
This new, burgeoning governance structure for theenvironmental arena is reflected by the increasing mediacoverage of environmental issues. This is hard to es-cape as newspapers, magazines, radio, TV, not to men-tion the Internet with now over 10 million Chinese usersnot only report on the environment, but increasinglyalso question the lack of government action.
The widening room for public participation is reflectedalso in the remarkably independent grassroots and citi-zen organisations, which have been formed over the lastcouple of years. Proudly referred to as NGOs—not onlyby members but also by officials that fancy this newphenomenon—these organisations do not enjoy quitethe same level of freedom as NGOs in other countries,but most of them have some form of financial or adminis-trative dependence on a government agency—some-times referred to as GONGOs, or governmental NGOs.
Public participation in China is built on a silent mutualagreement between media and NGOs on the one hand,and government ministries and agencies on the other.NGOs and media provide exposure to issues that theenvironmental authorities are hesitant to raise; and theauthorities in return give relative freedom to the envi-ronmental organisations. The bottom line of this silentagreement is that media and environmental NGOs thatoperate responsibly and within a scope acceptable tothe Chinese government are likely to be granted increas-ing freedom and access to the political process. This

Chapter 3
UNDP72
may be particularly true for locally active NGOs that pro-mote public awareness and serve as watchdogs for cen-tral government. However, government in a subtle waycontrols NGOs, which have to master the invisible butever present line between voicing environmental con-cern on the one hand, and questioning political poweron the other. Notably, at present, it seems unlikely thatthe government would allow for any nationwide NGOorganisation. Yet, organisations working for the benefitof local environments are being formed all over China,out of which a web of informal networks is growing.
The Birth of Influential, More Neutral Technical andAcademic SectorsThe existence of independent and reliable sources ofquality advice is crucial to sound decision-making, es-pecially when it comes to the complex issues surround-ing sustainable development. In the past, technical andacademic institutes were part of or under the supervi-sion of government ministries or agencies, gathering in-formation for that agency. Not surprisingly, the adviceproduced in these institutes had been carefully tuned tofollow the master’s voice, with the results that any no-tion of potentially adverse effects was routinely brushedunder the carpet. Recently, many of these institutes havedeveloped increased levels of independence. This, com-bined with strengthened capacities, means they are nowin a position to give objective and even challenging ad-vice to decision makers.
Another aspect of the growing numbers of more in-dependent expert institutions is that a competitive mar-ket for environmental knowledge and services is beingformed, where government agencies procure decisionsupport such as studies, investigations and feasibilitystudies on a contractual and increasingly also competi-tive basis. As a positive side effect, the evolution of amarket for environmental services has helped create ahigher level of professionalism in the environmental sec-tor.
Finally, the growing pluralism in the technical andacademic sectors has improved the opportunities forChinese institutes to network and collaborate with re-search institutes and consultancies around the world,where Chinese institutes have begun taking part in bidsfor overseas consulting as well as international researchassignments.
Two Steps Forward – One Step BackGovernance reforms—aiming as they do at the very heartof decision-making—are inherently time-consuming.Although the magnitude of challenges that lie ahead ishuge, one must esteem the remarkable progress that hastaken place over the last two decades. The massive sizeof the Chinese land and population is an often over-
looked factor—indeed hard to fathom—in determiningthe extent of, and speed by which new governance struc-tures may be put into place.
The preconditions for, and the clarity of decision-making vary considerably across the country, as well asbetween urban and rural areas. Urban people comparedto rural may be better informed with more opportunitiesto express their views through non-governmental net-works. But rural areas actually have better formal mecha-nisms for people to influence decision-making processesthrough the local democratic elections for village chiefsthat has been experimented and expanded throughoutthe country during the 1990s.
But good governance is also a matter of changing thedecision-making culture, and new governance structuresmay prove to increase demands on government officialsmore than new economic management systems can. Morecapacity is needed to manage participatory processes inorder to make them more transparent and the same goesfor working with and making the most of NGOs.
Future Trends and UncertaintiesChina is at a juncture of increased scarcity of naturalresources with declining environmental quality and in-tensified societal pressures. Good governance is essen-tial in order to come to grips with this and to steer thingstowards environmentally sustainable development.
Most governance indicators of present developmentsin China point in the right direction. These include ruleof law, government streamlining, the move towards mar-ket forces and increased private ownership, and greaterfreedom of self-expression, all of which are positive signsof a more efficient, transparent, and pluralistic govern-ance structure. New governance structures have begunto have positive impacts on the environment, e.g. recentmeasures to control logging and air pollution, partly aresponse to public and media campaigns. The WesternDevelopment Strategy has been presented in a moretransparent and accountable manner than earlier devel-opment initiatives, with sustainability at its core—at leastso far on paper.
Over the last two decades, China has suffered fromtaking “two steps forward and one step back” regardinggovernance reforms for sustainable development. Withall the many possible obstacles hindering progress, gov-ernance structures may well continue to develop muchin the same gradual way they have done since the late1970s. In terms of environment and natural resources,however, it is crucial that governance structures do con-tinue to undergo reform, in order for China to come togrips with the accelerating exploitation of scarce butunder-priced resources, the adverse result of a half-re-formed economy. Also decision-making processes needto be made fair and transparent, allowing for appropriate

China Human Development Report 73
The Society–Environment Nexus
con
t’d

Chapter 3
UNDP74
involvement of relevant stakeholders in a managed way.Only when this is the case, will decision-making becomeresponsible and self-correcting.
Still, there are threatening signs, such as increasedwater scarcity and inequity, and complete unknowns,such as large-scale natural/environmental catastrophesor deteriorating global politics, which could trigger a re-turn to the strict top-down structure of the past. Suchconsequences would turn the clock back on China farbeyond just the environmental issues.
China Human Development Report 75
Ongoing Response: Towards a Sustainable Future
Chapter 4
Ongoing Response: Towards aSustainable Future
The review and analysis of the “Society – environmentnexus” in chapter 3 provide some direction to identify-ing the strategies and measures required to reverse en-vironmental decline to help put China onto a sustain-able, human development path. In particular it arguesthat China can choose its own future and that continuedreform of governance and institutions is crucial in orderto navigate to a more sustainable future. It will obvi-ously be a complex and demanding task to manage thetangle of inter-relationships and feedbacks, while keep-ing one-step ahead and ensuring initiatives launchedtoday will still be appropriate for tomorrow’s challenges.This chapter describes and assesses ongoing efforts toput China on the right path.
The first section of this chapter provides an overviewof the administrative set-up of the country, while the twofollowing sections deal with the active responses bygovernment and various players in society to the chal-lenges described in the previous chapters. This leads tothe first section of chapter 5 which provides some foodfor thought as to whether these responses are optimal,or indeed sufficient, to keep China on a sustainable path.
4.1 China’s Environmental AdministrationChina first established an Environmental Protection Of-fice in 1974 as a follow-up to the 1972 Stockholm UNConference. Housed initially within the State Council,the Office was later moved into the Ministry of UrbanRural Construction and Environmental Protection, re-flecting the fact that environment was considered prima-rily an urban industrial issue at that time. In addition, in1984, the State Council established the State Commis-sion for Environmental Protection to co-ordinate envi-ronmental affairs among ministries. This implicitly rec-ognised that environment was not a separate sectoralissue.
The State Environmental Protection Administration(SEPA)This Commission was disbanded in 1998, by which timethe Environmental Protection Office had evolved,
through a number of intermediate stages, into a minis-try-level State Administration—the State EnvironmentalProtection Administration. SEPA has most of the respon-sibilities of an environment ministry, covering brown andgreen issues, policy making and monitoring, and co-or-dination of environmental affairs across ministries. Asimilar evolution in the environmental framework can beobserved at the provincial, county and township levels.By 2001, many agencies had clear responsibilities for theenvironment.
The National People’s Congress (NPC)NPC is China’s legislative body and the highest level ofpolitical authority. The NPC’s Environmental and Re-sources Protection Committee (ERPC) is responsible fordrafting legislation and the supervision of Governmentperformance in the environmental sector. The NPC andthe ERPC are far from the rubber stamp institutions theyused to be, and have during the 1990s developed into aforum for debate with environmental issues being ofparticular concern during NPC sessions.
The State Council—the Chinese GovernmentThe State Council under the present leadership of Pre-mier Zhu Rongji is responsible for the implementation oflaws and policies laid down by the NPC. The Councilconsists of four vice-premiers, the chairmen of govern-ment co-ordinating commissions, and the 29 ministersthat lead full-fledged line ministries. One of the vice-premiers, Wen Jiabao, is responsible for environmentalissues in the Council. Within the government, the high-est environmental executive body is SEPA. Though nothaving a permanent seat on the Council, SEPA’s Minis-ter, currently Mr. Xie Zhenhua, participates fully in Councilmeetings when environmental issues are discussed andaddressed.
Other MinistriesA number of state commissions and ministries have con-siderable responsibilities within the broad subject areaof environment and sustainable development (see box4.1). Over the years, these ministries have identified de-

Chapter 4
UNDP76
partments responsible for environmental issues and forco-ordination with SEPA. They have also strengthenedinternal capacity in this sector.
Local GovernmentsProvincial, municipal, and local governments issue envi-ronmental legislation and plans affecting their jurisdic-tions. Provincial environmental protection bureaus(EPBs), as well as county and municipal EPBs, overseecompliance with national and local-level environmentalstatutes, regulations, rules, methods and standards. Theydo not take orders from, nor answer to, SEPA – theybelong to local level government. SEPA has a limitedbudget, and little direct influence over provincial budg-ets. On the positive side, SEPA now participates in theselection of the heads of local EPBs.
Trends in Environmental AdministrationPolitically, SEPA enjoys the support of both the StateCouncil and the Communist Party, that share environ-mental concerns and recognise the importance of envi-ronmental protection to China’s future development. Re-cently, a dialogue mechanism has been establishedwhereby the President, the Premier, and other Cabinet
members sit down annually with SEPA officials to dis-cuss the strategy for environmental protection and thecountry’s sustainability. Such political support is essen-tial if SEPA is to effectively implement policies (Zhang,2001).
Improving its Position—But Still UnderstaffedIn 1998, at a time of general government downsizing,SEPA was upgraded to a semi-ministry level, with theminister reporting directly to the Vice-Premier in chargeof environmental protection. The change of status pro-vided SEPA with more leverage in its dealings with othergovernment departments and agencies, and enhancedits capacity to enforce environmental laws and regula-tions. Since this upgrade, SEPA has developed ambi-tious mid- and long-term plans. However, implementa-tion of the plans is constrained by serious lack of staffcapacity—the number of core staff is limited to 240 ascompared to the 6,000 staff of the Washington head-quarters of USEPA. Also capacity is lacking due to un-certain sources of finance, as well as limited leverageover local governments.
Box 4.1 Chinese Government Ministries and Agencies with Environmental Responsibilities
State Development Planning Commission (SDPC) has the mandate to control and regulate China’s macro economy andfuture planning, and assumes the main responsibility for sustainable development and the implementation of China’sAgenda 21. It is also responsible for regional co-ordination and plays a central role in formulating China’s position ininternational negotiations on climate change.
State Economic and Trade Commission’s mandate is to regulate the near-term operations of the national economy withfocus on industrial policies. As such, it has responsibilities within regulations of industrial pollution, and has relatedresponsibilities in the areas of environmental technology development, clean technologies, and energy efficiency.
Ministry of Foreign Affairs is involved in the negotiations and ratification of all international conventions and otheragreements, including climate change negotiations.
Ministry of Water Resources has responsibilities related to river basin management and water management outside ofurban areas.
Ministry of Construction has strong influence and responsibilities in urban infrastructure development, including wastewatertreatment and solid waste management.
Ministry of Agriculture assumes overall responsibility for most of what happens outside of urban areas, includingregulation of township and village enterprises.
Ministry of Science and Technology has a key role in sustainable development, is involved in climate change negotiations,and has responsibilities within technology research and development.
State Forestry Administration has significant responsibilities related to forest and wetlands management, and to biodiversityconservation.
State Ocean Administration is responsible for management of coastal and marine waters, including biodiversity conser-vation.
Ministry of Land and Resources is responsible for planning, administration, protection and rational utilisation of suchnatural resources as land, mineral and marine resources, including mapping and cadastral (land ownership) management.
State Meteorological Administration takes part in climate change negotiations, and has responsibilities in regional airquality management.
Ministry of Communications shares responsibilities with SEPA on vehicle emissions control, the implementation of whichfalls on the Public Security Bureaus.

China Human Development Report 77
Ongoing Response: Towards a Sustainable Future
Barter or Co-operation for the EnvironmentOver the past two decades China’s institutional frame-work has been broadened and strengthened, and is nowfar more responsive and capable of responding than wasthe case only a decade ago. However, serious weak-nesses do exist. A main limitation is collaboration acrosssectors—essential for making progress towards envi-ronmental goals. As box 4.1 well illustrates, mandatesrun across several agencies, often with unclear divisionof responsibilities. Whereas, for example, draft sectoralplans and policies should be reviewed by SEPA beforepassing them to the State Council for approval, SEPAstill yields little influence except on issues pre-selectedby the State Council. Most of the agencies listed in box4.1 are more powerful than SEPA.
SEPA has a cross-cutting mandate and needs to col-laborate to succeed. However, turf battles and competi-tion for funding make horizontal co-operation amongChinese government bureaus difficult. SEPA has madeefforts to increase its influence by improving collabora-tion with other ministries, in particular for biodiversityand conservation. At the provincial level, EPBs co-oper-ate increasingly with urban construction bureaus on ur-ban pollution control.
Yet, SEPA is challenged by its mandate to co-ordi-nate, as it is below ministerial level in many respects, andis considered somewhat of a “newcomer”. Moreover, itis often perceived by enterprises, local governments andproduction-oriented ministries as an environmental po-liceman trying to limit economic growth. Faced with thesereactions, SEPA often develops a defensive attitude, andsticks to issues it feels most comfortable with—those
which can be addressed without collaboration with otheragencies.
Power Moving Away from the CentreChina’s economic, social, and political reforms have in-fluenced environmental protection efforts. Provincialauthorities now have considerable power, for examplethrough issuing primary directives to local governmentand environmental protection bureaus. Provincial Plan-ning Commissions—belonging to the SDPC network—are intimately involved in project planning, especially inproject selection, design and approval stages. In eachprovince, the Party Standing Committee also influencesprovincial bureaus, including the Provincial EPBs. Like-wise, county and township governments have signifi-cant influence over the development process.
At the local level, the over-riding objective is eco-nomic growth. Local government officials gain legitimacyby increasing incomes, ensuring low unemploymentrates, and maintaining stability. Improving the local en-vironment offers few rewards to local officials. This “in-centive” structure may even apply to EPB staff. The re-sult is that local government officials often shun envi-ronmental protection responsibilities, and so local levelactivities do not reflect national priorities regarding en-vironmental protection (Lieberthal, 1997).
Political devolution and decentralisation has shiftedimplementation of environmental policies more towardslocal governments. Provincial, city, township and vil-lage governments, local environmental protection offices,and other local bureaus are now assuming greater re-sponsibility for environmental protection and resourcemanagement (Beach, 2001). In theory, the central gov-
Box 4.2 Sustainable Development and China’s Agenda 21
Sustainable development has grown into a key national development policy that enjoys strong backing from the politicalleadership.
After the United Nations Conference on Environment and Development in Rio, 1992, China was the first country to publisha national Agenda 21—an impressive work led by the SDPC and the Ministry of Science and Technology (MOST). Withsupport from UNDP, a white paper on China’s Agenda 21 was published in March 1994 (China’s Agenda 21, 1994) and aPriority Programme for China’s Agenda 21 consisting of 62 projects of demonstration character, building heavily on foreignsoft financial support.
The Administrative Centre of China’s Agenda 21 (ACCA21) was set up by the SDPC and the MOST for handling day-to-day work with regard to Agenda 21 implementation.
After the reconstruction of the ministerial structure in 1998, a new leading group for sustainable development has beenset up under the leadership of SDPC, and sustainable development is now a key national strategy. ACCA21 serves as asecretariat for China’s sustainable development, with the task to draft documents, plans and strategies, as well as reviewand develop new strategies for China’s Agenda 21.
China’s Agenda 21 work during the 1990s has been characterised by a top-down approach, but with experiences froma number of experimental community-based projects. The aim now is to localise future Agenda 21 activities and bring incitizens and NGOs in the work on the community level. All government departments and all provinces are expected to

Chapter 4
UNDP78
ernment could intervene at any time to prevent abusesat the local level. Yet, China’s enormous size and com-plexity makes thorough oversight difficult, if not impos-sible. Moreover, local and provincial officials complainthat they do not always know the content of the latestlaws and regulations, and they are unable to interpretthe laws they have access to. One result is that localregulations are often issued inconsistent with environ-mental targets.
4.2 Government ResponseIs the environment a priority for the Chinese govern-ment? Undoubtedly, over the past two decades, envi-ronment has been given increasing priority. In the 10th
Five-Year Plan (2001–2005), sustainable development isdesignated the “guiding principle and strategy” for thecountry’s economic and social development. The Planalso identifies environmental protection as a nationalpriority. Although not quite at the same level as eco-nomic growth or poverty alleviation, environment isfirmly a national priority. Within this, more specific envi-ronmental priorities and targets have been establishedby concerned government agencies, as illustrated in box4.4.
The list in box 4.4 exposes several of the challengesfacing the government. First, there are many such lists,issued at different times, by different departments. Al-though the lists are generally coherent, this may be con-fusing and may lead to difficulties in implementing pri-orities. Second, the list includes policy objectives, tech-nical targets, and implementation measures. This confu-sion between means and ends may make it difficult to actstrategically and sustainably address root causes. Third,this is only the environmental list. Although the StateCouncil issues general policy objective statements, itdoes not issue more direct targets, and there is a dangerof a disjunction between the State Council’s over-ridingobjectives, and the specific objectives of specific gov-ernment ministries and agencies.
Over the decades, the government has followed threeapproaches to addressing environmental challenges. Inthe early years, the government responded to key na-tional issues, for example acid rain or soil erosion, throughtargeted administrative and technical measures. Thiscampaign approach was inherited from the Mao era,when it was the central policy instrument, but has con-tinued to colour the way government conceives to meetvarious challenges to the present day. However, sinceChina embarked on the reform period in 1979, the leader-ship has been committed to a new approach, where alegislative and regulatory framework forms the basisfor government action. The third approach relies onmarket-forces and market-based instruments and hasbeen growing in importance along with the formulationof the “socialist market economy” that now constitutesa basic philosophy in the Chinese reform efforts.
The government has continuously revised andstrengthened its institutional framework for environmen-
Box 4.3 A Dangerous ProfessionViolations against environmental bureau officials prob-ably occur more than is reported. In Qinghai, a bureauofficial was probably killed by antelope poachers, de-spite the local government’s labelling his death as asuicide (McCarthy and Florcruz, 1999). SEPA has statedthat it cannot expect effective government managementfrom its officials if it cannot protect them from suchattacks.
Box 4.4 SEPA’s Environmental Goals for the 10th Five Year Plan
In line with national objectives, for the period 2001 to 2005, SEPA has identified the following specific environmentalobjectives (Zhang, 2001):
? reduce emissions of sulphur dioxide and total suspended particulates by 10 percent;
? alleviate water quality deterioration in the seven major river basins, major lakes, and key coastal areas;
? designate an increasing number of environmental model cities and counties as “ecological sustainable areas”;
? increase the national forest coverage from 14 to 19 percent;
? increase the percentage of land designated as nature reserves from 10 to 13 percent;
? control desertification and soil erosion;
? increase pollution control investment to 1.5 percent of China’s GDP;
? increase the number of “major cities for environmental protection” from 47 to 100;
? promote the use of cleaner energy sources - renewables, clean coal technology, and natural gas;
? pass the Environmental Impact Assessment Law, which would require all important macro-economic policies and keyregional development projects to complete EIAs; and
? consolidate TVEs in order to facilitate centralised pollution treatment.

China Human Development Report 79
Ongoing Response: Towards a Sustainable Future
tal management in order to implement these approaches.This section first describes this institutional framework,before discussing how each of the three approaches hasevolved over the years. The section ends with a discus-sion of environmental spending.
The First Approach: Campaigns and AdministrativeMeasuresIn the 1960s and 1970s the Chinese government’s mainapproach to economic and social challenges was throughcampaigns. In this approach, policies are set at the cen-tral level, and implemented through large governmentinvestment programmes supported by administrativecontrol measures and propaganda campaigns. This ap-proach dominated the response to environmental issuesin the early 1980s, and continues to be important today,particularly in some localities. The measures implementedinclude banning of activities, closing down of opera-tions, large-scale physical investments, and mobilisingthe communities. The approach is illustrated in the fol-lowing examples.
Pollution ReductionIn 1995 a series of geographical priorities were identifiedfor clean-up: three northern rivers—Huai, Hai, and Liao;three major lakes—Dianchi, Cao, and Tai; two controlzones—sulphur dioxide emissions and acid rain; onemetropolitan area—Beijing; and one marine area—BohaiBay. More than 1,500 separate projects have beenlaunched in support of these priorities, with an invest-ment totalling over 18 billion USD. These investmentswere accompanied by efforts to crack down on heavypolluters. Between 1995 and 2000, China shut down morethan 84,000 heavily polluting plants, including oil refin-eries, cement plants, thermal power plants, and metallur-gical mills. Most of the plants closed were privatelyowned small businesses scattered across the countryand far away from the reaches of state-sponsored infra-structure investments (SEPA, 2001).
A good case study is the Huai River. The call to “har-ness the Huai River” was sounded by the Chinese gov-ernment more than 30 years ago. The river, which runsthrough four provinces in China’s heavily industrialisedeastern coast, remains a major eyesore, despite years ofpollution control and reduction. More than 1,000 plantswere shut down in the end, as part of the “campaign tocontrol pollution plan” (SEPA, 2000).
Natural Resources ConservationIn the wake of the devastating floods in the summer of1998, the Chinese government renewed its attention tothe conservation of natural resources by issuing newdirectives to restrict logging and calling for wetland pres-ervation along the middle reaches of the Yangtze River.Wide-ranging banning and restrictions on logging were
issued, including bans along the upper Yangtze Riverbasin and the middle and upper Yellow River basin, aswere severe restrictions in the Northeast and the forestedregions of Inner Mongolia. Also, instructive measureswere used to change land-use, focusing on the conver-sion of steep cropland back to forestland.
These important administrative measures have beenbacked up by large investments. Some investments aresimilar to past methods used in the 1980s to reforest orre-grass land. For example, the “shelter forest program”has long been among the priorities, covering the North,Northeast, and Northwest of China, coastal areas, thePearl Delta, the Huai River basin, the Taihang Moun-tains, low-lying plains, the Dongting and Boyang lakes,as well as the middle and lower reaches of the Yangtze.Also, to tackle land degradation, anti-erosion has be-come a top goal to be achieved through afforestationprogrammes, improving pasture management schemes,terracing projects, silt dam construction, and policiesthat encourage removal of fragile land from cultivation.Those schemes now cover 41 percent of the eroded landin the country. Improvement in irrigation and drainagesystem, irrigation management, cropping pattern andmanagement are the main measures to control landsalinisation. A very successful effort, the schemes nowhave 70 percent of the saline land under control (HuangJikun, 2001).
Other related government funds focus on poverty al-leviation, transportation and education, indicating thatthe government recognises the need to address socialissues in conjunction with environmental improvement.Other programmes also aim to protect land resourcesand biodiversity through the setting up of more naturereserves. Between 1996 and 2000, China set up 1,000new nature reserves, covering 7.64 percent of the terri-tory, and 112 ecological pilot areas.
Western Development PlanRealising the importance of narrowing the gap betweenthe Eastern and Western parts of the country, the Chi-nese government has made the development of the Westa top priority for the coming decades. President JiangZemin declared that the Western Development Plan wascrucial to maintaining China’s stability and the Commu-nist Party’s hold on power, as well as to the “revitaliza-tion” of the Chinese people (He, 2001). This plan is ex-pected to include the construction of 35,000 kms of roadsand 4,000 kms of railways over the next decade, as wellas the construction of a 14 billion USD, 4,000-km gaspipeline linking Xinjiang to Shanghai.
Part of the plan also focuses on ecological and waterresources construction in the West and Northwest. Thegovernment is expected to spend 200 billion yuan in eco-system and environmental protection, natural forest con-

Chapter 4
UNDP80
servation, returning steep cultivated land back toforestland or grassland, and controlling desertification.It is believed that the actual investment could be muchhigher, when increasing interests from both China andabroad are attracted to protecting the region’s ecosys-tems.
Energy Conservation and EfficiencySince the early 1980s, China has adopted a series of poli-cies and programmes to promote energy efficiency andconservation across different industrial sectors. Duringthis period, more than ten percent of government invest-ments was put into energy-targeted energy efficiency.In the coal sector, thousands of small mines were shutdown. Policies in the power sector to eliminate small gen-erators reduced net growth in electricity generation andslowed growth in coal use by getting rid of inefficientunits. Residential use of coal also fell as urban dwellerswere encouraged to switch to gas and electricity for cook-ing and water heating and as more people moved intoapartments with central heating. These measures con-tributed substantially to reductions in energy intensityof the economy during the decade, even though theeconomy grew at a double digital rate. It should be noted,however, that administrative measures in this sector havebeen strongly supported by regulatory and market-trans-formation measures (Sinton, 2001).
Campaigns and Administrative Measures—Pros andConsThe above examples reveal how the campaign approachhas evolved over the years. In the 1970s, campaignswere often sectoral and relied purely on administrativebans and investments. Increasingly, they have becomeinter-sectoral, relying also on a regulatory framework,and complemented by social measures. This “campaign”approach has contributed greatly to improving someaspects of the environment. Its main strength has beenits power to mobilise a broad and deep support fromacross society to address a key issue, often in supportof a magic number or a patriotic slogan. Another strengthis that it ensures the focus of efforts is on issues thatmatter to people—such as pollution—rather than ontechnical challenges or means—such as emissionsstandards. Also, given the size and complexity of China,it has not been possible to address all issues all over thecountry simultaneously, and campaigns help set priori-ties.
There are weaknesses with this approach. In the past,it has not been clear how priorities were set and cam-paigns initiated. This may have been largely through aclosed political process, rather than based on social oreconomic priorities. Without appropriate checks andbalances, in some cases the methods and priorities may
seem ad hoc. Also, monitoring of programmes has beenweak. Implementation starts up with a flurry, but once anissue becomes less fashionable, implementation may fadeaway. This is demonstrated by the re-opening of manyof the closed polluting plants with the support of thelocal governments. Also, once an issue is identified, in-sufficient thought is given to determining the most cost-effective method to achieve the goals and there is anautomatic focus on big spending schemes (see section5.1 for more discussion on this). Campaigns tend to workagainst sectoral co-ordination, as one agency is respon-sible for each campaign, whereas sustainable develop-ment requires a co-ordinated, integrated approach. Fi-nally, the ad hoc nature of campaigns makes it difficultfor private sector and some government agencies to an-ticipate their start-up and finish.
The Second Approach: Legislative and RegulatoryFrameworksSince the beginning of the reform period, China has beentaking steps to complement and then replace campaignsand administrative measures with a legislative and regu-latory framework as a foundation for economic and so-cial behaviour. Two decades of building a legal systemhave yielded an impressive amount of laws, regulations,and standards in a way that has truly changed basicrules in Chinese society. Still, 20 years is a short time forbuilding a legal system, so the system is still far fromcomplete, and the speed with which it has grown has leftsignificant imperfections behind.
Still, the work so far to create a legislative and regula-tory framework carries an imprint of the fact that cam-paign and administrative measures have continued toplay an important role as a tool for environmental ac-tions, and legislation has therefore often been accompa-nied by large-scale government-funded investment pro-grammes. For example, the government complementedthe air and water pollution bills by investing heavily inair and water pollution control, and closing down manypolluting enterprises. In a period of transition from com-mand-and-control to a more market-oriented society it islikely, however, that these combined measures have beenthe best possible choice.
Blizzard of LegislationSince the promulgation of the first Environmental Pro-tection Law in 1979, China has adopted and enacted morethan 20 statutes on pollution control, natural resourceconservation, and human health and safety. In addition,dozens of regulations, procedures and initiatives, as wellas hundreds of standards have been passed. Most re-cently, the Air Pollution Control and Prevention Lawhas been amended, and will be followed by two morestatutes—the Environmental Impact Assessment Law

China Human Development Report 81
Ongoing Response: Towards a Sustainable Future
and the Clean Production Law. In comparison, over thelast four decades the United States has ratified only 21major environmental acts. Box 4.5 provides an illustra-tion of the hierarchy of key environmental laws and regu-lations, and an indication of how national and local lawsinterrelate.
Impressive in sheer quantity, the Chinese environ-mental legislative framework has grown into a bush veg-etation of different legal acts and other semi-legal docu-ments of various dignities, many of which are not wellharmonised with each other. An effort to weed out legis-lation that is obsolete or even contradictory would helpmake the legislative framework more efficient.
Improving the QualityBuilding a legislative framework is an ongoing process,and the trend now is to improve the quality of environ-mental legislation.
First, an increasing number of laws and regulationstake into account the fact that China is moving away
from a centrally planned economy, and Chinese enter-prises are learning to be more responsive to changes inmarket and pricing mechanisms.
Second, in the past, the regulatory system focusedalmost entirely on the control of emission concentra-tions, which allowed enterprises to avoid problems bydiluting their emissions. Pollution control efforts aremoving from controlling the concentration to control-ling total emission loads. This has a more direct linkwith the ambient environmental quality—the ultimateobjective of policy. Notably, two of China’s pillar envi-ronmental protection laws—the Law on Water Pollu-tion Prevention and Control and the Law on Air Pollu-tion Prevention and Control—were recently amendedto include the concept of total mass loading. The April2000 amendment of the Air Pollution Law stipulates thattotal emissions control be implemented for acid rain andsulphur dioxide control zones and areas not in compli-ance with ambient air quality standards.
Box 4.5 Environmental Legislation and Regulation in China
State Constitution (1982)(especially articles 9, 22, and 26)
Basic LawEnvironmental Protection Law (1979, amended in 1989)
Specialised LawsLaw on the Prevention and Control of Air Pollution (1995, amended 2000)
Law on the Prevention and Control of Water Pollution (1996, amended 2000)Law on the Prevention and Control of Solid Waste Pollution (1995)
Law on the Prevention and Control of Noise Pollution (1996)The Marine Environmental Protection Law (1982)
The Criminal Law
RegulationsIssued by national ministries and bureaus,such as SEPA, includes regulations like man-agement procedures for environmental pro-tection of construction sites
Local RegulationsIssued by provincial, municipal and local admin-istrative agencies to adapt national statutes tolocal conditions; approved by provincial and lowerlevel peoples congresses
Site Standards
Ambient Standards MeasurementStandards
Emissions Standards
Ministerial StandardsInvolves measurement proceduresand equipment performance crite-ria for specific industries
Local StandardsPrimarily involves the setting ofgeographical boundaries for ambient andenvironmental quality standards
Adapted from ERM China, 1998

Chapter 4
UNDP82
Third, efforts are being made to enhance the trans-parency of environmental lawmaking processes by in-viting feedback from the public. This helps lawmakerskeep up to date with the changes that are taking placeacross industries and in the marketplace. During theamendment process for the Law on Air Pollution Pre-vention and Control, for example, public hearings wereconducted to present the lawmakers with opportunitiesto hear comments from the general public. Finally, in itsefforts to strengthen law enforcement, the NPC has re-vised the country’s criminal codes so that people heldresponsible for damaging certain kinds of environmen-tal and natural resources can be prosecuted. Many suchcases have been reported in the media.
Problems with the Legislative FrameworkThe legislative framework faces the twin, inter-relatedproblems of an incomplete framework and low enforce-ment rates.
A close analysis of the volumes of legislation issuedover recent years reveals many contradictions in the laws.Notably, there is no clear delineation of roles and re-sponsibilities among central level agencies, nor betweencentral and local level agencies. The Constitution de-clares that the State shall protect and improve the envi-ronment, but little guidance is given on who should dowhat. Hence turf battles remain, for example, regardingwho is responsible for wetlands management, or amongthe many agencies involved in water supply and sanita-tion.
In addition to the many contradictions, the existinglegislation is often vague. There is considerable scopefor interpretation by local level officials, and conse-quently implementation is often negotiated on a case-by-case basis. Thus local officials, when faced with atrade-off between short-term economic gain and non-monetary, long-term environmental impacts, will oftenrule in favour of the former. Another critical gap is thatmost legislative efforts have focused on industrial pol-lution. As yet, there has been insufficient legislation fo-cusing on urban environment or on challenges to thenatural resource base.
Enforcement can be difficult because a number of lawsand regulations set impossibly high standards for com-pliance. The Law on the Prevention of EnvironmentalPollution Caused by Solid Waste, for example, requiresthat measures be taken for the “safe disposal” of wastes,though solid waste and hazardous waste treatment fa-cilities are virtually non-existent in many locations. Like-wise, municipal bans against polystyrene food packag-ing came into force before any packaging alternativesbecame available.
There is also an obvious gap between standards forambient environmental quality, which are at least in line
with WHO guidelines, and the regulatory tools providedto control emissions and conserve natural resources.The latter are insufficient to make polluters reduce emis-sions to the level needed to reach the ambient stand-ards.
These problems are exacerbated by national and lo-cal-level capacity constraints. With the rapid and sig-nificant changes taking place in China, it is a challengefor lawmakers to simply understand the nature of thesechanges and their legislative needs. Other constraintshindering effective implementation of environmental lawsrelate to local government capacity, such as lax fiscaldiscipline, the lack of proper accounting of local finances,poor administrative capacity, and insufficient technicaltraining of government employees.
The Third Approach: Using Market ForcesAcross the world, market-based instruments (MBI) areused increasingly as a way to stimulate clean economicbehaviour. It is generally considered that in order forMBIs to function, two necessary—but not sufficient—conditions must be satisfied. First, the economy shouldbe market-oriented and second, regulatory frameworksshould be reasonably well established. Despite China’slimited progress to meet these conditions through the1990s, it has increasingly experimented with and devel-oped MBIs to complement campaigns and legislativemeasures. The impact of some of these experiments isdiscussed as follows.
The Polluter-Pays-Principle and the Idiosyncrasies ofChina’s Pollution Levy SystemEarly in the reform period, China developed a pollutionlevy system based on the principle that polluters, whenforced to pay for their pollution, would be motivated toinvest in pollution control. Covering wastewater dis-charges, industrial waste gas emissions and dust, andindustrial solid wastes and noise, the levy systemcharges fees for pollutant discharges and provides pen-alties for emissions above certain levels. Some provinceshave also started charging for sulphur dioxide and totalemissions.
After nearly two decades, several major shortfalls canbe identified in the system and its enforcement. The levelof the fee charged is too low to provide incentive toenterprises to reduce pollution. Enterprises generallycarry on polluting and sometimes pay the levy. The WorldBank noted in one study that the air pollution levy trans-lates into a value of a single life for urban residents of270 USD.
Also, the charges are linked to the regulatory frame-work, and so, based on pollutant concentration ratherthan on total emissions. Enterprises can thus dilutewastewater to avoid paying the charges, and therebywaste scarce water resources.

China Human Development Report 83
Ongoing Response: Towards a Sustainable Future
But the most peculiar problem with the pollution levysystem is that the EPBs that collect the fees throughenvironmental inspection are also largely financed bythe same fees. These fees are a main source of financingfor environmental authorities. The authorities keeptwenty percent of the revenue for their own administra-tion. The remaining eighty percent goes to an environ-mental protection fund—managed by the EPBs—whichis used to subsidise environmental investments in thevery same companies that have paid the levies. Hence,the local EPB may actually be pleased to see higher pol-lution—in order to collect higher fees. Meanwhile, thepolluter is also pleased, since its operational costs re-main low and it remains on good terms with the EPB.
So, what on paper may look like a polluter-pays-prin-ciple is more of an administrative mechanism that trans-fers some money from polluters to EPBs, which thendistributes some of this money back to the polluters inthe form of subsidies for environmental investments—amoney circuit which is in direct conflict with the pol-luter-pays-principle. What these funds have providedthough is a financial basis for the burgeoning environ-mental administration. In an economic context where firmsare not strongly exposed to market forces, and wherereal markets only exist weakly, this kind of regulation cancreate perverse results.
TaxationThere is also a lot of discussion on the suitability of feesversus taxation. Tax collection ostensibly would providethe central government with more resources to back itsenvironmental policies, and to reduce corruption andinconsistent local level enforcement. There is opposi-tion to the introduction of an environmental tax withinthe government, so it is a wait-and-see situation for thetaxation issue to unfold. However, in 1999, the NPC ap-proved a controversial fuel tax—part of the HighwayLaw passed in October 2000—which was to replace anumber of often arbitrary fees assessed on vehicles. Someof the proceeds from this tax may be used to fund im-provements in vehicle emissions.
Pricing Energy and WaterAs part of the legacy of the planned economy, China’senergy and water supplies are priced far below the envi-ronmental costs of using these resources, and even be-low the production cost. The situation is being rectified.One of the motivations behind this is the need to im-prove the environment—although cost recovery andeconomic efficiency are the most important motivations.
Additional fees are now beginning to be levied onwater supply, wastewater treatment, and solid waste dis-posal. According to the “Notice on IncreasingWastewater Treatment Fees and Establishment of Cen-tralised Urban Wastewater Treatment Systems”, effec-
tive since November 1, 1999, municipal utilities have beencharged with the responsibility to collect wastewatertreatment fees and water supply fees from the users on amonthly basis. The funding will be channelled to financethe construction of wastewater treatment facilities. As aresult, the price of water supply in Taiyuan, Shanxi Prov-ince, has quadrupled to provide funding for water treat-ment. Tap water prices in Shanghai have risen by be-tween 25 to 40 percent to fund water quality improve-ment and sewage treatment projects. A host of othercities are following suit (WRI, 1998).
Energy pricing is still the greatest shortcoming inChina’s energy conservation policy. Current pricingpolicy does not reflect the environmental costs relatedto sulphur and ash content of coal. Many small minesignore safety regulations and environmental damage,selling cheap, dirty coal. Administrative interventionshave kept the price of natural gas low, such as pricesubsidies for the chemical fertiliser industry and for resi-dential use, but at the expense of depriving the industryof the capital it needs to grow in order to replace coal.
Emissions TradingAs mentioned above, China’s pollution control effortsare moving from controlling the concentration of pollut-ants in emissions to controlling total pollutant emissions.Since the early 1990s, numerous pilot projects have stud-ied and tested the applicability of this total emissionscontrol strategy and explored possible policy instru-ments to assist in its implementation. One such policyinstrument, applicable notably to pollutants with a smallnumber of large sources, is an emissions trading system.In this system the government may issue permits to en-terprises to emit given quantities. Those enterpriseswhich cannot keep emissions within their permitted lev-els can purchase, at a price set by the market, additionalemission quotas from other enterprises.
Emissions trading provides an economic incentive toenterprises to use less polluting and low-cost technolo-gies. Pilot projects, such as described in box 4.6 will yieldexperiences and important insights. But overall, lack ofeffective policy tools hinders the implementation of thetotal emissions control as well as emissions trading. Inother countries, a permit system has operated success-fully for several years before introducing a permit-trad-ing system. A successful permitting and trading systemrequires well co-ordinated efforts among a large numberof interests and government agencies ranging from plan-ning, to finance and environment. And successful trad-ing needs complete information on the quantity of pollu-tion emissions across all sectors. This is a difficult tasksince the existing pollution emissions data have not cap-tured the extent of pollution from TVEs.

Chapter 4
UNDP84
The Future of Market-based InstrumentsThere is a keen interest for market-based instruments inChina, as expressed by the flurry of enthusiasm amongenvironmental officials for buzzwords such as PPP—thepolluter-pays-principle—or emissions trading. An ini-tial look, however, reveals two basic obstacles to suc-cessful use of market forces in controlling environmen-tal behavior. First, the absence of a mature market situa-tion in the Chinese economy limits their use. Second, alack of understanding for fundamental market principlesamong Chinese environmental officials tends to producemechanisms which are in fact administrative measuresdressed up as market-based instruments.
Still, as the Chinese economy matures and adopts astronger market profile, and as the capacity to designand implement market-based interventions growsstronger among the Chinese administration, these are
likely to become the basis for environmental administra-tion in the not too distant future. The economic futuresof the two scenarios dealt with in this report can be de-scribed as in Scenario Box 4.
Rising Environmental SpendingGovernment or public financing has long been the mostimportant source for environment and conservation fi-nancing. Under a centrally planned system, the statetakes responsibility for environmental protection. Eventhough the economy is becoming increasingly market-oriented, rough estimates show that public financing stillaccounts for 70 percent of the total environmental fi-nancing.
Official figures reporting China’s environmentalspending have shown impressive growth over the lasttwo decades, from barely 0.7 percent of its GDP in themid-1980s to one percent in 2000. It is expected to rise toabout 1.5 percent by 2005. Government spending jumpedlargely in 1998 and 1999 due to the government’s eco-nomic stimulus programme, which features large in-creases in fixed capital investment thanks to a 12 billionUSD bond issue aimed at investment in infrastructure.According to the Asian Development Bank, about tenpercent of that bond issue was invested in environmen-tal infrastructure facilities (Baldinger, 2000). Despite thislarge state spending, ambitious programmes are con-strained by the limited availability of public financing forthe growing environmental challenges.
Moreover, official figures on environmental spend-ing depend very much on the definition of an environ-mental project. Incentives may exist to label a project“environmental”, especially at the local level. Local gov-ernments have guidelines on how much of their budgetto spend on the environment—and this may not be inline with their own priorities. With slack reporting andmonitoring requirements, local governments could chan-nel funds to physical infrastructure or employment-gen-erating projects, and label these “environmental” in or-der to meet their quotas. Hence, a main task of SEPA hasbeen to push each level of the government to increasethe investment in environmental protection.
The central government channelled much of the rev-enue from the 1998-99 bond sales to provinces for infra-structure investments. The main objective of such “lend-ing and spending” was to generate employment and eco-nomic growth. However, these measures may prop-upinefficient production units and distort the market, andso run counter to the market and financial reforms re-quired in China. As is noted in other sections of thisreport, establishing a market structure is probably therequired measure leading to long-term environmentalprotection.
Box 4.6 Trying Emissions Trading
A project piloting sulphur emissions trading is now be-ing carried out in two medium-sized cities—Benxi ofLiaoning Province and Nantong of Jiangsu Province—as a collaborative effort between Chinese and Ameri-can experts. In Benxi, the team works with local gov-ernment and enterprises to develop cap and emissionstrading rules and procedures, thus creating a legal ba-sis for total emissions control to provide co-ordinationamong existing environmental policies, to establish emis-sions measurement and reporting protocols, and to pro-mote compliance (Dudek et al., 2001). While in Nantong,the team has developed emissions trading between apower plant and a light manufacturing facility underexisting administrative regulations. The trade allows acellulose manufacturing plant to expand its operationsby acquiring offsetting emissions reductions from anearby power plant.
Box 4.7 Exploring the Market Mechanism
Market-based mechanisms and instruments are on thelips of very many environmental officials today and a lotof discussion and testing is being carried out. The morecutting edge market-based channels being consideredor tested include collecting fees through pricing the useof utilities and goods at market values e.g. drinking wa-ter; and payments transfers between downstream andupstream, or between industries and local communi-ties, such as a hydropower station in a reservoir inGuangdong that pays the forest owner in the upperwatershed in order to prevent soil erosion andsediments in the reservoir. Most of these initiatives arestill in early testing stages, but they are expected tobecoming more prominent tools in the near future (Sun,2001).

China Human Development Report 85
Ongoing Response: Towards a Sustainable Future
In 1983, the State Council, in order to raise more envi-ronmental financing, issued “Decisions on Environmen-tal Protection Work”, in which it specified eight environ-mental financing sources. The relative use of thesesources has shifted in recent years, reflecting a generalshift towards the polluter-pays-principle in China (Wanget al., 2000). This complex array of financing mechanisms,tools and subsidies makes it difficult to quickly channelfunds to meriting projects. At the same time, this makesit possible to channel environmental protection funds toother purposes.
Throughout the 9th Five-Year Plan, 1996 – 2000, thegovernment used a large and growing number of infra-structure projects to improve environmental conditions.
For example, the central government is significantly in-creasing its investments in large-scale ecological con-struction projects. The Reforestation and Greening Pro-gram in the Yellow and Yangtze watersheds involves astate investment plan of over 12 billion USD to be usedfor tree planting and other ecological restoration effortsand began in 2000. An Ecological Compensation Fund,approved recently by the State Council and funded bythe Central Financial Transfer, is going to raise two bil-lion yuan each year for managing and protecting theforests classified for nature reserves and water resourceconservation (Gao Yuying and Liu Jinfu, 2002; Depart-ment of Policy and Legislation officials, State ForestryAdministration, pers comm.)
The Perilous Path Scenario
The ongoing process of globalisation and the gradualspread of the dominant economic values and consump-tion patterns of industrial societies shape the future ofChina in the early 21st century.
As the country moves towards a market-orientedeconomy, the share of state-owned enterprises contin-ues to decline, and the government continues to recedefrom economic management, granting micro-economicdecision-making authority to private corporations.
In this environment, the strategy of “get rich fast – cleanup later” continues, resulting in increasing severity ofenvironmental degradation. Distorting subsidies in theprices of water and energy that do not account forscarcity and externalities further exacerbate environ-mental conditions.
Economic growth continues to be robust, although at arate lower than the 8 to 10 percent experienced in thelate 20th century, with GDP per capita increasing on theorder of 3 to 4 percent per year through 2050. Growth isdriven in part by the increase in personal consumption inChina. However, income and consumption continue tobe unevenly distributed, both between and within re-gions. The western half of China and poorer populationsin the east are particularly disadvantaged.
Rural communities continue to struggle with a lack of themost basic services. The environment, already suffer-ing from serious impairment, as described in chapter 2,is further degraded, as the poor are forced tounsustainably exploit land, water and forest resources.
Environmental impact per unit of activity generally de-creases as technology becomes more efficient and pol-lution control improves. But the exponential increase inthe scale of activity overwhelms these improvementsand the overall demand for resources and level of envi-ronmental pressure continues to rise.
SCENARIO BOX 4 CHOOSING A FRAMEWORK FOR ECONOMIC CHANGE
The Green Reform Path Scenario
As the new century unfolds, the gradual deepening ofenvironmental and social stresses are seen to be a Per-ilous Path for the country, prompting a popular outcry fora new development strategy – one that more truly em-bodies the “economy and environment developing in tan-dem.”
The market framework predominates, as a tool for pro-moting efficiency, but the workings of the market aresteered towards a sustainable path. Chinese authoritiesuse an array of market-based incentives to spur “green”behaviour and to finance cleanup and prevention. Sub-sidies on natural resources such as water and energyare lifted, and the prices begin to reflect the true costs oftheir use, including environmental externalities.
The market economy favours the service sector, whichis generally less resource-intensive and polluting thanthe industrial sector that dominated in the previous cen-tury, thus further reducing the burden on the environ-ment.
There is an emphasis on “green” growth. Environmentalindustries that have both regional and global impacts aresignificantly developed, leading ultimately to the improve-ment of environmental standards for products and serv-ices on a broad level.
Technological progress, especially in the fields of en-ergy efficiency, transport and information technology,helps secure economic growth without environmentaldegradation. The impact of industrialisation and urbani-sation on the environment is tackled seriously in a seriesof policy reform packages that effect substantial gains.
The policy of food self-sufficiency is fully replaced by apolicy of food security, thus reducing the strain placedon the environment by agriculture – particularly irrigatedagriculture – while the transition from collective to pri-vate ownership prompts long-term investments in pro-tecting land resources.

Chapter 4
UNDP86
Funding for environmental infrastructure projects al-ready comes primarily from the local level. But munici-palities are restricted in their ability to generate funds.They do not yet have the right to issue their own bondsto finance local construction. In line with the transitionfrom the campaign approach to a legislative and market-oriented approach, it should be possible to implementthe polluter-pays-principle in reality, where enterprises—and ultimately consumers—pay for environmental im-provement directly. For example wastewater treatment isa profit oriented service produced by the private sectorin an increasing number of countries, and not an issuefor governments to resolve through public spending,although it is still regulated and monitored by govern-ment agencies. Resources could also be mobilised bysetting up a national environmental investment fund;using bond and stock markets to promote green invest-ment; attracting more FDI to invest in environmental in-frastructure; and encouraging privatisation of environ-mental services and facilities.
4.3 Non-government ResponseWhereas the government has been and remains the lead-ing actor on the Chinese environmental stage, other ac-tors are slowly emerging. The media, academic institutes,non-profit organisations, the business community, andthe general public are all forces for environmental change.The government generally recognises the potential ofthese alternative forces, and, as can be seen by the sec-tion below, is taking steps to encourage it. The sectionsthat follow discuss the roles played and challenges facedby the different non-governmental actors in the envi-ronmental field. The governance aspects of the two sce-narios dealt with in this report are described in ScenarioBox 5.
Government Increases Dialogue with Civil SocietyRecently, government officials, particularly from SEPA,have begun to hold the stakeholders of Chinese societyresponsible for pollution prevention, control and reduc-tion. This partly reflects recent government downsizingbut it is also a result of the recognition that, if wiselymanaged, stakeholders can help the government achievesocial goals such as improving the environment. In the1990s the government increasingly developed the skillsand capacity to work with other forces in society toachieve its goals. In the environmental sector, it is ex-perimenting and developing the skills to manage andutilise, rather than control, the pressures for changeemanating from outside the existing political framework.
Facilitating Information AccessBarriers are being dismantled to facilitate public accessto government information. SEPA has opened itself to
the public since the late 1980s, making information avail-able related to its organisation, staff, structure and workprocedures. Information on policies and practices, forexample levels of levy charges and pollution penalties,is no longer confidential. According to media reports,the resulting increase in public attention has reducedthe abuse of power and misuse of pollution charges.Tests on public access to information have been con-ducted in five counties in Jiangsu, Shaanxi, and LiaoningProvinces. The initiatives are currently being expandedto the cities of Shanghai, Tianjin, Chongqing and prov-inces of Hebei, Heilongjiang, Anhui, Shandong, Hubei,Guangdong and Jiangxi. Similar initiatives are being pro-moted nationwide in 2002.
Environmental HotlinesAt the provincial level, direct telephone hotlines throughwhich ordinary citizens can report environmental viola-tions have been opened. This has proved to be one ofthe most cost-effective ways to strengthen law enforce-ment. In 2000, the public reported more than half a mil-lion violations through the hotline, and more than 90percent of these cases were processed. Hebei provincialgovernment has set up a special fund of five million yuanto reward reports that lead to conviction of the mostserious environmental violations. This practice is spread-ing to other levels—upwards and downwards. SEPA isconsidering setting up its own national level environ-mental hotline. By the end of 2001, local environmentalprotection administrations above county level were ableto receive violation reports from the hotline. The publicwith access to the Internet are able to check the status oftheir reports, and follow up.
MediaThrough the 1990s, Chinese media has become increas-ingly independent of direct government pressures, andmore responsive to market forces and sales. Increasingly,media has to address issues in which their audience isinterested, in order to remain commercially viable. Oneresult of this is that environment is now a staple part ofthe Chinese media, as the public want information ontheir environment. For example, in 1996, the seventy majornewspapers published over 17,000 stories on environ-ment (Wen, 1998). This represents a dramatic turnaroundcompared to only a decade earlier. Media campaigns havebeen organised every year to support the government’senvironmental initiatives. A considerable number of vet-eran journalists familiar with environmental coverage hasemerged.
The China Environmental News (CEN) and ChinaGreen Times (CGT) are the two major newspaper outletsdedicated to environmental issues. Though both are af-filiated with the government—CEN with SEPA and CGT

China Human Development Report 87
Ongoing Response: Towards a Sustainable Future
The Perilous Path Scenario
The emphasis on economic growth allows groups inChina that benefit from market-driven development tomaintain a strong influence with the central government– a continuation of patterns seen at the end of the 20th
century. Concerned with the threat to their incomes, thesevested interests successfully thwart major efforts toreduce the degradation of the environment.
The Chinese public continues to perceive environmentalprotection and preservation as a role for the central gov-ernment, and not one of personal responsibility. Addi-tionally, there is a perception that environmental prob-lems are a necessary concomitant of economic growth.
Aspirations for a Western lifestyle continue to dominate,and although the ability to reach that lifestyle is limited toonly the wealthy part of Chinese society, the sheernumber of people in that group results in a significantincrease in energy use, solid waste production and airpollution. Incentives for private investment in developingtechnologies to address the pressing environmental is-sues are low. Government investment in relevant re-search and development is also low, and such invest-ments are viewed as too risky for the private sector.
Non-governmental organisations, which were steadilygaining acceptance in the early part of the 21st century,are able to address very localised environmental prob-lems, but not the larger issues, such as energy andtransport policies. The government actively preventsNGOs from reaching a national audience, and silencesquestioning of political processes. NGOs therefore re-main largely irrelevant as forces for change in the eco-nomic, social or environmental arenas.
The public has a growing awareness that the degradedenvironment is having negative impacts, particularly withrespect to health. But the political climate remains unre-sponsive to public debate, and there are no alternativechannels for people to express their concerns. There isan increasing distrust among the public that the govern-ment will protect its interests. Signs of political and socialinstability increase to near crisis conditions by 2050.
The Green Reform Path Scenario
The Beijing Green Olympics Campaign results in increas-ing public awareness of the social and economic con-sequences of environmental degradation.
There is a shift in the social climate toward one thatencourages public debate. Civil society responds by be-coming more engaged, drawing in many actors. There isa mushrooming of NGOs. The academic community playsan active role, with the Chinese Academy of Sciencesserving to manage and disseminate knowledge. Busi-ness also actively participates, seeking to promote trans-parency and participatory processes in the governingof the nation.
Eventually, the Chinese government responds by re-evaluating the path of economic growth taken in thepast, and looking for mechanisms to increase the de-gree of partnership with citizens, corporations and NGOs.
By 2010, with increasing support from citizens, centraland local government organisations begin to promotebroader access to health and education, particularly inrural and low-income areas. Issues of wealth distribu-tion are discussed in public fora in an attempt to reduceinequalities and social conflict. These discussions leadto pro-active government policies to share more equita-bly the benefits of the changing economy.
Citizens are empowered by the greater recognition fromthe central government and the feeling that they have agreater stake in the well-being of their environment. Thisis bolstered by a return to traditional Chinese values forthe land and the environment. These forces act to initiategrassroots movements for environmental conservation.The aspiration for Western lifestyles is tempered by thesenew values and a respect for non-material values – thebeauty of the environment, personal fulfilment and theimportance of community.
With higher awareness of the public on environmentalissues, China also starts implementing policies to im-prove degraded environments. Although some of theecosystem and biodiversity losses from the previousdecades are irreversible, by 2025 there is some resto-ration and the human impact on the environment de-creases as a result of the integrated economic and en-vironmental policies. By 2050 China takes a leading rolein engaging the region in dialogues on sustainable devel-opment.
SCENARIO BOX 5 CHOOSING A PATH OF GOVERNANCE
with the State Forestry Administration, their editorialboards enjoy considerable freedom in what to publish.Importantly, their operating expenses are covered mainlyby revenues from advertising and distribution.
The media enjoys considerable flexibility in its envi-ronmental coverage, in part explained by the fact thatthe government believes that such coverage can be usedto promote its environmental agenda. Pollution data for47 major cities are regularly made public through themedia. News organisations have also collaborated with
the government in creating a national “ésprit de corps”,which can be seen in numerous cases such as the forcedclosing of a rural polluting factory, illegal logging andpoaching.
Overall, the response of the media to the environmen-tal challenges has been serious and it has become a ma-jor force for positive environmental change. Howeverthe media in China remains strongly supervised, and in-dividual publications know the limits they face in report-ing on controversial issues.

Chapter 4
UNDP88
Institutes and Think-tanksIn the past, Chinese environmental research was mainlyconcerned with natural science and technology issuesconducted in academic seclusion within universities orinstitutes under the Chinese Academy of Sciences. GivenChina’s isolationistic background and the language bar-rier, exchange with international academic communitieswas also limited. More applied environmental research,particularly policy-relevant, was carried out in institutesthat belonged to government ministries and agencies.Still, there was some limited room for independent re-search, and environmental research and studies basedon social sciences.
Slowly, these institutions are gaining capacity andability to influence. Most do not play an official role indetermining environmental policy, but they assume astronger role in advising the public, government andprivate sectors. The formation that we see today of inde-pendent or semi-independent research institutions andthink-tanks is partly the result of the increasing demandfor independent expert services that has been generatedby sharpened environmental policy and legislation, suchas environmental impact assessments. But the explosionof international academic exchange and the involvementof Chinese experts in environmental development co-operation projects have also played a decisive role increating an atmosphere of more independent, criticalthinking.
For example, the Rural Development Institute of thePeople’s University in Beijing is one of many educa-tional institutions that combine academic research andrural development project experience in China’s interior.The Beijing Environment and Development Institute(BEDI) was established in 1995 by Ma Zhong, a profes-sor of economics, with institutional support from thePeople’s University. BEDI focuses on applied researchon environmental issues and seeks to encourage mar-ket-based tools to tackle environmental problems. BEDIwas instrumental in the re-evaluation of developmentplans in Heilongjiang’s Three Rivers Plain region, wherewetland preservation and agricultural development comeinto direct conflict.
Regionally-based institutions, such as the ChineseAcademy of Sciences’ Institute of Geography and theNortheast Normal University’s Institute of Environmen-tal Sciences, both based in Changchun, Jilin Province,also have impressive research and training agendas, andhave been quite responsive to the specific regionalneeds.
Government restructuring of 1998, when central gov-ernment ministries and agencies were downsized by half,was largely a matter of detaching the numerous ministe-rial research institutes from the government payroll, with
the result that these institutions have to survive on thesame conditions that similar policy think-tanks do aroundthe world by selling their expert services. Now, thesegovernment centres are becoming increasingly independ-ent from government support and control. Many of themhave gained something akin to NGO status.
Particularly, environmental and energy policy researchtends to be conducted by these government-affiliatedresearch institutions, but also by institutes concernedwith capacity development, training, education, andoutreach. For instance, the Beijing-based South NorthInstitute for Sustainable Development has been verysuccessful in conducting small demonstration projectson biogas energy for small farmers in the Baima SnowMountain in Sichuan Province. The prestigious EnergyResearch Institute (ERI) under the SDPC umbrella is anexample of a think-tank that has had a lot of influenceover China’s future energy policies, including its dy-namic Centre for Renewable Energy Development(CRED). ERI and CRED work mainly on a consultancybasis, partly for government, international donors, andprivate sector.
Affiliated with SEPA but “independent without chal-lenging government” the Centre for Environmental Edu-cation and Communications is an example of a youngand dynamic institution working with activities such astraining of mayors of key cities, environmental mediatraining for journalists, teachers training within theGLOBE programme, and production of environmentalschool books.
There are also a number of institutions that play animportant role in building and extending environmentalmanagement systems within Chinese industry, the ChinaNational Cleaner Production Centre, under SEPA’sChinese Research Academy of Environmental Sciences,is an example of institutions that carry out consultancybusiness in the field of environmental auditing, cleanproduction, and setting up of ISO 14000 systems.
Although independently financed, largely throughsub-contracts, many institutes are sheltered by one gov-ernment agency. This, combined with China’s embry-onic bidding procedures, means that open competitionamong institutes remains rare. Institutes often gain con-tracts through having contacts, rather than excellence, asituation that does not promote the development of ca-pacity.
NGOs and Government-organised NGOsChina’s legal framework does not promote the creationof NGOs in the Western sense, since the governmentassociates these types of groups with political dissent.Legislation enacted in 1998 outlined new regulations onregistration and management of NGOs and establishedthe clearest legislative framework for the NGO sector to

China Human Development Report 89
Ongoing Response: Towards a Sustainable Future
date. However, the new regulations fall short of givingNGOs complete independence from government control.While the Communist Party and the government are in-terested in encouraging the growth of this sector, theyare also evidently “concerned about releasing unknown,and potentially uncontrollable, social forces” (Young andWoo, 2000). Notably, many Chinese NGOs have officialgovernmental sponsors who guide them through theregistration process and provide political cover and sup-port for their work. Despite the unclear legal situation,China now has more than 200,000 not-for-profit organi-sations, including a growing number of “people’s envi-ronmental organisations”.
The Formation of Fairly Independent NGOsEnvironmentally oriented NGOs, although limited in scale,are beginning to provide Chinese society with a vehiclefor expressing environmental concerns and for effectingchange. These activities are directed towards environ-mental education and community development work.
Friends of Nature (FON) focuses primarily on raisingenvironmental awareness among China’s public, laterextended to cover wildlife and habitat conservation. FONwas instrumental in getting a ban on logging in DeqingPrefecture in Yunnan Province, home of the endangeredgolden monkey. It has also developed and published aprimer for school children, organised field trips, and es-tablished a “Forest and Kids” summer camp. The mem-bers mobilise citizens and the media in support of statedgovernment goals for sustainable development practices,and compel the government to enforce its own policies.
Global-Village Environmental Culture Institute ofBeijing (Global Village) was set up in 1996 by Liao Xiaoyi.Primarily using personal savings supplemented by smallgrants from Western and multilateral organisations, Glo-bal Village focuses on two main areas: the production ofa series of television programmes, including the weekly“Time for Environment” and efforts to popularise reuseand recycling among the households of Beijing.
Green Earth Volunteers (GEV), co-founded in 1997by Wang Yongchen, a popular radio personality andboard member of FON, is an example of a volunteer or-ganisation. Wang organises activities with volunteerswho generally pay their own way to participate. In 1997,108 volunteers, each paying 78 USD travelled to InnerMongolia to spend three days planting trees in theEngebie Desert. Some of the activities are designed inparticular to get youngsters involved in conservationprojects.
In addition, a number of international NGOs have es-tablished their presence in China, including WWF-China,Oxfam and LEAD (the latter hosted by IED).
The Power of Government-organised NGOsThere is also an interesting form of professional organi-sation, which is state-sponsored and often establishedby state agencies or well-known Chinese leaders or re-tired officials. Often large, national-level organisationsreceiving a large part of their funding from the govern-ment, though increasingly from various other sourcesas well, these are not grassroots organisations but fo-cus on an elite audience of scholars, policy-makers, andgovernment officials. The clear advantage of these or-ganisations is their ability to draw together scholars andofficials from a wide range of institutions, which nor-mally find it difficult to interact in China’s highly verticalbureaucratic structure. This is particularly important inthe interdisciplinary field of environmental protection.With prestigious leadership and membership, these or-ganisations can draw attention to environmental issuesflowing information and ideas from their members topolicy-making bodies in the government. There is a largenumber of professional organisations involved one wayor another with environmental issues. For example:
China Environmental Protection Foundation wasfounded in 1993 under SEPA (then NEPA) with a dona-tion of UNEP Prize money awarded to Mr. Qu Geping,former NEPA Administrator. The Foundation’s statedprinciple is “to facilitate the donation of funds and goodsin order to help develop environmental protection un-dertakings in China”.
National Natural Science Foundation was estab-lished in 1986, under the Chinese Academy of Sciences,and views itself as analogous to the National ScienceFoundation in the United States. More than 70 percentof its 250 members are professors. Its goal is to supportbasic research in natural sciences.
All China Women’s Federation is one of the oldestand most powerful government-organised NGOs. Overthe decades, its elite status has improved women’s so-cial status, equal employment opportunities, and wom-en’s welfare. In recent years, the Federation has becomeactively involved in environmental education amongwomen.
Future of NGOsThere are far too many NGOs to mention them all here.This recent development is a positive force for environ-mental change, as recognised by SEPA and other minis-tries. However, the degree of independence of NGOs islimited. Also, these groups are often small and overlyspecialised. They may often be “one-man shows” ratherthan true organisations. If the government can continueto stimulate the growth and activities of these actors,the total contribution to environment could continue togrow impressively.

Chapter 4
UNDP90
Chinese NGOs are also concerned about growing toolarge and being seen as too strong a force. This is areflection of the incomplete legal framework, but also areflection of historical legacies. Until NGOs can act inde-pendently, with no fear of ad hoc reprisals, they willremain cautious of growing, and will shy away from manyissues. They will remain subject to the whims of govern-ment administrators, and therefore really an extension ofgovernment administration, rather than a positive inde-pendent force. The role and potential of the NGOs in theChinese governance model is further discussed in sec-tion 3.12 on Governance and Institutions.
Business CommunityUntil very recently, the business community in Chinahas been hardly concerned with the environment. Start-ing from this very low point, and with some encourage-ment from the government, as well as pressure from thepublic, there have been some recent signs of change.
The following paragraphs illustrate some of thesedevelopments, although it must be emphasised that anenvironmentally conscious enterprise manager is verymuch an exception to the rule. Most enterprise manag-ers think only about short-term profits, and they con-tinue to work within an economic and administrativeframework that does not provide incentives for environ-mentally oriented activities.
Although the actions described below are limited anddispersed, with penetration of green-labelled productsamounting to only fractions of a percent, they show whatcan be achieved if incentives are provided for environ-mentally sound products and business patterns. Andgiven the improved efficiency, better quality, and mar-keting advantages that often come with efforts to greenbusiness, the potential for success is immense.
Environmental Management Systems and ISO 14000The ISO 14000 series, set by the International StandardsOrganisation (ISO), focuses on encouraging corpora-tions and organisations to establish a management sys-tem that protects the environment. China joined the ranksof some 200 countries when it agreed to comply with ISOstandards. Twenty Chinese organisations have beenauthorised to issue ISO certificates, and 710 Chineseenterprises, including Haier Group and Baoshan Iron andSteel Complex, have been awarded the certificates.
The China Accreditation Committee for Environmen-tal Management System Certification Bodies under SEPAhas licensed eight environmental management certifica-tion centres, and 11 institutes have received SEPA’s ap-proval to provide consultancy services on ISO 14000.
The ISO 14001 standards are slowly becoming an im-portant tool for China’s environmental managers. Theyplay an important role in improving compliance with do-
mestic environmental laws and policies helping Chineseexport industries, particularly medium and large enter-prises, deal with environmental challenges in foreignmarkets.
Eco-labellingEco-labelling is used to inform consumers of environ-mentally friendly products and encourage manufactur-ers to develop products that do not adversely impactthe environment. The National Environmental LabellingProgram was founded in 1993. A national committeechaired by SEPA, was set up in 1994 to take charge ofdeveloping rules and standards to certify products. Thiswas partly encouraged by local business initiatives thathad started to design their own environmental pro-grammes or logos. Suggestions to improve this effortinclude expanding the programme nation-wide, increas-ing transparency of the certifying process, and adopt-ing life-cycle assessment in the formulation of productenvironmental criteria.
Cleaner ProductionCleaner production is another element promoted by gov-ernment and is being adopted by more enterprises inChina. It involves shifting from downstream, end-of-pipesolutions to pollution prevention throughout the wholeproduction process. Beijing, Shanghai, and Benxi ofLiaoning Province have carried out a series of experi-mental projects supported by international organisations.A Clean Production Research Centre was set up to trainChinese specialists in clean production auditing. SEPAhas granted 25 certificates for clean production auditingin Beijing. Now the experimental programme is being ex-panded to 26 enterprises in over 20 locations, represent-ing 14 heavy polluting industries. Experiments show a10 to 50 percent pollution reduction in these enterprises.The Beijing Beer Brewery, for instance, reduced its wateruse by one-third and its output rose by 11 percent peryear after the factory started the programme. Cleanerproduction leads to both economic and environmentalgains. The fact that it has not been more broadly adoptedreflects the fact that many Chinese enterprises are notfully exposed to market forces.
The Clean Development MechanismChina could also potentially benefit from the Clean De-velopment Mechanism of the Kyoto Protocol on globalclimate change. While energy efficiency has been im-proved and greenhouse gas emissions have shown signsof declining, the Chinese energy sector is still inefficient.Investment in the Chinese power sector could reducecarbon dioxide emissions for a fraction of the cost ofachieving similar reductions almost anywhere else in theworld.

China Human Development Report 9 1
Ongoing Response: Towards a Sustainable Future
Encouraging Public ParticipationCo-operation between government and civil society hasbecome an established principle in the environment sec-tor, and people in general, are not reluctant to speak theirmind about the environment, at least in private. FormerSEPA Administrator and Chairman of NPC’s Environ-mental and Resources Conservation Committee, Mr. QuGeping, once noted that “the degree of popular partici-pation in environmental protection work is an importantindicator of the success or failure of environmental pro-tection in that country”. For example, during the currentdrafting of the Law on Environmental Impact Assess-ments, opinions from various institutions, experts andthe public are being actively solicited. Lawmakers fromthe NPC are required to provide feedback in a timelymanner. Chinese media, in the coverage of the hearings,touted participation as a “legal right for the public”.
The Ghost of the Not Too Distant PastTo achieve public participation is not always easy. InJanuary 2001, in Fuoyang, Jiangsu Province, a SEPA andWorld Bank Research Group sponsored the township’sfirst public hearing on environmental protection issues.An anxious crowd of citizens came to the meeting with alot to say, but mostly remained quiet. As the team foundout, few would speak up unless repeatedly prodded.Fuoyang is not unique—in general the Chinese public isreluctant, to say the least, to confront the governmentand voice its concerns openly. In part this reluctancecan be explained by cultural heritage and the fact thatthe public is not accustomed to express views openly.But it also reflects political experiences over the pastdecades.
The Chinese public, and in particular the intelligent-sia, have been encouraged to express their opinionthroughout a number of critical junctures during modernChinese history. Today political openness and guaran-teed legal rights to express one’s views are slowly beingintroduced to instil confidence among the Chinese peo-ple in order to develop a strong and positive grassroots’movement and to foster a civic sense in the general pub-lic.
People Taking ActionInformation disclosure contributes to the building ofpublic knowledge. When air quality data in 47 major cit-ies were first made public by the media on a daily basis in1997, they were immediately used to begin evaluatingperformances of local officials. The release of drinkingwater data, originally scheduled for January 2001, wasdelayed for fear of “serious consequences”.
The same pressure can also be applied to manufac-turing companies—the major polluters. As a pilot experi-ment, some are required to release pollution data andpollution control performances of manufacturers in
Zhenjiang, Jiangsu Province, and Hohhot, Inner Mon-golia Autonomous Region, and ranked black, red, yel-low, and green. The changes in rankings are made publicon a regular basis. As a result, CEOs of some poor per-formers have gone directly to the media making commit-ments towards pollution control. Jiangsu has decided topromote the practice province wide.
There are many other examples of ordinary peopletaking actions, either as individuals or in groups. Box 4.8provides a few examples where individuals, often ordi-nary people, have made a difference. Despite these posi-tive trends, most members of the public are uninformedabout the environment, and when informed, believe it isnot their responsibility to take action. Culturally, the pub-lic tends to lie low and not rock the boat. So, the exam-ples in box 4.8 are still only exceptions, and insufficientto make a wide-scale impact on the degrading environ-mental situation.
The Future Role of Civil SocietyAn articulate, knowledgeable and active public is thebest insurance for the environmental future, and theNGOs, think-tanks and media are the channels to makethat happen. Compared to ten years ago, such non-gov-ernmental forces are playing a much bigger role in assur-ing China’s environmental future.
The government clearly recognises the potential ofthese forces. Particularly SEPA has expressed on manyoccasion that it sees this as an ally. But fears remainregarding the consequences of unleashing these forces.NGOs are encouraged to act, but in a limited scope withinlimited methodologies. The public is still cautious abouttaking initiatives, and the government has not made realefforts to develop the necessary trust. If the results ofthe recent social experiments are considered positive,the government may be increasingly confident of its abil-ity to work in collaboration with these forces, and thispotential will be reached.

Chapter 4
UNDP92
Box 4.8 Seeds of Action
There are numerous examples of how individuals and groups of engaged citizens have taken action, often on their owninitiative, to solve a problem. Chinese media likes to report on these sometimes seemingly marginal, but yet so encouragingevents.
? Since the early 1990s, more than 120 million Chinese women have participated in tree planting campaigns to buildshelter forests. From 1990 to 1997, Chinese women established 100,000 green bases that include shelter forests,orchards, and tea farms. A survey shows that the tree survival rate of trees planted by women has reached eighty-five percent.
? In Hunan, one of the most important bread baskets in China, women are encouraged to plant trees—fruits, tea, andmedicinal plants—in their backyards. The province has 24,000 households with revenue from family fruit plantationsexceeding 100,000 yuan.
? “Little League of Blue Sky and Clear Water” was established in a primary school in Shandong Province after an 11-year-old fellow student started taking waste-sorting boxes to his school to encourage recycling. He and hisclassmates have been spending weekends and holidays on the streets handing out flyers about the environment.
? Li Shuangliang, an employee of Taiyuan Iron and Steel Company in Shanxi Province, devoted himself to findingsolutions to recycling scrap, which not only reduced pollution, but generated economic benefits.
? Xu Xiujuan, a crane breeder in Yancheng Nature Reserve of Jiangsu Province, died when she was trying to save acrane.
? Wang Jiuju, a town EPB director, risked losing her position when she pushed forward the implementation of agovernment regulation to eliminate small coke-making factories in her town.
? Wang Yangzu, former SEPA Deputy Administrator, won the acknowledgement from his counterparts at USEPA forhis leadership in phasing out CFCs and protecting the stratospheric ozone layer.
? Dalian, Liaoning Province, was selected by UNEP as a winner in 2001 of the 500 Roll of Honour for its efforts toreform its old industrial structures and build a green city. Dalian has been the model city for China for years.
? Zhou Meien, a retired school teacher in Xuzhou, won the same UNEP prize, for her devotion to mobilising youngstudents to protect the environment.

China Human Development Report 93
Human Choice and the Path Ahead
Chapter 5
Human Choice and the PathAhead
5.1 Finding the Optimal ResponseChapter 1 of this report described two possible scenariosfor China. In one, the perilous path, inappropriate poli-cies, choice and critical uncertainties combine to lead tocostly and irreversible damage to China’s environment.In the other, the green reform path, visionary economicand social governance leads to a slow, but steady im-provement in the environment and natural resource basethroughout the first decades of the 21st Century. Whichpath is China on?
Despite many critical uncertainties, many of whichwere laid out in chapter 3, China’s environmental futureis largely in the hands of its government and people.This section now asks if the responses described in chap-ter 4 are adequate to address the present challenges,and how the responses can be optimised. It can be seenfrom the scenario approach that efforts to improve Chi-na’s future environment could act at the level of the “cur-rent state of the environment”, or they could act at thelevel of the “driving forces”. Scenario Box 6 describesthe underlying frameworks for environmental change as-sociated with the two scenarios.
Efforts to Improve the State of the EnvironmentThe Government has undertaken many programmes toimprove the environment. There have been successes,and many battles have been won, particularly in clean-ing up dirty water and controlling air pollution in cities.However, severe problems still remain, and some are grow-ing in scale. Next to the government response, the non-government response has also been admirable, withNGOs sprouting up with media and people taking ac-tion. Yet, these non-governmental efforts generally re-main quite small, uncoordinated and limited in scope.And despite a small but growing number of exceptions,industrial managers are not interested in the environ-ment.
A crucial aspect of the present response to environ-mental challenge is that it is mostly aimed directly atchanging the state of the environment—or cleaning upexisting hotspots, through administrative measures and
physical investments. Initially, most countries had simi-lar approaches. Governments tend to favour direct ac-tion on environmental hotspots, as this leads to obvi-ous, direct results, and so enjoys broad government andpublic support. Moreover, this approach is relatively sim-ple to design and monitor. Another reason for the popu-larity of this approach is that it can be implemented byone sectoral agency—not having to put heavy demandon collaboration between agencies or on inter-sectoralagencies.
A second important aspect of the present response isthe low level of effort by non-government forces inChina. This is different from many other countries, wherepublic actions often precede those of the governmentand enterprises.
China’s present approach has several weaknesses.Cleaning-up hotspots can be expensive, and administra-tive measures can lead to employment problems. Even ifsuccessful in the short-term, clean-up may not be per-manent. If the drivers have not been addressed, thingswill get dirty again, or the problem may pop up else-where. Also, experience shows that governments willalways be limited in what they can achieve. The extent ofaction needed will require large inputs from civil societyincluding large-scale actions by industry.
Efforts to Change Driving ForcesThe Chinese government does target the day-to-daydrivers of environmental change, but seems to do thisfrom a non-environmental perspective. For example, theGovernment has a large, co-ordinated programme tomanage population growth, but this is not heavily influ-enced by recent environmental thinking. The Govern-ment is also addressing poverty, energy, technologychange and the other drivers, but not for environmentalreasons. As for the non-governmental response, theseare generally very limited. There are non-governmentalactivities in the population and poverty area, and someindustries are making small efforts in water and energymanagement, but the scope is limited.
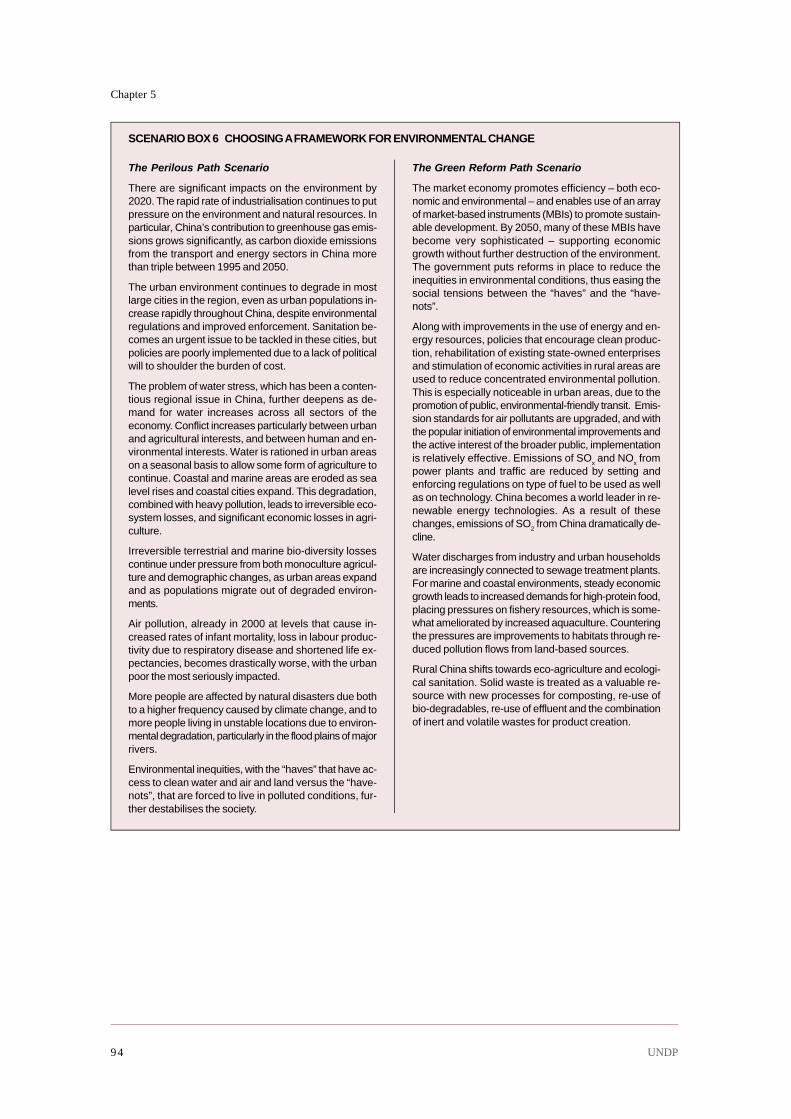
Chapter 5
UNDP94
The Perilous Path Scenario
There are significant impacts on the environment by2020. The rapid rate of industrialisation continues to putpressure on the environment and natural resources. Inparticular, China’s contribution to greenhouse gas emis-sions grows significantly, as carbon dioxide emissionsfrom the transport and energy sectors in China morethan triple between 1995 and 2050.
The urban environment continues to degrade in mostlarge cities in the region, even as urban populations in-crease rapidly throughout China, despite environmentalregulations and improved enforcement. Sanitation be-comes an urgent issue to be tackled in these cities, butpolicies are poorly implemented due to a lack of politicalwill to shoulder the burden of cost.
The problem of water stress, which has been a conten-tious regional issue in China, further deepens as de-mand for water increases across all sectors of theeconomy. Conflict increases particularly between urbanand agricultural interests, and between human and en-vironmental interests. Water is rationed in urban areason a seasonal basis to allow some form of agriculture tocontinue. Coastal and marine areas are eroded as sealevel rises and coastal cities expand. This degradation,combined with heavy pollution, leads to irreversible eco-system losses, and significant economic losses in agri-culture.
Irreversible terrestrial and marine bio-diversity lossescontinue under pressure from both monoculture agricul-ture and demographic changes, as urban areas expandand as populations migrate out of degraded environ-ments.
Air pollution, already in 2000 at levels that cause in-creased rates of infant mortality, loss in labour produc-tivity due to respiratory disease and shortened life ex-pectancies, becomes drastically worse, with the urbanpoor the most seriously impacted.
More people are affected by natural disasters due bothto a higher frequency caused by climate change, and tomore people living in unstable locations due to environ-mental degradation, particularly in the flood plains of majorrivers.
Environmental inequities, with the “haves” that have ac-cess to clean water and air and land versus the “have-nots”, that are forced to live in polluted conditions, fur-ther destabilises the society.
The Green Reform Path Scenario
The market economy promotes efficiency – both eco-nomic and environmental – and enables use of an arrayof market-based instruments (MBIs) to promote sustain-able development. By 2050, many of these MBIs havebecome very sophisticated – supporting economicgrowth without further destruction of the environment.The government puts reforms in place to reduce theinequities in environmental conditions, thus easing thesocial tensions between the “haves” and the “have-nots”.
Along with improvements in the use of energy and en-ergy resources, policies that encourage clean produc-tion, rehabilitation of existing state-owned enterprisesand stimulation of economic activities in rural areas areused to reduce concentrated environmental pollution.This is especially noticeable in urban areas, due to thepromotion of public, environmental-friendly transit. Emis-sion standards for air pollutants are upgraded, and withthe popular initiation of environmental improvements andthe active interest of the broader public, implementationis relatively effective. Emissions of SOx and NOx frompower plants and traffic are reduced by setting andenforcing regulations on type of fuel to be used as wellas on technology. China becomes a world leader in re-newable energy technologies. As a result of thesechanges, emissions of SO2 from China dramatically de-cline.
Water discharges from industry and urban householdsare increasingly connected to sewage treatment plants.For marine and coastal environments, steady economicgrowth leads to increased demands for high-protein food,placing pressures on fishery resources, which is some-what ameliorated by increased aquaculture. Counteringthe pressures are improvements to habitats through re-duced pollution flows from land-based sources.
Rural China shifts towards eco-agriculture and ecologi-cal sanitation. Solid waste is treated as a valuable re-source with new processes for composting, re-use ofbio-degradables, re-use of effluent and the combinationof inert and volatile wastes for product creation.
SCENARIO BOX 6 CHOOSING A FRAMEWORK FOR ENVIRONMENTAL CHANGE
China Human Development Report 95
Human Choice and the Path Ahead
An alternative approach exists, drawing on some ofthe experiences of industrialised nations. This sustain-able development approach focuses on strategic changewithin the driving factors. It consists of more co-ordinatedefforts by the environmental sector to change the proc-esses, policies and programmes (as described in chapter3). In this approach, the environmental sector works withmany partners, not just across government, but broadlyacross society. As governments become more comfort-able with the stakeholders taking actions, and more ableto manage and support these, the non-governmental re-sponse increases in scope, magnitude and strategic im-pact. Importantly, if governments put in place a correctincentive framework, enterprises efficiently and quicklyadopt different behaviour without significant employ-ment or production losses. Impacts of this approach maynot be immediately visible, but spread over the medium-term future.
Addressing the DriversThe following paragraphs explore an alternative, sus-tainable development, driver-oriented approach in theChina context. As shall be clear from these paragraphs,this approach is already nascent in China.
Population Growth and MigrationThe environment is incorporated into population andmigration policy, and the agencies responsible for envi-ronment, population, migration, and urbanisation co-operate at all levels. The environmental impacts of mi-gration are assessed in advance. The cost of the envi-ronmental impact of population growth, urbanisation andmigration is considered when making developmentpolicy. Migrants are given opportunities and support tofind ways of prospering while at the same time minimis-ing damage to the environment.
Economic Growth and Development StrategiesFirst and foremost, ongoing reforms are consolidatedand the market functions more and more freely. This ismatched by reforms in the public administration andgovernance sectors. Ownership rights and responsibili-ties are clarified. Development policies continue to ad-dress inequity and natural resource degradation. Envi-ronmental costs are incorporated into economic and de-velopment policy, and vice-versa.
Poverty, Equity and Environmental JusticeEnvironment and poverty policy are integrated. The so-cial and environmental costs of poverty are considered.The poor are supported in managing their environmentand given access to a good environment. The environ-mental costs of inequity are incorporated into develop-ment policy making. Environmental justice becomes a
strong concept for improving the position of vulnerablegroups.
Awareness and HealthStrong campaigns to increase environmental awarenessand improve environmental education are undertaken.The people realise that maintaining the environment istheir responsibility, they cannot rely on the state. Theydesire to take action. More information is made morereadily available to the public, in an appropriate format.Media and other bodies are encouraged to develop en-vironmental awareness. Business and political decision-makers are key targets for environmental awareness. Thisraises their commitment to and understanding of theenvironment.
Consumption Patterns and Consumer Pressure forChangeA debate on future society is initiated. Progressive West-ern models of less waste and less consumption are ob-served. Policies that stimulate appropriate consumption,while maintaining economic growth are developed. Wasteis disassociated from fashionable or wealthy lifestyles.
Technological DevelopmentThe environmental technology industry is stimulated, inorder to generate employment and meet local demand ataffordable prices. China becomes a major manufacturerand then exporter of appropriate environmental technol-ogy.
WaterThe price of water is increased to reflect scarcity andclean-up costs. Environment is incorporated in watersector policy. As a result, water thirsty economic activi-ties slowly move to water rich areas, and activities re-quiring low water use are competitive in areas with lim-ited water supply. Also, finance for recycling and waterconservation schemes becomes available.
EnergyEnvironment becomes one of the core themes in energysector development, planning and implementation. En-vironmental considerations have a real influence overdevelopment of policy and all energy programmes?through promoting renewables, energy efficiency, pricesetting, etc. SEPA, rather than monitoring power plantsand closing mines, focuses more resources on helpingSDPC and SETC map out China’s energy future.
TransportationAs with energy, the environment and transport sectorswork together to map out a sustainable transport policyfor China; with perhaps more emphasis on integratedtransport, alternative transport, and low polluting tech-nologies.

Chapter 5
UNDP96
Agriculture and Food ProductionEnvironmental concerns become a key factor in agricul-tural policies. The result is agricultural practices thatcombine economic efficiency with environmental con-siderations. Importantly, land tenure policy is revised toincorporate environmental objectives, and the implemen-tation of policy is monitored. Water thirsty agriculturemigrates to water rich areas, integrated pest manage-ment becomes common, certain food imports increase,whereas other exports also increase.
GlobalisationChina continues to play an active role in the globalisationprocess, and puts environmental protection at the cen-tre of its strategies. Trade and investment policies haveenvironmental considerations. The government contin-ues to utilise foreign direct investment and developmentassistance in support of domestic policy objectives andas drivers of environmental improvement.
Governance and Institutional StructuresThe government moves to clarify the legal framework,and ensure it is implemented, building the public’s trustin legal mechanisms. The market economic system ismaturing with the result that less resources are wasted.Strong institutions act to utilise the market forces to mini-mise environmental externalities. Within a clear and com-prehensive regulatory framework, the environmental sec-tor increasingly acts as partners, rather than policemen.Governments, although concerned for social stability,empower people and organisations. Partnerships are builtbetween government agencies, with the business com-munity, public, and NGOs. For example, government fa-cilitates development of high-calibre, independent insti-tutes and NGOs, which work in support of governmentpolicy objectives. Where necessary, the authorities re-sort to regulation.
5.2 The Choice AheadA choice lies ahead for the Chinese government andpeople. A choice between sustainable development withan improving environment on the one hand, and short-term economic growth accompanied by a dirty, unhealthyenvironment, with irreversible damage to the water sys-tem, to soil and to biodiversity on the other. Making theright choice will not be easy, it requires sacrifices byindividuals and will lead to some disadvantages. Is Chinaup to the challenge? This section provides a recap ofsome of the key findings of this report, and highlightssome of the specific choices facing China’s people andgovernment, and the implications of making the rightchoice.
China at the Dawn of the 21st CenturyChina’s development path is complex, multi-faceted andfast moving. The journey involves a number of transi-tional pathways. There is the transition from a commandeconomy to the market. There is a demographic transi-tion from “high birth rate, high death rate” to “low birthrate, low death rate”. There are epidemiological transi-tions, with the leading causes of death changing frominfectious diseases to other things like cancer, car acci-dents and welfare-related diseases. Managing these tran-sitional processes is one of the greatest challenges facedby any state government at any time in human history.
At times of such complex transitions, there is alwaysa danger that governmental and societal responses re-main one step behind the forces of change. Yesterday’srisks and failures lead to today’s problems; today’s risksand failures lead to tomorrow’s problems. If we only re-spond to immediate symptoms, the longer-term risks willbe neglected.
Despite the great social and economic achievementsmade during the past two decades, the Chinese peopleand government may be one crucial step behind in deal-ing with other challenges, particularly in the fight to safe-guard the environment. Today, the environmental sectorhas organised itself to address past and the more tradi-tional risk factors, but it is not well prepared to minimisethe risks associated with modern society and the associ-ated long-term problems. Take, for example, the wholecomplex of challenges associated with rapid urbanisa-tion, increased water conflicts, burgeoning volumes ofroad traffic, and widening inequity between the havesand the have-nots. How best to organise to address thesenew challenges?
The situation is even further complicated by the con-fluence of two generations of risk spheres in China. Re-sidual risks from the old days still prevail side-by-sidecurrent risks associated with modern society. In order toimprove urban air quality, European cities first had coaland sulphur-related problems to deal with, and thesewere pretty well under control before traffic-related emis-sions became serious. In China both problems co-ex-ist—along with many others—creating compoundingrisk factors.
Present Challenges and Possible FuturesThe environmental situation is already a major concern.Air quality in cities, rural areas and indoors is often ap-palling, well below all standards, leading to health prob-lems and substantial economic losses. Water quality isequally poor, with large stretches of rivers and lakes in-capable of supporting life or providing water for resi-dential, industrial or agricultural use. Many rivers andlakes have gone dry, as groundwater stocks sink to new

China Human Development Report 97
Human Choice and the Path Ahead
depths each year. Likewise, natural capital in the form ofland, forest and biodiversity is under a long-term de-cline. These factors combine synergistically to negativelyaffect human health and welfare. They increasingly con-strain economic prospects and growth, and so pose aserious threat to China’s mid and long-term sustainabledevelopment and stability. Likewise, the marine andcoastal resources have suffered and China contributessignificantly to regional and global environmental prob-lems, like acidification and global warming. Yet, as thisreport has clearly illustrated, there are alternatives. Airand water resources can slowly be restored, forest andland degradation can be interrupted and even reversed,and biodiversity losses can be halted.
The scenarios illustrated in Scenario Box 7, adaptedfor China from UNEP’s GEO-3 process, show how keyindicators could evolve over the coming decades. Thetwo scenarios stem from the business as usual path andare thus not unrealistic. They are almost identical in termsof population and economic growth. However, in termsof equity, poverty, air and water pollution and ecosys-tem integrity, there is a striking difference. And this iswhere the green options and opportunities to bend thesecurves in the right direction can be seen.
Maintaining the Reform ProcessA common theme throughout this report has been thatthe reform process has, generally, had a positive impacton the environment. Although reform in the economic,public administration and governance spheres has pro-gressed unevenly, the environmental payoffs are gener-ally large. Increasing the efficiency of the economy hasthe greatest impact on the environment, by increasingthe efficiency of resource use, decreasing waste, andimportantly as a basis for introducing a system of incen-tives that can stimulate further environmental improve-ments.
Continued reform of public administration towardsgood governance for sustainable development is essen-tial in order to stimulate economic reform, and is a re-quired basis for enhancing the environmental legislativeframework and ensuring its implementation. The devel-oping cadre of more efficient public officials at the na-tional level and across China, with increasingly clearerduties and responsibilities, and with a commitment tothe rule of law, is necessary for safeguarding the envi-ronment. Deepening this process, with further clarifica-tions and separations of duties, from national to locallevels, and between agencies at the same level, will yieldsimilarly impressive results. Notably, SEPA and EPBsefforts to strengthen capacity need to be maintained.
Finally, limited experiments in governance reformshow that empowering and liberalising the will of peo-
ple, within a regulated and monitored framework, canrelease a strong and comprehensive positive force forenvironmental change, which can complement ratherthan threaten government objectives and actions. Nota-bly, experience in China and other countries suggeststhat the media and NGOs are to be strong weapons inthe future. Related to this, continuing progress on own-ership structures—notably the ownership of productiveunits, of profits and of liabilities—is facilitating and stimu-lating improved behaviour within enterprises. Likewise,experiments show that land tenure systems can make orbreak efforts to safeguard forests, grasslands and agri-cultural lands. Related to this are data collection andinformation management systems. Knowledge of peo-ple and government is essential if progress is to be made,and this requires good data availability, in appropriateforms. Although greatly improved over the past decade,these remain weak.
An Increased Effort on All FrontsThe reform process creates frameworks, foundations andincentives for action. But alone, the reform process isinsufficient. Action is still needed, and this requires amajor effort and commitment by many actors. In recentyears, the scale of action has grown to an impressivelevel—particularly on the part of the central government.The level of public spending and the intensity of physi-cal investments have probably risen to improved levelsalready. It will be necessary to maintain this level. Also,the degree of action of the non-governmental sphereshas grown, and is still growing. While not quite yet atthe level of other countries, there is every sign that theefforts by media, NGOs, institutes and individuals willmeet the challenge.
In the future, some actors may have to increase theirefforts. As China becomes increasingly market-oriented,and as the state sector accounts for less and less of theGDP, it is the private sector that has to increase its effort.In response to economic and legislative developmentsand public pressure, as in western countries, the privatesector has to significantly upgrade its contribution toenvironmental improvements. This will largely go hand-in-hand with efforts to increase efficiency and remaincompetitive, but in many cases may mean sacrificingshort-term profits and increasing corporate social respon-sibility.
Related to effort is capacity. Agencies can only makean effort if they have the right staff and tools. Hence,wide-scale capacity building of individuals, institutionsand frameworks is a fundamental requirement to increas-ing effort.
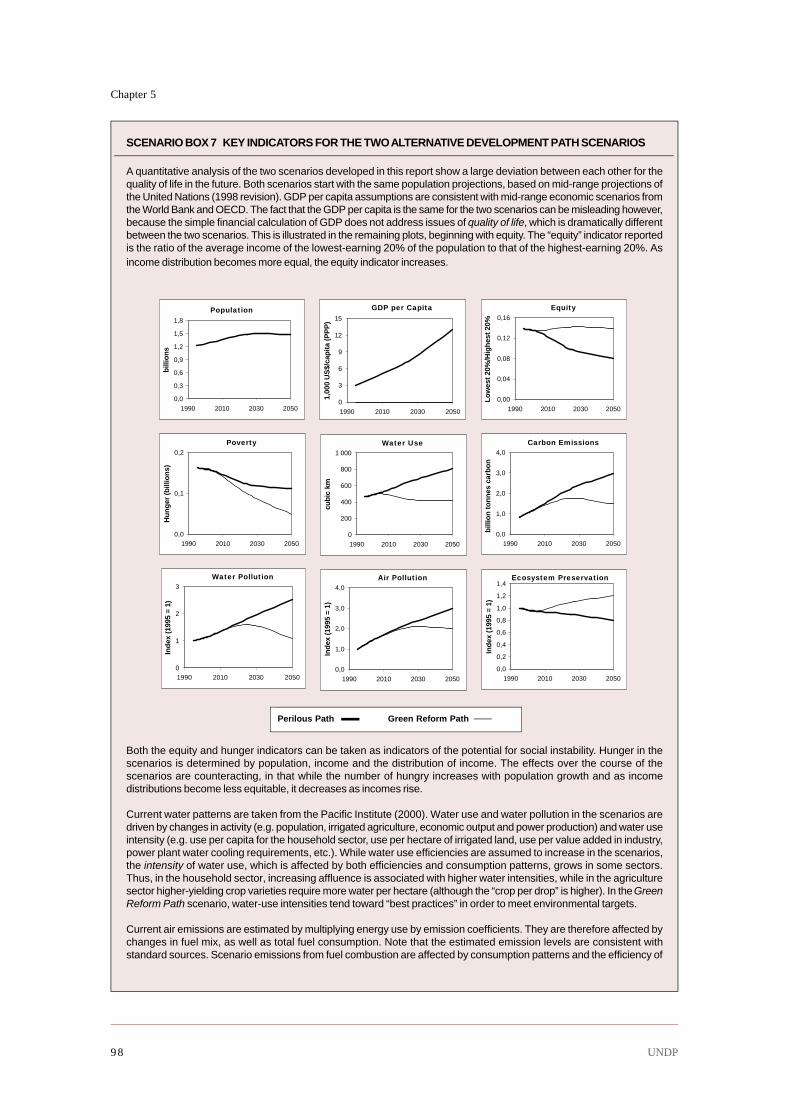
Chapter 5
UNDP98
SCENARIO BOX 7 KEY INDICATORS FOR THE TWO ALTERNATIVE DEVELOPMENT PATH SCENARIOS
A quantitative analysis of the two scenarios developed in this report show a large deviation between each other for thequality of life in the future. Both scenarios start with the same population projections, based on mid-range projections ofthe United Nations (1998 revision). GDP per capita assumptions are consistent with mid-range economic scenarios fromthe World Bank and OECD. The fact that the GDP per capita is the same for the two scenarios can be misleading however,because the simple financial calculation of GDP does not address issues of quality of life, which is dramatically differentbetween the two scenarios. This is illustrated in the remaining plots, beginning with equity. The “equity” indicator reportedis the ratio of the average income of the lowest-earning 20% of the population to that of the highest-earning 20%. Asincome distribution becomes more equal, the equity indicator increases.
Both the equity and hunger indicators can be taken as indicators of the potential for social instability. Hunger in thescenarios is determined by population, income and the distribution of income. The effects over the course of thescenarios are counteracting, in that while the number of hungry increases with population growth and as incomedistributions become less equitable, it decreases as incomes rise.
Current water patterns are taken from the Pacific Institute (2000). Water use and water pollution in the scenarios aredriven by changes in activity (e.g. population, irrigated agriculture, economic output and power production) and water useintensity (e.g. use per capita for the household sector, use per hectare of irrigated land, use per value added in industry,power plant water cooling requirements, etc.). While water use efficiencies are assumed to increase in the scenarios,the intensity of water use, which is affected by both efficiencies and consumption patterns, grows in some sectors.Thus, in the household sector, increasing affluence is associated with higher water intensities, while in the agriculturesector higher-yielding crop varieties require more water per hectare (although the “crop per drop” is higher). In the GreenReform Path scenario, water-use intensities tend toward “best practices” in order to meet environmental targets.
Current air emissions are estimated by multiplying energy use by emission coefficients. They are therefore affected bychanges in fuel mix, as well as total fuel consumption. Note that the estimated emission levels are consistent withstandard sources. Scenario emissions from fuel combustion are affected by consumption patterns and the efficiency of
Population
0,0
0,3
0,6
0,9
1,2
1,5
1,8
1990 2010 2030 2050
billi
ons
GDP per Capita
0
3
6
9
12
15
1990 2010 2030 2050
1,00
0 U
S$/
capi
ta (P
PP
)
Equity
0,00
0,04
0,08
0,12
0,16
1990 2010 2030 2050
Low
est 2
0%/H
ighe
st 2
0%
Ecosystem Preservation
0,0
0,2
0,4
0,6
0,8
1,0
1,2
1,4
1990 2010 2030 2050
Inde
x (1
995
= 1)
Water Use
0
200
400
600
800
1 000
1990 2010 2030 2050
cubi
c km
Carbon Emissions
0,0
1,0
2,0
3,0
4,0
1990 2010 2030 2050
billi
on to
nnes
car
bon
Water Pollution
0
1
2
3
1990 2010 2030 2050
Inde
x (1
995
= 1)
Air Pollution
0,0
1,0
2,0
3,0
4,0
1990 2010 2030 2050
Inde
x (1
995
= 1)
Poverty
0,0
0,1
0,2
1990 2010 2030 2050
Hu
ng
er (b
illio
ns)
Perilous Path Sustainable PathPerilous Path Green Reform Path

China Human Development Report 99
Human Choice and the Path Ahead
A More Strategic Form of EnvironmentalManagementDeepening reform and upgrading effort are necessaryelements, but even more is needed to safeguard China’senvironment. There is a need for more strategy and ef-fectiveness. This report has shown that the administra-tive and campaign approach is increasingly inadequate,and needs to be even more complemented by rule of lawand market-based instruments. In order to meet thesedemands, individual efforts need to be more strategic.With challenges becoming more complex, and with a shiftto focus on causal factors and drivers rather than symp-toms, it is less and less possible to build or spend theway out of problems.
Implementation of the polluter-pays-principle isunderway, but must be deepened in order to move theburden to industries that are able to achieve goals costeffectively. Public participation in priority setting shouldmean targets are set appropriately, and implementationefficiency-monitored. Long-term thinking and planningshould help integrate environment into development
use. Scenario energy requirements are the sum of sectoral contributions (households, industrial sub-sectors, transpor-tation modes, services, and agriculture). Total requirements are therefore affected by both the increasing scale of theeconomy and the changing mix of economic activity. This contributes to differences that can be seen between thescenarios. For example, there is a greater contribution from services, and less from agriculture in the Green Reform Pathcompared to the Perilous Path, while there is more heavy industry in the Perilous Path. Electrification increases in bothscenarios, but more rapidly in the Perilous Path. Energy efficiency improves in both scenarios, but more rapidly in theGreen Reform Path in order to meet environmental targets. In the Green Reform Path scenario, there is more fuelswitching to low-carbon fuels (such as natural gas and renewables) and greater efficiency improvements. Note: Onlycarbon emissions from fossil fuels are reported.
Ecosystem preservation relates to general impacts of pollution and natural resource use that affect the air, land and water,biodiversity and forest area. In the Perilous Path scenario, forest area declines due to conversion to agricultural land andthe built environment, while it increases in the Green Reform Path, due to expansion of plantations and reforestation, andgreater reliance on agriculture imports. Due to the considerable uncertainty and controversy regarding the complexrelationships in ecosystems, these figures should be taken only as approximate trends.
plans, policies and programmes, and into all legislation,achieving prevention at a far lower cost than clean-upwould have been. Once the price of natural resourcesfully reflects scarcity, more market-based instruments willhave to be introduced to internalise environmental costs.Care must be taken in introducing such instruments.Governance reform will mean that the comparative ad-vantages of the different actors in government, non-gov-ernment and production units will become increasinglyclear. Government will focus on framework and regula-tion, with some large-scale investments. Non-govern-ment will focus on information collection, monitoring,whistle blowing, and providing an alternative voice. Andproduction units will focus on physical clean-up by in-troducing new, cleaner processes and building efficienttreatment facilities.
The grounds for successful green reform in China arethere. It is now a matter of making the right choices tohelp make this happen.

Chapter 5
UNDP100

China Human Development Report 101
References
Asian Development Bank (ADB). 2000. Country AssistancePlan (2000 – 2002): People’s Republic of China.(www.adb.org/Documents/CAPs/2000/prc.pdf)
Baldinger, Pamela. 2000. Environmental Trends and Policiesin China: Implications for Foreign Business. WashingtonD.C.: The United States-China Business Council.
Beach, Marilyn. 2001. Local Environmental Management inChina. China Environment Series, no. 4: 21-31. (http://ecsp.si.edu/Ecsp_pdf.htm)
Becker, Jasper. 1998. Hungry Ghosts: Mao’s Secret Famine.New York: Henry Holt.
Biodiversity Committee/CAS, Wang Sung (ed.). 1992.Biodiversity in China, Status and Conservation Needs.Beijing: Science Press.
Bledsoe, David J. and Roy L. Prosterman. 2000. Policy, theRule of Law, and Rural Land Reform in China. Seattle: RuralDevelopment Institute.
British Petroleum (BP). 2001. BP Statistical Review of WorldEnergy 2001. London: British Petroleum. (www.bp.com/centres/energy/world_stat_rev/index.asp)
Brown, Lester R. 1995. Who Will Feed China? London:Earthscan.
BWG (Biodiversity Working Group). 1996. Fourth AnnualReport to CCICED. Beijing. (http://monkey.ioz.ac.cn/bwg-cciced/english/bwg-cciced)
BWG/CCICED. 1997. Conserving China’s Biodiversity. Beijing.China Environmental Sciences Press. (In Chinese and Eng-lish.)
BWG/CCICED. 1999. (Phase Two): Third Report. Beijing:BWG/CCICED. (http://monkey.ioz.ac.cn/bwg-cciced/english/bwg-cciced/annual%2099.htm)
Carbon Dioxide Information Analysis Center (CDIAC). 2000.Trends Online: A Compendium of Data on Global Change.Oak Ridge, Tenn.: National Laboratory, U.S. Department ofEnergy. (http://cdiac.esd.ornl.gov/trends/trends.htm)
Chen, Binghao. 1998. Causes of Yangtze River Flooding andMechanism of Forest Hydrology. Forestry Economics. vol.5: 12-17.
Chen, L., X. Wang and S. Wang (eds.). 1993. ChineseBiodiversity - Status and Conservation Strategy. Beijing:Science Press. (In Chinese.)
Chen, Y., M. Lin, Z. He, X. Xie, Y. Liu, Y. Xiao, J. Zhou, Y.Fan, X. Xiao and F. Xu. 1993. Air pollution-type fluorosisin the region of Pingxiang, Jiangxi, Peoples’ Republic of China.Archives of Environmental Health, vol. 48 (4): 246-9.
China. 1999. Beijing: New Star Publishers.China Electric Power Yearbook (Zhongguo Dianli Nianjian).
1999. Beijing: China Electric Power Press.
China Energy Group. 2001. China Energy Databook, version5.0 (CD ROM). Lawrence Berkeley National LaboratoryEnergy Analysis Department. (http://eetd.lbl.gov/EA/part-nership/China)
China Environment News. 1998. May 28.China to Commercialize Water Supply. 1999. People’s Daily
Online, Nov. 14. (http://english.people.com.cn)China’s Agenda 21: White Paper on China’s Population, Envi-
ronment, and Development in the 21st Century. 1994. Beijing:Administrative Centre for China’s Agenda 21.
Cortner, Hanna J. and Margaret A. Moote. 1999. The Politicsof Ecosystem Management. Washington, D.C.: Island Press.
Daly, Herman E. 1993. On Economics as a Life Science. InHerman E. Daly and Kenneth N. Townsend (eds.), Valuingthe Earth: Economics, Ecology, Ethics. Cambridge, Mass.:MIT Press, pp. 250 - 264.
Daly, Herman E. and Kenneth N. Townsend (eds.). 1993. Valu-ing the Earth: Economics, Ecology, Ethics. Cambridge, Mass.:MIT Press.
Dasgupta, Susmita, Hua Wang and David Wheeler. 1997. Sur-viving Success: Policy Reform and the Future of IndustrialPollution in China. Washington, D.C.: World Bank.(www.worldbank.org/nipr/work_paper/survive)
Deng, K.Y. 1995. Renewable Energy Benefits Rural Women inChina. In J. Goldemberg, T.B. Johansson and R. Philips(eds.), Energy as an Instrument for Socio-Economic Devel-opment. New York: UNDP.
Department of Policy and Legislation Officials, State ForestryAdministration of China. Personal communication.
Duan, Changqun, Xue-Qing Yang and Gao Fayuan. 2000. FiftyYears of Political Ecology in Mainland China. Sinosphere,vol. 3 (1): 6-13. (www.chinaenvironment.net)
Dudek, D. et al. 2001, Great Future of Emissions Trading inChina. China Environment News, June 30.
The Economist Intelligence Unit, 2001a. Country BriefingsChina, Economic structure, Sep 5, 2001. (http://w w w . e c o n o m i s t . c o m / c o u n t r i e s / C h i n a /profile.cfm?folder=Profile%2DEconomic%20Structure)
The Economist Intelligence Unit, 2001b. Country BriefingsChina, Factsheet, Oct 26, 2001. (http://www.economist.com/countries/China/profile.cfm?folder=Profile-FactSheet)
EIA (Energy Information Administration). 2001. InternationalEnergy Outlook: 2001. Washington, D.C.: Energy Informa-tion Administration, US Department of Energy.(www.eia.doe.gov/oiaf/ieo/index.html)
ERM China (Environmental Resources Management China).1998. The State Environmental Protection Administration:A New Environment in Government? (www.ermchina.com)
FAO. 1997. Forest Resource Report. National Forest ResourceStatistics, 1977-1981; 1989-1993.
References

References
UNDP102
Ferris, Richard J., Changhua Wu and John Barlow. 2000. Envi-ronmental Implications of China’s Accession to WTO:Policy and Law Considerations. Sinosphere, vol. 3 (3): 5-8.(www.chinaenvironment.net)
Forestry Department of China. 1977-1981, 1989-1993. Na-tional Forest Resource Statistics.
Fridley, D.G., J.E. Sinton, J.L. Lewis, F.Q. Zhou, and J. Li.2001. China Energy Databook, fifth revised edition (CDROM). Report no. LBL-47832. Berkely: Lawrence BerkeleyNational Laboratory.
Gao Yuying and Liu Jinfu. 2002. Why the Forest EcologicalCompensation Fund Policy? Forestry Economics. January,pp. 26-27.
Hallding, Karl. 1991. Water Resource Problems in China.Stockholm University: Department of East Asian Studies.
He, P. (ed.). 2001. Interpretation of the 10th Five-Year-Plan.Beijing: Xinhua Press.
He, X. Z. 1990. Lung cancer and indoor air pollution fromcoal burning. Yunnan Sci-tech Publishing Company. Yunnan
Heilig, G. K. 1999. Can China Feed Itself? A System for Evalu-ation of Policy Options. CD-ROM. Laxenburg, Austria, In-ternational Institute for Applied Systems Analysis (IIASA).
Holling, C.S. 2000. Theories for Sustainable Futures. Conser-vation Ecology. vol. 4 (2): 7. (www.consecol.org/vol4/iss2/art7)
Hongkong Far East Economy Review, 2000. Water Shortage:Biggest Threat Facing China. Reference News. Feb. 5. p.8.
Hou Xiangyang and Gao Weidong. 1999. Conservation andutilization of wild relatives of crops.
Chinese Biodiversity, vol. 7 (4): 327-331.Huang Jikun. 2001. Erosion and Salinization. In World Bank
Background Paper in China: Air, Land, and Water. Wash-ington, D.C.: World Bank.
Huang Jikun and Chen Chunlai. 1999. Effects of Trade Liber-alization on Agriculture in China: Institutional and Struc-tural Aspects. Bogor, Indonesia: CGPRT Centre.
Jiao Yali and Zhang Yijun. 2000. Plants and Religion. Plants,no. 155: 24-25.
Johnson, Todd, Feng Liu and Richard S. Newfarmer. 1997.Clear Water, Blue Skies: China’s Environment in the NewCentury. Washington, D.C.: World Bank.
Joint Study Team (National Environmental Protection Agencyof China). 1996. China: Issues and Options in GreenhouseGas Emissions Control. Washington, D.C.: World Bank.
Karasov, C. 2000. On a Different Scale: Putting China’s Envi-ronmental Crisis in Perspective. Environmental Health Per-spectives, vol. 108 (10): A452-459.
Khachaturov, T. 1985. Nature Conservation in European So-cialist Countries. Problems of Economics, vol. 28: 48-68.Translated from Voprosy Ekonomiki, no. 12 (1984).
Li Shichao. 2000. Approaches to Improve the Recycling ofMunicipal Solid Wastes in China. Sinosphere, vol. 3 (1).(www.chinaenvironment.net)
Liang Xinmin. 1999. Pay Attention to Farmland Pollution.Territorial Resources News, July 14.
Lieberthal, Kenneth. 1997. China’s Governing System and ItsImpact on Environmental Policy Implementation. ChinaEnvironment Series, no. 1: 3-8. (http://ecsp.si.edu/default.htm)
Liu Jiang and Zou Lianwen. 2000. Analysis of the GroundwaterEnvironment in Shandong, China. Shuiwen (Hydrology), vol.20 (5): 50-51, 57. (In Chinese)
Liu Yingqiu, 1999. Land Resource and Sustainable Develop-ment. Beijing: China S & T Press.
Long Chunlin et.al. 1999. Impacts of Traditional Culture of YiNationality upon Biodiversity in Zixishan Mountain Area.Chinese Biodiversity, vol. 7 (3): 245-249.
Lu Dadao et al. 2001. Report of 2000 China Regional Develop-ment: Trend, Questions and Recommendations on ChinaGrand Western Development. Beijing: Commercial Press.
Ludwig, Don. 2001. Crisis and Information. ConservationEcology, vol. 5 (1): 11. (www.consecol.org/vol5/iss1/art11)
McCarthy, Terry and Jaime A. Florcruz,. 1999. Toxic China.Time, March 1: 16-33.
McGregor, R. 2001. Chinese Court Rejects Tobacco IndustrySuit. Financial Times. June 30/July 1: 4.
Mackinnon, J. et al. 1996. A Biodiversity Review of China.Hong Kong: WWF International China Programme.
Ma Hengyun. 2000. Eating Out, Meat Demand and Food Con-sumption Pattern Change in China. PhD dissertation, Chi-nese Academy of Agricultural Sciences.
Ministry of Public Health in China. 1996. Selected Edition onHealth Statistics in China 1991-1995. Beijing: Ministry ofPublic Health Press.
Munich Re. 1999. Annual Review of Natural Catastrophes1997. Munich Reinsurance Co. Munich: Germany. (alsowww.munichre.com)
National Bureau of Statistics (NBS). 2000. China StatisticalYearbook 2000. Beijing: China Statistical Publishing House.
National Conditions Analysis Group, Chinese Academy ofSciences. 1988. Survival and Development. Beijing: SciencePress.
Paehlke, Robert and Douglas Torgerson (eds.). 1990. Manag-ing Leviathan: Environmental Politics and the Administra-tive State. London: Belhaven.
Raufer, Roger and Wang Weili. 1999. Air Quality Managementin Chinese Cities: The Policy Setting for Future Controls.Sinosphere, vol. 2 (4): 21-28. (www.chinaenvironment.net)
Research Group of Sustainable Development and Compre-hensive Productivity in Chinese Agriculture. 1995. Study onSustainable Development and Comprehensive Productivityin Chinese Agriculture. Jinan, China: Shandong Science andTechnology Press.
Research Team of China Climate Change Country Study(RTCCCCS). 1999. China Climate Change Country Study.Beijing: Tsinghua Univ. Press.
SEPA (State Environment Protection Administration). 1998.China Country Report on Biodiversity. Beijing: China Envi-ronmental Sciences Press.
SEPA (State Environmental Protection Administration). 1999.1998 Report on the State of Environment in China. Beijing:SEPA. (www.zhb.gov.cn/english/SOE/1998/index.htm)
SEPA (State Environmental Protection Administration). 2000.1999 Yearbook of Environmental Statistics. Beijing: SEPA.
SEPA (State Environmental Protection Administration). 2001.State of the Environment 2000. Beijing: SEPA.
Shao Wenjie and Deng Min. 2000. Guangming Daily, June 13.Sinton, Jonathan and David Fridley. 2001. Hot Air and Cold
Water: The Unexpected Fall in China’s Energy Use. ChinaEnvironment Series, no. 4: 1-10. (http://ecsp.si.edu/CES4.htm)
Smil, Vaclav. 1993: China’s Environmental Crisis: an Inquiryinto the Limits of National Development. Armonk, N.Y.:Sharpe.
Song Ruijin, Wang Guifang and Wang Bin. 1998. Research onHuman Exposure to Motorized Vehicle Exhaust Pollutants.Environment & Health Journal, vol. 15 (5): 196-198.
China Human Development Report 103
References
SSB (State Statistical Bureau). 1998. China Energy StatisticalYearbook 1991-1996. Beijing.
SSB (State Statistical Bureau). 2000. China Statistics Sum-mary. Beijing.
State Science and Technology Commission (SSTC). 1994. ChinaStatistical Yearbook of Science and Technology. Beijing.
State Science and Technology Commission (SSTC). 1995. ChinaStatistical Yearbook of Science and Technology. Beijing.
Stover, Jim. 2000. Hazardous Waste Management in China.Sinosphere, vol. 3 (1). (www.chinaenvironment.net)
Sun, Changjin. 2001. Paying for the Environment in China:The Growing Role of the Market. China Environment Se-ries, no. 4: 32-42. (http://ecsp.si.edu/CES4.htm)
Tickell, Crispin. 2001. Book review: Mao’s War Against Na-ture: Politics and the Environment in Revolutionary Chinaby Judith Shapiro. Nature, vol. 412, July 19: 273-274.
UNDP. 1998a. China Human Development Report 1997. NewYork: Oxford Univ. Press.
UNDP. 1998b. Global Human Development Report 1998. NewYork: Oxford Univ. Press.
UNDP. 2000. China Human Development Report 1999. NewYork: Oxford Univ. Press.
United Nations Team in China. 2000. United Nations Devel-opment Assistance Framework, 2001-2005. Beijing. (http://www.unchina.org/html/undaf.pdf)
USEPA (United States Environmental Protection Agency).2001. (www.epa.gov)
Wang Guifang, Chen Liexian, Song Ruijin, Zhao Keqin, ShiLiwei, Jing Haining, and Li Xia, 2000. A Survey on AirPollution in Office Rooms. Environment & Health Journal.vol. 17(3): 156-157.
Wang Huijiong, Gan Shijun and Li Shantong, 1999. SustainableDevelopment and Economic Structures. Science PublishingHouse. Beijing. p.221-225, 277.
Wang, J. et al. 2000. Establishing the Investment and FinancingSystems for China’s Environmental Protection Industryunder a Market-based Economy: Forum for the develop-ment strategy of China’s environmental protection industry.Beijing: China’s Environmental Protection Industry Asso-ciation.
Wang Junping. 1999. China Economy Times, June 24.Wang, L. 1988. Journal of Beijing Medicine.WCED, 1987. Our Common Future. Oxford: Oxford Univ
Press. p.8.Wen, Bo. 1998. Greening the Chinese Media. China Environ-
ment Series, no. 2. (http://ecsp.si.edu/Ecsp_pdf.htm)World Bank. 1999. World Development Indicators. Washing-
ton, D.C.: World Bank.World Bank. 2001. World Development Indicators. Washing-
ton, D.C.: World Bank.World Resources Institute (WRI). 1998. World Resources:
1998-1999. New York: Oxford Univ. Press.Wu, C., C. Maurer, Y. Wang, S. Xue and D.L. Davis. 1999.
Water Pollution and Human Health in China. EnvironmentalHealth Perspectives, vol. 107 (4): 251-256.
Wu, Douglas. 2000. China’s Quiet Property Rights Revolu-tion. Cato Policy Report, vol. 22 (6). (www.cato.org/pubs/policy_report/v22n6/china.pdf)
Xie Zhenhua and Song Ruixiang. 1999. A circular Concerningthe Distribution of Speeches by Director Xie Zhenhua andVice Director Song Ruixiang at the Working Conference ofthe 1999 National Environmental Protection Affairs, docu-ment HF, no. 79. Beijing: SEPA.
Xu, S. 1999. Food and Public Health. In Cao et al. (eds.).China Environment and Health Profile. Beijing: China Envi-ronmental Science Press.
Yan, Ruizhen. 1994. Cultivated Land Soil and Water Loss andControl Measures in China. Bulletin of Soil and Water Con-servation. vol. 14(2): 32-36
Young, Nick and Anthony Woo. 2000. An Introduction to theNon-profit Sector in China. London: Allavida.
Zhang Chengyuan. 2000. Promotion of the Output of Staplesand Protection of Environment and Natural Resources. InSustainable Development of Rural China in the 21st Century.Beijing: Social Sciences and Philology Press.
Zhang Endi and Zheng Hanchen (eds). 2000. Conservation ofEndangered Medicinal Wildlife Resources in China. Shang-hai: Second Military Medical University Press.
Zhang Kunmin. 1999. China’s Sustainable Development Strat-egy and International Co-operation Environment. KeynoteSpeech Paper at the International Seminar on Global Envi-ronmental Strategy, IGES, March 12, 1999, Japan.
Zhang Lijun. 1996. China Environmental Yearbook 1995.Beijing: National Environmental Protection Agency (NEPA).
Zhang, Q. 2001. Personal communication.Zhao Yongxi. 1998. The Human Destruction is the Main Cause
of Desertification. People’s Daily. July 24, 1998(5).Zhou, F.Q. and Zhou D.D. (eds). 1999. Study on Long Term
Energy Development Strategies of China (ZhongguoZhongchangqi Nengyuan Zhanlue). Beijing: China PlanningPublishing House.
Zhou Lun, Yu Da, Yu Hai, and Chen Kun, 2000. Relationshipbetween microcystin toxins in drinking water and occur-rence of large intestine cancer. China Preventive MedicalScience Journal. China Medical Society, vol 34(4): 224-226.
Ziegler, Dominic. 2000. A Survey of China: Now Comes theHard Part. Economist, April 8.

References
UNDP104

China Human Development Report 1
Human Development Index and Environmental Indicators in China
A
1. IntroductionWhile we recognize that the concept of human develop-ment is much richer and broader than what can be cap-tured in any single or composite index, there is a need forindicators to measure human progress. Thus the humandevelopment index (HDI) mirrors achievements in themost basic human characteristics: longevity, knowledgeand standard of living. As a composite index, the HDIthus contains three variables: life expectancy, educationalattainment (adult literacy and combined primary, second-ary and tertiary enrolment) and real GDP per capita (inPPP$). The HDI is a broader measure than per capitaincome. Income is only a means to human development,not an end. By concentrating on aspects beyond in-come and treating income as a proxy for a decent stand-ard of living, the HDI provides a more comprehensivepicture of human life than income only (global HumanDevelopment Report 1999, p128). Still the HDI is not asubstitute for the fuller treatment of the richness of theconcerns of the human development perspective.
2. What is New in the HDIThe Human Development Index used in this report iscomputed for the provinces of China with the follow-ing new data and approaches:(1) The latest provincial data on economic, social and
demographic indicators.(2) The new method initially adopted in global Human
Development Report 1999, proven to be more rea-sonable in treating adjusted income index.
Also for the first time, environmental indicators are in-troduced into the CHDR to reflect quality of environ-ment and achievement in environmental protection acrossprovinces.
3. Data DescriptionThe data used to compute provincial HDI in this reportinclude:(1) the provincial data on life-expectancy at birth in
19951, which are estimated by using the data from1% sampling population survey in 1995
(2) the provincial data on rate of literacy for populationaged over 15 years old in 1999 based on a nationalsurvey of 0.976‰ sampling of the population2
(3) the provincial enrolment ratios of primary, second-ary and tertiary education in 1999
(4) the provincial GDP per capita in 1999. The reportalso includes provincial environmental indicators inlatest years3.
4. Methods for Computing HDI4.1 For the reasons of consistency and comparability,the report adopts the procedure of computing HDI in-vented by UNDP teams preparing country HDI for theglobal Human Development Report 1999, to compute theHDI for every province in mainland China. The compu-tation of provincial HDI is based on three indicators:longevity, as measured by life-expectancy at birth; edu-cational attainment, as measured by a combination ofadult literacy (two-thirds weight) and combined primary,secondary and tertiary enrolment ratios (one-thirdweight); and standard of living, as measured by real GDPper capita in terms of PPP$.
4.2 For the construction of the provincial HDI, fixedminimum and maximum values are established for eachof these indicators:(1) Life-expectancy at birth: 25 years and 85 years.(2) Adult literacy: 0% and 100%.(3) Combined enrolment ratio: 0% and 100%
Annex
Human Development Index andEnvironmental Indicators in China
1 Qi Xin, Ma Jin, Gao Xinhua, Gao Yumei and Ren Huijuan, ‘1995 Provincial Table of Life Expectancy by Gender in China’, Population andEconomy (in Chinese), 5-6, 1999 and 1-4, 2000. The 1995 table is the latest published data which can be found for the provinces.2 Part of the aggregated data is published in China Statistical Yearbook 2000 (pp 100-109).3 The data mainly come from China Statistical Yearbook 2000 (pp 769-785), China Environmental Statistics 1998 and China EnvironmentalYearbook 1998.

Annex
UNDP2A
(4) Real GDP per capita (PPP$): 0% and 100%
For any component of the HDI individual indices canbe computed according to the general formula:
value Ximinimum - value XiMaximumvalue Ximinimum - value XiActual Index =
Taking Beijing as an example, the 1995 life expectancyat birth in Beijing is 69, so given a minimum value as25 and maximum value as 85, the index of life expect-ancy for Beijing can be computed as
0.73325 - 8525 - 69 Index Expectancy Life ==
4.3 Computing the income index for the year of 1999 fol-lows a new approach treating income suggested in theGlobal Human Development Report 1999. The new meth-odology is based on a more solid analytical foundation,which is discussed in detail in the report (pp. 159-160).Accordingly, to construct the provincial HDI for thisyear, income is treated using the following formula:
(Ymin) Log - (Ymax) Log(Ymin) Log - (Y) Log
W(y)=
Before treating income, the provincial GDP per capitais converted into real income in terms of PPP$. Ac-cording to the Human Development Report 1999(p159), the PPP ratio of Chinese yuan to US dollar in1999 is estimated as 1:2.08754 . This ratio is used forconverting the provincial GDP per capita into real in-come measured in PPP$.
5. Illustration of the HDI MethodologyThe construction of the provincial HDI is illustratedwith two examples - Guangdong Province and GuizhouProvince.Life Expectancy Index: given that life-expectancy atbirth is 74.2 in Guangdong and 66.2 in Guizhou and us-ing the general formula above, the life expectancy in-dex in the two provinces can be computed as follows.
0.69 25 - 8525 - 66.2Guizhou ==
Adult Literacy Index: given that literate ratio is 90.8 inGuangdong and 75.5 in Guizhou and using minimum
value as 0 and maximum value as 100, the adult literacyindex in the two provinces can be computed as follows.
0.908 0 - 1000 - 90.8 Guangdong ==
0.755 0 - 1000 - 75.5Guizhou ==
Combined Gross Enrolment Index: given that the com-bined gross enrolment ratio is 64.6 in Guangdong and60.8 in Guizhou and using minimum value as 0 and maxi-mum value as 100, the combined gross enrolment in-dex in the two provinces can be computed as follows.
0.646 0 - 1000 - 64.6 Guangdong ==
0.6080 - 1000 - 60.8 Guizhou ==
Educational Attainment Index is derived by comput-ing weighted average of the adult literacy index and thecombined gross enrolment index, where two thirds giv-ing to the former index and one thirds to the latter in-dex.
Guangdong = [2×0.908 + 0.646]/3 = 0.82
Guizhou = [2×0.755 + 0.608]/3 = 0.71
Adjusted Real GDP per capita (PPS$) index: (the ad-justed real GDP per capita in terms of PPP$ in 1999 is5618 for Guangdong Province and 1186 for GuizhouProvince)
0.67 (100) Log - (40000) Log
(100) Log - (5618) Log Guangdong ==
0.41 (100) Log - (40000) Log
(100) Log - (1186) Log Guizhou ==
6. Provincial HDI for Guangdong andGuizhou:The HDI is a simple average of the life expectancy in-dex, educational attainment index and adjusted real GDPper capita (PPP$) index and so is derived by dividingthe sum of these three indices by 3.
0.82 25 - 8525 - 74.2 Guangdong ==
Province Lifeexpectancy
index
Educationalattainment
index
Adjustedreal GDP
index
Sum ofthe threeindices
HDI
Guangdong 0.82 0.82 0.67 2.31 0.77
Guizhou 0.69 0.71 0.41 1.81 0.60
4 The figure of GDP per capita in 1999 in Chinese currency is given as 6534 yuan in China Statistical Yearbook 2000, while theHuman Development Report 1999 estimates real income for China as 3130 PPP$.

China Human Development Report 3
Human Development Index and Environmental Indicators in China
A
Sources: (1) Qi Xin, Ma Jin, Gao Xinhua, Gao Yumei, and Ren Huijuan, ‘1995 Provincial Table of Life Expect-ancy by Gender in China ‘ , Population and Economy (in Chinese), 5-6, 1999 and 1-4, 2000. (2) ChinaStatistical Yearbook 2000, China Statistical Publisher.
Table A.1 HDI and its Components by Province, 1999
Province HDI Life expectancyindex
Educationindex
Income index Rank ofHDI
Shanghai 0.8528 0.8412 0.8837 0.8336 1
Beijing 0.8453 0.8568 0.9188 0.7602 2
Tianjin 0.8008 0.8133 0.8651 0.7240 3
Guangdong 0.7708 0.8194 0.8205 0.6724 4
Liaoning 0.7635 0.7878 0.8555 0.6472 5
Zhejiang 0.7584 0.8132 0.7855 0.6767 6
Jiangsu 0.7500 0.8066 0.7868 0.6565 7
Fujian 0.7326 0.7790 0.760 0.6586 8
Heilongjiang 0.7318 0.7660 0.8281 0.6013 9
Shandong 0.7239 0.8093 0.7403 0.6220 10
Hebei 0.7229 0.7815 0.8026 0.5846 11
Jilin 0.7204 0.7414 0.8500 0.5697 12
Hainan 0.7105 0.7891 0.7716 0.5709 13
Shanxi 0.7101 0.7883 0.8213 0.5207 14
Xinjiang 0.7068 0.7349 0.8124 0.5731 15
Hubei 0.6973 0.7278 0.7899 0.5742 16
Henan 0.6856 0.7672 0.7630 0.5265 17
Chongqing 0.6838 0.7316 0.7957 0.5242 18
Hunan 0.6829 0.7038 0.8113 0.5336 19
Shaanxi 0.6802 0.7599 0.7838 0.4970 20
Guangxi 0.6799 0.7540 0.7868 0.4989 21
Inner Mongolia 0.6790 0.7248 0.7709 0.5414 22
Anhui 0.6747 0.7673 0.7368 0.5200 23
Jiangxi 0.6730 0.7096 0.7911 0.5184 24
Sichuan 0.6711 0.7316 0.7710 0.5107 25
Ningxia 0.6596 0.7549 0.7123 0.5115 26
Yunnan 0.6323 0.6753 0.7108 0.5107 27
Gansu 0.6322 0.7096 0.7088 0.4784 28
Qinghai 0.6249 0.6926 0.6637 0.5184 29
Guizhou 0.6020 0.6872 0.7062 0.4128 30
Tibet 0.5212 0.6421 0.4181 0.5034 31

Annex
UNDP4A
0
0.1
0.2
0.3
0.4
0.5
0.6
0.7
0.8
0.9
Sha
ngha
i
Bei
jing
Tia
njin
Gu
an
gd
on
g
Lia
on
ing
Zhe
jiang
Jia
ngsu
Fuj
ian
Hei
long
jiang
Sh
an
do
ng
Heb
ei
Jili
n
Ha
ina
n
Sha
nxi
Xin
jiang
Hub
ei
He
na
n
Ch
on
gq
ing
Hu
na
n
Sha
anxi
Gua
ngxi
Inn
er M
ongo
lia
Anh
ui
Jia
ngxi
Sic
huan
Nin
gxia
Yun
nan
Gan
su
Qin
ghai
Gui
zhou
Tib
et
Province
Life
Exp
ecte
ncy
Inde
x
Fig. A.2 Provincial Life Expectancy Index
Fig. A.1 Provincial Human Development Index 1999
0
0.1
0.2
0.3
0.4
0.5
0.6
0.7
0.8
0.9
Sha
ngha
i
B
eijin
g
Ti
anjin
G
uang
dong
Li
aoni
ng
Zh
ejia
ng
Ji
angs
u
Fu
jian
H
eilo
ngjia
ng
S
hand
ong
H
ebei
Ji
lin
H
aina
n
S
hanx
i
X
injia
ng
H
ubei
H
enan
C
hong
qing
H
unan
S
haan
xi
G
uang
xi
In
ner
Mon
golia
A
nhui
Ji
angx
i
S
ichu
an
N
ingx
ia
Y
unna
n
G
ansu
Q
ingh
ai
G
uizh
ou
T
ibet
Province
HD
I

China Human Development Report 5
Human Development Index and Environmental Indicators in China
A
0
0.1
0.2
0.3
0.4
0.5
0.6
0.7
0.8
0.9
S
hang
hai
B
eijin
g
Ti
anjin
G
uang
dong
Li
aoni
ng
Zh
ejia
ng
Ji
angs
u
Fu
jian
H
eilo
ngjia
ng
S
hand
ong
H
ebei
Ji
lin
H
aina
n
S
hanx
i
X
injia
ng
H
ubei
H
enan
C
hong
qing
H
unan
S
haan
xi
G
uang
xi
In
ner
Mon
golia
A
nhui
Ji
angx
i
S
ichu
an
N
ingx
ia
Y
unna
n
G
ansu
Q
ingh
ai
G
uizh
ou
T
ibet
Province
Inco
me
Inde
x
Fig. A.4 Provincial Income Index 1999
0
0.1
0.2
0.3
0.4
0.5
0.6
0.7
0.8
0.9
1 S
hang
hai
Bei
jing
Tia
njin
Gua
ngdo
ng
Lia
onin
g
Zhe
jiang
Jia
ngsu
Fuj
ian
Hei
long
jiang
Sha
ndon
g
Heb
ei
Jili
n
Hai
nan
Sha
nxi
Xin
jiang
Hub
ei
Hen
an
Cho
ngqi
ng
Hun
an
Sha
anxi
Gua
ngxi
Inn
er M
ongo
lia
Anh
ui
Jia
ngxi
Sic
huan
Nin
gxia
Yun
nan
Gan
su
Qin
ghai
Gui
zhou
Tib
et
Province
Edu
catio
n In
dex
Fig. A.3 Provincial Education Index 1999
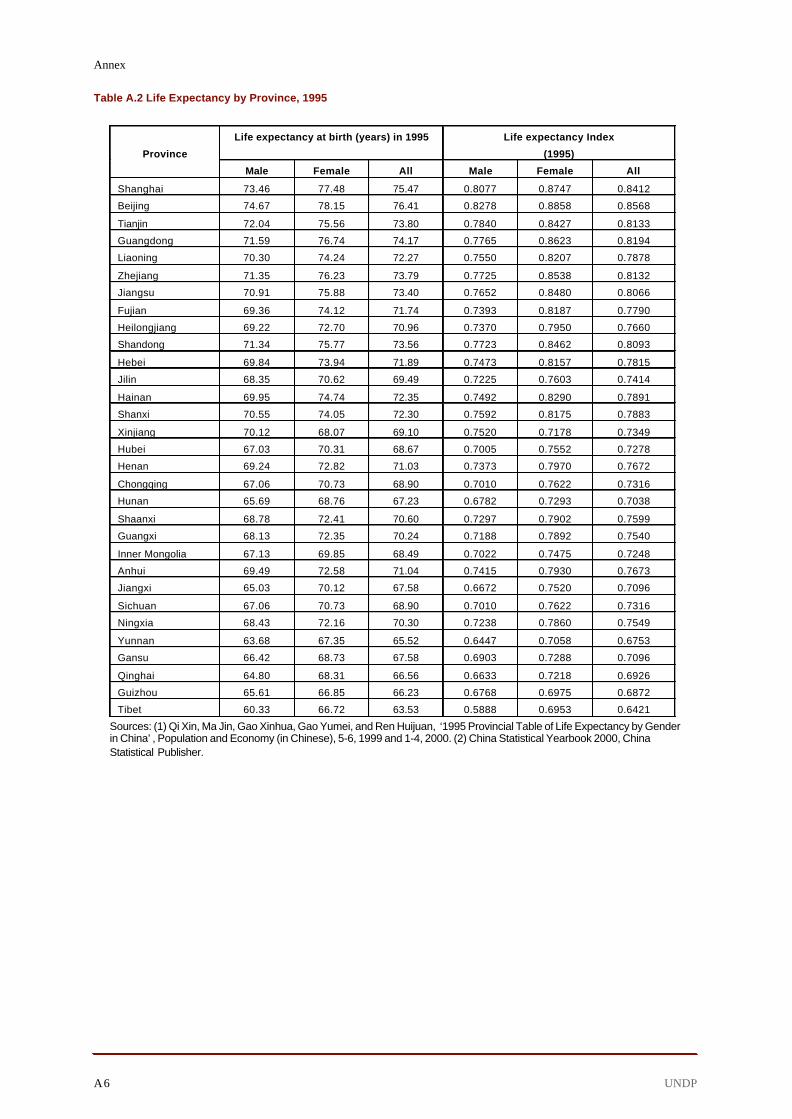
Annex
UNDP6A
Sources: (1) Qi Xin, Ma Jin, Gao Xinhua, Gao Yumei, and Ren Huijuan, ‘1995 Provincial Table of Life Expectancy by Genderin China’ , Population and Economy (in Chinese), 5-6, 1999 and 1-4, 2000. (2) China Statistical Yearbook 2000, ChinaStatistical Publisher.
Life expectancy at birth (years) in 1995 Life expectancy Index
(1995)Province
Male Female All Male Female All
Shanghai 73.46 77.48 75.47 0.8077 0.8747 0.8412
Beijing 74.67 78.15 76.41 0.8278 0.8858 0.8568
Tianjin 72.04 75.56 73.80 0.7840 0.8427 0.8133
Guangdong 71.59 76.74 74.17 0.7765 0.8623 0.8194
Liaoning 70.30 74.24 72.27 0.7550 0.8207 0.7878
Zhejiang 71.35 76.23 73.79 0.7725 0.8538 0.8132
Jiangsu 70.91 75.88 73.40 0.7652 0.8480 0.8066
Fujian 69.36 74.12 71.74 0.7393 0.8187 0.7790
Heilongjiang 69.22 72.70 70.96 0.7370 0.7950 0.7660
Shandong 71.34 75.77 73.56 0.7723 0.8462 0.8093
Hebei 69.84 73.94 71.89 0.7473 0.8157 0.7815
Jilin 68.35 70.62 69.49 0.7225 0.7603 0.7414
Hainan 69.95 74.74 72.35 0.7492 0.8290 0.7891
Shanxi 70.55 74.05 72.30 0.7592 0.8175 0.7883
Xinjiang 70.12 68.07 69.10 0.7520 0.7178 0.7349
Hubei 67.03 70.31 68.67 0.7005 0.7552 0.7278
Henan 69.24 72.82 71.03 0.7373 0.7970 0.7672
Chongqing 67.06 70.73 68.90 0.7010 0.7622 0.7316
Hunan 65.69 68.76 67.23 0.6782 0.7293 0.7038
Shaanxi 68.78 72.41 70.60 0.7297 0.7902 0.7599
Guangxi 68.13 72.35 70.24 0.7188 0.7892 0.7540
Inner Mongolia 67.13 69.85 68.49 0.7022 0.7475 0.7248
Anhui 69.49 72.58 71.04 0.7415 0.7930 0.7673
Jiangxi 65.03 70.12 67.58 0.6672 0.7520 0.7096
Sichuan 67.06 70.73 68.90 0.7010 0.7622 0.7316
Ningxia 68.43 72.16 70.30 0.7238 0.7860 0.7549
Yunnan 63.68 67.35 65.52 0.6447 0.7058 0.6753
Gansu 66.42 68.73 67.58 0.6903 0.7288 0.7096
Qinghai 64.80 68.31 66.56 0.6633 0.7218 0.6926
Guizhou 65.61 66.85 66.23 0.6768 0.6975 0.6872
Tibet 60.33 66.72 63.53 0.5888 0.6953 0.6421
Table A.2 Life Expectancy by Province, 1995

China Human Development Report 7
Human Development Index and Environmental Indicators in China
A
Sources: (1) China Statistical Yearbook 2000, China Statistical Publisher.
1999
ProvinceGDP per capita in
China currencyReal GDP per capita
in PPP$ Income index
Shanghai 30805 14756.77 0.8336
Beijing 19846 9507.21 0.7602
Tianjin 15976 7653.33 0.7240
Guangdong 11728 5618.35 0.6724
Liaoning 10086 4831.76 0.6472
Zhejiang 12037 5766.02 0.6767
Jiangsu 10665 5109.01 0.6565
Fujian 10797 5172.16 0.6586
Heilongjiang 7660 3669.48 0.6013
Shandong 8673 4154.96 0.6220
Hebei 6932 3320.70 0.5846
Jilin 6341 3037.52 0.5697
Hainan 6383 3057.72 0.5709
Shanxi 4727 2264.21 0.5207
Xinjiang 6470 3099.27 0.5731
Hubei 6514 3120.47 0.5742
Henan 4894 2344.29 0.5265
Chongqing 4826 2311.94 0.5242
Hunan 5105 2445.38 0.5336
Shaanxi 4101 1964.79 0.4970
Guangxi 4148 1987.04 0.4989
Inner Mongolia 5350 2562.95 0.5414
Anhui 4707 2254.96 0.5200
Jiangxi 4661 2232.98 0.5184
Sichuan 4452 2132.65 0.5107
Ningxia 4473 2142.57 0.5115
Yunnan 4452 2132.81 0.5107
Gansu 3668 1757.02 0.4784
Qinghai 4662 2233.50 0.5184
Guizhou 2475 1185.77 0.4128
Tibet 4262 2041.55 0.5034
Table A.3 GDP per Capita and Income Index by province, 1999

Annex
UNDP8A
Province Enrolmentrate in
primaryeducation
Enrolmentrate in
secondaryeducation
Enrolmentrate intertiary
education
Combined1,2,3 level
grossEnrolment
rate
Adult literacyratio
Educationalindex
Shanghai 0.9997 0.8998 0.5747 0.8248 0.9132 0.8837
Beijing 0.9995 0.8908 0.7659 0.8854 0.9355 0.9188
Tianjin 0.9999 0.8029 0.4652 0.7560 0.9197 0.8651
Guangdong 0.9977 0.6676 0.2727 0.6460 0.9077 0.8205
Liaoning 0.9938 0.7127 0.4241 0.7102 0.9282 0.8555
Zhejiang 0.9988 0.7915 0.2208 0.6704 0.8430 0.7855
Jiangsu 0.9984 0.7678 0.3228 0.6963 0.8321 0.7868
Fujian 0.9977 0.6929 0.2599 0.6502 0.8154 0.7603
Heilongjiang 0.9882 0.6674 0.3830 0.6796 0.9023 0.8281
Shandong 0.9962 0.7075 0.1682 0.6240 0.7985 0.7403
Hebei 0.9979 0.7078 0.2025 0.6361 0.8858 0.8026
Jilin 0.9956 0.7378 0.3251 0.6862 0.9319 0.8500
Hainan 0.9939 0.6251 0.2006 0.6065 0.8542 0.7716
Shanxi 0.9965 0.6935 0.2499 0.6466 0.9086 0.8213
Xinjiang 0.9658 0.7302 0.2017 0.6326 0.9023 0.8124
Hubei 0.9962 0.7203 0.2917 0.6694 0.8502 0.7899
Henan 0.996 0.6678 0.1821 0.6153 0.8369 0.7630
Chongqing 0.9574 0.7126 0.3759 0.6820 0.8525 0.7957
Hunan 0.9855 0.6959 0.2885 0.6566 0.8887 0.8113
Shaanxi 0.9925 0.7800 0.3790 0.7172 0.8171 0.7838
Guangxi 0.9854 0.6208 0.2157 0.6073 0.8765 0.7868
Inner Mongolia 0.994 0.7929 0.1374 0.6414 0.8356 0.7709
Anhui 0.9972 0.6828 0.1677 0.6159 0.7972 0.7368
Jiangxi 0.9956 0.6709 0.2427 0.6364 0.8685 0.7911
Sichuan 0.9619 0.7117 0.2717 0.6484 0.8323 0.7710
Ningxia 0.967 0.6668 0.1761 0.6033 0.7668 0.7123
Yunnan 0.9836 0.6480 0.2263 0.6193 0.7566 0.7108
Gansu 0.9768 0.6895 0.2511 0.6391 0.7436 0.7088
Qinghai 0.9046 0.7586 0.1412 0.6014 0.6948 0.6637
Guizhou 0.9738 0.6013 0.2485 0.6079 0.7554 0.7062
Tibet 0.782 0.5652 0.3863 0.5779 0.3382 0.4181
Table A.4 Education Index and Enrolment Rate in Provinces
Sources: (1) China Statistical Yearbook 2000, China Statistical Publisher.
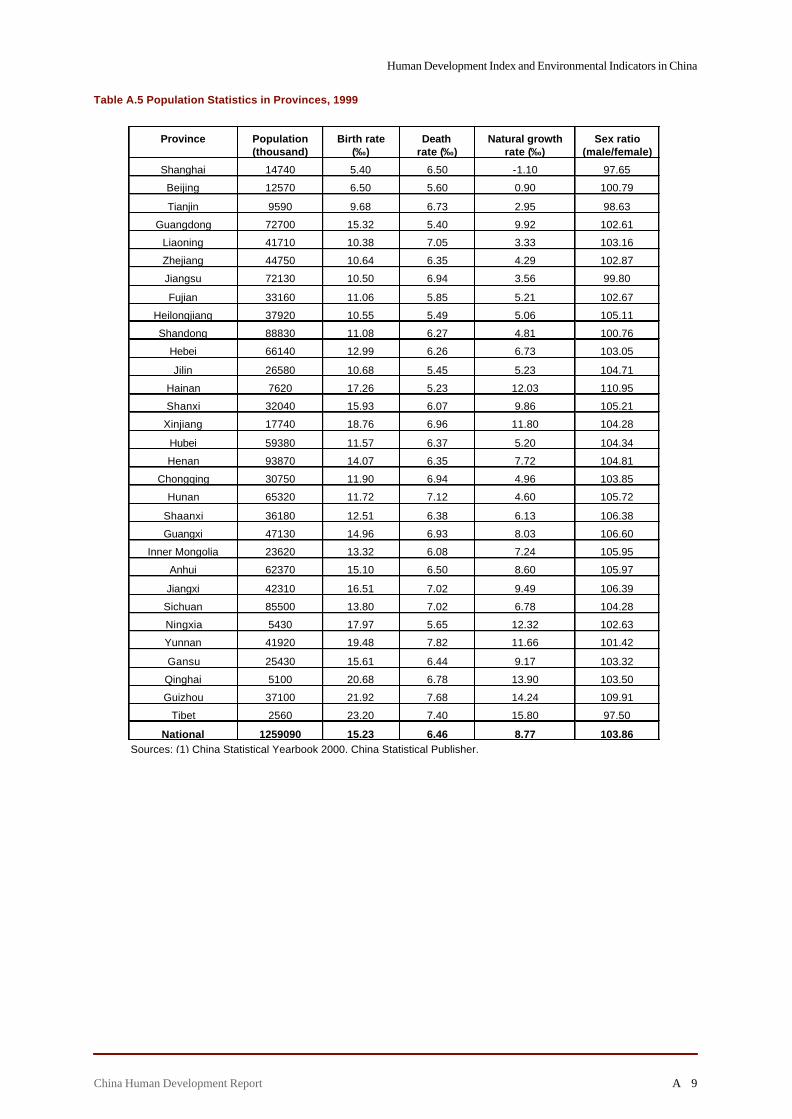
China Human Development Report 9
Human Development Index and Environmental Indicators in China
A
Province Population
(thousand) Birth rate
(‰) Death
rate (‰) Natural growth
rate (‰) Sex ratio
(male/female)
Shanghai 14740 5.40 6.50 -1.10 97.65
Beijing 12570 6.50 5.60 0.90 100.79
Tianjin 9590 9.68 6.73 2.95 98.63
Guangdong 72700 15.32 5.40 9.92 102.61
Liaoning 41710 10.38 7.05 3.33 103.16
Zhejiang 44750 10.64 6.35 4.29 102.87
Jiangsu 72130 10.50 6.94 3.56 99.80
Fujian 33160 11.06 5.85 5.21 102.67
Heilongjiang 37920 10.55 5.49 5.06 105.11
Shandong 88830 11.08 6.27 4.81 100.76
Hebei 66140 12.99 6.26 6.73 103.05
Jilin 26580 10.68 5.45 5.23 104.71
Hainan 7620 17.26 5.23 12.03 110.95
Shanxi 32040 15.93 6.07 9.86 105.21
Xinjiang 17740 18.76 6.96 11.80 104.28
Hubei 59380 11.57 6.37 5.20 104.34
Henan 93870 14.07 6.35 7.72 104.81
Chongqing 30750 11.90 6.94 4.96 103.85
Hunan 65320 11.72 7.12 4.60 105.72
Shaanxi 36180 12.51 6.38 6.13 106.38
Guangxi 47130 14.96 6.93 8.03 106.60
Inner Mongolia 23620 13.32 6.08 7.24 105.95
Anhui 62370 15.10 6.50 8.60 105.97
Jiangxi 42310 16.51 7.02 9.49 106.39
Sichuan 85500 13.80 7.02 6.78 104.28
Ningxia 5430 17.97 5.65 12.32 102.63
Yunnan 41920 19.48 7.82 11.66 101.42
Gansu 25430 15.61 6.44 9.17 103.32
Qinghai 5100 20.68 6.78 13.90 103.50
Guizhou 37100 21.92 7.68 14.24 109.91
Tibet 2560 23.20 7.40 15.80 97.50
National 1259090 15.23 6.46 8.77 103.86 Sources: (1) China Statistical Yearbook 2000, China Statistical Publisher.
Table A.5 Population Statistics in Provinces, 1999

Annex
UNDP10A
-2
0
2
4
6
8
10
12
14
16
18S
hang
hai
Bei
jing
Tian
jin
Gua
ngdo
ng
Liao
ning
Zhej
iang
Jian
gsu
Fujia
n
Hei
long
jiang
Sha
ndon
g
Heb
ei
Jilin
Hai
nan
Sha
nxi
Xin
jiang
Hub
ei
Hen
an
Cho
ngqi
ng
Hun
an
Sha
anxi
Gua
ngxi
Inne
r M
ongo
lia
Anh
ui
Jian
gxi
Sic
huan
Nin
gxia
Yun
nan
Gan
su
Qin
ghai
Gui
zhou
Tibe
t
Province
Pop
ulat
ion
Gro
wth
Rat
e
%0
Fig. A.5 Provincial Natural Growth Rate of Population 1999
0
5000
10000
15000
20000
25000
30000
35000
Sha
ngha
i
Bei
jing
Tia
njin
Gua
ngdo
ng
Liao
ning
Zhej
iang
Jian
gsu
Fuj
ian
Hei
long
jiang
Sha
ndon
g
Heb
ei
Jilin
Hai
nan
Sha
nxi
Xin
jiang
Hub
ei
Hen
an
Cho
ngqi
ng
Hun
an
Sha
anxi
Gua
ngxi
Inne
r Mon
golia
Anh
ui
Jian
gxi
Sic
huan
Nin
gxia
Yun
nan
Gan
su
Qin
ghai
Gui
zhou
Tib
et
yuan
Fig. A.6 Provincial GDP per Capita, 1999

China Human Development Report 11
Human Development Index and Environmental Indicators in China
A
Sources: (1) China Statistical Yearbook 2000, China Statistical Publisher.
Province GDP per capita inyuan
Share of Primaryindustry (%)
Share of secondaryindustry (%)
Share of Tertiaryindustry (%)
Shanghai 30805 2.0 48.4 49.6
Beijing 19846 4.0 38.7 57.3
Tianjin 15976 4.9 49.1 46.0
Guangdong 11728 12.1 50.4 37.6
Liaoning 10086 12.5 48.0 39.5
Zhejiang 12037 11.8 54.1 34.1
Jiangsu 10665 13.0 50.9 36.1
Fujian 10797 17.7 42.5 39.8
Heilongjiang 7660 13.0 54.8 32.2
Shandong 8673 15.9 48.4 35.7
Hebei 6932 17.6 49.1 33.3
Jilin 6341 25.4 40.2 34.4
Hainan 6383 37.4 20.1 42.4
Shanxi 4727 10.6 50.5 38.9
Xinjiang 6470 23.0 39.4 37.6
Hubei 6514 17.0 48.9 34.1
Henan 4894 24.5 45.3 30.2
Chongqing 4826 19.2 40.8 39.9
Hunan 5105 23.4 39.0 37.6
Shaanxi 4101 18.0 43.1 38.9
Guangxi 4148 28.4 35.6 36.0
Inner Mongolia 5350 27.0 40.6 32.3
Anhui 4707 25.5 44.0 30.5
Jiangxi 4661 23.7 38.6 37.7
Sichuan 4452 25.4 41.9 32.7
Ningxia 4473 19.9 42.5 37.6
Yunnan 4452 22.2 44.5 33.3
Gansu 3668 20.5 45.5 34.0
Qinghai 4662 17.0 41.1 41.9
Guizhou 2475 29.3 38.2 32.4
Tibet 4262 32.4 22.7 44.9
National 6534 17.7 49.3 33.0
Table A.6 Provincial GDP per Capita and its Components, 1999

Annex
UNDP12A
Sources: (1) China Statistical Yearbook 2000, China Statistical Publisher.
Province Illiterate Primaryschool
Lower middleschool
Upper middleschool College
Shanghai 3.2 11.3 40.6 29.8 15.1
Beijing 1.5 8.1 39.4 28.1 23.0
Tianjin 2.9 19.1 41.7 25.1 11.1
Guangdong 4.1 32.0 44.1 14.8 5.0
Liaoning 2.9 26.6 50.2 13.3 7.0
Zhejiang 10.3 34.9 39.4 12.4 3.0
Jiangsu 11.5 29.4 40.1 14.0 5.0
Fujian 12.4 39.5 33.0 11.9 3.2
Heilongjiang 4.9 27.5 48.3 14.3 4.9
Shandong 13.9 29.0 44.4 10.4 2.2
Hebei 6.4 30.4 46.7 12.6 3.9
Jilin 3.5 29.0 42.9 18.7 5.9
Hainan 11.6 28.6 40.2 14.4 5.1
Shanxi 5.3 25.8 49.7 14.1 5.1
Xinjiang 7.1 32.4 33.4 16.7 10.5
Hubei 10.9 32.8 39.6 12.7 4.0
Henan 12.4 27.0 47.7 10.6 2.3
Chongqing 10.9 44.3 33.2 9.0 2.7
Hunan 6.9 36.7 39.8 13.2 3.4
Shaanxi 14.0 27.4 39.3 15.1 4.2
Guangxi 8.1 42.5 40.2 8.2 0.9
Inner Mongolia 12.7 29.1 36.6 16.4 5.1
Anhui 16.2 35.6 39.4 6.8 2.0
Jiangxi 8.1 43.0 33.7 11.9 3.3
Sichuan 13.4 43.4 33.5 7.5 2.2
Ningxia 22.0 26.9 35.1 11.6 4.4
Yunnan 20.5 47.7 25.3 5.1 1.4
Gansu 23.6 30.9 31.1 11.3 3.2
Qinghai 29.6 30.1 23.5 11.5 5.3
Guizhou 22.8 40.7 26.0 7.8 2.7
Tibet 67.4 28.5 4.0 0.1 0.0
National 11.0 33.3 39.9 11.9 3.9
Table A.7 Proportion of Employees with Different Education Level, 1999 (%)

China Human Development Report 13
Human Development Index and Environmental Indicators in China
A
Fig. A.8 Provincial Illiterate Ratio of Female Population, 1999
0
10
20
30
40
50
60
70
80
Sha
ngha
i
Bei
jing
Tia
njin
Gua
ngdo
ng
Liao
ning
Zhe
jiang
Jian
gsu
Fuj
ian
Hei
long
jiang
Sha
ndon
g
Heb
ei
Jilin
Hai
nan
Sha
nxi
Xin
jiang
Hub
ei
Hen
an
Cho
ngqi
ng
Hun
an
Sha
anxi
Gua
ngxi
Inne
r M
ongo
lia
Anh
ui
Jian
gxi
Sic
huan
Nin
gxia
Yun
nan
Gan
su
Qin
ghai
Gui
zhou
Tib
et
%
Fig. A.7 Provincial Illiterate Ratio, 1999
0
10
20
30
40
50
60
70
80S
hang
hai
Bei
jing
Tia
njin
Gua
ngdo
ng
Liao
ning
Zhe
jiang
Jian
gsu
Fuj
ian
Hei
long
jiang
Sha
ndon
g
Heb
ei
Jilin
Hai
nan
Sha
nxi
Xin
jiang
Hub
ei
Hen
an
Cho
ngqi
ng
Hun
an
Sha
anxi
Gua
ngxi
Inne
r Mon
golia
Anh
ui
Jian
gxi
Sic
huan
Nin
gxia
Yun
nan
Gan
su
Qin
ghai
Gui
zhou
Tib
et
%

Annex
UNDP14A
Sources: (1) China Statistical Yearbook 2000, China Statistical Publisher.
Province Illiterate Primary
school Lower middle
school Upper middle
school College
Shanghai 1.3 10.8 41.5 29.3 17.1
Beijing 1.2 8.2 42.7 25.2 22.7
Tianjin 2.2 19.1 44.3 23.5 10.9
Guangdong 2.4 27.2 46.8 17.4 6.2
Liaoning 2.1 24.6 52.4 13.5 7.4
Zhejiang 7.0 34.0 42.4 13.0 3.6
Jiangsu 5.5 26.7 45.2 16.2 6.3
Fujian 6.8 35.6 39.9 13.6 4.0
Heilongjiang 3.7 25.2 51.4 14.7 5.0
Shandong 8.5 25.9 49.7 13.1 2.8
Hebei 4.5 27.0 50.4 13.7 4.4
Jilin 2.8 26.8 45.4 18.7 6.2
Hainan 6.1 24.3 44.3 18.2 7.1
Shanxi 4.4 23.1 52.4 14.8 5.3
Xinjiang 6.1 30.2 36.8 16.5 10.4
Hubei 6.7 29.6 44.5 14.3 4.9
Henan 7.9 24.7 52.0 12.5 2.8
Chongqing 6.7 43.1 36.9 10.0 3.3
Hunan 3.9 34.2 42.7 14.8 4.3
Shaanxi 9.7 25.4 42.6 17.2 5.1
Guangxi 3.8 38.6 46.5 10.0 1.1
Inner Mongolia 8.8 28.2 40.6 16.9 5.6
Anhui 11.0 30.7 47.3 8.4 2.5
Jiangxi 4.7 36.6 40.4 14.3 4.0
Sichuan 8.9 42.4 37.6 8.5 2.6
Ningxia 14.2 27.5 39.9 12.8 5.6
Yunnan 13.3 49.8 29.5 5.7 1.6
Gansu 15.1 29.6 37.6 13.6 4.0
Qinghai 19.2 33.1 29.3 12.0 6.4
Guizhou 12.1 42.5 32.9 9.2 3.3
Tibet 59.1 36.5 4.2 0.1 0.0
National 6.9 30.8 44.4 13.4 4.5
Table A.7a Proportion of Male Employees with Different Education Level, 1999 (%)

China Human Development Report 15
Human Development Index and Environmental Indicators in China
A
Province Illiterate Primary school
Lower middle school
Upper middle school
College
Shanghai 5.5 11.9 39.5 30.5 12.6
Beijing 1.8 8.1 35.2 31.6 23.3
Tianjin 3.9 19.0 38.4 27.2 11.4
Guangdong 5.9 37.2 41.3 11.9 3.7
Liaoning 3.8 29.1 47.5 13.1 6.5
Zhejiang 14.3 36.0 35.7 11.6 2.4
Jiangsu 18.1 32.3 34.6 11.6 3.5
Fujian 19.3 44.4 24.5 9.7 2.1
Heilongjiang 6.6 30.5 44.1 13.8 4.8
Shandong 20.0 32.6 38.4 7.5 1.5
Hebei 8.7 34.3 42.4 11.4 3.2
Jilin 4.3 31.7 39.9 18.7 5.5
Hainan 18.0 33.4 35.6 10.1 3.0
Shanxi 6.6 29.3 46.1 13.1 4.9
Xinjiang 8.2 35.0 29.3 16.9 10.6
Hubei 15.7 36.5 34.0 10.8 2.9
Henan 17.2 29.6 43.0 8.5 1.7
Chongqing 15.5 45.6 29.0 7.8 2.0
Hunan 10.3 39.7 36.4 11.2 2.4
Shaanxi 19.0 29.7 35.4 12.7 3.1
Guangxi 12.8 46.7 33.5 6.3 0.7
Inner Mongolia 17.8 30.3 31.5 15.8 4.6
Anhui 22.0 41.1 30.5 5.1 1.3
Jiangxi 12.3 50.7 25.6 9.0 2.3
Sichuan 18.2 44.5 29.1 6.4 1.8
Ningxia 30.7 26.2 29.8 10.2 3.1
Yunnan 28.2 45.4 20.7 4.5 1.2
Gansu 32.8 32.2 24.0 8.8 2.2
Qinghai 41.4 26.7 16.7 10.9 4 .2
Guizhou 35.1 38.6 18.2 6.1 2.0
Tibet 75.7 20.6 3.7
National 15.8 36.1 34.8 10.2 3.1
Table A.7b Proportion of Female Employees with Different Education Level, 1999 (%)
Sources: (1) China Statistical Yearbook 2000, China Statistical Publisher.

Annex
UNDP16A
Province Total revenue (million)
Total expenditure (million)
Fiscal revenue per capita (yuan)
Fiscal expenditure per capita (yuan)
Shanghai 41995.13 53353.64 2849.1 3619.6
Beijing 28136.61 35519.32 2238.4 2825.7
Tianjin 11280.73 15741.22 1176.3 1641.4
Guangdong 76618.82 96589.90 1053.9 1328.6
Liaoning 27963.90 45790.16 670.4 1097.8
Zhejiang 24547.21 34404.24 548.5 768.8
Jiangsu 34336.47 48465.06 476.0 671.9
Fujian 20892.18 27923.61 630.0 842.1
Heilongjiang 17012.76 33903.42 448.6 894.1
Shandong 40448.29 55000.34 455.3 619.2
Hebei 22327.57 35079.69 337.6 530.4
Jilin 10128.21 23462.31 381.0 882.7
Hainan 3614.41 5678.31 474.3 745.2
Shanxi 10917.85 18533.88 340.8 578.5
Xinjiang 7131.10 16627.88 402.0 937.3
Hubei 19444.25 33645.52 327.5 566.6
Henan 22335.08 38431.57 237.9 409.4
Chongqing 7673.41 15023.65 249.5 488.6
Hunan 16649.94 31312.40 254.9 479.4
Shaanxi 10640.33 20651.73 294.1 570.8
Guangxi 13356.47 22497.75 283.4 477.4
Inner Mongolia 8657.14 19979.64 366.5 845.9
Anhui 17429.17 28860.31 279.4 462.7
Jiangxi 10513.71 20782.93 248.5 491.2
Sichuan 21147.56 36349.81 247.3 425.1
Ningxia 1883.93 4953.46 346.9 912.2
Yunnan 17266.90 37804.68 411.9 901.8
Gansu 5836.57 14778.68 229.5 581.2
Qinghai 1417.36 5571.91 277.9 1092.5
Guizhou 7426.18 17071.63 200.2 460.2
Tibet 457.31 5325.44 178.6 2080.3
National 559486.55 899114.09 444.4 714.1
Table A.8 Fiscal Revenue and Expenditure by Province, 1999
Sources: (1) China Statistical Yearbook 2000, China Statistical Publisher.

China Human Development Report 17
Human Development Index and Environmental Indicators in China
A
0
500
1000
1500
2000
2500
3000
3500
4000
Sha
ngha
i
Bei
jing
Tian
jin
Gua
ngdo
ng
Liao
ning
Zhej
iang
Jian
gsu
Fujia
n
Hei
long
jiang
Sha
ndon
g
Heb
ei
Jilin
Hai
nan
Sha
nxi
Xin
jiang
Hub
ei
Hen
an
Cho
ngqi
ng
Hun
an
Sha
anxi
Gua
ngxi
Inne
r M
ongo
lia
Anh
ui
Jian
gxi
Sic
huan
Nin
gxia
Yun
nan
Gan
su
Qin
ghai
Gui
zhou
Tibe
t
Revenue
Expenditure
Fig. A.9 Per Capita Fiscal Revenue and Expenditure by Province 1999 (yuan)
0
2000
4000
6000
8000
10000
12000
Sha
ngha
i
Bei
jing
Tia
njin
Gua
ngdo
ng
Liao
ning
Zhe
jiang
Jian
gsu
Fuj
ian
Hei
long
jiang
Sha
ndon
g
Heb
ei
Jilin
Hai
nan
Sha
nxi
Xin
jiang
Hub
ei
Hen
an
Cho
ngqi
ng
Hun
an
Sha
anxi
Gua
ngxi
Inne
r M
ongo
lia
Anh
ui
Jian
gxi
Sic
huan
Nin
gxia
Yun
nan
Gan
su
Qin
ghai
Gui
zhou
Tib
et
Urban Rural
yuan
Fig. A.10 Household Income per Capita in Rural and Urban Areas, 1999

Annex
UNDP18A
Province
Household income per
capita (yuan)
Income of Staff &
Workers in State- owned
Units
Income of Staff &
Workers in Collective
owned Units
Income of Staff & Workers in
Other Types of Ownership
Income from
Property
Transfer Income
Shanghai 10988.90 4951.22 301.03 1027.32 68.32 3411.25
Beijing 9238.80 5146.22 296.64 736.87 91.91 2467.26
Tianjin 7670.94 3715.91 123.88 443.92 138.14 2352.18
Guangdong 9205.60 5090.94 784.08 760.25 432.77 1261.88
Liaoning 4924.55 2399.45 449.58 118.64 50.00 1297.24
Zhejiang 8476.41 4045.14 690.28 967.54 179.98 1748.20
Jiangsu 6587.35 3213.34 737.14 213.04 112.20 1891.78
Fujian 6913.91 3631.62 547.46 268.27 176.31 1339.69
Heilongjiang 4619.51 2601.34 193.43 21.32 43.59 1216.30
Shandong 5840.54 4263.24 479.37 175.27 108.08 661.83
Hebei 5394.61 3547.31 245.94 46.96 131.45 1032.47
Jilin 4499.10 2715.81 277.69 18.05 31.39 982.83
Hainan 5384.96 3348.09 109.25 36.70 90.40 1242.03
Shanxi 4362.13 2549.62 133.65 148.38 75.81 1184.18
Xinjiang 5359.70 3734.96 110.38 11.60 45.00 1176.81
Hubei 5234.54 3426.05 310.93 75.38 137.78 917.58
Henan 4553.74 2916.06 184.22 14.47 210.59 1008.41
Chongqing 5915.55 3972.83 376.56 123.28 104.68 1024.44
Hunan 5855.81 4121.52 331.22 134.36 153.86 925.83
Shaanxi 4678.81 2707.02 118.11 32.77 213.69 1318.22
Guangxi 5648.46 3764.87 188.75 42.24 289.45 866.50
Inner Mongolia 4798.52 2919.83 143.38 31.49 79.60 936.49
Anhui 5101.77 3032.84 482.58 143.85 69.95 962.26
Jiangxi 4746.30 3221.46 231.55 19.07 197.00 825.79
Sichuan 5510.00 3656.62 311.83 145.16 152.68 847.42
Ningxia 4508.88 2570.31 178.22 41.85 82.33 1141.33
Yunnan 6234.59 4301.42 447.17 57.54 112.77 978.30
Gansu 4502.26 3236.23 210.57 17.70 35.31 700.84
Qinghai 4727.42 3011.22 123.33 4.49 50.66 1136.42
Guizhou 4953.17 3316.14 182.91 15.64 44.69 977.40
Tibet 6955.62 5946.64 307.74 31.13 85.06 417.66
National 5888.77 3448.40 345.24 214.76 128.65 1257.17
Table A.9 Urban Household Income per Capita and its Components, 1999
Sources: (1) China Statistical Yearbook 2000, China Statistical Publisher.

China Human Development Report 19
Human Development Index and Environmental Indicators in China
A
Province
Household net income per
capita
Basic income
Labor wages
Income from Household business
Transfer income
Property income
Shanghai 5409.11 5048.50 4191.80 856.69 233.26 127.36
Beijing 4226.59 3912.11 2600.60 1311.51 209.38 105.11
Tianjin 3411.11 3271.65 1444.73 1826.92 89.93 49.52
Guangdong 3628.95 3340.15 1104.17 2235.98 229.84 58.96
Liaoning 2501.04 2403.97 816.38 1587.59 70.34 26.73
Zhejiang 3948.39 3634.27 1737.81 1896.46 219.51 94.61
Jiangsu 3495.20 3313.23 1620.65 1692.58 134.78 47.19
Fujian 3091.39 2786.16 981.20 1804.96 263.74 41.49
Heilongjiang 2165.93 2088.52 285.32 1803.20 57.19 20.22
Shandong 2549.58 2390.90 791.15 1599.75 89.79 68.89
Hebei 2441.50 2328.65 896.28 1432.37 60.30 52.56
Jilin 2260.59 2220.59 283.02 1937.57 29.75 10.25
Hainan 2087.46 1895.79 54.23 1841.56 145.63 46.04
Shanxi 1772.62 1696.10 682.36 1013.74 60.79 15.73
Xinjiang 1473.17 1408.65 109.19 1299.46 29.83 34.69
Hubei 2217.08 2092.98 496.40 1596.58 107.62 16.47
Henan 1948.36 1856.56 408.33 1448.22 64.62 27.18
Chongqing 1736.63 1557.09 451.32 1105.77 168.33 11.21
Hunan 2127.46 2057.63 706.75 1350.88 59.29 10.55
Shaanxi 1455.86 1358.75 438.04 920.71 71.06 26.05
Guangxi 2048.33 1918.41 395.75 1522.66 117.33 12.59
Inner Mongolia 2002.93 1948.61 259.38 1689.23 41.07 13.24
Anhui 1900.29 1790.36 470.69 1319.67 92.33 17.61
Jiangxi 2129.45 2011.63 614.98 1396.65 98.57 19.25
Sichuan 1843.47 1722.00 530.40 1191.60 101.74 19.74
Ningxia 1754.15 1680.97 460.14 1220.83 58.03 15.15
Yunnan 1437.63 1334.43 215.26 1119.16 77.17 26.03
Gansu 1357.28 1277.46 278.10 999.36 72.52 7.30
Qinghai 1466.67 1410.49 277.16 1133.33 45.57 10.60
Guizhou 1363.07 1282.62 263.50 1019.12 74.65 5.80
Tibet 1309.46 1242.87 98.21 1144.66 62.10 4.49
National 2210.34 2078.62 630.26 1448.36 100.17 31.55
Table A.10 Rural Household Income per Capita and its Components, 1999
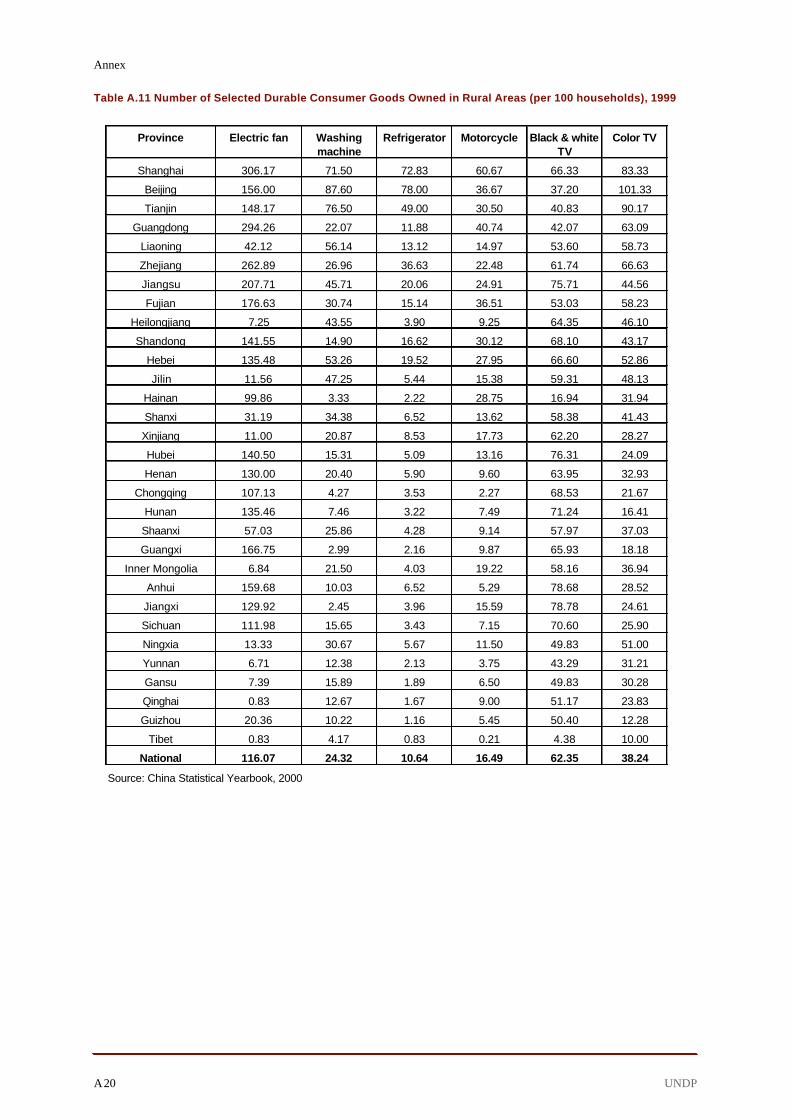
Annex
UNDP20A
Province Electric fan Washingmachine
Refrigerator Motorcycle Black & whiteTV
Color TV
Shanghai 306.17 71.50 72.83 60.67 66.33 83.33
Beijing 156.00 87.60 78.00 36.67 37.20 101.33
Tianjin 148.17 76.50 49.00 30.50 40.83 90.17
Guangdong 294.26 22.07 11.88 40.74 42.07 63.09
Liaoning 42.12 56.14 13.12 14.97 53.60 58.73
Zhejiang 262.89 26.96 36.63 22.48 61.74 66.63
Jiangsu 207.71 45.71 20.06 24.91 75.71 44.56
Fujian 176.63 30.74 15.14 36.51 53.03 58.23
Heilongjiang 7.25 43.55 3.90 9.25 64.35 46.10
Shandong 141.55 14.90 16.62 30.12 68.10 43.17
Hebei 135.48 53.26 19.52 27.95 66.60 52.86
Jilin 11.56 47.25 5.44 15.38 59.31 48.13
Hainan 99.86 3.33 2.22 28.75 16.94 31.94
Shanxi 31.19 34.38 6.52 13.62 58.38 41.43
Xinjiang 11.00 20.87 8.53 17.73 62.20 28.27
Hubei 140.50 15.31 5.09 13.16 76.31 24.09
Henan 130.00 20.40 5.90 9.60 63.95 32.93
Chongqing 107.13 4.27 3.53 2.27 68.53 21.67
Hunan 135.46 7.46 3.22 7.49 71.24 16.41
Shaanxi 57.03 25.86 4.28 9.14 57.97 37.03
Guangxi 166.75 2.99 2.16 9.87 65.93 18.18
Inner Mongolia 6.84 21.50 4.03 19.22 58.16 36.94
Anhui 159.68 10.03 6.52 5.29 78.68 28.52
Jiangxi 129.92 2.45 3.96 15.59 78.78 24.61
Sichuan 111.98 15.65 3.43 7.15 70.60 25.90
Ningxia 13.33 30.67 5.67 11.50 49.83 51.00
Yunnan 6.71 12.38 2.13 3.75 43.29 31.21
Gansu 7.39 15.89 1.89 6.50 49.83 30.28
Qinghai 0.83 12.67 1.67 9.00 51.17 23.83
Guizhou 20.36 10.22 1.16 5.45 50.40 12.28
Tibet 0.83 4.17 0.83 0.21 4.38 10.00
National 116.07 24.32 10.64 16.49 62.35 38.24
Table A.11 Number of Selected Durable Consumer Goods Owned in Rural Areas (per 100 households), 1999
Source: China Statistical Yearbook, 2000

China Human Development Report 21
Human Development Index and Environmental Indicators in China
A
Province Motorcycle Auto-mobile WashingMachine
ElectricFan
Refrigerator Color TV Set
Shanghai 2.00 0.00 93.40 230.80 103.00 144.20
Beijing 6.00 2.50 99.60 145.40 102.80 141.40
Tianjin 10.20 0.00 97.40 131.40 98.80 131.20
Guangdong 51.08 0.69 97.06 325.62 81.03 130.34
Liaoning 6.96 0.49 85.51 69.03 78.38 109.04
Zhejiang 14.45 0.37 92.37 271.86 98.71 130.86
Jiangsu 18.63 0.00 97.05 271.02 81.51 113.48
Fujian 27.51 0.39 93.99 240.49 84.78 115.42
Heilongjiang 5.38 0.11 87.31 42.95 59.17 99.44
Shandong 25.50 0.05 89.62 193.56 87.04 110.72
Hebei 30.79 0.32 93.72 177.42 83.00 107.96
Jilin 4.06 0.17 90.77 59.34 61.20 99.17
Hainan 36.33 0.00 76.55 187.39 50.52 106.42
Shanxi 15.58 0.28 94.54 78.28 71.10 106.25
Xinjiang 7.65 1.11 91.29 44.79 77.97 104.08
Hubei 8.49 0.08 92.99 238.09 85.77 103.80
Henan 14.15 0.06 89.59 221.09 70.20 101.85
Chongqing 1.00 0.67 95.00 210.67 99.33 120.67
Hunan 13.47 0.23 94.05 252.21 85.45 106.68
Shaanxi 6.59 0.14 93.49 150.01 72.42 112.20
Guangxi 31.01 0.44 92.49 316.53 79.05 109.71
Inner Mongolia 22.91 0.62 89.79 44.35 66.65 104.91
Anhui 11.28 0.28 87.43 242.02 78.35 99.08
Jiangxi 11.03 0.32 80.39 263.51 73.03 100.18
Sichuan 7.57 0.63 94.51 199.22 81.56 116.26
Ningxia 11.21 0.00 89.84 64.51 68.60 110.95
Yunnan 10.96 0.29 96.03 29.39 65.17 109.94
Gansu 7.38 0.41 95.73 38.87 67.17 111.25
Qinghai 9.09 0.00 98.18 2.18 69.82 107.82
Guizhou 13.49 0.00 95.08 100.17 78.81 109.30
Tibet 6.00 3.00 81.00 4.00 69.00 119.00
National 15.12 0.34 91.44 171.73 77.74 111.57
Table A.12 Number of Selected Durable Consumer Goods Owned in Urban Areas (per 100 households), 1999
Sources: (1) China Statistical Yearbook 2000, China Statistical Publisher

Annex
UNDP22A
ProvinceProduction
capacity of tapwater (10000
tons/day)
Total annualvolume of water
supply(10000 tons)
Forresidential
use
Forproduction
Use
Number ofresidents
with accessto tap water
(10000)
Per capita dailyresidential
consumption oftap water
(liter)
Shanghai 1428.63 289648 110434 115630 1127.22 268.41
Beijing 507.25 110744 73459 27863 764.19 263.36
Tianjin 320.20 65334 28025 26375 521.91 147.12
Guangdong 1982.07 440042 236959 181993 1883.44 344.69
Liaoning 1389.18 311418 109187 169552 1705.92 175.36
Zhejiang 954.11 176228 71920 84742 974.95 202.10
Jiangsu 1585.48 339066 138264 173487 1425.36 265.76
Fujian 621.46 128678 53275 66565 560.26 260.52
Heilongjiang 670.42 155923 56005 87308 1027.77 149.29
Shandong 1140.72 240016 90748 138097 1673.04 148.61
Hebei 995.88 198156 90096 97536 1053.19 234.37
Jilin 684.72 152151 39462 97107 708.29 152.64
Hainan 145.33 25787 15640 4904 169.51 252.78
Shanxi 350.70 88000 34579 48338 667.23 141.99
Xinjiang 286.74 47771 23562 19871 402.13 160.53
Hubei 1512.80 348126 133520 186517 1445.51 253.07
Henan 915.64 195184 79271 100733 1183.31 183.54
Chongqing 324.72 59838 34162 24888 559.75 167.21
Hunan 1242.26 283226 89522 168247 847.69 289.33
Shaanxi 306.63 79742 38984 30800 554.40 192.65
Guangxi 609.72 138248 58640 67409 529.05 303.67
Inner Mongolia 237.26 61916 21596 36692 425.74 138.97
Anhui 941.38 194832 60687 122185 768.87 216.25
Jiangxi 622.71 130998 48524 71503 564.20 235.63
Sichuan 882.19 195831 76324 107286 1027.23 203.56
Ningxia 104.00 25165 8429 13278 107.89 214.04
Yunnan 210.75 49270 28036 15846 379.65 202.32
Gansu 293.63 78636 19391 51394 362.54 146.54
Qinghai 59.59 14107 6033 7416 88.14 187.53
Guizhou 211.97 46009 17989 19710 356.76 138.15
Tibet 13.80 4986 3502 1484 20.60 465.75
National 21551.94 4675076 1896225 2364756 23885.74 217.50
Table A.13 Tap Water Supply in Cities by Province, 1999
Source: China Statistical Yearbook, 2000

China Human Development Report 23
Human Development Index and Environmental Indicators in China
A
Table A.14 Supply and Use of Gas in Cities by Province, 1999
Total gas supply Population with access to gas(10000 persons)Province Production
capacity of coalgas (10000cu.m/day)
Coal gas(10000 cu.m)
Liquefiedpetroleumgas (ton)
Naturalgas(10000
cu.m)Coal gas
Liquefiedpetroleum
gasNatural gas
Shanghai 684.00 207056 192951 9813 561.70 328.70 32.70
Beijing 205.00 61549 173042 64833 109.81 256.30 242.07
Tianjin 68.00 10085 53342 17882 72.20 109.52 273.64
Guangdong 68.00 10956 2183087 453 139.55 1206.17 6.59
Liaoning 198.80 80116 336906 24440 423.52 574.93 378.19
Zhejiang 34.00 25766 614278 44.74 525.34
Jiangsu 170.27 350299 695826 323.88 814.09
Fujian 10.00 3683 269246 11.39 343.09
Heilongjiang 209.00 24842 507414 3907 198.28 541.72 41.83
Shandong 151.00 40665 281750 79970 328.43 853.41 40.33
Hebei 112.80 43730 181860 4581 250.99 460.23 24.66
Jilin 64.50 16009 154205 10194 158.26 340.52 61.72
Hainan 74922 114.80
Shanxi 114.23 50469 29932 4762 277.40 106.01 34.06
Xinjiang 204344 3453 310.21 12.06
Hubei 135.80 24720 272579 2360 178.83 798.54 9.00
Henan 22.80 77831 151220 55326 106.60 423.63 169.15
Chongqing 10.00 2 49576 111001 0.16 28.81 290.47
Hunan 38.00 74550 189579 72.82 432.45
Shaanxi 17.40 6313 61353 9853 44.28 179.17 84.67
Guangxi 2764 186693 14.43 361.95
Inner Mongolia 16.40 7238 49320 67.80 178.09
Anhui 70.72 27773 374899 166.61 352.35
Jiangxi 37.00 38746 75533 116.68 200.04
Sichuan 105868 66137 395711 29.29 83.79 516.74
Ningxia 2783 22340 6 9.31 66.13 0.35
Yunnan 65.00 14588 72425 33 89.56 138.35 1.60
Gansu 55.80 5685 34945 55.01 83.43
Qinghai 24 11025 1560 2.50 31.10 3.10
Guizhou 34.80 6815 26275 418 64.29 82.93 2.20
Tibet 15680 10.46
National 2593.32 1320925 7612684 800556 3918.32 10336.26 2225.13
Source: China Statistical Yearbook, 2000

Annex
UNDP24A
Table A.15 Sanitation Statistics in Cities by Province, 1999
Province
Length ofsewer pipelines
(km)
Daily disposalcapacity of
sewage(10000 tons)
Volume ofgarbagedisposal
(10000 tons)
Volume ofexcrement &
urine disposal(10000 tons)
Number ofpublic
lavatories(unit)
Watercloset
Shanghai 4577.00 524.30 499.80 217.00 1150 1150
Beijing 4067.47 14.87 449.50 273.50 5900 5482
Tianjin 6731.00 95.00 211.30 19.10 2610 1480
Guangdong 14903.46 176.58 840.65 125.11 4150 3598
Liaoning 8098.52 107.43 878.91 152.21 10862 994
Zhejiang 6587.95 115.78 413.87 118.07 2808 2313
Jiangsu 10382.05 366.76 505.06 309.66 7337 5467
Fujian 3400.30 50.76 230.44 33.52 1352 1308
Heilongjiang 4678.57 199.00 943.82 237.38 10386 806
Shandong 11682.23 30.70 711.70 133.41 5063 2952
Hebei 6873.69 87.34 544.99 118.88 6385 1538
Jilin 3530.78 2.98 646.47 133.73 6942 623
Hainan 1496.19 10.78 67.28 8.56 403 381
Shanxi 2488.01 7.83 365.38 160.92 3508 887
Xinjiang 1915.48 37.80 267.36 25.17 1640 1053
Hubei 6363.10 237.78 599.29 70.39 4747 3146
Henan 5761.47 38.86 535.83 70.79 4255 2524
Chongqing 1954.42 54.97 144.20 187.05 2816 1543
Hunan 4921.89 67.60 316.82 23.21 2922 1762
Shaanxi 1810.57 23.10 204.92 17.50 1388 662
Guangxi 2788.70 113.49 171.73 21.26 1170 984
Inner Mongolia 2442.18 3.52 312.54 98.12 3826 436
Anhui 3998.17 160.90 327.31 52.05 4790 2298
Jiangxi 1983.91 16.15 175.51 24.79 1871 1027
Sichuan 5012.18 20.12 360.22 78.30 3322 2363
Ningxia 460.00 7.89 77.45 9.31 939 260
Yunnan 1912.10 57.40 147.47 61.85 1483 819
Gansu 1645.08 23.92 223.62 37.52 956 405
Qinghai 206.06 92.30 7.64 259 132
Guizhou 1593.44 0.90 120.35 15.61 1733 825
Tibet 220.00 29.10 2.11 91 70
National 134485.97 2654.51 11415.19 2843.72 107064 49288
Source: China Statistical Yearbook, 2000

China Human Development Report 25
Human Development Index and Environmental Indicators in China
A
Table A.16 Public Facilities in Cities by Province, 1999
Province Percentage ofpopulation with
access to tap water
Percentage ofpopulation with
access togas
Number of publicbuses and trolleybuses per 10000
persons
Per capita publicgreen areas (sq.m)
Shanghai 100.00 99.99 19.46 3.44
Beijing 100.00 97.10 23.98 7.96
Tianjin 100.00 94.97 9.81 4.87
Guangdong 97.47 93.00 8.46 10.11
Liaoning 97.72 88.90 7.95 6.09
Zhejiang 99.79 97.11 12.75 6.96
Jiangsu 99.10 94.87 9.69 7.99
Fujian 98.01 87.26 9.78 7.02
Heilongjiang 85.57 69.65 6.59 6.58
Shandong 97.31 87.93 7.52 7.30
Hebei 99.45 91.01 7.59 6.16
Jilin 88.08 72.69 7.25 5.99
Hainan 94.40 91.80 13.45 13.30
Shanxi 97.03 73.71 5.48 4.07
Xinjiang 98.14 92.47 12.82 6.21
Hubei 98.34 83.47 11.91 9.15
Henan 94.89 68.74 6.58 5.99
Chongqing 96.53 73.03 8.62 2.37
Hunan 97.85 75.54 10.32 4.87
Shaanxi 97.85 64.88 7.10 5.02
Guangxi 98.67 89.72 5.44 7.44
Inner Mongolia 88.62 54.11 3.71 5.99
Anhui 92.80 73.20 6.98 6.67
Jiangxi 93.23 65.80 6.17 5.78
Sichuan 96.85 72.43 7.13 4.38
Ningxia 97.72 76.63 6.47 4.25
Yunnan 98.02 78.76 12.88 7.76
Gansu 94.24 43.92 6.54 3.60
Qinghai 97.54 48.89 9.39 3.22
Guizhou 94.34 50.72 13.83 7.61
Tibet 74.72 65.13 28.21 29.38
National 96.30 81.74 9.36 6.54
Source: China Statistical Yearbook, 2000

Annex
UNDP26A
0
20
40
60
80
100
120
Sha
ngha
i
Bei
jing
Tia
njin
Gua
ngdo
ng
Liao
ning
Zhe
jiang
Jian
gsu
Fuj
ian
Hei
long
jiang
Sha
ndon
g
Heb
ei
Jilin
Hai
nan
Sha
nxi
Xin
jiang
Hub
ei
Hen
an
Cho
ngqi
ng
Hun
an
Sha
anxi
Gua
ngxi
Inne
r Mon
golia
Anh
ui
Jian
gxi
Sic
huan
Nin
gxia
Yun
nan
Gan
su
Qin
ghai
Gui
zhou
Tibe
t
Fig. A.12 Percentage of Population with Access to Gas in Cities, 1999
0
50
100
150
200
250
300
350
400
450
500S
hang
hai
Bei
jing
Tia
njin
Gua
ngdo
ng
Liao
ning
Zhe
jiang
Jian
gsu
Fuj
ian
Hei
long
jiang
Sha
ndon
g
Heb
ei
Jilin
Hai
nan
Sha
nxi
Xin
jiang
Hub
ei
Hen
an
Cho
ngqi
ng
Hun
an
Sha
anxi
Gua
ngxi
Inne
r M
ongo
lia
Anh
ui
Jian
gxi
Sic
huan
Nin
gxia
Yun
nan
Gan
su
Qin
ghai
Gui
zhou
Tibe
t
Litre
Fig. A.11 Per Capita Daily Residential Consumption of Tap Water in Cities, 1999

China Human Development Report 27
Human Development Index and Environmental Indicators in China
A
Province Totalconsumption(10000 tons)
Nitrogenousfertilizer
Phosphatefertilizer
Potashfertilizer
Compoundfertilizer
Shanghai 20.4 16.0 1.7 0.5 2.3
Beijing 19.0 11.6 1.1 0.4 5.9
Tianjin 15.8 8.8 1.8 0.8 4.5
Guangdong 172.8 95.3 18.6 34.2 24.8
Liaoning 116.3 73.0 11.2 7.8 24.3
Zhejiang 92.7 61.9 12.7 5.7 12.4
Jiangsu 335.4 191.3 52.4 15.2 76.6
Fujian 124.3 56.7 17.2 24.1 26.3
Heilongjiang 126.3 55.2 31.0 10.6 29.6
Shandong 419.3 201.1 57.9 34.5 125.9
Hebei 272.4 151.2 44.1 16.2 61.0
Jilin 116.2 69.3 5.7 8.5 32.7
Hainan 19.4 5.7 1.6 2.6 9.5
Shanxi 86.0 42.3 20.1 4.9 18.7
Xinjiang 78.3 42.5 18.4 2.4 15.1
Hubei 251.5 128.2 62.6 16.8 44.0
Henan 399.9 200.4 91.3 34.4 73.8
Chongqing 71.0 45.8 15.6 2.5 7.0
Hunan 180.9 98.0 24.5 30.4 28.0
Shaanxi 132.0 75.1 17.7 6.9 32.4
Guangxi 153.8 55.2 22.4 35.3 40.8
Inner Mongolia 76.0 45.0 13.2 2.8 15.0
Anhui 255.7 121.0 44.6 24.7 65.4
Jiangxi 116.7 55.1 21.3 19.2 21.1
Sichuan 210.3 124.2 40.4 9.3 36.4
Ningxia 29.3 21.4 3.0 0.1 4.8
Yunnan 90.5 52.9 15.3 7.8 14.5
Gansu 64.5 30.9 18.4 2.4 12.8
Qinghai 7.3 3.5 1.3 0.3 2.2
Guizhou 67.7 41.2 10.5 4.6 11.4
Tibet 2.7 1.3 0.4 0.2 0.9
National 4124.3 2180.9 697.8 365.6 880.0
Table A.17 Consumption of Chemical Fertilizers in Rural Areas by Province, 1999
Source: China Statistical Yearbook, 2000

Annex
UNDP28A
Flood Drought
ProvinceAreas
covered(1000 ha)
Areasaffected(1000 ha)
Areascovered
Areasaffected
Areascovered
Areasaffected
Shanghai 259 110 85 36
Beijing 123 73 97 60
Tianjin 226 125 190 110
Guangdong 1580 687 85 27 507 197
Liaoning 1280 1020 21 5 1190 964
Zhejiang 757 459 539 336
Jiangsu 3190 1290 549 254 1110 474
Fujian 876 580 314 159 17 10
Heilongjiang 1440 650 142 83 809 388
Shandong 3000 1230 231 121 2570 1000
Hebei 3620 2170 12 9 3090 1870
Jilin 1124 698 14 7 980 628
Hainan 363 166 17 10 212 55
Shanxi 3000 2090 45 28 2710 1910
Xinjiang 865 523 126 87.4 166 121
Hubei 2830 1330 1366 731 1102 511
Henan 3670 1890 73 37 2960 1680
Chongqing 1850 820 387 198 952 437
Hunan 1530 936 1070 689 218 110
Shaanxi 2520 1490 185 101 2120 1268
Guangxi 2200 918 372 149 1020 392
Inner Mongolia 3840 1980 52 35 3470 1745
Anhui 2860 1560 947 605 1480 770
Jiangxi 747 456 638 399 45 13
Sichuan 976 512 468 281 351 171
Ningxia 347 261 77 48 233 187
Yunnan 1410 836 429 239 545 367
Gansu 1810 1060 178 70 1310 867
Qinghai 420 217 47 27 340 177
Guizhou 1230 575 529 283 362 132
Tibet 36.5 21.7 22 16
National 49981 26731 9020 5071 30156 16614
Table A.18 Areas Covered and Affected by Natural Disasters by Province, 1999
Source: China Statistical Yearbook, 2000

China Human Development Report 29
Human Development Index and Environmental Indicators in China
A
Province Number ofagencies
(unit)
Number ofstaff &
workers
Scientific &technical staff
Monitoringpersonnel
Supervising &administrative
personnelShanghai 86 1987 188 804 391
Beijing 65 1136 184 375 148
Tianjin 73 1418 189 562 78
Guangdong 1001 6269 220 1702 1340
Liaoning 459 6376 626 2109 1641
Zhejiang 302 3718 240 1832 563
Jiangsu 880 6637 181 2664 1502
Fujian 349 3046 199 1091 701
Heilongjiang 414 4110 168 1468 1033
Shandong 601 10364 262 3423 2651
Hebei 604 8186 205 1607 1803
Jilin 265 3998 209 1289 1491
Hainan 66 1161 30 366 256
Shanxi 429 7243 148 2396 1877
Xinjiang 206 1811 89 678 343
Hubei 420 6366 246 1930 1916
Henan 617 11815 289 3209 3551
Chongqing 151 1694 12 654 363
Hunan 541 5974 240 2019 1103
Shaanxi 341 3985 99 1378 1034
Guangxi 263 1853 115 764 248
Inner Mongolia 513 2995 164 1044 261
Anhui 362 3872 166 1437 825
Jiangxi 346 3166 169 1075 764
Sichuan 428 3942 144 1836 818
Ningxia 62 602 52 156 98
Yunnan 344 1278 170 730 189
Gansu 227 2136 98 642 557
Qinghai 78 337 21 129 59
Guizhou 275 1802 146 591 435
Tibet 19 137 50
National 10811 121049 5269 40010 28039
Table A.19 Environmental Protection Agencies and Staff by Province, 1999
Source: China Statistical Yearbook, 2000

Annex
UNDP30A
ProvinceNumber ofsurveyed
enterprises(unit)
Total volumeof waste
waterdischarged(10000 ton)
Of whichvolume up
to thedischargestandards
Number offacilities for
treatingwastewater
Volume ofwaste water
treated(10000 ton)
Volume ofwastewater
reusedafter
treatment
Volume oftreated waste
water up tothe discharge
standards(10000 ton)
Shanghai 2045 85280 76664 2079 122495 82407 36958
Beijing 1211 28085 23493 793 105493 91054 12417
Tianjin 1404 14185 11568 829 29039 22440 4570
Guangdong 6763 114844 70062 6646 128068 54629 49930
Liaoning 2525 116040 83280 2214 180902 126418 46922
Zhejiang 5239 117170 94166 4397 95476 36577 52311
Jiangsu 6724 201039 175983 4301 193051 106784 79317
Fujian 3687 53620 35980 3000 58834 27906 22241
Heilongjiang 1936 53736 36608 1278 96305 74850 15072
Shandong 5543 107975 84116 3944 303303 231246 62120
Hebei 2915 97420 61549 3258 282681 240310 37068
Jilin 1111 38795 24241 870 38384 22278 13261
Hainan 303 7114 3823 236 5024 1214 2938
Shanxi 2773 42588 21280 2064 98648 82810 11379
Xinjiang 810 16919 7348 430 19314 11303 4492
Hubei 2147 115985 69385 1970 160710 117642 30346
Henan 3401 94952 67413 3368 228477 175686 42575
Chongqing 1327 90220 58380 1207 107366 68006 32901
Hunan 3103 126146 73510 2955 141629 74090 43625
Shaanxi 1824 31569 18900 1641 39582 25633 11094
Guangxi 1828 87542 42536 1958 97538 57088 21570
Inner Mongolia 1142 22954 11000 590 42921 35794 4307
Anhui 1834 63616 50407 1608 127526 98726 26423
Jiangxi 1054 42493 26222 1300 55626 32507 15932
Sichuan 3377 94536 46696 3313 100936 69468 19574
Ningxia 235 8954 2801 274 11112 7987 1192
Yunnan 1347 37123 11592 1391 77292 62914 5277
Gansu 1247 29576 16395 824 40172 27170 8623
Qinghai 221 4093 2862 116 2989 1208 1501
Guizhou 1858 26067 7768 1156 39970 31148 3991
Tibet 63 2398 12 25 1509 1506
National 70997 1973036 1316043 60035 3032373 2098802 719927
Table A.20 Discharge and Treatment of Industrial Wastewater by Province, 1999
Source: China Statistical Yearbook, 2000

China Human Development Report 31
Human Development Index and Environmental Indicators in China
A
Table A.21 Emission and Treatment of Industrial Waste Gas by Province, 1999
ProvinceNumber ofsurveyed
enterprises(unit)
Number offacilities for
treatingwaste gas
Total volumeof waste gas
emission(100 million
cu.m)
Volume ofwaste gas
in theprocess of
fuelburning
Volume ofgas with
soot & dustremoved
Volume ofwaste gasfrom the
process ofproduction
Volumeof gas
purified
Shanghai 2045 4034 4947 2821 2417 2126 1896
Beijing 1211 3660 3083 1777 1586 1306 1202
Tianjin 1404 2520 1570 1132 1031 438 389
Guangdong 6763 10771 7165 4312 3730 2853 2606
Liaoning 2525 7260 8880 5586 4616 3295 2753
Zhejiang 5239 8618 5417 3570 3244 1847 1511
Jiangsu 6724 10221 8343 6373 6049 1970 1561
Fujian 3687 5072 2321 1118 1054 1203 911
Heilongjiang 1936 4741 4059 3287 3172 771 662
Shandong 5543 9841 6443 6008 3398 2903
Hebei 2915 8342 9032 4577 4221 4456 3866
Jilin 1111 3709 3008 2107 2000 901 507
Hainan 303 328 341 210 199 131 129
Shanxi 2773 5471 6287 3899 3407 2388 1397
Xinjiang 810 2144 1839 1210 1141 629 556
Hubei 2147 5111 5566 2492 2308 3075 2444
Henan 3401 7157 6943 4136 3603 2807 2237
Chongqing 1327 2133 1839 1047 897 792 646
Hunan 3103 5645 3787 1870 1674 1917 1648
Shaanxi 1824 3583 2337 1476 1380 860 627
Guangxi 1828 4345 4397 1651 1497 2746 2497
Inner Mongolia 1142 3298 5023 3629 2919 1393 1100
Anhui 1834 3341 3682 2089 1863 1593 1358
Jiangxi 1054 2326 1934 1124 907 809 648
Sichuan 3377 5510 4671 2244 1552 2427 1677
Ningxia 235 622 1102 766 753 336 122
Yunnan 1347 3016 2268 1125 861 1143 870
Gansu 1247 2757 2659 1344 1243 1315 1006
Qinghai 221 434 606 183 167 423 265
Guizhou 1858 2243 3845 2312 1521 1533 847
Tibet 63 47 16 9 3 7 3
National 70997 138934 126807 75919 67026 50887 40843
Source: China Statistical Yearbook, 2000

Annex
UNDP32A
ProvinceVolume ofSulphurdioxide
emission(ton)
Volume ofSulphurdioxide
removed(ton)
Volume ofindustrial soot
emission(ton)
Volume ofindustrial soot
removed(ton)
Volume ofindustrial
dustemission
(ton)
Volume ofindustrial
dust removed(ton)
Shanghai 310865 33616 90038 2610372 40649 1846108
Beijing 161674 6143 56345 1660157 100235 886618
Tianjin 151769 24649 57841 1507656 21123 170902
Guangdong 669396 135903 335173 4240968 944190 2772746
Liaoning 723645 570961 623436 7742012 453101 3243255
Zhejiang 608138 77245 325283 3445968 690385 2024451
Jiangsu 934906 153152 423320 6853927 457945 1467117
Fujian 169564 23043 80424 1274331 377426 1184903
Heilongjiang 214774 19731 422304 5889536 117624 664439
Shandong 1451547 265529 581024 7831317 786656 6138329
Hebei 1116566 181009 714483 6978661 906916 3309836
Jilin 210021 62913 307370 4680323 134390 1236453
Hainan 22148 915 21738 223634 21308 170736
Shanxi 932251 105659 800500 5450937 616868 1459751
Xinjiang 197909 28399 125381 619896 120404 525516
Hubei 503788 299217 309339 2213220 483803 1823260
Henan 678391 124962 658361 6204566 1004254 2459517
Chongqing 758755 147859 140645 1104036 182431 333317
Hunan 606373 518981 420543 3967711 783784 1700838
Shaanxi 572642 42279 394794 2764518 393867 539144
Guangxi 548499 282700 320340 2265741 458441 2277125
Inner Mongolia 521816 80809 346786 4216527 169100 470647
Anhui 364298 490380 320236 3227888 450900 1579530
Jiangxi 236745 403110 184851 2631229 357010 920967
Sichuan 526157 195282 534426 2194821 665424 1433244
Ningxia 175741 25186 92296 1083254 80309 92620
Yunnan 276596 245965 256596 1434695 234712 1243992
Gansu 257282 366705 134957 1377874 148681 842646
Qinghai 18992 209 52502 344950 63985 88858
Guizhou 678810 97206 401724 2902969 483670 457574
Tibet 892 1269 729 3399 19
National 14600949 5009717 9534322 98944420 11752990 43364459
Table A.21 continued
Source: China Statistical Yearbook, 2000

China Human Development Report 33
Human Development Index and Environmental Indicators in China
A
Province
Number ofsurveyed
enterprises(unit)
Volume ofindustrial
solid wastesproduced
(10000 tons)Dangerous
waste
Volume ofindustrial
solid wastesutilized
(10000 tons)
Annual volumeof industrialsolid wastesaccumulated(10000 tons)
Volume ofindustrial solidwastes treated(10000 tons)
Shanghai 2045 1211 26 1287 4 67
Beijing 1211 1161 10 840 309 3
Tianjin 1404 407 8 472 11 26
Guangdong 6763 1877 59 1024 412 172
Liaoning 2525 7545 66 2540 3481 1019
Zhejiang 5239 1361 11 1011 176 104
Jiangsu 6724 2907 95 2432 330 72
Fujian 3687 1590 10 1082 440 121
Heilongjiang 1936 2881 4 1911 434 654
Shandong 5543 5166 70 3877 1198 190
Hebei 2915 7156 38 2971 1680 1381
Jilin 1111 1770 17 817 816 55
Hainan 303 69 30 38 1
Shanxi 2773 6242 20 1461 1089 2373
Xinjiang 810 702 56 267 174 84
Hubei 2147 2511 26 1494 838 129
Henan 3401 3477 13 1790 1189 1078
Chongqing 1327 1511 52 655 311 42
Hunan 3103 1869 47 1049 628 188
Shaanxi 1824 2624 6 367 1627 342
Guangxi 1828 2068 23 1173 683 296
Inner Mongolia 1142 2510 42 573 1632 246
Anhui 1834 2974 38 2081 484 719
Jiangxi 1054 3984 1 695 3154 57
Sichuan 3377 4396 47 1526 1738 123
Ningxia 235 419 1 148 236 24
Yunnan 1347 3117 111 908 1238 239
Gansu 1247 1699 13 438 1075 49
Qinghai 221 305 2 111 171 5
Guizhou 1858 2925 101 726 688 905
Tibet 63 6 1 10
National 70997 78442 1015 35756 26295 10764
Table A.22 Discharge, Treatment and Utilization of Industrial Solid Wastes by Province, 1999
Source: China Statistical Yearbook, 2000

Annex
UNDP34A
Table A.22 continued
ProvinceVolume of
industrial solidwastes
Discharged(10000 tons)
Dangerouswaste
Total volume ofindustrial solid
wastesaccumulated(10000 tons)
Areas occupiedby industrialsolid wastes(10000 sqm)
Output valueproducts madefrom utilization
of ‘threewastes’
(10000 yuan)
Profits obtainedfrom utilization
of ‘threewastes’
(10000 yuan)
Shanghai 554 119 86926 48093
Beijing 35 11672 290 41403 13584
Tianjin 2 1196 1191 22784 1018
Guangdong 58 22205 3033 130915 21681
Liaoning 134 4 124253 4668 170260 36621
Zhejiang 11 5451 754 118244 55239
Jiangsu 7 9943 2489 191672 35955
Fujian 18 4162 12859 65395 21607
Heilongjiang 1 23842 2587 82302 10322
Shandong 3 33122 3452 323559 58825
Hebei 247 65153 3675 124158 16510
Jilin 26 18921 2009 89806 37285
Hainan 2137 316 1548 626
Shanxi 718 27078 2025 49553 6963
Xinjiang 111 4057 545 37776 7016
Hubei 28 12020 1807 90382 16734
Henan 31 26437 2070 165881 15570
Chongqing 291 1 7434 775 80554 11719
Hunan 59 1 25628 2214 103071 20635
Shaanxi 160 16547 1079 38589 4742
Guangxi 82 8531 925 102100 9775
Inner Mongolia 60 26354 2706 21153 12161
Anhui 37 11424 1849 77884 17333
Jiangxi 34 53324 3317 30777 6436
Sichuan 476 0 31118 794 157526 43125
Ningxia 10 4306 611 15485 4214
Yunnan 567 20662 1858 83313 11462
Gansu 64 1 18940 2193 37820 5463
Qinghai 1 6225 120 953 188
Guizhou 610 30 14918 475 31751 4064
Tibet 1 6 1 162 41
National 3880 36 637624 62808 2573700 555003
Source: China Statistical Yearbook, 2000

China Human Development Report 35
Human Development Index and Environmental Indicators in China
A
Province
Number ofPollutionaccidents
(times)Water
pollutionAir pollution Solid waste
pollution
Pollutiondamage
converted intocash
(10000 yuan)
Amount ofreparations and
fines
(10000 yuan)
Shanghai
Beijing
Tianjin
Guangdong 171 120 44 2 239.6 163.9
Liaoning 89 31 35 17 182.0 210.0
Zhejiang 44 30 14 27.1 8.8
Jiangsu 103 61 35 4 370.9 70.6
Fujian 28 18 10 41.5 19.5
Heilongjiang 4 2 1 22.4 10.8
Shandong 148 36 86 25 122.7 111.1
Hebei 11 8 1 1 30.5 29.8
Jilin 18 6 8 1 17.4 16.0
Hainan 9 8 1 4.7 4.5
Shanxi 10 4 4 318.1 163.7
Xinjiang 14 11 3 11.3 8.4
Hubei 18 7 11 36.5 34.6
Henan 25 10 13 1 24.1 21.5
Chongqing 37 27 8 1 27.5 18.7
Hunan 13 10 3 228.6 202.7
Shaanxi 65 38 18 5 61.0 27.2
Guangxi 280 141 129 7 1364.8 293.2
Inner Mongolia 11 7 2 19.3
Anhui 51 39 10 2 1049.0 62.5
Jiangxi 97 56 32 3 172.7 101.4
Sichuan 90 51 25 3 243.6 193.0
Ningxia 6 3 3 5.3
Yunnan 148 72 64 5 205.2 160.4
Gansu 99 83 8 2 773.2 132.8
Qinghai 8 1 6 91.8 40.3
Guizhou 17 8 8 1 19.6 11.1
Tibet
National 1614 888 582 80 5710.6 2116.3
Table A.23 Pollution Accidents by Province, 1999
Source: China Statistical Yearbook, 2000

Annex
UNDP36A
Province
Volume of waste water discharged
(10000 tons)
Absorption of oxygen by waste
water (ton)
Emission of sulfur dioxide
(ton)
Emission of dust (ton)
Shanghai 117559 260605 92259 45667
Beijing 54118 139828 71813 22442
Tianjin 22369 118400 90654 51508
Guangdong 313918 509945 25547 12097
Liaoning 96241 382215 213721 192595
Zhejiang 75018 274775 28283 10527
Jiangsu 134994 377360 44750 15763
Fujian 47945 169917 20800 16250
Heilongjiang 57964 350748 79290 104617
Shandong 116160 484087 378205 132056
Hebei 62791 217841 209592 199891
Jilin 48467 222825 83727 79696
Hainan 15826 57941 243 20
Shanxi 50168 176485 307245 124965
Xinjiang 28564 92844 139187 118541
Hubei 117476 373846 49466 26697
Henan 120613 428291 171356 98074
Chongqing 42574 138382 182371 95517
Hunan 88571 301969 152020 12464
Shaanxi 35368 160735 75202 40071
Guangxi 78310 261273 34957 3408
Inner Mongolia 22844 120057 169039 202923
Anhui 71389 277300 45545 34860
Jiangxi 52794 296967 47556 4955
Sichuan 74606 312767 286592 31346
Ningxia 4042 33689 32111 25971
Yunnan 29386 146470 59986 123758
Gansu 15988 83240 55137 43808
Qinghai 7282 29127 12038 17815
Guizhou 33778 171230 815662 167502
Tibet 558 496
National 2037681 6971651 3974354 2055804
Table A.24 Discharge of Pollutants from Domestic Sources by Province, 1999
Source: China Statistical Yearbook, 2000
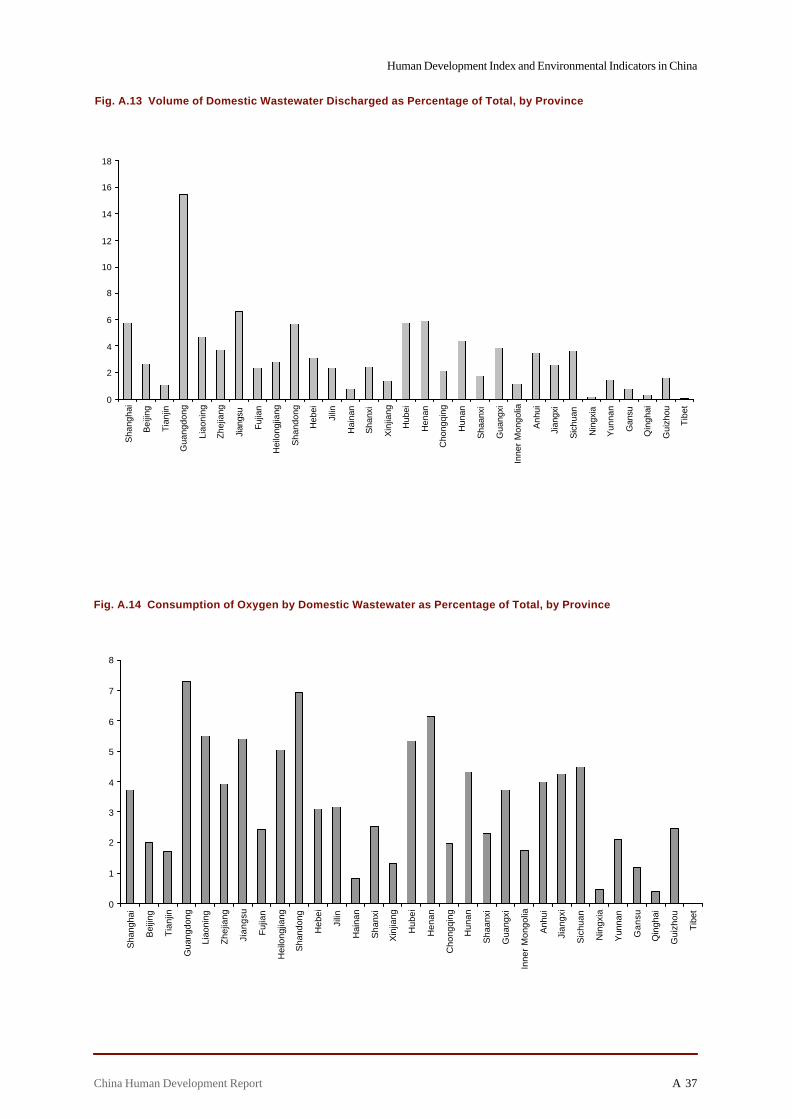
China Human Development Report 37
Human Development Index and Environmental Indicators in China
A
0
1
2
3
4
5
6
7
8
Sha
ngha
i
Bei
jing
Tia
njin
Gua
ngdo
ng
Liao
ning
Zhe
jiang
Jian
gsu
Fuj
ian
Hei
long
jiang
Sha
ndon
g
Heb
ei
Jilin
Hai
nan
Sha
nxi
Xin
jiang
Hub
ei
Hen
an
Cho
ngqi
ng
Hun
an
Sha
anxi
Gua
ngxi
Inne
r M
ongo
lia
Anh
ui
Jian
gxi
Sic
huan
Nin
gxia
Yun
nan
Gan
su
Qin
ghai
Gui
zhou
Tib
et
Fig. A.14 Consumption of Oxygen by Domestic Wastewater as Percentage of Total, by Province
0
2
4
6
8
10
12
14
16
18
Sha
ngha
i
Bei
jing
Tia
njin
Gua
ngdo
ng
Liao
ning
Zhe
jiang
Jian
gsu
Fuj
ian
Hei
long
jiang
Sha
ndon
g
Heb
ei
Jilin
Hai
nan
Sha
nxi
Xin
jiang
Hub
ei
Hen
an
Cho
ngqi
ng
Hun
an
Sha
anxi
Gua
ngxi
Inne
r M
ongo
lia
Anh
ui
Jian
gxi
Sic
huan
Nin
gxia
Yun
nan
Gan
su
Qin
ghai
Gui
zhou
Tib
et
Fig. A.13 Volume of Domestic Wastewater Discharged as Percentage of Total, by Province
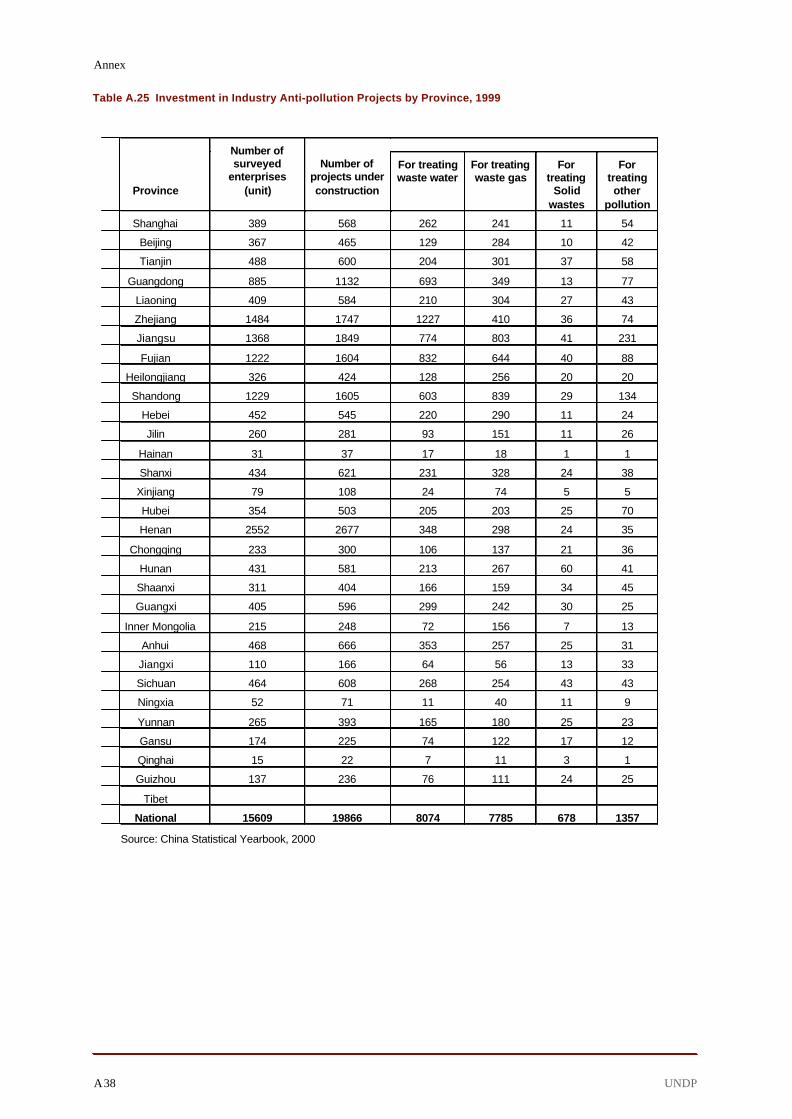
Annex
UNDP38A
Province
Number ofsurveyed
enterprises(unit)
Number ofprojects underconstruction
For treatingwaste water
For treatingwaste gas
Fortreating
Solidwastes
Fortreatingother
pollution
Shanghai 389 568 262 241 11 54
Beijing 367 465 129 284 10 42
Tianjin 488 600 204 301 37 58
Guangdong 885 1132 693 349 13 77
Liaoning 409 584 210 304 27 43
Zhejiang 1484 1747 1227 410 36 74
Jiangsu 1368 1849 774 803 41 231
Fujian 1222 1604 832 644 40 88
Heilongjiang 326 424 128 256 20 20
Shandong 1229 1605 603 839 29 134
Hebei 452 545 220 290 11 24
Jilin 260 281 93 151 11 26
Hainan 31 37 17 18 1 1
Shanxi 434 621 231 328 24 38
Xinjiang 79 108 24 74 5 5
Hubei 354 503 205 203 25 70
Henan 2552 2677 348 298 24 35
Chongqing 233 300 106 137 21 36
Hunan 431 581 213 267 60 41
Shaanxi 311 404 166 159 34 45
Guangxi 405 596 299 242 30 25
Inner Mongolia 215 248 72 156 7 13
Anhui 468 666 353 257 25 31
Jiangxi 110 166 64 56 13 33
Sichuan 464 608 268 254 43 43
Ningxia 52 71 11 40 11 9
Yunnan 265 393 165 180 25 23
Gansu 174 225 74 122 17 12
Qinghai 15 22 7 11 3 1
Guizhou 137 236 76 111 24 25
Tibet
National 15609 19866 8074 7785 678 1357
Table A.25 Investment in Industry Anti-pollution Projects by Province, 1999
Source: China Statistical Yearbook, 2000

China Human Development Report 39
Human Development Index and Environmental Indicators in China
A
Province
Investmentcompleted inanti-pollution
projects(10000 yuan)
For treatingwaste water
For treatingwaste gas
For treatingSolid wastes
Fortreatingother
pollution
Number ofprojects
completed
Shanghai 58714 24462 16101 4302 13849 364
Beijing 137591 10052 50154 2555 74830 433
Tianjin 34485 21278 10936 489 1782 498
Guangdong 78877 39707 37041 306 1823 935
Liaoning 67610 30400 28422 4538 4250 528
Zhejiang 134494 90251 22896 7435 13912 1299
Jiangsu 116959 61009 31679 2337 21934 1280
Fujian 45191 19456 14152 5393 6190 876
Heilongjiang 50097 24243 15541 10099 214 370
Shandong 230235 115414 56029 8385 50408 1392
Hebei 58689 23981 32806 918 985 463
Jilin 34134 18094 13022 1765 1253 227
Hainan 2403 1751 362 290 0 21
Shanxi 41734 16073 11222 7167 7273 478
Xinjiang 13520 2756 9978 435 351 101
Hubei 31804 13288 11439 1894 5182 367
Henan 58384 35078 18170 716 2904 492
Chongqing 10733 5181 4495 413 645 229
Hunan 33711 14600 13548 1509 4055 491
Shaanxi 32530 12829 16033 886 2782 332
Guangxi 36746 15838 13535 1352 6022 454
Inner Mongolia 20541 2792 17304 294 151 173
Anhui 43543 23885 14897 2532 2230 360
Jiangxi 9025 6223 1841 343 618 152
Sichuan 37398 17333 11587 7632 846 535
Ningxia 10853 4204 1920 3407 1322 65
Yunnan 26385 11838 11496 2716 335 349
Gansu 45628 22507 6380 781 15960 195
Qinghai 3924 336 3529 39 20 17
Guizhou 21369 3445 13332 2429 2163 196
Tibet
National 1527307 688302 509847 83354 244288 13672
Table A.25 Continued
Source: China Statistical Yearbook, 2000

Annex
UNDP40A
0
5
10
15
20
25
Sha
ngha
i
Bei
jing
Tia
njin
Gua
ngdo
ng
Liao
ning
Zhe
jiang
Jian
gsu
Fuj
ian
Hei
long
jiang
Sha
ndon
g
Heb
ei
Jilin
Hai
nan
Sha
nxi
Xin
jiang
Hub
ei
Hen
an
Cho
ngqi
ng
Hun
an
Sha
anxi
Gua
ngxi
Inne
r Mon
golia
Anh
ui
Jian
gxi
Sic
huan
Nin
gxia
Yun
nan
Gan
su
Qin
ghai
Gui
zhou
Tib
et
Fig. A.15 Emission of Sulfur Dioxide from Domestic Sources as Percentage of Total, by Province
0
2
4
6
8
10
12
Sha
ngha
i
Bei
jing
Tia
njin
Gua
ngdo
ng
Liao
ning
Zhe
jiang
Jian
gsu
Fuj
ian
Hei
long
jiang
Sha
ndon
g
Heb
ei
Jilin
Hai
nan
Sha
nxi
Xin
jiang
Hub
ei
Hen
an
Cho
ngqi
ng
Hun
an
Sha
anxi
Gua
ngxi
Inne
r Mon
golia
Anh
ui
Jian
gxi
Sic
huan
Nin
gxia
Yun
nan
Gan
su
Qin
ghai
Gui
zhou
Tib
et
Fig. A.16 Emission of Dust from Domestic Sources as Percentage of Total, by Province

China Human Development Report 41
Human Development Index and Environmental Indicators in China
A
Province
Areas of planting
trees in 1997 (1000 ha)
For timber
Economic forest
For environmental
protection
Shanghai 2.08 0 1.91 0.17
Beijing 37.56 0.06 2.36 33.74
Tianjin 8.99 0.26 3.37 5.36
Guangdong 4.96 2.35 1.35 0.96
Liaoning 154.82 33.74 30.83 63.1
Zhejiang 37.15 11.81 21.87 2.31
Jiangsu 19.21 9.2 5.92 3.71
Fujian 29.99 13.05 7.55 5.26
Heilongjiang 278.00 169.21 21.74 65.97
Shandong 174.20 25.28 100.88 47.17
Hebei 386.16 84.99 115.84 176.27
Jilin 62.87 22.73 19.37 19.7
Hainan 15.24 7.13 4.93 3.03
Shanxi 430.74 98.08 128.13 202.18
Xinjiang 50.51 3.24 16.13 27.12
Hubei 223.61 90.79 112.66 14.14
Henan 139.84 89.43 21.84 27.7
Chongqing 108.98 28.24 48.68 28.66
Hunan 42.94 26.25 12.99 3.26
Shaanxi 271.81 73.73 97.26 90.85
Guangxi 112.84 48.78 54.62 6.57
Inner Mongolia 464.41 93.87 81.81 286.55
Anhui 86.89 35.08 42.23 8.09
Jiangxi 81.00 46.92 25.11 7.18
Sichuan 281.50 105.43 95.72 76.39
Ningxia 24.09 2.71 6.62 14.11
Yunnan 376.36 161.19 146.02 58.23
Gansu 156.82 30.63 65.09 38.17
Qinghai 35.57 4.94 1.94 17.98
Guizhou 235.52 126.46 76.54 30.94
Tibet 13.00 12 0 1
National 4354.93 1465.05 1371.31 1366.23
Table A.26 Areas of Planting Trees by Province, 1997
Source: China Environmental Yearbook, 1998

Annex
UNDP42A
7. Provincial Health Risk Index for China*
IntroductionThe Health Risk Index (HRI) can be estimated using similarapproaches used by UNDP and the World ResourcesInstitute in calculating the Human Development Index(HDI) in measuring potential exposure to health risksfrom environmental threats.
The HRI appears to be inversely proportional to theHDI (see box 2.5). According to WRI, the quality of air,water, and food resources within a country can influ-ence the health and potential exposure of populations toenvironmental health risks. In China, it is proposed touse potential exposure to air pollution, water pollution,poor nutrition, and access to health services, as compo-nents of the Health Risk Index. Confounding factors,though important, were not considered here. Future re-finement of the HRI methodology involves using morevariables depending on availability of data.
As in other developing countries, there is scarcityof data in China for both environment and health statis-tics. In many cases, proxy indicators for human-envi-ronment relationships were applied as well as the bestavailable database such as published yearbooks, even ifthey may be of low quality or incomplete. In this sec-tion, we describe the methods in developing the indica-tors of environmental health risk using the best dataavailable between 1995-1999.
MethodsFor the 27 provinces and 3 autonomous cities (excludingChongqing) of China, there are four indicators to esti-mate their likely health risk potential: exposure to pol-luted indoor and outdoor air, polluted water, poor nutri-tion and access to health services. The fourth one, thoughnot due to environmental conditions, can influence thetotal risk potential in terms of being able to provide timelymedical attention. The following were found importantin China:
Calculation of index for each province/city1. Potential exposure to air pollution (indoor and
outdoor)a) Indoor air pollution
Residential coal consumption per family
b) Outdoor air pollution
Or in China, it becomes
Based on 1999 Environment Statistical Yearbook, almostall cities exceeded in at least one parameter (TSP, SO
2,
NO2).
2. Potential exposure to polluted watera) Percentage of population without access to safe
water
3. Poor nutritionPercentage of children below 5 years whose weight-for-age is less than the weight median -2SD
4. Capacity of health servicesa) ‰ = Number of hospital beds, doctors and nurses
per 1000 persons
b)
Linear transformation using the formula below was ap-plied to each of the calculated values to obtain the re-spective index value. All the indicators were assignedequal weights and the HRI was computed by getting theaverage of the four indices.
Plotting the infant mortality rate (IMR) versus HRI vali-dated the computed HRI since a positive correlation wasobtained, i.e., a province with a high health risk also hadhigh infant mortality. The same strong correlation was alsofound if UMR (under 5 mortality rate) and MMR (mater-nal mortality rate) were used instead of IMR.
Example of the HRI MethodologyThe calculation of the provincial HRI is illustrated withtwo examples - Shanghai and Guizhou provinces.1. Potential exposure to air pollution (indoor and
outdoor air pollution)a) Indoor air pollution
100population totalpopulation urban
% ×=
100ityprovince/c the in population Total
units health withoutPopulation% x=
value X minimum - value X Maximumvalue X minimum - value X Actual
Indexii
ii=
population Totalguidelines quality air
WHO the exceeding cities in living Population
% =
population Total standard)] exceeding
samples waterrural of % population (rural standard) exceeding samples
waterurban of % population [(urban 100
%
×+
×
=
35.043940001549700
families of number Total nconsumptio coal
lresidentia of amount Total
Shanghai ===
*based on the UNDP-WHO Project (2001) Environment and People’s Health in China

China Human Development Report 43
Human Development Index and Environmental Indicators in China
A
The minimum and maximum values of residential coalconsumption per household in China are 0 and 1.7ton, respectively.
Indoor air pollution index:
b) Outdoor air pollution
The minimum and maximum values of potentialexposure to outdoor air pollution in China are 0%and 83.76%, respectively.
Outdoor air pollution index:
Air pollution index:
2. Potential exposure to polluted water
The minimum and maximum values of potential exposureto water pollution in China are 0.94% and 81.50%, re-spect ively.
Water pollution index:
3. Poor nutritionThe minimum and maximum values of poor nutrition inChina are 0.24% and 12.56%, respectively.
Poor nutrition index:
4. Capacity of the health servicesa) Population without access to health units:
The minimum and maximum values of populationwithout access to health units in China are 0.49%and 38.89%, respectively.
Population without access to health units index:
b) Number of hospital beds, doctors and nurses per1000 personsThe minimum and maximum values for the numberof hospital beds, doctors and nurses per 1000 per-sons in China are 3.38 and 14.36, respectively.
Access to health services index:
5. Provincial HRIThe HRI is a simple average of the air pollution index,water pollution index, poor index and access to healthservice index.
32.18595200
11315000families of number Total
nconsumptio coal lresidentia of amount Total
Guizhou ===
21.00-1.700-0.35 Shanghai ==
%76.8350.1413
1184%100
population Totalpopulation Urban
Shanghai ==×=
%60.2208.3508
793%100
population Totalpopulation Urban
Guizhou ==×=
00.10-83.760-83.76
Shanghai ==
27.00-83.760-22.60 Guizhou ==
61.02
1.000.21 Shanghai =
+=
55.02
0.270.77 Guizhou =+=
% 2.99 100% 1413.50
0.0358 229.5 0.0288 1184 Shanghai =××+×=
% 29.91 100% 3508.08
0.3469 2715.1 0.1353 793 Guizhou =×
×+×=
03.00.94-81.50
0.94-2.99 Shanghai ==
36.00.94-81.500.94-29.91
Guizhou ==
00.00.24-12.56
0.24-0.24 Shanghai ==
48.00.24-12.560.24-6.12
Guizhou ==
00.00.49-38.89
0.49-0.49 Shanghai ==
43.00.49-38.890.49-17.18
Guizhou ==
23.03.38-14.363.38-11.81-1 Shanghai ==
00.13.38-14.36
3.38-3.38-1 Guizhou ==
12.02
0.230.00 Shanghai =+=
72.02
1.000.43 Guizhou =+=
19.04
0.120.000.030.61 Shanghai =
+++=
52.04
0.720.480.360.52 Guizhou =+++=
Province Air
pollution
Water
pollution
Poor
Nutrition
Capacityof healthservices
HRI
Shanghai 0.61 0.03 0.00 0.12 0.19
Guizhou 0.52 0.36 0.48 0.72 0.52
77.00-1.700-1.32 Guizhou ==

Annex
UNDP44A
Table A.27 Data Tabulation for Provincial Health Risk Index

China Human Development Report 45
Human Development Index and Environmental Indicators in China
A
Table A.27 continued
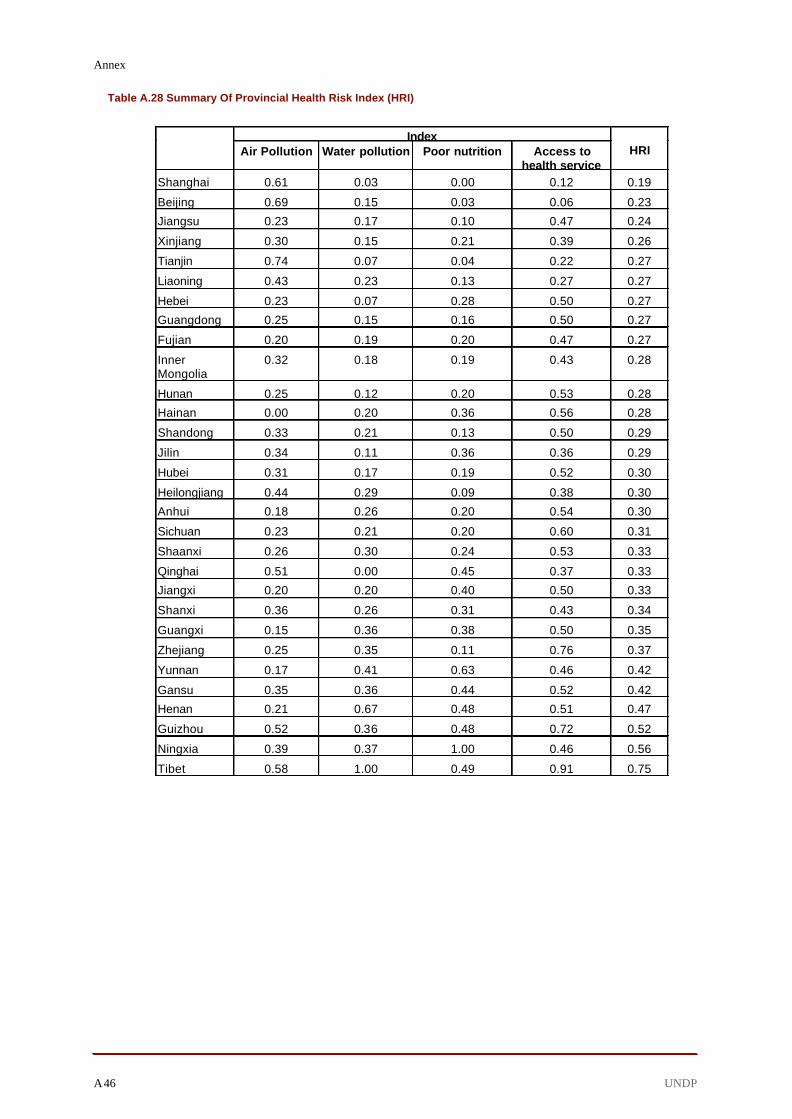
Annex
UNDP46A
Index Air Pollution Water pollution Poor nutrition Access to
health service
HRI
Shanghai 0.61 0.03 0.00 0.12 0.19
Beijing 0.69 0.15 0.03 0.06 0.23
Jiangsu 0.23 0.17 0.10 0.47 0.24
Xinjiang 0.30 0.15 0.21 0.39 0.26
Tianjin 0.74 0.07 0.04 0.22 0.27
Liaoning 0.43 0.23 0.13 0.27 0.27
Hebei 0.23 0.07 0.28 0.50 0.27
Guangdong 0.25 0.15 0.16 0.50 0.27
Fujian 0.20 0.19 0.20 0.47 0.27
Inner Mongolia
0.32 0.18 0.19 0.43 0.28
Hunan 0.25 0.12 0.20 0.53 0.28
Hainan 0.00 0.20 0.36 0.56 0.28
Shandong 0.33 0.21 0.13 0.50 0.29
Jilin 0.34 0.11 0.36 0.36 0.29
Hubei 0.31 0.17 0.19 0.52 0.30
Heilongjiang 0.44 0.29 0.09 0.38 0.30
Anhui 0.18 0.26 0.20 0.54 0.30
Sichuan 0.23 0.21 0.20 0.60 0.31
Shaanxi 0.26 0.30 0.24 0.53 0.33
Qinghai 0.51 0.00 0.45 0.37 0.33
Jiangxi 0.20 0.20 0.40 0.50 0.33
Shanxi 0.36 0.26 0.31 0.43 0.34
Guangxi 0.15 0.36 0.38 0.50 0.35
Zhejiang 0.25 0.35 0.11 0.76 0.37
Yunnan 0.17 0.41 0.63 0.46 0.42
Gansu 0.35 0.36 0.44 0.52 0.42
Henan 0.21 0.67 0.48 0.51 0.47
Guizhou 0.52 0.36 0.48 0.72 0.52
Ningxia 0.39 0.37 1.00 0.46 0.56
Tibet 0.58 1.00 0.49 0.91 0.75
Table A.28 Summary Of Provincial Health Risk Index (HRI)

China Human Development Report 47
Human Development Index and Environmental Indicators in China
A
Table A.29 Major Laws, Measures and Regulations in China for Conserving Biodiversity

Annex
UNDP48A
Table A.29 (contd.) Major Laws, Measures and Regulations in China for Conserving Biodiversity

This third China Human Development Report 2002, Making Green Development aChoice, looks at the environmental challenges facing China today especially in thecontext of its WTO entry and efforts towards a green and clean 2008 Olympics. Thereport argues that it is now time for the government and people to respond to thesechallenges and make the right choices to achieve green development and a sustainablefuture.
What impacts do environmental changes have on people’s health and livelihoods? Howdo environmental issues affect overall governance structure? The Report’s first chapterbegins with a review of China’s people and their history and culture as the resource andfoundation to build and modernise this vast land. Chapter two assesses the current statusof the environment and chapter three examines the forces and trends that determineenvironmental changes including the linkages between society and environment. Chapterfour analyzes the ongoing efforts to put China on the right path and discusses how theresponses can be optimized. Chapter five concludes that today’s decisions will havesignificant influence on the degree of sustainability in China’s future development. Ascenario approach is provided describing two alternatives: today’s perilous path andtomorrow’s green reform path.
Informative and readable, the China Human Development Report 2002 is an invaluablecollection of solid statistics, in-depth analysis and thought-provoking ideas for people allover the world to better understand the general system of societal, environmental andeconomic factors that together make China what it is today and what it can become in thefuture.
The China Human Development Report 2002 was commissioned by UNDP China andwas prepared by a team of eminent development professionals under the leadership ofStockholm Environment Institute, an independent, international research institutespecializing in sustainable development and environment issues at the local, national,regional and global policy levels.
This report was financed by the United Nations Development Programme, UNDP anda grant from the Swedish International Development Cooperation Agency, Sida.Special thanks go to Ericsson (China) Company Ltd., Shell (China) Ltd., Jun YaoGroup of China, BP China Ltd. and Cisco Systems (China) for their kind sponsorship.
Published byOxford University PressISBN 0-19-592744-3
This report was produced by theStockholm Environment Institutewww.sei.se
in collaboration withUNDP Chinawww.unchina.org/undp

China H
uman D
evelopment R
eport 2002 Making G
reen Developm
ent a Choice U
ND
P SEI