Embed Size (px)
Citation preview
Making it Count: Understanding the Value of Energy Efficiency Financing Programs Funded by Utility Customers Financing Solutions Working Group and Driving Ratepayer-Funded Efficiency through Regulatory Policies Working Group December 2015
The State and Local Energy Efficiency Action Network is a state and local effort facilitated by the federal government
that helps states, utilities, and other local stakeholders take energy efficiency to scale and achieve all cost-effective
energy efficiency by 2020.
Learn more at www.seeaction.energy.gov
DOE/EE-1303

December 2015 www.seeaction.energy.gov ii
Making it Count: Understanding the Value of Regulated Energy Efficiency Financing Programs was developed as a product of the State and Local Energy Efficiency Action Network (SEE Action), facilitated by the U.S. Department of Energy/U.S. Environmental Protection Agency. Content does not imply an endorsement by the individuals or organizations that are part of SEE Action working groups, or reflect the views, policies, or otherwise of the federal government. This document was final as of December 9, 2015. If this document is referenced, it should be cited as: State and Local Energy Efficiency Action Network (2015). Making it Count: Understanding the Value of Regulated Energy Efficiency Financing Programs. Prepared by: Chris Kramer, Emily Martin Fadrhonc, Charles Goldman, Steve Schiller, and Lisa Schwartz of Lawrence Berkeley National Laboratory.
FOR MORE INFORMATION
Regarding Making it Count: Understanding the Value of Regulated Energy Efficiency Financing Programs, please contact:
Johanna Zetterberg Brian Ng U.S. Department of Energy U.S. Environmental Protection Agency [email protected] [email protected]
Regarding the State and Local Energy Efficiency Action Network, please contact:
Johanna Zetterberg U.S. Department of Energy

December 2015 www.seeaction.energy.gov iii
Acknowledgments
Making it Count: Understanding the Value of Regulated Energy Efficiency Financing Programs is a product of the State and Local Energy Efficiency Action Network’s (SEE Action) Financing Solutions Working Group.
This report was prepared by Chris Kramer, Emily Martin Fadrhonc, Charles Goldman, Steve Schiller, and Lisa Schwartz of Lawrence Berkeley National Laboratory under contract to the U.S. Department of Energy Office of Energy Efficiency and Renewable Energy, Weatherization and Intergovernmental Programs Office (WIPO), Lawrence Berkeley National Laboratory Contract No. DE-AC02-05CH1131.
The authors received direction and comments from many members of the Financing Solutions Working Group including the following individuals who provided specific input:
• Bryan Garcia (Connecticut Green Bank - CGB)
• Bruce Schlein (Citigroup)
• Dan Bresette (formerly Maryland Energy Administration)
• Jeanne Clinton (California PUC)
• Al Gaspari (PG&E)
• Alfred Griffin (NY Green Bank)
• Greg Hale (New York Office of the Governor)
• Laura James (Cadmus Group)
• Angie Lee (Navigant)
• Jeff Pitkin (New York State Energy Research and Development Authority - NYSERDA)
• Frank Spasaro (SoCalGas)
• Bob Wirtschafter (Massachusetts Energy Efficiency Advisory Council)
We also received comments on a draft of this report from technical experts including Merrian Borgeson, Jennifer Easler, Don Gilligan, Fred Gordon, Robert Hall, Jamie Howland, Sami Khawaja, Peter Krasja, Marjorie McRae, Maggie Molina, Steve Nadel, Anne Marie Perrachio, Jane Peters, Curtis Probst, Rich Sedano, and Kenji Takahashi. Ian Hoffman (LBNL) provided significant input to the initial outline and work plan for this report.
We appreciate the support and guidance of Eleni Pelican, Ira Birnbaum, and Anna Garcia at DOE EERE WIPO and want to thank Dana Robson and Danielle Callaghan for technical support on report preparation.

December 2015 www.seeaction.energy.gov iv
Contents
Acknowledgments ......................................................................................................................................... iii List of Tables ................................................................................................................................................. v List of Figures ................................................................................................................................................ v Acronyms ..................................................................................................................................................... vi Executive Summary ...................................................................................................................................... 2 What Savings Could Financing Potentially Deliver? ..................................................................................... 6 Chapter 1: Introduction ................................................................................................................................ 13 Chapter 2: Placing Energy Efficiency Financing Programs in a Regulatory Context ................................. 18 Chapter 3: Characterizing the Role of Financing in Energy Efficiency Potential Studies ........................... 29 Chapter 4: Cost-Effectiveness of Energy Efficiency Financing Programs .................................................. 36 Chapter 5: Evaluating the Impact of Financing Programs .......................................................................... 42 Conclusion................................................................................................................................................... 55 References .................................................................................................................................................. 57 Appendix A: Energy Efficiency Cost-Effectiveness Tests ........................................................................... 61 Appendix B: The Objective Function ........................................................................................................... 62

December 2015 www.seeaction.energy.gov v
List of Tables
Table ES-1: Summary Characteristics of Financing Programs Reviewed ................................................... 5 Table ES-2: Early Experience with Adapting Traditional Planning and Performance Tools to Financing Programs ..................................................................................................................................................... 11 Table 1: Role of Financing: Complement or Substitute for Existing Efficiency Program Strategies?......... 14 Table 2: Summary Characteristics of Financing Programs Reviewed ....................................................... 24 Table 3: Finance vs. Traditional Rebate Program Example if Aggregate Savings Decrease: Cost-Effectiveness Results .................................................................................................................................. 38 Table 4: Financing Programs as Complement to Traditional Rebate Program: Cost-Effectiveness Results .................................................................................................................................................................... 38 Table 5: Potential Impact of Adding Financing Costs onto an Existing Portfolio: Cost-Effectiveness Results ........................................................................................................................................................ 39 Table 6: Three High-Level Descriptions of Energy Efficiency-Focused Logic Models ............................... 49 Table 7: Possible Interim Metrics for Evaluation of Financing for Market Transformation ......................... 53 Table A-1: The Five Principal Cost Effectiveness Tests ............................................................................. 61
List of Figures
Figure ES-1: Placing Financing Programs in a Regulatory Context—Variables That Affect the Degree of Regulatory Oversight .................................................................................................................................... 4 Figure ES-2: Savings Attribution in the Context of Energy Efficiency Financing .......................................... 9 Figure 1: Placing Financing Programs in a Regulatory Context—Variables That Affect the Degree of Regulatory Oversight .................................................................................................................................. 19 Figure 2: Technical, Economic, and Achievable Potential .......................................................................... 31 Figure 3: Booz Addressable Potential Methodology (Booz & Co., 2013) ................................................... 33 Figure 4: Reduction in iDR Resulting from Introduction of EE Financing (Navigant, 2014) ....................... 35 Figure 5: Effect of Introducing EE Financing on Market Adoption .............................................................. 35 Figure 6: Savings Attribution in the Context of Energy Efficiency Financing .............................................. 47 Figure 7: Role of the Connecticut Green Bank in Market Transformation .................................................. 48 Figure 8: Potential Logic Model for Connecticut Green Bank (Not Currently Adopted).............................. 50 Figure 9: Measuring Savings from Market Effects Above Baseline (Peters, 2014) .................................... 51

December 2015 www.seeaction.energy.gov vi
Acronyms
ARRA—American Reinvestment and Recovery Act CAEATFA—California Alternative Energy and Advanced Transportation Financing Authority CGB—Connecticut Green Bank CPUC—California Public Utilities Commission DEEP—Department of Energy and Environmental Protection EEB—Energy Efficiency Board EM&V—Evaluation, Measurement, and Verification iDR—Implied Discount Rate IRB—Interest Rate Buydown LAO—Legislative Analyst Office LLR—Loan Loss Reserve MEA—Maryland Energy Administration MHELP—Maryland Home Energy Loan Program MT—Market Transformation NRDC—Natural Resources Defense Council NTG—Net to Gross NYCEEC—New York City Energy Efficiency Corporation NYSERDA— New York State Energy Research and Development Authority OBF—On-bill Financing PACE—Property Assessed Clean Energy PACT—Program Administrator Cost Test PCT—Participant Cost Test PSC—Public Service Commission PUC—Public Utilities Commission PURA—Public Utilities Regulatory Authority PV—Photovoltaic RA—Resource Acquisition REC—Renewable Energy Credit RGGI—Regional Greenhouse Gas Initiative RIM—Ratepayer Impact Measure Test SBC—Systems Benefits Charge SCT—Societal Cost Test TRC—Total Resource Cost Test TRM—Technical Reference Manuals

December 2015 www.seeaction.energy.gov 2
Executive Summary
Utility customer-supported financing programs are receiving increased attention as a strategy for achieving energy saving goals. Rationales for using utility customer funds to support financing initiatives include:
• Some market segments have difficulty accessing financing, and utility customer funds, as credit enhancements or as direct investment, are needed to expand access to these consumers.
• Ratepayer funds are limited and larger cost contributions from participants can increase leverage and minimize rate impacts of efficiency programs.1 Utility customer-funded financing offers may encourage larger cost contributions by participating consumers.
• Private markets are not providing attractive financing for energy efficiency projects due to a lack of information, education, and loan performance data. Utility customer-funded credit enhancements or direct investment may be able to mitigate this gap and allow the needed loan performance data to accumulate.
• Specialized financing products like on-bill financing or property assessed clean energy (PACE) are needed to overcome the unique challenges of financing energy efficiency investments in certain market sectors (e.g., renter/owner split incentives, balance sheet treatment); utility customer funds may be needed to encourage these new products.
In most jurisdictions, financing is either offered as a small component of a larger portfolio that includes rebates, technical assistance, education, audits, and training, or is not offered. In other jurisdictions (CT, NY, MA, CA, MD) policy makers are considering or implementing large-scale financing programs using utility customer funds and/or are considering shifting away from traditional energy efficiency program strategies over time. To compare these two approaches, we use the construct of “financing as a complement”—using financing as an enhancement to existing programs—and “financing as a substitute”—transitioning away from traditional programs over time and toward financing as a primary strategy to achieve energy efficiency goals.2
The SEE Action Financing Solutions and Driving Ratepayer-Funded Efficiency through Regulatory Policies Working Groups commissioned this report as groundwork for a dialogue to explore regulatory and policy mechanisms for ensuring that efficiency financing initiatives provide value for society and protection for consumers. In this study, we identify and explore many of the emerging regulatory and practical issues that jurisdictions will need to consider when contemplating an increased reliance on financing programs as a primary program strategy.
Large-scale financing programs present at least two challenges for state policy makers, utility regulators, and program administrators:
• Some program administrators believe that attracting private-sector capital partners requires greater flexibility than a public utility commission (PUC)-overseen model allows and have placed these programs
1 Rebates and incentives also achieve leverage, in the form of customers’ cash contributions or use of private, non-utility customer-supported financing. However, utility customer-supported financing may increase this leverage. 2 Note that these two approaches are not mutually exclusive in the short-term; even in jurisdictions where policy makers have made statements emphasizing an eventual substitution, financing currently operates as a complement (e.g., consumers may make use of existing programs and new financing-focused offers).

December 2015 www.seeaction.energy.gov 3
partially or wholly outside of oversight by state utility regulators.3 In some cases, administrators of finance programs have not been subject to existing planning and evaluation approaches utilized for existing energy efficiency programs. If a shift toward financing as a primary strategy for acquiring energy efficiency is accompanied by less regulatory oversight or different approaches to ensuring accountability, then it may be more difficult to assess impacts from eliminating or cutting back traditional efficiency programs.
• Unique aspects of financing programs may create challenges in adapting traditional regulatory planning, evaluation, and performance tools that are used to assess the impacts and cost-effectiveness of efficiency programs (e.g., potential studies, cost-effectiveness screening, and impact evaluation). To a large extent, these tools have been developed and designed around traditional rebate and incentive programs, and adapting these tools to financing will take careful consideration and may require modification for use in a financing context. For example, because private financing options are often available to many customers, it is important to understand to what extent savings attributed to program financing are truly “additional” compared to savings that would have occurred in the absence of a utility-customer funded program.
In exploring these issues, we focus on identifying information and tools that state regulators need in order to fulfill their oversight role while balancing the interests of utility customers, shareholders, and the public.
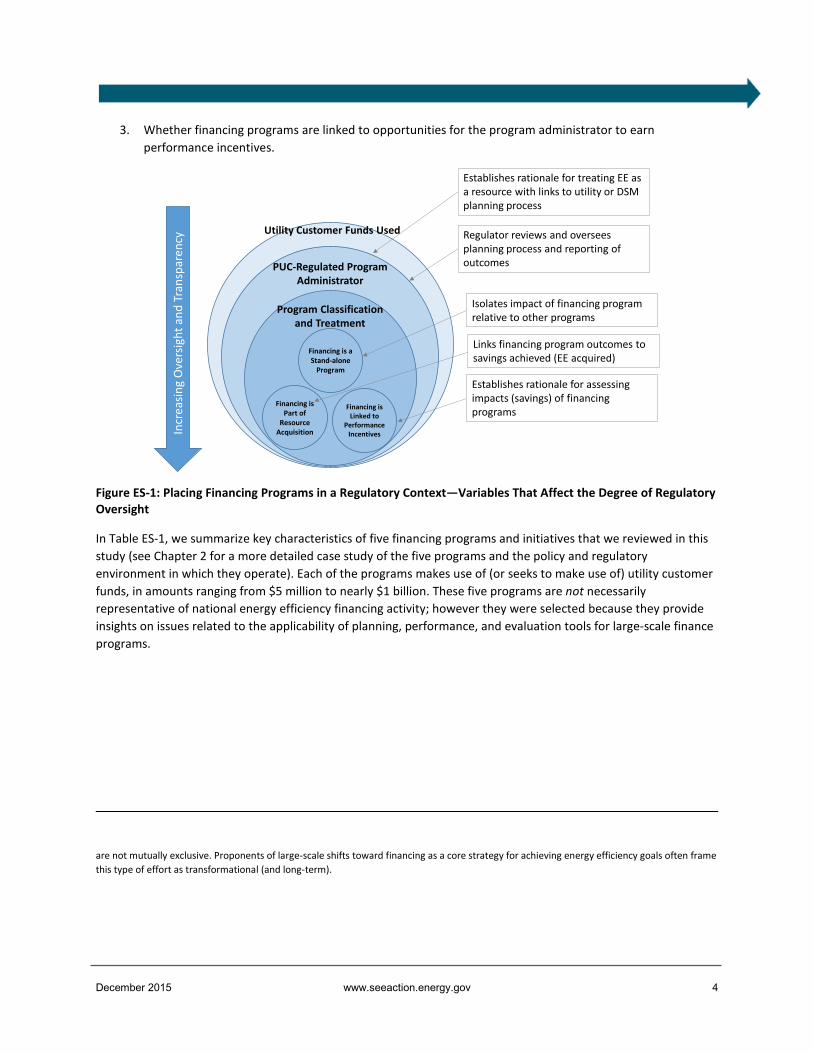
Placing Energy Efficiency Financing Programs in a Regulatory Context
The regulatory context under which efficiency financing programs operate is heavily influenced by three variables: (1) use of utility customer funding, (2) type of program administrator, and (3) program classification and treatment. As shown in Figure ES-1, the use of utility customer funds often triggers requirements for some type of oversight by state regulators or governing boards. Financing programs that are implemented by existing efficiency program administrators are typically subject to a state’s regulatory planning and oversight requirements. However, when finance programs are administered by new entities (e.g., a Green Bank), state policymakers do not necessarily place those entities under PUC oversight or apply existing regulatory mechanisms.4 The regulatory context of financing programs is also influenced by the way the program is treated and categorized under a state’s efficiency policy guidelines, including:
1. Whether financing is treated as a distinct program within the energy efficiency portfolio;5 2. Whether financing is treated as a resource acquisition program and/or viewed as a market transformation
effort);6 and
3 Evaluation of financing programs does require data collection, although it is not yet clear what level of data collection will fall to private financial institutions who partner with ratepayer-funded programs. In one example, the California evaluation team identified only six data fields that would need to be reported by financial institutions because the majority of information needed for evaluation (e.g., customer information, property information, measure information) was already collected by program administrators, contractors, or other parties (Opinion Dynamics, 2014, p. 4). Some additional information may be required from consumers (e.g., consumer surveys). 4 In some cases, state policymakers or financing proponents have cited concerns that attracting private-sector capital partners requires greater flexibility than a PUC-overseen model allows. 5 For example, in jurisdictions that are considering financing as a substitute for traditional efficiency programs, it may be advantageous to treat financing as a distinct program because it would be easier to assess and document savings and cost-effectiveness through periodic impact evaluations. 6 Resource acquisition tends to focus on energy savings that are achieved directly through program activities, whereas market transformation generally focuses on achieving energy savings via impacts on the broader market. Market transformation and resource acquisition approaches
December 2015 www.seeaction.energy.gov 4
3. Whether financing programs are linked to opportunities for the program administrator to earn performance incentives.
Figure ES-1: Placing Financing Programs in a Regulatory Context—Variables That Affect the Degree of Regulatory Oversight
In Table ES-1, we summarize key characteristics of five financing programs and initiatives that we reviewed in this study (see Chapter 2 for a more detailed case study of the five programs and the policy and regulatory environment in which they operate). Each of the programs makes use of (or seeks to make use of) utility customer funds, in amounts ranging from $5 million to nearly $1 billion. These five programs are not necessarily representative of national energy efficiency financing activity; however they were selected because they provide insights on issues related to the applicability of planning, performance, and evaluation tools for large-scale finance programs.
are not mutually exclusive. Proponents of large-scale shifts toward financing as a core strategy for achieving energy efficiency goals often frame this type of effort as transformational (and long-term).
Incr
easin
g O
vers
ight
and
Tra
nspa
renc
yEstablishes rationale for treating EE as a resource with links to utility or DSM planning process
Regulator reviews and oversees planning process and reporting of outcomes
Establishes rationale for assessing impacts (savings) of financing programs
Utility Customer Funds Used
PUC-Regulated Program Administrator
Financing is a Stand-alone
Program
Financing is Part of
Resource Acquisition
Financing is Linked to
Performance Incentives
Isolates impact of financing program relative to other programs
Links financing program outcomes to savings achieved (EE acquired)
Program Classification and Treatment

December 2015 www.seeaction.energy.gov 5
Table ES-1: Summary Characteristics of Financing Programs Reviewed
CA NY CT MA MD
Financing program reviewed Statewide Financing Pilots NY Green Bank
Connecticut Green Bank (CBG) HEAT Loan
Maryland Home Energy Loan Program (MHELP)
Utility customer funds sought or used? Yes Yes Yes Yes
Yes
Utility customer funds dedicated to selected financing program7 $75M8
$947M ($165M initial funding, $150M additional funding approved in July, $631.5M follow on request)9
$27.6M (2014)10
Approx. $15M (2013)
$4.6M proposed (2013 and 2014)
Regulated program administrator?
Yes, California Alternative Energy and Advanced Transportation Financing Authority (CAEATFA)11
Yes, New York State Research and Development Authority (NYSERDA)
No, Connecticut Green Bank
Yes, utilities’ third-party administrator
No, Maryland Clean Energy Center
Financing envisioned as a complement? Yes Yes Yes Yes Yes Financing envisioned as a substitute? Potentially Yes Yes No Potentially Part of resource acquisition portfolio? Yes No N/A12 Yes
No, but under discussion
Treated as a distinct program? Potentially Yes N/A No Potentially
Tied to performance incentives? Yes, via linkage to other EE programs TBD No
Yes, via linkage to other EE programs No
Type of financing or credit enhancement offered by program
Loans, leases, energy savings agreements, loan loss reserves (LLRs) and debt service reserves
Guarantees, loan capital (credit facilities, subordinate capital, senior capital)
Interest rate buy downs (IRBs), LLRs, and loan capital IRBs IRBs
7 CA (California Public Utilities Commission, 2013). NY (NYSERDA, 2014c). CT (CEFIA, 2014). MA (NSTAR, 2014) (WMECo, 2014) (National Grid, 2014). MD (EmPOWER Finance Work Group, 2013). 8 $65.9M initial commitment; $9M held in reserve. 9 Remaining capitalization proposed to be transferred over ten years (2016-2025), but supplemented by an external borrowing facility, supported by a pledge of the approved collections, that will allow NY Green Bank to deploy capital when needed but also would allow transfers to be scheduled to meet objectives for overall declining ratepayer collections. Funds are to be transferred over four years in equal installments beginning in June 2015. 10 CGB’s budget is for both renewable and energy efficiency efforts; utility customer funds of $28M in 2014 were used for administration and renewable energy programs. 11 CAEATFA is a state agency that the California PUC designated as the administrator of California’s financing pilots, in collaboration with utilities. 12 Although the Connecticut Green Bank as the administrator of the Connecticut Clean Energy Fund is not responsible for resource acquisition, the utilities as administrators of the Connecticut Energy Efficiency Fund are focused on resource acquisition. Through a Joint Committee there is coordination on goals and priorities between the administrators, see http://www.ctcleanenergy.com/Portals/0/board-materials/5a_Consolidated%20Priorities_Joint%20Committee_090815.pdf

December 2015 www.seeaction.energy.gov 6
In reviewing experiences to date in these five programs, we found that:
• None of the reviewed programs currently operate as substitutes—consumers who take advantage of financing may also access rebates, education, and other efficiency programs offered by the program administrator. However, in several states (New York, Maryland, and Connecticut), policymakers or commissions have indicated their intention to explore financing as a substitute for traditional programs.
• Financing programs in California and Massachusetts are classified as resource acquisition efforts; this designation seems to correlate with increased requirements for evaluating the impacts of financing programs specifically (versus financing in combination with other program offerings).
• Financing programs that are treated as distinct programs (e.g., California, New York) within an overall portfolio may be required to demonstrate savings specifically attributable to the program, which may be especially important in jurisdictions considering using financing as a substitute for traditional programs in the future.
• Linking financing programs to performance incentives, whether directly or through their contribution to aggregate portfolio savings as in California and Massachusetts, may bring increased attention to evaluations that focus on savings that are attributable to program financing.
What Savings Could Financing Potentially Deliver?
In Chapter 3, we review the types of potential studies (technical, economic, and achievable), discuss studies that estimate the theoretical potential for financing of efficiency and their use by policymakers and program administrators, and discuss the applicability and inclusion of financing strategies in achievable potential studies.
Several initial studies examined how much capital could potentially be deployed in the energy efficiency market. For example, Booz & Co. completed a study for New York that estimated energy efficiency represented $55 billion of the $85 billion of addressable clean energy technical potential in the state over the next ten years.13 This study was cited by NYSERDA in its petition sizing the NY Green Bank efficiency funding at $1 billion; some stakeholders took issue with using “theoretical estimates of investment potential” as the basis for capitalization levels of the Green Bank (City of New York, 2012).
A few initial efforts have attempted to incorporate financing into more traditional energy efficiency potential studies. For example, as part of a state-wide potential study in California, analysts focused on estimating the additional achievable energy savings that could be realized by introducing financing programs. The authors used a framework based on changes in a customer’s implied discount rate (iDR) due to financing and found that the “incremental savings potential due to financing is modest” in California (Navigant, 2014, p. 142). A 2015 update to the study found that financing could increase potential savings by 4.5 percent in the residential sector and 3.5 percent in the commercial sector (Navigant, 2015). Explanations for the modest incremental savings potential include limited eligibility for proposed financing programs in the commercial and multifamily sectors and the relatively low importance of access to financing as a barrier to overall energy efficiency adoption (i.e., financing barriers are a small component of consumers’ implied discount rate).
13 Booz & Co. estimated what they described as the addressable potential for efficiency (and clean energy) over a ten year period; they did exclude customers in markets that had credit worthiness issues or were likely to be addressed by private financing.

December 2015 www.seeaction.energy.gov 7
Including energy efficiency financing as part of achievable potential studies could offer important insights regarding:
• How financing might increase the total amount of achievable potential (i.e., to what extent can program financing help grow the efficiency market, ensuring that program financing is not replacing existing private sector financing).
• The amount of program-supported financing that might be appropriate to meet customer demand, which could help administrators size their financing programs. Without incorporating the full range of barriers into an “achievable” estimate of financing potential, market-sizing analyses may lead to an overestimate of the amount of program capital actually needed.
• The total savings financing could delivery, for use in goal setting. Achievable potential studies can help decision makers to understand the incremental savings that financing could produce and to set savings goals against this benchmark.
Given the interest in financing as a potential substitute for traditional energy efficiency activities, additional research on the best methods to incorporate financing into achievable potential studies would be useful.
Financing Programs: Cost-Effectiveness Screening Issues
In Chapter 4, we discuss planning and performance metrics—benefit/cost screening tests and net program benefits—and their applicability to financing programs, and we identify unique features of financing programs that pose challenges for administrators when conducting cost-effectiveness screening analyses.
In thinking about cost-effectiveness screening tests for efficiency financing programs, it is helpful to distinguish between those tests that focus on costs and benefits from a utility or program administrator perspective (i.e., the Program Administrators Cost Test or PACT) and those that involve a broader comparison of costs and benefits (e.g., the Total Resource Cost or Societal Cost Test). The PACT is particularly relevant because a key rationale offered by proponents of large-scale financing programs is that they can effectively leverage limited program funds, attract a large amount of private capital, and induce participants to bear most or all of the costs of efficiency measures. From a PACT perspective, benefit-cost ratios for financing programs may be encouraging (i.e., greater than one) due to lower costs borne by the program administrator than would occur in a rebate program. However, the ratio alone does not indicate if total net savings are increasing as a result of introducing financing. If the total level of savings attributable to a financing program is modest or is less than what occurred using traditional programs, then the total amount of net benefits achieved may be lower. Thus, states that are considering a shift toward financing as a core energy efficiency strategy should examine both total net benefits and benefit/cost ratios in order to assess the complete picture.
Several states that are implementing large-scale financing programs have also begun to examine the unique features of financing strategies that may be addressed in screening these programs for cost-effectiveness. Specifically, decision makers are considering how to account for:
• Measure Costs. Depending on the application, incremental measures costs (i.e., the additional cost of a high-efficiency air conditioner versus a standard air conditioner) are often included in cost effectiveness calculations. However, program-supported loans cover the full cost of measures and may even include non-energy measures. These are real costs to the program; however one could argue that only the energy-related portion of the loan should be included in cost-benefit analysis.

December 2015 www.seeaction.energy.gov 8
• Write Offs and Loss Reserves. Regulators and program administrators may need to use reasonable assumptions for expected loan performance to estimate the cost of write offs and loss reserve payouts over time.
• Opportunity Costs. Opportunity costs, or the value of forgone alternatives, of capital dedicated to financing programs may need to be properly accounted for in cost-effectiveness tests. For example, programs that lend utility customer capital at below-market rates arguably may be foregoing higher potential returns. Determining an appropriate rate of return that these funds could have generated may be a matter of discussion among stakeholders. Similar opportunity cost questions arise when utility customer funds are used to establish a loss reserve.
Evaluating the Impact of Financing Programs
Evaluation has been used for decades to verify the impacts and cost-effectiveness of energy efficiency programs. Efficiency financing programs have typically not been evaluated as separate programs within utility customer-funded portfolios to determine their incremental savings contribution. Chapter 5 discusses the increasing relevance of evaluation in jurisdictions where financing is gaining prominence, either as a complementary strategy or as a potential substitute for traditional efficiency programs.
When evaluating financing as a resource acquisition strategy, the broad availability of alternative private financing options (e.g., credit cards, home equity lines of credit, savings) should be considered. Evaluations would ideally assess whether program financing was a critical factor in influencing participants’ decision to move forward with their project (e.g., did the program-supported financing generate incremental savings?). This question may be more complex for efficiency financing programs compared to traditional efficiency programs because:
1. Program financing is often offered in markets in which private financing is also readily available. Thus, it may be more difficult to determine whether the project would have moved forward in the absence of a program offering.
2. Program financing is often promoted as an element or option in a broader program offering that may include other design components (e.g., technical assistance, rebates). Typical program evaluations generally do not parse out the specific impacts of particular program elements, focusing instead on the overall effectiveness of the program.
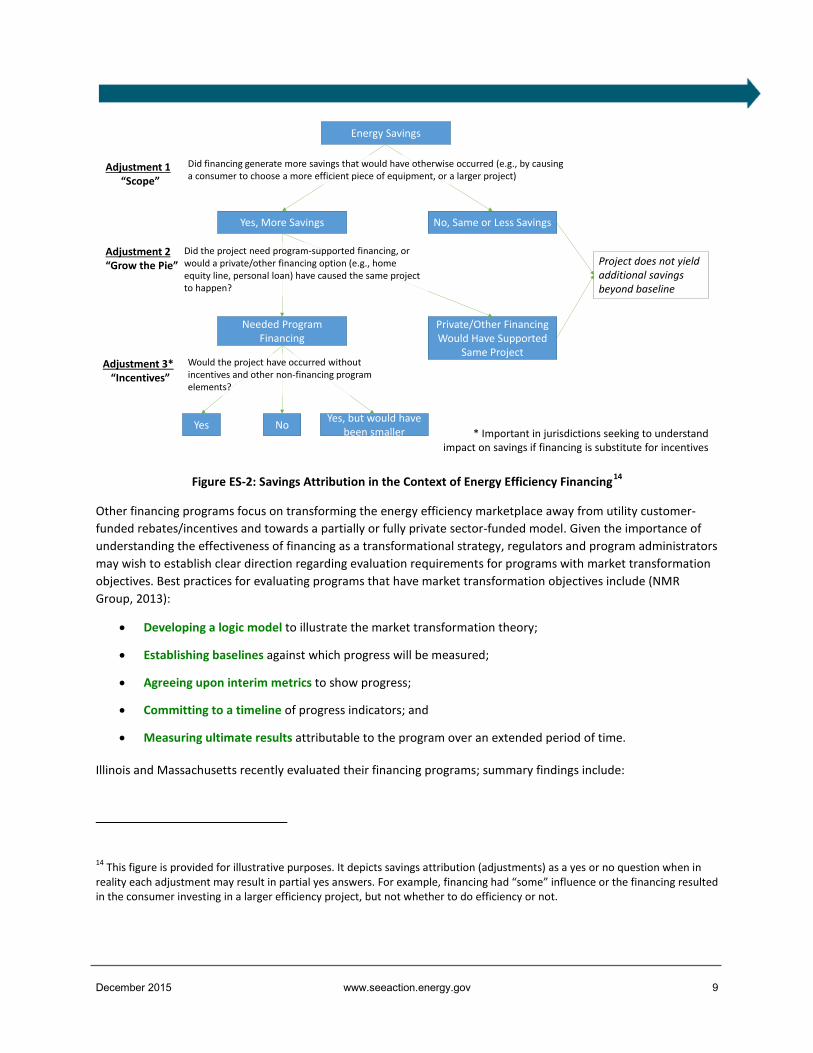
Figure ES-2 illustrates the multi-layered nature of the savings attribution question for energy efficiency programs that include and offer financing as part of their portfolio.
December 2015 www.seeaction.energy.gov 9
Figure ES-2: Savings Attribution in the Context of Energy Efficiency Financing14
Other financing programs focus on transforming the energy efficiency marketplace away from utility customer-funded rebates/incentives and towards a partially or fully private sector-funded model. Given the importance of understanding the effectiveness of financing as a transformational strategy, regulators and program administrators may wish to establish clear direction regarding evaluation requirements for programs with market transformation objectives. Best practices for evaluating programs that have market transformation objectives include (NMR Group, 2013):
• Developing a logic model to illustrate the market transformation theory;
• Establishing baselines against which progress will be measured;
• Agreeing upon interim metrics to show progress;
• Committing to a timeline of progress indicators; and
• Measuring ultimate results attributable to the program over an extended period of time.
Illinois and Massachusetts recently evaluated their financing programs; summary findings include:
14 This figure is provided for illustrative purposes. It depicts savings attribution (adjustments) as a yes or no question when in reality each adjustment may result in partial yes answers. For example, financing had “some” influence or the financing resulted in the consumer investing in a larger efficiency project, but not whether to do efficiency or not.
Energy Savings
Yes, More Savings No, Same or Less Savings
Adjustment 1“Scope”
Adjustment 2“Grow the Pie”
Adjustment 3*“Incentives”
Needed Program Financing
Private/Other Financing Would Have Supported
Same Project
* Important in jurisdictions seeking to understand impact on savings if financing is substitute for incentives
Did financing generate more savings that would have otherwise occurred (e.g., by causing a consumer to choose a more efficient piece of equipment, or a larger project)
Project does not yield additional savings beyond baseline
Did the project need program-supported financing, or would a private/other financing option (e.g., home equity line, personal loan) have caused the same project to happen?
Yes No Yes, but would have been smaller
Would the project have occurred without incentives and other non-financing program elements?

December 2015 www.seeaction.energy.gov 10
• Massachusetts (HEAT Loan Program). In Massachusetts, the zero-percent interest residential HEAT Loan program has grown to roughly $100 million of loans originated annually, with interest-rate buy-downs in the range of $1,400 per loan.15 Customers used HEAT loans primarily to finance equipment replacement (~80 percent of loans; 10 percent of loans were used for weatherization). A survey of ~950 aimed to assess the relative importance of the HEAT loan compared to other incentives in encouraging participation. Eighty-five percent of customers who used a HEAT loan reported that it allowed them to make improvements that they otherwise would have passed over. Evaluators found that only 9 percent of customers who received incentives also chose to use a HEAT loan. Those who did use the loan reported that it was slightly more influential in their decision-making than incentives, which are generous, including an insulation incentive of up to 75 percent of project cost. Among customers that did not take a HEAT loan, only 21 percent of customers reported that upfront costs were a barrier (compared to 39 percent of HEAT loan participants) (The Cadmus Group, 2015a).
• Illinois (On-Bill Financing). $7.6 million of loans had been made at the time of the evaluation (over 1600 loans), primarily to single-family residential customers. Nearly 90 percent of the loans financed replacement or upgrades of furnaces or central air conditioning systems). Based on self-reported surveys of 75 participants, the evaluation team estimated a free ridership rate of 13 percent; that is, 87 out of 100 projects were estimated to be due to the on-bill financing program and not to incentives, which were also available to on-bill financing (OBF) participants. However, participants were also asked if they planned to complete a project prior to learning about the program; almost half (43 percent) of all participants reported that they were planning to complete the upgrade.16 All programs were cost effective from the program administrator perspective (PACT ranged from 1.27 to 3.13) although the pilot programs did not pass a total resource cost (TRC) test (The Cadmus Group, 2015b).
Evaluation can help state policy makers and program administrators assess whether savings are attributable to financing programs versus other programs components, offering insight on the impact of shifting resources to financing and away from other program options. Conventional evaluation methods can be adapted to assess financing programs, such as survey methods and various experimental and quasi-experimental approaches, including randomized control trials. However, further research is required on refining these approaches for financing programs and assessing which approaches are the most effective, and on cost-effective ways to assess savings and market transformation.
Conclusion
Our review of several leading states that are implementing or considering these large-scale financing programs suggests that additional work on adapting planning, performance, and evaluation tools is warranted in order to assess the role of large-scale financing programs. Table ES-2 outlines early applications of these tools to financing programs.
15 Only approximately $15M of ratepayer funds was used to support total activity of $100M. 16 This percentage varied by measure type; 76 percent of survey respondents who installed a new furnace had planned to do so before hearing of the program, but none of the respondents who installed insulation planned to do so prior to participating in the program. However, respondents were not asked to differentiate between plans to install a high efficiency unit versus a standard efficiency unit, so the evaluation team does not draw conclusions from this statistic.

December 2015 www.seeaction.energy.gov 11
Table ES-2: Early Experience with Adapting Traditional Planning and Performance Tools to Financing Programs CA NY CT MA MD Program Reviewed Statewide Financing
Pilots NY Green Bank
Connecticut Green Bank
HEAT Loan
EmPower
Achievable Potential Analysis Used? Yes No No No No Cost-Effectiveness Screening Used? Yes (under
development) No No (voluntary
protocols used) Yes Yes
EM&V Process with Regulatory Oversight/Review?17
Yes Yes No Yes No
The perception that financing programs must be flexible enough to attract private capital has led some jurisdictions to modify regulatory reporting requirements. This could create situations in which financing is used as the primary mechanism to achieve energy efficiency goals but is subject to less regulatory oversight than has been applied to traditional efficiency programs. The ability of large-scale financing programs to achieve aggressive energy efficiency savings or market transformation objectives is still an open question. Achievable potential studies, such as those conducted in California, suggest that financing programs may increase electric and gas savings potential by only three to five percent (Navigant, 2014). This suggests some uncertainty regarding the ability of financing to drive energy efficiency to a new scale on its own, rather than as one component in a more comprehensive mix of programs and strategies.
Impact evaluations of existing large-scale financing programs that have achieved relatively high levels of loan volume may address other remaining issues. For example, in the residential sector, single measures like HVAC and windows often far outstrip the number of comprehensive whole-house projects that are financed; evaluations in Illinois and Massachusetts confirm this trend. HVAC equipment replacements and windows have relatively high naturally-occurring demand; robust impact evaluations may help determine whether these types of projects would have moved forward in the absence of a program offering, to avoid using utility customer funds to support projects that would have been completed anyways.
Jurisdictions that are considering a shift toward financing as a primary strategy to achieve their energy efficiency objectives may want to consider implementing a regulatory framework that has adequate oversight and accountability as strategic choices are pursued. Several key elements of a regulatory framework include:
1. Independent Oversight Entity. Regulatory oversight by an entity (e.g., PUC, city council, governing board) that is independent of the program administrator and applies performance and accountability requirements as robust as those applied to traditional efficiency programs.
2. Program Classification and Treatment. Treatment of energy efficiency financing programs in ways likely to generate periodic and rigorous assessments of program performance. Examples include treating financing as a stand-alone program and linking evaluated performance to administrator performance incentives.
Jurisdictions may wish to consider utilizing planning and evaluation tools that can help provide objective information regarding the prospects and performance of energy efficiency financing programs.
17 Many of these entities are also overseen by a Board of Directors and conduct annual financial audits.

December 2015 www.seeaction.energy.gov 12
• Achievable Potential Studies. Achievable potential studies that focus on the incremental savings financing can unlock are likely to be more useful than “market sizing” studies that estimate a theoretical maximum investment need without considering demand for financing.
• Cost-Effectiveness Screening Analysis. It is important to estimate and report both total net benefits as well as benefit/cost ratios in order to assess the overall value of financing programs.
• Evaluation. Assessing the impacts of and savings attributable to financing programs may be more complex due to readily available private market alternatives. A robust evaluation may require an examination of (1) whether financing was needed to produce the savings; (2) whether program financing was needed, as opposed to private financing alternatives; and (3) whether the savings would have occurred in the absence of other program offerings, such as rebates and incentives.

December 2015 www.seeaction.energy.gov 13
Chapter 1: Introduction
Empirical studies suggest that current levels of public and utility customer (ratepayer) funding are insufficient to access all cost-effective energy efficiency opportunities in most jurisdictions (Navigant, 2014) (Goldman, et al., 2010). Utility customer-supported financing may be able to address the upfront costs of energy efficiency upgrades and stretch the impact of limited program dollars. Given this situation, the offer of financing to customers has received increasing attention in recent years as a key strategy for achieving energy efficiency goals.
At present, many program administrators are using utility customer funds to support financing products designed to encourage energy efficiency, either by making loans directly with customer funds or by using these funds to offer credit enhancements (e.g., loan loss reserves) to attract private capital.18,19 Typically, financing is a small component of a larger portfolio of energy efficiency programs that includes rebates, technical assistance, education, training, and other strategies.
By contrast, policy makers in some jurisdictions have expressed interest in shifting away from traditional energy efficiency program strategies over time, seeking to increase the prominence and availability of financing products. In these jurisdictions, policy makers are testing new approaches and have directed program administrators to launch large-scale financing programs, often using a combination of utility customer funds and third-party private capital. This larger pool of capital would make more loans, leases, and other financing solutions available to customers interested in energy efficiency upgrades. Examples of policy makers’ interest in this approach include:
• New York, where the New York State Energy Research and Development Authority (NYSERDA) requested $947M of utility customer funds to capitalize the NY Green Bank (which came partially from uncommitted system benefit charge funds for traditional efficiency programs). This is supplemented by $53M allocated by NYSERDA from revenues from Regional Green House Gas Initiative proceeds(NYSERDA, 2014c).
• Connecticut, which advanced a “goal of transitioning programs away from government-funded grants, rebates, and other subsidies, and towards deploying private capital to finance energy efficiency” (Connecticut Department of Energy and Environmental Protection, 2013, p. 8).
• California, which allocated $65 million to launch a suite of statewide energy efficiency financing pilots to “stimulate deeper energy efficiency projects than previously achieved through traditional program approaches (e.g., audits, rebates, and information)” (California Public Utilities Commission, 2013, p. 3).
• New Jersey, which is proposing a shift away from existing programs and into financing strategies (New Jersey Board of Public Utilities, 2015).
18 This report focuses on energy efficiency financing programs funded by utility customers. Many state and local agencies also offer financing for clean energy projects using other funding sources. Under the American Recovery and Reinvestment Act, state and local governments dedicated over $650M in new funds for financing of efficiency projects using various strategies (e.g. revolving loan funds, loan loss reserves). See Goldman, Stuart, Hoffman, Fuller & Billingsley, 2011 for more discussion of how ARRA-funded efficiency finance programs interacted with ratepayer-funded programs. 19 For example, a 2014 SEE Action study identified 30 programs that allow utility customers to repay loans for energy efficiency upgrades via their utility bill. In aggregate these programs have financed over $1.8 billion of improvements over several decades (SEE Action Financing Solutions Working Group, 2014).

December 2015 www.seeaction.energy.gov 14
To compare these two approaches, throughout this report we use the construct of “financing as a complement”—using financing as an enhancement to existing programs that are built on direct incentive strategies—and “financing as a substitute”—transitioning away from traditional programs and toward financing as a primary strategy to achieve energy efficiency goals (see Table 1 and Chapter 2 for more detailed discussion). Note that these two approaches are not mutually exclusive in the short-term; even in jurisdictions where policy makers have made statements emphasizing an eventual substitution, financing currently operates as a complement across the board (e.g., consumers may make use of existing programs and new financing-focused offers).
Table 1: Role of Financing: Complement or Substitute for Existing Efficiency Program Strategies? Role of
Financing Description Key Questions
Financing as a Complement
Deployment of financing strategies to enhance existing efficiency programs
- Effectiveness of financing relative to other existing program strategies
- Ability of financing to enhance existing programs - Optimal mix of program budgets/resources to allocate to financing
versus other program strategies (e.g., rebates) Financing as a Substitute
Eventual transition from rebates to financing-only strategies
- Effectiveness of a paradigm shift away from traditional rebates and toward financing. How much participation is achieved? Energy savings realized? Hard-to-reach market segments accessed?
Rationales for Utility Customer-Supported Financing
Any utility customer-funded activity should be based on a well-articulated rationale for offering the program. This “problem statement” can inform program design and allow program administrators to measure progress towards goals. Rationales for offering financing include:
• Addressing “first cost barriers:” 20 Consumers may be put off by a large upfront expense for efficiency retrofits for benefits (e.g. bill savings) that are received over time and may be unwilling to use financing options available to them (e.g., savings, home equity line of credit).
• Some market segments have difficulty accessing financing, and utility customer funds, as credit enhancements or as direct investment, are needed to expand access to these consumers. Many consumers have access to attractive financing, but some market segments (e.g., small businesses, affordable multifamily properties) do not. Gap analyses may be useful in determining which segments are not being adequately served by private financing options and what additional savings might be achieved by filling these financing gaps.
• Larger consumer cost contributions are needed to increase leverage of limited ratepayer funds. Utility customer-funded financing offers may encourage larger cost contributions by participating consumers.
• Private capital markets are not providing attractive financing for energy efficiency projects due to a lack of information, education, and data. Because energy efficiency financing is a relatively new type of lending, performance history and loan data are limited. Without this information, private financing
20 Financing does not actually reduce the first (or total) cost of a project; if interest is charged, financing increases total project cost. Financing alters the timing of when costs are paid and eliminates a large, upfront outlay of cash. Rebates do not address timing of payments but do reduce total project cost.
December 2015 www.seeaction.energy.gov 15
markets may not offer financing terms that reflect the true performance of and risks associated with energy efficiency loans. Utility customer funding, in the form of credit enhancements or direct investment, may be able to mitigate this gap and allow the needed loan performance data to accumulate.
• Specialized financing products are needed to overcome the unique challenges of financing energy efficiency (e.g., renter/owner split incentives, balance sheet treatment). Utility customer funds may be needed to encourage new products that may not be widely offered by private lenders. Examples of specialized financing products include property assessed clean energy (PACE) and on-bill financing.
Challenges for Regulators and Administrators
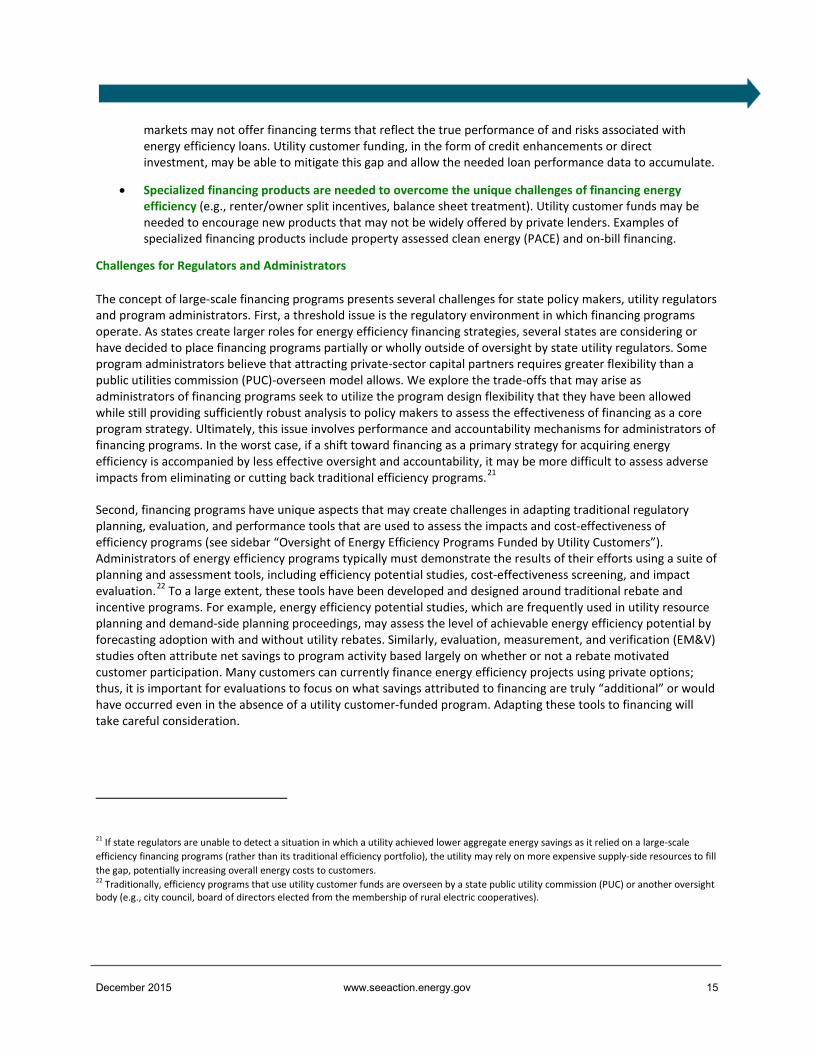
The concept of large-scale financing programs presents several challenges for state policy makers, utility regulators and program administrators. First, a threshold issue is the regulatory environment in which financing programs operate. As states create larger roles for energy efficiency financing strategies, several states are considering or have decided to place financing programs partially or wholly outside of oversight by state utility regulators. Some program administrators believe that attracting private-sector capital partners requires greater flexibility than a public utilities commission (PUC)-overseen model allows. We explore the trade-offs that may arise as administrators of financing programs seek to utilize the program design flexibility that they have been allowed while still providing sufficiently robust analysis to policy makers to assess the effectiveness of financing as a core program strategy. Ultimately, this issue involves performance and accountability mechanisms for administrators of financing programs. In the worst case, if a shift toward financing as a primary strategy for acquiring energy efficiency is accompanied by less effective oversight and accountability, it may be more difficult to assess adverse impacts from eliminating or cutting back traditional efficiency programs.21
Second, financing programs have unique aspects that may create challenges in adapting traditional regulatory planning, evaluation, and performance tools that are used to assess the impacts and cost-effectiveness of efficiency programs (see sidebar “Oversight of Energy Efficiency Programs Funded by Utility Customers”). Administrators of energy efficiency programs typically must demonstrate the results of their efforts using a suite of planning and assessment tools, including efficiency potential studies, cost-effectiveness screening, and impact evaluation.22 To a large extent, these tools have been developed and designed around traditional rebate and incentive programs. For example, energy efficiency potential studies, which are frequently used in utility resource planning and demand-side planning proceedings, may assess the level of achievable energy efficiency potential by forecasting adoption with and without utility rebates. Similarly, evaluation, measurement, and verification (EM&V) studies often attribute net savings to program activity based largely on whether or not a rebate motivated customer participation. Many customers can currently finance energy efficiency projects using private options; thus, it is important for evaluations to focus on what savings attributed to financing are truly “additional” or would have occurred even in the absence of a utility customer-funded program. Adapting these tools to financing will take careful consideration.
21 If state regulators are unable to detect a situation in which a utility achieved lower aggregate energy savings as it relied on a large-scale efficiency financing programs (rather than its traditional efficiency portfolio), the utility may rely on more expensive supply-side resources to fill the gap, potentially increasing overall energy costs to customers. 22 Traditionally, efficiency programs that use utility customer funds are overseen by a state public utility commission (PUC) or another oversight body (e.g., city council, board of directors elected from the membership of rural electric cooperatives).

December 2015 www.seeaction.energy.gov 16
Nearly every state in the United States offers programs to utility customers to promote energy efficiency. These programs are developed and managed by program administrators to meet state policy or regulatory goals (e.g., achieve an energy savings target, implement all cost-effective efficiency) (Billingsley, et al., 2014). In many states, energy efficiency is defined, in statute or regulation, as a resource that can potentially avoid or defer generation or transmission and distribution investments. Utilities collect funding for efficiency programs as part of the bundled electricity rate or through a line-item charge on customer bills, often called a system benefits charge (SBC). Energy efficiency programs are often designed to meet “resource acquisition” and/or “market transformation” objectives (although these distinctions are not always neatly drawn within a portfolio of efficiency programs and some programs may have elements of both):
• Resource acquisition (RA) is aimed at acquiring cost-effective energy efficiency resources using various program strategies (e.g., rebates, financing, technical assistance) to help meet future electric system needs that would otherwise have been met by additional infrastructure or fuel purchases.
• Market transformation (MT) is “the strategic process of intervening in a market to create lasting change in market behavior by removing identified barriers or exploiting opportunities to accelerate the adoption of all cost-effective energy efficiency as a matter of standard practice” (NEEA, n.d.). The term “market transformation” refers to both the policy objective and a program strategy that works to permanently alter a marketplace so that greater levels of energy efficiency become standard practice. Market transformation involves strategic intervention in specific markets (made up of definable market actors and decision makers), results in sustainable changes (e.g. continues after the program intervention ends), changes the behavior of supply-side and demand-side market actors, addresses market barriers and leverages opportunities, and accelerates and/or increases market adoption. Examples include building market capacity to apply more energy efficient new construction and support codes, offering rebates to “upstream” or “mid-stream” providers of energy-efficient technologies, and labeling energy efficient products.
Several planning and performance tools are used to assess energy efficiency program offerings and include prospective planning tools—energy efficiency potential studies and cost-effectiveness screening mechanisms—and retrospective program evaluations. Applying these tools to energy efficiency financing programs may involve some modifications from standard practice.
• Potential studies are estimates of the technical, economic, and achievable opportunity for savings from energy efficiency in a given jurisdiction (see Chapter 3).
• Cost effectiveness screening compares a program’s benefits to its costs, using one or a combination of tests that represent different perspectives (e.g., program administrator, societal, participant) (see Chapter 4). Cost effectiveness tests are used for planning purposes to help determine the composition of energy efficiency program portfolios as well as retrospectively as an element in assessing the net benefits (benefits minus costs) of programs that have been implemented (see Chapter 4).
• Impact evaluations, a component of evaluation, measurement, and verification (EM&V), involve a retrospective assessment of the performance of an efficiency program or portfolio of programs. Impact evaluations typically estimate energy and peak demand savings attributable to programs. These savings cannot be directly measured and are often estimated using specified protocols, including utility billing analysis before and after retrofits for treatment and control group, verification of savings that use deemed or deemed calculation methods using field measurements (e.g., hours of operation of equipment, audits of installations), and building simulation models for new construction calibrated to occupancy and operating schedule (see Chapter 5).
OVERSIGHT OF ENERGY EFFICIENCY PROGRAMS FUNDED BY UTILITY CUSTOMERS
December 2015 www.seeaction.energy.gov 17
Objectives and Approach
The State and Local Energy Efficiency Action (SEE Action) Financing Solutions and Driving Ratepayer-Funded Efficiency through Regulatory Policies Working Groups commissioned this report as groundwork for a dialogue among regulators and stakeholders in the energy and financing sectors to explore regulatory mechanisms for ensuring that efficiency financing initiatives provide value for society and protection for consumers. The primary audiences for this report are state regulators and other policy makers, program administrators, current and prospective providers of financing services in the efficiency market, and other stakeholders. This report builds on a previous SEE Action report that reviewed 30 on-bill programs and analyzed results (e.g., loan volume, savings, participation rates) and examined key program design issues (SEE Action Financing Solutions Working Group, 2014). In that report, we identified several states that were implementing large-scale finance programs and/or considering shifting away from traditional efficiency programs to much greater reliance on financing.
In this report, our primary objectives are: (1) to identify and analyze key policy and technical issues that are emerging around integration of financing into energy efficiency portfolios with a particular focus on those states considering and/or implementing large-scale efficiency financing programs and (2) to better understand the practical and regulatory challenges in order for financing initiatives to deliver on their potential. In exploring these issues, we focus on identifying information and tools that state regulators need in order to fulfill their oversight role and balance the interests of utility customers, shareholders, and the public.
We conducted interviews with about 20 regulators and stakeholders in five states (California, New York, Connecticut, Massachusetts, and Maryland) and reviewed publicly available documents (e.g., regulatory proceedings on efficiency financing initiatives, potential studies and evaluations of financing programs). These states were chosen because of their recent experiences grappling with the key issues identified in this report.
Report Organization
The remainder of this report is organized as follows. In Chapter 2, we discuss the regulatory context under which energy efficiency programs operate, the relationship between a program administrator and state regulatory commission, and the objectives of a financing program and its treatment and classification by state regulators. We also describe financing programs and energy efficiency policy environments in our five case study states. In Chapters 3 through 5, we discuss existing planning, performance, and evaluation tools and early efforts to apply them to large-scale financing programs.
In Chapter 3, we review the types of energy efficiency potential studies and discuss attempts to estimate achievable potential for financing program, including other planning tools that have been used to support financing programs: studies that estimate the theoretical maximum opportunity and studies that estimate long-term market addressable potential. In Chapter 4, we discuss benefit/cost screening tests and analysis of net program benefits and identify unique features of financing programs that pose challenges for administrators that need to conduct cost-effectiveness screening and benefits analysis. In Chapter 5, we discuss EM&V issues that arise in relation to financing programs and review evaluation studies and approaches used to assess impacts of large-scale finance programs that have resource acquisition or market transformation objectives. It is important to emphasize that open questions remain to be answered regarding the use and application of these planning, performance and evaluation tools for efficiency financing programs.

December 2015 www.seeaction.energy.gov 18
Chapter 2: Placing Energy Efficiency Financing Programs in a Regulatory Context
In this chapter, we describe and discuss the regulatory context under which efficiency financing programs operate. We define regulatory context as a combination of three variables: (1) use of utility customer funding, (2) type of program administrator, and (3) program classification and treatment. These three factors, visualized in Figure 1, may affect the type and rigor of regulatory oversight applied to financing programs. In practice, decisions on how financing programs will be regulated and overseen and what level of accountability will be required of them are complex and multidimensional. A program’s regulatory context is not the only determinant of oversight and accountability mechanisms, but it is often an important factor.
KEY TAKEAWAYS
• Use of utility customer funds in energy efficiency financing programs provides a foundational rationale for regulatory oversight of program planning and performance.
• Effective PUC governance may depend on how the regulator engages in program oversight (e.g., reviewing links to a state’s overall energy and efficiency policy goals), as well as how financing programs are treated within the regulatory context. Potentially important aspects of program treatment include (1) classification of financing as a distinct program, (2) resource acquisition/market transformation classifications, and (3) links to performance incentives.
• Financing programs that are treated as distinct programs within an overall portfolio may be required to demonstrate savings specifically attributable to the program, which may be important in jurisdictions considering using financing as a substitute for traditional programs in the future.
• Resource acquisition and market transformation objectives are not mutually exclusive. For financing programs, applying both classifications may have important regulatory implications. Financing programs typically have short-term goals in early years designed to be achieved directly through program activity, which may exist alongside longer-term market transformation goals. Examining early outcomes resulting directly from program activity (e.g., direct lending, credit enhancement) through the lens of resource acquisition may shed light on the prospects for transforming the broader market in future years.
• Linking financing programs to performance incentives of the program administrator, whether directly or through their contribution to aggregate portfolio savings, may lead to increased attention on evaluations of the impacts of efficiency financing programs.

December 2015 www.seeaction.energy.gov 19
Figure 1: Placing Financing Programs in a Regulatory Context—Variables That Affect the Degree of Regulatory Oversight
Utility Customer Funded Energy Efficiency
Nearly all states offer energy efficiency programs for utility customers. These programs are developed and managed by program administrators to meet state policy or regulatory goals (e.g., achieve an energy savings target established in state legislation, implement all cost-effective efficiency) (Billingsley, et al., 2014). The use of utility customer funds for an energy efficiency program presents a clear rationale for regulatory oversight of program planning and performance (see Figure 1) although oversight by a state PUC (or governing board) does not automatically guarantee transparency and accountability.
State regulators who oversee efficiency programs that use utility customer funds have traditionally required program administrators to demonstrate accountability based on policy guidelines (e.g. cost-effectiveness screening, EM&V requirements). As a recent survey of North American energy efficiency programs stated, “Collection of funds from rate-paying utility customers to finance energy efficiency acquisition from those same customers involves a type of covenant between the energy utilities, customers, and any third parties, usually overseen by public utility commissions” (Instutite for Industrial Productivity, 2012, p. 25). This covenant provides one rationale for requiring program administrators that use utility customer funds to demonstrate their effective use through impact evaluations of program outcomes.
PUC Oversight
The regulatory context of an efficiency financing program may also be influenced by the entity selected to administer such programs, and whether that entity is overseen by a PUC. We found that financing programs implemented by the existing efficiency program administrator are typically subject to that state’s regulatory oversight requirements for efficiency programs, as those programs generally fall under PUC purview. However,
Incr
easin
g O
vers
ight
and
Tra
nspa
renc
yEstablishes rationale for treating EE as a resource with links to utility or DSM planning process
Regulator reviews and oversees planning process and reporting of outcomes
Establishes rationale for assessing impacts (savings) of financing programs
Utility Customer Funds Used
PUC-Regulated Program Administrator
Financing is a Stand-alone
Program
Financing is Part of
Resource Acquisition
Financing is Linked to
Performance Incentives
Isolates impact of financing program relative to other programs
Links financing program outcomes to savings achieved (EE acquired)
Program Classification and Treatment

December 2015 www.seeaction.energy.gov 20
when programs are administered by new or non-traditional entities, state policy makers and regulators do not necessarily place these entities under PUC oversight or apply existing regulatory mechanisms.
Oversight by a state PUC (or governing board) is one type of governance model. Reliance upon a board of directors and/or independent financial audits are examples of other governance and oversight models, which may play an important role in ensuring sound administration.23 PUCs focus on reviewing energy savings targets and reporting, and also typically play a unique role in coordinating oversight of customer-supported energy efficiency programs within the broader context of a state’s overall energy procurement strategies and policy efforts.24
Program Classification and Treatment
The mechanisms used to assess energy efficiency financing programs may also be shaped by the way the program is treated and categorized under a state’s efficiency policy guidelines, including:
1. Whether financing is treated as a distinct program within the energy efficiency portfolio;
2. Whether financing is treated as a resource acquisition program or a market transformation effort; and
3. Whether financing programs are linked to opportunities for the program administrator to earn performance incentives.
Treatment as a Distinct Program
In many jurisdictions, financing is treated as a component of an overall portfolio, rather than as a distinct program. In other cases, administrators treat financing offerings as a cross-cutting effort that is available for use in multiple programs (e.g., a customer may use a residential loan product to help finance their purchase of high-efficiency equipment in an HVAC program as well as participate in a home performance program). In jurisdictions that treat financing as a complementary activity, classifying financing as a program component (or cross-cutting offering) may be consistent with the notion that financing must work in conjunction with other program elements in order to provide a comprehensive package of service offerings to customers.
However, there may be advantages in treating financing as its own distinct program.25 For example, it is more likely that stand-alone finance programs will be asked to demonstrate and document savings and cost-effectiveness through periodic impact evaluations. If financing is not treated as a distinct program, it may be more difficult to conduct an impact evaluation that characterizes the results that are specifically attributable to financing. Under these circumstances, program administrators and regulators may have less information as to the likely effectiveness of using financing as a substitute for traditional efficiency programs.
Resource Acquisition and Market Transformation
23 A board of directors of a non-profit or for-profit entity (or independent auditors) is focused primarily on firm conduct, financial performance, and broad policy objectives rather than demonstrating savings created or assessing cost-effectiveness. 24 State PUC oversight may involve reviewing savings targets to ensure that the program administrators meet an agreed-upon portion of the energy load and, in some jurisdictions, reviewing claims by program administrators for performance incentives based on accomplishments. 25 Treatment of financing as a distinct program would not necessarily mean that customers would be ineligible to participate in other programs if they took advantage of financing offerings. For example, in the California financing pilots, customers may take advantage of rebates and incentives along with financing, though they these offerings are made via separate programs. One effect of this structure has been a focus on attribution (see Chapter 5).

December 2015 www.seeaction.energy.gov 21
Proponents of large-scale shifts toward financing as a core strategy for achieving energy efficiency goals often frame this type of effort as transformational (and long-term). It should be emphasized that market transformation and resource acquisition approaches are not mutually exclusive (Eto, Prahl, & Schlegel, 1996).26 Resource acquisition tends to focus on energy savings that are achieved directly through program activities, whereas market transformation generally focuses on achieving energy savings via impacts on the broader market.
For example, in the short term, an administrator of a financing program may pursue a resource acquisition strategy by directly lending out funds from its program budget or by using these funds as credit enhancements and interest-rate buy-downs to encourage immediate improvements of rates and terms offered by private financial institutions. These activities are expected to generate a certain number of loans and associated energy savings as a result of their immediate impact on the cost of capital. The administrator may also design the finance program so that loan performance data is made available to private market lenders without violating customer confidentiality; in the long term, this may lead to more favorable loan terms and increased lender participation even without credit enhancement.
Evaluating the effectiveness of and resource acquisition savings that can be attributed to these direct program strategies may help shed light on the prospects for financing to serve effectively as a large-scale market transformation strategy. If savings are significant and can be attributed to the financing program strategy, then it may be reasonable to expect that further efforts to improve the availability and cost of capital in the broader market may have even greater effects. On the other hand, if the immediate outcomes are more limited, then greater caution may be warranted in shifting towards financing as a substitute for other program strategies.
Linking Program Results to Performance Incentives
In some states, program administrators have the opportunity to earn performance incentives if they achieve program goals and targets. In jurisdictions that are contemplating large-scale shifts toward the use of financing as a core strategy for achieving energy efficiency savings objectives, policy makers should consider whether offering performance incentives provides a mechanism to motivate administrators and also assess prospects for using financing as a means to achieve large-scale energy savings targets.
Designing performance incentives for programs focused on financing as a core strategy is largely theoretical at this stage. None of the jurisdictions reviewed for this paper had performance incentives in place specifically tied to financing, although, in California, financing program outcomes will contribute to the overall results of the resource acquisition portfolio, which in turn are linked to performance incentives.
From a resource acquisition perspective, jurisdictions considering linking performance incentives to program outcomes should consider designing incentive structures that reward actual savings attributable to financing-related efforts. Rewarding loan volume may be less effective than rewarding savings attributable to loans originated.27 If market transformation is an important policy objective, then it may be appropriate initially to reward administrators based on financing metrics and goals (e.g., changes in the availability or cost of capital) that have been established, which are ultimately expected to increase savings over the longer term. In such cases,
26 See, for example, in Eto, Prahl, & Schlegel, 1996, p. xii: “Market transformation is not a label that uniquely identifies certain energy efficiency program designs to the exclusion of others. It is instead an objective that all energy-efficiency programs have at least a theoretical potential to achieve to varying degrees.” 27 As discussed in Chapter 5, in some cases, financing activity may not necessarily correlate with increased savings, particularly if program activity replaces private activity that might otherwise have occurred.

December 2015 www.seeaction.energy.gov 22
performance metrics may need to evolve over time to correspond with expected market transformation timelines (see Chapter 5 for a discussion of market transformation and interim metrics).28
Linking financing programs to performance incentives, either directly or through their contribution to aggregate portfolio savings, may lead to increased attention on evaluations of the impacts of efficiency financing programs.29 Understanding how performance incentives impact the outcomes of financing programs is an area worthy of further exploration.
Role of Financing in an Efficiency Portfolio: Complement vs. Substitute for Traditional Programs
As noted in Chapter 1, we observe two schools of thought regarding the role of utility customer-supported financing programs in an energy efficiency portfolio:
1. Financing as a Complement. In some jurisdictions, financing is advanced as an enhancement that complements existing programs (e.g., rebates, technical assistance, information/audits).
2. Financing as a Substitute. In other jurisdictions, policy makers have expressed aspirations to transition away from traditional energy efficiency program designs and toward financing as a primary strategy to achieve energy efficiency goals.
These scenarios are not mutually exclusive, particularly in the short term. Most jurisdictions reviewed in this report have expressed a desire to shift more toward financing as a partial or even complete substitute for their existing rebate incentive efficiency programs. However, in practice, financing still is being used in some form as a program complement (i.e., consumers may take advantage of both financing and rebate programs).
Programs Reviewed
Table 2 introduces the five programs reviewed for this report. We focused selectively on states where financing programs are a relatively large part of the energy efficiency portfolio or provide insights on issues related to the applicability of planning, performance, and evaluation tools for finance programs. These five programs are not necessarily representative of national energy efficiency financing activity.
California
Selected Energy Efficiency Policies
In 2003, California formalized its commitment to acquire all cost-effective energy efficiency and introduced the “loading order” concept, which requires that electricity demand be first reduced through energy efficiency and demand response, then met by renewable resources and distributed generation, and lastly by clean and efficient
28 See also, “Performance Metrics for Market Transformation Programs: Incentivizing Progress without Strangling Creativity,” (Nadel, Hewitt, Horowitz, & Casentini, 2000). 29 For example, in California, the classification of financing as a resource acquisition program, which together with other resource programs is tied to performance incentives at the portfolio level, influences the evaluation of the financing programs in several ways. First, evaluators will be required to ensure that financing savings are not double-counted with savings from other programs. Second, evaluators will seek to establish a net-to-gross ratio for financing programs, which—in addition to accounting for the impact of other programs—will also examine free ridership rates in light of the availability of private market financing. Only the remaining savings that are actually attributable to the financing program itself would contribute to resource portfolio savings, with the potential to increase performance incentives.

December 2015 www.seeaction.energy.gov 23
fossil-fueled generation (State of California, 2003). Legislation in 1996 and 2000 authorized collection of a public goods charge (i.e., a system benefit charge or SBC) to pay for pursuit of all cost-effective energy efficiency opportunities. After the SBC sunset in 2011, utilities were authorized to use their resource procurement budgets to support energy efficiency acquisition and are eligible for performance incentives awarded for meeting energy efficiency targets.
Both legislation and regulatory orders require evaluation of energy efficiency programs, with focus on net benefits, cost-effectiveness, and “the extent to which the programs have delivered cost-effective energy efficiency not adequately provided by markets” (CPUC Code §399.8(f)(4)(G), 1999).

December 2015 www.seeaction.energy.gov 24
Table 2: Summary Characteristics of Financing Programs Reviewed
CA NY CT MA MD
Financing program reviewed Statewide Financing Pilots NY Green Bank Connecticut Green Bank (CGB)
HEAT Loan MHELP Loan Program
Utility customer funds sought or used? Yes Yes Yes Yes Yes
Regulated program administrator?
Yes, California Alternative Energy and Advanced Transportation Financing Authority (CAEATFA)30
Yes, NYSERDA No, Connecticut Green Bank
Yes, utilities’ third-party administrator
No, Maryland Clean Energy Center
Part of resource acquisition portfolio? Yes No N/A31 Yes No, but under
discussion Treated as a distinct program? Potentially Yes N/A No Potentially
Tied to performance incentives? Yes, via linkage to other EE programs TBD No Yes, via linkage to other EE programs No
Financing envisioned as a complement? Yes Yes Yes Yes Yes
Financing envisioned as a substitute? Potentially Yes Yes No Potentially
Utility customer funds dedicated to selected
financing program32 $75M33
$947M ($165M initial funding, $150M additional funding approved in July, $631.5M follow on request)34
$27.6M (2014)35 Approx. $15M (2013)
$4.6M proposed (2013 and 2014)
Type of financing or credit enhancement offered by
program
Loans, leases, energy savings agreements, LLRs and debt service reserves36
Guarantees, loan capital (credit facilities, subordinate capital, senior capital)
IRBs, LLRs, and loan capital IRBs IRBs
30 California Alternative Energy and Advanced Transportation Financing Authority (CAEATFA) is a state agency that the California PUC designated as the administrator of California’s financing pilots, in collaboration with utilities. 31 Although the Connecticut Green Bank as the administrator of the Connecticut Clean Energy Fund is not responsible for resource acquisition, the utilities as administrators of the Connecticut Energy Efficiency Fund are focused on resource acquisition. Through a Joint Committee there is coordination on goals and priorities between the administrators, see http://www.ctcleanenergy.com/Portals/0/board-materials/5a_Consolidated%20Priorities_Joint%20Committee_090815.pdf 32 CA (California Public Utilities Commission, 2013). NY (NYSERDA, 2014c). CT (CEFIA, 2014). MA (NSTAR, 2014) (WMECo, 2014) (National Grid, 2014). MD (EmPOWER Finance Work Group, 2013). 33 $65.9M initial commitment; $9M held in reserve. 34 Remaining capitalization proposed to be transferred over ten years (2016-2025), but supplemented by an external borrowing facility, supported by a pledge of the approved collections. This will allow NY Green Bank to deploy capital when needed but allow transfers from utility customer funds to be scheduled to meet objectives for overall declining ratepayer collections. 35 CGB supports both renewable and energy efficiency efforts; utility customer funds ($28M in 2014) are currently used for administration and renewable energy programs. 36 LLR = loan loss reserve, IRB = interest rate buy down. See each state for more detailed description of financing structures offered.

December 2015 www.seeaction.energy.gov 25
Financing Program Reviewed: State-wide Financing Pilots
In 2012, the California Public Utilities Commission (CPUC) directed that existing pilot financing efforts, some of which began as local government or non-profit-led efforts during the American Recovery and Reinvestment Act (ARRA) period, be expanded state-wide, noting that “Lowering the barriers to energy efficiency retrofits and financing, particularly in under-served market sectors, is …critical to reaching the state’s goals of reduced energy consumption” (California Public Utilities Commission, 2013, p. 2). The pilot programs are funded with $65.9 million of utility customer funds plus $9.3 million held in reserve until after a midpoint review of the pilots (California Public Utilities Commission, 2013).
In the near-term, the pilot programs act as a complement to other energy efficiency programs; customers may make use of financing offers as well as incentives. However, the CPUC notes that the pilots are “designed to test market incentives for attracting private capital through investment of limited ratepayer funds.…The Commission’s goals include developing scalable and leveraged financing products to stimulate deeper EE projects than previously achieved through traditional program approaches (e.g., audits, rebates, and information)” (California Public Utilities Commission, 2013, p. 3).
New York
Selected Energy Efficiency Policies
In 1996, New York authorized NYSERDA to use SBC funds to offer state-wide energy efficiency programs. In 2008, the New York Public Service Commission (PSC) established a statewide goal of a 15 percent reduction in electricity usage by 2015 and increased the SBC collection accordingly (New York State Department of Public Service, 2008). The PSC emphasized the importance of rigorous program evaluation and called for “transparent and technically sound methods for measurement and verification of net energy savings, benefits and costs, as well as assessment of customer satisfaction and program efficacy” (New York State Department of Public Service).
The state’s energy efficiency programs have historically been administered by the state’s utilities and NYSERDA. The current Reforming the Energy Vision and Clean Energy Fund proceedings propose a reduction in collections from ratepayers, a gradual wind down of many of NYSERDA’s currently authorized programs, and a shift in NYSERDA’s focus to market transformation activities (NYSERDA, 2015). The PSC makes clear that, even with lower budgets, NYSERDA and New York’s utilities must still meet the 15 percent electricity reduction goal using “market-based approaches to drive greater value for customers” (New York Public Service Commission, 2015, p. 75).37
Financing Program Reviewed: NY Green Bank
The NY Green Bank is a public-private partnership designed to use public dollars to attract private sector capital into the clean energy sector. When fully capitalized, the NY Green Bank will manage nearly $1 billion of public funds to attract private funding to energy efficiency. The Green Bank’s ultimate goal is to transform the energy efficiency marketplace so that, in the long run, the price of clean energy goods and services declines and becomes more attractive to consumers, leading to greater energy savings. 37 See p.81 of New York State Public Service Commission, 2015; “Parties question whether NYSERDA’s targets will be added to utility targets and whether utilities will be adopting NYSERDA programs. Utility targets will not be increased for 2016; rather, we expect that the utility targets established here in addition to NYSERDA metrics established in the CEF proceeding will equal or exceed the current aggregate of utility and NYSERDA energy savings.”

December 2015 www.seeaction.energy.gov 26
In 2013, the NY PSC approved NYSERDA’s request for an initial $165 million of utility customer funding to capitalize the Green Bank.38 Utility customer funds were augmented with $53 million of proceeds from the sale of Regional Greenhouse Gas Initiative (RGGI) credits.39 An additional approval to increase the capitalization of the NY Green Bank by an additional $150 million from uncommitted and reallocated NYSERDA ratepayer funds was approved in July 2015. NYSERDA submitted a request to the PSC in June 2015 as part of the Clean Energy Fund proceeding to request future ratepayer funding of $631.5 million to reach the $1 billion capitalization goal (NYSERDA, 2014c). NYSERDA proposed that the additional funding, scheduled at varying amounts over 10 years, would be supplemented by an external borrowing facility, supported by a pledge of the requested ratepayer funds. This would allow NY Green Bank to meet projected market demand but also would allow ratepayer collections to be reduced over time, as envisioned by the Clean Energy Fund proceeding.
As the Green Bank evolves, its relationship to existing energy efficiency programs will come into sharper focus. Today, it is most accurately characterized as both a complement to and a substitute for existing energy efficiency programs. In its petition to establish the Green Bank, NYSERDA characterized the Green Bank as “a cost-effective, powerful and complementary addition to New York’s existing portfolio of clean energy support programs” (NYSERDA, 2013b, p. 3). In its order establishing the Green Bank, the PSC stated that, “the effect of the Green Bank on reducing the cost of capital can also enable the potential reduction or even the possible elimination of incentives in some sectors over time” (NYSERDA, 2013b, p. 3).
Connecticut
Selected Energy Efficiency Policies
In 2007, Connecticut adopted legislation directing that “resource needs shall first be met through all available energy efficiency and demand reduction resources that are cost effective, reliable and feasible” (Connecticut General Statutes §16a-3a(c)). The state’s regulated electric utilities file a plan with the Department of Energy and Environmental Protection (DEEP) and the Public Utilities Regulatory Authority (PURA), developed with the advice and assistance of the Energy Efficiency Board (EEB) and its consultants, to establish comprehensive conservation and load management plans that specify what energy efficiency programs will be used to acquire these savings. Energy efficiency activities are administered by utilities and funded by an SBC, in place since 1998.40
Regulators in Connecticut require annual program evaluations to ensure that utility customer-funded programs are “administered appropriately and efficiently … programs and measures are cost effective … and evaluation results are appropriately and accurately taken into account in program development and implementation” (Connecticut General Statues §16-245(m)). An independent Evaluation Committee oversees program evaluation activity, from planning and contractor selection to presentation of results, to ensure objectivity and transparency (Connecticut Energy Efficiency Board, 2012).
Financing Program Reviewed: Connecticut Green Bank
38 The funding was comprised of uncommitted ratepayer funds: NYSERDA $3.5M in uncommitted NYSERDA EEPS I funds; $22.1M in uncommitted NYSERDA SBC III funds; $90.0M in uncommitted utility EEPS I funds; and $50.0M in NYSERDA RPS funds. NYSERDA also allocated $52.9M in RGGI proceeds to the Green Bank (NYSERDA, 2013b). 39 RGGI is a cooperative effort among the states of Connecticut, Delaware, Maine, Maryland, Massachusetts, New Hampshire, New York, Rhode Island, and Vermont to cap and reduce carbon emissions from the power sector. States sell nearly all emission allowances through auctions and invest proceeds in energy efficiency, renewable energy, and other consumer benefit programs. See http://www.rggi.org. 40 SBC was established by 1998 “An act concerning electric restructuring” PUBLIC ACT NO. 98-28

December 2015 www.seeaction.energy.gov 27
The Legislature established the Connecticut Green Bank in 2011 as a successor to the Renewable Energy Investment Fund (renamed the Clean Energy Fund).41 The Renewable Energy Fund was initially established using proceeds from a line-item charge on customer bills to “promote investment in renewable energy sources … [to] stimulate demand for renewable energy … and for the further purpose of supporting operational demonstration projects” (Connecticut General Statutes §16-245n, 2009). As modified, the Connecticut Green Bank has the additional mandate to “provid[e] low-cost financing and credit enhancement mechanisms for clean energy projects and technologies,” (Connecticut General Statutes §16-245n) including not just renewable energy resources but all types of clean energy including energy efficiency.
Connecticut’s Comprehensive Energy Plan lays out a clear vision for the long-term goals of the Green Bank’s financing activity as a substitute for traditional energy efficiency acquisition activities:
While consistent ratepayer support at levels sufficient to leverage (or sell) the customer investment is essential, the larger investment that will be required to take efficiency to scale will require new sources of capital to help fund those upfront costs. In order to access new sources of capital, this Strategy proposes that the State take steps to shift from a reliance on ratepayer funding to a much greater focus on using existing funding to leverage private capital…. [T]he foundation for this Strategy‘s goal of transitioning programs away from government-funded grants, rebates, and other subsidies, and towards deploying private capital to finance energy efficiency is underway (Connecticut Department of Energy and Environmental Protection, 2013, p. 7).
Currently, Green Bank-funded projects are eligible for utility customer-supported rebates, and customers assert that many projects still depend on rebates to move forward. For example, a recent joint analysis by the Connecticut Green Bank and the Connecticut Energy Efficiency Board showed that 92 percent of Green Bank commercial property assessed clean energy (PACE) projects receive rebates, and that 46 percent could not move forward as originally scoped without building in utility customer incentives (Connecticut Energy Efficiency Board, 2015).
Massachusetts
Selected Energy Efficiency Policies
Massachusetts has required utilities to offer energy efficiency programs to their customers, funded by an SBC enacted in 1999. The 2008 Green Communities Act built on this foundation and required utilities to “provide for the acquisition of all available energy efficiency and demand reduction resources that are cost effective or less expensive than supply options” (Massachusetts General Laws §21(b)(1)). The Act similarly stated that “electric and natural gas resource needs shall first be met through all available energy efficiency and demand reduction resources that are cost effective or less expensive than supply” (Massachusetts General Laws §21(b)(1)).
Both the legislation and associated regulations direct energy efficiency program administrators to assess the cost-effectiveness of offered programs. Evaluations are administered collaboratively by program administrators and the Energy Efficiency Advisory Council.
41 The Connecticut Green Bank was originally called the Connecticut Clean Energy Finance and Investment Authority.

December 2015 www.seeaction.energy.gov 28
Financing Program Reviewed: HEAT Loan
Since 2005, the HEAT Loan program has offered residential customers no-interest loans to finance home energy upgrades. Customers receive loans from one of HEAT’s partner lending institutions and utilities use utility customer funds to reimburse the lenders for the interest rate that they otherwise would have charged.
As explained in the utilities’ program plan, the HEAT Loan and other financing programs are intended to complement the existing set of energy efficiency programs “to the extent that access to low-cost capital is a barrier for certain customers, financing can alleviate that and encourage energy efficiency investments” (MassSave, 2012, p. 92).
Maryland
Selected Energy Efficiency Policies
In 2008, Maryland’s EmPower Act set a statewide goal of reducing per capita electricity use 15 percent by 2015, compared to a 2007 baseline. Utilities are directed to “procure or provide for [their] electricity customers cost-effective energy efficiency and conservation programs and services with projected and verifiable electricity savings that are designed to meet [the 2015 savings goal]” (Maryland General Code §7–211(g)(1)). Efficiency programs are funded by the EmPower surcharge. In 2015, the Maryland Public Service Commission issued an order requiring utilities to ramp up to 2 percent of annual incremental gross savings per year.
The EmPower Act requires the PSC to evaluate the cost effectiveness and the impact of utility customer-funded energy efficiency programs. Utilities are responsible for annual evaluation reviews, which are verified by the PSC’s independent evaluation contractor.
Financing Program Reviewed: MHELP Residential Energy Efficiency Financing
The Maryland Home Energy Loan Program (MHELP) began as a joint effort of the Maryland Clean Energy Center and the Maryland Energy Administration (MEA). Initially funded by ARRA dollars, the MHELP program generated $2.5 million in loans by buying down interest rates on loans made by private sector partners (EmPOWER Finance Workgroup, 2013). As ARRA funding ended, MEA and the Maryland PSC began to explore options for offering residential sector financing as part of the energy efficiency program portfolio funded by utility customers, noting that “the lack of convenient, accessible financing at favorable rates is a missing link in all of the Companies’ EmPOWER programs” (Maryland Public Service Commission, 2011, p. 13). A PSC-appointed working group explored options for incorporating the MHELP program or other residential financing offerings into the utility customer-funded portfolio. To date, the PSC has not approved such incorporation. However, in April 2015, a Maryland Public Utility Law Judge Division report makes recommendations and observations of how a statewide residential financing program could be offered (Romine, McGowan, Sober, & McLean, 2015).
As proposed by the EmPOWER Work Group, energy efficiency financing for the residential sector is framed as a complement to existing energy efficiency activities, at least in the near term: “Financing is not a stand-alone program. Financing facilitates the goals of associated energy efficiency program and must be ‘in synch’ with the characteristics of its associated program(s)—which themselves can have significant variations” (EmPOWER Maryland Work Group, 2013, p. 15). However, the working group does not preclude the possibility that, over time, financing may reduce the need for rebates, stating, “The mix of rebates and financing should be expected to shift over time in favor of financing” (Maryland Energy Administration, 2014, p. 33).
Observations on Regulatory Context of Programs Reviewed
State policy makers typically establish explicit links that involve regulatory oversight and accountability for the use of utility customer funding. Comparing the New York and Connecticut Green Banks is illustrative in this respect.

December 2015 www.seeaction.energy.gov 29
Both green banks use utility customer funds. The NY Green Bank is housed within NYSERDA, which has administered a portfolio of efficiency programs since 1998 and is overseen by the New York PSC.42 By contrast, the Connecticut Green Bank is not overseen by the state regulatory commission and operates as a separate quasi-public agency within the state government, an expanded successor to an agency that primarily focused on the promotion of emerging renewable energy technologies. This difference in program administrator oversight may explain some of the differences in the extent of regulatory involvement as the two green banks took shape.
In New York, interviewees indicated that, because the Green Bank was created through a regulatory proceeding under the oversight of the PSC, the Green Bank’s mission, goals, and performance metrics were created in a transparent and open process (Pitkin, Hale, & Griffin, 2014).43 NYSERDA held an open workshop on the development of its performance metrics and evaluation plan and stakeholders were given the opportunity to comment on the plan through regulatory filings.44 NYSERDA also allocated up to $4 million in its plan for evaluation activities to assess how the Green Bank is performing against these metrics (NYSERDA, 2014b).
Program administrators in the five states included in this report are required to verify the impacts of traditional energy efficiency programs using EM&V processes that involve oversight by a regulatory agency. However, the extent to which traditional EM&V processes are applied to energy efficiency financing programs varies among these states. California’s energy efficiency financing pilots will be subject to robust EM&V processes that are currently under development. Connecticut’s Green Bank efficiency programs are not currently subject to regulated EM&V requirements, although the Green Bank recently hired a team to scope out a voluntary evaluation plan for the institution and certain specific programs.
Chapter 3: Characterizing the Role of Financing in Energy Efficiency Potential Studies
Since the 1980s, policy makers and regulators in many states have periodically required program administrators to conduct potential studies to gauge both the technical potential for efficiency as well as the estimated economic and achievable potential. In this chapter, we review the types of potential studies, discuss the applicability and inclusion of financing strategies in achievable potential studies, and discuss studies that estimate the theoretical potential for financing of efficiency and their use by policy makers and program administrators.
The Three Potentials: Technical, Economic, and Achievable
A potential study is a quantitative analysis of the amount of energy savings that exists technically, or is cost-effective (i.e., economic), or could be realized through the implementation of efficiency policies and programs (i.e., achievable). Historically, potential studies have provided input for the design of policies and programs aimed at
42 The role of NYSERDA going forward may be somewhat in flux as a result of ongoing state proceedings. 43 The NYPSC order directed NYSERDA to collaborate with stakeholders to develop metrics for the evaluation of the Green Bank’s performance. 44 For example, the Natural Resources Defense Council (NRDC) and the Pace Energy and Climate Center submitted joint comments asserting that in order to demonstrate the influence of green bank programs, it would be essential to develop performance metrics identifying net benefits specifically attributable to the program’s influence.

December 2015 www.seeaction.energy.gov 30
increasing the penetration of efficiency (National Action Plan for Energy Efficiency (NAPEE), 2007).45 See Figure 2 for a characterization of the types of potential studies and their relationship to each other:
• Technical potential is the theoretical maximum amount of energy use that could be displaced by energy efficiency and is often a snapshot in time that assumes that all technologically feasible energy savings measures could be implemented.
• Economic potential represents the amount of savings from energy efficiency that is cost effective as compared to utility supply-side resources, again assuming immediate implementation.
• Achievable potential is the amount of savings from energy efficiency that can be achieved assuming aggressive and effective program strategies and accounting for market barriers, program administration costs and the capability of program administrators to ramp up efforts over time (National Action Plan for Energy Efficiency (NAPEE), 2007).
45 Three broad applications for which a potential study can provide useful insights include: (1) building a case for energy efficiency investment, (2) identifying alternatives to supply-side investments, and (3) detailed design and planning for efficiency programs.
KEY TAKEAWAYS
• A few early efforts incorporate financing into energy efficiency potential studies or have been completed. These studies vary in their methodological approach.
• Some studies have attempted to estimate the theoretical maximum opportunity and focus on the investment needed if the vast majority of technically feasible upgrades were implemented, assuming vastly expanded customer adoption rates for efficiency projects.
• One such potential study in New York was cited by the program administrator as supporting justification for investing large amounts of ratepayer dollars in efficiency financing programs.
• Some stakeholders have raised concerns over using these types of studies, indicating that they overstate the amount of financing required under current and future market conditions and likely levels of demand.
• A recent potential study in California found that “incremental savings potential due to financing is modest.” Offering financing increased achievable potential savings by about 45 percent.
• Including energy efficiency financing in potential studies could offer important insights regarding:
• How financing might increase the total amount of achievable energy efficiency potential (i.e., how financing can help “grow the pie”)
• The amount of program-supported financing that might be appropriate to meet customer demand, which could help administrators size their financing program budgets and expected activity level in the near and long-term (for goal setting)
• Additional research is needed to refine methods for estimating the incremental impacts of financing on achievable market potential for efficiency.
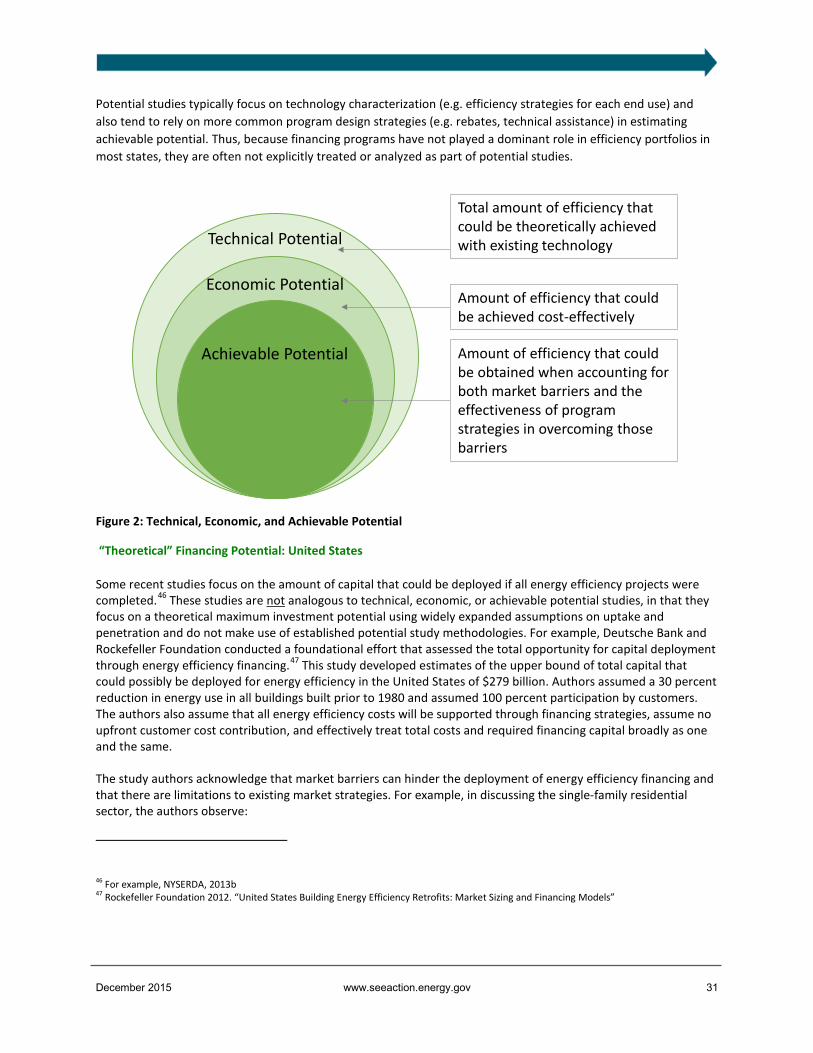
December 2015 www.seeaction.energy.gov 31
Potential studies typically focus on technology characterization (e.g. efficiency strategies for each end use) and also tend to rely on more common program design strategies (e.g. rebates, technical assistance) in estimating achievable potential. Thus, because financing programs have not played a dominant role in efficiency portfolios in most states, they are often not explicitly treated or analyzed as part of potential studies.
Figure 2: Technical, Economic, and Achievable Potential
“Theoretical” Financing Potential: United States
Some recent studies focus on the amount of capital that could be deployed if all energy efficiency projects were completed.46 These studies are not analogous to technical, economic, or achievable potential studies, in that they focus on a theoretical maximum investment potential using widely expanded assumptions on uptake and penetration and do not make use of established potential study methodologies. For example, Deutsche Bank and Rockefeller Foundation conducted a foundational effort that assessed the total opportunity for capital deployment through energy efficiency financing.47 This study developed estimates of the upper bound of total capital that could possibly be deployed for energy efficiency in the United States of $279 billion. Authors assumed a 30 percent reduction in energy use in all buildings built prior to 1980 and assumed 100 percent participation by customers. The authors also assume that all energy efficiency costs will be supported through financing strategies, assume no upfront customer cost contribution, and effectively treat total costs and required financing capital broadly as one and the same.
The study authors acknowledge that market barriers can hinder the deployment of energy efficiency financing and that there are limitations to existing market strategies. For example, in discussing the single-family residential sector, the authors observe:
46 For example, NYSERDA, 2013b 47 Rockefeller Foundation 2012. “United States Building Energy Efficiency Retrofits: Market Sizing and Financing Models”
y
Total amount of efficiency that could be theoretically achieved with existing technology
Amount of efficiency that could be achieved cost-effectively
Amount of efficiency that could be obtained when accounting for both market barriers and the effectiveness of program strategies in overcoming those barriers
Technical Potential
Economic Potential
Achievable Potential

December 2015 www.seeaction.energy.gov 32
[T]here are at least two main challenges associated with market development in this segment. The first is the extreme fragmentation that exists within the single family market, which results in fragmented demand that is difficult to aggregate. The second is the relatively low level of effective demand, which is only likely to be addressed through strong regulatory requirements, retail consumer engagement strategies and/or other significant non-financial interventions. (Rockefeller Foundation, 2012, p. 15)
While market barriers are discussed qualitatively, the estimate of total market capital is not revised downwards to reflect these market barriers. These theoretical financing potential studies may be useful in estimating an upper bound for the demand for capital for energy efficiency improvements but do not provide insights on the level of participation and likely demand for capital that may be achieved by employing financing as a strategy for energy efficiency.
Addressable Financing Potential: New York
In September 2013, NYSERDA petitioned the New York PSC for an initial capitalization of approximately $165 million to launch a Green Bank, followed by a petition in October 2014 for full capitalization at a level of $1 billion (NYSERDA, 2013b) (NYSERDA, 2014c). In its request, NYSERDA cited a 2013 “New York State Green Bank Business Plan Development” analysis by Booz & Co.:
Booz has developed a directional estimate of the potential addressable investment of $85 billion over the next ten years. Due to initial private sector leverage and the recycling of the Green Bank’s capital, the Booz report projects that an initial $1 billion NYGB capitalization will lead to as much as $8 billion of additional private sector investment in clean energy projects over the next ten years … which would represent approximately 10% of the $85 billion potential addressable market. (NYSERDA, 2013b, p. 7)48
Booz & Co.’s study estimates that energy efficiency represents $55 billion of the total $85 billion of addressable clean energy potential (Booz & Co., 2013). To arrive at this figure, the report’s authors first approximated the total technical potential for energy efficiency—$78.1 billion—using an assumed 100 percent participation rate for all building stock (pre-2008 or 2009, depending on the sector) and multiplied by the estimated retrofit cost per unit or square foot (see Figure 3). This figure is adjusted downwards by removing the portion of the market deemed “unaddressable” based on creditworthiness considerations and the potential market already being addressed through private market funding to arrive at $55 billion (Booz & Co., 2013, p. 47).
48 The $85 billion value includes both energy efficiency ($55 billion), solar Photovoltaic (PV) ($13 billion), cogeneration ($8 billion), and other renewable technologies ($9 billion).

December 2015 www.seeaction.energy.gov 33
Figure 3: Booz Addressable Potential Methodology (Booz & Co., 2013)
NYSERDA’s use of the Booz & Co. report has drawn comments from stakeholders. For example, the New York Energy Efficiency Corporation (NYCEEC), which provides financing for energy efficiency improvements in New York City, noted that:
NYCEEC and the City are concerned that the proposed capitalization level of $1 billion is supported primarily by a theoretical estimate of the ‘upper bound of investment potential,’ and not by an estimate of the market-achievable potential for investment. In NYCEEC’s experience, there currently is not $5.5 billion of annual market demand (i.e., $55 billion over 10 years) for energy efficiency projects in New York State. This is based on the level of demand that NYCEEC has experienced directly (not theoretically) for its various financing offerings. (City of New York, 2012, p. 13)
NYSERDA’s reply comments acknowledge that the Booz estimate “did not attempt to identify a current market-achievable potential for energy efficiency or renewable energy, but rather to identify a conservative long term market addressable potential, in order to provide context for the current Green Bank capitalization plan” (NYSERDA, 2013a, p. 3).
Over time, questions regarding the true achievable potential of energy efficiency financing in New York may be resolved through observation of program results and retrospective impact evaluations. Concerns raised by some stakeholders in New York suggest that developing an achievable potential estimate for deployment of financing capital may be useful and would allow decision-makers to consider the amount of utility customer dollars to put into financing programs in the context of potential energy savings and costs for other energy efficiency opportunities.49
49 New York did produce an achievable potential analysis in the same year as the Booz report, though that analysis focused principally on achievable potential energy savings using rebates and incentives as a primary strategy. The achievable potential analysis treated “access to

December 2015 www.seeaction.energy.gov 34
Achievable Potential: California
California’s analysis of energy efficiency financing was conducted as a part of the state’s overall 2013 California Energy Efficiency Potential and Goals Study (Navigant, 2014). The study focused on estimating the additional achievable energy savings that could be realized by introducing financing programs in California.
The study’s authors assert that it was “the first potential study known to include financing as a driver of energy efficiency savings” (Navigant, 2014, p. 146) and acknowledged that, “currently, there are no established best practices to incorporate financing into EE potential models” (Navigant, 2014, p. 81). Given this situation, the Navigant authors devised their own methodology to assess the achievable potential of energy efficiency financing.
Navigant Consulting used consumers’ implied discount rate (iDR) as an input to a larger model that determines achievable energy savings:
Peer-reviewed research demonstrates that the discount rate that consumers apply to EE purchases is higher than market interest rates. The higher [implied discount rate] applied to energy efficiency purchases indicates that the consumer accounts for a range of perceived risks other than financial risks; such risks may include lack of access to capital, liquidity constraints, split incentives, hassle factor, information search costs, and behavioral failures. The difference between a consumer’s implied discount rate and the market interest rate is often referred to as the ‘efficiency gap.’ (Navigant, 2014, p. 82)
The authors began with a typical consumer economic discount rate and built up an implied discount rate that incorporates the full range of these perceived risks or market barriers (see Figure 4). The authors reasoned that, to the extent that access to financing reduces these barriers, the implied discount rate should come down, leading to more energy efficiency upgrade activity. The authors then re-ran their achievable potential savings model using the lower implied discount rate to determine a new overall level of achievable savings.
As Figure 5 shows, “The difference in output in the two model runs (without financing and with financing) determines the incremental impact of EE financing” (Navigant, 2014, p. 86).50 Ultimately, the study indicated that the “incremental savings potential due to financing is modest” (Navigant, 2014, p. 142). The study found that financing could increase potential savings by 2.5 percent in the residential sector and 1.5 percent in the commercial sector. Explanations for the modest incremental savings potential include limited eligibility for proposed financing programs in the commercial and multifamily sectors and the relatively low importance of access to financing as a barrier to overall energy efficiency adoption (i.e., financing barriers are a small component of consumers’ implied discount rate) (Navigant, 2014, pp. 87-89).51,52
financing” as only one subset among several market barriers related to cost; financing was listed as one among several categories of market barriers that could impact achievable potential. This study listed access to financing as a barrier, although it did not attempt to quantify the specific impact of that financing barrier on total achievable savings potential nor did it examine the potential additional savings that could be achieved by addressing this barrier with effective programmatic financing solutions. See http://www.nyserda.ny.gov/Cleantech-and-Innovation/EA-Reports-and-Studies/EERE-Potential-Studies 50 The authors point out that the methodology described above provides the flexibility to “estimate market adoption with (a) rebates only, (b) rebates and financing, and (c) financing only.” 51 Navigant utilized past survey results, observations from financing programs in California and other states, expert interviews, literature research, and a process evaluation of California’s small business On-Bill Financing Program in estimating the impact of access to financing on reducing the implied discount rate. Uncertainty in estimates of changes in the implied discount rate can be addressed by providing a range of possible outcomes and then re-estimating impact on the achievable potential savings from access to financing.
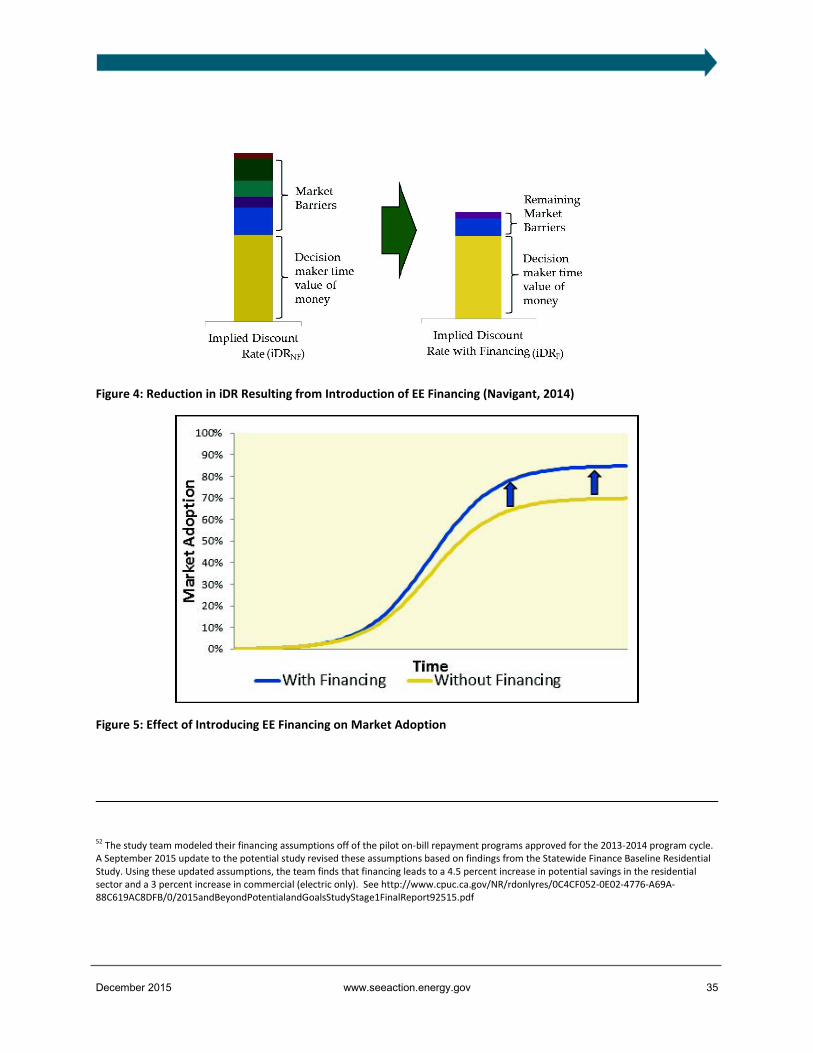
December 2015 www.seeaction.energy.gov 35
Figure 4: Reduction in iDR Resulting from Introduction of EE Financing (Navigant, 2014)
Figure 5: Effect of Introducing EE Financing on Market Adoption
52 The study team modeled their financing assumptions off of the pilot on-bill repayment programs approved for the 2013-2014 program cycle. A September 2015 update to the potential study revised these assumptions based on findings from the Statewide Finance Baseline Residential Study. Using these updated assumptions, the team finds that financing leads to a 4.5 percent increase in potential savings in the residential sector and a 3 percent increase in commercial (electric only). See http://www.cpuc.ca.gov/NR/rdonlyres/0C4CF052-0E02-4776-A69A-88C619AC8DFB/0/2015andBeyondPotentialandGoalsStudyStage1FinalReport92515.pdf

December 2015 www.seeaction.energy.gov 36
Benefits of Achievable Potential Studies for Financing
There are several rationales for conducting an achievable potential assessment of energy efficiency financing:
• Focusing on additional savings as the end result. Other financing potential studies have tended to examine only how much capital can potentially be deployed in the energy efficiency market. An achievable potential assessment may focus on the level of additional savings potential that may occur if financing programs are offered by the administrator. This is an important question, particularly given the potential for utility customer-supported financing simply to replace private sector financing options, rather than expanding the total amount of energy efficiency activity by encouraging participation that would not otherwise have occurred.53
• Treating financing as only one among a range of barriers. Financing potential studies that focus only on market sizing may correlate market size estimates with the amount of program capital needed as an allocation toward financing programs. However, this perspective may overlook other key barriers that may limit the amount of capital that is actually likely to be deployed. Without incorporating the full range of barriers into an achievable estimate of financing potential, market-sizing analyses may lead to an overestimate of the amount of program capital actually needed.
• Providing a benchmark for program planning and evaluation. An achievable potential analysis may provide a reasonable starting estimate of achievable potential for purposes of program planning and budgets.
• Setting a savings target for financing activities. Achievable potential studies can help decision makers to understand the incremental savings that financing could produce and to set savings goals for financing programs using this benchmark.
Chapter 4: Cost-Effectiveness of Energy Efficiency Financing Programs
In this chapter, we discuss planning and performance metrics—benefit/cost screening tests and net program benefits—and their applicability to financing programs using illustrative examples. We also identify unique features of financing programs that pose challenges for administrators when conducting cost-effectiveness screening analyses. As part of a utility’s resource planning or demand side management planning process, program administrators are typically required to screen proposed programs for cost-effectiveness using one or more benefit-cost tests. If efficiency financing programs become a more prominent element of the overall portfolio or are treated as distinct program offerings, then these efforts are likely to be subject to a state’s policy guidelines and regulatory practices.
The primary tests used in assessing program cost effectiveness are described in Appendix A. In thinking about how these tests interact with energy efficiency financing programs, it may be helpful to distinguish between those tests that focus on costs and benefits from a utility or program administrator perspective (such as the PACT), and those that involve a broader comparison of costs and benefits (such as the total resource cost test (TRC) or the societal cost test (SCT)). The TRC test compares all of the direct costs that both utilities and customers pay with the regional benefits received from energy efficiency. The PACT assesses whether an efficiency program is cost-
53 The Navigant study also focused specifically on savings that were generated by financing in addition to those that would have already occurred with rebates alone (p. 146).

December 2015 www.seeaction.energy.gov 37
effective from the program administrator’s perspective. The PACT is particularly relevant because a key rationale offered by proponents of large-scale financing programs is that they can effectively leverage limited program funds, attract a large amount of private capital, and induce participants to bear most or all of the costs of efficiency measures.54 (The sidebar “Financing Programs and Cost-Effectiveness Test Screening” explores this issue and others.) Such leveraging of utility customer dollars would, in theory, reduce program administration costs, though benefits could also potentially be reduced, leaving some uncertainty regarding ultimate bill impacts.
Cost-Effectiveness Screening in a Finance Program as Substitute Scenario
In jurisdictions that are contemplating a shift away from traditional energy efficiency programs and toward financing as a core strategy, it may be important to consider both benefit-cost ratios as well as total net benefits achieved. One risk in assessing financing programs using benefit-cost ratios alone, particularly from a PACT perspective, is that it is possible that benefit-cost ratios could improve even as net benefits decrease and total energy savings actually decline. Table 3 provides a hypothetical example in which a finance program replaces a traditional rebate program in a market sector and aggregate gas and electric savings decrease significantly after 54 Administrative costs can be built into interest rates or program fees; interest costs themselves are added costs that do not exist in rebate-only programs.
KEY TAKEAWAYS
• Several states that are implementing large-scale financing programs have begun to examine the unique features of financing strategies that may need to be addressed when screening these programs for cost-effectiveness.
• From a program administrator’s perspective, the ratio of costs associated with financing programs may be modest compared to the benefits, leading to relatively high benefit/cost ratios.
o However, if program administrators shift towards financing and the total level of savings attributable to a financing program are modest or are less than what occurred in traditional efficiency programs, then the total amount of net benefits achieved may be lower even while the benefit/cost ratio improves.
• State policymakers, regulators, and program administrators that are considering a shift toward financing as a core energy efficiency strategy should consider reviewing both total net benefits and benefit/cost ratios.
FINANCING PROGRAMS AND COST-EFFECTIVENESS TEST SCREENING
The potential for financing programs to lower program costs and improve cost-effectiveness is most relevant to the PACT. Costs borne by participants are not included in the PACT and thus finance programs may have higher benefit-cost ratios than a rebate program if program participants pay for a greater share of the costs of energy efficiency measures and the program is able to achieve comparable savings. However, in comparing a finance vs. a traditional rebate program, the relative impact on TRC or societal benefit-cost ratio results would be much less dramatic because those tests include administrator costs and net participant costs (which are based on incremental costs of efficiency measures).

December 2015 www.seeaction.energy.gov 38
the program is implemented. From the program administrator’s perspective, the benefit-cost ratio increases from 2 to 4 although net benefits decrease from $3 to $1.8 million. The decrease in net benefits is driven by the result that savings have decreased by 60 percent either because customer participation rates decreased or because the finance program primarily attracted customers that indicated that they would have utilized private financing if the program were not available. If net benefits decrease, the utility would likely have to procure energy from more expensive supply-side resources.
Table 3: Finance vs. Traditional Rebate Program Example if Aggregate Savings Decrease: Cost-Effectiveness Results
Traditional Programs Scenario
Financing as Substitute Scenario
Total Net Savings (MMBtu) 1,000,000 400,000 Program Administrator Cost ($/MMBtu Saved) $3.00 $1.50 Total Cost – EE Programs ($) $3,000,000 $600,000 Benefits ($/MMBtu of Avoided Supply) $6 $6 Total Benefits – EE Programs $6,000,000 $2,400,000 PACT Benefit/Cost Ratio 2 4 Net Benefits (Total Benefits – Total Costs) $3,000,000 $1,800,000 Loss of Net Benefits $1,200,000
Given the large degree of uncertainty regarding total net savings potential under a shift toward financing as a core strategy, regulators may wish to monitor both benefit/cost ratio screening results as well as actual net benefits achieved.
Cost-Effectiveness Screening in a Financing Program as Complement Scenario
In jurisdictions where efficiency financing programs complement other energy efficiency strategies, it is also important for administrators and regulators to analyze cost effectiveness test results and actual net benefits achieved. Table 4 provides a hypothetical example where a program administrator offers a traditional rebate program and a financing program that leads to deeper savings in some efficiency projects as well as increased market penetration in certain market segments.
Table 4: Financing Programs as Complement to Traditional Rebate Program: Cost-Effectiveness Results Traditional
Programs Financing as Complement
Total Portfolio
Total Savings (MMBtu) 1,000,000 400,000 1,400,000 Program Administrator Cost ($/MMBtu Saved) $3.00 $1.50 $2.57* Total Cost – EE Programs $3,000,000 $600,000 $3,600,000 Benefits ($/MMBtu of Avoided Supply) $6 $6 $6 Total Benefits – EE Programs $6,000,000 $2,400,000 $8,400,000 PACT Benefit/Cost Ratio 2 4 2.6* Net Benefits (Total Benefits - Total Costs) $3,000,000 $1,800,000 $4,800,000
* Savings-weighted averages
In this example, the addition of the financing program increases the program administrator’s benefit/cost test results and increases total net benefits by $1.8 million compared to the traditional rebate program.

December 2015 www.seeaction.energy.gov 39
By contrast, it is also possible that augmenting traditional programs with a financing program may actually increase the cost of saved energy for the overall efficiency portfolio. Table 5 provides a hypothetical example in which participants in a financing program also receive the full amount of incentives offered in other programs or incur additional administrative costs or added incentives, such as interest rate buy-downs.55 Under such a scenario, adding a financing program would cause the PACT benefit-cost ratio to decline compared to the existing traditional programs (1.82 vs. 2), although net benefits would still increase. Despite the decline in the benefit-cost ratio relative to traditional programs, it should be noted that layering on financing still produces a better outcome by increasing total net benefits.
Table 5: Potential Impact of Adding Financing Costs onto an Existing Portfolio: Cost-Effectiveness Results
Traditional Programs
Financing as a Complement
Total Portfolio
Total Savings (MMBtu) 1,000,000 400,000 1,400,000 Program Administrator Cost/MMBtu Saved $3.00 $4.00 $3.29* Total Cost – EE Programs $3,000,000 $1,600,000 $4,600,000 Benefits/MMBtu of Avoided Supply $6 $6 $6 Total Benefits $6,000,000 $2,400,000 $8,400,000 PACT Benefit/Cost Ratio 2 1.5 1.82 Net Benefits (Total Benefits - Total Costs) $3,000,000 $800,000 $3,800,000
* Savings-weighted averages
Applying Cost-Effectiveness Principles to Energy Efficiency Financing Programs
Certain aspects of applying cost-effectiveness principles to financing programs are more straightforward than others. In some cases, basic principles that have long been applied to traditional programs may be readily applicable to financing programs, but there may be challenges in practice with determining appropriate values to use. In other cases, there may be foundational questions regarding the proper way to account for some of the unique costs and benefits of energy efficiency financing programs. We highlight these issues in this section.
Basic Principles
Baselines and Incremental Savings
In traditional efficiency programs, savings from installed efficiency measures are typically estimated relative to an appropriate baseline condition. For example, if a measure is replaced at the end of its useful life, traditional programs generally count only the efficiency gains above either minimum efficiency standards at the time of replacement or observed efficiency specifications of similar equipment on the market. Given that the equipment likely would have been replaced at some point even without the program, some efficiency gains would tend to result simply from the market-driven or required improvements in the efficiency of new models over time. Under traditional regulatory regimes, this portion of the efficiency improvement, while realized by the program participant, cannot be attributed to the program.
55 This type of situation has been observed in some programs.

December 2015 www.seeaction.energy.gov 40
Depending on regulatory oversight or policy guidelines, financing programs may not be required to estimate savings or account for program-attributable benefits using approaches that are common for traditional efficiency programs. One potential way to address this issue is to adopt the same methods and reference documents as traditional efficiency programs in order to account for the benefits of measures installed in a consistent fashion. In many jurisdictions, technical reference manuals provide either deemed savings values or deemed calculation methods that provide guidance on accounting for savings from installed measures.56
Net-to-Gross Issues
In screening programs for cost-effectiveness, program administrators typically estimate a net-to-gross (NTG) ratio that is used to adjust gross energy impacts to reflect those savings that are attributed to and are a direct result of the efficiency program. Net-to-gross adjustments often include and reflect estimates of free riders (i.e., customers that would have installed high-efficiency measures on their own but participated in the program), spillover effects (i.e., customers that adopt efficiency measures because they are influenced by information and marketing material provided by the administrator although they do not actually participate in a rebate program), market effects, and rebound/take-back effects.57 The monetized value of these net savings is generally reflected in the benefits included in cost-effectiveness screening tests. Neither free ridership or spillover issues have been well explored to date in energy efficiency financing programs; see Chapter 5 for additional discussion of this issue.
Unique Features of Financing Programs That May Impact Cost-Effectiveness Screening
Unique features of energy efficiency financing programs may present challenges when conducting cost-effectiveness screening tests. Several states (e.g., California, New York and Maryland) are discussing cost-effectiveness screening issues. Stakeholders in California have begun to explore ways of applying cost-effectiveness principles to financing pilot programs (Dunksy, 2014).58 However, additional work is needed to assess the most appropriate ways to tackle these issues. We highlight several of the more salient questions that have emerged from these discussions. Appendix B and the sidebar titled “The Objective Function” also explore one state’s approach to accounting for program costs and benefits.
56 Technical Reference Manuals (TRMs) are used in planning, reporting and evaluating efficiency programs. TRMs include metrics and characteristics (e.g., energy savings and efficiency measure lives), engineering algorithms to calculate savings, and factors to apply to calculated savings (e.g., net-to-gross ratios). For more information, see SEE Action’s 2011 “National Energy Efficiency Evaluation, Measurement and Verification (EM&V) Standard: Scoping Study of Issues and Implementation Requirements” available online at https://www4.eere.energy.gov/seeaction/system/files/documents/emvstandard_scopingstudy.pdf. 57 See the National Action Plan for Energy Efficiency’s “Understanding Cost-Effectiveness of Energy Efficiency Programs” (2008) for more information, especially pages 4-10, available online at http://www.epa.gov/cleanenergy/documents/suca/cost-effectiveness.pdf. 58 The California Legislative Analyst Office (LAO) identified cost-effectiveness as a key priority for California’s financing pilots. The LAO recommended that the CPUC and program administrators be required to report on the financing pilots’ cost-effectiveness. Specifically, the LAO noted, “This evaluation should include information that allows the Legislature to compare the cost and effectiveness of each approach, including information on … the costs of these projects compared to their benefits” (California Legislative Analyst's Office, 2014, p. 47) .

December 2015 www.seeaction.energy.gov 41
Measure Costs
For certain applications in traditional energy efficiency programs (e.g., equipment replacement upon burn-out at end of measure life), incremental measure costs and savings that are incremental to current codes/standards (or practice) are used in the TRC or SCT Tests. However, in the case of financing programs, loans generally cover the full cost of energy efficiency measures and may even cover non-energy measures (e.g., asbestos removal or rewiring). If program administrators incur costs from those loans (e.g., write-offs or payouts from a loan loss reserve), they may similarly tie back to the full cost of the measures installed (Dunksy, 2014). These represent real costs to the program and may need to be accounted for in the Program Administrator Test. However, from a TRC or SCT standpoint, one could argue that only those costs that tie back to the energy-related portion of the loan (e.g., in proportion to a percentage of the loan covering incremental energy efficiency costs) should be included as a cost in the screening analysis.
Write-Offs and Loss Reserve Payouts
Predicting loan performance over time is a basic challenge of accounting for financing costs when performing prospective cost-effectiveness analyses. This is particularly true in the case of financing pilot programs, which are often designed to demonstrate that loan performance may exceed expectations, reducing the gap between perceived and actual risk. Given this potential gap, regulators and program administrators may need to come up with a reasonable assumption for expected loan performance, which may impact the projected cost of write-offs and payouts from loan loss reserves when calculating PACT values. It is also possible that loss reserve payouts could be treated as transfer payments in the TRC or SCT perspectives. This is a topic worthy of further investigation.
Connecticut is exploring a new cost effectiveness-like tool, called the Objective Function, originally developed by the Coalition for Green Capital. The Objective Function measures energy saved per dollar of public funds invested (and is similar to the reciprocal of the cost of saved energy metric). Conceptually, a larger value indicates more efficient use of public dollars. The formula for the Connecticut version of the Objective Function 1.0 is:
(𝐸𝐸𝐸𝐸𝐸𝐸 𝐺𝐸𝐸𝐸𝐸𝐺𝐺𝐸𝐺 𝑜𝐸 𝑆𝐺𝑆𝐸𝐺−𝑘𝑘ℎ 𝑜𝐸 𝐵𝐺𝐵)∗(1±% 𝑅𝐸𝐺𝑅𝑅𝑅𝐸𝐺 𝑆𝐺𝑆𝑅𝐸𝐸𝑆)𝐶𝐺𝐵 𝑅𝐸𝑒𝐺𝐺𝐸𝑆+𝑃𝐸𝑜𝐸𝐸𝐺𝑃 𝐺𝐸𝐺 𝐴𝐺𝑃𝑅𝐸𝑅𝑆𝐺𝐸𝐺𝐺𝑅𝑆𝐸 𝐶𝑜𝑆𝐺𝑆+𝐶𝐸𝐸𝐺𝑅𝐺 𝐸𝐸ℎ𝐺𝐸𝑎𝐸𝑃𝐸𝐸𝐺𝑆+𝐴𝑃𝑜𝐵𝐸𝐺 𝑜𝑜 𝐹𝑅𝐸𝐺𝐸𝑎𝑅𝐸𝐸−𝑅𝐸𝐶 𝑅𝐸𝑆𝐸𝐸𝐵𝐸
The numerator of the Objective Function counts the amount of clean energy generated by renewable resources and/or the amount of energy saved by energy efficiency projects, adjusted by a realization term that accounts for the difference between predicted and actual generation/energy savings. The denominator includes various costs such as Green Bank rebates (not utility rebates); Green Bank program and administrative costs; Green Bank credit enhancements including interest rate buy-downs, loan loss reserves and guarantees; principal funded by the Green Bank; and an adjustment for revenue from renewable energy credits (RECs) that the Green Bank retains and may sell. Other revenue from financing activities is not currently included.
Currently, the Connecticut Green Bank uses the Objective Function to provide information regarding the energy-related benefits of its programs and plans to eventually revise and enhance this metric. Because the Objective Function is a work in progress and does not account for all benefits and costs of energy efficiency programs (and other clean energy projects), it is important for policy makers to consider or develop other metrics in addition to assess the impacts of efficiency financing programs.
THE OBJECTIVE FUNCTION

December 2015 www.seeaction.energy.gov 42
Opportunity Costs
Opportunity costs, or the value of forgone alternatives, of capital dedicated to financing programs may need to be properly accounted for in cost-effectiveness tests. For example, programs that lend out utility customer capital at below-market rates arguably may be foregoing higher potential returns. Determining an appropriate rate of return that these funds could have generated may be a matter of discussion among stakeholders. Arguments can be made for assuming a market rate of return on similar lending activity (e.g., a utility rate of return on revenue collected from utility customers, or a societal rate of return on funds invested to achieve public policy goals). Alternatively, one could argue that there is no opportunity cost, just as there is no opportunity cost assumed for the investment of ratepayer funds in other types of energy efficiency programs. Similar questions arise when funds are invested in loan loss reserve accounts to cover potential write-offs. Funds in these types of accounts may also earn a small return. Questions may arise as to whether this gap should be treated as an opportunity cost. Accounting treatment of reserves set aside by financial institutions to cover potential lending risks may provide guidance on these questions for energy efficiency financing programs.
Chapter 5: Evaluating the Impact of Financing Programs
Evaluation, measurement, and verification (EM&V), and particularly impact evaluation, is the primary tool that program administrators and policy makers have used for the past several decades to assess savings created by energy efficiency programs. EM&V serves a number of important functions, including: (1) providing feedback to administrators, including recommendations for improving programs; (2) quantifying observed versus predicted or claimed savings; and (3) assessing the cost-effectiveness of a program ex post. In some jurisdictions, evaluation results also have a role in determining performance incentives for program administrators.59
While there are currently no standard protocols for evaluating financing programs, a few evaluations have been completed and commitments to evaluation of financing are in place in some jurisdictions. Evaluation may play an important role in helping program administrators quantify the level of incremental benefits (e.g., energy savings) that financing strategies produce. Traditionally, financing strategies have not been separately evaluated from other programmatic activities, primarily because financing has often been considered as a component of a broader program offering that targets a specific customer market segment.60
This trend is beginning to change for at least two reasons. First, in jurisdictions such as Massachusetts, financing activities—though still treated as complementary to other programs—have achieved a volume that has generated interest in better understanding both the costs and savings attributable to financing. Second, in jurisdictions considering large-scale shifts toward financing as a substitute for traditional programs, some stakeholders have called for evaluation activities in order to understand the likely (prospective) or actual (retrospective) effectiveness of such a shift.
59 For a more complete discussion of EM&V for energy efficiency programs, see State and Local Energy Efficiency Action Network (2012). Energy Efficiency Program Impact Evaluation Guide. Prepared by Steven R. Schiller, Schiller Consulting, Inc., www.seeaction.energy.gov. 60 During the 1980s and 1990s, several utilities conducted impact evaluations of weatherization programs that offered attractive financing to residential customers (e.g. zero-interest loan programs). See for example Hirst, E. “Evaluation of the BPA Residential Weatherization Pilot Program” (1983) http://www.osti.gov/scitech/biblio/6241133.

December 2015 www.seeaction.energy.gov 43
Assessments of Financing as a Complementary Program Strategy
Financing programs have typically not been separately evaluated in jurisdictions where it is a complementary strategy. However, in a few cases, regulators or program administrators have determined that a financing-specific evaluation is warranted, either because loan volume has reached high levels or for other policy reasons. Examples include:61
• In Massachusetts, the zero-percent interest residential HEAT Loan program has grown to roughly $100 million of loans originated annually, with interest-rate buy-downs in the range of $1,400 per loan.62 The Massachusetts Energy Efficiency Advisory Council completed an evaluation to assess the relative importance of the HEAT loan compared to other incentives in encouraging participation. The evaluation focused on roughly 950 customers who had recently received an energy audit and recommendation to install various energy efficiency measures; evaluators also surveyed consumers who participated in other energy efficiency programs but not the HEAT loan. Evaluators utilized self-reported customer responses
61 Efficiency Maine’s financing programs and the California On-Bill Financing Pilots were also evaluated. 62 Only approximately $15M of ratepayer funds were used to support total activity of $100M.
FINANCING PROGRAMS AND COST-EFFECTIVENESS TEST SCREENING
• Evaluation has been used for decades to verify the impacts and cost-effectiveness of energy efficiency programs. However, efficiency financing programs have typically not been evaluated as separate programs within ratepayer-funded portfolios. Thus, few formal impact evaluations have been conducted that assess the incremental savings contribution of financing to efficiency efforts.
• Evaluation is becoming increasingly important in jurisdictions where financing is gaining prominence; Illinois and Massachusetts recently evaluated their financing efforts.
• Impact evaluation can help state policy makers and program administrators assess whether savings are attributable to financing programs versus other programs offerings, offering insight on the impact of shifting resources to financing and away from other program options.
• Resource acquisition-focused evaluations should take into account the broad availability of alternative private financing options and should assess whether program financing was a critical factor for program participants deciding to invest and move forward with their project (i.e., did the program-supported financing generate incremental savings?).
• Market transformation-focused evaluations should seek to establish appropriate baselines (e.g., level of adoption of various efficiency technologies and the extent to which investments in these measures are supported through private financing mechanisms prior to the program), setting interim metrics and a timeline for measuring progress, and determining attribution of savings.
• Conventional evaluation methods can be adapted to assess financing programs, such as survey methods and various experimental and quasi-experimental approaches, including randomized control trials. However, further research is required on refining these approaches for financing programs and assessing which approaches are the most effective ways to assess savings and market transformation.

December 2015 www.seeaction.energy.gov 44
and data from program administrators to complete an analytical hierarchy process, a statistical model that estimates the relative influence of several factors, using pair-wise comparisons.
• HEAT loans were primarily used to finance equipment replacement (over 80 percent of loans by count), with only 10 percent of loans used for weatherization. Eighty-five percent of customers who used a HEAT loan reported that it allowed them to make improvements that they otherwise would have passed over. Evaluators found that only 9 percent of customers who received incentives also chose to use a HEAT loan; those who did use the loan reported that it was slightly more influential in their decision-making than incentives, which are generous, including an insulation incentive of up to 75 percent of project cost.63,64 Among customers that did not take a HEAT loan, 21 percent of customers reported that upfront costs were a barrier (compared to 39 percent of HEAT loan participants) (The Cadmus Group, 2015a).
• One of the aims of Illinois’ legislatively-mandated on-bill financing (OBF) pilot program is to provide greater access to energy efficiency for middle-income consumers. Each of Illinois’s five investor owned utilities was authorized to make up to $2.5 million of loans beginning in 2011.65 The legislation establishing the pilot required an evaluation of the program to inform the legislature and regulatory commission about whether the program should continue. The evaluation made use of data reviews, web-based customer self-report surveys, stakeholder interviews, and trade ally research to address program design, implementation, and impacts.
• At the time of the evaluation, $7.6 million of loans had been made (over 1600 loans), primarily to single-family residential customers. Most loans (nearly 90 percent) financed replacement or upgrades or furnaces or central air conditioning systems. Based on web surveys of 75 participants, the evaluation team estimated a free ridership rate of 13 percent (i.e., 87% of customer projects were attributable to the on-bill financing program, rather than rebates, which were also available to OBF participants). Participants were asked if they planned to complete a project prior to learning about the program; almost half (43 percent) of all participants reported that they were planning to complete the upgrade.66 However, respondents were not asked to differentiate between plans to install a high efficiency unit versus a standard efficiency unit, so the evaluation team does not draw conclusions from this statistic.67 The evaluation team also assessed the cost effectiveness of the on-bill financing program using the PACT and the TRC. All five utilities’ programs were cost effective (PACT calculated results ranged from 1.27 to 3.13) from the program administrator perspective while the programs did not pass a TRC test (TRC results ranged from 0.81 to 0.84). The evaluation team found that administrative costs were the primary driver of this result and estimated that programs could become cost-effective from a TRC perspective if
63 Of the 91 percent of customers who did not use a HEAT loan, over two thirds were aware of the loan’s existence. 64 Consumers receiving a HEAT loan are also eligible for rebate incentives. 65 One utility which offers both electric and gas service had a cap of $5M of loans. Utilities did not provide loan capital; these funds came from a private capital partner. Utilities provide a guarantee to the capital provider in the event of any defaults and are responsible for on-bill payment collection and disconnection in the case of delinquency. 66 This percentage varied by measure type; 76 percent of survey respondents who installed a new furnace had planned to do so before hearing of the program, but none of the respondents who installed insulation planned to do so prior to participating in the program. 67 Survey respondents were asked if, in the absence of the program, they would have pursued the same project with alternative financing (13 out of 75 said yes and were considered free-riders) or would have installed a less efficient option (10 out of 75 said yes). While participants were asked hypothetical questions about what they would have done, partial participants’ (customers who applied for the program but were denied or dropped out) behavior was actually observed: 37 percent of partial participants went on to install the same (high-efficiency) measure they had hoped to finance using OBF and paid for it using another funding source (primarily cash). Eight percent of partial participants went on to install a less efficient unit. Partial participants differ, demographically, from participants and thus are not an appropriate comparison group. Partial participants’ behavior is not a perfect indicator of a “no OBF” counterfactual because partial participants were exposed to some program elements which may have led to selecting high efficiency measures. However, partial participants’ behavior in future evaluations might be a useful addition to a self-reported free-ridership survey.

December 2015 www.seeaction.energy.gov 45
participation increased by 2.5 times (The Cadmus Group, 2015b). This evaluation provided useful information regarding the administrative costs, anticipated participation rates, and installed measures in a residential financing program, along with methods for estimating free-ridership issues in financing programs.
Evaluating Financing as a Resource Acquisition Strategy
Applying basic principles of evaluation to financing programs may help stakeholders better understand the additional benefits offered by financing programs, whether the programs focus on resource acquisition and/or market transformation objectives.68 Evaluation of financing programs does require data collection, although it will not necessarily lead to overly burdensome data collection requirements on private financial institutions who partner with ratepayer-funded programs. The majority of information needed for evaluation (e.g., customer information, property information, measure information) is likely already collected by program administrators, contractors, or other parties. Some additional information may be required from consumers (e.g., the consumer survey completed in Massachusetts and Illinois evaluations). The California evaluation team identified only six data fields that would be reported by financial institutions (Opinion Dynamics, 2014, p. 4).
Establishing Baselines
Energy efficiency programs are often designed to encourage customers to purchase more efficient technology than they would have otherwise chosen. In some market segments, reactive purchases (e.g., end-of-life equipment replacement or emergency equipment purchases if equipment breaks or fails) far outstrip the volume of proactive energy efficiency upgrades (Krajsa, 2013). In these reactive scenarios, evaluators traditionally do not count the amount of savings relative to the old equipment, but rather the savings relative to the equipment that the customer would have chosen were it not for the program offering.
Regulators and program administrators may need to ensure that savings from financing programs are counted in a similar fashion. Proper accounting may be as simple as adopting EM&V methods that are used for similar measures in traditional programs in the same jurisdiction. In other cases, such as custom projects and whole-house retrofits, additional efforts may be needed to ensure that savings are properly estimated up front and verified. Leveraging the protocols of traditional programs, including engineering savings analysis methods, modeling software, and contractor eligibility and training requirements, can help ensure that claimed savings values are reliable.
Measuring Savings Attributable to an Efficiency Finance Program
In this context, we focus on the extent to which program financing strategies actually increase the total energy efficiency savings within a given jurisdiction above and beyond a naturally occurring baseline. This question may be more complex for efficiency financing programs compared to traditional efficiency programs for at least two reasons.
• First, program financing is often offered in markets in which private financing is also readily available. Thus, it may be more difficult to determine whether the project would have moved forward in the absence of a program offering (i.e., would other financing have been used?). This consideration makes financing somewhat unique from other types of program offerings. For example, in the case of rebates, there is typically only one counterfactual to consider: in the absence of a program rebate, there are no
68 It should be noted that while organizing programs by these two objectives is fairly common, they are often interrelated and certainly not mutually exclusive objectives.

December 2015 www.seeaction.energy.gov 46
“private” rebates available. By contrast, in the case of program financing, there are often a wide variety of choices available to customers in the private market (e.g., using cash, credit cards, vendor financing, or home equity loans). Often, these options are more widely used than program financing products. As such, determining whether private financing would have worked equally well in generating the same level of savings may require a detailed and careful evaluation.
• Second, program financing is often promoted as an element or option in a broader program offering that may include other design components (e.g., technical assistance, rebates). Typical program evaluations generally do not parse out the specific impacts of particular program elements, focusing instead on the overall effectiveness of the program.
In jurisdictions exploring the possibility of using financing as a substitute for traditional programs, it may be important to evaluate the level of savings that program financing would likely have generated in the absence of other offerings. It may also be important to assess the ways in which combining offerings may produce enhanced results. In some cases, combining financing, incentives and other program elements may produce impacts that are disproportionately larger than might be expected by simply observing the effects of individual strategies (Kramer, 2014).
Figure 6 illustrates the multi-layered nature of the savings attribution question for energy efficiency programs that include and offer financing as part of their portfolio. Adjustment 1 can be thought of as analogous to a traditional counterfactual for efficiency programs in that it focuses on whether financing generated more savings than would have occurred otherwise. In this case, the question is framed as whether financing in general (of any type—program or private) helped generate additional savings relative to a baseline with no financing available.
The next two adjustments relate to the specific contextual factors noted above that are unique to financing as a particular type of program offering. Adjustment 2 considers whether financing offered through a given program generated additional savings beyond what would have occurred if a non-program financing option (or other payment option) were used by customers. Adjustment 3 accounts for the impact of other program offerings offered alongside financing, to help estimate what level of savings would have occurred in the absence of these other offerings. This last adjustment may be particularly important in jurisdictions that are contemplating the reduction or removal of these other offerings.

December 2015 www.seeaction.energy.gov 47
Figure 6: Savings Attribution in the Context of Energy Efficiency Financing69
By incorporating these elements into the evaluation process, evaluators will be able to provide stakeholders with a more complete picture of the incremental savings that program financing has added to baseline or naturally occurring energy efficiency, existing programs and traditional financing products. This information may be important in helping jurisdictions determine how best to allocate resources among financing and other strategies, as well as to assess the prospects for using financing as a primary program strategy in the future.
Evaluating Financing as a Market Transformation Strategy
Some proponents of efficiency financing have asserted that large-scale financing programs will fundamentally transform the energy efficiency marketplace away from utility customer-funded rebates/incentives and towards a partially or fully funded private sector model. For example, the NY Green Bank has been characterized as an integral part of a larger statewide market transformation effort designed to encourage greater adoption of energy efficiency technology through private market activity (NYSERDA, 2014a). Some financing proponents have also suggested that financing programs may transform the market by encouraging larger projects that generate more savings per project than currently achieved.
Others see financing as a vehicle for moving away from utility customer supported incentives of any form. For example, Figure 7 depicts the Connecticut Green Bank’s long-term vision of its role in transitioning from the current program environment (with rebates/incentives for high-efficiency products) to a market for energy
69 This figure is provided for illustrative purposes. It depicts savings attribution (adjustments) as a yes or no question when in reality each adjustment may result in partial yes answers. For example, financing had “some” influence or the financing resulted in the consumer investing in a larger efficiency project, but not whether to do efficiency or not.
Energy Savings
Yes, More Savings No, Same or Less Savings
Adjustment 1“Scope”
Adjustment 2“Grow the Pie”
Adjustment 3*“Incentives”
Needed Program Financing
Private/Other Financing Would Have Supported
Same Project
* Important in jurisdictions seeking to understand impact on savings if financing is substitute for incentives
Did financing generate more savings that would have otherwise occurred (e.g., by causing a consumer to choose a more efficient piece of equipment, or a larger project)
Project does not yield additional savings beyond baseline
Did the project need program-supported financing, or would a private/other financing option (e.g., home equity line, personal loan) have caused the same project to happen?
Yes No Yes, but would have been smaller
Would the project have occurred without incentives and other non-financing program elements?

December 2015 www.seeaction.energy.gov 48
efficiency products and services ultimately supported by “private sector financing only” (Clean Energy Finance and Investment Authority, 2014).
Figure 7: Role of the Connecticut Green Bank in Market Transformation
Given the importance of understanding the effectiveness of financing as a transformational strategy, regulators and program administrators may wish to establish clear direction regarding evaluation requirements for programs with market transformation objectives. Best practices for evaluating programs that have market transformation objectives include (NMR Group, 2013):
• Developing a logic model to illustrate the market transformation theory;
• Establishing baselines against which progress will be measured;
• Agreeing upon interim metrics to show progress;
• Committing to a timeline of progress indicators; and
• Measuring ultimate results attributable to the program over an extended period of time.
Each of these key elements is discussed in more detail below.
Developing a Logic Model
Program logic models are “graphic representations of the causal links between program activities, short-term responses to those activities among market actors and longer-term market effects” (Rosenberg & Hoefgen, 2009, p. 48). Logic models flow from decision makers’ hypotheses of how a program intervention strategy addresses barriers or market failures. A logic model can provide the basis for establishing metrics that indicate progress

December 2015 www.seeaction.energy.gov 49
toward program goals (interim metrics) and help program administrators, policy makers, and stakeholders assess the likely timeframe within which the theorized transformation might be realized. Three high-level descriptions of logic models relevant to efficiency financing are presented in Table 6.
Table 6: Three High-Level Descriptions of Energy Efficiency-Focused Logic Models
To date, few program administrators have developed formal logic models that describe the potential for financing as a market transformation tool. However, the Connecticut Green Bank is exploring the third hypothesis described in Figure 8 using a version of a logic model originally developed for use in California. Neither state has adopted this model.
The logic model outlines the steps through which financing could increase savings from energy efficiency:
1. Programs provide rebates, incentives, and training to drive demand for financing projects. Market trends favoring efficiency may increase demand at the same time.
2. Programs may also provide credit enhancements to lower investors’ perceived risks in energy efficiency projects. Over the longer term, as demand for financing increases, programs track loan performance data to increase investor confidence in energy efficiency investments and reduce the need for credit enhancements.
3. As the perceived risk of energy efficiency investments decreases, capital becomes more widely accessible with lower interest rates, more favorable terms, and more flexible underwriting criteria. Marketing by financing partners may also increase with the growth of energy efficiency lending as a line of business.
4. Attractive and available capital further increases demand for energy efficiency projects and the number and size of projects completed, leading to an increase in aggregate energy savings.
Identified Barrier Hypothesis Intervention Total Project Cost Reducing total project cost with a direct
incentive will induce more consumers to install high-efficiency measures and result in greater energy savings
Offer direct incentives, tax-credits, or rebates to consumers for targeted efficiency measures
Project Cash Flow / Timing of Payments versus Benefits
A financing option that results in a cash flow neutral or positive investment will induce more consumers to install high-efficiency measures and result in greater energy savings
Offer a subsidized financing option (e.g., below market rates or longer than typical repayments terms) for targeted efficiency measures; use ratepayer funds to make the loans or to fund credit enhancements that will induce private lenders to provide preferential terms (e.g., lower rates, longer repayment terms)
Lower than Desired Availability of Attractive Private Financing
If private sector lenders had additional information or experience with energy efficiency, they would provide more attractive financing, which would induce more consumers to install high-efficiency measures and result in greater energy savings
Work with private lenders to educate them on energy efficiency, collect and share relevant loan performance data, and support private investment with ratepayer-funded credit enhancements or direct investment until private sector lenders change their practices

December 2015 www.seeaction.energy.gov 50
Figure 8: Potential Logic Model for Connecticut Green Bank (Not Currently Adopted)
This logic model in focuses on leveraging energy savings from existing programs and policies to increase both the number of projects (↑ Projects) and the level of savings per project (↑ Savings PP) and does not necessarily imply a reduction or elimination of other incentives (e.g., rebates).
Establishing Market Baselines
A market baseline estimate is a quantitative assessment of existing levels of market adoption and savings from a given set of energy efficiency technologies and services (Rosenberg & Hoefgen, 2009, p. 62). It differs from a qualitative market characterization in that it provides a specific benchmark against which to measure future progress. As shown in Figure 9, a baseline estimate is key to understanding what changes in the market, and hopefully incremental savings, are attributable to programmatic efforts. “If the ultimate objective of the evaluation is to estimate net product or service adoptions attributable to the program, then an estimate of sales or market share for a period close to program launch is required” (Rosenberg & Hoefgen, 2009, p. 62).

December 2015 www.seeaction.energy.gov 51
Figure 9: Measuring Savings from Market Effects Above Baseline (Peters, 2014)
To the extent that market transformation efforts aim to both (1) increase the use of financing generally to support energy efficiency measures, and (2) specifically increase the use of private financing to support energy efficiency, it may be necessary to establish a baseline that accounts for both program and private financing activity related to energy efficiency.
Agreeing Upon Interim Metrics
Establishing and tracking interim metrics is critical in assessing progress toward achieving market transformation goals. Examples of interim metrics include market share of high-efficiency equipment or products or market saturation of services/practices (e.g., commissioning). Data indicating changes in these metrics may be drawn from self-report surveys of customers or upstream market actors (e.g., manufacturers, distributors, and retailers), saturation surveys, periodic market baseline studies, and shipment or sales data (Peters, 2014). Other indicators of market effects (e.g., changes in awareness, attitudes, and product availability) may also be tracked, particularly in the earlier stages of a program intervention.
Potential indicators of market effects for financing programs might include the following:
• Early Indicators:
o Availability and accessibility of financing options to customers
o Customer awareness of and attitudes toward financing options
• Mid-Stage Indicators:
o Changes in interest rates, terms, and underwriting criteria offered for energy efficiency financing
o Changes in levels of credit enhancement needed to achieve given rates and terms (e.g., leverage, see sidebar “Volume and Leverage”)
o Changes in incentive levels and other supports needed to drive financing participation

December 2015 www.seeaction.energy.gov 52
o Number of financial institutions that see efficiency financing as a viable business and begin offering efficiency-oriented loan products without assistance from utilities or government agencies
• Ultimate indicators:
o Increased savings attributable to energy efficiency financing
Committing to a Timeline
Establishing a timeline for various performance metrics helps to ensure accountability; see Table 7 for an example of interim metrics that could be tracked over time to assess whether an efficiency financing program is making progress toward achieving its market transformation objectives.70
70 This example builds off of the logic model in translating the steps into actual interim metrics that can be measured over time.
Volume—the total dollar amount of financing extended and number of loans—and leverage—the ratio of ratepayer dollars (e.g., rebates, credit enhancements, interest rate buy downs) to private dollars—are two straightforward metrics that have often been used to track the performance of energy financing programs. Administrators in the five states surveyed for this report track both volume and leverage. Volume and leverage metrics provide useful information on program performance, although these metrics are not sufficient to answer questions related to savings attributable to efficiency financing programs. For example, consider a program that works with private lenders to buy down interest rates offered to participants. This program may attract many participants who had access to attractive financing outside the program and had planned to complete similar projects even without program support. Volume (total number of loans) and the leverage ratio would be high, although savings attributable to the financing program might be negligible.
Program-supported financing is potentially available to support many types of energy efficiency projects and eligible technologies, ranging from single measure projects, to equipment replacements, to multi-measure whole home upgrades. For example, if significant market activity occurs as a result of “reactive improvements” (e.g. replacing broken water heaters), then it is important to ensure that additional efficiency gains occur as a result of replacing needed equipment. Moreover, certain products and equipment are highly visible, have attractive non-energy attributes, and are perceived to enhance property values (e.g., new windows and doors). These types of improvements may be more likely to occur in the absence of program support and should be screened to ensure that high-efficiency equipment is being selected and efficiency gains are beyond what would have occurred in the absence of program-supported financing. It is possible that volume and gross savings may appear large for a financing program that focuses on reactive improvements or desirable home upgrades. Baseline market penetration levels of efficient equipment may need to be estimated and compared with post-implementation evaluation results to determine whether the program has actually motivated more customers to choose efficient equipment than may already do so naturally.
VOLUME AND LEVERAGE

December 2015 www.seeaction.energy.gov 53
The first step is to establish a baseline (T0) of efficiency project activity (and aggregate energy efficiency savings) in the target market (or market segment) and the percentage of projects supported by financing prior to the program. The baseline should account for both private market activity and existing program savings and financing activity.
Data on new financing program options should then be gathered (T1) and an estimate of initial demand for these options should be established (T2). From an evaluation standpoint, the time required for these tasks may depend on the timeline of program development and implementation. After initial program launch, an interim period may be needed to allow loans to “season” (generate performance history over time) and data to be gathered before robust loan information and project performance data (T3) is available. In theory, several years of performance history could potentially be needed for this purpose. After this data was available to financial market investors, it would make sense to gather information on perceived risk (T4) and any responses from capital providers, such as an increase in financing supply (T5).
Such changes could potentially attract more demand for financed efficiency projects (T6) if the supply changes corresponded with a positive response to more favorable loan terms, increased promotion of energy efficiency financing products, or increased access to capital (e.g., more loan options or less restrictive underwriting). From a policy standpoint, the most important metric would be changes in overall savings and net benefits attributable to this type of market transformation effort (T7). It is important for evaluators to distinguish between an increase in observed financing activity and actual increases in net savings in order to determine whether the market transformation initiative had actually helped achieve policy-related goals.
Table 7: Possible Interim Metrics for Evaluation of Financing for Market Transformation
71 This information will also be useful to financial institutions, some of which have cited a lack of historical performance data on energy efficiency loans as a barrier to investing in this area.
Time Data Category Metrics T0 Baseline data:
-Private market -Existing programs
- Private market: - Naturally occurring EE savings - Estimated % attributable to private financing - Existing programs: - Net savings levels - Estimated % attributable to program financing
T1 Data on new program financing options
- Rates, terms, underwriting criteria - Credit enhancements - Other incentive levels
T2 Initial data on financing demand - Availability, awareness, knowledge, attitudes toward financing options -Promotion and uptake of EE financing
T3 Data on loan and project performance71
- Delinquencies, defaults - Cash flows generated - Net savings achieved
T4 Changes in perceived risk of EE financing
- Changes in credit enhancement and other incentive amounts needed to achieve desired terms and interest rates -Lender surveys
T5 Changes in financing supply - Number of lenders in the market - Changes in rates, terms, and underwriting criteria for EE projects
T6 Updated data on financing demand - Availability, awareness, knowledge, attitudes toward

December 2015 www.seeaction.energy.gov 54
Our example illustrates that assessing the extent to which program interventions transform the market for financing energy efficiency is likely to be a long-term effort. However, it is possible to collect useful information in the nearer term that may provide insights.72 By evaluating these near-term efforts, it may be possible to predict the ultimate outcome of improved and expanded financing offerings over the longer run resulting from reliance on performance history rather than credit enhancement.
Determining Ultimate Results Attributable to the Program
Determining the extent to which market effects are attributable to programmatic efforts is critical for market transformation initiatives. For example, the California PUC evaluation protocol states that “Causality should be examined to estimate net market effects. The goal of the activity is to estimate the proportion of market changes that can be attributed to program interventions (California Public Utilities Commission, 2006, p. 155).
The most direct method of assessing the impact of a market transformation initiative is to establish a baseline estimate of market adoption in the absence of a program and compare that baseline to adoption rates in the presence of program implementation.73 Baselines that may be chosen include comparable jurisdictions without existing programs as well as experimental or quasi-experimental groups within a jurisdiction (Rosenberg & Hoefgen, 2009).74 Baselines may also be established after program implementation using careful retrospective analysis, though establishing a baseline prior to implementation is preferable (NMR Group, 2013).75
In the case of financing programs, establishing an appropriate baseline may differ somewhat from other market transformation initiatives. Large-scale energy efficiency financing programs may aim to change the way in which energy efficiency investments are supported overall. As such, rather than estimating the adoption levels of a particular measure or practice in the absence of a program, a baseline estimate for a market effects evaluation focused on increasing the use of financing may need to estimate the extent to which, prior to launch of the financing program, energy efficiency investments are already supported through private or existing program financing offerings. Once this estimate has been established, subsequent observations can determine any changes in the percentage of market and program savings attributable to financing, as well as the total amount of additional net savings that new financing strategies have produced.
72 For example, if a financing program seeks to reduce a lender’s perceived risk in order to entice the lender to offer better loan terms, it may be possible to provide a shortcut using other forms of risk mitigation aside from establishing solid loan performance. Many financing programs partner with private lenders to offer credit enhancements that incentivize increased lending for energy efficiency, better loan terms, and less restrictive underwriting criteria. 73 This approach has sometimes been referred to as a “cross-sectional” methodology, see (NMR Group, 2013). 74 Experimental groups are randomly assigned, quasi-experimental groups “are not randomly identified but have collective characteristics that are similar to those of the program group” (NMR Group, 2013, p. 27). 75See NMR Group, 2013, p. 27: “While the approach could certainly benefit from data collection performed early during planning or early implementation stages, with careful model specification, evaluators have successfully developed such models well into program implementation.”
financing options -Response to more favorable loan terms and increased access to capital - Promotion and uptake of EE financing
T7 Changes in overall savings levels and savings attributable to EE financing
- Additional savings achieved (market and program) and % attributable to financing

December 2015 www.seeaction.energy.gov 55
Self-reporting approaches have also been used to assess market effects, in which data is gathered through surveys of program participants, non-participants, and potentially other market actors.76 Self-reporting methods may be less expensive than direct observational comparisons, although they can be subject to various biases among survey participants. Retrospective self-reporting may be even more challenging for financing programs (e.g., likelihood that survey participants are able to recall and distinguish the influence of financing versus other offerings).77
Research Needs
At present, the most promising methods for assessing the impacts of energy efficiency financing are a matter of some discussion within the evaluation community; more research and field experience may be needed before best practices can be established. In particular, development of cost-effective methodologies for estimating savings that are attributable to financing efforts is needed. Data collection, including surveying methods, specific to efficiency financing need further definition as part of such methodologies as well as guidance on effective experimental and quasi-experimental study designs. More research is also needed on program logic models for efficiency financing programs that seek to transform markets and metrics that are appropriate for measuring progress.
Conclusion
As the role of energy efficiency financing continues to expand, several jurisdictions have begun to explore the possibility of making large-scale shifts toward financing and away from traditional energy efficiency programs. In some cases, states have made commitments or expressed public aspirations to move in this direction in the hopes of minimizing the use of ratepayer funds while continuing to achieve energy efficiency goals. The perception that financing programs must be flexible enough to attract private capital has led some jurisdictions to minimize regulatory reporting requirements. The combination of these trends has the potential to create situations in which financing is used as the primary mechanism to achieve energy efficiency goals, with less regulatory oversight than has been applied to traditional efficiency programs.
The risk in this type of scenario is that the ability of large-scale financing programs to achieve aggressive energy efficiency savings or market transformation objectives is still an open question. Achievable potential studies, such as those conducted in California, suggest that financing programs may increase electric and gas savings potential by three to five percent (Navigant, 2014). In New York, the number of residential home performance projects has remained relatively stable at about 0.1% participation annually, both before and after the introduction of various innovative financing products (Kramer, 2014). These examples suggest that there is some uncertainty regarding the ability of financing to drive energy efficiency to a new scale on its own, rather than as one component in a more comprehensive mix of programs and strategies.
Impact evaluations of existing large-scale financing programs that have achieved relatively high levels of loan volume may address other remaining issues. For example, in the residential sector, single measures like HVAC equipment and window replacements often far outstrip the number of comprehensive whole-house projects that are financed. HVAC equipment replacements and windows have relatively high naturally occurring demand; impact evaluations may help determine whether these types of projects would have moved forward in the absence of a program offering, assess the extent which high efficiency HVAC equipment and window measures are being installed, and assess whether private financing alternatives are available or could be used. 76 This type of method is often used for determining net savings by assessing levels of free ridership and spillover (Rosenberg & Hoefgen, 2009). 77 To some extent, it may be possible to cross-reference response with prospective, hypothetical surveys that provide options with and without specific offerings, but those approaches raise obvious questions regarding the reliability of responses.

December 2015 www.seeaction.energy.gov 56
Jurisdictions that are considering a shift toward financing as a primary strategy to achieve their energy efficiency objectives may want to consider implementing a regulatory framework that has adequate oversight and accountability as these strategic choices are pursued. Several key elements of a regulatory framework include:
• Oversight and Governance: Oversight by a regulatory or governing body that develops and applies performance and accountability requirements as robust as those applied to traditional efficiency programs.
• Program Classification and Treatment: Treatment of energy efficiency financing programs in ways likely to generate periodic and rigorous assessments of program performance. Examples include treating financing as a stand-alone program, classifying financing as a resource acquisition program, and linking evaluated performance to administrator performance incentives.
Jurisdictions may wish to consider utilizing planning and evaluation tools that can help provide information regarding the prospects and performance of energy efficiency financing programs. These include:
• Achievable Potential Studies: Achievable potential studies may help provide useful information regarding the level of incremental energy efficiency savings that program financing strategies can be expected to achieve over a defined time horizon.
o Avoiding Pitfalls: It may be important to distinguish between studies of program-achievable potential and analyses of the total potential market size for financing. Market sizing may provide a larger theoretical number representing the total amount of capital that might be needed if all potential customers participated in a given financing program. By contrast, achievable potential studies focus on the actual level of participation that can realistically be expected for a given program.
• Cost-Effectiveness Screening Analysis: Examining the total costs and benefits produced by financing programs may help regulators and other stakeholders better understand the overall value of these programs.
o Avoiding Pitfalls: Programs that are considering using financing as a substitute for traditional programs may want to consider both total net benefits as well as benefit/cost ratio.
• Evaluation: Evaluation of energy efficiency financing programs may provide a better understanding of the incremental savings that are attributable to financing programs.
o Avoiding Pitfalls: Assessing savings that are attributable to financing programs may be more complex than for traditional programs because in the case of financing there are often readily available private alternatives. A robust evaluation may require an examination of (1) whether financing was needed to produce the savings (and overcome customer market barriers), (2) whether program financing was needed as opposed to private financing alternatives, and (3) whether the savings would have occurred in the absence of other program offerings, such as rebates and incentives.
The SEE Action Financing Solutions and Driving Ratepayer-Funded Efficiency through Regulatory Policies Working Groups commissioned this report as groundwork for a dialogue among regulators and stakeholders in the energy and financing sectors to explore regulatory mechanisms for ensuring that efficiency financing initiatives provide value for society and protection for consumers. In this study, we identify and explore many of the emerging regulatory and practical issues that jurisdictions will need to consider when contemplating an increased reliance on financing programs as a primary program strategy. Our review of several leading states that are implementing or considering these large-scale financing programs suggests that additional work on adapting planning, performance, and evaluation tools is warranted in order to assess the role of large-scale financing programs.
December 2015 www.seeaction.energy.gov 57
References
Billingsley, M., Hoffman, I., Stuart, E., Schiller, S., Goldman, C., & Hamachi LaCommare, K. (2014). The Program Administrator Cost of Saved Energy for Utility Customer-Funded Energy Efficiency Programs. Lawrence Berkeley National Lab.
Booz & Co. (2013). New York State Green Bank Business Development Plan . Retrieved from http://documents.dps.ny.gov/public/Common/ViewDoc.aspx?DocRefId={52B09652-1BA1-4B85-845C-B6F05185E692}
Borgeson, M., Zimring, M., & Goldman, C. (2012). The Limits of Financing for Energy Efficiency. ACEEE Summer Study on Energy Efficiency in Buildings. Retrieved from http://aceee.org/files/proceedings/2012/data/papers/0193-000155.pdf
California Legislative Analyst's Office. (2014). The 2014-2015 Budget: Resources and Environmental Protection. Retrieved from http://www.lao.ca.gov/reports/2014/budget/resources/resources-environmental-protection-022114.pdf
California Public Utilities Commission. (2006). California Energy Efficiency Evaluation Protocols: Technical, Methodological, and Reporting Requirements for Evaluation Professionals. Retrieved from http://www.cpuc.ca.gov/nr/rdonlyres/27629e7a-f01a-48ca-8b2c-b07ecee7dd5a/0/caenergyefficiencyevaluationprotocols.doc
California Public Utilities Commission. (2013). Decison 13-09-044: Implementing 2013-2014 Energy Efficiency Financing Pilot Programs. Retrieved from http://docs.cpuc.ca.gov/PublishedDocs/Published/G000/M077/K182/77182202.pdf
CEFIA. (2014). CEFIA FY15 Operating and Program Budget. Retrieved from http://www.ctcleanenergy.com/portals/0/board-materials/5b_FY%202015%20Budget_FY%202014%20Actuals_061314.pdf
City of New York. (2012). Initial Comments of the City of New York and the New York City Energy Efficiency Corporation. Retrieved from http://documents.dps.ny.gov/public/Common/ViewDoc.aspx?DocRefId={12FA6A4F-2F9C-42AD-A7BA-A4C595B6347C}
Clean Energy Finance and Investment Authority. (2014). Pvodiging Easy Access to Affordable Capital. Environment Northeast: Energy Efficiency. Retrieved from http://acadiacenter.org/wp-content/uploads/2014/09/ENE_CT_EE_Forum_Presentations.pdf
Connecticut Department of Energy and Environmental Protection. (2013). Comprehensive Energy Strategy for Connecticut. Retrieved from http://www.ct.gov/deep/lib/deep/energy/cep/2013_ces_final.pdf
Connecticut Energy Efficiency Board. (2012). The EEB Program Evaluation and Market Assessment Roadmap. Retrieved from http://www.energizect.com/sites/default/files/2012%20EEB%20Program%20Evaluation%20%26%20Market%20Assessment%20Roadmap%20F.pdf
Connecticut Energy Efficiency Board. (2015). CEEF C&I Program Involvement in PACE Projects: Update for the CT Energy Efficiency Board. Retrieved from https://app.box.com/s/hnpolw20kn7y4awv2ekuykc8geguc95b/1/3350450172/28478714528/1
Dunksy, P. (2014). Adapting Cost Effectiveness to Financing Programs: Issues and Options.

December 2015 www.seeaction.energy.gov 58
Dunsky, P., & Mithcell Jackson, J. (2014, December 3).
EmPOWER Finance Work Group. (2013). EmPOWER Finance Work Group Residential Energy Efficiency Financing Proposal.
EmPOWER Finance Workgroup. (2013). EmPOWER Finance Work Group Residential Energy Efficiency Financing Proposal. Retrieved from http://webapp.psc.state.md.us/newIntranet/casenum/NewIndex3_VOpenFile.cfm?filepath=C:\Casenum\9100-9199\9154\Item_369\\9153-57.ResidentialEnergyEfficiencyFinancingProposal-wg-013013.pdf
EmPOWER Maryland Work Group. (2013). Supplemental Report to the Public Service Commission Of the EmPOWER Maryland Work Group. Retrieved from http://webapp.psc.state.md.us/newIntranet/casenum/NewIndex3_VOpenFile.cfm?filepath=C:\Casenum\9100-9199\9154\Item_390\\9153-57-EmPOWERFinancingSupplementalReport-wg-040113.pdf
Eto, J., Prahl, R., & Schlegel, J. (1996). A Scoping Study on Energy-Efficiency Market Transformation by California Utility DSM Programs. California Demand-Side Measurementa Advisory Committee.
Garcia, B., & Schub, J. (2014). Objective Function Protocol – Version 1.0. Retrieved from http://www.ctcleanenergy.com/documents/5a_Objective%20Function%20Protocol_Version%201.0_Memo_061314.pdf
Goldman, C., Fuller, M., Stuart, E., Peters, J., McRae, M., Albers, N., . . . Spahic, M. (2010). Energy Efficiency Services Sector: Workforce Size and Expectations for Growth. Retrieved from http://emp.lbl.gov/publications/energy-efficiency-services-sector-workforce-size-and-expectations-growth
Goldman, C., Stuart, E., Hoffman, I., Fuller, M., & Billingsley, M. (2011). Interactions between Energy Efficiency Programs Funded under the Recovery Act and Utility-Customer Funded Energy Efficiency Programs.
Instutite for Industrial Productivity. (2012). Energy Efficiency Resource Acquisition Program Models in North America. Retrieved from http://www.iipnetwork.org/IIP_resoure_acquisition
Krajsa, P. (2013, August 10). Reaching Middle Market Homeowners through Finance Programs and the Contractor Network. State and Local Energy Report. Retrieved from http://stateenergyreport.com/2013/08/10/reaching-middle-market-homeowners-through-finance-programs-and-the-contractor-network/
Kramer, C. (2014). Residential Financing on the Ground: Lessons Learned from Programmatic Examples. ACEEE Summer Study Conference Proceedings.
Maryland Energy Administration. (2014). 2015–2017 EmPOWER Maryland Filing.
Maryland Public Service Commission. (2011). ORDER NO. 84569 .
MassSave. (2012). Massachusetts Joint Statewide Three-Year Electric and Gas Energy Efficiency Plan.
Nadel, S., Hewitt, D., Horowitz, N., & Casentini, L. (2000). Performance Metrics for Market Transformation Programs: Incentivizing Progress without Strangling Creativity. ACEEE Summer Study Proceedings. Retrieved from http://aceee.org/files/proceedings/2000/data/papers/SS00_Panel6_Paper26.pdf
National Action Plan for Energy Efficiency (NAPEE). (2007). Guide for Conducting Energy Effi ciency Potential Studies. Retrieved from http://www.epa.gov/cleanenergy/documents/suca/potential_guide.pdf
National Action Plan for Energy Efficiency. (2007). Guide to Resource Planning with Energy Efficiency. Retrieved from http://www2.epa.gov/sites/production/files/2015-08/documents/resource_planning.pdf
December 2015 www.seeaction.energy.gov 59
National Action Plan for Energy Efficiency. (2007). Model Energy Efficiency Program Impact Evaluation Guide. Retrieved from http://www.epa.gov/cleanenergy/documents/suca/evaluation_guide.pdf
National Action Plan for Energy Efficiency. (2008). Understanding the Cost-Effectiveness of Energy Efficiency Programs: Best Practices, Technical Methods, and Emerging Issues for Policy-Makers. Retrieved from http://www2.epa.gov/sites/production/files/2015-08/documents/cost-effectiveness.pdf
National Grid. (2014). 2013 Plan Year Report. Retrieved from http://ma-eeac.org/wordpress/wp-content/uploads/National-Grid.pdf
Navigant. (2014). 2013 California Energy Efficiency Potential and Goals Study.
Navigant. (2015). Energy Efficiency Potential and Goals Study for 2015 and Beyond. Retrieved from http://www.cpuc.ca.gov/NR/rdonlyres/0C4CF052-0E02-4776-A69A-88C619AC8DFB/0/2015andBeyondPotentialandGoalsStudyStage1FinalReport92515.pdf
NEEA. (n.d.). NEEA's Definition of Market Transformation. Retrieved from http://neea.org/docs/default-source/marketing-tookits/neea_definition_of_markettransformation.pdf?sfvrsn=2
New Jersey Board of Public Utilities. (2015). Request for Proposal: Program Administration and Management Services, New Jersey Clean Energy Program .
New York Public Service Commission. (2015). Order Adopting Regulatory Policy Framework and Implementation Plan in Case 14-M-0101 .
New York State Department of Public Service. (n.d.). 07-M-0548: Energy Efficiency Portfolio Standard - Evaluation. Retrieved from http://www3.dps.ny.gov/W/PSCWeb.nsf/All/766A83DCE56ECA35852576DA006D79A7?OpenDocument
New York State Department of Public Service. (2008). CASE 07-M-0548 - Proceeding on Motion of the Commission Regarding an Energy Efficiency Portfolio Standard. Retrieved from http://www3.dps.ny.gov/W/PSCWeb.nsf/All/06F2FEE55575BD8A852576E4006F9AF7?OpenDocument
NMR Group. (2013). A Review of Effective Practices for the Planning, Design, Implementation, and Evaluation of Market Transformation Efforts. Retrieved from http://www.calmac.org/publications/FINAL_NMR_MT_Practices_Report_20131125.pdf
NSTAR. (2014). 2013 Plan Year Report. Retrieved from http://ma-eeac.org/wordpress/wp-content/uploads/NSTAR.pdf
NYSERDA. (2013a). Case 13-M-0412: Reply Comments.
NYSERDA. (2013b). Petition of New York State Energy Research and Development Authority to Provide Initial Capitalization for the New York Green Bank. Retrieved from http://documents.dps.ny.gov/public/Common/ViewDoc.aspx?DocRefId={C3FE36DC-5044-4021-8818-6538AAB549B8}
NYSERDA. (2014a). Clean Energy Fund Proposal. Retrieved from http://documents.dps.ny.gov/public/Common/ViewDoc.aspx?DocRefId=%7BDABF6A8A-17A5-441F-AC44-48587105CF6D%7D
NYSERDA. (2014b). New York Green Bank Metrics Reporting and Evaluation Plan.

December 2015 www.seeaction.energy.gov 60
NYSERDA. (2014c). Petition to Complete Capitalization of NYGB. Retrieved from http://documents.dps.ny.gov/public/Common/ViewDoc.aspx?DocRefId={10FE3798-EFFA-4BD3-879A-3E251F260C40}
NYSERDA. (2015). Clean Energy Fund Information Supplement in Case 14-M-0094.
Opinion Dynamics. (2014). Finance Impact Evaluation Data Fields Memorandum.
Peters, J. (2014). Evaluation of Market Transformation Programs. ACEEE National Symposium on Market Transformation. Retrieved from http://www.aceee.org/files/pdf/conferences/mt/2014/101-Peters.pdf.
Pitkin, J., Hale, G., & Griffin, A. (2014, October 22).
Rockefeller Foundation. (2012). United States Building Energy Efficiency Retrofits: Market Sizing and Financing Models. Retrieved from http://www.rockefellerfoundation.org/report/united-states-building-energy-efficiency-retrofits/
Romine, T., McGowan, R., Sober, D., & McLean, R. (2015). Report of Public Utility Law Judget Division. Retrieved from http://webapp.psc.state.md.us/newIntranet/Casenum/NewIndex3_VOpenFile.cfm?filepath=C:\Casenum\9300-9399\9373\Item_35\\9373--Report(Final).pdf
Rosenberg, M., & Hoefgen, L. (2009). Market Effects and Market Transformation: Their Role in Energy Efficiency Program Design and Evaluation. California Institute for Energy and Environment. Retrieved from http://uc-ciee.org/downloads/mrkt_effts_wp.pdf
SEE Action Financing Solutions Working Group. (2014). Financing Energy Improvements on Utility Bills: Market Updates and Key Program Design Considerations for Policymakers and Administrators. SEE Action.
State of California. (2003). Energy Action Plan. Retrieved from http://www.energy.ca.gov/energy_action_plan/2003-05-08_ACTION_PLAN.PDF
The Cadmus Group. (2015a). Home Energy Services Initiative and HEAT Loan Delivery Assessment. Retrieved from http://ma-eeac.org/wordpress/wp-content/uploads/HES-and-HEAT-Loan-Program-Assessment-Final-Report.pdf
The Cadmus Group. (2015b). Illinois On-Bill Financing Program Evaluation.
WMECo. (2014). 2013 Plan Year Report. Retrieved from http://ma-eeac.org/wordpress/wp-content/uploads/WMECO.pdf

December 2015 www.seeaction.energy.gov 61
Appendix A: Energy Efficiency Cost-Effectiveness Tests
Cost-effectiveness screening analysis is utilized by program administrators to assess the proposed costs and estimated benefits of a particular energy efficiency program or strategy, and in some cases to help evaluate program results. There are five standard cost-effectiveness tests that take varying stakeholder perspectives: the participant cost test (PCT), the utility/program administrator cost test (PACT), the ratepayer impact measure test (RIM), the total resource cost test (TRC), and the societal cost test (SCT). Many state PUCs have adopted policy guidelines or regulatory decisions that direct efficiency program administrators to use a primary test in screening programs or consider multiple tests in their planning process. Table A-1 summarizes the five cost-effectiveness tests, including stakeholder perspective, key questions that the test addresses and summary of benefit and costs that are included in each test.
Table A-1: The Five Principal Cost Effectiveness Tests78
Test Perspective Key Question Answered Summary Approach
Participant cost test (PCT)
Program participants
Will program participants benefit over the measure life?
Compares the customer’s benefits (e.g., bill reduction plus incentives) to their direct costs of implementing the efficiency project/measures
Program administrator cost test (PACT)
Program administrator
Will program administrator costs (and utility bills) increase or decrease?
Compares a utility’s avoided supply costs (energy, generation and T&D capacity) based on net energy and load reductions to program administrator costs (administration costs plus incentives to participants)
Ratepayer impact measure test (RIM)
Non-participating ratepayer
Will utility rates increase? Compares a utility’s avoided supply costs to program administrator costs plus net lost utility revenues caused by reduced sales
Total resource cost test (TRC)
Stakeholders in service territory
Will the total costs of energy in the utility service territory increase or decrease (regardless of who pays the costs and how receives the benefits)?
Compares a utility’s avoided supply costs plus other benefits (e.g., water savings, fuel oil savings) to program administrative costs plus net participant costs and tax benefits
Societal cost test (SCT)
General public What are the overall benefits to the community of the energy efficiency program portfolio, including indirect benefits?
Compares utility’s avoided supply costs, plus other benefits (e.g., externalities) to program administrative costs plus net participant costs
78 Adapted from National Action Plan for Energy Efficiency (2007 and 2008). Guide to Resource Planning with Energy Efficiency (Table 5.2) and Understanding Cost-Effectiveness of Energy Efficiency Programs: Best Practices, Technical Methods, and Emerging Issues for Policy-Makers. Energy and Environmental Economics, Inc. and Regulatory Assistance Project. www.epa.gov/eeactionplan.

December 2015 www.seeaction.energy.gov 62
Appendix B: The Objective Function
The Connecticut Green Bank (CGB) uses an alternative tool to account for some of the costs and benefits of its financing programs. This tool, called “the Objective Function,” was originally developed by the Coalition for Green Capital.79 The Objective Function measures energy saved per dollar of public funds invested. Conceptually, a larger value indicates more efficient use of public dollars. It is similar to the inverse of the cost of saved energy, though currently only Green Bank costs (not other utility costs) are included. Participant costs are also not included, making the metric more similar to a PACT or utility cost test (UCT) perspective than a TRC or societal one.
The formula for the Connecticut version of the Objective Function 1.0 is:
(𝐸𝐸𝐸𝐸𝐸𝐸 𝐺𝐸𝐸𝐸𝐸𝐺𝐺𝐸𝐺 𝑜𝐸 𝑆𝐺𝑆𝐸𝐺−𝑘𝑘ℎ 𝑜𝐸 𝐵𝐺𝐵)∗(1±% 𝑅𝐸𝐺𝑅𝑅𝑅𝐸𝐺 𝑆𝐺𝑆𝑅𝐸𝐸𝑆)𝐶𝐺𝐵 𝑅𝐸𝑒𝐺𝐺𝐸𝑆+𝑃𝐸𝑜𝐸𝐸𝐺𝑃 𝐺𝐸𝐺 𝐴𝐺𝑃𝑅𝐸𝑅𝑆𝐺𝐸𝐺𝐺𝑅𝑆𝐸 𝐶𝑜𝑆𝐺𝑆+𝐶𝐸𝐸𝐺𝑅𝐺 𝐸𝐸ℎ𝐺𝐸𝑎𝐸𝑃𝐸𝐸𝐺𝑆+𝐴𝑃𝑜𝐵𝐸𝐺 𝑜𝑜 𝐹𝑅𝐸𝐺𝐸𝑎𝑅𝐸𝐸−𝑅𝐸𝐶 𝑅𝐸𝑆𝐸𝐸𝐵𝐸
The numerator of the Objective Function counts the amount of clean energy generated by renewable resources and/or the amount of energy saved by energy efficiency projects, adjusted by a realization term that accounts for the difference between predicted and actual generation/energy savings. The denominator includes various costs such as Green Bank rebates; Green Bank program and administrative costs; Green Bank credit enhancements including interest rate buy-downs, loan loss reserves and guarantees; principal funded by the Green Bank; and an adjustment for revenue from renewable energy credits (RECs) that the Green Bank retains and may sell. Other revenue from financing activities is not currently included.
Benefits
As compared with traditional cost-effectiveness tests, some of the benefits included in the Objective Function may be overvalued; on the other hand, certain other benefits that are typically included in traditional benefit-cost tests may not be included. Overvaluation may occur if savings are included that are not incremental (above baseline) or attributable to financing. Currently the Green Bank calculates some savings relative to the old equipment that was previously installed, rather than as compared to an assumed baseline that would be installed were it not for the program. It also does not explicitly assess whether savings are directly attributable to its programs. However, other benefits may be understated because the Objective Function does not estimate avoided capacity savings or avoided transmission and distribution benefits, which are typically included in cost-effectiveness analyses.
Costs
Some costs included in the Objective Function may be underrepresented while other costs may be overstated. For example, the Green Bank does not currently calculate administrative costs, though there is a placeholder for them in the equation. Utility and participant costs are also not included, which are included in TRC and societal cost-effectiveness tests.
On the other hand, some costs may be overvalued. Currently financing costs are valued based on dollars invested, even though those dollars may be recycled or not immediately expended. For example, direct lending costs are valued as the dollars of capital invested in this activity, rather than the expected write-offs that may occur. 79 The Objective Function Protocol (Version 1.0) can be found at http://www.ctcleanenergy.com/documents/5a_Objective%20Function%20Protocol_Version%201.0_Memo_061314.pdf

December 2015 www.seeaction.energy.gov 63
Similarly, loan loss reserve costs are based on dollars invested in a reserve, rather than on expected payouts as losses occur.
Observations
The Connecticut Green Bank has stated that the Objective Function is a work in progress and does not account for all benefits and costs of energy efficiency programs (and other clean energy projects). Currently, the Green Bank uses the Objective Function to provide information regarding the energy-related benefits of its programs and plans to eventually revise and enhance this metric. Given its current limitations, it is important for policy makers to consider or develop other metrics in addition to assess the impacts of efficiency financing programs. Connecticut and the Coalition for Green Capital have committed to developing a new version of the Objective Function at some point.

This document was developed as a product of the State and Local Energy Efficiency Action Network (SEE Action), facilitated by the U.S. Department of Energy/U.S. Environmental Protection Agency. Content does not imply an endorsement by the individuals or organizations that are part of SEE Action working groups, or reflect the views, policies, or otherwise of the federal government.