Embed Size (px)
Citation preview

Making Journal-Quality Tables(and other useful hints!)
Making Journal-Quality Tables(and other useful hints!)
Presented by the CFDRInstructor: Meredith PorterMonday, October 23, 2006
First question to ask…
Who is your audience?– Specific journal– Conference reviewer– Professor overseeing assistantship– Professor of class
First question to ask…
Specific journal– Consult the journal’s website
Manuscript submission guidelines
…Here are some examples of manuscript submission guidelines
ASA Manuscripts (American Sociological Review, Social Psychology Quarterly…)Number tables consecutively throughout the text. Type or print each table on a separate page at the end of your paper. Insert a note in the text to indicate table placement
Each table must include a descriptive title and headings for all columns and rows (see recent journal issues for examples).
For clarity, always use the same variable names in your tables as you use in your text.

ASA Manuscripts (American Sociological Review, Social Psychology Quarterly…)
Standard errors, standard deviations, t-statistics, and so on, should appear in parentheses under the means or coefficients in the tables.
Gather general notes to tables as “Note:” or “Notes:” at the bottom of the table; use a, b, c, etc., for table footnotes.
Use asterisks *, **, and/or *** to indicate significance at the p < .05, p < .01, and p < .001 levels, respectively; note if tests are one-tailed or two-tailed. Generally, only those results significant at the p < .10 level or better should be indicated as significant in tables or text.

CriminologyPlease note that if a paper is accepted for publication, all the formatting and layout of tables and graphs will have to be redone in the composition stage of publication. It is therefore requested that table formatting and layout be kept simple and straightforward. Information should be conveyed as simply as possible…
The title of the table is flush left at the top of the page. "Table" is followed by a space, the table number, and a period. This is followed by two spaces and then the title of the table, with initial capital letters for all important words, and no period.

CriminologyTables should have no borders or shading. This will be added during composition. Set the first column heading and column flush left; other headings and columns can be arranged in whatever format best presents the data, so long as all data within a column are aligned with the heading and with other data in the column.
Consult a recent issue of Criminology for style and placement of general notes to the table, specific footnotes, and the source.
Demography
Tables are numbered consecutively in the order in which they are cited. Thus each table must be cited in the text. …Sometimes a straddle heading is appropriate to avoid repeating the same word in two column heads.
Avoid using bold or italic type within the body of the table.Separate headings from the title using a horizontal rule covering the width of the table; separate straddle heads from the column heads using a single horizontal rule straddling only the pertinent columns; separate column heads from the body using a horizontal rule covering the entire width of the table. Do not use vertical rules anywhere in the table; do not use horizontal rules in the body of the table. Close the body of the table with a single horizontal rule covering the width of the table.

American Journal of SociologyTables should be numbered consecutively as they appear in text. AJS strongly prefers that authors number discrete items separately (table 1, 2, 3, 4, etc.) as opposed to grouping items together (table 1, table 2a, 2b, 2c). Appendix tables are numbered table A1, A2, or table B1, B2, and so on. AJS frowns on the use of font in tables (i.e., bold or italic to mark a specific cell) and avoids the use of “panel” to refer to a specific group of table entries. AJS requires that you collect tables together at the back of your manuscript rather than placing them where cited in the text.
Journal of Marriage and Family
Generally follows APAGives templates for tables
Follow rules set out by specific journal
If rules are vague or you have a different audience, there are some general rules you can keep in mind…
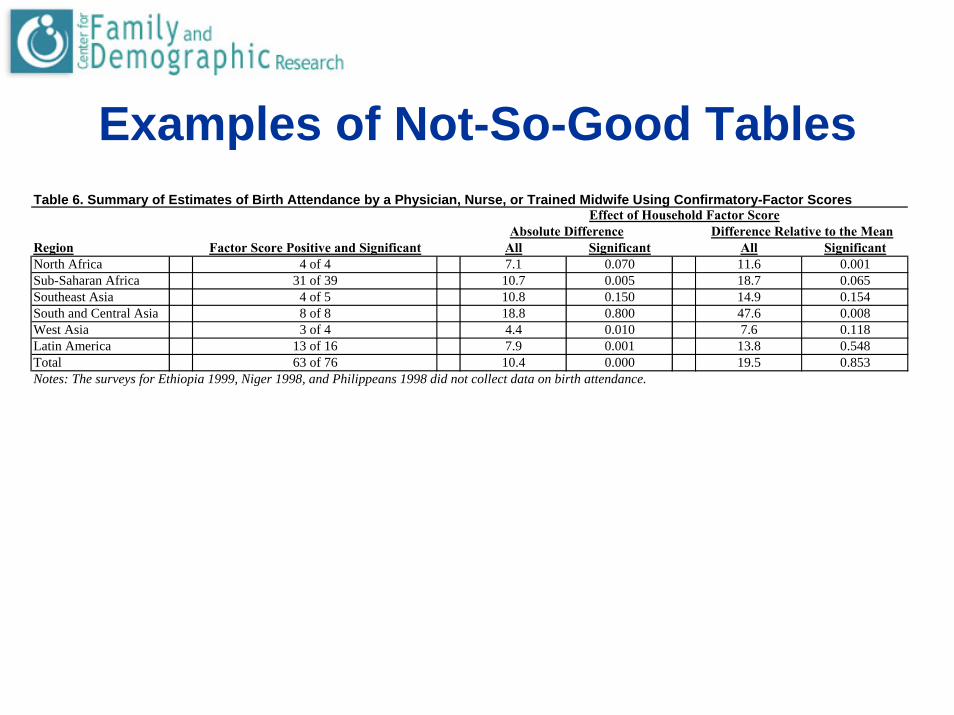
Examples of Not-So-Good TablesTable 6. Summary of Estimates of Birth Attendance by a Physician, Nurse, or Trained Midwife Using Confirmatory-Factor Scores
Region Factor Score Positive and Significant All Significant All SignificantNorth Africa 4 of 4 7.1 0.070 11.6 0.001Sub-Saharan Africa 31 of 39 10.7 0.005 18.7 0.065Southeast Asia 4 of 5 10.8 0.150 14.9 0.154South and Central Asia 8 of 8 18.8 0.800 47.6 0.008West Asia 3 of 4 4.4 0.010 7.6 0.118Latin America 13 of 16 7.9 0.001 13.8 0.548Total 63 of 76 10.4 0.000 19.5 0.853Notes: The surveys for Ethiopia 1999, Niger 1998, and Philippeans 1998 did not collect data on birth attendance.
Effect of Household Factor ScoreAbsolute Difference Difference Relative to the Mean

Open Excel– Open Excel Examples file
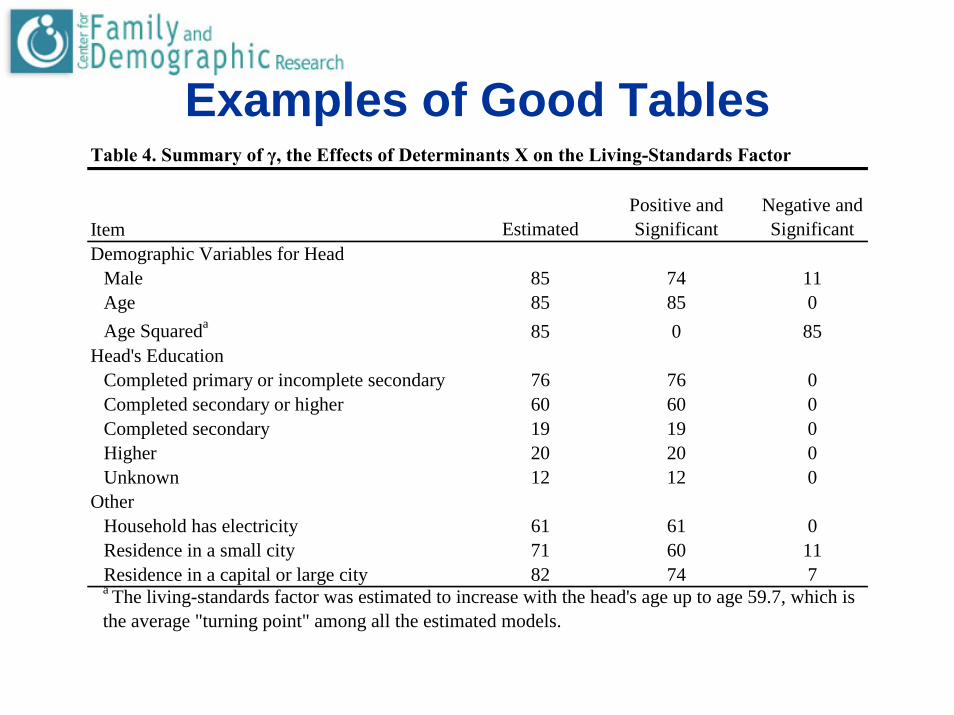
Examples of Good Tables
Item EstimatedPositive and Significant
Negative and Significant
Demographic Variables for HeadMale 85 74 11Age 85 85 0Age Squareda 85 0 85
Head's EducationCompleted primary or incomplete secondary 76 76 0Completed secondary or higher 60 60 0Completed secondary 19 19 0Higher 20 20 0Unknown 12 12 0
OtherHousehold has electricity 61 61 0Residence in a small city 71 60 11Residence in a capital or large city 82 74 7
Table 4. Summary of γ, the Effects of Determinants X on the Living-Standards Factor
a The living-standards factor was estimated to increase with the head's age up to age 59.7, which is the average "turning point" among all the estimated models.
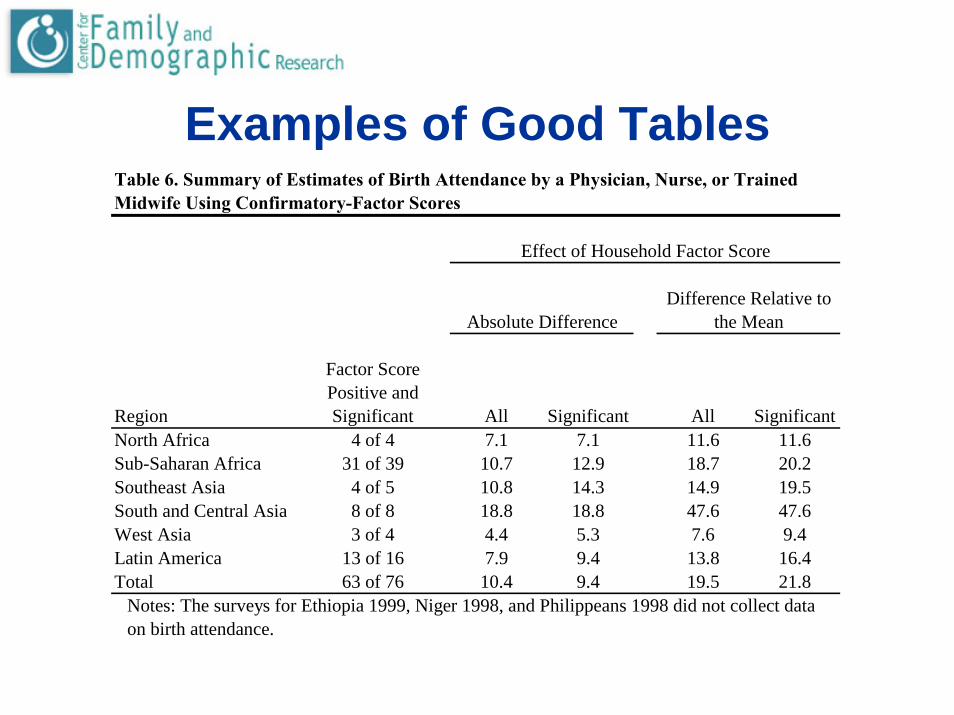
Examples of Good Tables
Region
Factor Score Positive and Significant All Significant All Significant
North Africa 4 of 4 7.1 7.1 11.6 11.6Sub-Saharan Africa 31 of 39 10.7 12.9 18.7 20.2Southeast Asia 4 of 5 10.8 14.3 14.9 19.5South and Central Asia 8 of 8 18.8 18.8 47.6 47.6West Asia 3 of 4 4.4 5.3 7.6 9.4Latin America 13 of 16 7.9 9.4 13.8 16.4Total 63 of 76 10.4 9.4 19.5 21.8
Table 6. Summary of Estimates of Birth Attendance by a Physician, Nurse, or Trained Midwife Using Confirmatory-Factor Scores
Notes: The surveys for Ethiopia 1999, Niger 1998, and Philippeans 1998 did not collect data on birth attendance.
Absolute DifferenceDifference Relative to
the Mean
Effect of Household Factor Score
Examples of Good Tables
So how do we get from having a whole jumble of data to a nice, organized table?

Excel Basics
Entering data– Raw data
Formatting– Merging– Alignment– Decimals
Inserting & Deleting
Advanced Excel Moves
Borders & LinesFormulas (“Functions”)– Summing– Mean/Median/Mode– Minimum/Maximum
Entering Data
Bringing in data from SAS

Excel
Make sure SAS is set-up for HTML output (before running program)1. tools…2. options…3. preferences…4. results…5. create HTML (check box)
Folder (desktop or work folder)Style Minimal
Excel
Two ways to get output into Excel1. Open with Excel
1. Once HTML output is generated, go to file (on desktop if you save there)
2. Right-click on file, click on Open with3. Choose Excel

Excel
Two ways to get output into Excel2. Copy and paste from HTML output
Excel Word
How can I put my table into Word?– Highlight cells you want copied– Copy (Edit, Copy OR CTRL C)– Open Word document – Paste (Edit, Paste OR Edit, Paste Special)
Many options…

Creating Tables in Word
Table, Insert Table

Presented by:Center for Family and Demographic
Research009 Williams Hall(419) 372-7279
Additional Sources:JournalsDemography
Journal of Marriage and the Family
www.microsoft.com