Making Policy Maps for Your Community - Esri...A map of data: Sidewalks: Walkability Opportunities A...
14
Making Policy Maps for Your Community Jennifer Bell and Julia Holtzclaw
Making Policy Maps for Your Community - Esri...A map of data: Sidewalks: Walkability Opportunities A policy map: Walkability Sidewalk Connectivity Julia:\爀匀栀漀爀琀† 搀攀洀漠ᴀ
Making Policy Maps for Your CommunityJennifer Bell and Julia Holtzclaw
Presenter
Presentation Notes
http://esriurl.com/communitypolicymaps
Introduction
• Living Atlas Team – A source of layers and inspiration for policy maps• Contribute content and finished layers/maps for the GIS community
• Overview:- What is a policy map?- Examples- Demo- Questions
Presenter
Presentation Notes
Introduce ourselves – Julia and Jenn Julia: Check out Living Atlas etc Jenn: Overview of the presentation
What is a policy map?
What is a policy map?
1. Illuminate the problem
2. Propose policy's solution / desired effect
3. Measure against the original goal
Have you ever made a map for policy
makers?
Presenter
Presentation Notes
Julia Data mapped to clearly illuminate the issue at hand Resonates with the reader Jenn Here’s a quick example: http://urbanobservatory.maps.arcgis.com/apps/Cascade/index.html?appid=1de17557401a4ecb8d8c0766d3f453e0
What is a policy map?“A policy map is a map where the opportunity to intervene is made clear.”- Stephen Goldsmith, December 2015
A map of data: Sidewalks: Walkability Opportunities A policy map: Walkability Sidewalk Connectivity
Presenter
Presentation Notes
Julia: Short “demo” showing walkability example What is the difference between these two? Why is one a policy map and the other is not? Walkability map shows sidewalk gaps and connectivity areas > Clear action plan
3. Take advantage of GIS resources such as Living Atlas of the World
Presenter
Presentation Notes
Jenn Map should be toned down (Less is More) > only showing what is important Important to cite data source > Authoritive sources such as government or non profit orgs *Be aware of the audience… Policy makers usually are not GIS professionals* Wreck a good map with too much information
Examples of Policy Maps
Clean Streets Index
• Available in the Living Atlas• Initiative from Los Angeles to clean the streets• Identifies the issue with measurable goal to improve street cleanliness
Presenter
Presentation Notes
Julia: Map identifies problem, sets goal> implemented policy to meet these goals A year after Clean Stat's implementation, the LA Times released an article applauding improvement. http://www.latimes.com/local/lanow/la-me-ln-garcetti-back-to-basics-20170224-story.html Policy mapping in action!
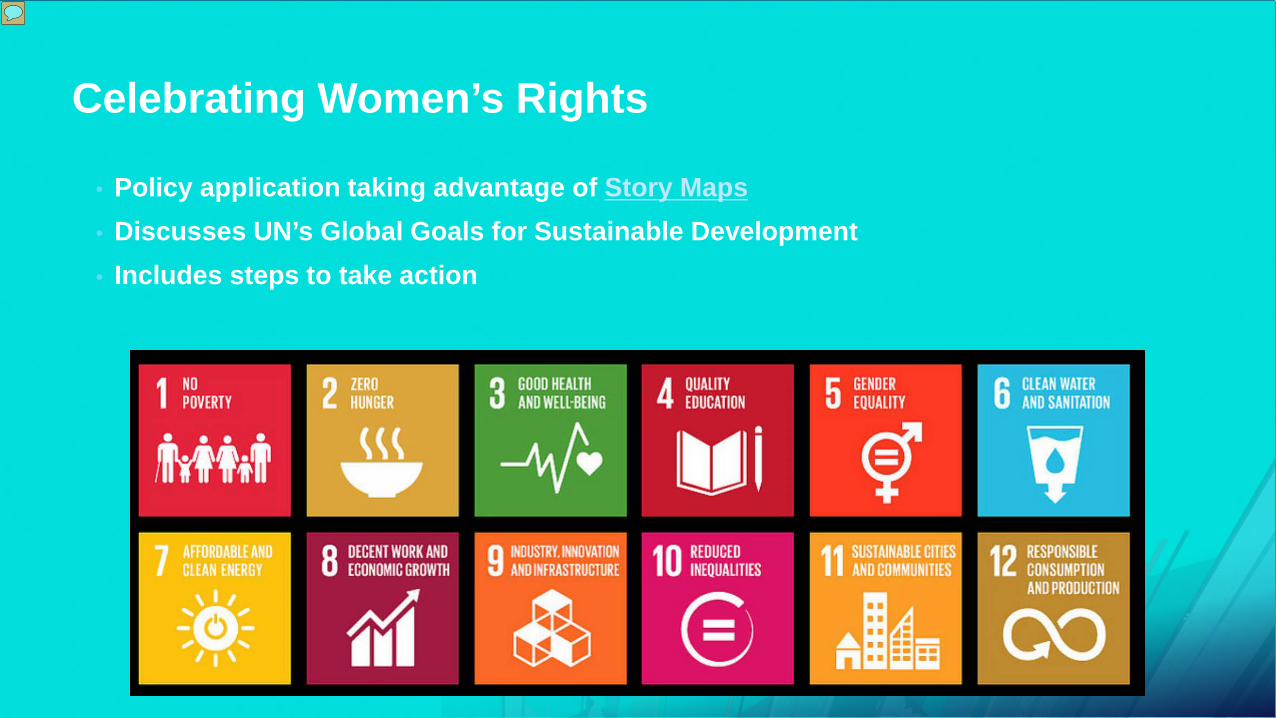
• Policy application taking advantage of Story Maps• Discusses UN’s Global Goals for Sustainable Development• Includes steps to take action
Presenter
Presentation Notes
Jenn: Application identifies the problem, shares the measurable goals on how to improve equality. Global health has indicator of 70 per 100,000 as goal for maternal mortality ratio Web map has above and below: http://urbanobservatory.maps.arcgis.com/home/webmap/viewer.html?webmap=fd13aaa4abfd471bb4d1334652ea43d5 Contains action information for user > good policy maps contain call to action
• Mapping how medication is prescribed – Identifies issue geographically• Mapping change – Measures areas with improvements or decline against goal• Influences policy and law implementations to address problem at local level
Presenter
Presentation Notes
Julia: Mapping how medication is prescribed – Identifies issue geographically Mapping change – Measures areas with improvements or decline against goal Influences policy and law implementations to address problem at local level http://urbanobservatory.maps.arcgis.com/apps/Cascade/index.html?appid=f86499d99e4340b68229eaccfb02b29f
DemoMaking Policy Maps
Presenter
Presentation Notes
Both! Superfund Site example: http://urbanobservatory.maps.arcgis.com/home/webmap/viewer.html?webmap=07b4737c79954d169241bdc006cdd2f9 Goals: -Is the site in floodzone? -How many people live within 1 mile buffer? -What is the score? Over 40 is bad Steps: AGOL and LAW intro Start with Topo and show how to add human geography dark basemap Start with your organization's superfund layer Add USA Flood Risk from ArcGIS Online (not in LAW) > purple one that is a map image layer Geoenrich the superfund locations to add total population Find existing locations with populations >1000 and score of 40+ and within 1 mile of flood zones Create web app to share using minimalist > show metadata and simple tricks to make policy map simple and easy to understand
Summary
Policy maps:1. Show the problem
2. Propose policy’s goal/solution
3. Measure against the original goal
Questions?
http://esriurl.com/communitypolicymaps
Presenter
Presentation Notes
Julia To access this url go to … http://esriurl.com/communitypolicymaps