Embed Size (px)
Citation preview
< # >
Making Retirement Income Work
David Blanchett, CFA, CFP®, AIFA® Research Consultant Morningstar Investment Management
© 2012 Morningstar. All Rights Reserved. These materials are for information and/or illustration purposes only. Morningstar Investment Management is a division of Morningstar which includes Morningstar Associates, LLC, Morningstar Investment Services, Inc., and Ibbotson Associates, Inc., all registered investment advisors and wholly owned subsidiaries of Morningstar, Inc. All investment advisory services described herein are provided by one or more of the registered investment advisor subsidiaries. The Morningstar name and logo are registered marks of Morningstar. This presentation includes proprietary materials of Morningstar. Reproduction, transcription or other use, by any means, in whole or in part, without the prior, written consent of Morningstar is prohibited.
2 For financial professional use only. See Slide 64 for important disclosures
Agenda
× Key Retiree Risks × Annuities × Non-Guaranteed Options × Modeling Considerations × Dynamic Withdrawal Strategies × Conclusions × Questions
3 For financial professional use only. See Slide 64 for important disclosures
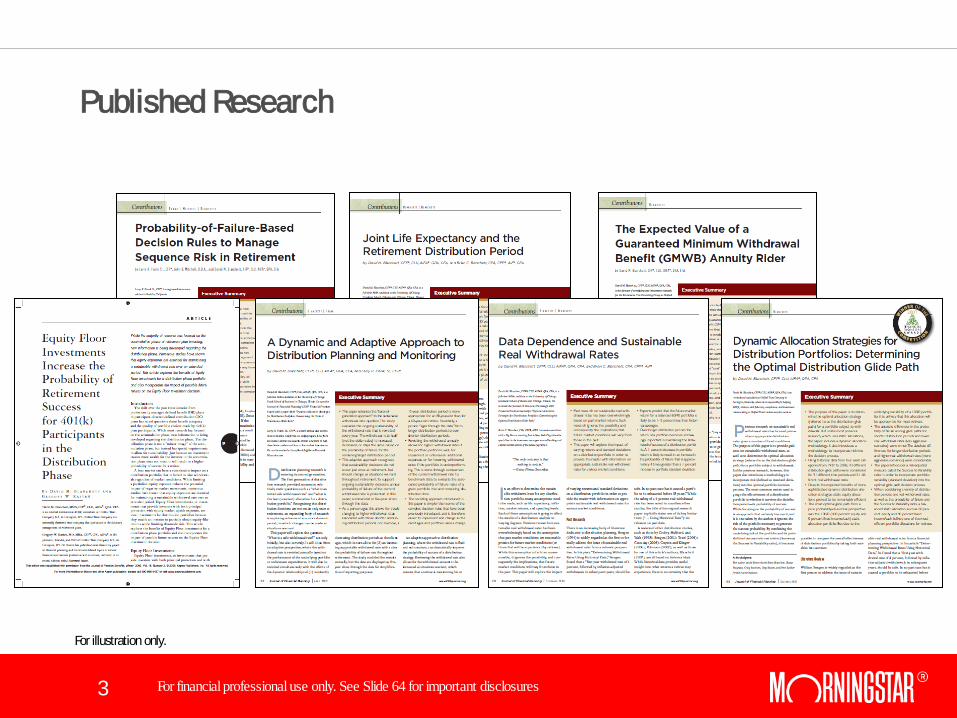
Published Research
For illustration only.
4 For financial professional use only. See Slide 64 for important disclosures
Selected Working Papers
a Morningstar company
Optimal Portfolio Allocations with GMWB Annuities
Exploring the Benefits of Immediate Annuities
Determining the Optimal Portfolio Withdrawal Strategy Using Perfect Information
Working Paper
David M. Blanchett, CFA Research Consultant
Working Paper
David M. Blanchett, CFA Research Consultant
Working Paper
David M. Blanchett, CFA Research Consultant
a Morningstar company a Morningstar company
For illustration only.
5 For financial professional use only. See Slide 64 for important disclosures
Key Retiree Risks
6 For financial professional use only. See Slide 64 for important disclosures
For illustration only.
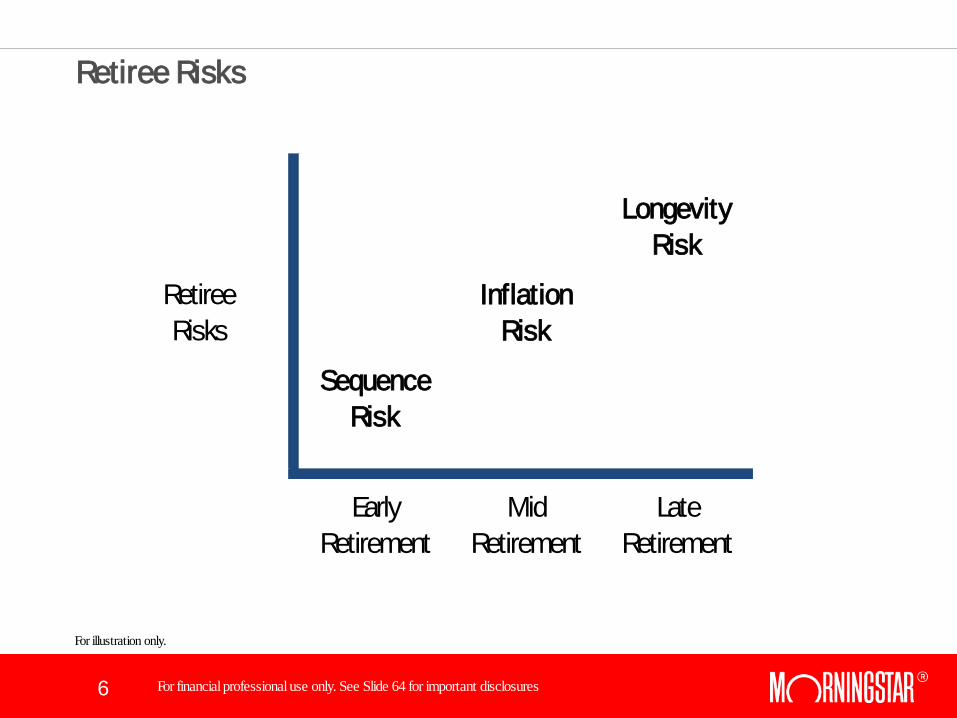
Longevity Risk
Retiree Risks
Inflation Risk
Sequence Risk
Early Retirement
Mid Retirement
Late Retirement
Retiree Risks

7 For financial professional use only. See Slide 64 for important disclosures
Sequence Risk
8 For financial professional use only. See Slide 64 for important disclosures
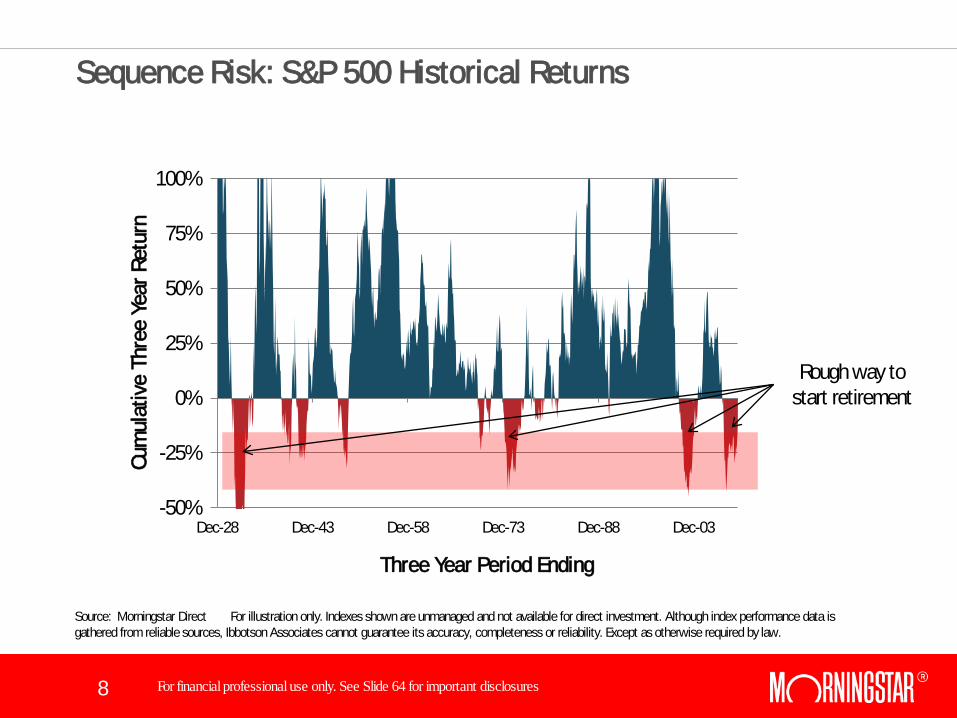
Sequence Risk: S&P 500 Historical Returns
Source: Morningstar Direct For illustration only. Indexes shown are unmanaged and not available for direct investment. Although index performance data is gathered from reliable sources, Ibbotson Associates cannot guarantee its accuracy, completeness or reliability. Except as otherwise required by law.
-50%
-25%
0%
25%
50%
75%
100%
Dec-28 Dec-43 Dec-58 Dec-73 Dec-88 Dec-03
Cum
ulat
ive
Thre
e Ye
ar R
etur
n
Three Year Period Ending
Rough way to start retirement
9 For financial professional use only. See Slide 64 for important disclosures
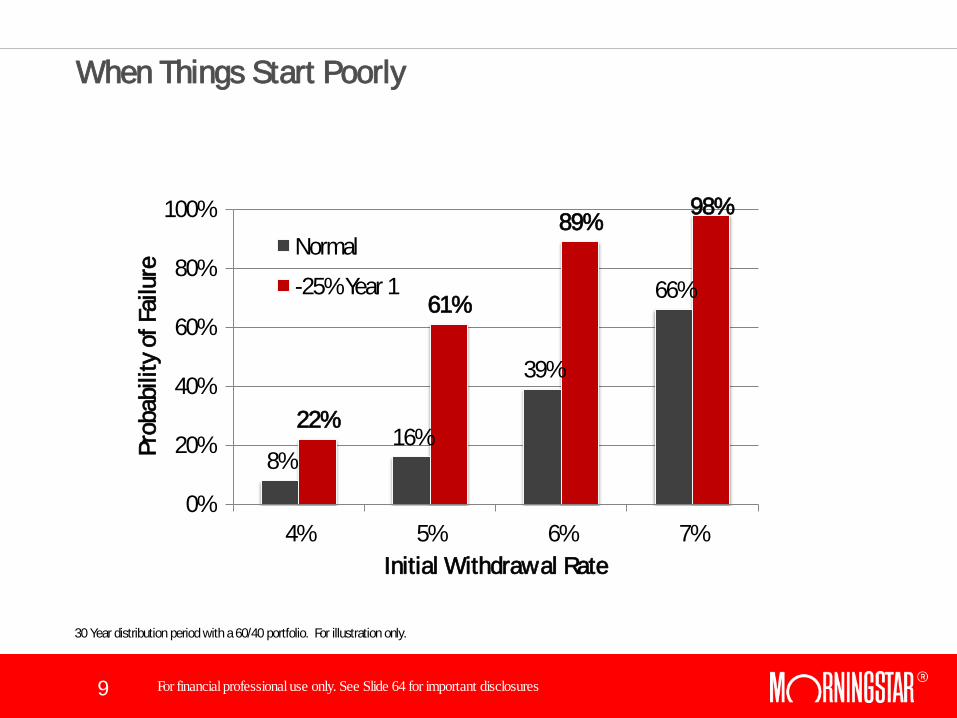
When Things Start Poorly
30 Year distribution period with a 60/40 portfolio. For illustration only.
8% 16%
39%
66%
22%
61%
89% 98%
0%
20%
40%
60%
80%
100%
4% 5% 6% 7%
Prob
abili
ty o
f Fai
lure
Initial Withdrawal Rate
Normal -25% Year 1
10 For financial professional use only. See Slide 64 for important disclosures
Why Are Retirement Portfolios Aggressive?
× Allocations are “optimized” where optimal is based on achieving some “probability of success”
× “Probability of success” is an incomplete measure because it does not include the potential risk of a portfolio and does not distinguish in magnitude of failure
× A very “black and white” perspective of a very colorful decision
11 For financial professional use only. See Slide 64 for important disclosures
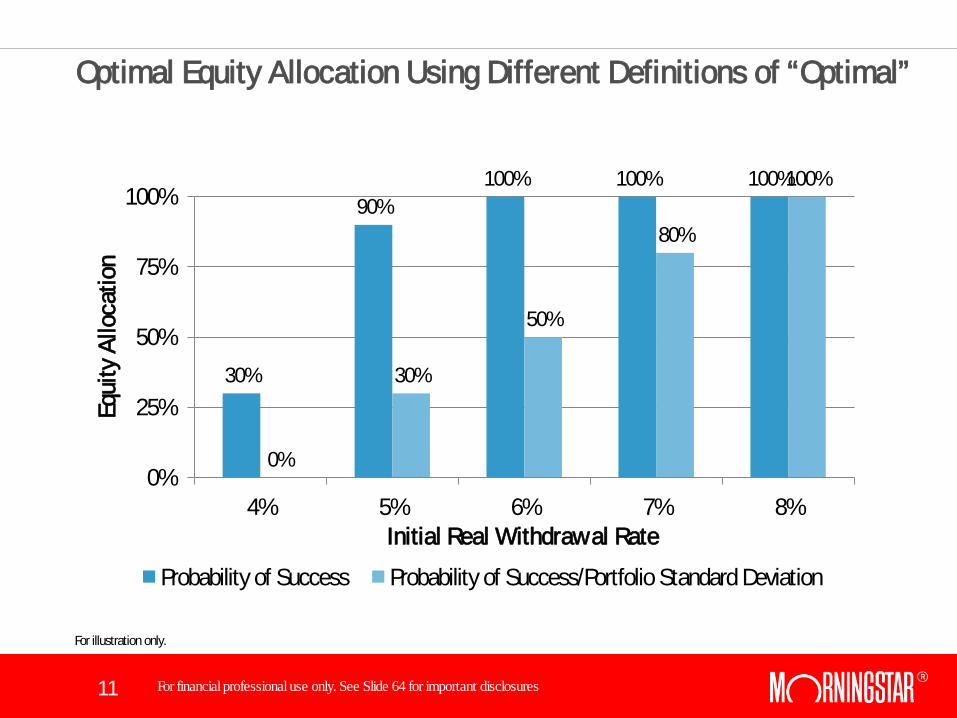
Optimal Equity Allocation Using Different Definitions of “Optimal”
30%
90% 100% 100% 100%
0%
30%
50%
80%
100%
0%
25%
50%
75%
100%
4% 5% 6% 7% 8%
Equi
ty A
lloca
tion
Initial Real Withdrawal Rate
Probability of Success Probability of Success/Portfolio Standard Deviation
For illustration only.
12 For financial professional use only. See Slide 64 for important disclosures
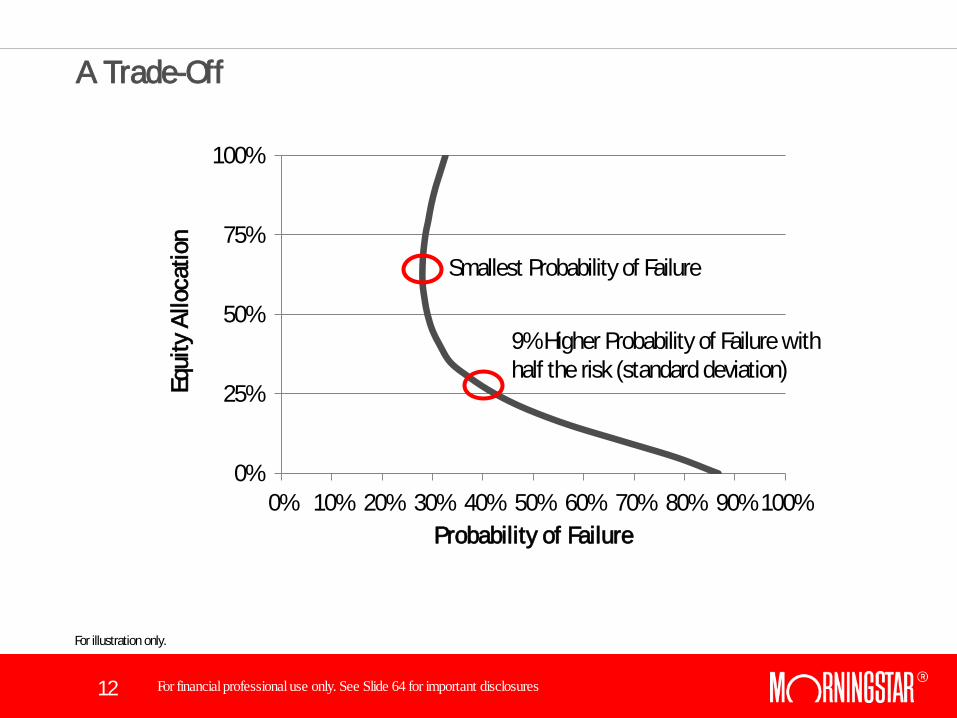
A Trade-Off
0%
25%
50%
75%
100%
0% 10% 20% 30% 40% 50% 60% 70% 80% 90% 100%
Equi
ty A
lloca
tion
Probability of Failure
9% Higher Probability of Failure with half the risk (standard deviation)
Smallest Probability of Failure
For illustration only.

13 For financial professional use only. See Slide 64 for important disclosures
Acceptable Success Rates?
More Income More Safety vs

14 For financial professional use only. See Slide 64 for important disclosures
Inflation Risk
15 For financial professional use only. See Slide 64 for important disclosures
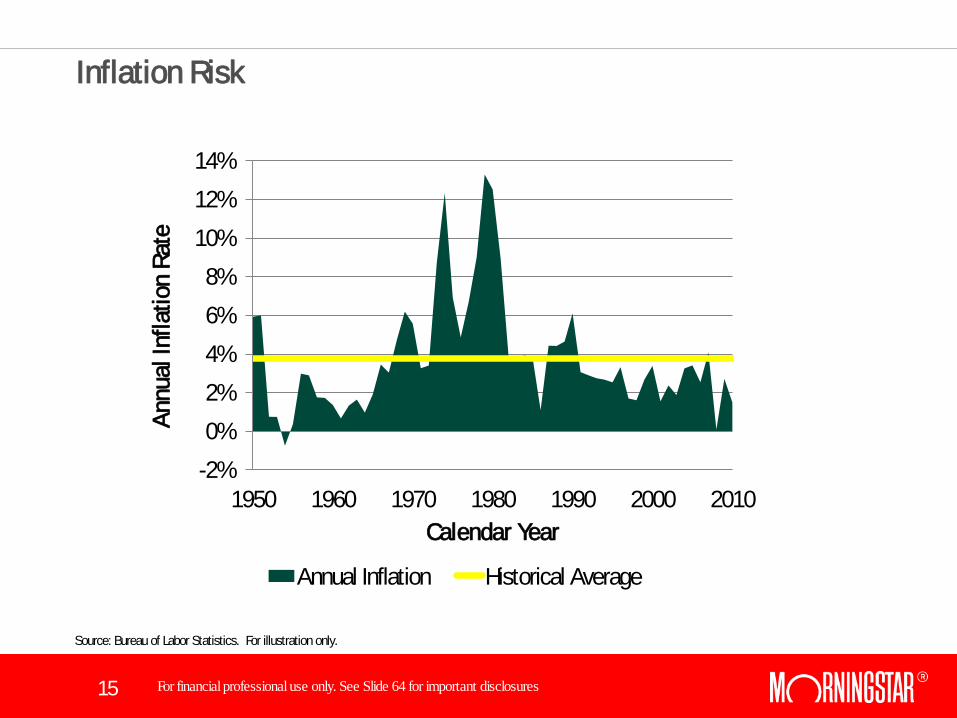
Inflation Risk
Source: Bureau of Labor Statistics. For illustration only.
-2% 0% 2% 4% 6% 8%
10% 12% 14%
1950 1960 1970 1980 1990 2000 2010
Annu
al In
flatio
n Ra
te
Calendar Year
Annual Inflation Historical Average
16 For financial professional use only. See Slide 64 for important disclosures
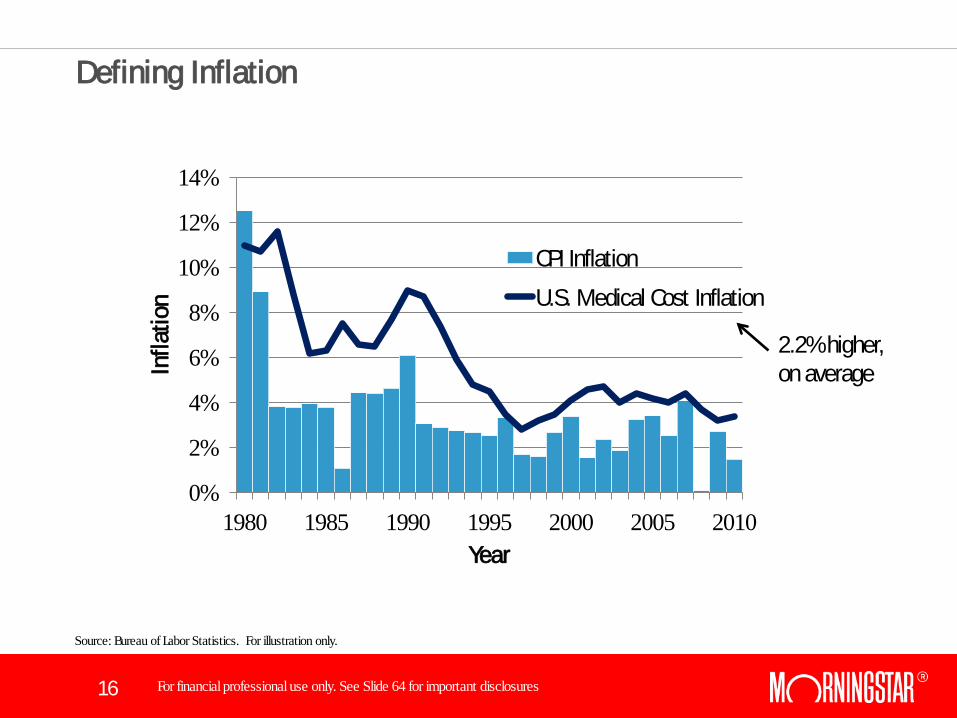
Source: Bureau of Labor Statistics. For illustration only.
0%
2%
4%
6%
8%
10%
12%
14%
1980 1985 1990 1995 2000 2005 2010
Infla
tion
Year
CPI Inflation U.S. Medical Cost Inflation
2.2% higher, on average
Defining Inflation
17 For financial professional use only. See Slide 64 for important disclosures
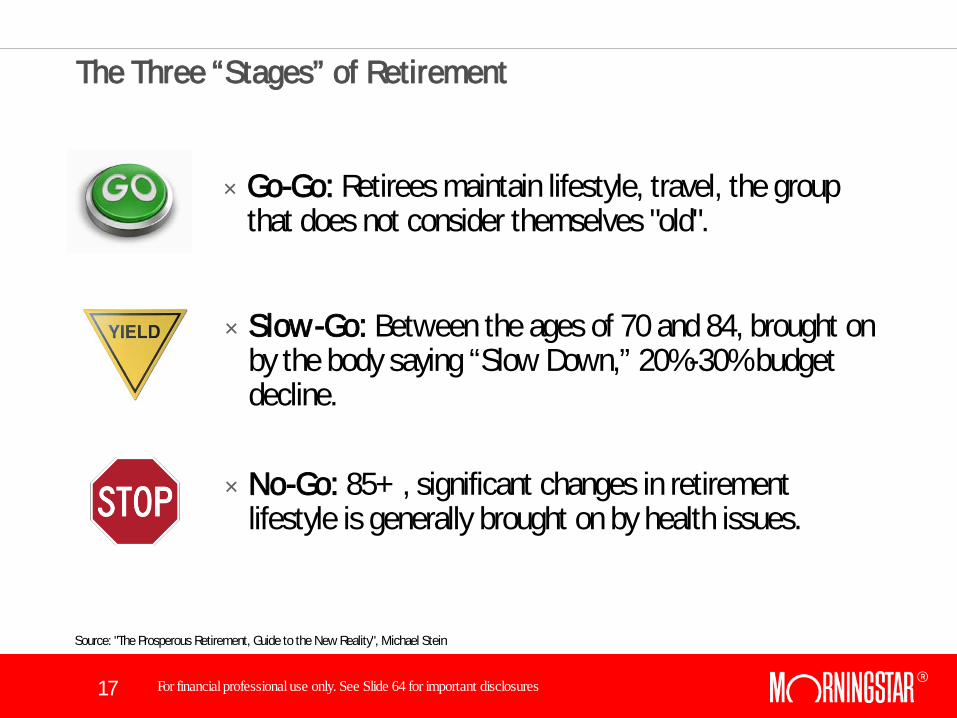
The Three “Stages” of Retirement
× Go-Go: Retirees maintain lifestyle, travel, the group that does not consider themselves "old".
Source: "The Prosperous Retirement, Guide to the New Reality", Michael Stein
× Slow-Go: Between the ages of 70 and 84, brought on by the body saying “Slow Down,” 20%-30% budget decline.
× No-Go: 85+ , significant changes in retirement lifestyle is generally brought on by health issues.

18 For financial professional use only. See Slide 64 for important disclosures
Longevity Risk
19 For financial professional use only. See Slide 64 for important disclosures
Longevity Risk
20 For financial professional use only. See Slide 64 for important disclosures
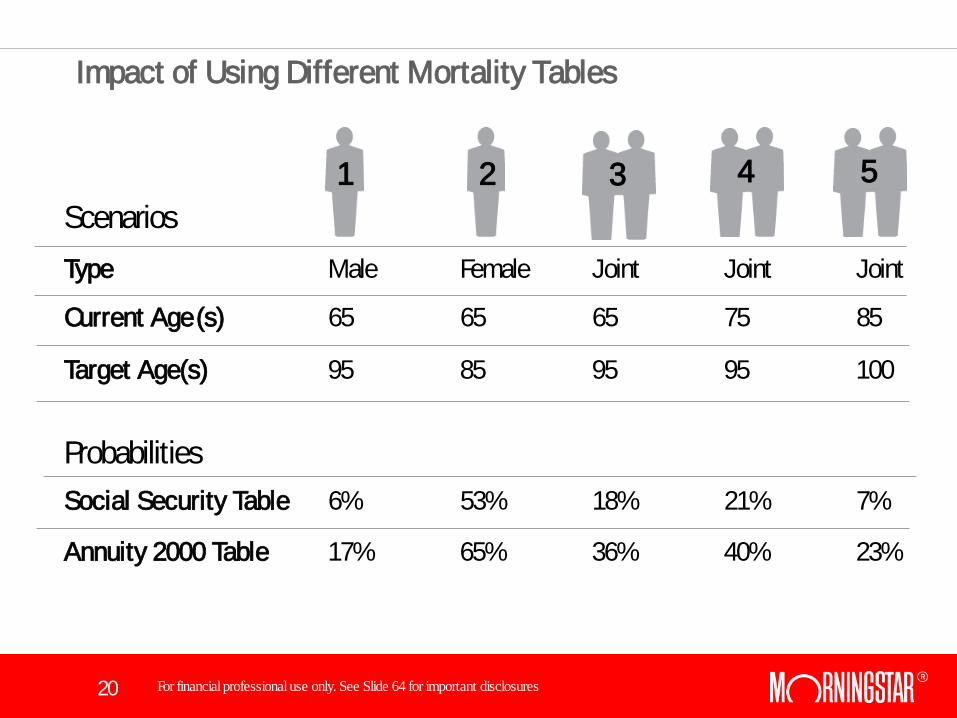
Impact of Using Different Mortality Tables
Type Male Female Joint Joint Joint
Current Age (s) 65 65 65 75 85
Target Age(s) 95 85 95 95 100
1 2 3 4 5
Social Security Table 6% 53% 18% 21% 7%
Annuity 2000 Table 17% 65% 36% 40% 23%
Scenarios
Probabilities
21 For financial professional use only. See Slide 64 for important disclosures
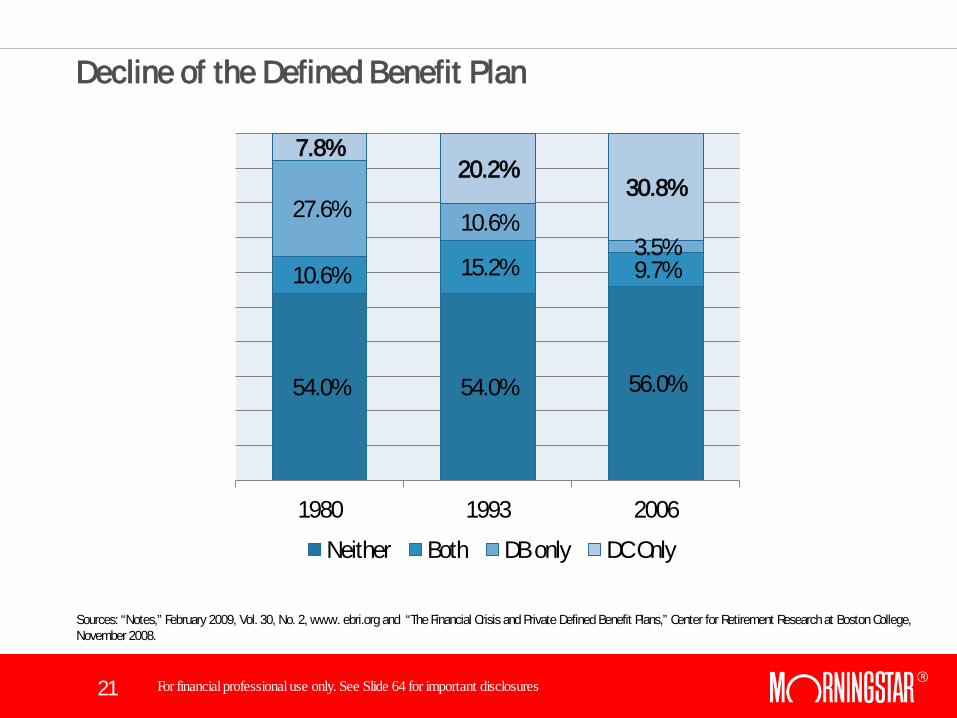
Decline of the Defined Benefit Plan
54.0% 54.0% 56.0%
10.6% 15.2% 9.7%
27.6% 10.6% 3.5%
7.8% 20.2%
30.8%
1980 1993 2006
Neither Both DB only DC Only
Sources: “Notes,” February 2009, Vol. 30, No. 2, www. ebri.org and “The Financial Crisis and Private Defined Benefit Plans,” Center for Retirement Research at Boston College, November 2008.
22 For financial professional use only. See Slide 64 for important disclosures
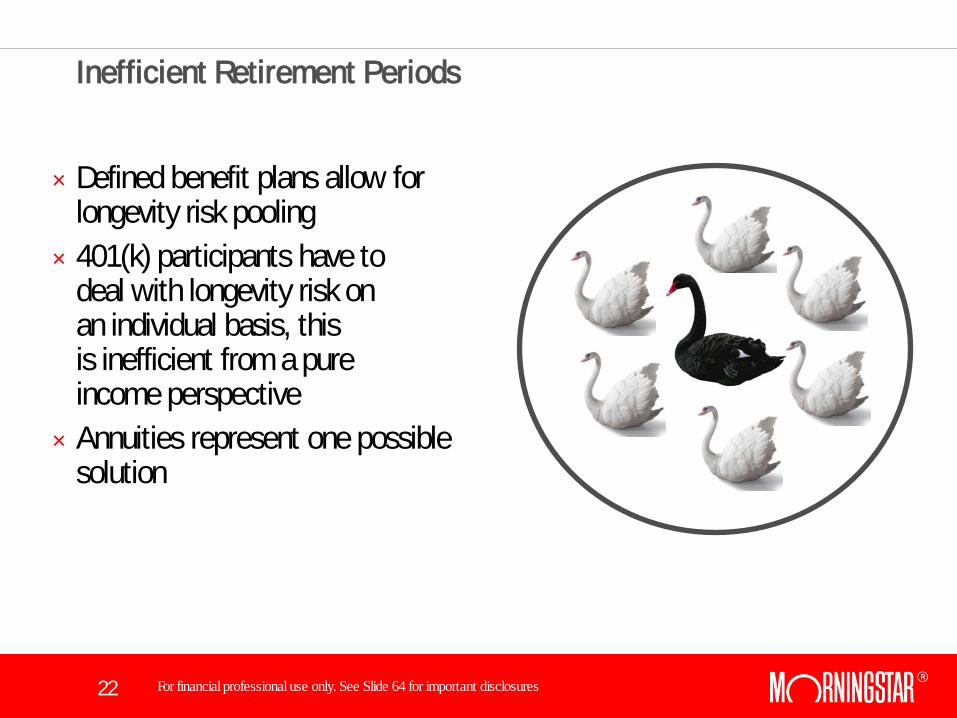
Inefficient Retirement Periods
× Defined benefit plans allow for longevity risk pooling
× 401(k) participants have to deal with longevity risk on an individual basis, this is inefficient from a pure income perspective
× Annuities represent one possible solution

23 For financial professional use only. See Slide 64 for important disclosures
Annuities

24 For financial professional use only. See Slide 64 for important disclosures
Who Cares About Lifetime Income?
25 For financial professional use only. See Slide 64 for important disclosures
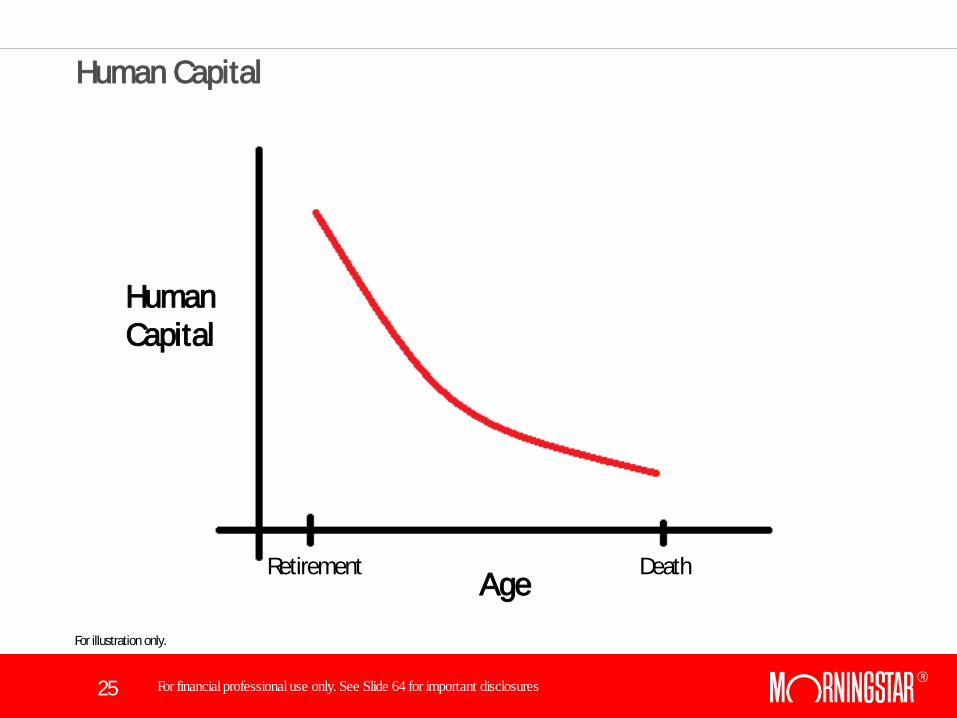
Human Capital
Retirement Death Age
Human Capital
For illustration only.
26 For financial professional use only. See Slide 64 for important disclosures
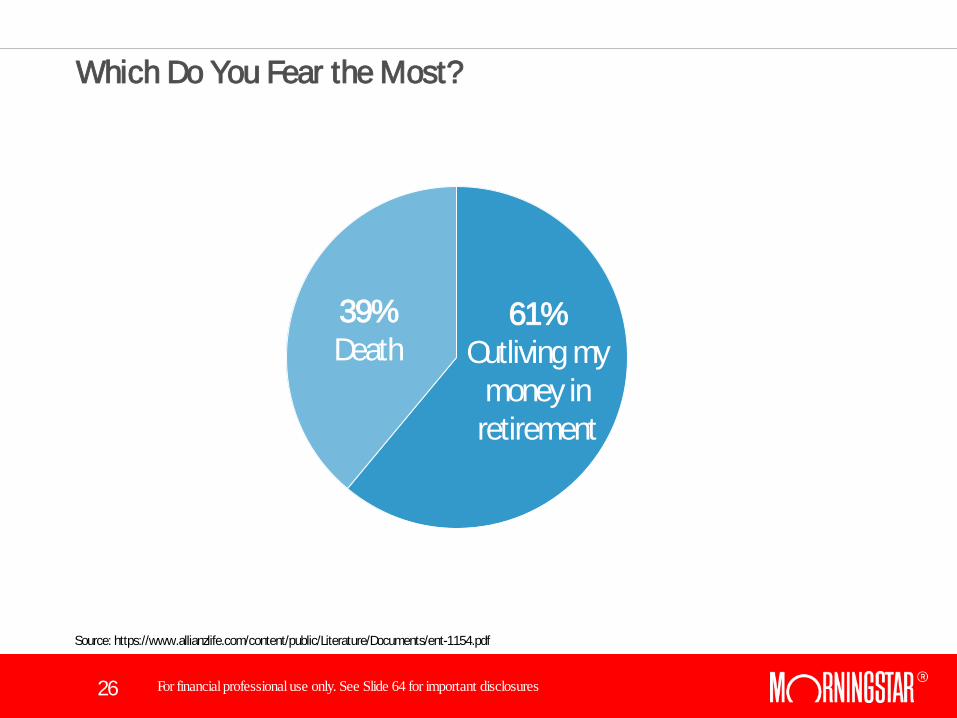
Which Do You Fear the Most?
61% Outliving my
money in retirement
39% Death
Source: https://www.allianzlife.com/content/public/Literature/Documents/ent-1154.pdf

27 For financial professional use only. See Slide 64 for important disclosures
The Annuity Puzzle
Source: Modigliani, Franco. 1986. “Life Cycle, Individual Thrift, and the Wealth of Nations.” American Economic Review, 76(3): 297–313.
× Franco Modigliani noted the “annuitization puzzle” in his 1985 Nobel acceptance speech
× A survey conducted by Allianz Life Insurance Company of North America (Allianz Life) noted that more than half (nearly 54%) of Americans aged 44-75 expressed distaste for the word “annuity”
× This is despite the fact 80% of the more than 3,200 surveyed preferred a product with four percent return and a guarantee against losing value over a product with eight percent return and subject to market risk. Source: https://www.allianzlife.com/content/public/Literature/Documents/ent-1154.pdf

28 For financial professional use only. See Slide 64 for important disclosures
Do You Feel Lucky?
29 For financial professional use only. See Slide 64 for important disclosures
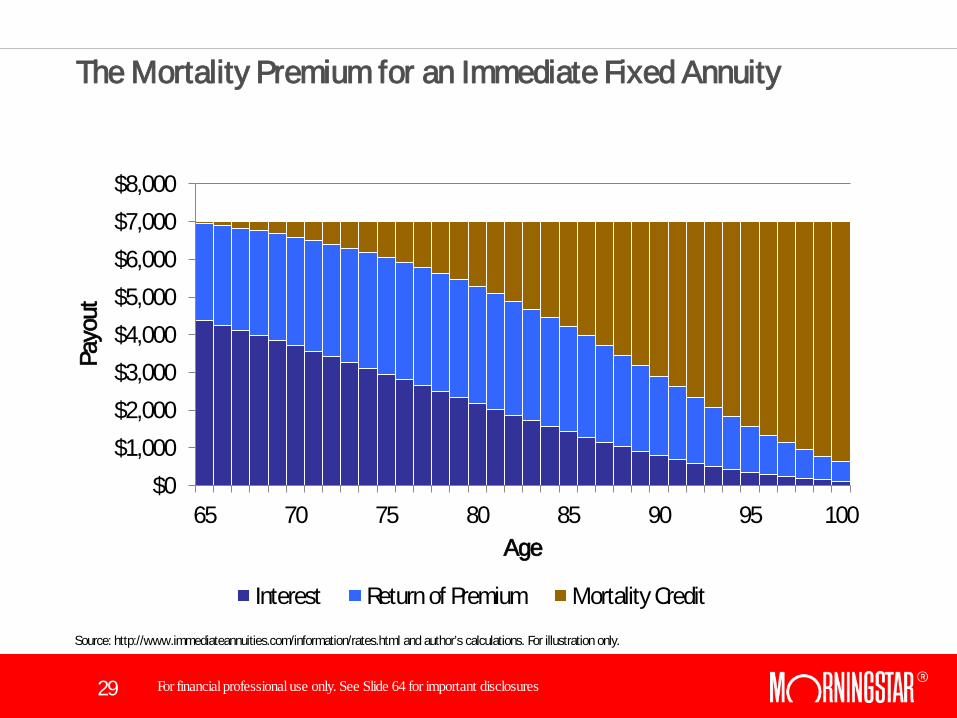
The Mortality Premium for an Immediate Fixed Annuity
Source: http://www.immediateannuities.com/information/rates.html and author’s calculations. For illustration only.
$0 $1,000 $2,000 $3,000 $4,000 $5,000 $6,000 $7,000 $8,000
65 70 75 80 85 90 95 100
Payo
ut
Age
Interest Return of Premium Mortality Credit
30 For financial professional use only. See Slide 64 for important disclosures
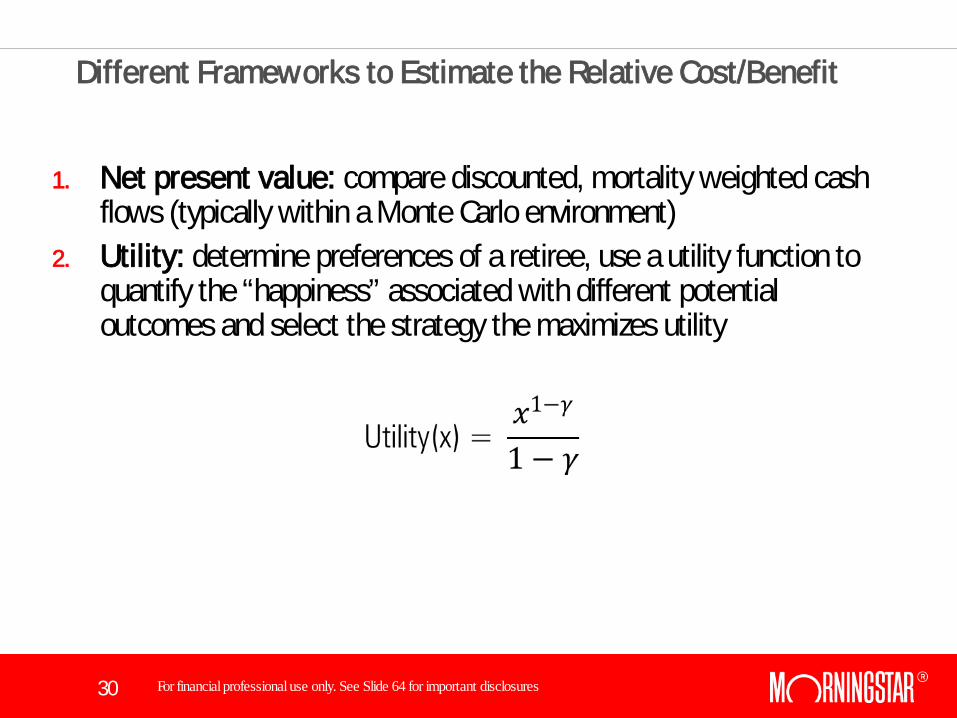
Different Frameworks to Estimate the Relative Cost/Benefit
1. Net present value: compare discounted, mortality weighted cash flows (typically within a Monte Carlo environment)
2. Utility: determine preferences of a retiree, use a utility function to quantify the “happiness” associated with different potential outcomes and select the strategy the maximizes utility
31 For financial professional use only. See Slide 64 for important disclosures
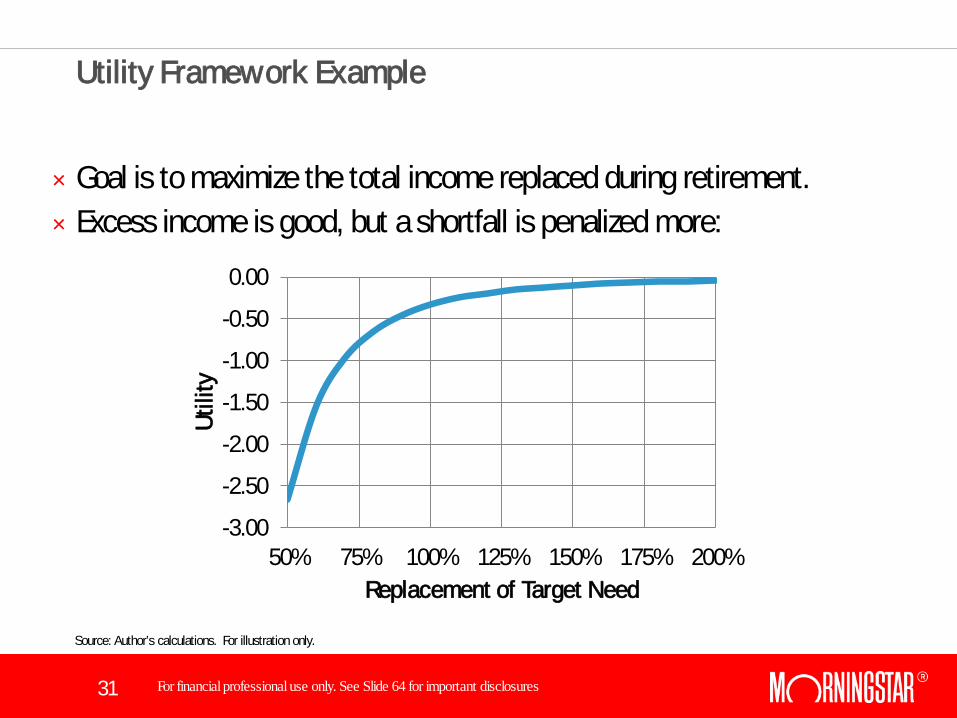
Utility Framework Example
× Goal is to maximize the total income replaced during retirement. × Excess income is good, but a shortfall is penalized more:
-3.00
-2.50
-2.00
-1.50
-1.00
-0.50
0.00
50% 75% 100% 125% 150% 175% 200%
Utili
ty
Replacement of Target Need
Source: Author’s calculations. For illustration only.
32 For financial professional use only. See Slide 64 for important disclosures
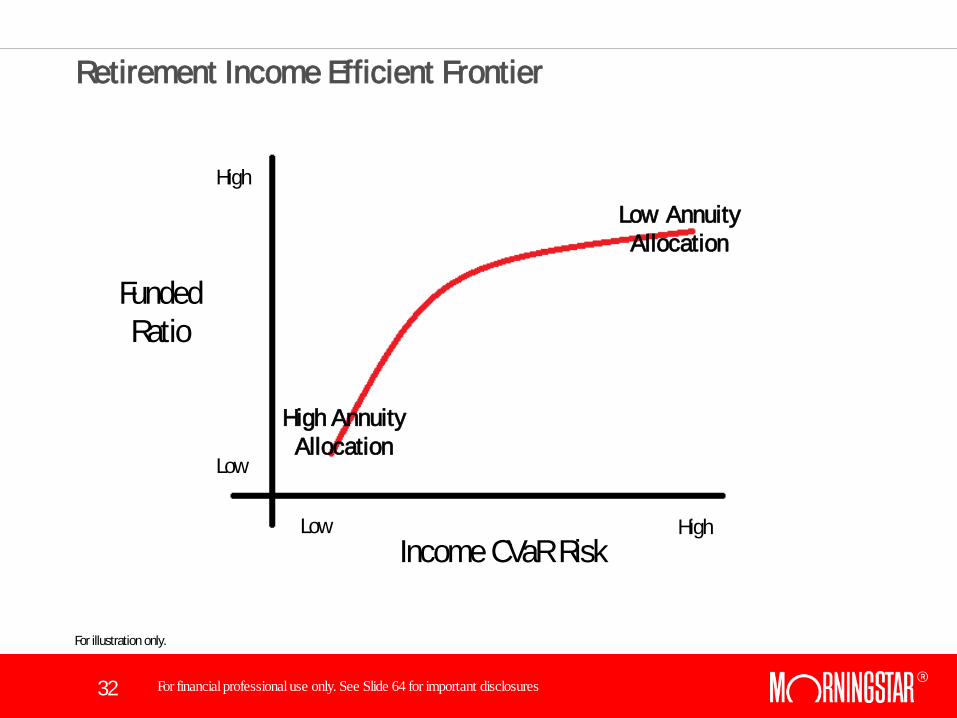
Retirement Income Efficient Frontier
Income CVaR Risk
Funded Ratio
Low
Low
High
High
Low Annuity Allocation
High Annuity Allocation
For illustration only.
33 For financial professional use only. See Slide 64 for important disclosures
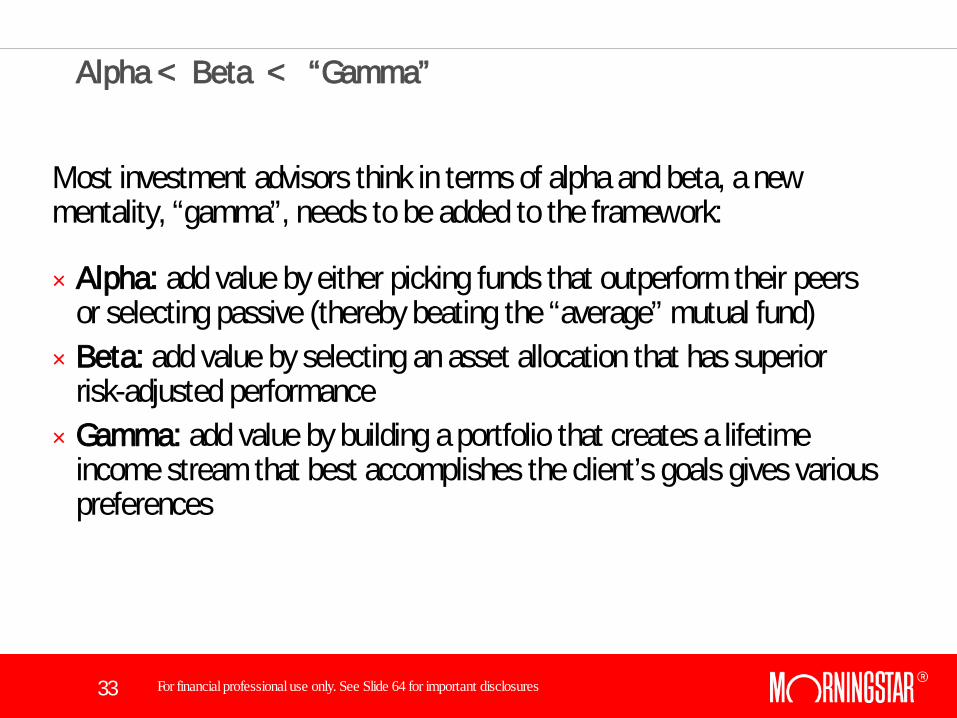
Alpha < Beta < “Gamma”
Most investment advisors think in terms of alpha and beta, a new mentality, “gamma”, needs to be added to the framework:
× Alpha: add value by either picking funds that outperform their peers or selecting passive (thereby beating the “average” mutual fund)
× Beta: add value by selecting an asset allocation that has superior risk-adjusted performance
× Gamma: add value by building a portfolio that creates a lifetime income stream that best accomplishes the client’s goals gives various preferences
34 For financial professional use only. See Slide 64 for important disclosures
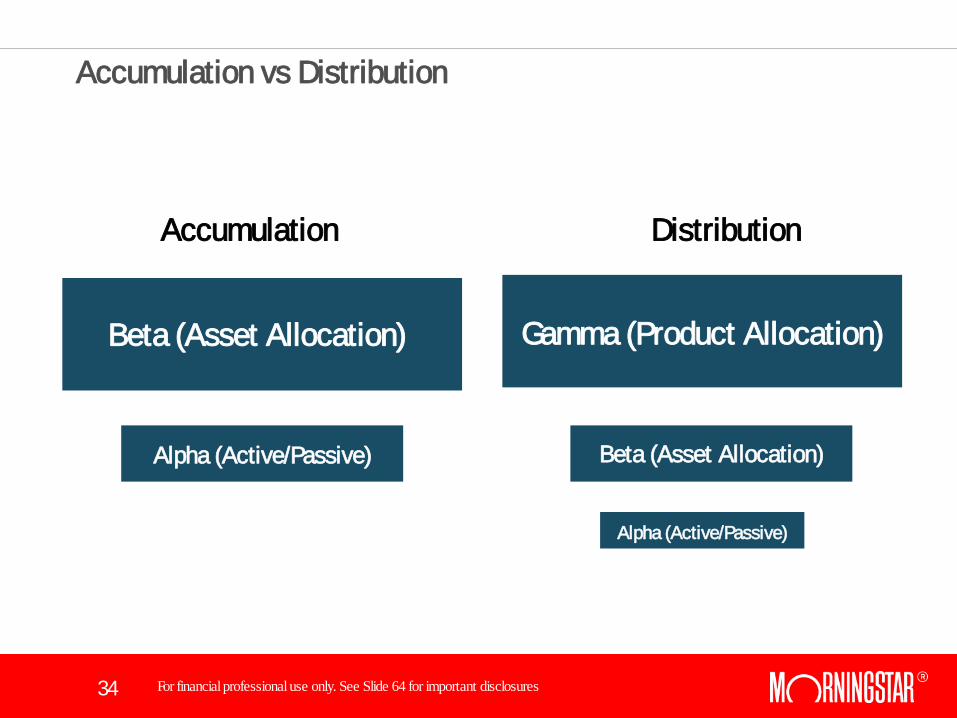
Accumulation vs Distribution
Accumulation Distribution
Beta (Asset Allocation) Gamma (Product Allocation)
Beta (Asset Allocation) Alpha (Active/Passive)
Alpha (Active/Passive)
35 For financial professional use only. See Slide 64 for important disclosures
Annuity Summary Thoughts
× All annuities are not bad, but most annuities are expensive × Annuities are different, and different annuities work better/best in
different scenarios for different retirees × The majority of annuitants cannot “make money”, so any type of
“average” analysis will yield unfavorable results × A better approach to estimate the “cost” is to take total portfolio
approach and incorporate some type of preference model (like utility) × Given the current interest rate environment (historic lows), I think
GMWB annuities are probably more attractive than immediate annuities and longevity insurance, although this is an apples to oranges to bananas comparison
36 For financial professional use only. See Slide 64 for important disclosures
Non-Guaranteed Managed Options

37 For financial professional use only. See Slide 64 for important disclosures
Money Back Guarantee?
38 For financial professional use only. See Slide 64 for important disclosures
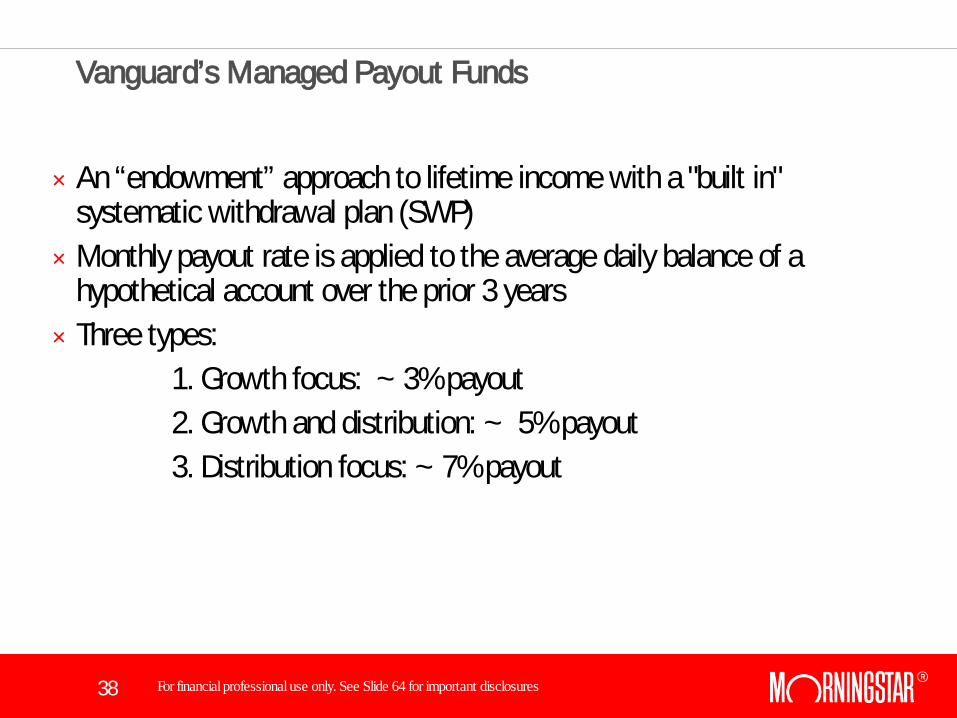
Vanguard’s Managed Payout Funds
× An “endowment” approach to lifetime income with a "built in" systematic withdrawal plan (SWP)
× Monthly payout rate is applied to the average daily balance of a hypothetical account over the prior 3 years
× Three types: 1. Growth focus: ~ 3% payout 2. Growth and distribution: ~ 5% payout 3. Distribution focus: ~ 7% payout
39 For financial professional use only. See Slide 64 for important disclosures
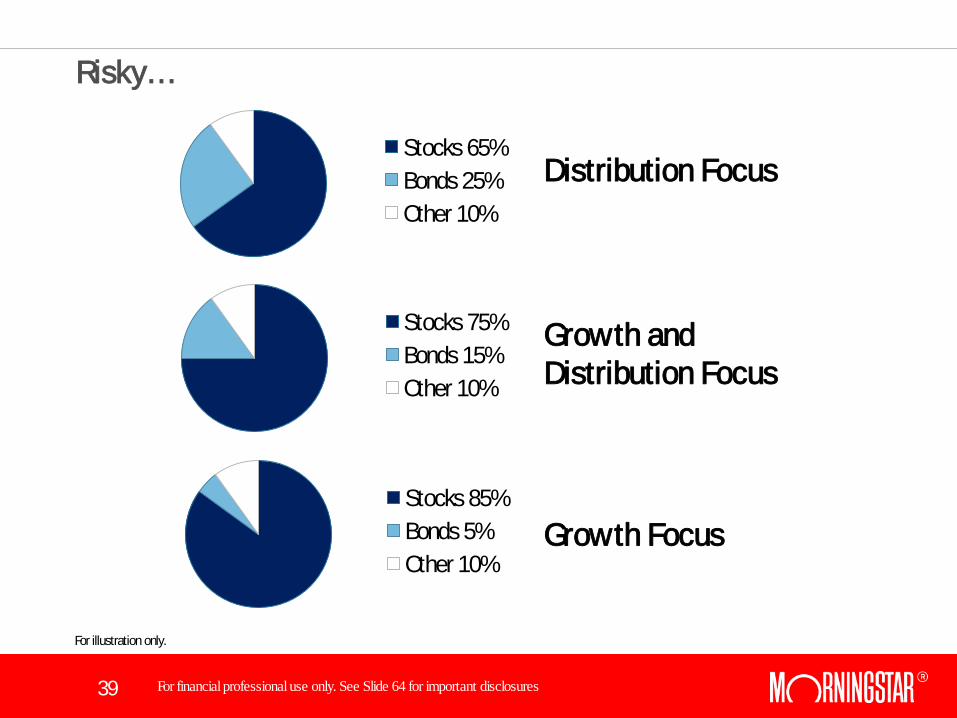
Risky…
Distribution Focus
Growth and Distribution Focus
Stocks 65% Bonds 25% Other 10%
Stocks 75% Bonds 15% Other 10%
Stocks 85% Bonds 5% Other 10%
Growth Focus
For illustration only.
40 For financial professional use only. See Slide 64 for important disclosures
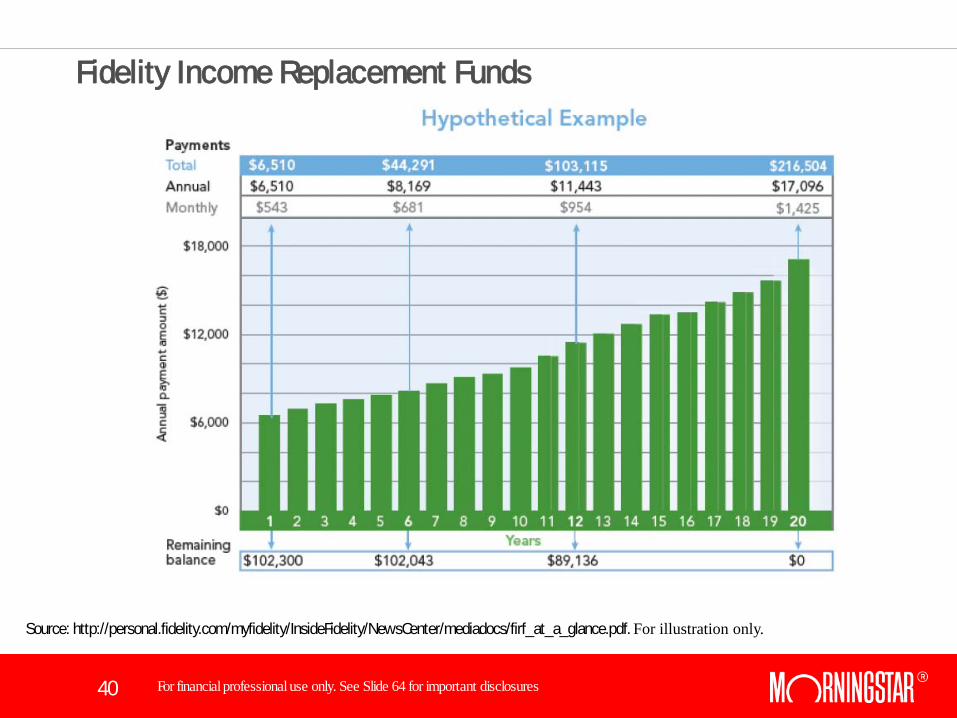
Fidelity Income Replacement Funds
Source: http://personal.fidelity.com/myfidelity/InsideFidelity/NewsCenter/mediadocs/firf_at_a_glance.pdf. For illustration only.
41 For financial professional use only. See Slide 64 for important disclosures
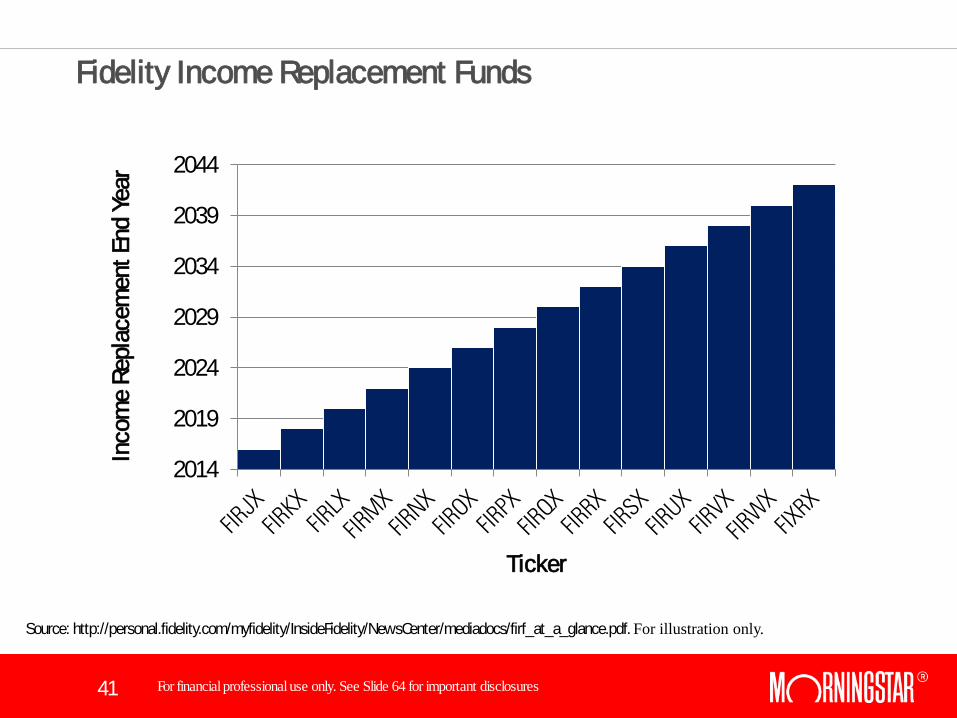
Fidelity Income Replacement Funds
2014
2019
2024
2029
2034
2039
2044
Inco
me
Repl
acem
ent E
nd Y
ear
Ticker
Source: http://personal.fidelity.com/myfidelity/InsideFidelity/NewsCenter/mediadocs/firf_at_a_glance.pdf. For illustration only.
42 For financial professional use only. See Slide 64 for important disclosures
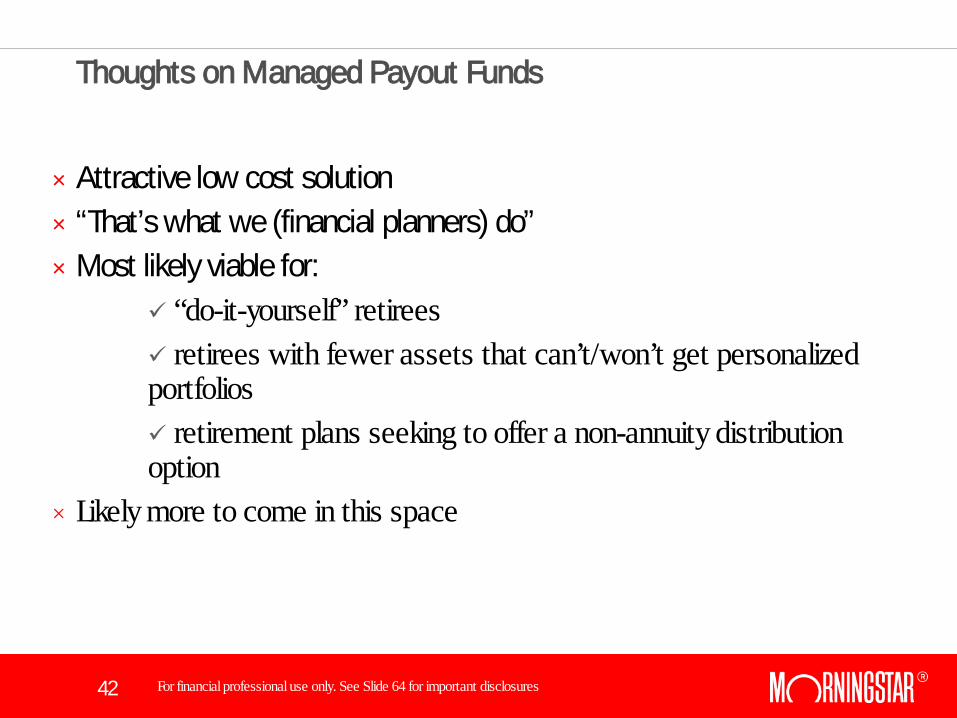
Thoughts on Managed Payout Funds
× Attractive low cost solution × “That’s what we (financial planners) do” × Most likely viable for:
“do-it-yourself” retirees retirees with fewer assets that can’t/won’t get personalized portfolios retirement plans seeking to offer a non-annuity distribution option
× Likely more to come in this space
43 For financial professional use only. See Slide 64 for important disclosures
Modeling Considerations
44 For financial professional use only. See Slide 64 for important disclosures
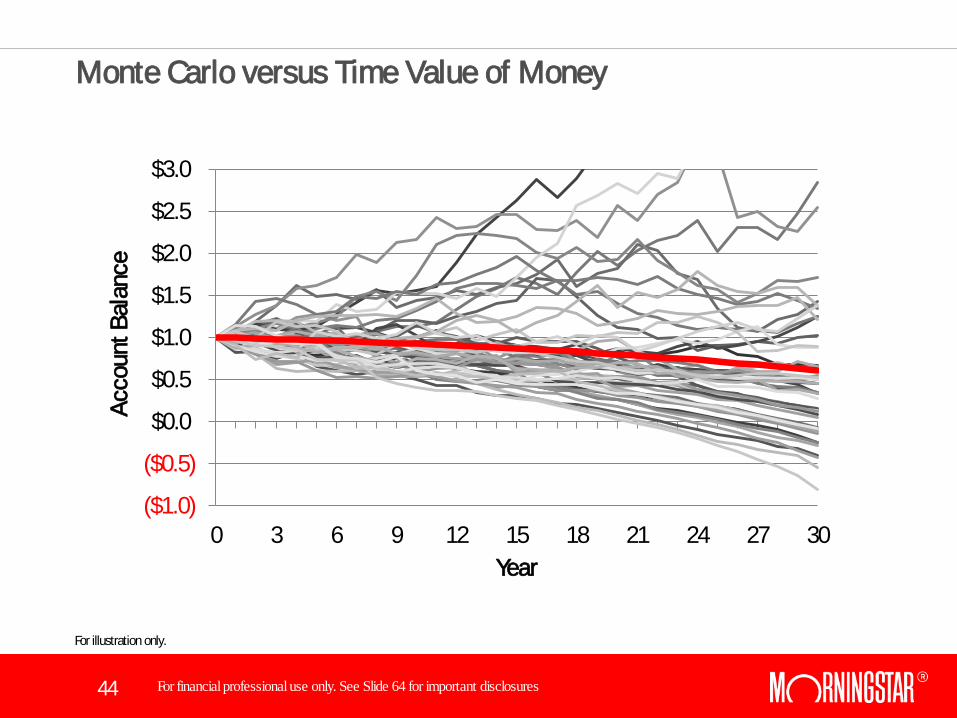
Monte Carlo versus Time Value of Money
($1.0)
($0.5)
$0.0
$0.5
$1.0
$1.5
$2.0
$2.5
$3.0
0 3 6 9 12 15 18 21 24 27 30
Acco
unt B
alan
ce
Year
For illustration only.
45 For financial professional use only. See Slide 64 for important disclosures
Beware of the Average
46 For financial professional use only. See Slide 64 for important disclosures
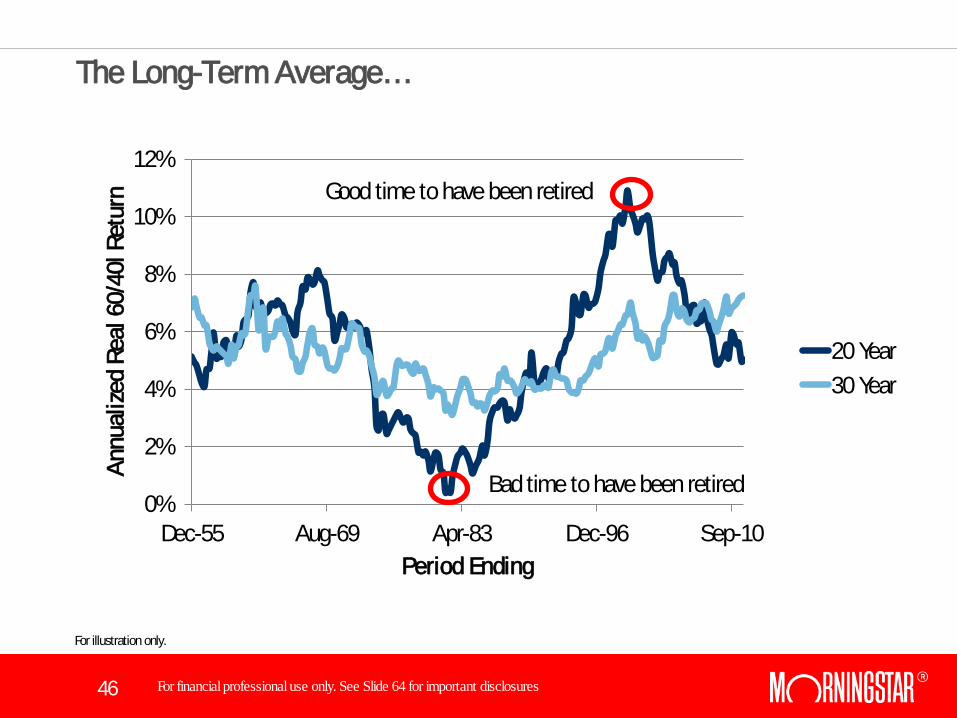
The Long-Term Average…
0%
2%
4%
6%
8%
10%
12%
Dec-55 Aug-69 Apr-83 Dec-96 Sep-10
Annu
alize
d Re
al 6
0/40
l Ret
urn
Period Ending
20 Year 30 Year
Good time to have been retired
Bad time to have been retired
For illustration only.

47 For financial professional use only. See Slide 64 for important disclosures
Is 4% “Safe”?
48 For financial professional use only. See Slide 64 for important disclosures
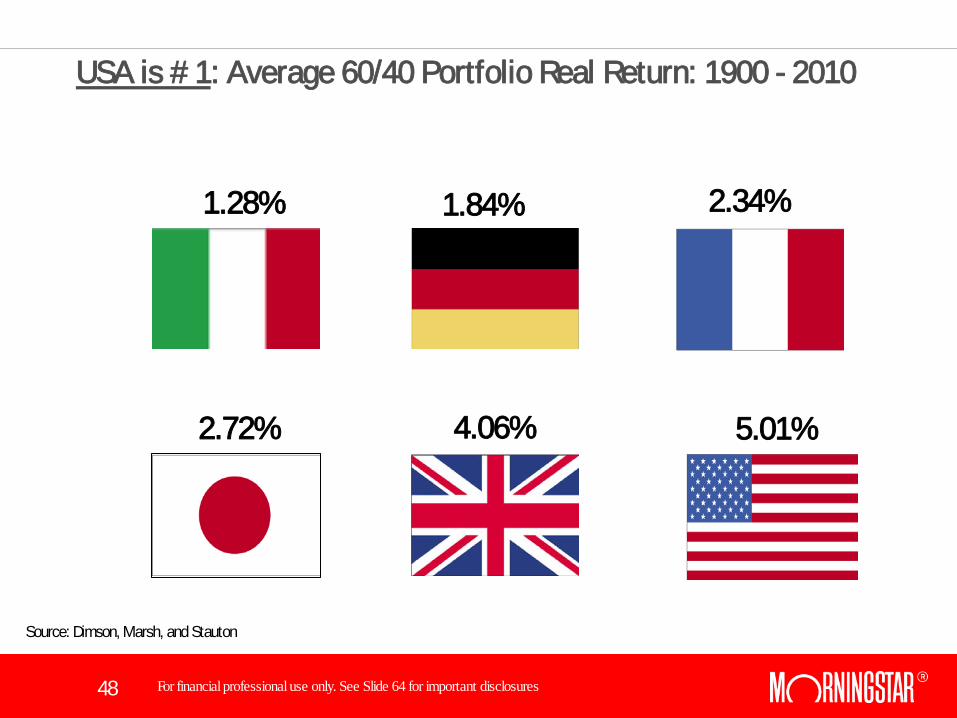
USA is # 1: Average 60/40 Portfolio Real Return: 1900 - 2010
2.72%
1.84% 2.34% 1.28%
4.06% 5.01%
Source: Dimson, Marsh, and Stauton
49 For financial professional use only. See Slide 64 for important disclosures
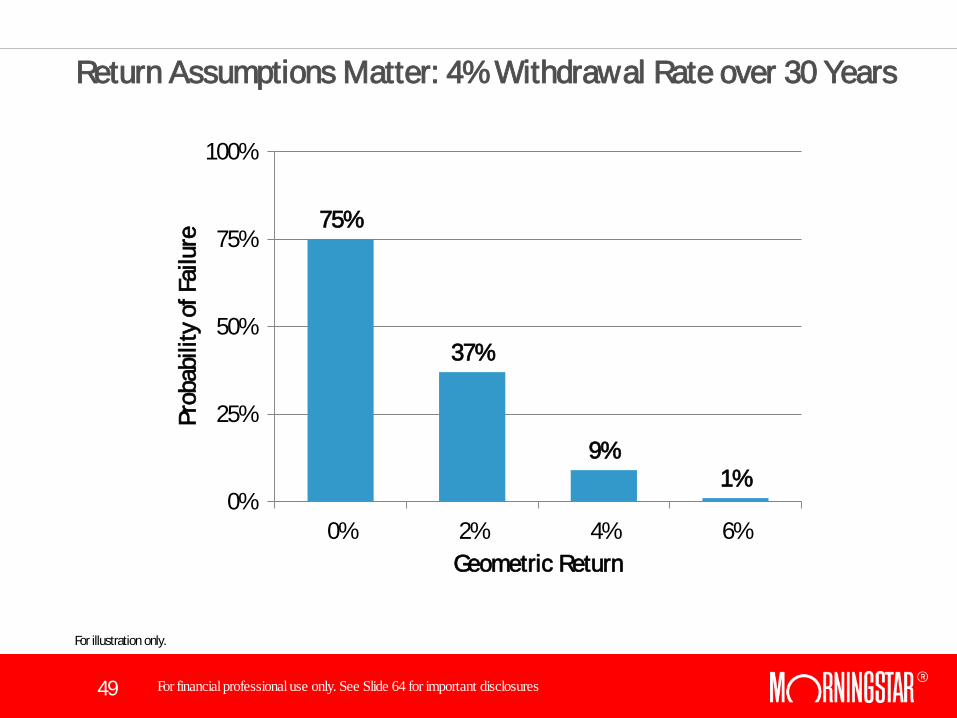
Return Assumptions Matter: 4% Withdrawal Rate over 30 Years
75%
37%
9% 1%
0%
25%
50%
75%
100%
0% 2% 4% 6%
Prob
abili
ty o
f Fai
lure
Geometric Return
For illustration only.
50 For financial professional use only. See Slide 64 for important disclosures
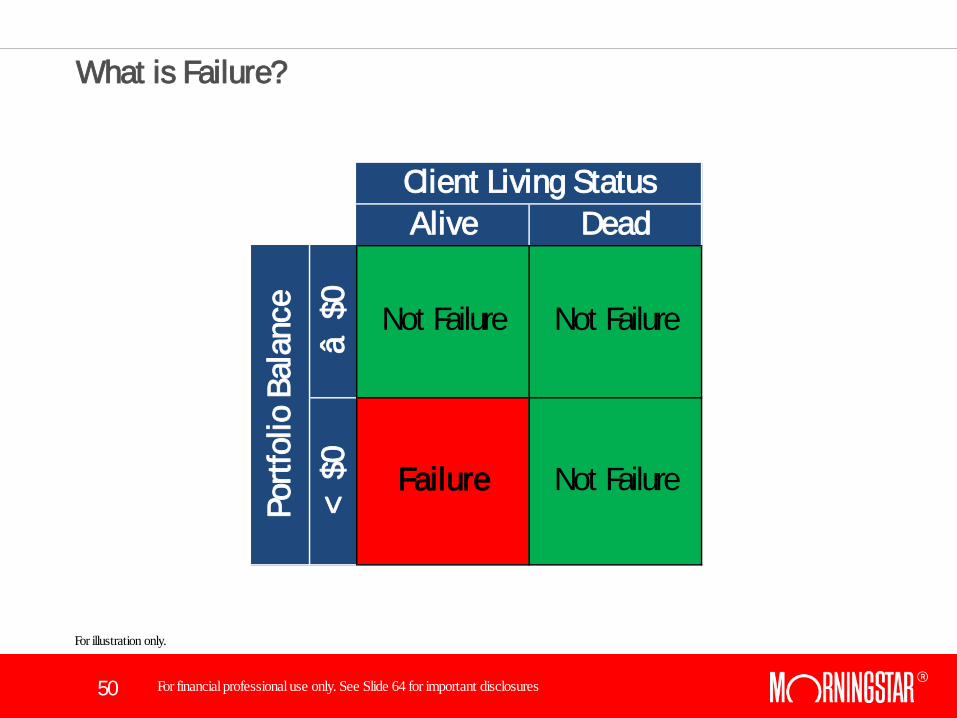
What is Failure?
Failure Not Failure
Client Living StatusAlive Dead
â $
0<
$0
Portf
olio
Bal
ance Not Failure Not Failure
For illustration only.
51 For financial professional use only. See Slide 64 for important disclosures
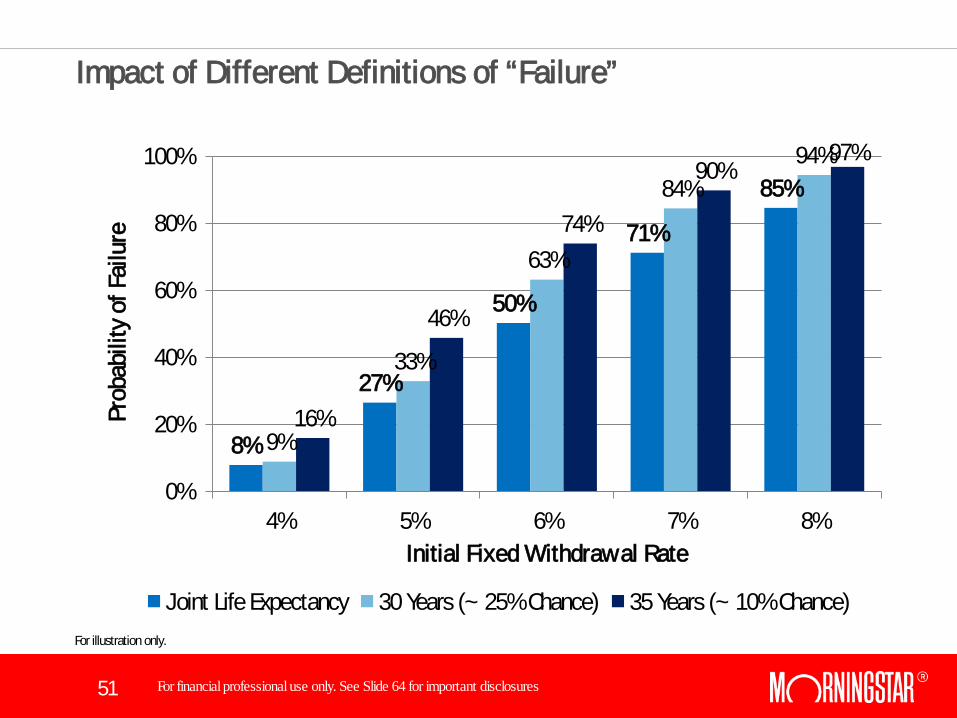
Impact of Different Definitions of “Failure”
8%
27%
50%
71%
85%
9%
33%
63%
84% 94%
16%
46%
74%
90% 97%
0%
20%
40%
60%
80%
100%
4% 5% 6% 7% 8%
Prob
abili
ty o
f Fai
lure
Initial Fixed Withdrawal Rate
Joint Life Expectancy 30 Years (~ 25% Chance) 35 Years (~ 10% Chance) For illustration only.
52 For financial professional use only. See Slide 64 for important disclosures
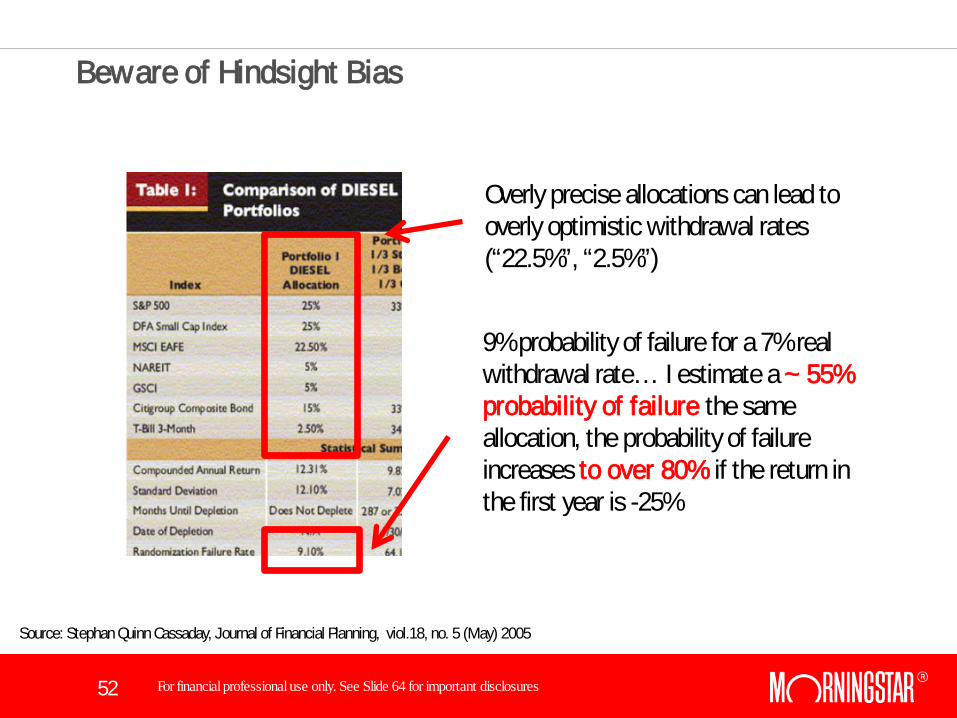
Beware of Hindsight Bias
Overly precise allocations can lead to overly optimistic withdrawal rates (“22.5%”, “2.5%”)
9% probability of failure for a 7% real withdrawal rate… I estimate a ~ 55% probability of failure the same allocation, the probability of failure increases to over 80% if the return in the first year is -25%
Source: Stephan Quinn Cassaday, Journal of Financial Planning, viol.18, no. 5 (May) 2005
53 For financial professional use only. See Slide 64 for important disclosures
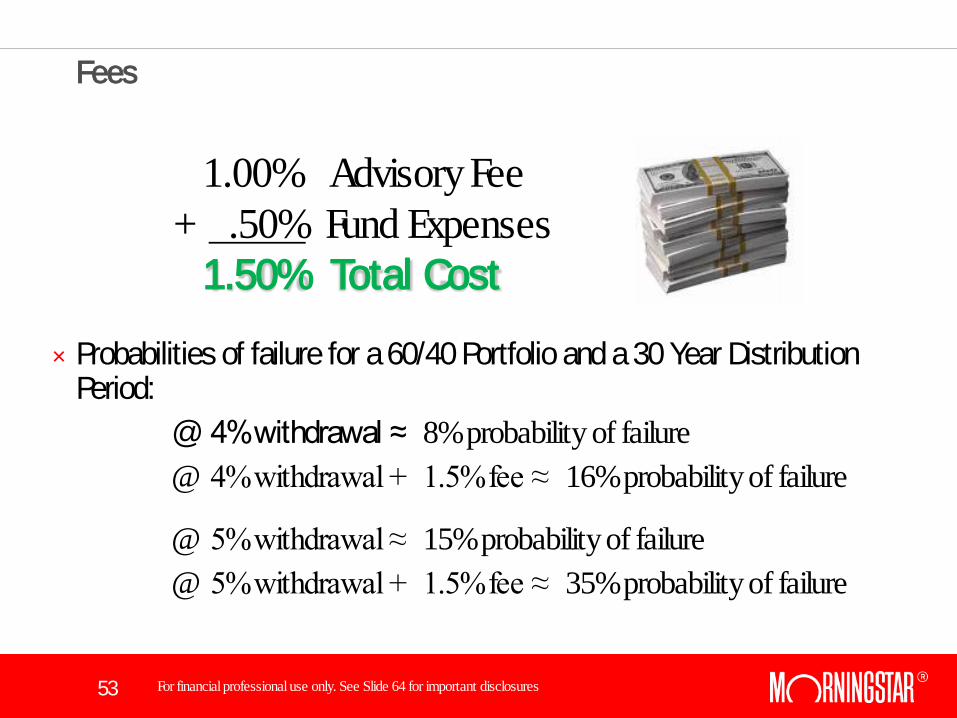
Fees
× Probabilities of failure for a 60/40 Portfolio and a 30 Year Distribution
Period: @ 4% withdrawal ≈ 8% probability of failure @ 4% withdrawal + 1.5% fee ≈ 16% probability of failure
@ 5% withdrawal ≈ 15% probability of failure @ 5% withdrawal + 1.5% fee ≈ 35% probability of failure
1.00% Advisory Fee + .50% Fund Expenses 1.50% Total Cost
54 For financial professional use only. See Slide 64 for important disclosures
Dynamic Withdrawal Strategies
55 For financial professional use only. See Slide 64 for important disclosures
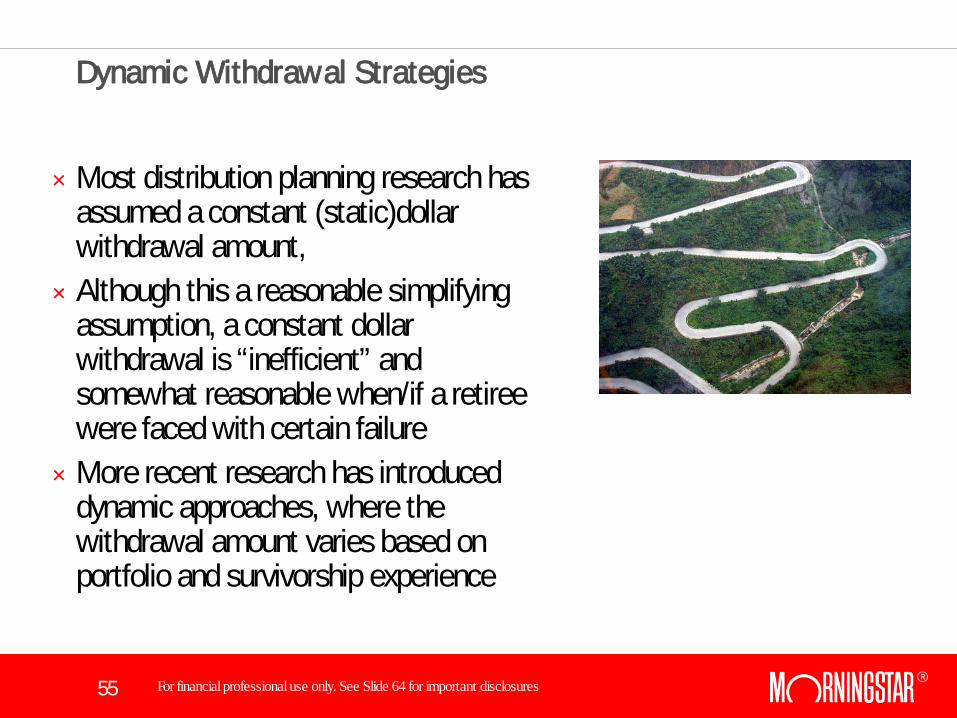
Dynamic Withdrawal Strategies
× Most distribution planning research has assumed a constant (static)dollar withdrawal amount,
× Although this a reasonable simplifying assumption, a constant dollar withdrawal is “inefficient” and somewhat reasonable when/if a retiree were faced with certain failure
× More recent research has introduced dynamic approaches, where the withdrawal amount varies based on portfolio and survivorship experience
56 For financial professional use only. See Slide 64 for important disclosures
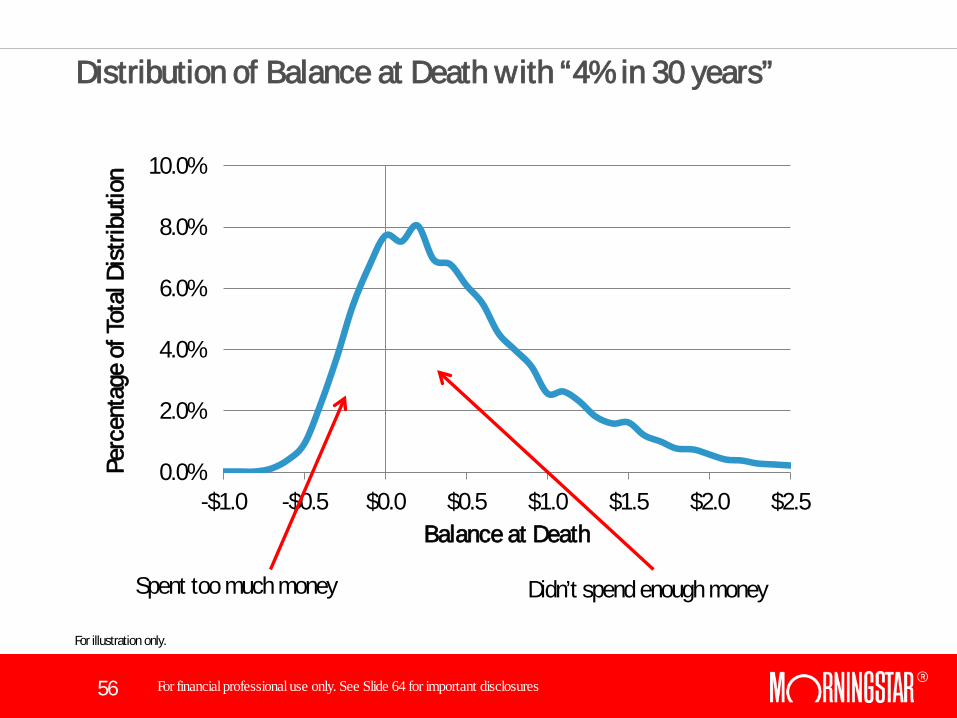
Distribution of Balance at Death with “4% in 30 years”
0.0%
2.0%
4.0%
6.0%
8.0%
10.0%
-$1.0 -$0.5 $0.0 $0.5 $1.0 $1.5 $2.0 $2.5
Perc
enta
ge o
f Tot
al D
istri
butio
n
Balance at Death
Spent too much money Didn’t spend enough money
For illustration only.
57 For financial professional use only. See Slide 64 for important disclosures
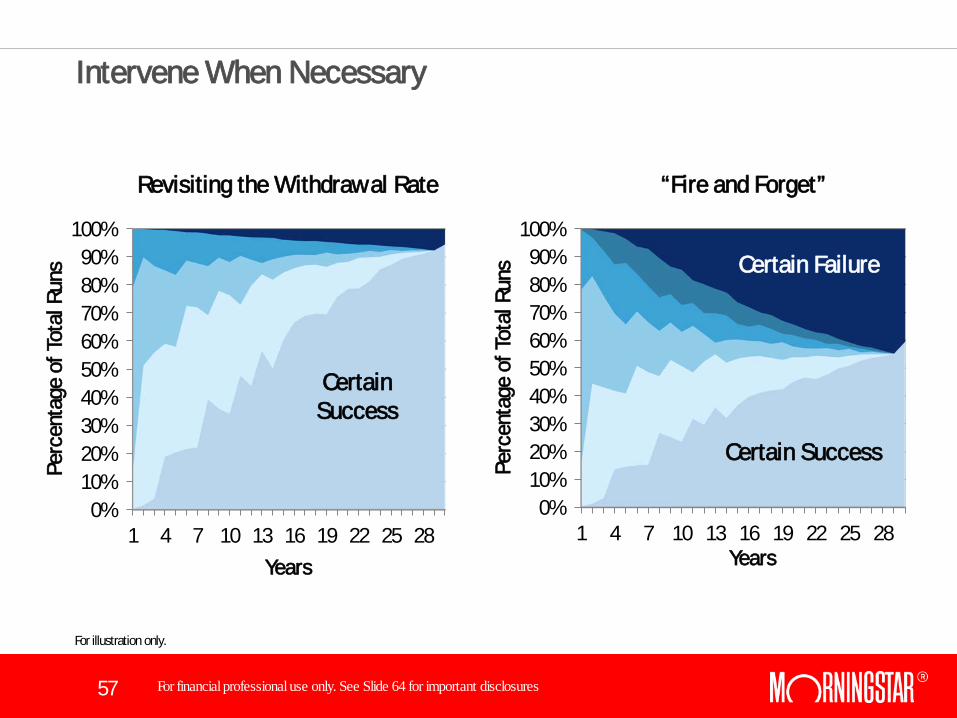
Intervene When Necessary
0% 10% 20% 30% 40% 50% 60% 70% 80% 90%
100%
1 4 7 10 13 16 19 22 25 28 Pe
rcen
tage
of T
otal
Run
s
Years
0% 10% 20% 30% 40% 50% 60% 70% 80% 90%
100%
1 4 7 10 13 16 19 22 25 28
Perc
enta
ge o
f Tot
al R
uns
Years
Revisiting the Withdrawal Rate “Fire and Forget”
Certain Success
Certain Success
Certain Failure
For illustration only.
58 For financial professional use only. See Slide 64 for important disclosures
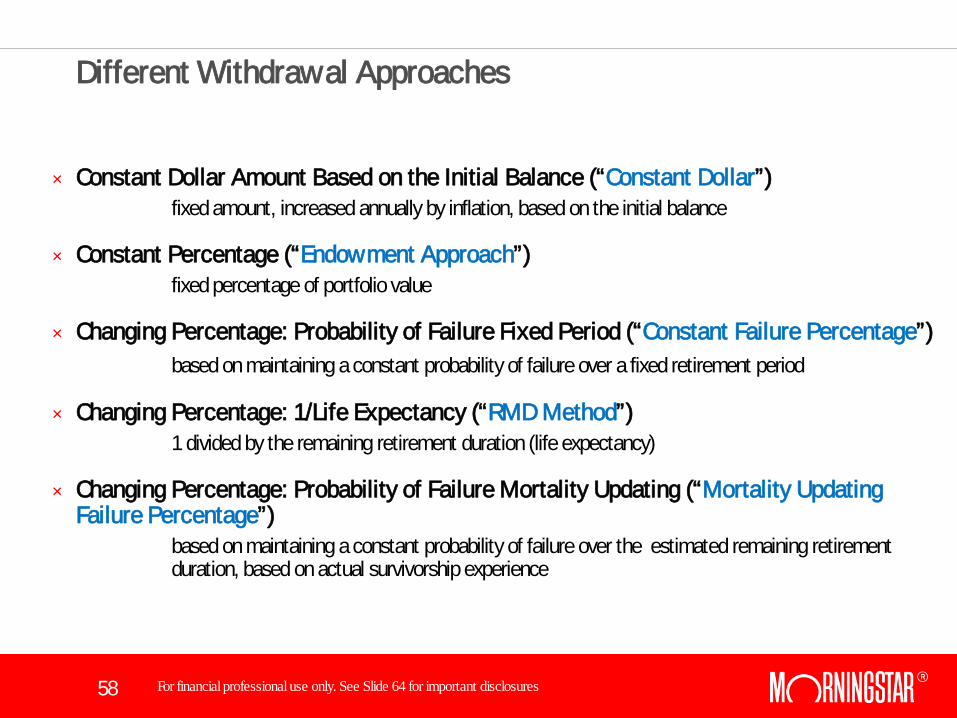
Different Withdrawal Approaches
× Constant Dollar Amount Based on the Initial Balance (“Constant Dollar”) fixed amount, increased annually by inflation, based on the initial balance
× Constant Percentage (“Endowment Approach”) fixed percentage of portfolio value
× Changing Percentage: Probability of Failure Fixed Period (“Constant Failure Percentage”) based on maintaining a constant probability of failure over a fixed retirement period
× Changing Percentage: 1/Life Expectancy (“RMD Method”) 1 divided by the remaining retirement duration (life expectancy)
× Changing Percentage: Probability of Failure Mortality Updating (“Mortality Updating Failure Percentage”)
based on maintaining a constant probability of failure over the estimated remaining retirement duration, based on actual survivorship experience
59 For financial professional use only. See Slide 64 for important disclosures
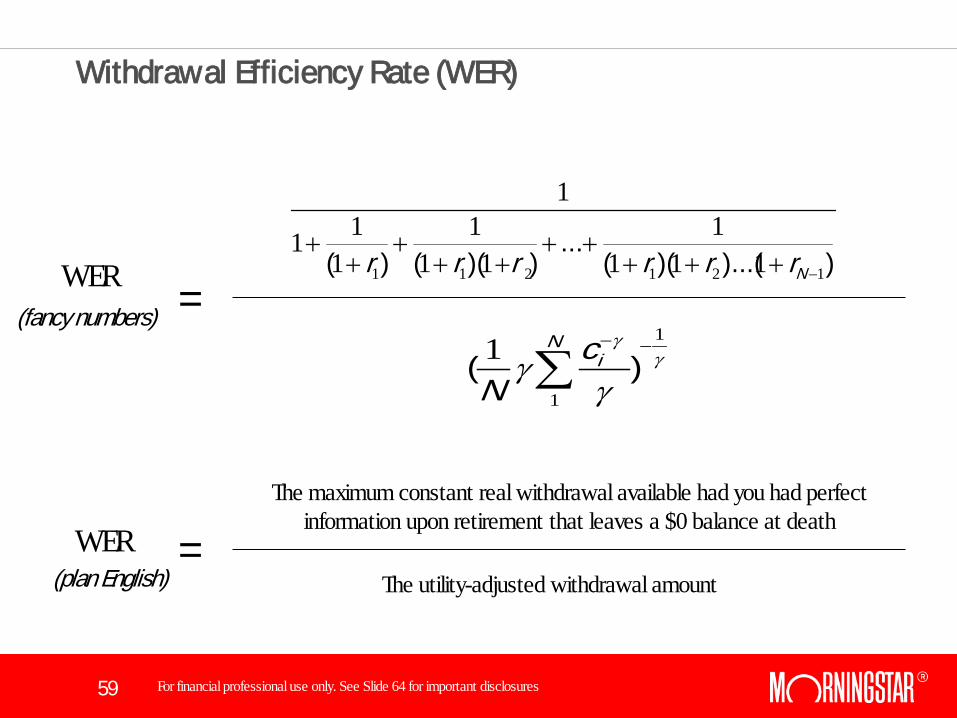
Withdrawal Efficiency Rate (WER)
γγ
γγ
1
1
1 −−
∑ )(N
icN
))...()((...
))(()( 121211 1111
111
111
1
−+++++
+++
++
NrrrrrrWER
WER The maximum constant real withdrawal available had you had perfect
information upon retirement that leaves a $0 balance at death
The utility-adjusted withdrawal amount
(fancy numbers)
(plan English)
=
=
60 For financial professional use only. See Slide 64 for important disclosures
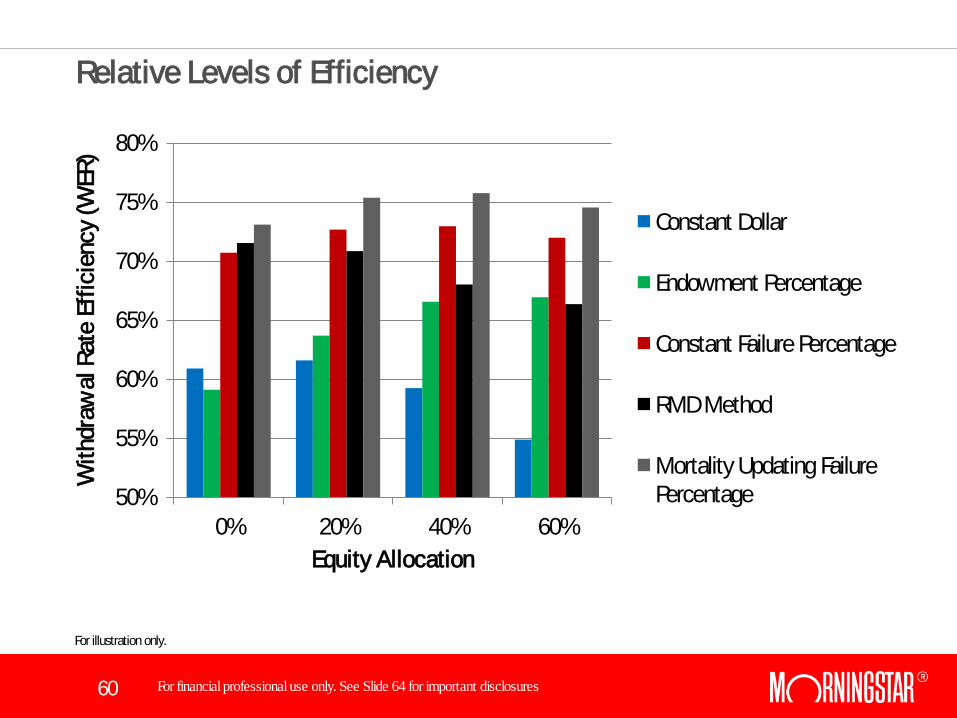
Relative Levels of Efficiency
50%
55%
60%
65%
70%
75%
80%
0% 20% 40% 60%
With
draw
al R
ate
Effic
ienc
y (W
ER)
Equity Allocation
Constant Dollar
Endowment Percentage
Constant Failure Percentage
RMD Method
Mortality Updating Failure Percentage
For illustration only.

61 For financial professional use only. See Slide 64 for important disclosures
Conclusions

62 For financial professional use only. See Slide 64 for important disclosures
Our Task
For illustration only.

63 For financial professional use only. See Slide 64 for important disclosures
Questions? Contact: david.blanchett@morningstar Research: http://corporate.morningstar.com/ib www.davidmblanchett.com/research
64 For financial professional use only. See Slide 64 for important disclosures
× The information, data, analyses, and opinions presented herein do not constitute investment advice; are provided as of the date written and solely for informational purposes only and therefore are not an offer to buy or sell a security; and are not warranted to be correct, complete or accurate. Past performance is not indicative and not a guarantee of future results.
× Author's calculations on Slides 9, 49, 51, 53, 57, 60 are based upon Monte Carlo simulations. Monte Carlo is an analytical method used to simulate random returns of uncertain variables to obtain a range of possible outcomes. Such probabilistic simulation does not analyze specific security holdings, but instead analyzes the identified asset classes. The simulation generated is not a guarantee or projection of future results, but rather, a tool to identify a range of potential outcomes that could potentially be realized. The Monte Carlo simulation is hypothetical in nature and for illustrative purposes only. Results noted may vary with each use and over time.
× Indexes shown are unmanaged and not available for direct investment. Although index performance data is gathered from reliable sources, Ibbotson Associates cannot guarantee its accuracy, completeness or reliability. Except as otherwise required by law.
Important Disclosures
65 For financial professional use only. See Slide 64 for important disclosures
For Information and/or illustrative purposes only. Not for public distribution. ©2012 Morningstar. All rights reserved. Morningstar Investment Management is a division of Morningstar. Morningstar Investment Management includes Morningstar Associates, Ibbotson Associates, and Morningstar Investment Services; all registered investment advisors and wholly owned subsidiaries of Morningstar, Inc. The information contained in this presentation is the proprietary material of Ibbotson Associates. Reproduction, transcription or other use by any means, in whole or in part, without the prior written consent of Ibbotson Associates, is prohibited. The Morningstar name and logo are registered marks of Morningstar, Inc. The Ibbotson name and logo are registered marks of Ibbotson Associates, Inc.

66 For financial professional use only. See Slide 64 for important disclosures 66