Embed Size (px)
Citation preview
MAKING SENSE OF CHINA’S ECONOMIC TRANSFORMATION
Dic Lo
Department of Economics, School of Oriental and African Studies, University of London,
Thornhaugh Street, Russell Square, London WC1H 0XG, U.K.***
and
School of Economics, Renmin University of China,
59 Zhongguancun Street, Beijing 100872, China.‡‡‡
E-mail: [email protected]
June 2006
Dic Lo teaches economics at the School of Oriental and African Studies, University of London,
and the School of Economics, Renmin University of China. He is author of Market and
Institutional Regulation in Chinese Industrialization, 1978-94 (1997, London: Macmillan; and
New York: St. Martin’s) and China’s Transformational Growth: A Structural-Institutional
Analysis (2001, Beijing: Economic Science Press).
*** Address for correspondence, January-March 2006 and January-March 2007; ‡‡‡ Address
for correspondence unless otherwise indicated, until August 2007.
I wish to thank Perry Anderson, Andrea Boltho, Robert Brenner, Alfredo Saad-Filho, Susan
Watkins and Zhang Yu for their comments on earlier versions of this essay. I am solely
responsible for the views expressed in the essay, and any errors and mistakes that remain.
ABSTRACT
China’s sustained rapid economic growth over the post-1978 reform era, which is also the era
of globalisation, is of worldwide importance. This growth experience has been based mainly
on China’s internal dynamics. In the first half of the era, economic growth was propelled by
improvement in both allocative efficiency and productive efficiency. From the early 1990s
until the present time, however, economic growth has been increasingly based on dynamic
increasing returns associated with a growth path that is characterised by capital deepening. In
both periods, the growth paths and their associated long-term-oriented institutions contradict
principles of the free market economy – i.e., doctrines of globalisation. In the form of an
analytical overview, this article seeks to explain and interpret the historical background, logic
of evolution, and developmental and social implications of China’s economic transformation.
The analytics draws on a range of relevant economic theories including Marxian theory of
economic growth, Post-Keynesian theory of demand determination, and Neo-Schumpeterian
theory of innovation. It is posited that these alternative theoretical perspectives offer better
insights than mainstream neoclassical economics in explaining and interpreting China’s
economic transformation.
1
1. Globalisation Meets the ‘China Paradox’
Viewed from the perspective of worldwide economic development in the era of globalisation,
that is, over the past quarter-century, China’s performance could be regarded as unique. The
country has survived well the three waves of catastrophes that beset the non-Western world
during this period. These catastrophes, namely, are: first, the ‘lost decades of development’ in
most parts of the Third World since the early 1980s, second, the total crisis in countries of the
former Soviet bloc since the mid-1980s, and, finally, the financial and economic crisis that
engulfed most parts of East Asia in the closing years of the century.
What these catastrophes indicate is the transition of world economic development
from the Golden Age of the 1950-70s to an era of prolonged stagnation since 1980. Along
with the general stagnation, meanwhile, there has been a trend of growing disparity among
major regions of the underdeveloped world – that is, a trend of uneven development.1 As can
be seen from Table 1, prior to the 1980s, the growth performance of most regions was rather
satisfactory, while that of the newly industrialising economies (represented by South Korea
and Taiwan Province of China, in East Asia, and Brazil and Mexico in Latin America) could
be considered as encouraging. And the record of countries of the former Soviet bloc was in no
sense far behind the best performers. A totally different picture emerged in the stagnation era,
1 For an analytical overview of the worldwide developmental crisis and uneven development
after the Golden Age, see Ajit Singh, ‘The actual crisis of economic development in the
1980s: an alternative policy perspective for the future’ (in A.K. Dutt and K. Jameson [eds.]
New Directions in Development Economics, Aldershot: Edward Elgar, 1992). John Weeks
(‘The expansion of capital and uneven development on a world scale’ Capital and Class, 2001,
no.74, pp.9-30) gives a more theoretical and updated treatment. Dic Lo (‘China after East
Asian developmentalism’, Historical Materialism, 2001, no.8, pp.253-264) notes several
structural features of the world economy that have been highlighted in the relevant literature
as possible main causes of the crisis. Williamson Easterly, ‘The lost decades: developing
countries’ stagnation in spite of policy reform 1980-1998’ (Working Paper no.27272, The
World Bank 2001, www.worldbank.org), notes the almost total ignorance of the worldwide
developmental crisis in the mainstream literature.
2
however. The real growth rate of per capita income for all low-income and middle-income
economies was a mere 1.3% per annum in the 1980s, and 1.8% in the 1990s. The same rate
for all low-income economies excluding China and India actually fell sharply, from the
already low level of 2.0% per annum in the 1960-80s to 1.2% in the 1990s. And the growth
performance of middle-income economies meanwhile has not been any better. Thus,
especially when the growing disparity across regions is taken into account, it is no
exaggeration to call the 1980-90s the ‘lost decades of development’. This is even more so for
countries of the former Soviet bloc, where the average annual growth rate of per capita
income in the 1990s was -1.7%.
[Table 1]
In this context, China’s rapid and sustained economic growth since 1980, over and
above its respectable record in the previous decades, is indeed unique. As also can be seen
from Table 1, the country’s per capita income grew at an average rate of 8.8% per annum in
the 1980s and 9.3% in the 1990s, far exceeding the average of the Asia-Pacific region which
is the best performer of the world during this period.2 The growth performance is paradoxical
2 The quality of China’s statistical data has invited suspicions, but, in the scholarly literature,
even the foremost sceptics accept that the actual growth performance over the long term is not
significantly different from that indicated by official data (Thomas G. Rawski, ‘Measuring
China’s recent GDP growth: where do we stand?’, www.pitt.edu/~tgrawski, August 2002).
Recent debates over the matter have centred around the quality of Chinese GDP data in the
years after 1998. Two arguments put forth by Rawski have been particularly controversial.
First, in view of the fact that virtually all Chinese provinces have reported their GDP growth
estimates that are higher than the national average figures, and that China’s statistics system is
based on vertical reporting, Rawski argues that the reliability of the national figures must also
be suspected. Second, based on the growth performance of various specific sectors (energy
consumption, airline usage, etc.), as well as a range of press reports on the behaviour of data
falsification by local governments, Rawski argues that China’s actual GDP growth rates after
1998 must be much lower than the official figures. In response to Rawski’s first argument, Xu
Xianchun (‘Main differences between China’s GDP estimation and the current SNA system
of GDP estimation’, Jingji Yanjiu [Economic Research Journal], 2001, no.11, and ‘The future
prospects for China’s economic growth and international economic status’, Jingji Yanjiu
3
as well, given that China’s economic institutions and policies have long been dismissed by the
world orthodox establishment – that is, the Washington establishment and its associated free
market doctrines – as by nature seriously deviating from the canonical free market economy,
and being akin to the crisis-causing factors of the three groups of economies indicated in the
opening paragraph of this article. How, then, has this ‘China paradox’ come about? Does
there really exit a distinctive, discernible ‘Chinese model of economic transformation’ that
has underpinned the spectacular developmental performance?
2. China in the Transition Orthodoxy
Talking about ‘the China paradox’, of course, would imply a challenge to the free market
doctrines, and the orthodox establishment has been outspoken in rejecting it. A recurring
claim has it that, given a longer time span, an economic collapse of comparable (to the East
Asian crisis, if not the Russian depression) scale is bound to occur in China, as a punishment
for its deviation from the established, universal doctrines.
What the orthodox establishment considers as anomalous, indeed objectionable, in
China’s reformed economic institutions concerns, ultimately, the widespread violation of the
[Economic Research Journal], 2002, no.3) contends that the National Bureau of Statistics has
developed an increasingly sophisticated system to verify the reliability of data reported by
lower-level authorities, and has accordingly made the necessary adjustments. In response to
Rawski’s second argument, in the literature, there have also emerged a range of contending
views that highlight the fast expansion in imports, the money supply, fiscal revenues and the
like as being in line with the economic growth performance indicated by official GDP data. It
is also of importance to note that, following the 2005 Economic Census, in December 2005,
the Chinese government substantially revised upwards the figures regarding the actual size of
the country’s GDP as well as its growth rates over the 1990s (for consistency with data of the
1980s this article does not incorporate the revised data). This contradicts the allegation of
exaggerated reporting in official statistical data. On the whole, whilst the indicated debates
have remained inconclusive, the analysis of this article is unlikely to be significantly affected
because its focus is on long-term performance.
4
principles of individualistic property rights. Easily observable phenomena such as discrete
government intervention in economic affairs (the state-business relationship), soft budget
constraints (the finance-industry relationship) and rigid employment and compensation
systems (the worker-enterprise relationship) are deemed symptoms of this ultimate disease.
Thus, in the scholarly circles associated with the orthodox establishment, there has long been
a proposition stating that China’s reformed economic institutions are a mix of market-
conforming and market-supplanting elements, that its developmental achievements so far
have been ascribable to the conforming elements whereas the accumulated problems being
ascribable to the supplanting elements, and that the problems have tended to outweigh the
achievements as the country’s economic transition proceeding from the allegedly easy phase
to the difficult phase. The future prospects for the Chinese economy, the proposition
maintains, is at best uncertain and more likely crisis-prone. And the only way to avoid this
looming crisis is to embrace the orthodox doctrines in toto, particularly via mass privatisation
of state firms and liberalisation of external economic transactions.3
To put the above proposition in context, it should be noted that China’s experience of
economic development and systemic reform has posed a serious challenge to the orthodox
doctrines – known variously as ‘market fundamentalism in transition’ (IMF 2000) or ‘the
transition doctrine of the Washington consensus’ (Stiglitz 1999) – in the so-called transition
debate. Back in the early 1990s, Martin Weitzman, an influential economist, apparently being
puzzled, spelt out the following: ‘According to almost any version of standard mainstream
property rights theory, what has been described as the “East European model” basically
represents the correct approach to transformation, while what we are calling the “Chinese
3 Examples of this claim abound, see, e.g., The Economist 24th-30th October 1998, pp.15-16
and pp.23-28. For a scholarly version of this view, see N.R. Lardy, China’s Unfinished
Economic Revolution (Washington, D.C.: Brookings Institution Press, 1998). See also IMF,
World Economic Outlook (Washington, D.C.: The International Monetary Fund, October
2000) and the World Bank, Transition – The First Ten Years: Analysis and Lessons for
Eastern Europe and the Former Soviet Union (Washington, D.C.: The World Bank, 2002),
for more recent accounts from the orthodox establishment.
5
model” should represent a far-out recipe for economic disaster… The central paradox is the
enormous success of the Chinese model in practice, contrasted with the sputtering, tentative,
comparatively unsuccessful experience with the East European model.’ 4 The Chinese
experience appears to indicate that adherence to principles of individualistic property rights is
neither necessary nor sufficient for generating sustained rapid economic growth – indeed for
avoiding economic stagnation. The credibility of the orthodox doctrines is thus at risk if not
having an adequate explanation of the seemingly anomalous Chinese experience.
In the face of this ‘China challenge’, the orthodox establishment has responded by
means of relying on the proposition indicated above that focuses on the institutional aspect, as
well as a second, related proposition on economic development. The World Bank, in its 1996
World Development Report, which is devoted to the ‘economics of transition’, frames such a
question for itself to answer: ‘Do differences in transition policies and outcomes reflect
different reform strategies, or do they reflect primarily country-specific factors such as
history, the level of development, or, just as important, the impact of political changes taking
place at the same time?’5 The answer, unsurprisingly, is that differences in country-specific
factors, particularly the different levels of industrialisation, have largely explained the
disparity in actual economic performance. Both in China and in countries of the former Soviet
bloc, the development experiences – sustained rapid growth in the former case, depression in
the latter case – are largely unrelated to their respective strategies of systemic transformation
and development policies. Unlike countries of the former Soviet bloc, China was fortunate to
4 Martin Weitzman, ‘Economic transition: can theory help?’ (European Economic Review,
1993, vol.37, pp.549-555), p.549. Weitzman did not provide a general answer to this question.
Nevertheless, in a subsequent paper with Chenggang Xu on the acclaimed development of
China’s collective township and village enterprises (‘Chinese township-village enterprises as
vaguely defined cooperatives’, Journal of Comparative Economics, 1994, vol.18, pp.121-
145), Weitzman raises a proposition – in the spirit of the theories of idiosyncratic exchange
and incomplete information – which states that vaguely-defined property rights do have
distinctive competitive advantage under certain structural and institutional conditions. 5 World Bank, World Development Report (New York, Oxford University Press, 1996, p.5).
6
be with a low level of industrialisation in the beginning of its reform. It has thus been able to
generate economic growth via labour transfer from the rural-agricultural sector to industry,
whilst postponing the needed, unavoidably painful reforms.6
It should be clear that what underpins both of the two orthodox propositions is the
notion that economic development is somehow easy or normal – the notion of the so-called
‘natural path of development’. This does not fare well with the dismal picture of late
development on the world scale, as depicted above with reference to Table 1. After all, it
should be noted that China’s growth performance in the era of systemic transformation stands
in sharp contrast to not only countries of the former Soviet bloc but also most of the non-
Western countries. 7 And it is also noted that the initial condition of China’s economic
transformation is not simply one of under-industrialisation. As can be seen from the figures in
Table 2, in 1980, industrial value-added accounted for an astonishingly high proportion of
49% of China’s GDP. This is lower than the Soviet Union (54%), but higher than South
Korea (40%), Brazil (44%) and India (24%) in the same year. The fact that, despite starting
with one of the highest industry-to-GDP ratios in the world, China has been able to maintain
very rapid industrial growth throughout the reform era, and with it to absorb labour transfer
from the rural-agricultural sector, clearly should not be taken for granted.
6 This view was pioneered by Jeffrey Sachs, a leading figure in the army of Western advisers
to countries of the former Soviet bloc in designing their systemic transformation strategies.
See Jeffrey Sachs and Wing-Thye Woo, ‘Reform in China and Russia’ (Economic Policy,
1994, no.18, pp.101-145). 7 Joseph Stiglitz (‘Whither reform? Ten years of the transition’, keynote address at the Annual
Bank Conference on Development Economics, Washington D.C.: The World Bank, April
1999), then chief economist of the World Bank, was outspoken in criticising this notion of the
transition orthodoxy. He maintains that China has faced a task of economic transformation
that must be more difficult than that faced by countries of the former Soviet bloc – because
China’s task encompasses simultaneously both systemic reform and economic development,
rather than systemic reform alone. Clearly, this statement suggests that economic
development is by no means a natural or easy process. This message is a basic tenet of what
has been termed, somewhat grandiosely, ‘the post-Washington consensus’.
7
[Table 2]
In terms of the immediate causes of economic growth, it might well be true that
China’s growth pattern in the 1980s and 1990s is not really unusual compared with the wider,
underdeveloped world as a whole in the second half of the twentieth century. Three general
observations pertaining to the worldwide experience of late development are of note. These,
namely, are: first, late development is often associated with the process of industrialisation, in
the form of an increasing share of employment of resources and production of output by
industry in the economy; second, there exists a positive relationship between output and
productivity growth within the industrial sector; and, third, there also exists a positive
relationship between industrial growth on the one hand, and the output or productivity growth
of the rest of the economy on the other hand.8
China’s real growth rate of industrial value-added reached 11.1% per annum in the
1980s, and increased further to the rate of 13.7% per annum in the 1990s. These rates are
much higher than the average of all low-income economies meanwhile, 5.5% and 2.7%,
respectively for the two periods, as well as that of all middle-income economies, 3.6% and
3.9%, respectively. They are also substantially higher than the average of the East Asian high-
growing economies (including China itself), the star performers of the underdeveloped world,
where the average annual growth rates during these two periods are both 9.3%. No wonder,
therefore, China’s overall economic growth in the 1980-90s has far outstripped most parts of
the underdeveloped world. Figure 1 charts out the evolution of labour productivity of Chinese
8 These observations are known in the literature as the ‘Kaldorian stylised facts’, while the
interpretation attached to them by Nicholas Kaldor is known as ‘the Kaldor-Verdoorn Laws’
(N. Kaldor, Causes of the Slow Rate of Economic Growth in the United Kingdom, Cambridge:
Cambridge University Press, 1966. See also J.S.L. McCombie and A.P. Thirlwall, Economic
Growth and the Balance-of-Payment Constraint, London: Macmillan, 1994.) It is noted that,
whilst the interpretation has been a matter of debate, the observations themselves have been
largely a consensus in the literature. See M. Syrquin, ‘Structural transformation and the new
growth theory’ (in L.L. Pasinetti and R.M. Solow [eds.] Economic Growth and the Structure
of Long−Term Development, London: Macmillan, 1994).
8
industry relative to the rest of the economy, both in nominal and real terms. It can be seen that
the curve representing relative labour productivity at constant prices has been persistently
above that representing relative labour productivity at current prices. This indicates the
transfer of productivity gains in the industrial sector to the rest of the economy via changes in
relative prices, thereby propelling overall economic growth. Moreover, the fact that the gap
between the two curves has tended to widen over time implies that the pace of productivity
transfer has tended to accelerate. It is thus clear that, regarding the immediate dynamics of
economic growth, the Chinese experience over the reform era is industry-led growth.9
[Figure 1]
3. The Role of External Factors: Causation or Correlation?
It is necessary to go beyond the immediate dynamics of economic growth (which is common
to experiences of late development) to investigate the underlying, structural-institutional
causes of the dynamics (which could be China-specific). In view of the relevant literature on
industry-led growth, and on the ‘Kaldor-Verdoorn Laws’ indicated above, it is often posited
that productivity growth in an economy is typically generated by the interaction between
9 In the spirit of the ‘Kaldorian stylised facts’ indicated above, simple regression analyses of
China’s 1978-2004 data give the following results:
Gn = 5.558 + 0.204 Gi Adjusted-R2 = 0.112
(2.041**)
Qi = 0.466 + 0.783 Gi Adjusted-R2 = 0.388
(4.107***)
Qn = -0.369 + 0.492 Gi Adjusted-R2 = 0.258
(3.110***)
where, G and Q denote the real annual growth rate of output and labour productivity,
respectively; the subscripts i and n denote industry and non-industry, respectively; and figures
in parentheses are t-statistics, with*, ** and *** indicating significant at 10%, 5% and 1%
confidence interval, respectively. It can be seen that China’s growth pattern in the reform era
fits well with the three stylised facts.
9
particular structural-institutional arrangements and the demand environment – the two aspects
combine to form a particular path of economic growth. Hence, further investigation into the
dynamics of China’s economic growth needs to take as its point of departure the following
question: what is the source of demand that has underpinned Chinese industrialisation over
the reform era? It is noted that, on the world scale during this period, a main factor that has
impeded late industrialisation comes precisely from demand-side constraints.10 Also recall
that China’s rapid industrial growth has been achieved in the context of starting in the late
1970s with one of the highest industry-to-GDP ratios in the world. There must exist some
peculiarities with China’s economic growth path in the reform era such that the accelerating
pace of industrialisation has found its necessary demand conditions.
A popular answer from the orthodox establishment to the demand question is to focus
on the external dynamics of China’s economic transformation, that is, to put the emphasis on
the country’s very fast expansion in exports in the reform era. It is posited that China has
followed the path of labour-intensive, export-oriented industrialisation on the basis of its
(endowment-determined) comparative advantage, which is in turn posited to be manifestation
of the ‘natural path of development’. If it is further posited that China’s export-oriented sector
is precisely its market-conforming sector, then, once again, the two orthodox propositions
described earlier are as if being preserved.11
There are serious problems with this view, however. In the first place, it begs the
question as to why such a presumably easy process of export-led growth has not occurred in
10 Ajit Singh (‘The actual crisis of economic development’) analyses the slowdown in late
industrialisation with an emphasis on the worsened demand conditions after the Golden Age.
Lance Taylor and C. Rada (‘Can the poor countries catch up? Sources of growth accounting
give weak convergence for the early 21st Century’, The Schwartz Working Papers no.2003-4,
http://www.newschool.edu/cepa/publications/workingpapers/index.htm, CEPA, New School
University, 2003) provides a more recent analysis along the same line of arguments. 11 World Bank, World Development Report (New York, Oxford University Press, 1996, ch.9).
See also N.R. Lardy, Integrating China into the Global Economy (Washington, D.C.: The
Brookings Institution, 2002, ch.2-4).
10
the wider underdeveloped world in a period known as globalisation. Concerning the actual
Chinese experience, it also appears to be dubious to claim that the economic growth is export-
led and that it is easy. At one level, according to national income accounting identities, what
counts as a constituent of aggregate demand is net exports, not gross exports. As can be seen
from Figure 2, in the period from 1978 to 1993 inclusive, there were eight years out of the
total of 16 where China actually registered trade deficits. And for the eight years that were
with trade surpluses, the ratios of net exports to GDP vary from 0.02% to 2.90%. It is only
from 1994 onwards that China has registered persistent trade surpluses. Even then, the ratios
of net exports to GDP have remained rather low, reaching 3.86% at their highest. Given the
low net exports-to-GDP ratios in most parts of the reform era and even in recent years, it is an
exaggeration to claim that exports have served as the main source of demand for China’s
economic growth. Such a judgement is unlikely to be significantly altered even if one takes
into account possible crowding-in effects of exports on the expansion of the other two
components of aggregate demand, i.e., consumption and investment.12
12 In line with our exposition on China’s dynamics of industry-led growth, the discussion
here focuses on the impact of exports expansion on economic growth by means of propelling
demand expansion. Theoretically, there could be other channels through which exports impact
on growth. In particular, it is often posited in the development literature that exports
expansion could promote the improvement in allocative and productive efficiency of domestic
industry via the pressure of competition in the world market (Andrea Boltho, ‘Was Japanese
growth export-led?’, Oxford Economic Papers, 1996, vol. 48, 415-432, reviews the main
theories of export-led growth). Viewed even in this broader perspective, Chinese experience
over the reform era still does not clearly appear to be a case of export-led growth. Simple
regression analyses of China’s 1978-2004 data give the following results:
y = -0.076 – 0.002 x Adjusted-R2 = -0.041
(-0.089)
y = -0.114 + 0.008 x – 0.335 l + 0.658 k Adjusted-R2 = 0.022
(0.303) (-0.949) (1.255)
(N/Y)n = -0.268 – 0.117 x + 0.626 l + 0.728 k Adjusted-R2 = 0.184
(-2.890***) (1.116) (0.874)
11
[Figure 2]
At another level, meanwhile, the claim that China’s export expansion has been largely
based on its ‘given’ (endowment-determined) comparative advantage, and hence must be
easy, should also be viewed with serious suspicion. One counter indicator, presented in Table
2 above, concerns the proportion of high-tech products in total manufacturing exports: in
2003, for instance, the ratio was 27% for China, which is higher than India (5%), Brazil
(12%), Russia (19%), and the average of all middle-income economies (21%). This ratio for
China is rather close to that of South Korea (32%), the latter being generally recognised as a
mature industrial economy. Yet, apart from India, all these economies are with much higher
levels of per capita income, and hence much lower degrees of ‘labour abundance’ or ‘capital
shortage’, than China. Conversely, it becomes difficult for China’s expansion in high-tech
exports to be explained by the theory of ‘given’ international comparative advantage.
In fact, in relation to the expanding high-tech exports is the large and very rapidly
expanding share of electronic products in China’s total manufacturing exports, from 6% in
1988 to around 36% by 2004 (data from the website of China’s Ministry of Commerce). In
terms of production characteristics, it can be shown that the electronics industry has a level of
per worker output value that is normally twice as high the average of Chinese industry. Yet, it
is customary in trade analysis to characterise industries with a value of relative labour
productivity exceeding unity as capital- and technology-intensive. In other words, a large and
rapidly expanding share of Chinese exports simply does not accord with the country’s ‘given’
where, Y, X, L, and K are GDP, exports, labour employment, and value of the capital stock,
respectively, with lower-case letters denoting the real annual growth rate of the corresponding
variables. It can be seen from the first regression result that the correlation between exports
growth and economic growth is statistically insignificant. The same applies to the correlation
between exports growth and productivity improvement, as can be seen from the second
regression result. Finally, in the case of the third regression where the equation is constructed
in a way to exclude the spurious effect of the national income accounting identity Y ≡ C + I +
G + X - M = N + X, (where C, I, G, and M are consumption, investment, government
12
comparative advantage. The point to note from these indicators of Chinese exports is that the
performance is not really an automatic, natural outcome of the regulation of the world market.
It must be part of – rather than being the cause of – the overall dynamics of Chinese
industrialisation.13
The above points appear to remain valid even if one goes one step further to take into
account the role of foreign capital in China’s economic transformation. It is often alleged that
inward foreign direct investment (FDI), the hitherto main form of foreign capital utilisation in
China, has in a very significant measure contributed to the country’s economic development –
in the form of the addition to capital formation, the transfer of better technology and
management practices, the promotion of structural and institutional changes in the direction of
raising the efficiency of the economy, etc. Further, there is the oft-highlighted observation
that a significant and rapidly expanding share of Chinese exports has been accounted for by
foreign capital invested enterprises (FIEs). Based on these beliefs, allegations and
expenditure and imports, respectively), it is found that the correlation between exports growth
and economic growth becomes statistically significant – but the correlation is negative. 13 Dic Lo and Thomas Chan (‘Machinery and China’s nexus of foreign trade and economic
growth’, Journal of International Development, 1998, vol.10, no.6, pp.733-749) analyse the
implications of China’s massive expansion in the export of mechanical and electronic
products since the mid-1980s, and argue that these exports have largely leapfrogged over the
country’s ‘given’ comparative advantage. Masao Yoshitomi (‘The comparative advantage of
China’s manufacturing in the twenty-first century’, in OECD [ed.] China in the 21st Century:
Long-Term Global Implications, Paris: OECD, 1996) gives a similar assessment: ‘China has
revealed comparative advantage vis-à-vis ASEAN countries in capital- and technology-
intensive products despite a similar development stage and even lower per-capita income.
China’s comparative advantage in labour-intensive and natural resource-based products is
essentially in relation to advanced countries and NIEs [newly industrialising economies], not
ASEAN countries. However, it is also interesting to note that over the past ten years, China
has been gaining comparative advantage relative to NIEs (in a broad range of technology- and
capital-intensive industries).’ See also Dani Rodrik, ‘What’s so special about China’s
exports?’ (Kennedy School, Harvard University, 2006, http://ksghome.harvard.edu/~drodrik).
13
observations, there has come out the assertion that China’s economic growth has been to a
large extent driven by the inflows of foreign capital and the operations of FIEs.14
The main problem with this orthodoxy-inspired assertion is that it does not fare well
with the observable realities. Consider, first, the addition to capital formation brought about
by foreign direct investment. As a ratio to gross fixed capital formation, FDI flows were of
small magnitudes from 1979 to 1991. Massive increases do have occurred from 1992, with
the ratio averaging to around 14% for ten years until 2004. This ratio is roughly twice as high
the average for all developing countries. Nevertheless, because they were only a fraction of
gross fixed capital formation, and the latter was in turn only a fraction of GDP, FDI flows
could not account for a significant part of China’ economic growth. A similar judgement can
be made regarding the contribution to export earnings by FIEs. True that FIEs have accounted
for a rapidly expanding share of China’s total exports, exceeding 40% from 1996 and 50%
from 2001 to reach 57% in 2004. Yet, it is also true that FIEs have accounted for an even
larger share of total imports, staying at the level of 58% even by 2004. For 13 years from
1985 to 1997, FIEs ran sizeable foreign trade deficits every year, quite in contrast to China’s
overall trade surplus meanwhile. And, although FIEs have enjoyed trade surplus every year
from 1998, such surplus has accounted for only a minor part of the national total.
What about the unobservable contribution of foreign capital? It is widely believed,
and inferred from regression analyses, that FDI flows and the operations of FIEs have raised
the efficiency of the Chinese economy – through such mechanisms as technology transfer,
and the promotion of structural and institutional changes. But, again, this belief does not seem
to fare well with the reality as a whole; and, insofar as the indicated inference does have its
empirical backing, there is always a serious question of distinguishing correlation from
causation (in the dictionary, not statistical, meaning of the term).
14 See, e.g., J-C. Berthélemy and S. Démurger, ‘Foreign direct investment and economic
growth: theory and application to China’ (Review of Development Economics, 2000, vol.4,
no.2, pp.140-155), and W. Tseng and H. Zebregs, ‘Foreign direct investment in China: some
lessons for other countries’ (IMF Policy Discussion Paper PDP/02/3, 2002, www.imf.org).
14
In this connection, it is of interest to note the contrast in productivity performance
between the industries of the two main centres of China’s FDI utilisation: Guangdong
province vis-à-vis the Shanghai region (i.e., Shanghai municipality plus Jiangsu province). In
2003, the share of FIEs in the value-added of all local industrial enterprises was 59% for
Guangdong province and 42% for the Shanghai region, compared with the level of 28% in
China as a whole. It is well-known that Guangdong’s economic development has followed a
path of labour-intensive, export-oriented industrialisation, in line with the principle of
comparative advantage. It is also well-known that the Shanghai region has followed a
development path that is in the opposite direction, i.e., inward-looking, capital-deepening
industrialisation. Now, it can be seen from Table 3 that, from 1991 to 2004, the labour
productivity of Guangdong relative to the national average decreased substantially while that
of the Shanghai region saw a modest increase. These reflect their opposite industrialisation
paths: relative to the national average, Guangdong industry has become more labour-intensive
whereas Shanghai industry has become more capital- and technology-intensive. Yet, Table 3
also shows that, relative to the national average, the total factor productivity of Guangdong
industry also decreased substantially whereas that of the Shanghai region again registered a
modest increase. Taken together, these observations imply that, insofar as FDI has indeed
been positively correlated to productivity growth, this has tended to be limited to such context
wherein the development paths deviate from the principle of the market.
[Table 3]
Similar analyses of the relative productivity performance of industrial sectors in the
country as a whole reinforce this point. There is no clear pattern of FIEs-dominated sectors
having outperformed the rest of Chinese industry in terms of total factor productivity growth;
and, for those FIEs-dominated sectors that have indeed had better-than-average performance,
they have tended to be capital- and technology-intensive. It appears that FDI has been drawn
into these sectors mainly because of dynamic factors, i.e., the potential for rapid productivity
growth and/or demand-side considerations. Conversely, insofar as FDI is correlated to
productivity improvement in the Chinese industries and regions, this is likely to be a matter of
15
cumulative rather than unidirectional causation. Just like the relationship between exports
expansion and economic growth, the positive contribution of FDI is part of – rather than
being the cause of – the overall dynamics of the Chinese economy.15
On the whole, from the discussion above on the economic impact of foreign trade and
FDI flows, it seems reasonable to draw the following two conclusions concerning the role of
the external dynamics in China’s economic transformation. First, in aggregate terms, the role
of the external dynamics is found to be modest. It is found that net exports as a source of
aggregate demand and FDI as an addition to gross fixed capital formation have both been
small in magnitude. Second, in the structural sense of industrial upgrading and of raising the
efficiency of the economy, the role of the external dynamics cannot be clearly delineated but
is unlikely to be in line with the orthodox notion of the ‘natural path of development’. The
positive impact of the external dynamics in this second respect is found to be part of, rather
than being the cause of, the overall dynamics of the Chinese economy. In other words, the
external dynamics is to a significant extent generated by China’s domestic factors, rather than
being the natural outcome of the logic of the world market.
Viewed from the perspective of worldwide late development, the Chinese model of
economic development has thus exhibited both similarities and differences compared with the
canonical ‘East Asian model’ of industrialisation as delineated by a number of renowned,
non-orthodox exponents. On the similarity side, writers like Alice Amsden and Robert Wade,
on the basis of their studies of the East Asian experiences, have forcefully argued that late
industrialisation requires the building up of sophisticated production capability, which is not
at all an easy task. And scholars that apply this theory to study Chinese industrialisation have
come out with the conclusion that what is required for successful late development is not just
production capability as such but rather the building up of indigenous innovative capability,
15 Dic Lo, ‘Assessing the role of foreign direct investment in China’s economic development’
(Economics Department working paper, SOAS, London, September 2003,
http://www.soas.ac.uk/departments/departmentinfo.cfm?navid=437); revised February 2006.
16
indeed of an indigenous ‘national system of innovation’.16 On the difference side, meanwhile,
it appears that Chinese industrialisation is much less than its East Asian counterpart in relying
on the external, world market as its source of demand and productivity growth. The external
dynamics has played a comparatively less important role in the Chinese case.
4. The Internal Dynamics: the Demand Question and the Growth Paths
Thus, any convincing account of China’s industry-led economic growth necessarily requires
an explicit analysis of the internal dynamics. Recall that from Figure 2 it was clearly evident
that, of China’s aggregated demand, consumption accounted for a substantially bigger share
in 1978-1992 than in 1993-2004. The opposite was true for the share of aggregate demand
accounted for by investment. Corresponding to this change in the composition of demand is
the evolution of the level of industrial labour productivity relative to the rest of the economy,
shown in Figure 1. In the first half of the reform era, industrial growth (and hence overall
economic growth) was to a large extent propelled by the transfer of unskilled labour from the
rural-agricultural sector to the more productive industrial sector. This exerted downward
pressures on industrial relative labour productivity. Since the early 1990s, however, industrial
development has followed a new path that is characterised by ‘capital deepening’. Industrial
relative labour productivity has tended to rise, and at an accelerating pace. And the share of
industrial labour employment in the national total has stagnated, in contrast to the persistent
increases in the 1978-1992 period. Clearly, there was a fundamental break in the early 1990s
16 Alice Amsden, Asia’s Next Giant: South Korea and Late Industrialization (New York:
Oxford University Press, 1989, ch.1); Robert Wade, Governing the Market: Economic Theory
and the Role of Government in East Asian Industrialization (New Jersey: Princeton
University Press, 1990, concluding chapters). Qiwen Lu, China’s Leap into the Information
Age: Innovation and Organization in the Computer Industry (New York: Oxford University
Press, 2000); William Lazonick, ‘Indigenous innovation and economic development: lessons
from China’s Leap into the Information Age’, paper presented at the Annual Meeting of the
Business History Conference, Lowell, Massachusetts, 28 June 2003.
17
whereby Chinese economic growth shifted from consumption-led to investment-led, and from
‘industrial widening’ to ‘capital deepening’.
[Figure 3]
In this connection, for analysing the demand question in China’s economic growth, it
would be illuminating to follow a recurring thesis of Post-Keynesian (and arguably Marxian)
macroeconomics in focusing on income distribution. The starting point concerns the evolution
of the structure of Chinese industry. As can be seen from Table 4, in the first half of the
reform era and more conspicuously in the second half, a prominent feature of the evolution is
the rapid expansion of the output share of heavy manufacturing industries, along with the
shrinkage of extraction industries and light industries that use farm products as raw materials
(particularly the industrial sectors of textile, clothing and leather products). A closer look at
the evolution further reveals that it is the broad machinery sector, particularly the electronics
industry, that has had the biggest gain in output share.
[Table 4]
This seems unusual. For, traditionally, it is a notorious character of the Soviet-type
centrally planned system that the machinery sector plays a leading role in the economy. In the
case of China, by 1980, the sector had already expanded to the extent of accounting for up to
23% of the total output of Chinese industry. Does the further expansion of the sector in the
reform era, therefore, signify a continuation of the Soviet-type Feldman-Mahalanobis model
of economic growth – that is, a growth path that is based on ‘producing investment goods for
producing investment goods’ (or, in short, ‘producing machines for producing machines’)? In
view of the actual situation, and of our preceding discussion on the inferences from Figures 1
and 2, the answer appears to be ‘no’ for the first half of the reform era and probably ‘yes’ for
the second half.
In the first half of the reform era, the massive expansion of the machinery sector (and
light industries using non-farm products as inputs) was actually associated with a phenomenal
development that was felt by the entire Chinese population: the ‘consumption revolution’
signified by the explosive growth of a very wide range of consumer durables, ranging from
18
electrical and electronic home appliances in the 1980s to mobile phones, personal computers
and the like in the 1990s. These products are not investment goods, but they do belong to the
mechanical and electronics industry. It was the explosive growth of these new consumer
durables that accounted for the expansion of the machinery sector in the 1978-1992 period.
And the machinery sector was the main driving force behind the growth of Chinese industry
as whole, as well as the transfer of productivity gains from industry to the rest of the economy
via changes in relative prices and other mechanisms.17
In terms of technical and economic characteristics, the new consumer durables belong
to mass-production industries that are characterised by rapid technological change, extensive
backward and forward linkages and high income elasticity of demand. Their explosive growth
in the first half of the reform era was thus sustained by the existence of mass consumption in
the domestic market. More generally, it may be argued that China’s rapid economic growth in
the 1978-1992 period was based on a nexus of causal relationships that could be characterised
as the following: consumption induced investment and thus overall demand expansion,
thereby making it possible to absorb labour transfer from agriculture and to improve industrial
productivity via dynamic increasing returns. In other words, there was a virtuous circle
between consumption and production, and between industry and the economy. This
characterisation of the fundamental dynamics of China’s economic growth path is consistent
with the three features of the Chinese economy indicated earlier: namely, the direction of
structural change associated with the ‘consumption revolution’, the leading role of industry in
economic growth in line with ‘Kaldor’s stylised facts’, and the judgement that the external
dynamics (the positive impacts of foreign trade and FDI flows) is mostly a consequence
rather than a cause of the characterised internal dynamics.
17 Dic Lo, China’s Transformational Growth: A Structural-Institutional Analysis (in Chinese)
(Beijing: Economic Science Press, 2001) ch.3-4 analyses in details the role of the machinery
sector, particularly the expansion of the indicated new consumer durables, in the dynamics of
Chinese industrialisation and economic growth.
19
The dynamics or nexus of causal relationships of China’s economic growth over the
first half of the reform era, characterised above, presupposes the existence of two necessary
conditions. First, the process of structural change, which was the main driving force of
economic growth, involved both a rapid expansion of the share of industry in the economy
and the leading role of a wide range of new, consumer durables industries. The former aspect
corresponds to the trend of labour transfer from agriculture to industry, and hence improving
allocative efficiency, while the second aspect corresponds to the ‘Kaldor-Verdoorn Laws’ of
improving industrial productivity via dynamics increasing returns. Second, there must exist an
even, egalitarian pattern of income distribution, which underpins mass-consumption, thereby
inducing investment and overall demand expansion. By income distribution it covers the total
of both money and non-money incomes for Chinese people, particularly for urban residents in
the first half of the reform era. The degree of egalitarianism is thus difficult to be gauged by
conventional measures of income distribution such as the Gini index. Perhaps much more
appropriate measures would be social development indicators such as life expectancy at birth,
the infant mortality rate, and the adult illiteracy rate. It is well-known that, in these measures,
China’s performance in the late 1970s was very close to the average of all middle-income
economies in the world, in spite that it was a low-income economy. By the early years of the
Twenty-First century, China’s performance in the social development indicators remained
very close to the average of all middle-income economies, despite the fact that its economic
growth in the preceding two decades had far outstripped the rest of the developing world.
Overall, it would be appropriate to assert that, for the main part of the reform era, China’s
pattern of income distribution tended to be egalitarian by international standard – although it
is also true that egalitarianism tended to wither along with the market reform.
It was precisely the worsening of the pattern of income distribution under the market
reform that led to the fundamental shift of China’s growth path in the early 1990s. Though not
a very good measure, the Gini index does broadly indicate the trend of worsening income
distribution. In 1978, the value of the Gini index in China was 0.16 for urban households and
0.21 for rural households, both being rather low in international comparison. By 1992, the
20
value increased to a moderate level of 0.25 for urban households and a high level of 0.31 for
rural households. By the year 2000, the value rose to high levels for both set of households:
0.32 urban, 0.35 rural.18 In this context, from the early 1990s until the present time, the
leading position of consumption has been taken over by investment in sustaining economic
growth on the demand side. This resulted in the accelerating pace of ‘capital deepening’ in the
path of economic growth, indicated in Figure 1. In contrast to the first half of the reform era,
the contribution of the effect of labour transfer to economic growth – that is, the improvement
in allocative efficiency as a source of productivity growth – has tended to be weakened. What
has been of increasing importance is dynamic increasing returns within industry.
Conceptually, in the relevant theoretical literature, it is often posited that dynamics
increasing returns are not determined by technical factors alone. Neo-Schumpeterian theory of
innovations rather posits that dynamic increasing returns are typically determined by the
interaction between technical factors and economic conditions, with the latter being referred
to the demand environment plus the nature of the institutions involved. Demand-induced
productivity growth typically takes the form of learning-by-doing effects, the inducement of
investment for technological renovation and upgrading, and the deepening of the division of
labour in the economy as a whole – the effects of collective learning, in short. And the nature
of the economic institutions involved is discernible in their capability of taking advantage of
the demand conditions to generate collective learning. More concretely, institutional attributes
that are consistent with collective learning entail the requirement of rigidities – that is, long-
term-oriented relationships between major economic agents, particularly the finance-industry
and firm-employees relationships. These attributes are antithetical to the logic of allocative
efficiency, whose realisation requires flexibilities, particularly the free movements of finance
in the pursuit of high profitability. Post-Keynesian economics, similar to the Marxian notion
of ‘productive activities’, tends to posit that dynamic increasing returns are mostly restricted
18 Data from Li Shi et. al., A Positive Analysis of Income Distribution in China, (in Chinese)
(Beijing, Shehui Kexue Wenxian Chubanshe, 2000) and Renmin Ribao (People’s Daily) 9th
July 2002.
21
to the manufacturing sector. This implies that its focus is on the purely technical dimension.
Even the ‘Kaldor-Verdoorn Laws’, which represent an attempt to combine technical factors
with the demand conditions, appear to be incomplete in analysing the sources of dynamic
increasing returns. A complete analytical framework would require further incorporating the
investigation into the relevant institutional attributes and their interaction with the technical
factors and the demand conditions.
We leave the issue of institutional attributes in China’s economic transformation to be
analysed in the next section. To close our analysis of structural change and economic growth,
it is useful to note that, in both Marxian and Post-Keynesian economics, demand expansion is
normally determined by two sets of factors, exogenous and endogenous. Exogenous factors
refer to the pattern of income distribution and that of consumption, and underpinning these
patterns the history-specific political and cultural conditions. Endogenous factors, meanwhile,
refer to the specificity of the economic growth path in question. More concretely, in Marxian
economics, the sustainability on the demand side of a growth path based on ‘producing
machines for producing machines’ is determined by the pace of production innovations. It is
through production innovations that the variety of investment goods could continuously
expand, and that the law of diminishing demand may not apply.19 The sources, and pace, of
product innovations in Chinese economic growth particularly since the early 1990s are an
important issue wanting scholarly studies. Nevertheless, one point seems clear: in addition to
domestic generation, a very important source of product innovations is from continuous, large
scale importing of foreign technology. It is in this particular respect that the external
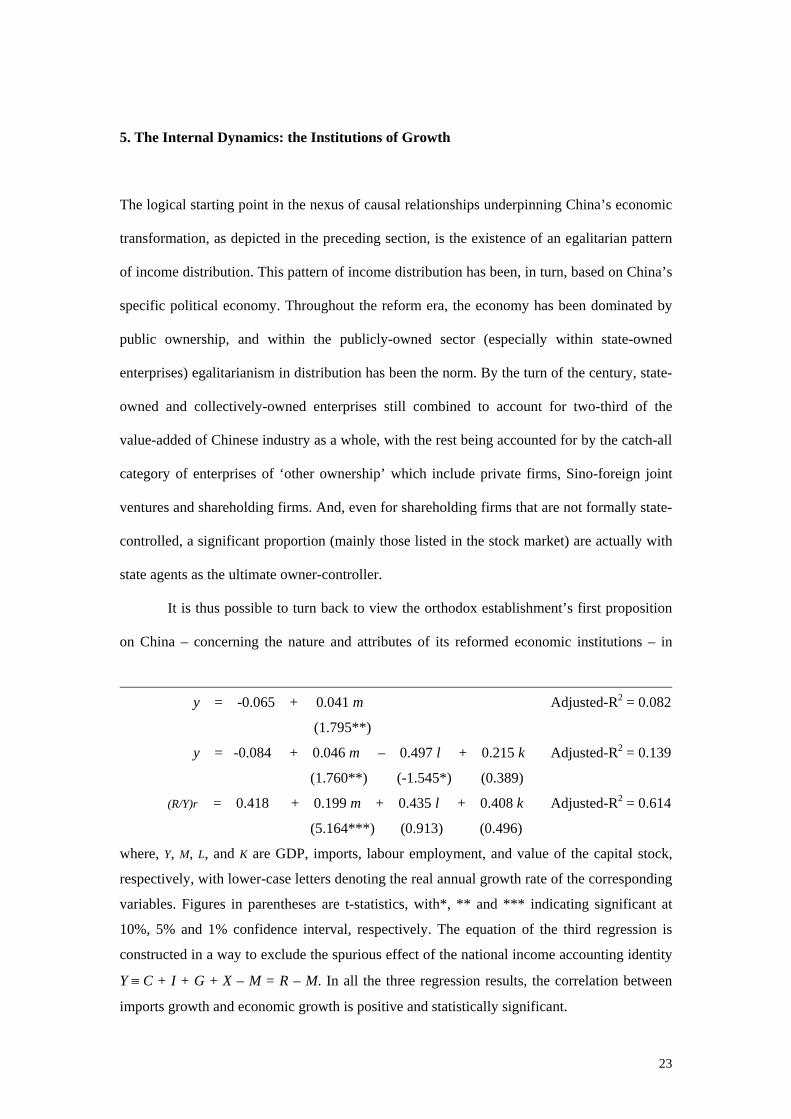
dynamics has played a crucial role in China’s overall economic transformation.20
19 Meng Jie, The Innovative Transformation of Marxist Economics’ (in Chinese) (Beijing:
Economic Science Press, 2001) provides a review and reformulation of the relevant theories,
particularly on the role of product innovations in the debates surrounding Luxemburg’s theory
of capital accumulation and Mandel’s theory of the long waves in capitalist development. 20 Dic Lo and Thomas Chan (‘Machinery…’). In contrast to the relationship between exports
expansion and economic growth, simple regression analyses of China’s 1978-2004 data of
imports expansion and economic growth give the following results:
22
5. The Internal Dynamics: the Institutions of Growth
The logical starting point in the nexus of causal relationships underpinning China’s economic
transformation, as depicted in the preceding section, is the existence of an egalitarian pattern
of income distribution. This pattern of income distribution has been, in turn, based on China’s
specific political economy. Throughout the reform era, the economy has been dominated by
public ownership, and within the publicly-owned sector (especially within state-owned
enterprises) egalitarianism in distribution has been the norm. By the turn of the century, state-
owned and collectively-owned enterprises still combined to account for two-third of the
value-added of Chinese industry as a whole, with the rest being accounted for by the catch-all
category of enterprises of ‘other ownership’ which include private firms, Sino-foreign joint
ventures and shareholding firms. And, even for shareholding firms that are not formally state-
controlled, a significant proportion (mainly those listed in the stock market) are actually with
state agents as the ultimate owner-controller.
It is thus possible to turn back to view the orthodox establishment’s first proposition
on China – concerning the nature and attributes of its reformed economic institutions – in
y = -0.065 + 0.041 m Adjusted-R2 = 0.082
(1.795**)
y = -0.084 + 0.046 m – 0.497 l + 0.215 k Adjusted-R2 = 0.139
(1.760**) (-1.545*) (0.389)
(R/Y)r = 0.418 + 0.199 m + 0.435 l + 0.408 k Adjusted-R2 = 0.614
(5.164***) (0.913) (0.496)
where, Y, M, L, and K are GDP, imports, labour employment, and value of the capital stock,
respectively, with lower-case letters denoting the real annual growth rate of the corresponding
variables. Figures in parentheses are t-statistics, with*, ** and *** indicating significant at
10%, 5% and 1% confidence interval, respectively. The equation of the third regression is
constructed in a way to exclude the spurious effect of the national income accounting identity
Y ≡ C + I + G + X – M = R – M. In all the three regression results, the correlation between
imports growth and economic growth is positive and statistically significant.
23
different light. What it considers as market-supplanting elements of the Chinese economy are
precisely the egalitarian systemic features, particularly the institutions and behaviour of state-
owned enterprises (SOEs). The concerned observation is widely agreed: that the institutional
arrangements of China’s SOEs have been contradicting the principles of the canonical market
economy, especially individualistic property rights. Conceptually, in the relevant literature,
China’s enterprise reform has generally been portrayed as a process of the state attempting to
employ and induce entrepreneurial activities of the managerial layer. But, it is noted that this
process has taken place in a broader context where various stake-holders of enterprises – local
governments, workers, local communities, the banks and other business partners – have been
involved to form a web of check and balance governing the operation and development of
enterprises. This systemic feature is visible not only in SOEs but also in enterprises of other
types of public ownership, so much so that some from the orthodox establishment have
dismissively termed the renowned collectively-owned township and village enterprises
(TVEs) as ‘the second state sector’.21
The crucial question, however, is: what are the implications of this rigidity-infused,
long-term-oriented systemic feature of China’s industrial enterprises with respect to economic
development? Specifically, even if it is true that this feature has its advantage of underpinning
the egalitarian pattern of income distribution and mass consumption, as suggested above, has
it also resulted in – as the orthodox establishment persistently maintains – gross inefficiency
of enterprise at the micro level?
Of course, the assertion about the allegedly ailing state sector in China has been so
popular in Western media that it seems trivial to answer the question. But, in the scholarly
21 For analyses of the institutional attributes of China’s SOEs and TVEs, see, respectively,
Dic Lo (China’s Transformational Growth, chapters 5-6), and Russell Smyth (‘Township and
village enterprises in China – growth mechanism and future prospects’, Journal of
International Economic Studies, 1998, vol.12, pp.101-117). Both studies observe that the
reformed enterprise system – whether SOEs or TVEs – has exhibited the kind of institutional
rigidities and long-term orientation that are akin to the canonical Japanese system, and argue
that this system has embodied the kind of relative efficiency attributes detailed below.
24
(rather than journalistic) literature, the assertion has in fact been a matter of debate. The
debate first centres around the assessment of productivity change of SOEs in the reform era.
Because of the very different estimation results of total factor productivity growth in SOEs
obtained by different studies, and because of lacking objective criteria to resolve the
difference, the orthodox assertion has been but just one, and far from being the dominant one,
of the established views on the matter. Hence, and against the background of the East Asian
financial and economic crisis, the orthodox establishment has shifted to base its assertion on
the assessment of the financial performance of SOEs. It is claimed that the observed trend of
declining enterprise profitability, together with the increasing ratio of non-performing loans
of state-owned banks, are both symptoms of the same ill: the gross inefficiency of SOEs. It is
further claimed that this must be treated as a matter of urgency, as otherwise an East Asian-
type crisis is most likely to occur in China.22
Compared with the second orthodox proposition (on development) indicated earlier in
the article, this first proposition (on institutions) does not appear to fare better with the reality.
On the one hand, it is a gross exaggeration to assert that the nexus of SOEs, state-owned
banks and the state itself as a whole is anything on the verge of a financial crisis. The fact that
China has survived well the East Asian crisis since 1997 flies in the face of this assertion. To
the extent that the nexus has indeed accumulated financial problems, they are largely a result
of the fiscal difficulty of the state rather than enterprise inefficiency. For, over the reform era,
22 Representative of the orthodox view on productivity growth are the works by Wing-Thye
Woo, Wen Hai, Yibiao Jin and Gan Fan (‘How successful has Chinese enterprise reform
been? Pitfalls in opposite biases and focus’, Journal of Comparative Economics, 1994, vol.18,
pp.410-437; and, ‘Reply to comment by Jefferson, Rawski and Zheng’, China Economic
Review, 1994, vol.5, pp.243-249). Representative of the dissident view are the works by G.H.
Jefferson, T.G. Rawski and Yuxing Zheng (‘Growth, efficiency, and convergence in China’s
state and collective industry’, Economic Development and Cultural Change, 1992, vol.40,
pp.239-266; and, ‘Chinese industrial productivity: trends, measurement issues, and recent
development’, Journal of Comparative Economics, 1996, vol.23, pp.146-180). Along the
orthodox line, the most articulate analysis of the financial aspect of Chinese enterprises is
N.R. Lardy, China’s Unfinished Economic Revolution.
25
SOEs have paid all the social costs that should have been the responsibility of state finance.
They have paid income taxes at much higher rates than other enterprises, while also facing
serious under-capitalisation from the state-owner. On the other hand, the observed decline of
enterprise profitability reflects more a macroeconomic issue than microeconomic inefficiency.
As can be seen from Figure 4, the pre-tax profit rate of SOEs has in fact been very close to the
average of all enterprises: slightly higher in the 1980s and slightly lower in the 1990s, while
both exhibiting a tendency of secular decline up until 1998, and of substantial rebound post-
1998. Noting that China’s accounting system has tended to underestimate depreciation, and
hence to overestimate the capital stock of SOEs which are in general much older than non-
SOEs, it could be argued that the profit rate of SOEs is likely to have been higher than
industrial average throughout the reform era.23
[Figure 4]
Figure 4 also shows that, throughout the reform era, the pre-tax profit rate of large-
scale enterprises has been much higher than the industrial average. It can be verified that the
same applies regarding the comparison of other performance indicators, such as output and
productivity growth. Given that the vast majority of large-scale enterprises are in fact SOEs –
that is, they have formed the core of China’s state sector – it appears that the first orthodox
proposition cannot be farther from the reality. What is more reasonable, therefore, is to see
how this seemingly paradoxical reality could be made sense. In other words, what kind of
advantage can be generated by the systemic feature of SOEs, which appears to have more
23 Dic Lo, ‘Reappraising the performance of China’s state-owned industrial enterprises, 1980-
96’ (Cambridge Journal of Economics, 1999, vol.23, pp.693-718) gives an assessment of the
performance of SOEs, particularly large-scale enterprises, that is in line with the arguments
presented here. Yuk-shing Cheng and Dic Lo ‘Explaining the financial performance of
China’s industrial enterprises: beyond the competition-ownership controversy’ (The China
Quarterly, 2002, no.170, pp.413-440) contend that, even without taking into account social
burdens, the financial performance of SOEs has been at least comparable to the rest of
Chinese industry while that of large-scale SOEs has been much better.
26
than compensated for the (allocative) efficiency loss that is deemed unavoidable from the
standpoint of orthodox economic theory?
It will be recalled that the reformed Chinese enterprise system has been infused with
rigidities, especially with an emphasis on maintaining a long-term relationship with major
stake-holders. This is akin to the canonical East Asian, or Japanese, system, and there are
well-developed economic theories to explain the distinctive advantage and disadvantage of
systemic features of this kind. Succinctly, in the context of steadily growing market demand,
industrial firms that are infused with rigidities and long-term orientation are especially
capable of improving productivity via various kinds of dynamic efficiency, particularly
through collective learning. By contrast, in the context of stagnant or contracting demand,
firms of this kind have difficulty in adjustment and hence tend to be out-competed by flexible,
market-conforming and short-term-oriented firms.24
The above theoretical argument appears to be reasonable for explaining the fact that,
on existing indicators, China’s SOEs out-competed non-SOEs in the demand-expanding
1980s but were out-competed in the demand-stagnant 1990s. Conversely, such an explanation
also pushes to the forefront the most prominent feature of the Chinese ‘model’ of economic
transformation. This, namely, is the basically appropriate match between mass consumption
at the macro level and the long-term-oriented behaviour of enterprises at the micro level, and,
behind this, that between the egalitarian income distribution and the systemic feature of
enterprises being accountable to major stake-holders. Needless to say, the significance of this
24 Masahiko Aoki, ‘Toward an economic model of the Japanese firm’ (Journal of Economic
Literature, 1990, vol.28, pp.1-27), provides a schematic, theoretical exposition on the relative
efficiency attributes of the (both stylised) Japanese firm vis-à-vis the American firm. Dic Lo
and Russell Smyth, ‘Towards a re-interpretation of the economics of feasible socialism’,
(Cambridge Journal of Economics, 2004, vol.28, no.6, pp.791-808), in a similar vein,
synthesise a range of theories on technological paradigms, growth paths and economic
institutions to investigate the relative efficiency attributes of different economic systems.
27
match is no less than the sustained rapid economic growth itself. It offers the opportunity for
China to embark on a path of late development that takes a strongly socialist character.25
But, it is also at this point that the constraints confronted by the pattern of economic
transformation depicted above are clearly exposed. The introduction of market practices
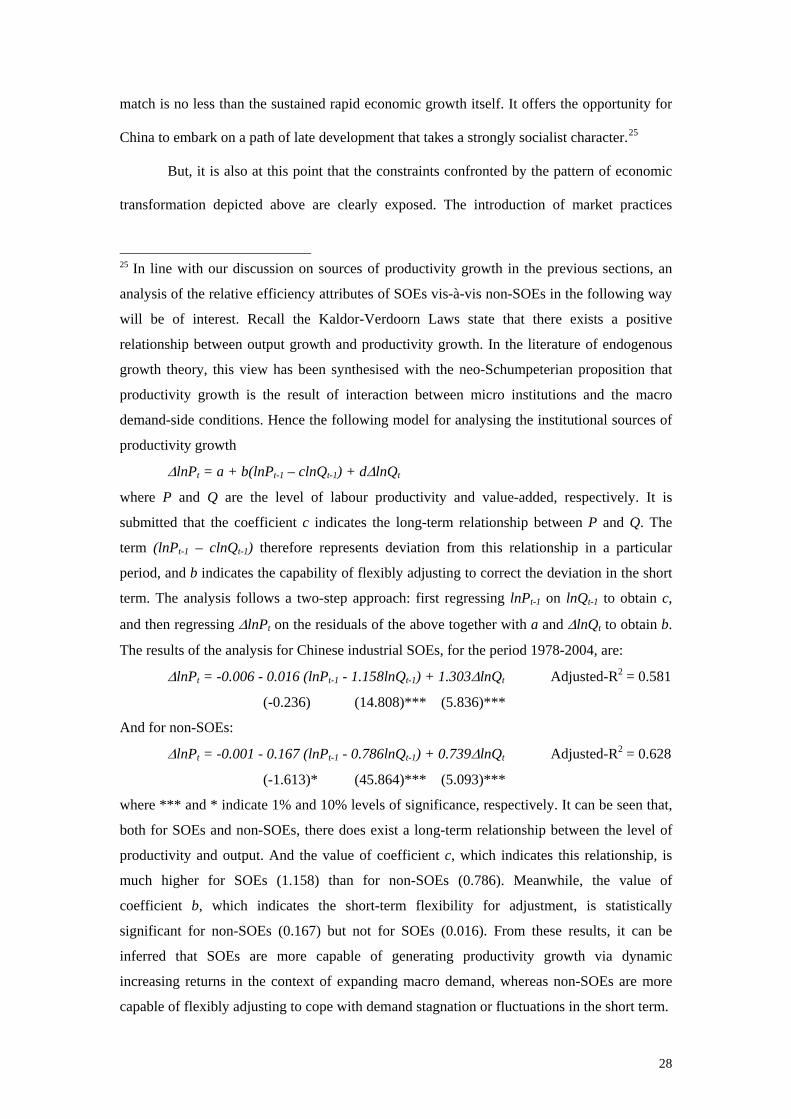
25 In line with our discussion on sources of productivity growth in the previous sections, an
analysis of the relative efficiency attributes of SOEs vis-à-vis non-SOEs in the following way
will be of interest. Recall the Kaldor-Verdoorn Laws state that there exists a positive
relationship between output growth and productivity growth. In the literature of endogenous
growth theory, this view has been synthesised with the neo-Schumpeterian proposition that
productivity growth is the result of interaction between micro institutions and the macro
demand-side conditions. Hence the following model for analysing the institutional sources of
productivity growth
ΔlnPt = a + b(lnPt-1 – clnQt-1) + dΔlnQt
where P and Q are the level of labour productivity and value-added, respectively. It is
submitted that the coefficient c indicates the long-term relationship between P and Q. The
term (lnPt-1 – clnQt-1) therefore represents deviation from this relationship in a particular
period, and b indicates the capability of flexibly adjusting to correct the deviation in the short
term. The analysis follows a two-step approach: first regressing lnPt-1 on lnQt-1 to obtain c,
and then regressing ΔlnPt on the residuals of the above together with a and ΔlnQt to obtain b.
The results of the analysis for Chinese industrial SOEs, for the period 1978-2004, are:
ΔlnPt = -0.006 - 0.016 (lnPt-1 - 1.158lnQt-1) + 1.303ΔlnQt Adjusted-R2 = 0.581
(-0.236) (14.808)*** (5.836)***
And for non-SOEs:
ΔlnPt = -0.001 - 0.167 (lnPt-1 - 0.786lnQt-1) + 0.739ΔlnQt Adjusted-R2 = 0.628
(-1.613)* (45.864)*** (5.093)***
where *** and * indicate 1% and 10% levels of significance, respectively. It can be seen that,
both for SOEs and non-SOEs, there does exist a long-term relationship between the level of
productivity and output. And the value of coefficient c, which indicates this relationship, is
much higher for SOEs (1.158) than for non-SOEs (0.786). Meanwhile, the value of
coefficient b, which indicates the short-term flexibility for adjustment, is statistically
significant for non-SOEs (0.167) but not for SOEs (0.016). From these results, it can be
inferred that SOEs are more capable of generating productivity growth via dynamic
increasing returns in the context of expanding macro demand, whereas non-SOEs are more
capable of flexibly adjusting to cope with demand stagnation or fluctuations in the short term.
28
might be necessary for the formation of micro-level incentives for economic development, but
market reforms in the strict sense – that is, principles of individualistic property rights – are
bound to disrupt the match between the macro environment and the micro institutions detailed
above. On the macro side, such reforms tend to reduce workers’ income and threaten their job
security, thereby undermining egalitarian income distribution and mass consumption. On the
micro side, such reforms threaten the loyalty or long-term commitment of major stake-holders
(again, workers in particular) to the firm, thus undermining the scope for collective learning.
The 1995-97 nationwide downsizing drive in state industry is especially crucial in
this regard. Initiated by the state leadership with an objective of transforming large and
medium SOEs into modern corporations and small SOEs into shareholding cooperatives, the
drive was seized upon by many local governments to simply sell off state assets while
unilaterally defecting on the state’s obligation for the job security of workers (and passing the
liabilities of the sold enterprises onto state banks and ultimately to the central government).
The crux of the matter is that, in the context of the demand-stagnant 1990s, SOEs had
difficulty in utilising the relative efficiency attributes of their rigidity-infused, long-term-
oriented institutions to generate dynamic increasing returns. They were thus ill-equipped for
competing with the more market-oriented non-SOEs, as well as transnational corporations
which began to enter China in massive scales from the early 1990s. The downsizing drive
launched by local governments, in the form of mass lay-off, further worsened the situation.
Consequently, unemployment surged, consumption expansion slowed down further
and investment growth also stagnated. Together with the worsening external environment
caused by the East Asian crisis, all these plunged China into a state of deflation at the macro
level, and worsening financial performance of industrial enterprises at the micro level, in the
closing years of the century. It was only with a significant policy reversal, where the state
leadership shifted from the stance of pushing forward the drive of marketisation to forcefully
implement a range of market-supplanting policies – Keynesian-type fiscal stimuli, welfare-
state measures, policies to revitalise SOEs and state banks, and a cautious approach to
reforming the regime of external transactions (particularly to shelve the target of liberalising
29
the country’s capital account) – that economic growth was sustained in the crisis-prone period
of 1998-2000.26
The policy reversal in 1998-2000 did not result in the resumption of the previous
pattern of economic transformation, however. What has emerged is a new pattern that exhibits
strong resemblance to the canonical East Asian model of economic institutions and growth.
At one level, the path of industrialisation characterised by capital deepening has become
firmly established, with the pace of capital deepening tending to accelerate. This is largely
due to the fact that consumption expansion has continued to be sluggish, and its leading
position has been taken over by investment. Hence the characteristic of ‘producing machines
for producing machines’. Meanwhile, at another level, consistent with capital deepening and
economic growth based on increasing returns is the rapid expansion of large-scale enterprises:
their value-added share in Chinese industry as a whole increased from 27% in 1998 to 36% in
2002. This is somewhat ironical, as it occurred in a period when, on the world scale and
particularly from the orthodox establishment, there was widespread criticism on the East
Asian model of capital-deepening industrialisation carried out by large-scale industrial
conglomerates – the model dismissively termed as ‘crony capitalism’.
This new pattern of economic transformation is clearly different from that of the first
half of the reform era. There is no trace of existing an appropriate match between egalitarian
income distribution and a systemic feature of enterprises being accountable to major stake-
holders. True that, along with capital deepening and the indicated policy reversal, there has
witnessed a phenomenal revival of the state sector. The value-added share of SOEs in Chinese
industry increased from 33% in 1998 to 35% in 2002 and further to 37% in 2004, amid the
rebound of their profit rate to once again surpass the industrial average. Yet, in an institutional
sense, this revival has been more than outweighed by the massive decrease in the employment
26 Raymond W.K. Lau, ‘The 15th Congress of the Chinese Communist Party: milestone in
China’s privatization’ (Capital and Class, 1999, no.68, pp.51-87) provides a detailed analysis
of the 1995-97 enterprise downsizing and privatisation drive. Dic Lo, (‘China after East Asian
developmentalism’) analyses the significance of the policy reversal in 1998-2000.
30
share of SOEs in Chinese industry: it decreased from 38% in 1998 to 21% in 2004. And this
reflects the broader trend of shrinking employment share of the public sector in the Chinese
society as a whole. As can be seen from Table 5, of the total of urban employment, the
combined share of state-owned and collectively-owned units decreased from 76% in 1995 to
29% in 2004. In the rural areas, the employment share of the collective township-village
enterprises remained basically unchanged during this period, in contrast to the persistent
increase in the first half of the reform era. Surely, a society where the main part of labour
employment is with the private sector is very remote from socialist pursuit.
[Table 5]
6. Speculation over the Future Prospects
In the discussion so far, we have left untouched a dimension that is conceivably of enormous
importance in explaining the actual experience of China’s economic transformation: namely,
politics. Ultimately, the inquiry into the role of politics comes down to answering the
following question: if the pattern of economic transformation in the first half of the reform era
has proved to be very successful in underpinning the sustained rapid economic growth, why
has it been progressively abandoned from the early 1990s onwards? In particular, why did the
Chinese state unfailingly pursue the policies of marketisation? An adequate answer to these
questions would require analysing such fundamental issues as the changing social formation
and class relations – defined, to be rigorous, in the Marxian sense in relation to the
‘economic’ matters discussed in this article – in China, as well as the changing relationship
between China (‘socialism in one country’) and the capitalist world system. These issues are
really too big to be dealt with in the article.
Nevertheless, it might still be possible and useful to attempt a less deep-going answer
to the indicated questions by looking at the ‘agents’, rather than ‘structures’, in China’s social
formation. Recall that what have most fundamentally undermined the depicted pattern of
economic transformation are the 1995-97 enterprise downsizing or privatisation drive,
31
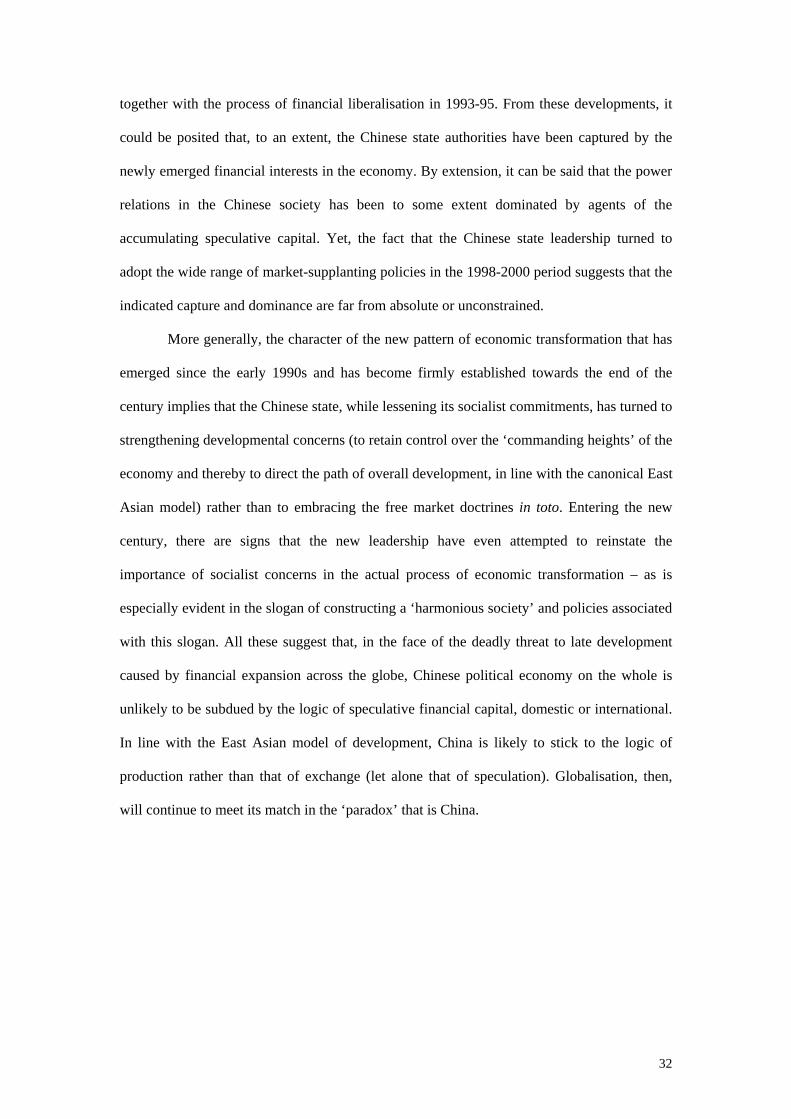
together with the process of financial liberalisation in 1993-95. From these developments, it
could be posited that, to an extent, the Chinese state authorities have been captured by the
newly emerged financial interests in the economy. By extension, it can be said that the power
relations in the Chinese society has been to some extent dominated by agents of the
accumulating speculative capital. Yet, the fact that the Chinese state leadership turned to
adopt the wide range of market-supplanting policies in the 1998-2000 period suggests that the
indicated capture and dominance are far from absolute or unconstrained.
More generally, the character of the new pattern of economic transformation that has
emerged since the early 1990s and has become firmly established towards the end of the
century implies that the Chinese state, while lessening its socialist commitments, has turned to
strengthening developmental concerns (to retain control over the ‘commanding heights’ of the
economy and thereby to direct the path of overall development, in line with the canonical East
Asian model) rather than to embracing the free market doctrines in toto. Entering the new
century, there are signs that the new leadership have even attempted to reinstate the
importance of socialist concerns in the actual process of economic transformation – as is
especially evident in the slogan of constructing a ‘harmonious society’ and policies associated
with this slogan. All these suggest that, in the face of the deadly threat to late development
caused by financial expansion across the globe, Chinese political economy on the whole is
unlikely to be subdued by the logic of speculative financial capital, domestic or international.
In line with the East Asian model of development, China is likely to stick to the logic of
production rather than that of exchange (let alone that of speculation). Globalisation, then,
will continue to meet its match in the ‘paradox’ that is China.
32
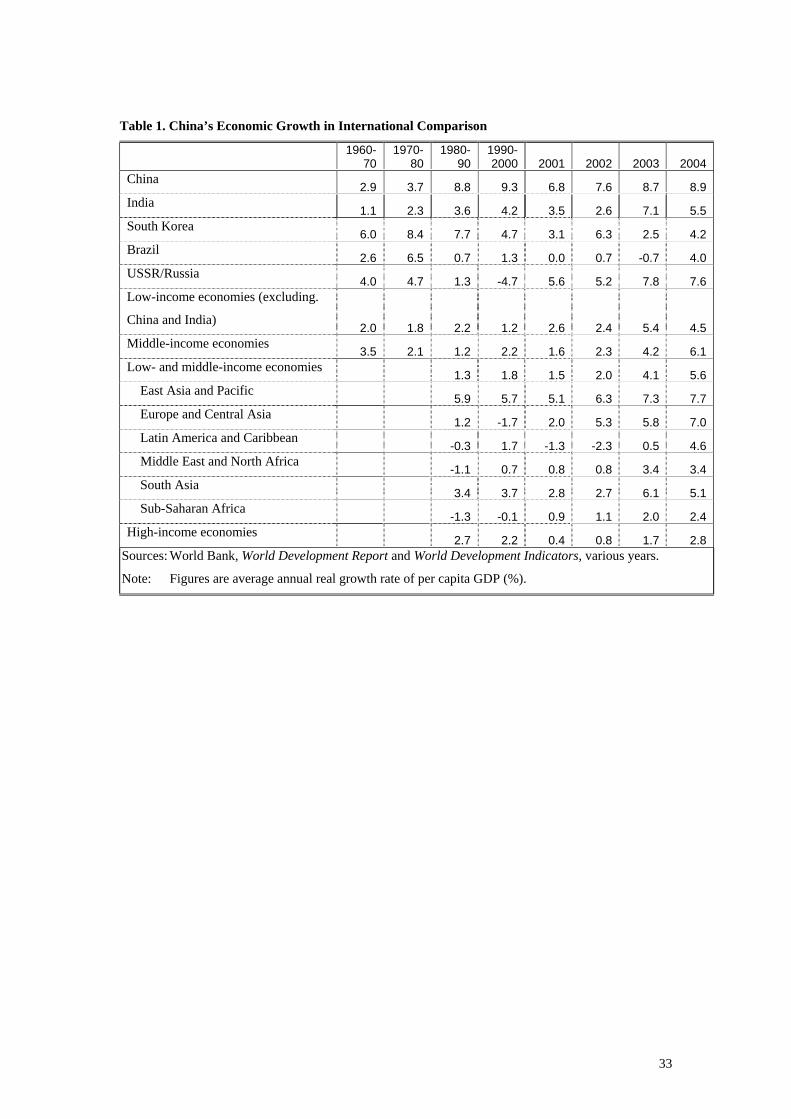
Table 1. China’s Economic Growth in International Comparison
1960-
70 1970-
80 1980-
90 1990-2000 2001 2002 2003 2004
China 2.9 3.7 8.8 9.3 6.8 7.6 8.7 8.9
India 1.1 2.3 3.6 4.2 3.5 2.6 7.1 5.5
South Korea 6.0 8.4 7.7 4.7 3.1 6.3 2.5 4.2
Brazil 2.6 6.5 0.7 1.3 0.0 0.7 -0.7 4.0
USSR/Russia 4.0 4.7 1.3 -4.7 5.6 5.2 7.8 7.6
Low-income economies (excluding.
China and India) 2.0 1.8 2.2 1.2 2.6 2.4 5.4 4.5
Middle-income economies 3.5 2.1 1.2 2.2 1.6 2.3 4.2 6.1
Low- and middle-income economies 1.3 1.8 1.5 2.0 4.1 5.6
East Asia and Pacific 5.9 5.7 5.1 6.3 7.3 7.7
Europe and Central Asia 1.2 -1.7 2.0 5.3 5.8 7.0
Latin America and Caribbean -0.3 1.7 -1.3 -2.3 0.5 4.6
Middle East and North Africa -1.1 0.7 0.8 0.8 3.4 3.4
South Asia 3.4 3.7 2.8 2.7 6.1 5.1
Sub-Saharan Africa -1.3 -0.1 0.9 1.1 2.0 2.4
High-income economies 2.7 2.2 0.4 0.8 1.7 2.8
Sources: World Bank, World Development Report and World Development Indicators, various years.
Note: Figures are average annual real growth rate of per capita GDP (%).
33
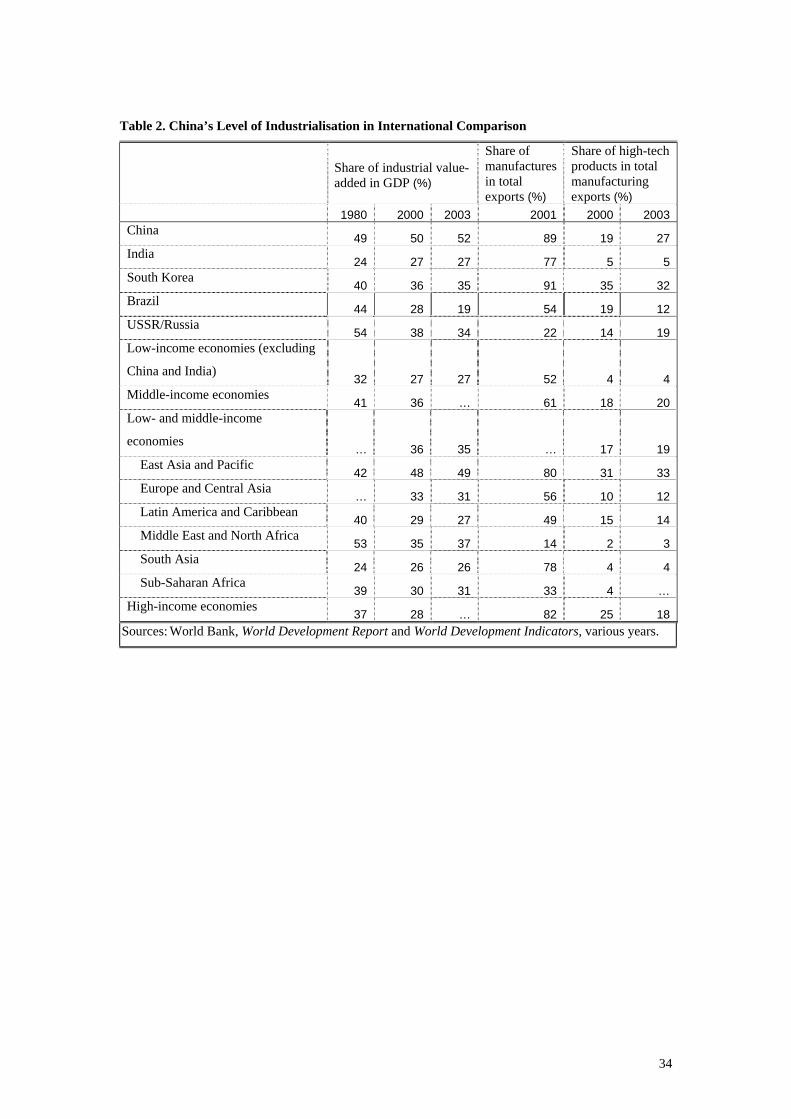
Table 2. China’s Level of Industrialisation in International Comparison
Share of industrial value-added in GDP (%)
Share of manufactures in total exports (%)
Share of high-tech products in total manufacturing exports (%)
1980 2000 2003 2001 2000 2003 China
49 50 52 89 19 27 India
24 27 27 77 5 5 South Korea
40 36 35 91 35 32 Brazil
44 28 19 54 19 12 USSR/Russia
54 38 34 22 14 19 Low-income economies (excluding
China and India) 32 27 27 52 4 4
Middle-income economies 41 36 … 61 18 20
Low- and middle-income
economies … 36 35 … 17 19
East Asia and Pacific 42 48 49 80 31 33
Europe and Central Asia … 33 31 56 10 12
Latin America and Caribbean 40 29 27 49 15 14
Middle East and North Africa 53 35 37 14 2 3
South Asia 24 26 26 78 4 4
Sub-Saharan Africa 39 30 31 33 4 …
High-income economies 37 28 … 82 25 18
Sources: World Bank, World Development Report and World Development Indicators, various years.
34
Figure 1. Relative Labour Productivity of Industry
0.00
1.00
2.00
3.00
4.00
5.00
6.00
7.00
8.00
9.00
1978
1980
1982
1984
1986
1988
1990
1992
1994
1996
1998
2000
2002
2004
(Yi/Li)/(Yn/Ln)
(Yi*/Li)/(Yn*/Ln)
Notes: Y = GDP and its components at current prices, with *denoting data at 1978 constant prices. L
= total labour employment. The subscripts i and n denotes the secondary sector (i.e., industry
plus construction) and the rest of the Chinese economy, respectively.
Sources: China State Statistical Bureau, China Statistical Yearbook, various issues.
35
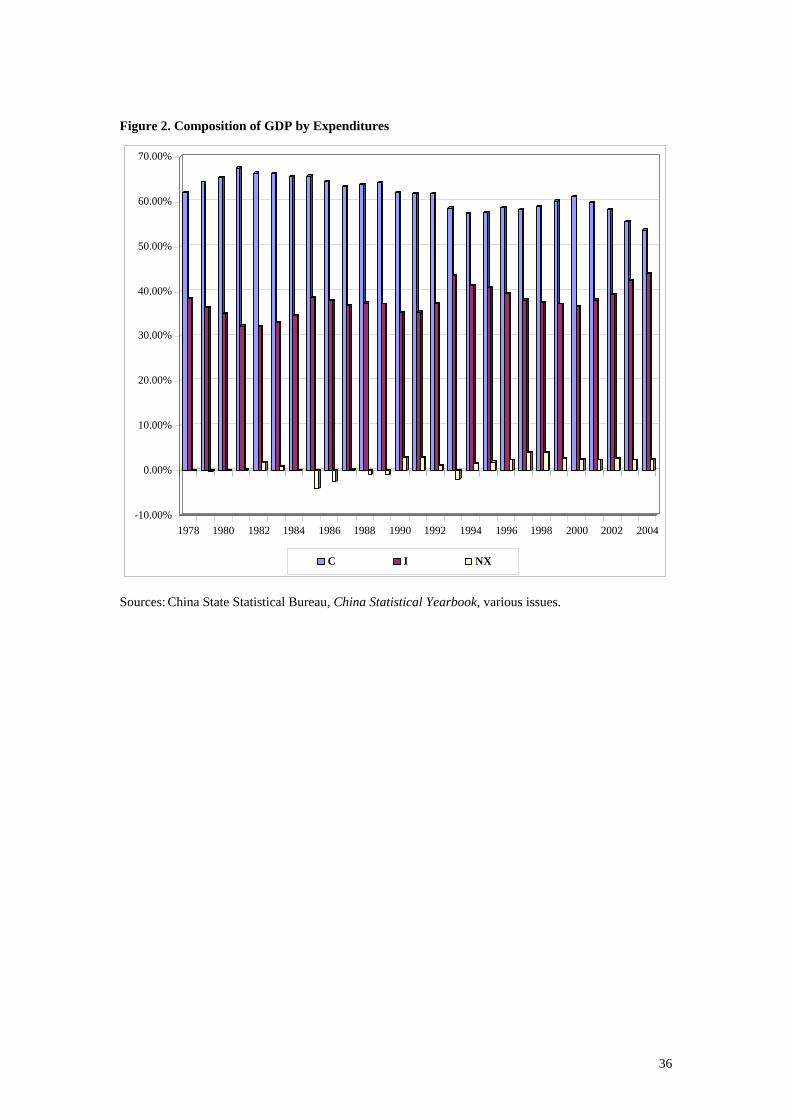
Figure 2. Composition of GDP by Expenditures
-10.00%
0.00%
10.00%
20.00%
30.00%
40.00%
50.00%
60.00%
70.00%
1978 1980 1982 1984 1986 1988 1990 1992 1994 1996 1998 2000 2002 2004
C I NX
Sources: China State Statistical Bureau, China Statistical Yearbook, various issues.
36
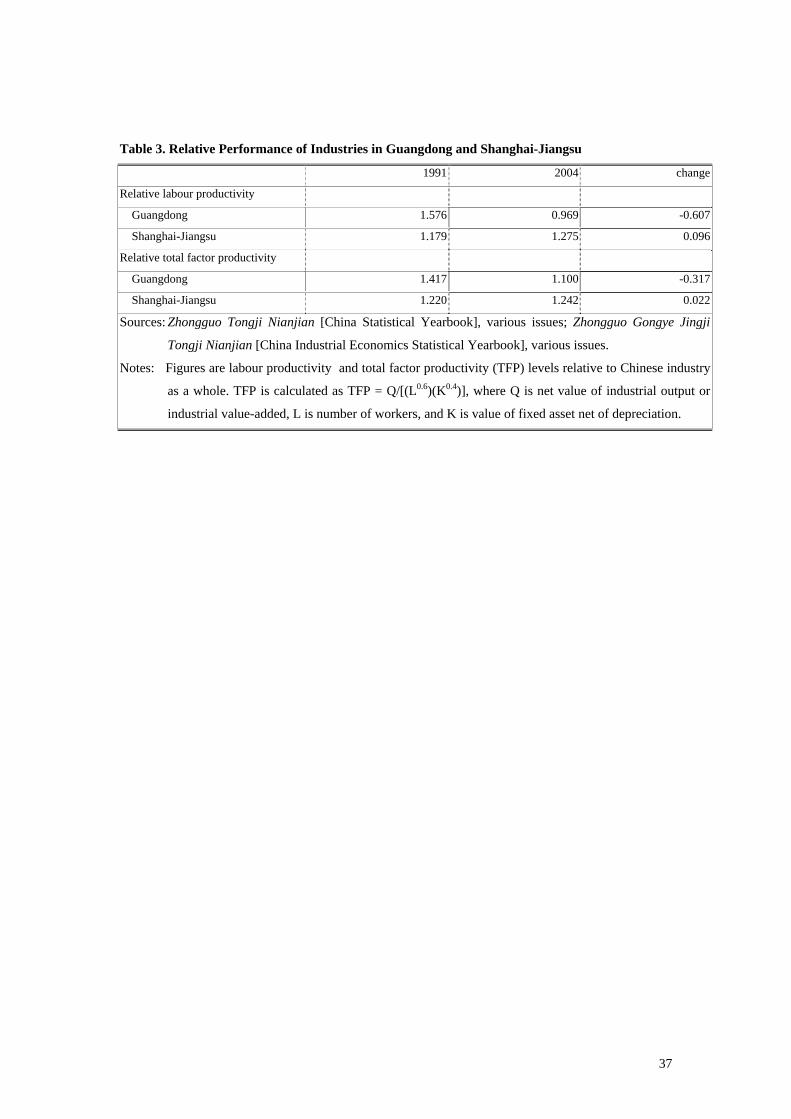
Table 3. Relative Performance of Industries in Guangdong and Shanghai-Jiangsu
1991 2004 change
Relative labour productivity
Guangdong 1.576 0.969 -0.607
Shanghai-Jiangsu 1.179 1.275 0.096
Relative total factor productivity
Guangdong 1.417 1.100 -0.317
Shanghai-Jiangsu 1.220 1.242 0.022
Sources: Zhongguo Tongji Nianjian [China Statistical Yearbook], various issues; Zhongguo Gongye Jingji
Tongji Nianjian [China Industrial Economics Statistical Yearbook], various issues.
Notes: Figures are labour productivity and total factor productivity (TFP) levels relative to Chinese industry
as a whole. TFP is calculated as TFP = Q/[(L0.6)(K0.4)], where Q is net value of industrial output or
industrial value-added, L is number of workers, and K is value of fixed asset net of depreciation.
37
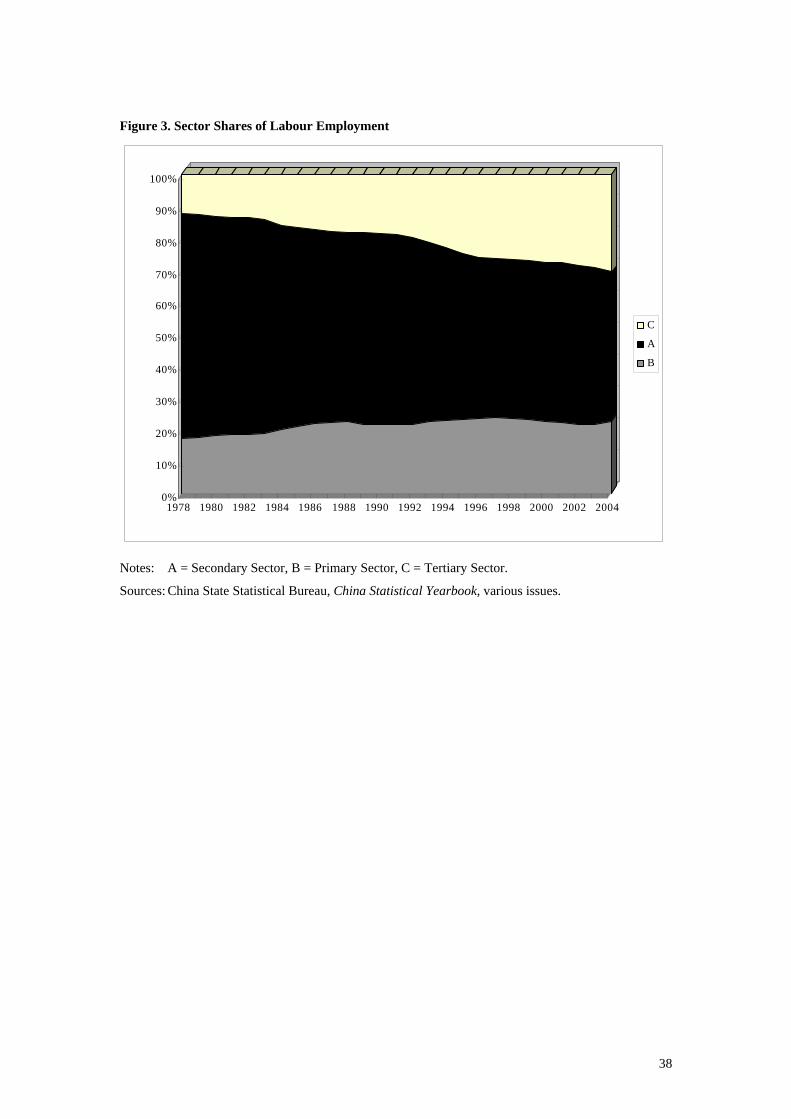
Figure 3. Sector Shares of Labour Employment
0%
10%
20%
30%
40%
50%
60%
70%
80%
90%
100%
1978 1980 1982 1984 1986 1988 1990 1992 1994 1996 1998 2000 2002 2004
C
A
B
Notes: A = Secondary Sector, B = Primary Sector, C = Tertiary Sector.
Sources: China State Statistical Bureau, China Statistical Yearbook, various issues.
38
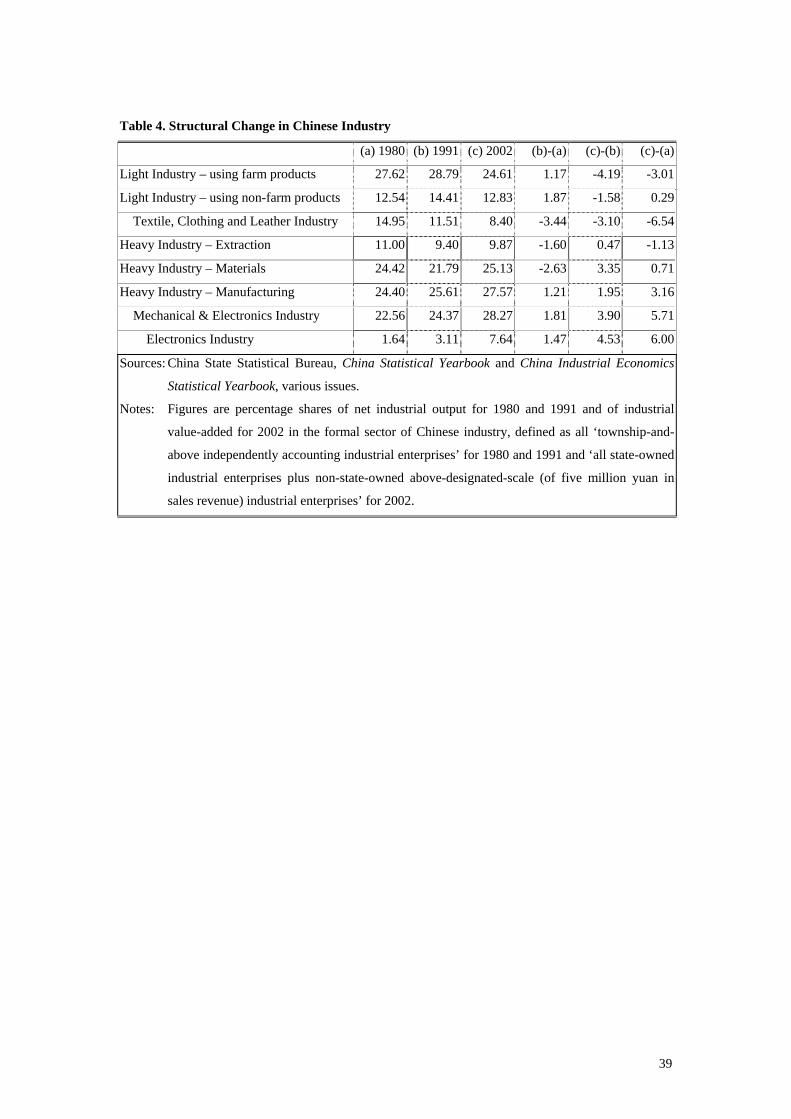
Table 4. Structural Change in Chinese Industry
(a) 1980 (b) 1991 (c) 2002 (b)-(a) (c)-(b) (c)-(a)
Light Industry – using farm products 27.62 28.79 24.61 1.17 -4.19 -3.01
Light Industry – using non-farm products 12.54 14.41 12.83 1.87 -1.58 0.29
Textile, Clothing and Leather Industry 14.95 11.51 8.40 -3.44 -3.10 -6.54
Heavy Industry – Extraction 11.00 9.40 9.87 -1.60 0.47 -1.13
Heavy Industry – Materials 24.42 21.79 25.13 -2.63 3.35 0.71
Heavy Industry – Manufacturing 24.40 25.61 27.57 1.21 1.95 3.16
Mechanical & Electronics Industry 22.56 24.37 28.27 1.81 3.90 5.71
Electronics Industry 1.64 3.11 7.64 1.47 4.53 6.00
Sources: China State Statistical Bureau, China Statistical Yearbook and China Industrial Economics
Statistical Yearbook, various issues.
Notes: Figures are percentage shares of net industrial output for 1980 and 1991 and of industrial
value-added for 2002 in the formal sector of Chinese industry, defined as all ‘township-and-
above independently accounting industrial enterprises’ for 1980 and 1991 and ‘all state-owned
industrial enterprises plus non-state-owned above-designated-scale (of five million yuan in
sales revenue) industrial enterprises’ for 2002.
39
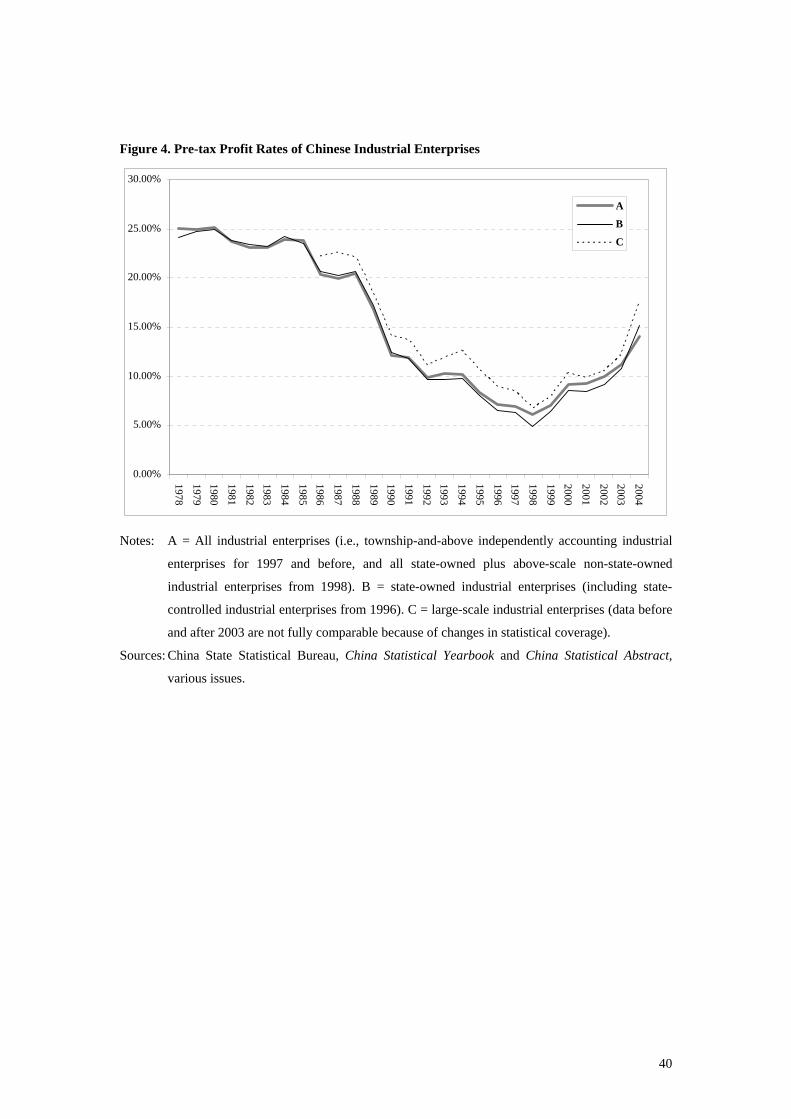
Figure 4. Pre-tax Profit Rates of Chinese Industrial Enterprises
0.00%
5.00%
10.00%
15.00%
20.00%
25.00%
30.00%
1978
19791980
1981
19821983
1984
19851986
1987
1988
19891990
1991
19921993
1994
1995
19961997
1998
19992000
2001
20022003
2004
A
B
C
Notes: A = All industrial enterprises (i.e., township-and-above independently accounting industrial
enterprises for 1997 and before, and all state-owned plus above-scale non-state-owned
industrial enterprises from 1998). B = state-owned industrial enterprises (including state-
controlled industrial enterprises from 1996). C = large-scale industrial enterprises (data before
and after 2003 are not fully comparable because of changes in statistical coverage).
Sources: China State Statistical Bureau, China Statistical Yearbook and China Statistical Abstract,
various issues.
40
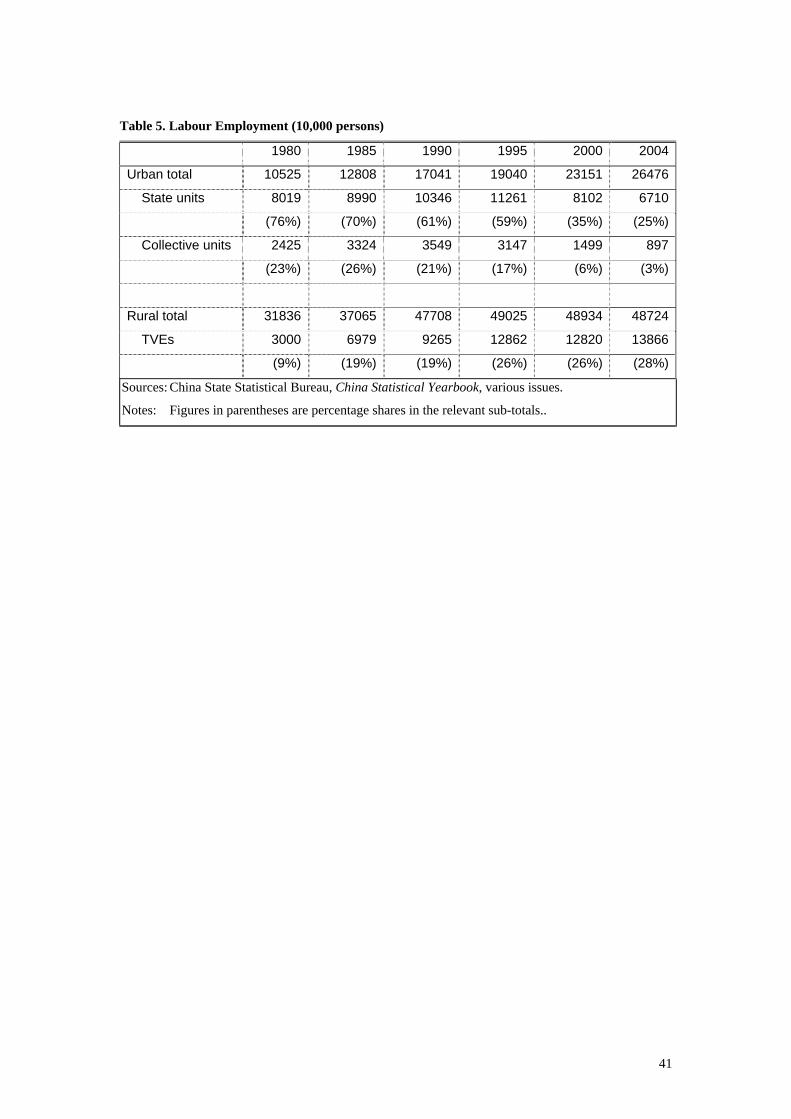
Table 5. Labour Employment (10,000 persons)
1980 1985 1990 1995 2000 2004
Urban total 10525 12808 17041 19040 23151 26476
State units 8019 8990 10346 11261 8102 6710
(76%) (70%) (61%) (59%) (35%) (25%)
Collective units 2425 3324 3549 3147 1499 897
(23%) (26%) (21%) (17%) (6%) (3%)
Rural total 31836 37065 47708 49025 48934 48724
TVEs 3000 6979 9265 12862 12820 13866
(9%) (19%) (19%) (26%) (26%) (28%)
Sources: China State Statistical Bureau, China Statistical Yearbook, various issues.
Notes: Figures in parentheses are percentage shares in the relevant sub-totals..
41


![SOA Based System Integration Project For the CSRC Beijing Miracle Hi-Tech Co.,Ltd. [China Securities Regulatory Commission]](https://img.pdfslide.net/doc/110x75/56649cc35503460f9498b4f5/soa-based-system-integration-project-for-the-csrc-wwwoasis-openorg-beijing.jpg)


![[Phind] Miracle](https://img.pdfslide.net/doc/110x75/5472c10eb4af9fa90a8b4fb9/phind-miracle.jpg)

