Embed Size (px)
Citation preview
Making Statistics and Mathematics Courses accessible to Blind and Vision Impaired Students
Pauline Pannell, Una Jansen Van Rensburg and Kim LouwUniversity of Western Australia
Overview
Few blind people achieve in higher mathematics
Making math and stat more accessible
Which strategy to adopt?
Case Study. Una learns Statistics
Short Film: teaching SPSS Using Code
Useful distinction for our purposes is between people who are vision impaired, including the legally blind who may be able to use some vision in accessing learning materials and those who need to rely totally on non visual means to access information.
Different learning styleSuperior tactile, auditory discrimination, verbal
processing, memory span and long term memory
Disadvantaged in spatial learning. Spatial information becomes a series of items.
Source: Pasqualotto, A and Proulx, M. (2012) The role of visual experience for the neural basis of spatial cognition. Neuroscience and Biobehavioral Reviews (36) 1179-1187
Congenitally Blind Differ from Acquired Blind.
May still be able to visualiseSource: Figueiras, L and Arcavi, A 2014 A touch of mathematics. Coming to our senses by observing the visually
impaired. Mathematics Education (46) 123-133.
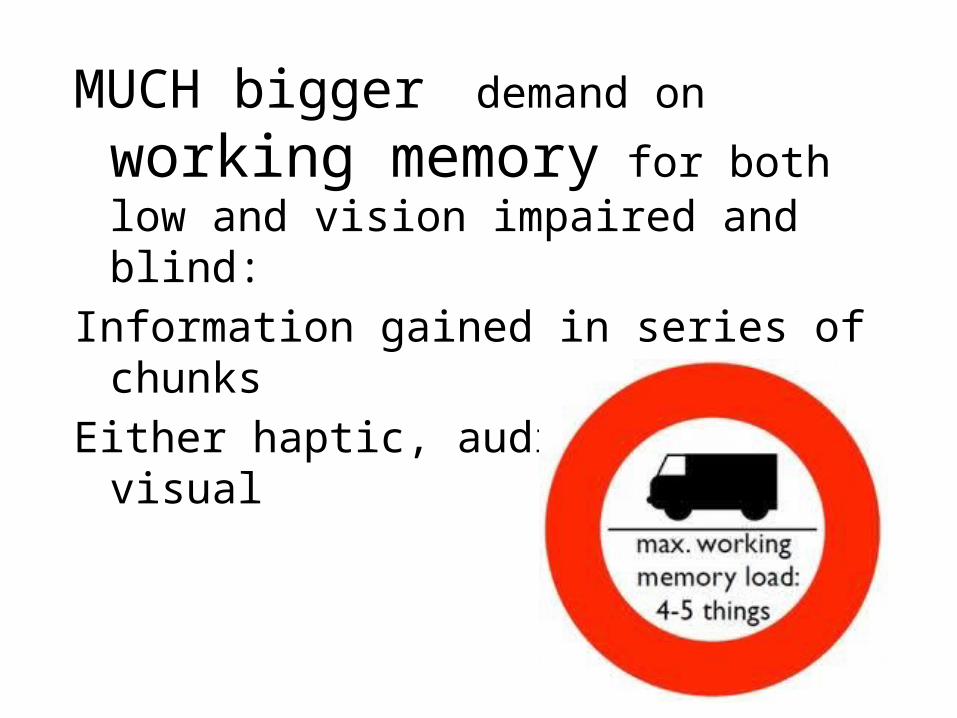
MUCH bigger demand on working memory for both low and vision impaired and blind:
Information gained in series of chunks
Either haptic, auditory or visual
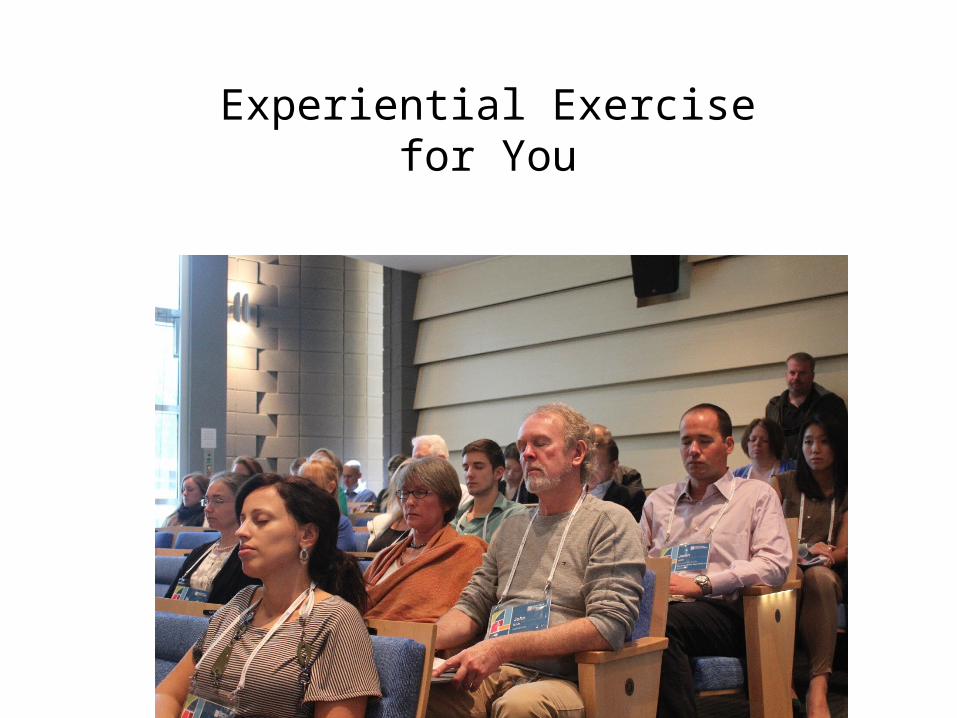
Experiential Exercise for You
Close your eyes
Road Blocks to Learning
Notation not accessible by screen reader or Braille
Numerical and statistical reasoning depends on conveying visual and spatial features…example standard deviation

Statistics is Spatial
Blocking the Road to LearningAcademics can’t or won’t adapt teaching style: use of
vague verbal directional cues …look over here
Mental Fatigue
Total additional time required to access courseSources: Spindler, R. (2006) Teaching mathematics to a student who is blind. Teaching Mathematics and its Applications (25) 3 120-126.Gibson W.E and Darron C. (1999) Teaching statistics to a student who is blind. Teaching of Psychology. (26) 13-131.
Improving Access
Clay, wood, paper models, puff paint
Tactile embossing print technology with associated software
Pictures in a flash (raised line drawings on swell paper)

http://www.uncp.edu/academics/colleges-schools-departments/departments/sociology-and-criminal-justice/visual-impairment-and-teaching-statistics/directions-construction-teaching-artifactshttp://mathslinks.net/faculty/normal-distribution-foldable
2d and 3d models are effective tools for conveying spatial concept but time consuming
Improving Access
Braille code to Latex and vice versa
Universal Braille code for mathematics(LAMBDA project) Edwards, A. McCartney, H. and Fogarolo F. (2006) Lambda: A multimodal approach to
making mathematics accessible to blind students.
Translation of mathematical notation into words and captioning of graphics for screen readers
Course delivered and assessed over extended time
Improving Access
Open book assessment
Untimed assessment
Academics must be educated, coaxed to adopt accessible teaching style Proctor or sighted education assistant
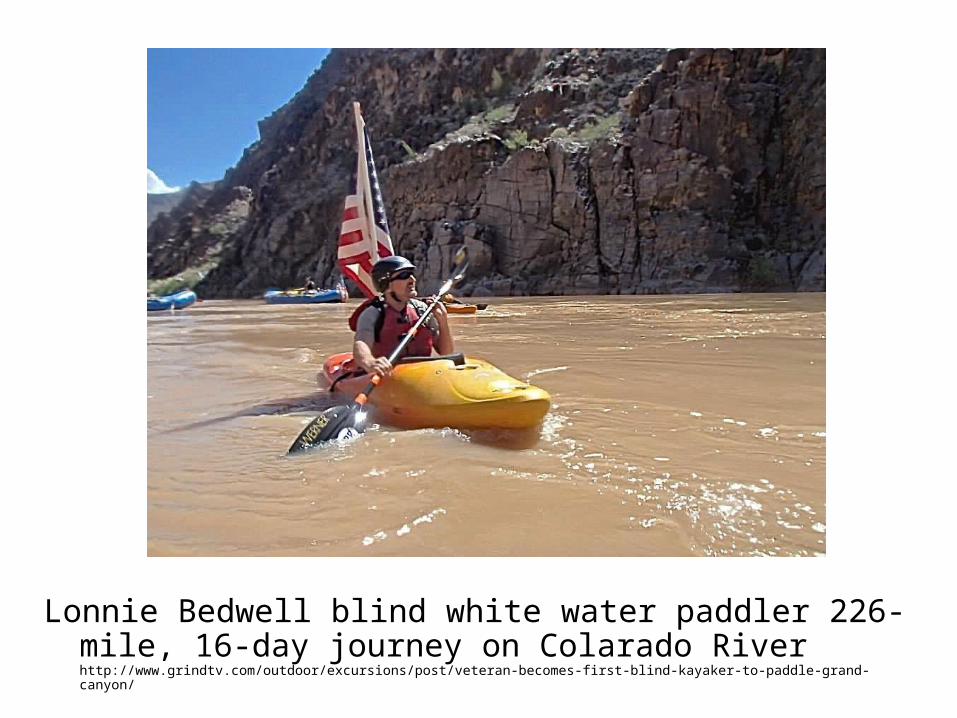
Lonnie Bedwell blind white water paddler 226-mile, 16-day journey on Colarado River http://www.grindtv.com/outdoor/excursions/post/veteran-becomes-first-blind-kayaker-to-paddle-grand-canyon/
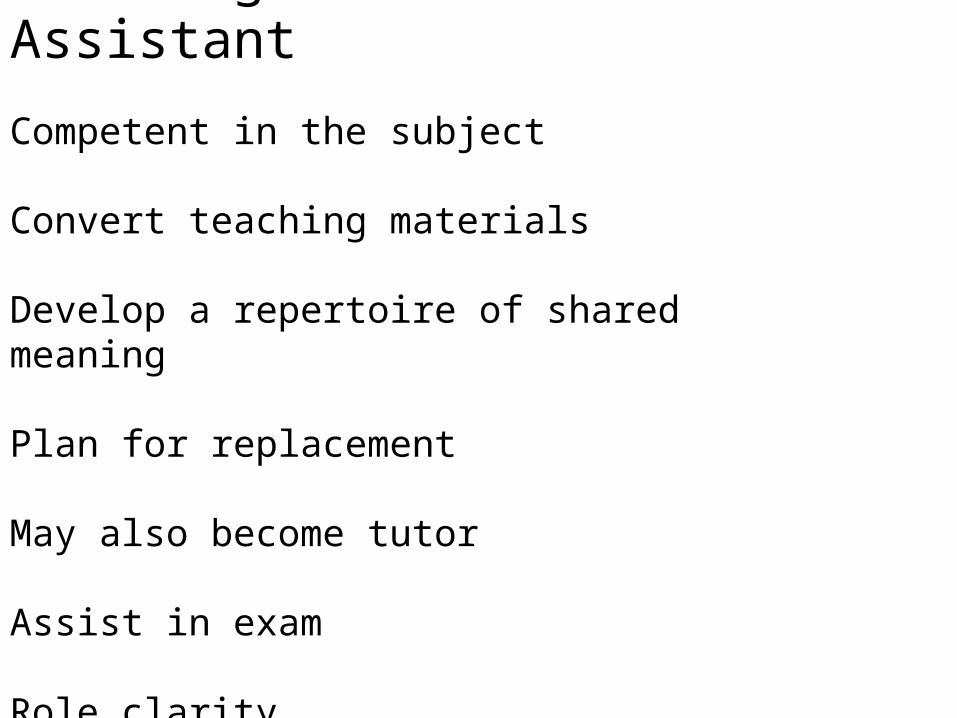
Role Sighted Education Assistant
Competent in the subject
Convert teaching materials
Develop a repertoire of shared meaning
Plan for replacement
May also become tutor
Assist in exam
Role clarity
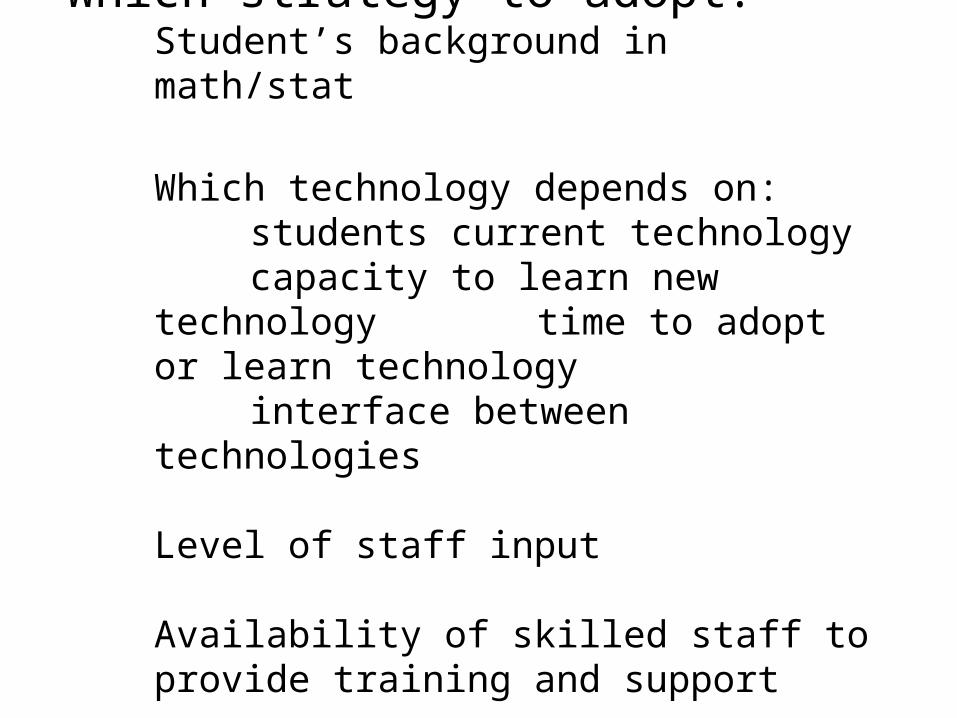
Which strategy to adopt? Student’s background in math/stat
Which technology depends on:students current technologycapacity to learn new
technology time to adopt or learn technology
interface between technologies
Level of staff input
Availability of skilled staff to provide training and support
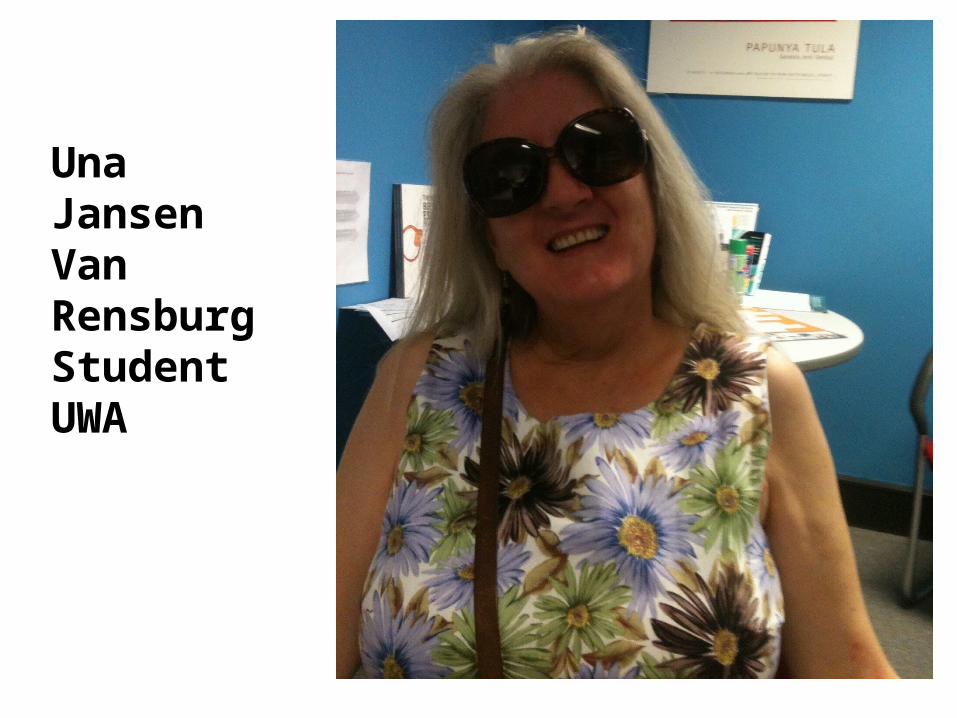
Una Jansen Van Rensburg Student UWA
Background
Double major in Psychology 2012-2015
Normal sight up to age 21
Maths up to Year 12
Algebra versus geometry
Visual and spatial strength
Screenreader JAWS (others e.g. Window Eyes, NVDA, Zoomtext)
Making the course accessible
First challenges
What to expect
Making use of sighted assistants
Started preparation before semester
Meeting the needs evolved over time
Inaccessibilities and Solutions
Textbook and lecture slides
Greek symbols
Graphic images and graphs
Inaccessibilities and Solutions
Lectures
“A picture speaks a thousand words”…??
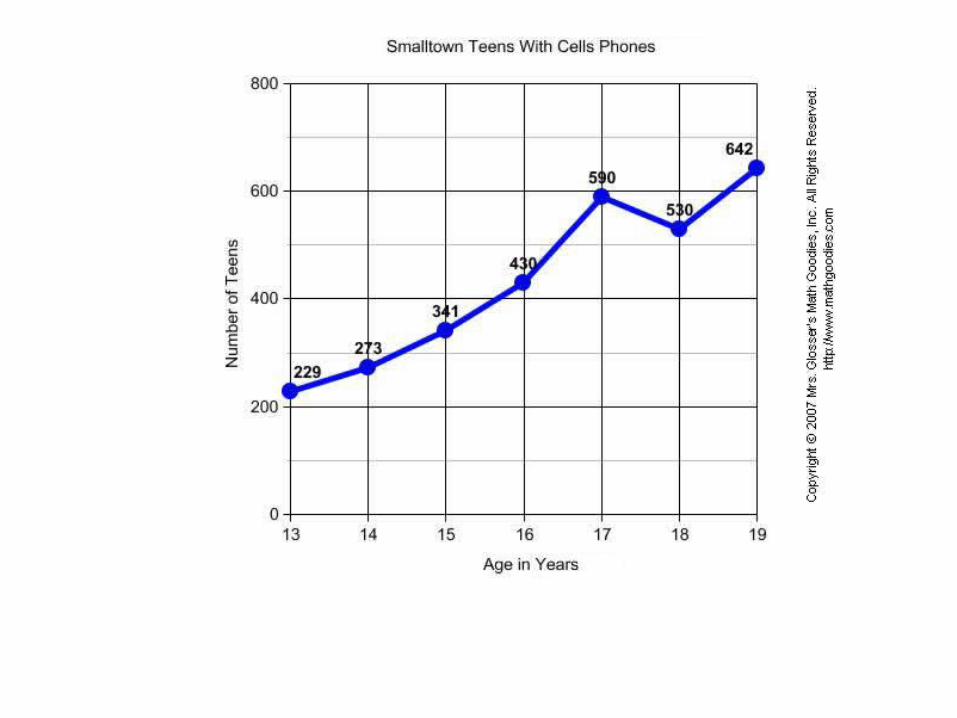
Think of line graph of the normal distribution
Formulae: close eyes for an example
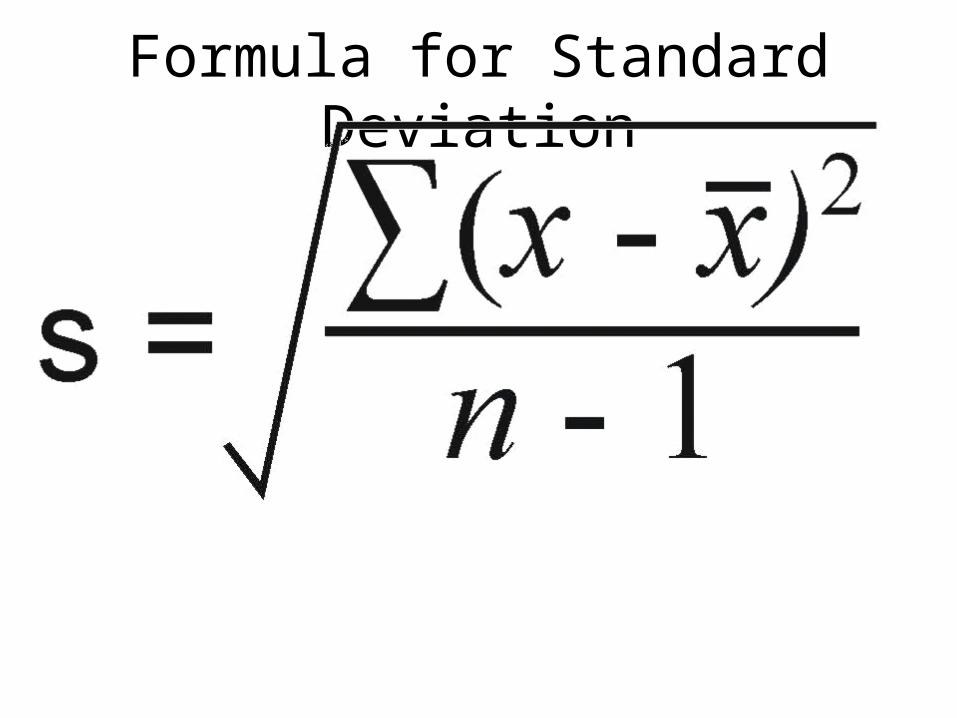
Formula for Standard Deviation
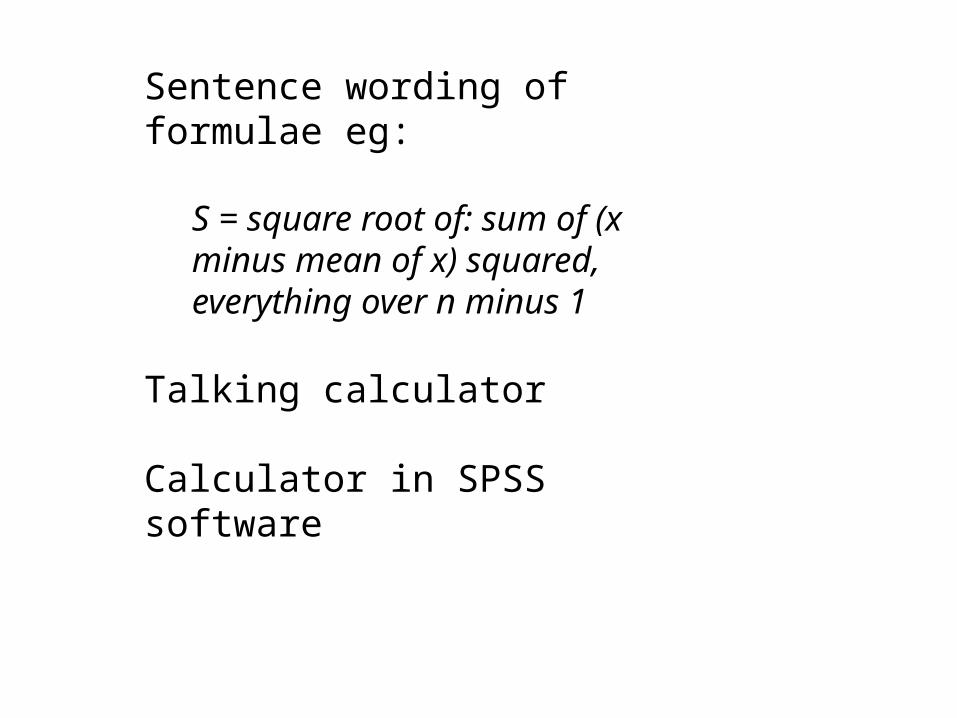
Sentence wording of formulae eg:
S = square root of: sum of (x minus mean of x) squared, everything over n minus 1
Talking calculator
Calculator in SPSS software

Assistant and Student Interaction
Conversion and editing of lecture slides (write out symbols as words, describe images)
Student commitment
Time with assistant
Graphs: tracing/drawing on plastic/embossed printer
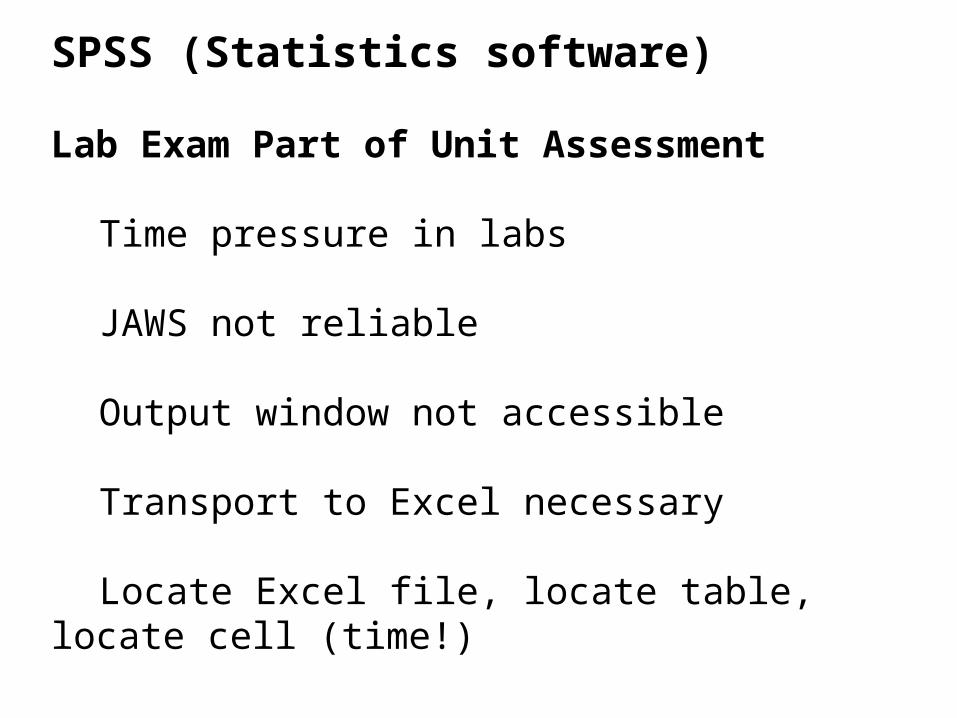
SPSS (Statistics software)
Lab Exam Part of Unit Assessment
Time pressure in labs
JAWS not reliable
Output window not accessible
Transport to Excel necessary
Locate Excel file, locate table, locate cell (time!)

Workable Strategy View lab slides beforehand
Attend and listen
Do analysis afterwards with sighted assistant
Timed Lab exam demonstrating SPSS skills DIFFICULT
A Solution for analyses….
Only take stats if essential
Career counselling and course planning
Stay motivated
Extra timeunits require double or more timeclarifying lecture materialexplanation of visualsrepeat of lab sessions
Consider doing few units per semester
It can be done!

Conclusions
Student intellectual and emotional resilience
Collaborativeand engaged teaching staff
early learning materials
Equity staff commitment
Acknowledgements
Antony GrayKim Louw
Short film can be viewed at http://youtu.be/6EwbhDFZpUM'bonus' video, which you can find here: http://youtu.be/UEUQmLMK2_M