Embed Size (px)
Citation preview

Making the Most of Raster
Analysis with Living Atlas DataAileen Buckley, PhD, Research Cartographer
Esri - Redlands
Spatial Analysis with Online Data
• Never scrounge for or download data again
- No pre-processing
- Reduced risk of processing errors
- Increased productivity
• Large selection of ready-to-use layers
• Use the most current data
- Some real-time or near-real-time services
- Historical data available, too
- For example, Wayback imagery
- 80 versions of World Imagery
- Last 5 years
Desktop Web Device
Online Content
and Services
Your
ArcGIS
Living
Atlas
Output can be to a desktop computer
or your ArcGIS Online account
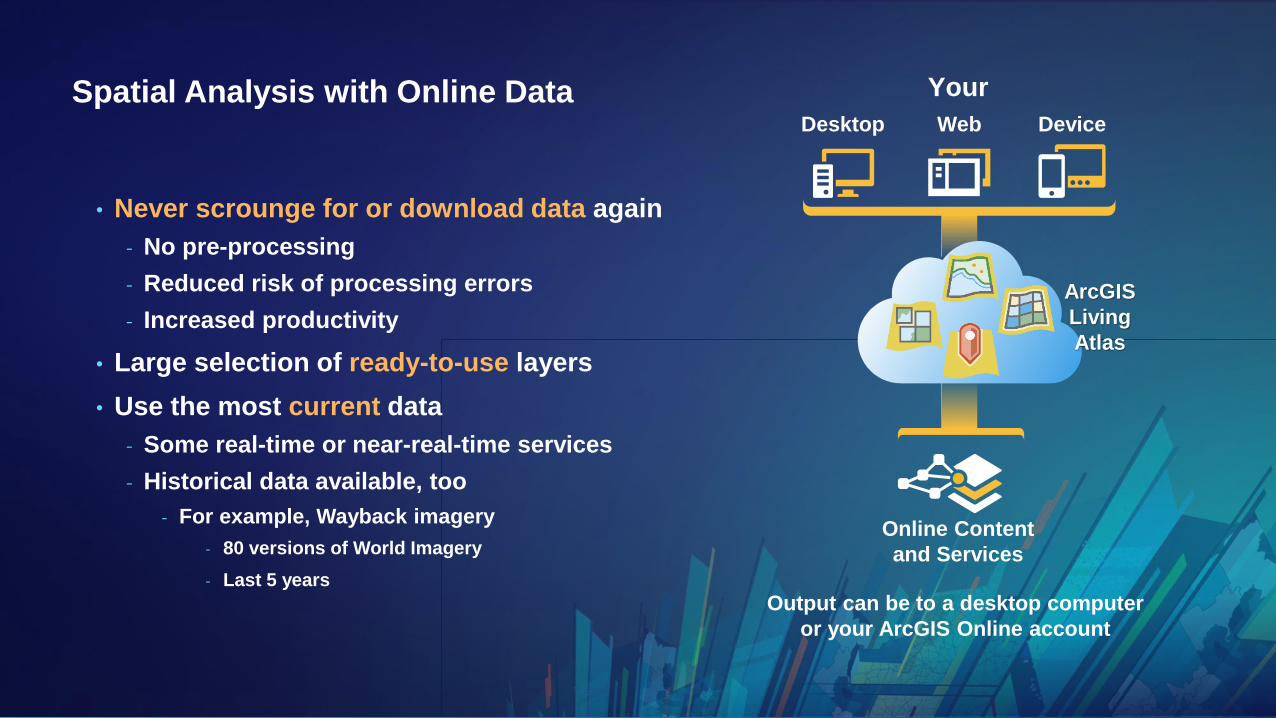
Online Web Layers as Inputs to Analysis
Imagery Layer – Source: Image Service based on raster data – probably good for analysis
Elevation Layer – Source: Image Service based on raster data – definitely good for analysis
Map Image Layer – Source: Map Service based on vector data – possibly good for analysis
- Cached map service – analysis is not possible
- Dynamic map service – possibly good for analysis
- Single layer – worth a try (depends on how it was served)
- Group layers – not possible
Tile Layer – Source: Map Service based on cached raster or vector tiles – not good for analysis
- Cached map service – analysis is not possible
Feature Layer – Source: Feature Service based on vector data – good for analysis
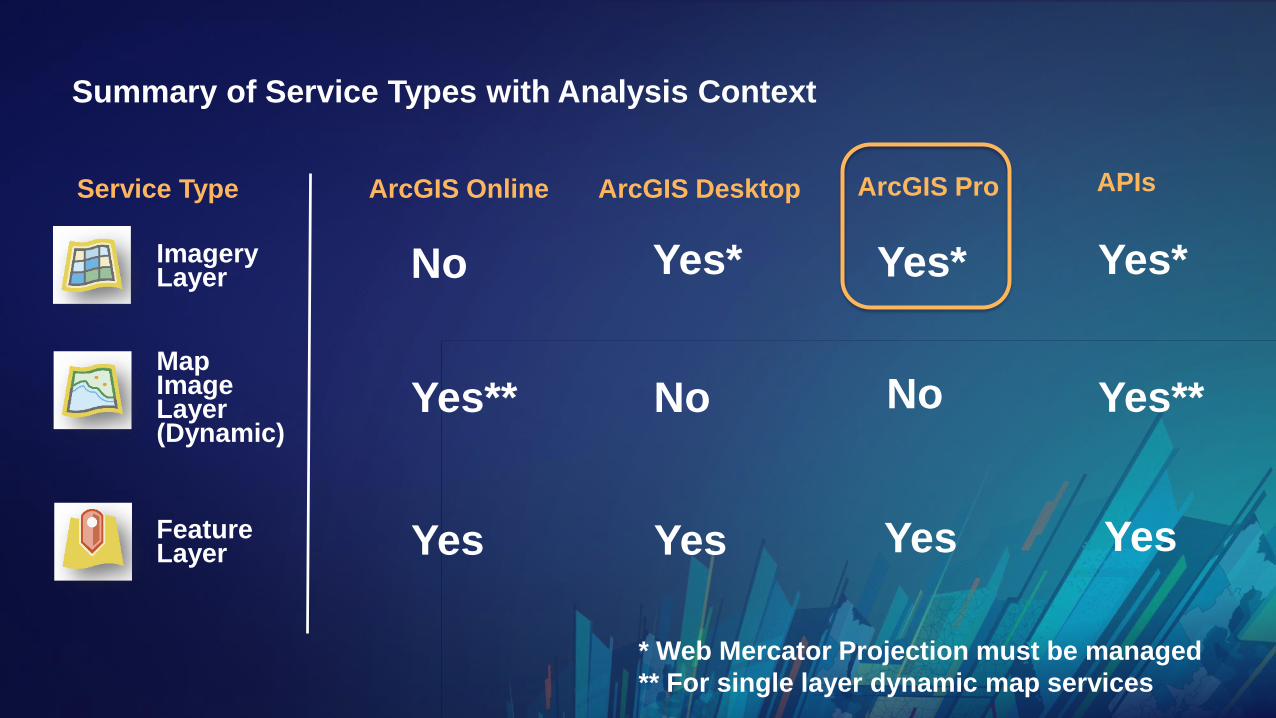
Summary of Service Types with Analysis Context
Service Type ArcGIS Online ArcGIS Desktop ArcGIS Pro
ImageryLayer No Yes* Yes*
MapImage Layer(Dynamic)
Yes** No No
Yes Yes YesFeature Layer
APIs
* Web Mercator Projection must be managed
** For single layer dynamic map services
Yes*
Yes**
Yes
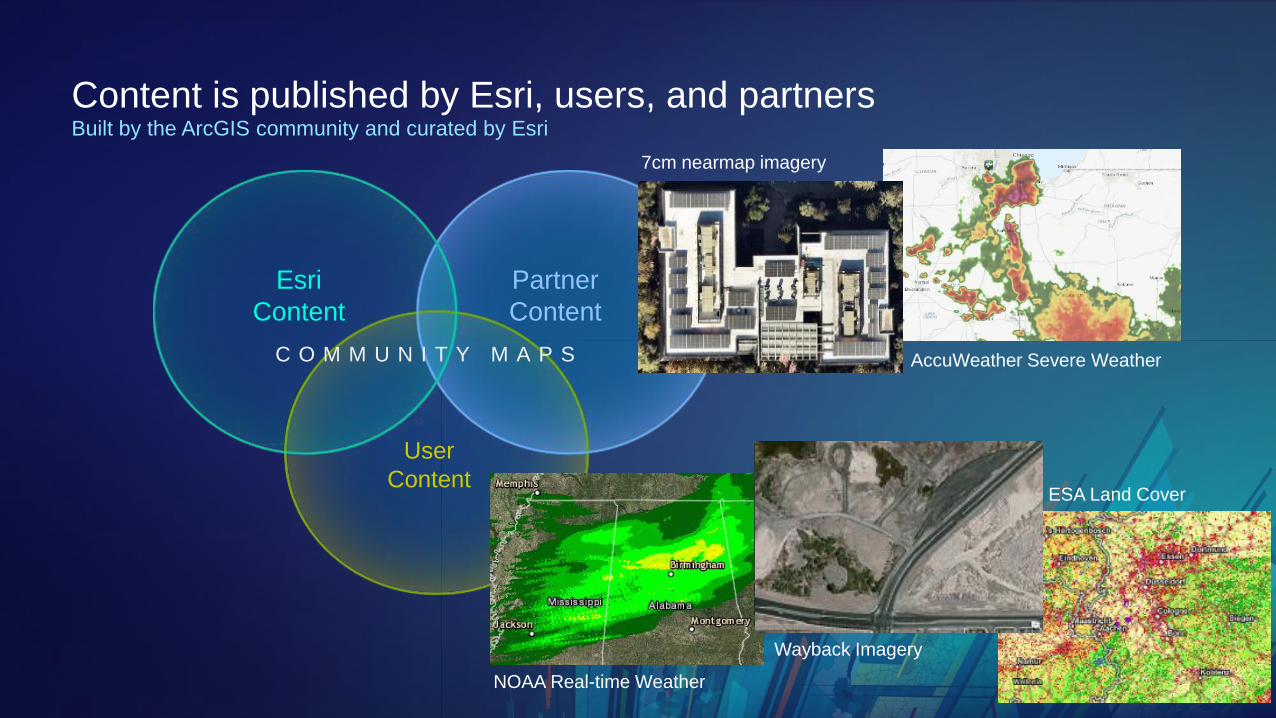
Content is published by Esri, users, and partnersBuilt by the ArcGIS community and curated by Esri
Esri
Content
C O M M U N I T Y M A P S
Partner
Content
User
Content
7cm nearmap imagery
AccuWeather Severe Weather
NOAA Real-time Weather
Wayback Imagery
ESA Land Cover
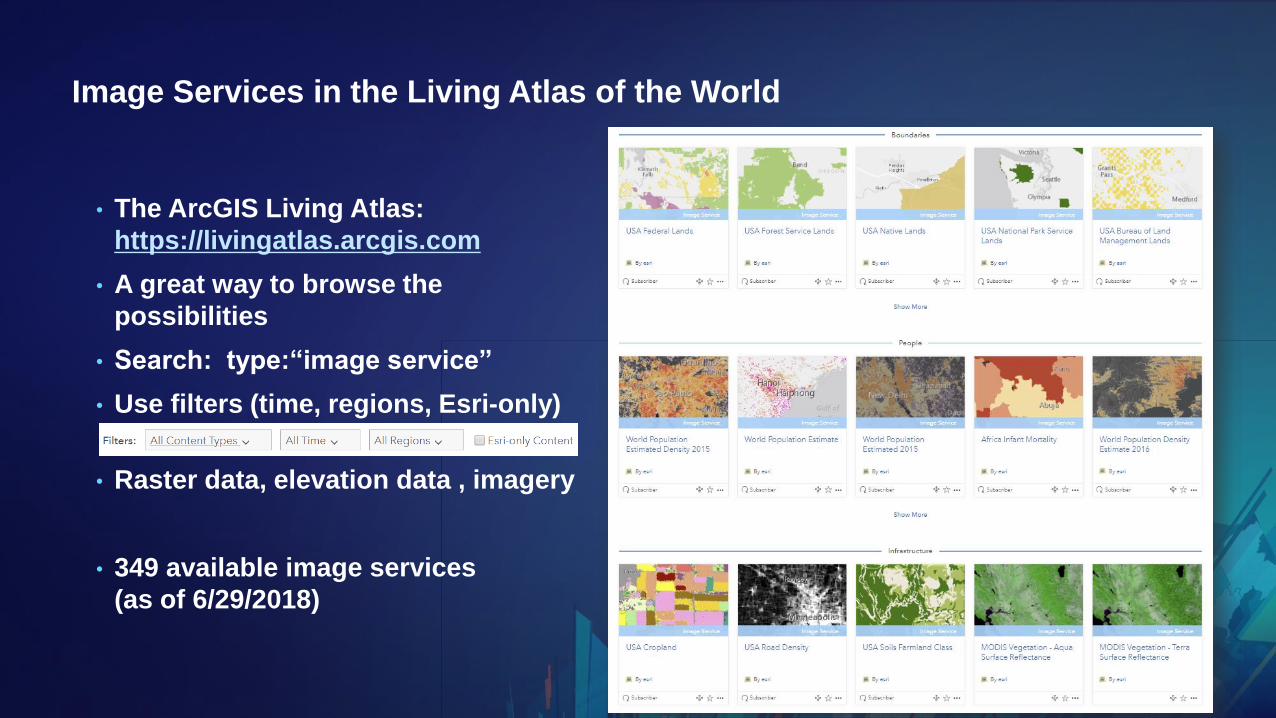
Image Services in the Living Atlas of the World
• The ArcGIS Living Atlas:
https://livingatlas.arcgis.com
• A great way to browse the
possibilities
• Search: type:“image service”
• Use filters (time, regions, Esri-only)
• Raster data, elevation data , imagery
• 349 available image services
(as of 6/29/2018)
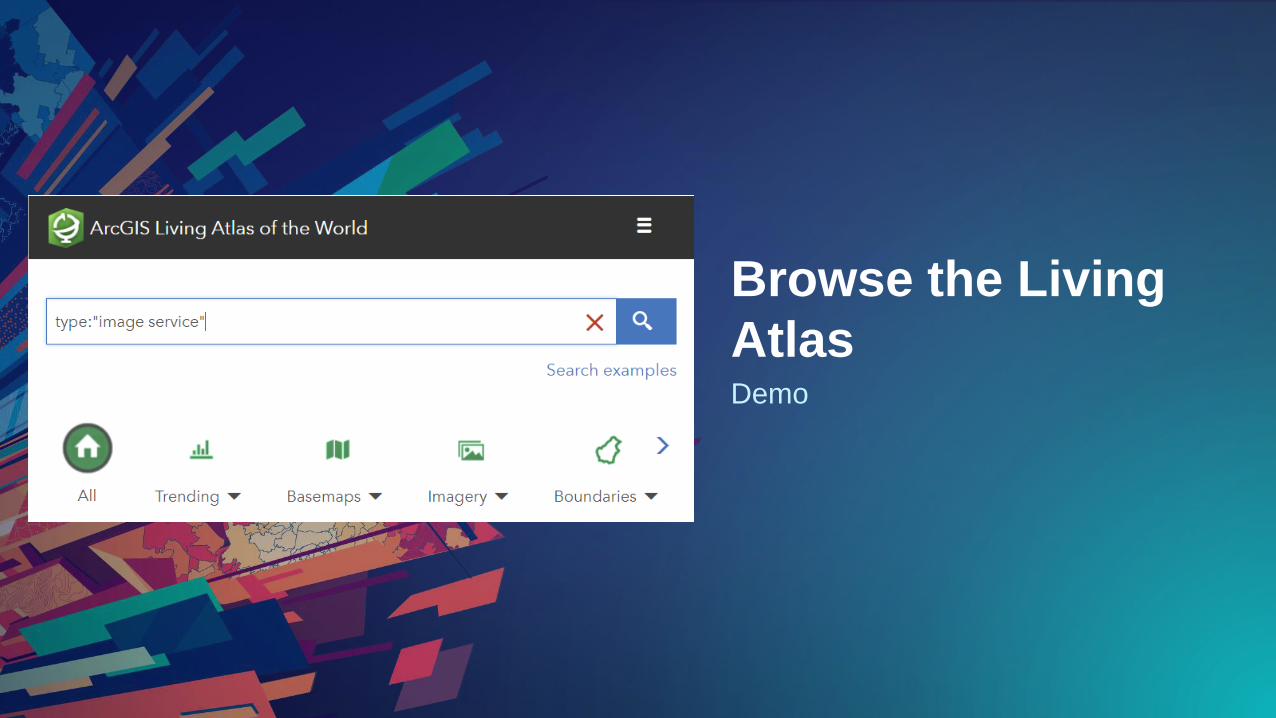
Demo
Browse the Living
Atlas
Stepping Forwards from ArcGIS Pro to ArcGIS Online
How Image Services are
Created
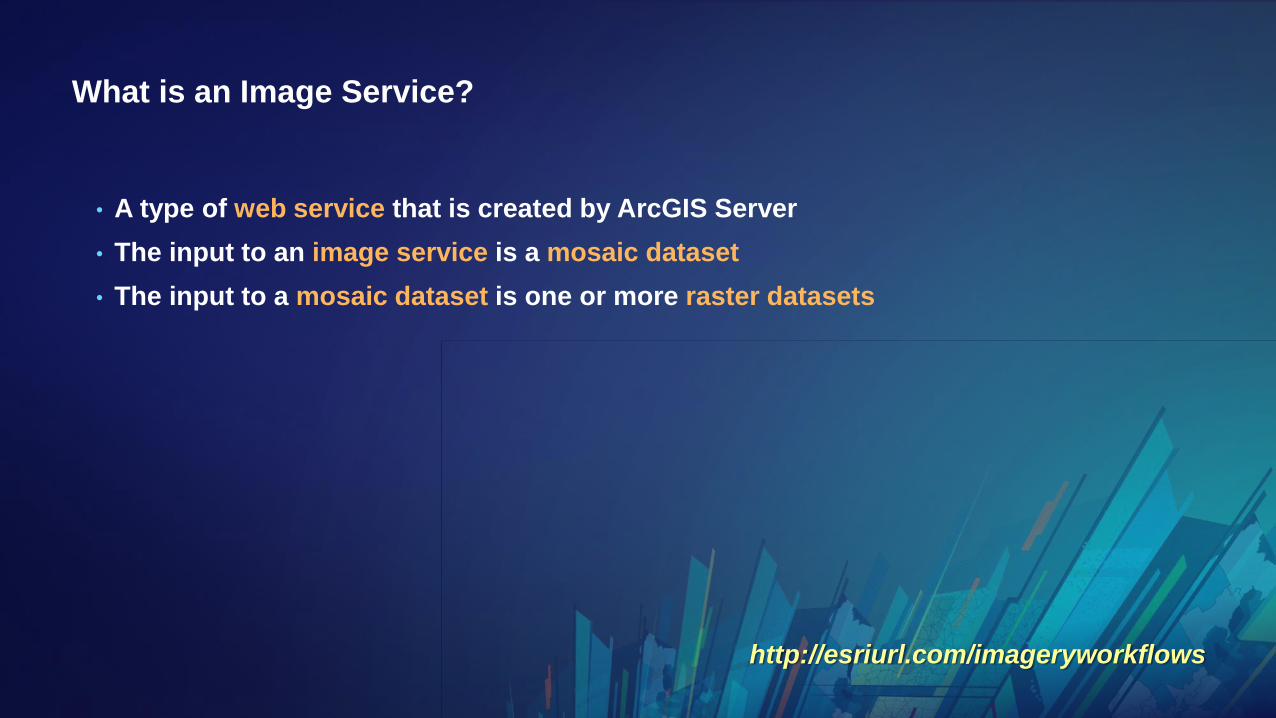
What is an Image Service?
• A type of web service that is created by ArcGIS Server
• The input to an image service is a mosaic dataset
• The input to a mosaic dataset is one or more raster datasets
http://esriurl.com/imageryworkflows
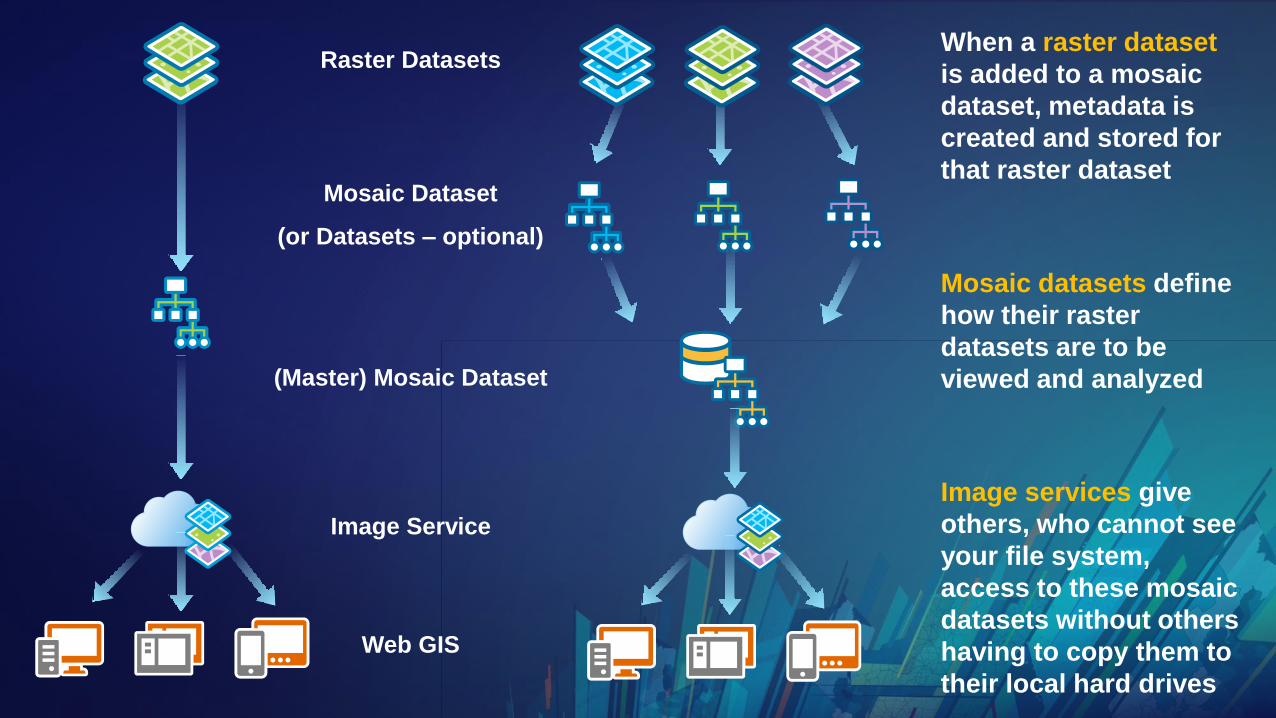
Mosaic Dataset
(or Datasets – optional)
(Master) Mosaic Dataset
Image Service
Raster Datasets
Web GIS
When a raster dataset
is added to a mosaic
dataset, metadata is
created and stored for
that raster dataset
Mosaic datasets define
how their raster
datasets are to be
viewed and analyzed
Image services give
others, who cannot see
your file system,
access to these mosaic
datasets without others
having to copy them to
their local hard drives
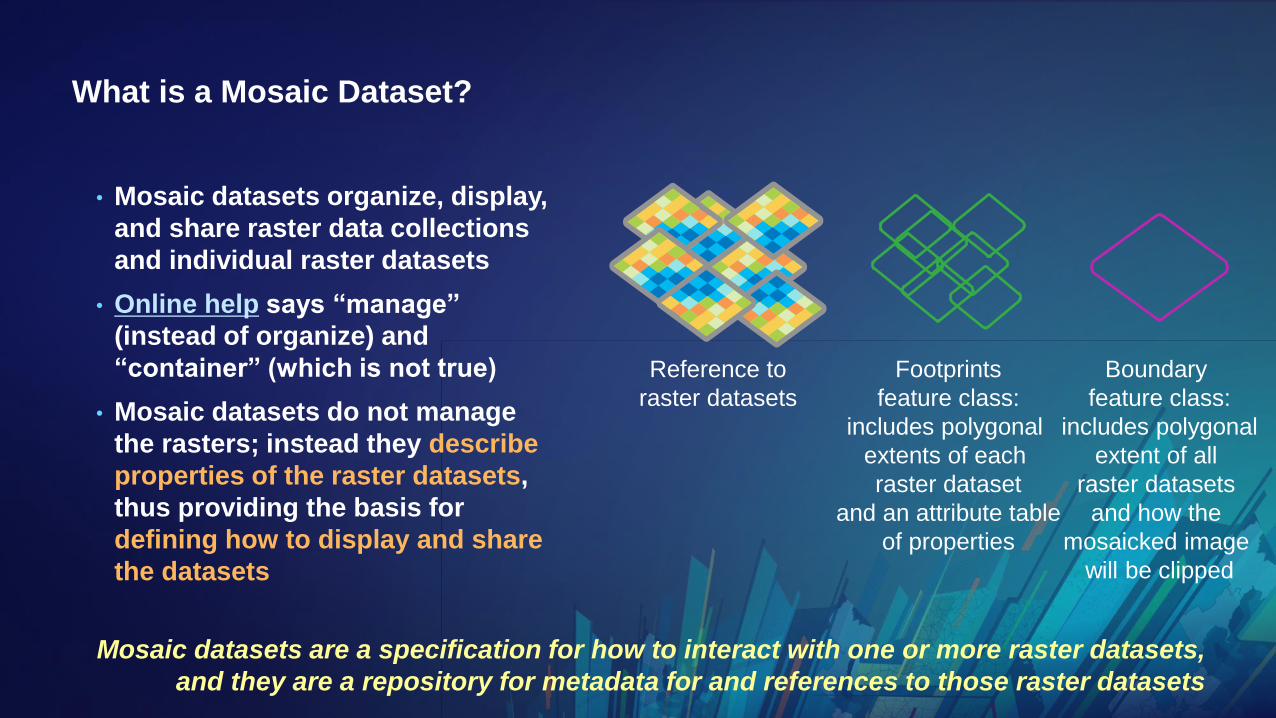
What is a Mosaic Dataset?
• Mosaic datasets organize, display,
and share raster data collections
and individual raster datasets
• Online help says “manage”
(instead of organize) and
“container” (which is not true)
• Mosaic datasets do not manage
the rasters; instead they describe
properties of the raster datasets,
thus providing the basis for
defining how to display and share
the datasets
Mosaic datasets are a specification for how to interact with one or more raster datasets,
and they are a repository for metadata for and references to those raster datasets
Reference to
raster datasets
Footprints
feature class:
includes polygonal
extents of each
raster dataset
and an attribute table
of properties
Boundary
feature class:
includes polygonal
extent of all
raster datasets
and how the
mosaicked image
will be clipped
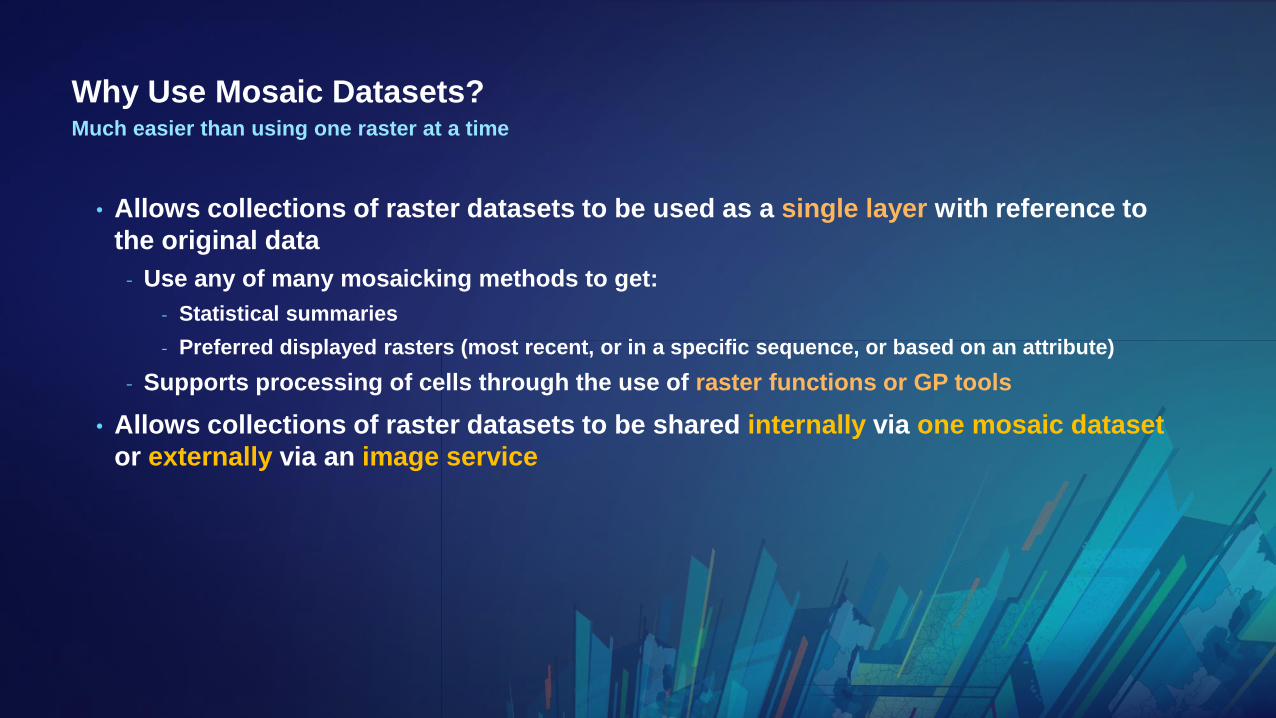
Why Use Mosaic Datasets?Much easier than using one raster at a time
• Allows collections of raster datasets to be used as a single layer with reference to
the original data
- Use any of many mosaicking methods to get:
- Statistical summaries
- Preferred displayed rasters (most recent, or in a specific sequence, or based on an attribute)
- Supports processing of cells through the use of raster functions or GP tools
• Allows collections of raster datasets to be shared internally via one mosaic dataset
or externally via an image service

Stepping Backwards from ArcGIS Online to the Original Data Source
Where the Pixels on Your
Screen Come From
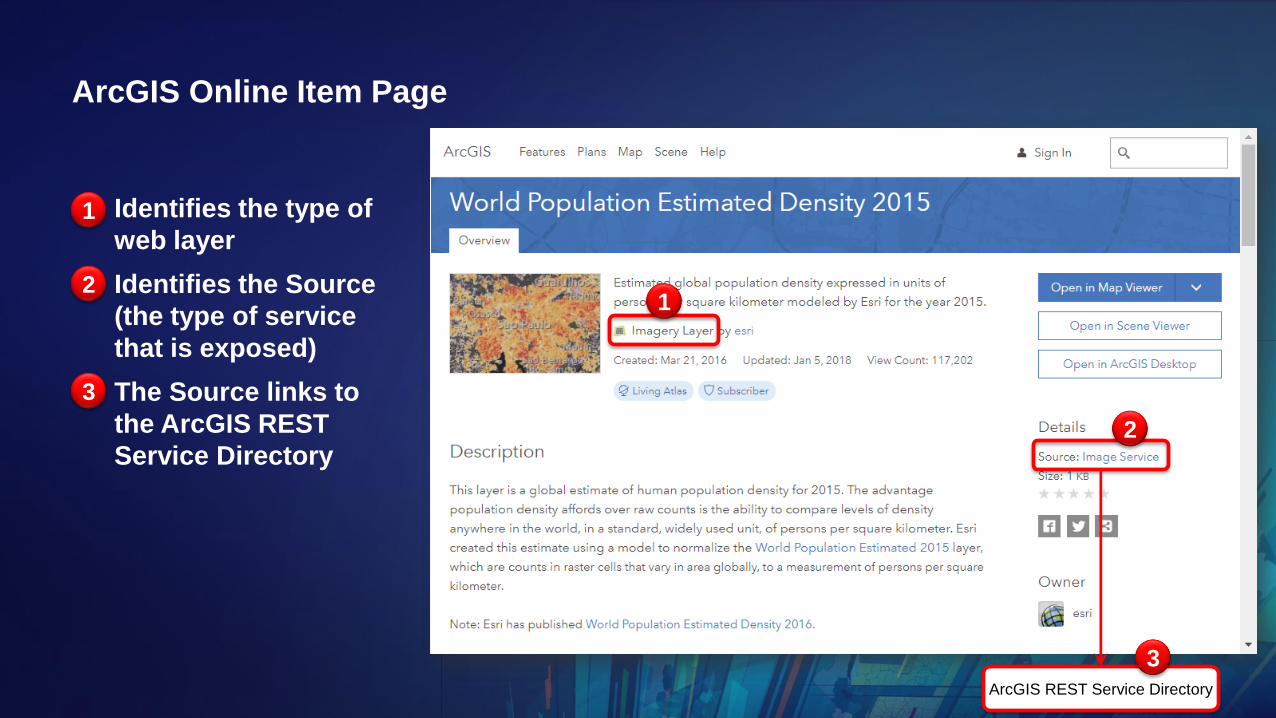
ArcGIS Online Item Page
• Identifies the type of
web layer
• Identifies the Source
(the type of service
that is exposed)
• The Source links to
the ArcGIS REST
Service Directory
ArcGIS REST Service Directory
1
2
3
1
3
2
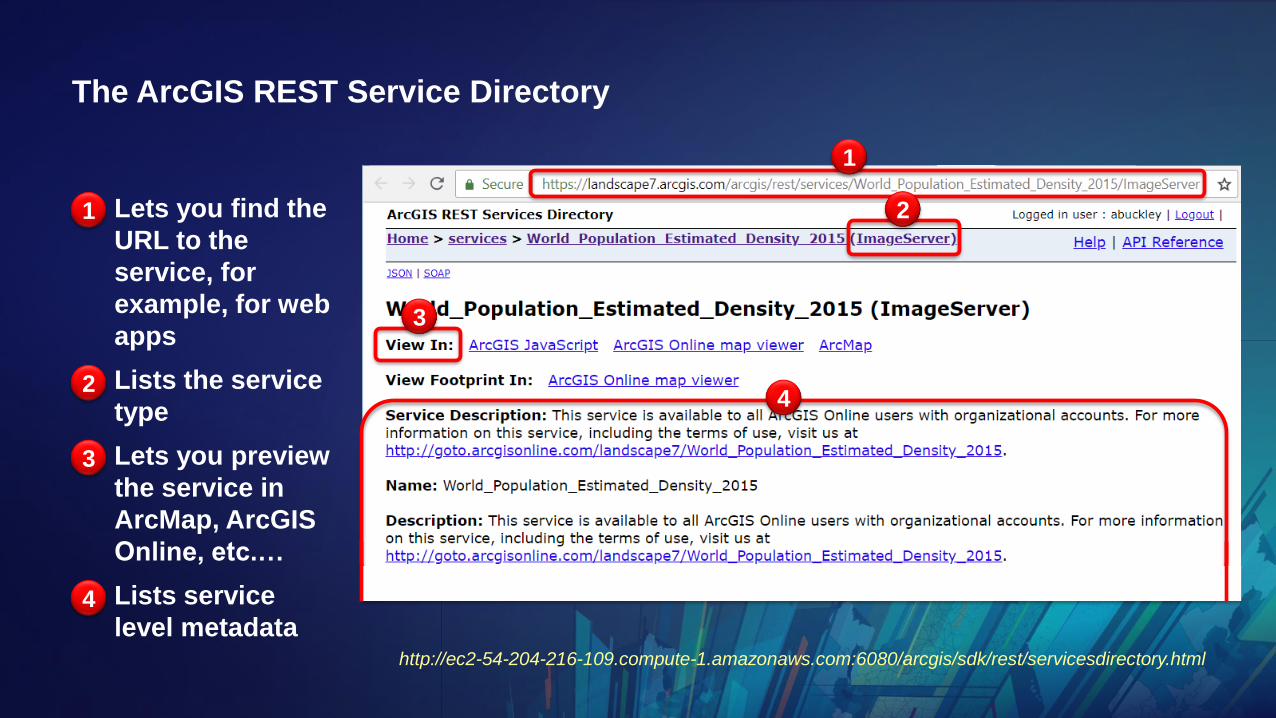
The ArcGIS REST Service Directory
• Lets you find the
URL to the
service, for
example, for web
apps
• Lists the service
type
• Lets you preview
the service in
ArcMap, ArcGIS
Online, etc.…
• Lists service
level metadatahttp://ec2-54-204-216-109.compute-1.amazonaws.com:6080/arcgis/sdk/rest/servicesdirectory.html
1
2
3
1
3
4
2
4
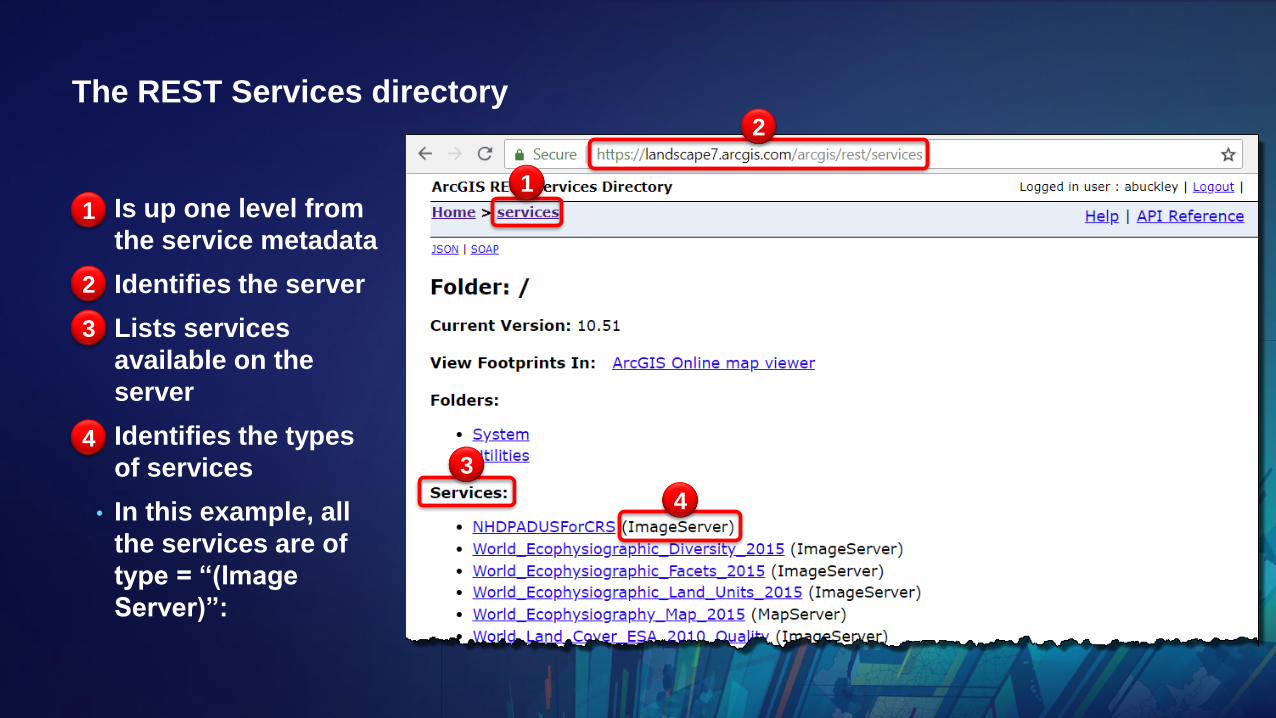
The REST Services directory
• Is up one level from
the service metadata
• Identifies the server
• Lists services
available on the
server
• Identifies the types
of services
• In this example, all
the services are of
type = “(Image
Server)”:
1
2
3
1
4
3
2
4
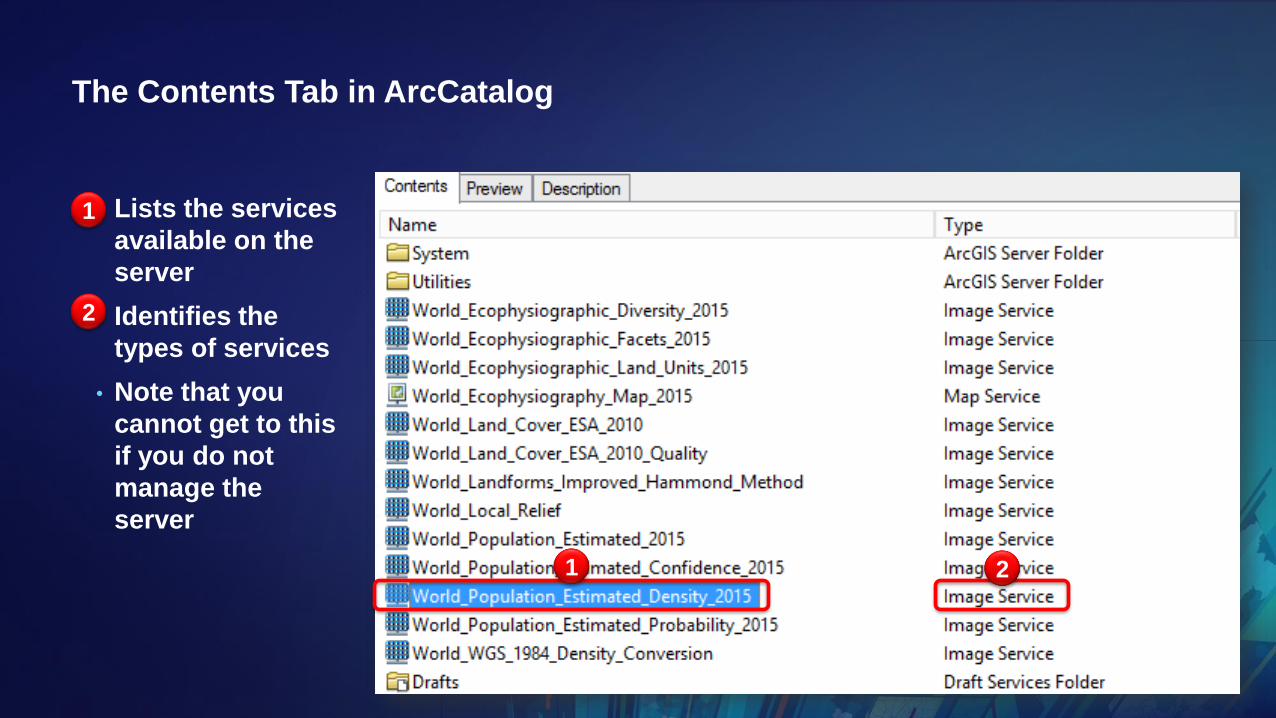
The Contents Tab in ArcCatalog
• Lists the services
available on the
server
• Identifies the
types of services
• Note that you
cannot get to this
if you do not
manage the
server
1
2
1 2
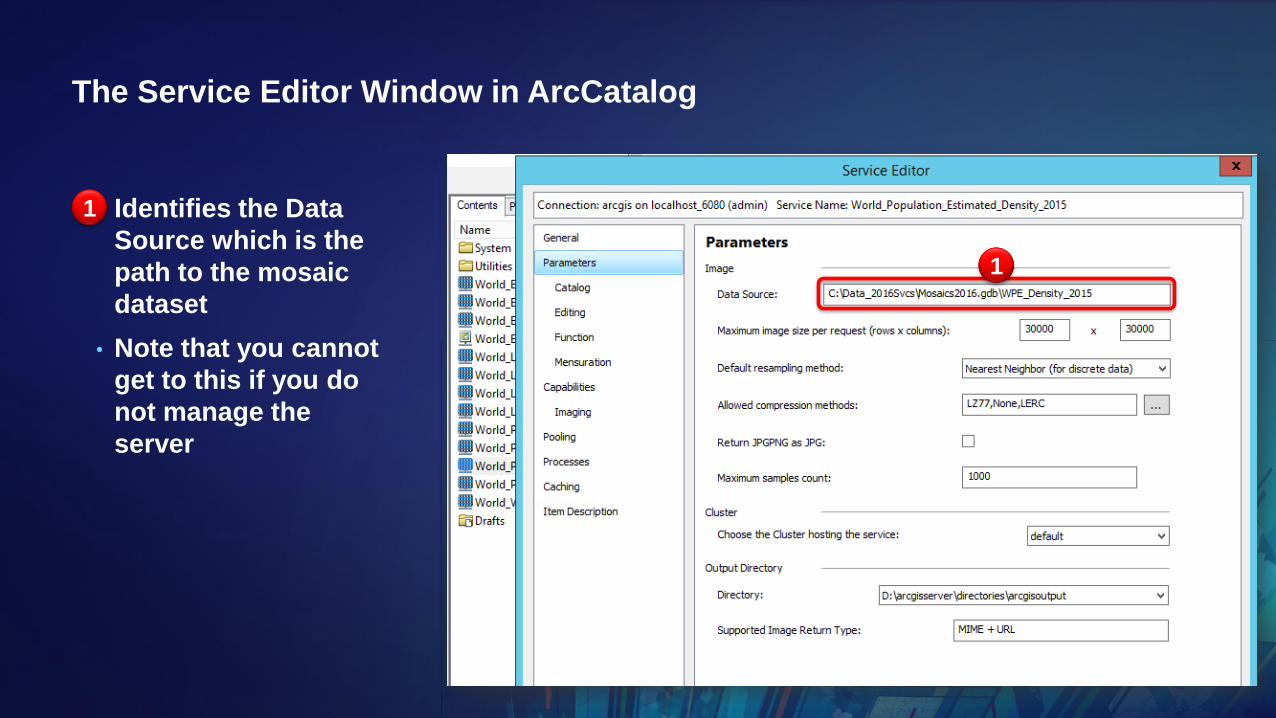
The Service Editor Window in ArcCatalog
• Identifies the Data
Source which is the
path to the mosaic
dataset
• Note that you cannot
get to this if you do
not manage the
server
1
1
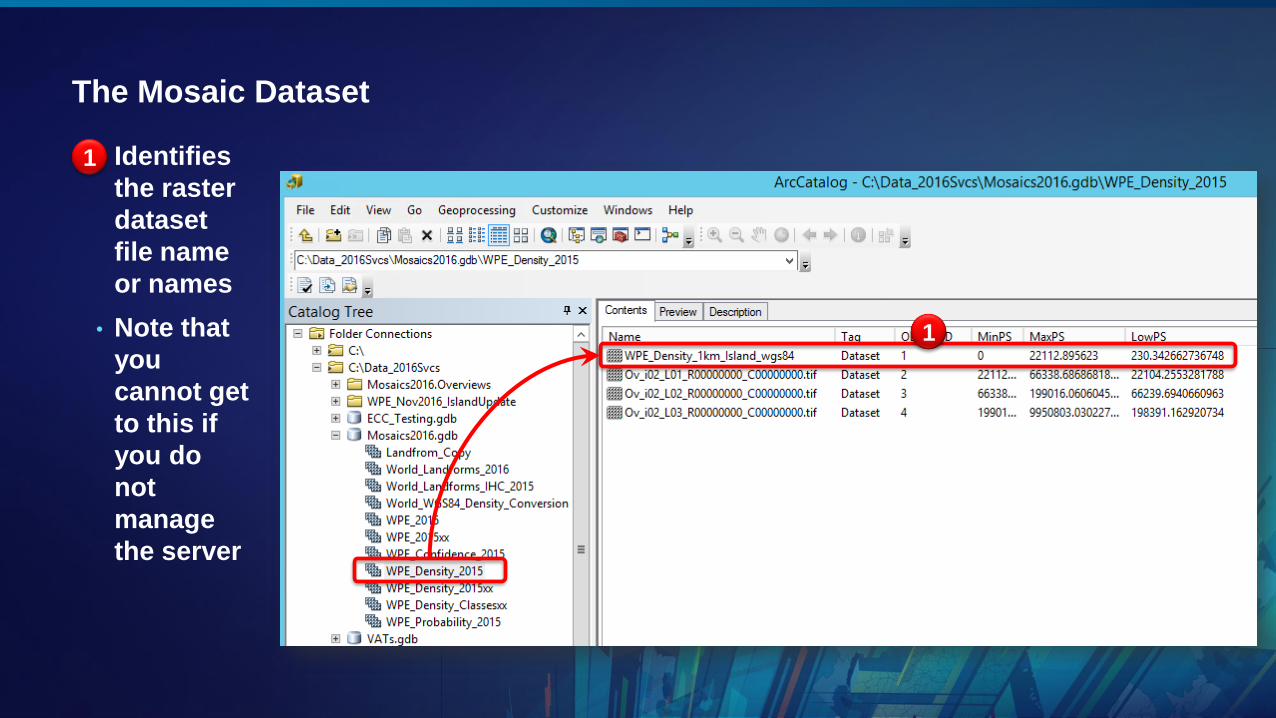
The Mosaic Dataset
• Identifies
the raster
dataset
file name
or names
• Note that
you
cannot get
to this if
you do
not
manage
the server
1
1
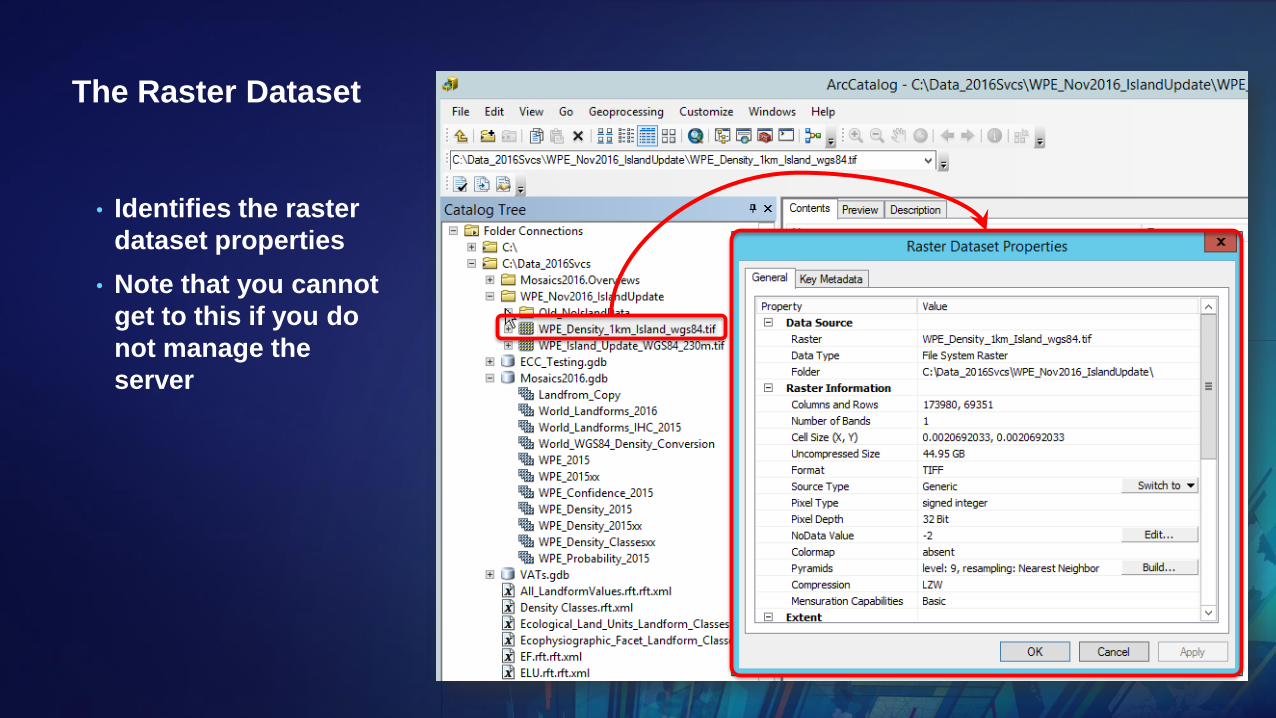
The Raster Dataset
• Identifies the raster
dataset properties
• Note that you cannot
get to this if you do
not manage the
server
Adding Living Atlas Image Services in ArcGIS Pro
• Browse for data and add to a map
- Fast and easy
- Allows you to see additional Living Atlas content
• Connect to a server and add data to a map
- Allows you to see additional server content
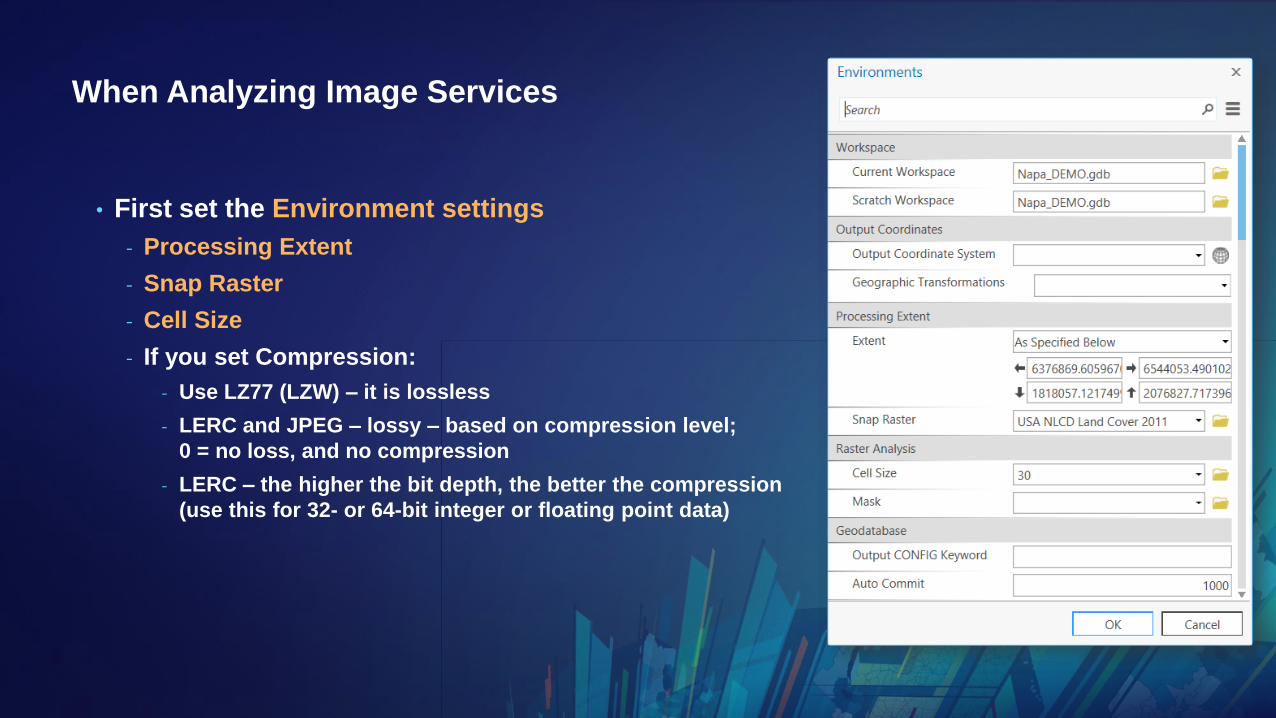
When Analyzing Image Services
• First set the Environment settings
- Processing Extent
- Snap Raster
- Cell Size
- If you set Compression:
- Use LZ77 (LZW) – it is lossless
- LERC and JPEG – lossy – based on compression level;
0 = no loss, and no compression
- LERC – the higher the bit depth, the better the compression
(use this for 32- or 64-bit integer or floating point data)
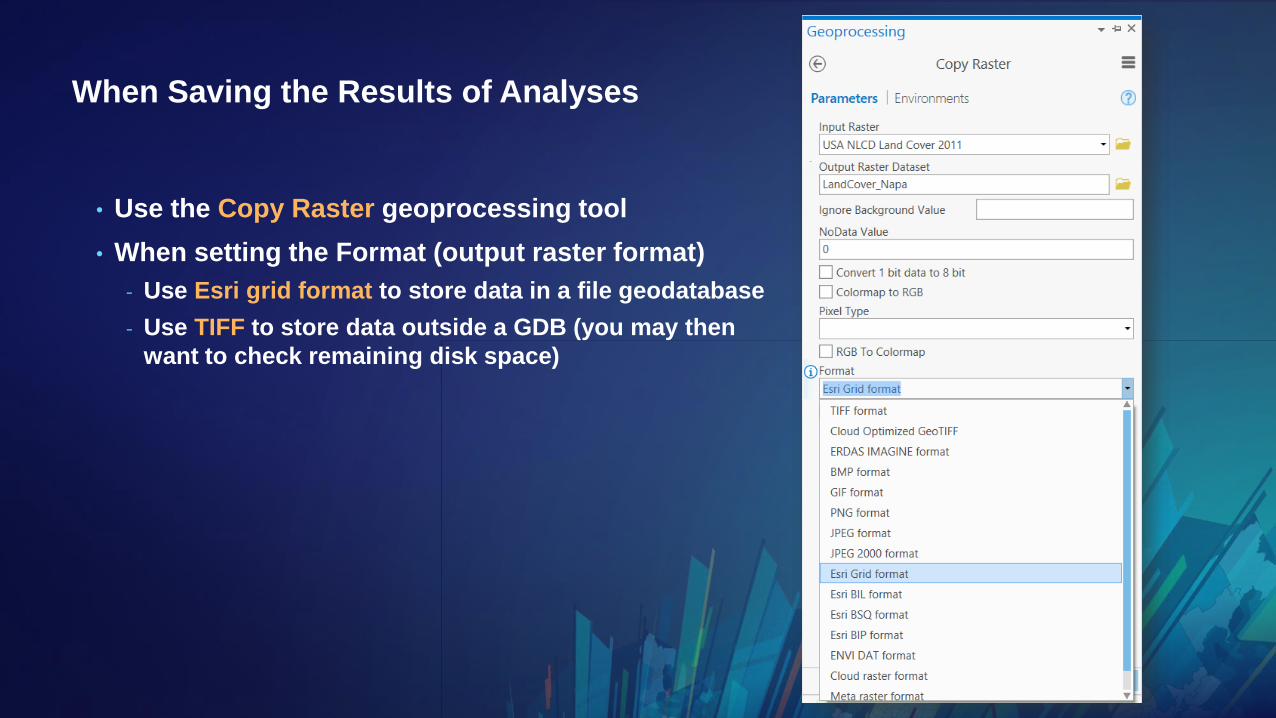
When Saving the Results of Analyses
• Use the Copy Raster geoprocessing tool
• When setting the Format (output raster format)
- Use Esri grid format to store data in a file geodatabase
- Use TIFF to store data outside a GDB (you may then
want to check remaining disk space)
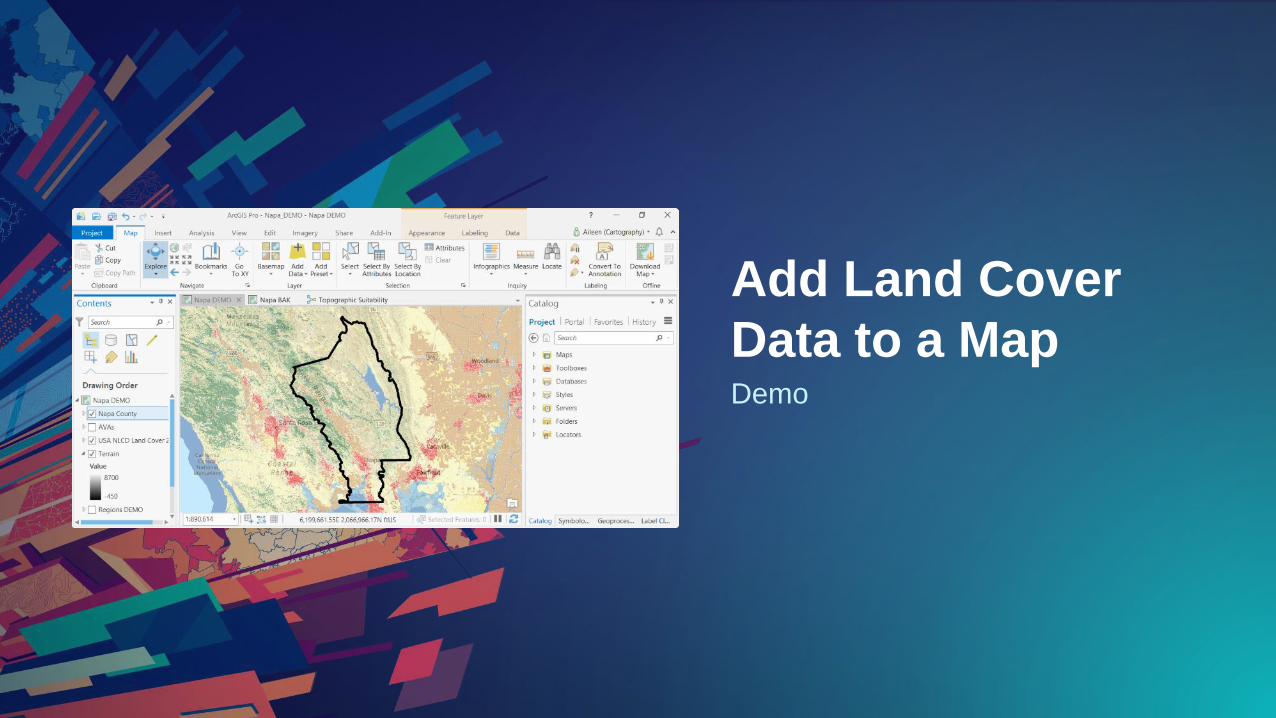
Demo
Add Land Cover
Data to a Map
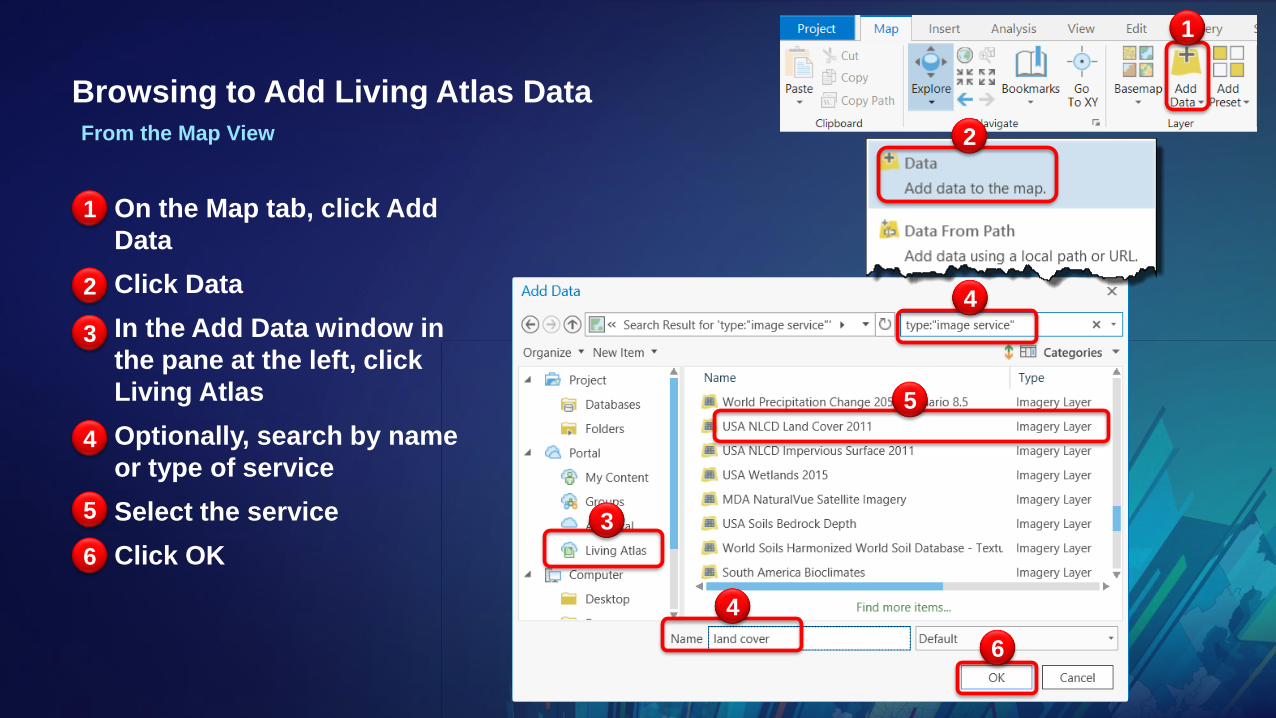
Browsing to Add Living Atlas Data
• On the Map tab, click Add
Data
• Click Data
• In the Add Data window in
the pane at the left, click
Living Atlas
• Optionally, search by name
or type of service
• Select the service
• Click OK
3
42
3
4
5
1
1
5
6
6
2From the Map View
4
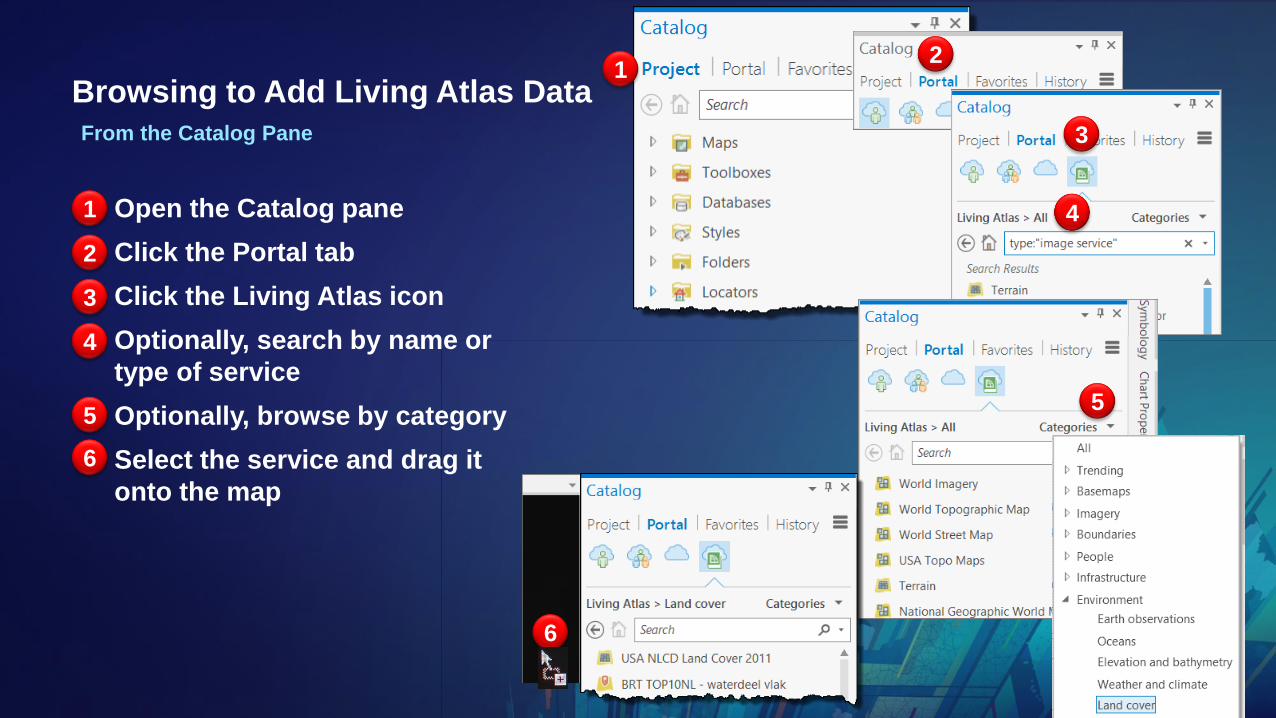
Browsing to Add Living Atlas Data
• Open the Catalog pane
• Click the Portal tab
• Click the Living Atlas icon
• Optionally, search by name or
type of service
• Optionally, browse by category
• Select the service and drag it
onto the map
From the Catalog Pane
2
3
4
5
1
6
2
3
4
1
6
5
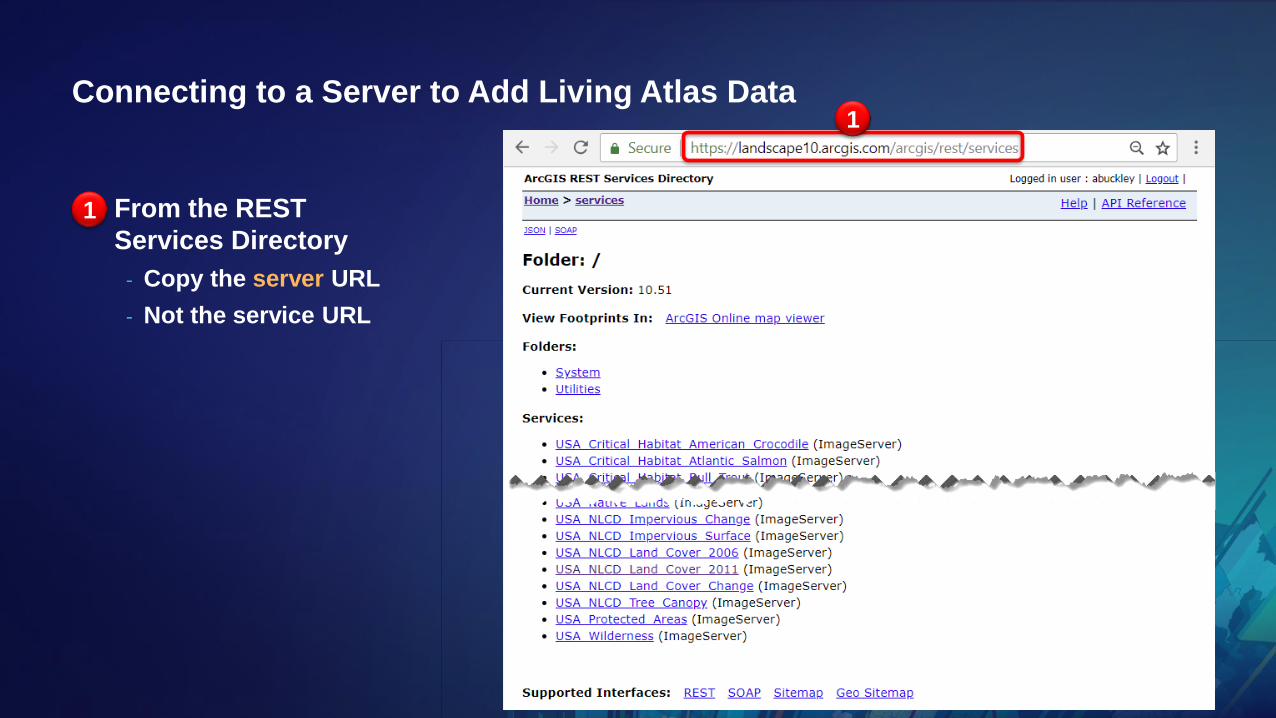
Connecting to a Server to Add Living Atlas Data
• From the REST
Services Directory
- Copy the server URL
- Not the service URL
1
1
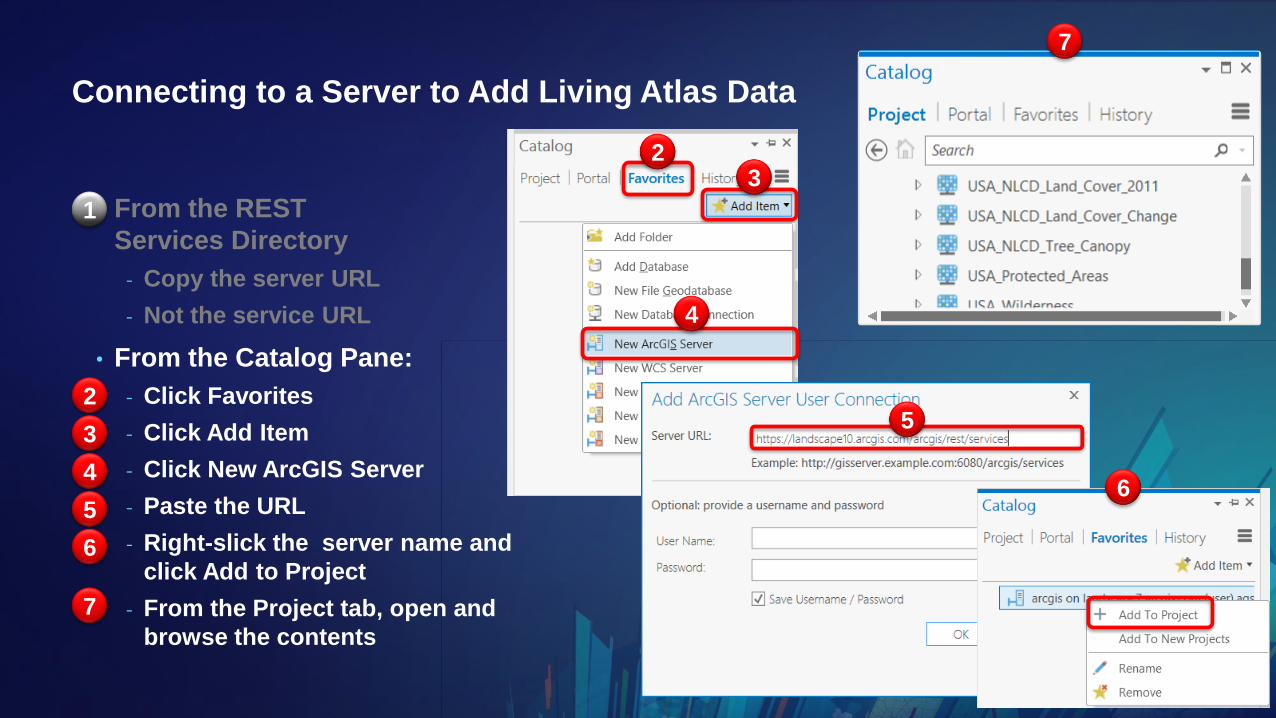
Connecting to a Server to Add Living Atlas Data
• From the REST
Services Directory
- Copy the server URL
- Not the service URL
• From the Catalog Pane:
- Click Favorites
- Click Add Item
- Click New ArcGIS Server
- Paste the URL
- Right-slick the server name and
click Add to Project
- From the Project tab, open and
browse the contents
23
4
52
3
4
5
1
6
6
7
7
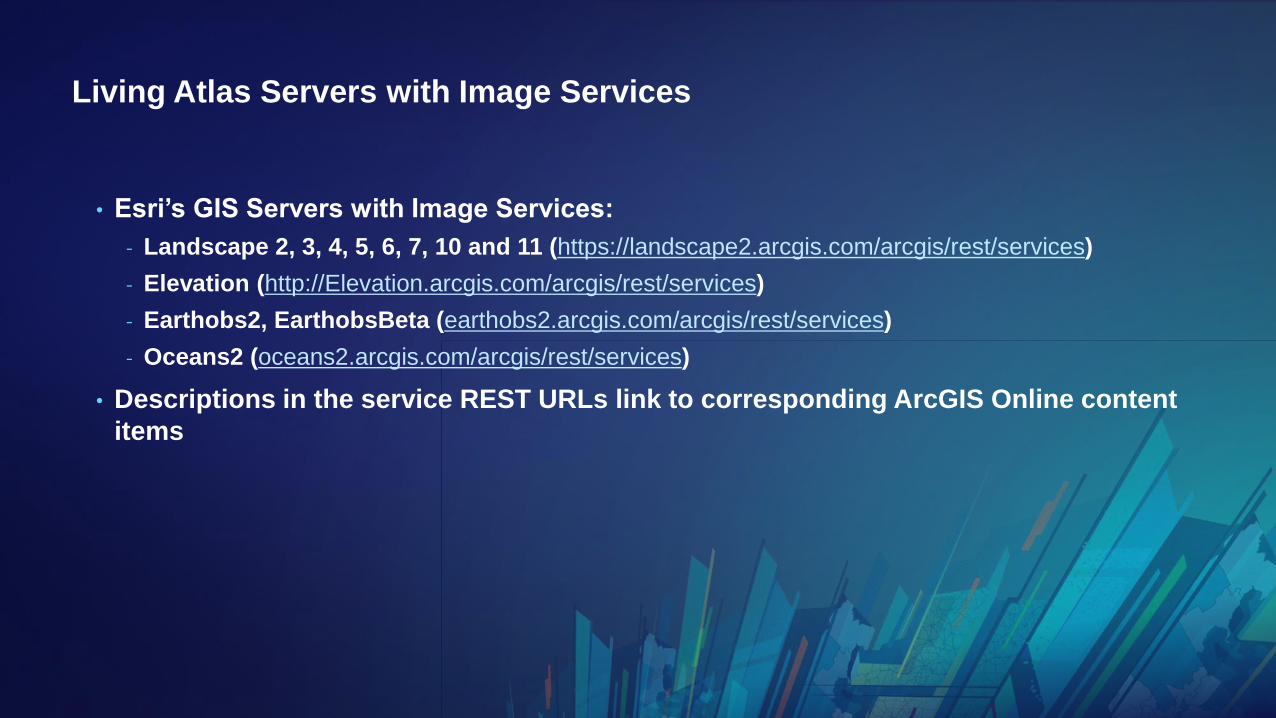
Living Atlas Servers with Image Services
• Esri’s GIS Servers with Image Services:
- Landscape 2, 3, 4, 5, 6, 7, 10 and 11 (https://landscape2.arcgis.com/arcgis/rest/services)
- Elevation (http://Elevation.arcgis.com/arcgis/rest/services)
- Earthobs2, EarthobsBeta (earthobs2.arcgis.com/arcgis/rest/services)
- Oceans2 (oceans2.arcgis.com/arcgis/rest/services)
• Descriptions in the service REST URLs link to corresponding ArcGIS Online content
items

Using Image Services in
ArcGIS Pro
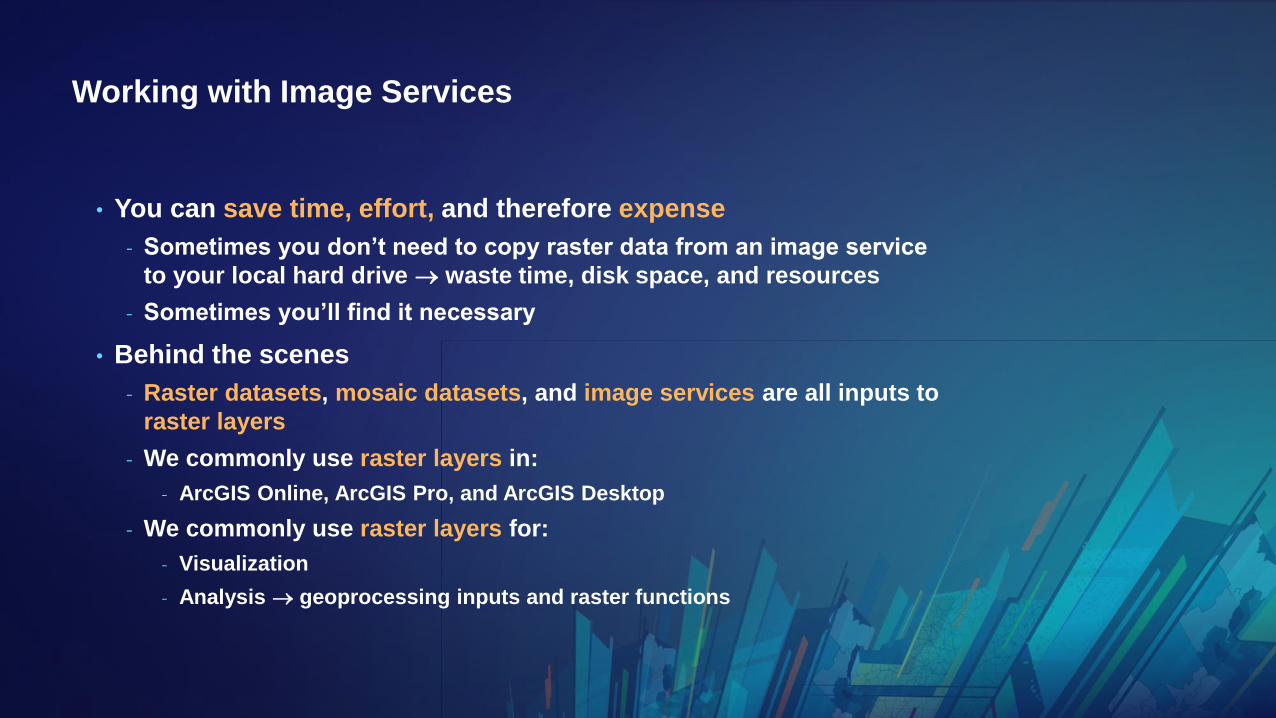
Working with Image Services
• You can save time, effort, and therefore expense
- Sometimes you don’t need to copy raster data from an image service
to your local hard drive waste time, disk space, and resources
- Sometimes you’ll find it necessary
• Behind the scenes
- Raster datasets, mosaic datasets, and image services are all inputs to
raster layers
- We commonly use raster layers in:
- ArcGIS Online, ArcGIS Pro, and ArcGIS Desktop
- We commonly use raster layers for:
- Visualization
- Analysis geoprocessing inputs and raster functions
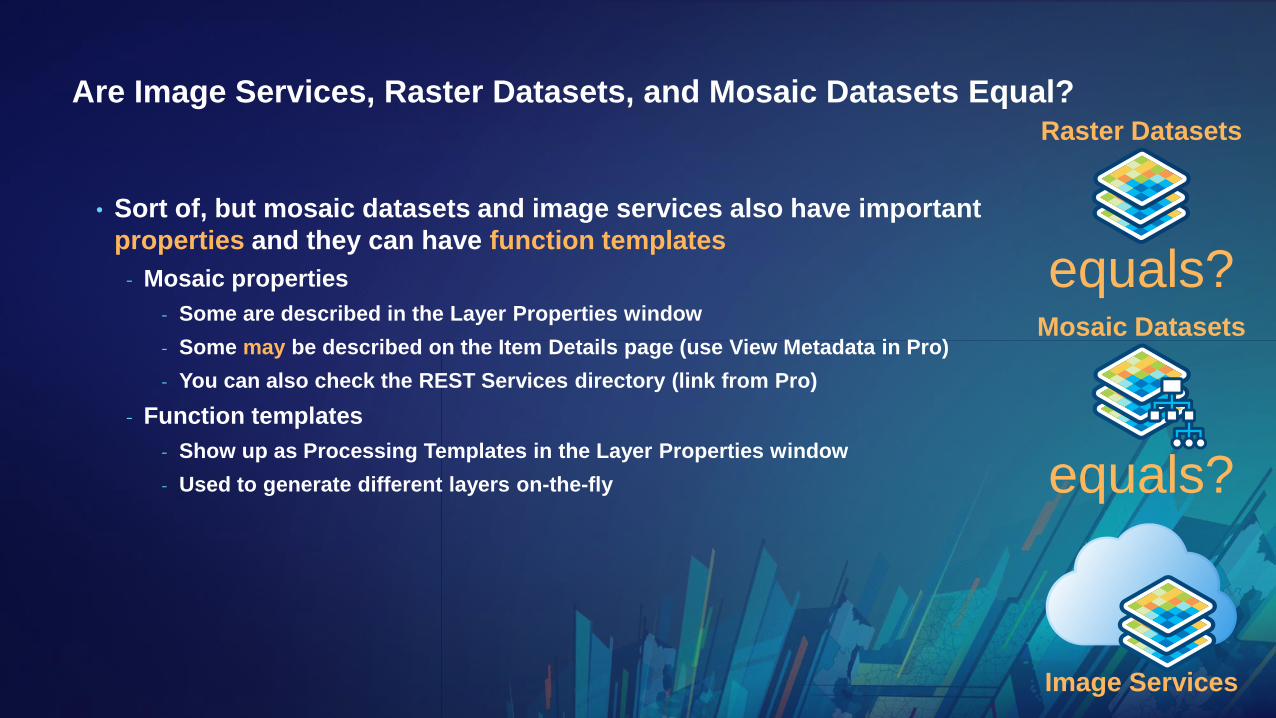
Are Image Services, Raster Datasets, and Mosaic Datasets Equal?
• Sort of, but mosaic datasets and image services also have important
properties and they can have function templates
- Mosaic properties
- Some are described in the Layer Properties window
- Some may be described on the Item Details page (use View Metadata in Pro)
- You can also check the REST Services directory (link from Pro)
- Function templates
- Show up as Processing Templates in the Layer Properties window
- Used to generate different layers on-the-fly
equals?
Image Services
Raster Datasets
Mosaic Datasets
equals?
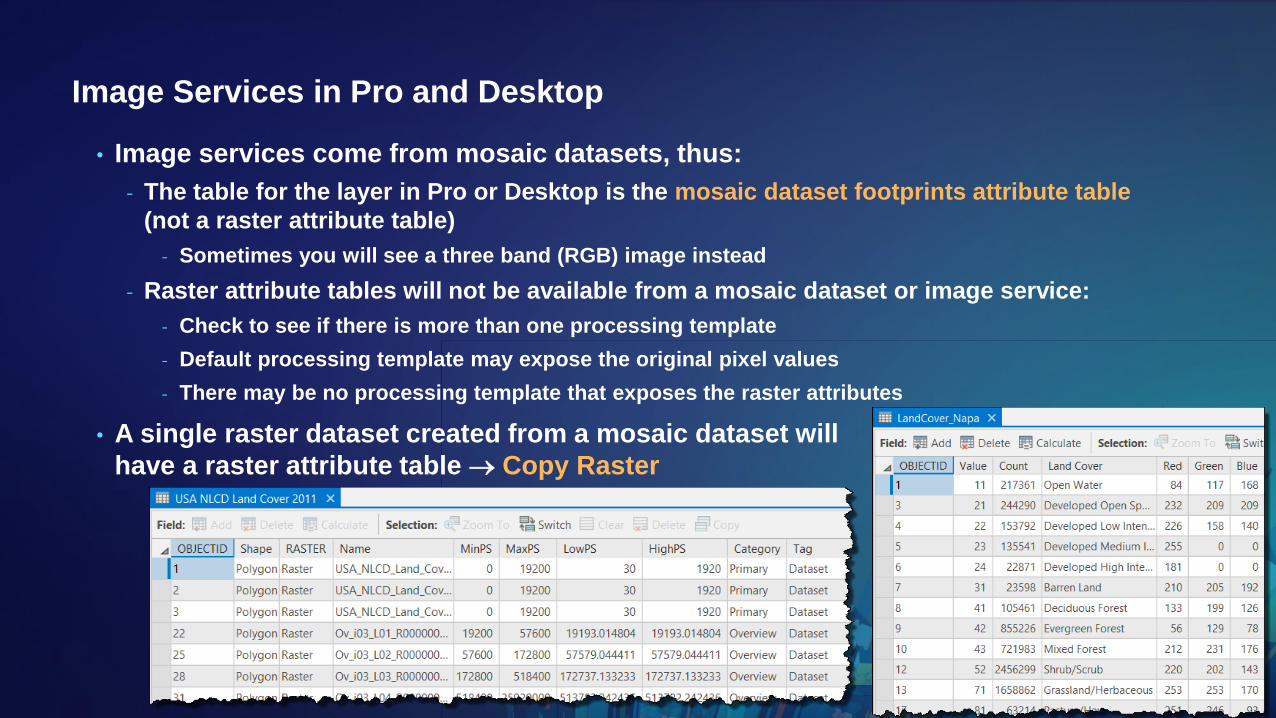
Image Services in Pro and Desktop
• Image services come from mosaic datasets, thus:
- The table for the layer in Pro or Desktop is the mosaic dataset footprints attribute table
(not a raster attribute table)
- Sometimes you will see a three band (RGB) image instead
- Raster attribute tables will not be available from a mosaic dataset or image service:
- Check to see if there is more than one processing template
- Default processing template may expose the original pixel values
- There may be no processing template that exposes the raster attributes
• A single raster dataset created from a mosaic dataset will
have a raster attribute table Copy Raster
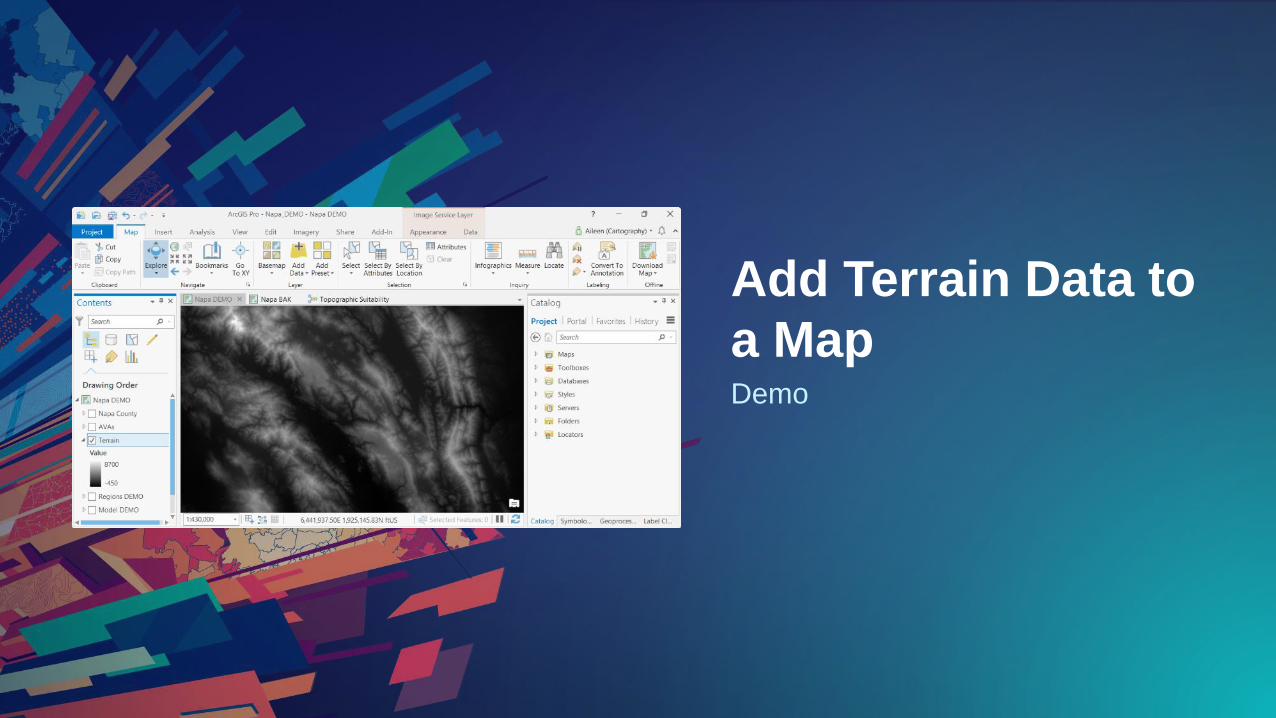
Demo
Add Terrain Data to
a Map
Suitable Locations to Grow Grapes for Mountain Wines: Napa
Analysis with Living Atlas
Image Services
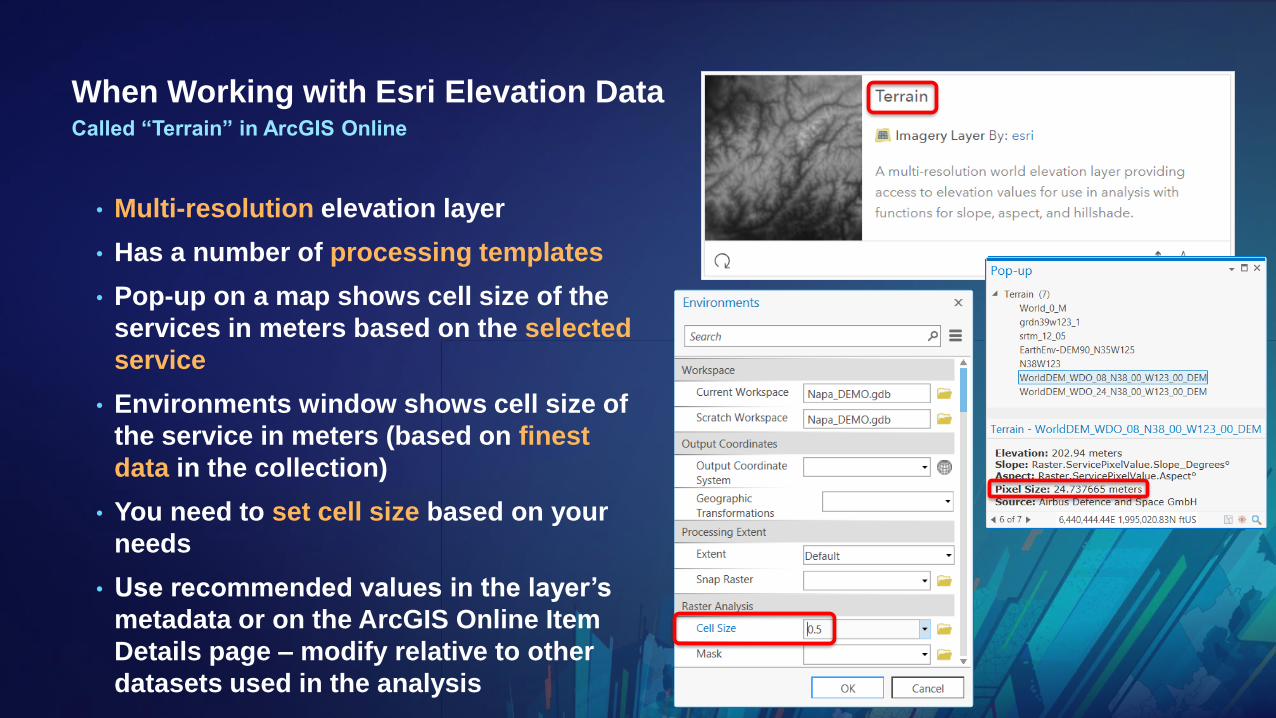
When Working with Esri Elevation DataCalled “Terrain” in ArcGIS Online
• Multi-resolution elevation layer
• Has a number of processing templates
• Pop-up on a map shows cell size of the
services in meters based on the selected
service
• Environments window shows cell size of
the service in meters (based on finest
data in the collection)
• You need to set cell size based on your
needs
• Use recommended values in the layer’s
metadata or on the ArcGIS Online Item
Details page – modify relative to other
datasets used in the analysis
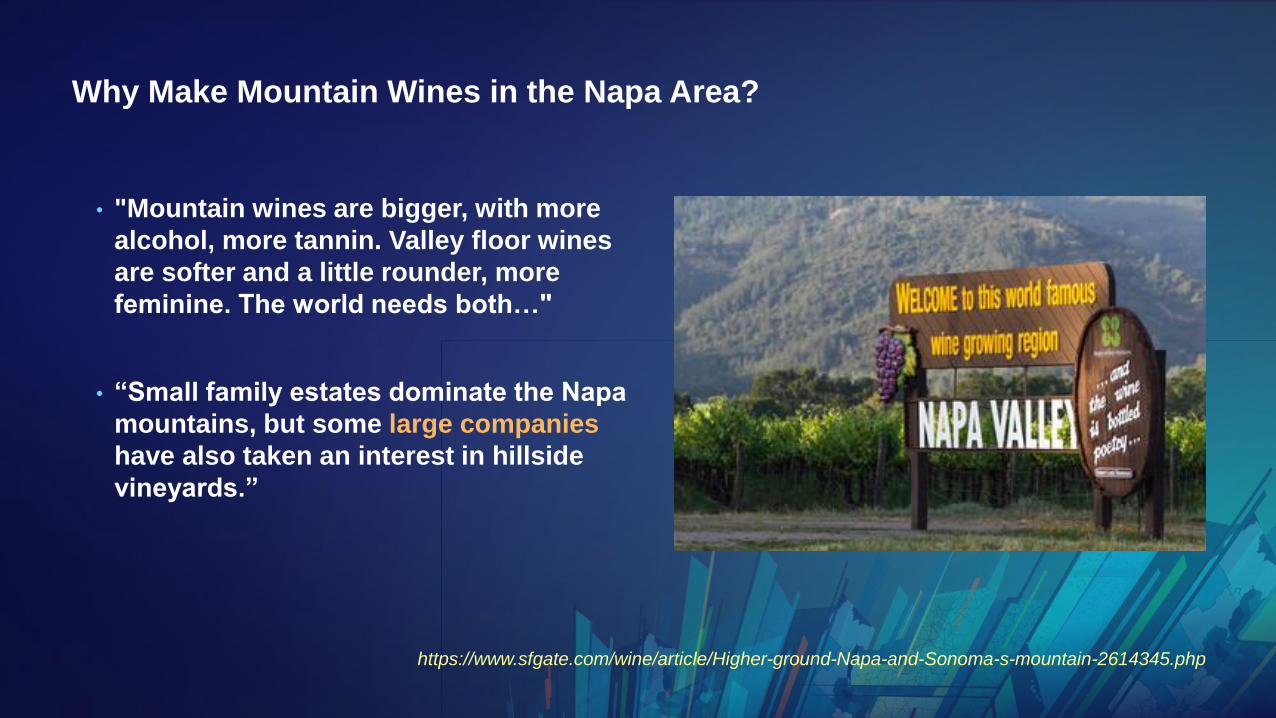
Why Make Mountain Wines in the Napa Area?
• "Mountain wines are bigger, with more
alcohol, more tannin. Valley floor wines
are softer and a little rounder, more
feminine. The world needs both…"
• “Small family estates dominate the Napa
mountains, but some large companies
have also taken an interest in hillside
vineyards.”
https://www.sfgate.com/wine/article/Higher-ground-Napa-and-Sonoma-s-mountain-2614345.php
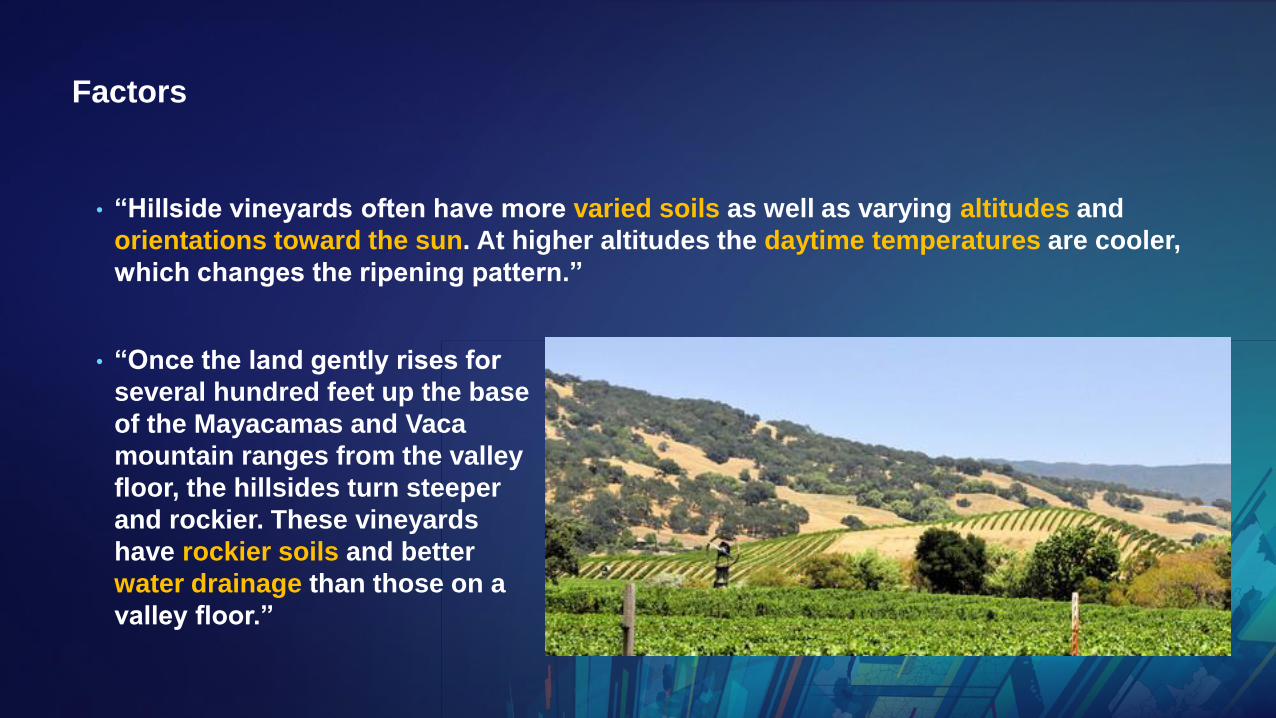
Factors
• “Hillside vineyards often have more varied soils as well as varying altitudes and
orientations toward the sun. At higher altitudes the daytime temperatures are cooler,
which changes the ripening pattern.”
• “Once the land gently rises for
several hundred feet up the base
of the Mayacamas and Vaca
mountain ranges from the valley
floor, the hillsides turn steeper
and rockier. These vineyards
have rockier soils and better
water drainage than those on a
valley floor.”
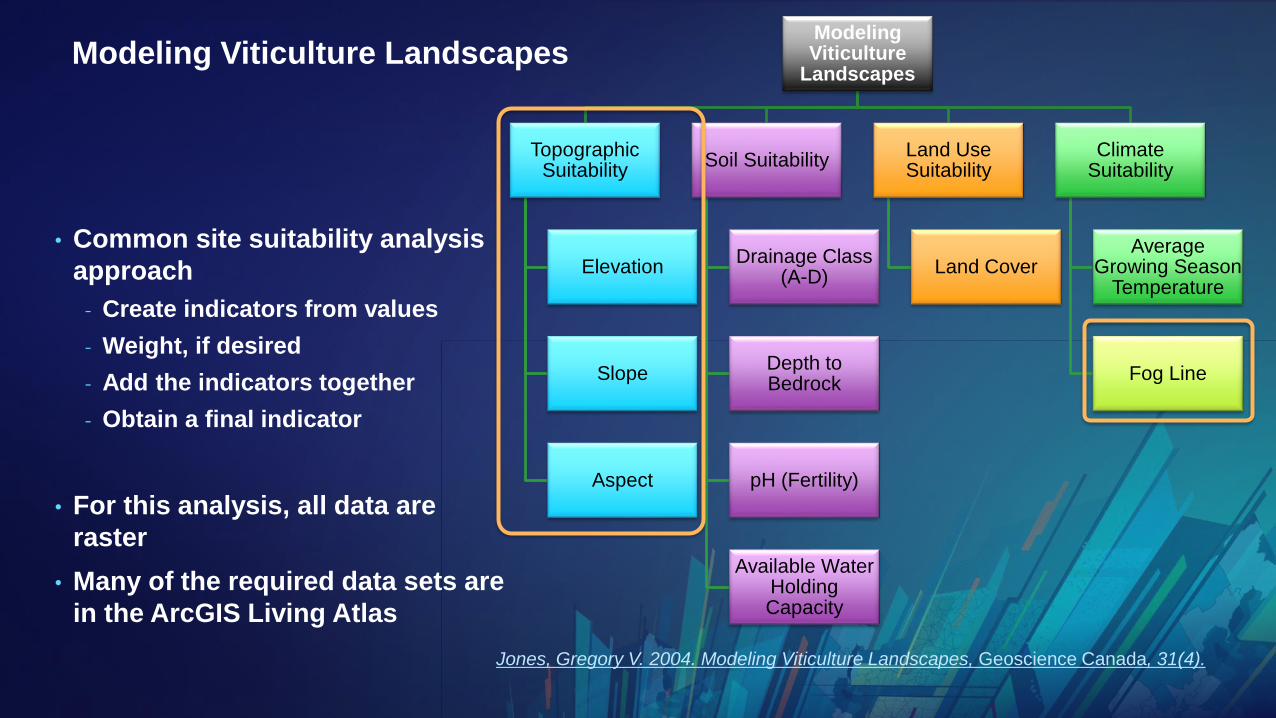
Modeling Viticulture Landscapes
• Common site suitability analysis
approach
- Create indicators from values
- Weight, if desired
- Add the indicators together
- Obtain a final indicator
• For this analysis, all data are
raster
• Many of the required data sets are
in the ArcGIS Living Atlas
Jones, Gregory V. 2004. Modeling Viticulture Landscapes, Geoscience Canada, 31(4).
Modeling Viticulture
Landscapes
Topographic Suitability
Elevation
Slope
Aspect
Soil Suitability
Drainage Class (A-D)
Depth to Bedrock
pH (Fertility)
Available Water Holding Capacity
Land Use Suitability
Land Cover
Climate Suitability
Average Growing Season
Temperature
Fog Line

Topographic Suitability Analysis
Topographic Suitability
Range: -2 to 6
ElevationRange:
-7–1320m
-7–99.9m0
100–199.9m1
200–799.9m2
800–874.9m1
875–1321m0
SlopeRange:1–67°
0°0
1–14°1
15–54°2
55–60°1
61–90°0
AspectRange:
-1–360°
-1-1
0–149°0
150–209°1
210–239°2
240–269°1
270–360°0
Fog Line
<300m0
>=300m1
• Elevation
• Slope
• Aspect
• Fog Line
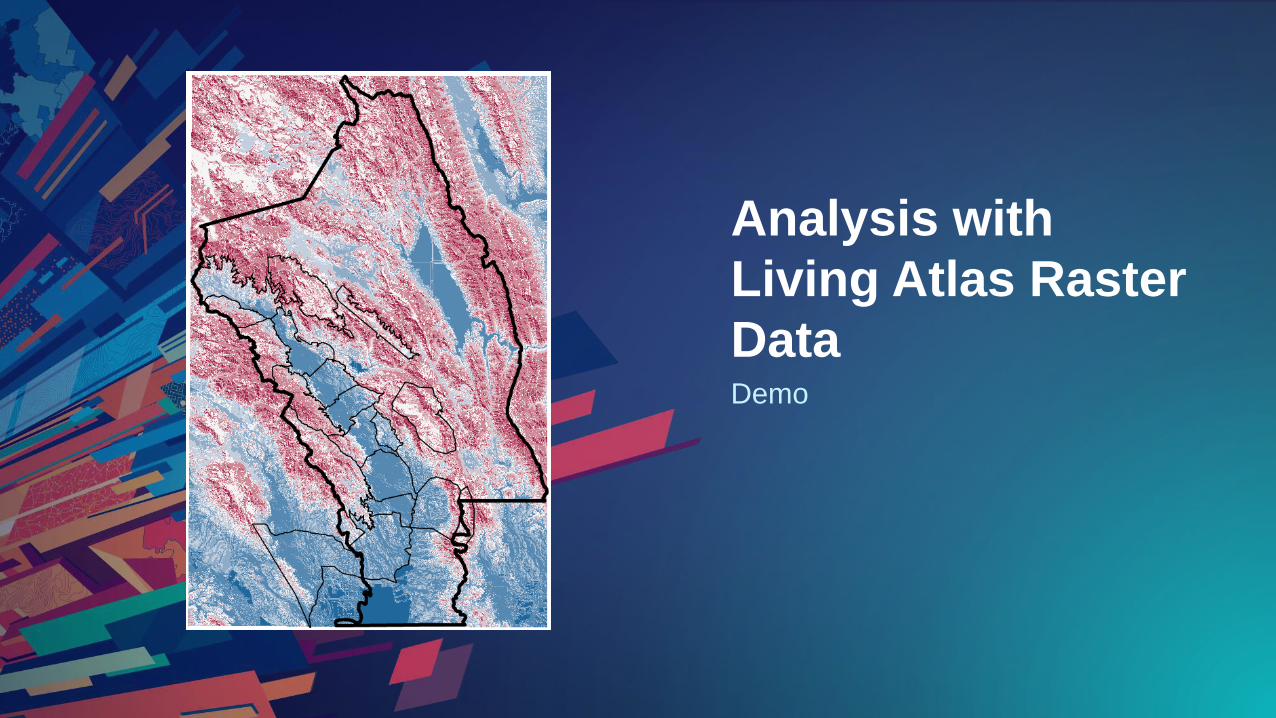
Demo
Analysis with
Living Atlas Raster
Data
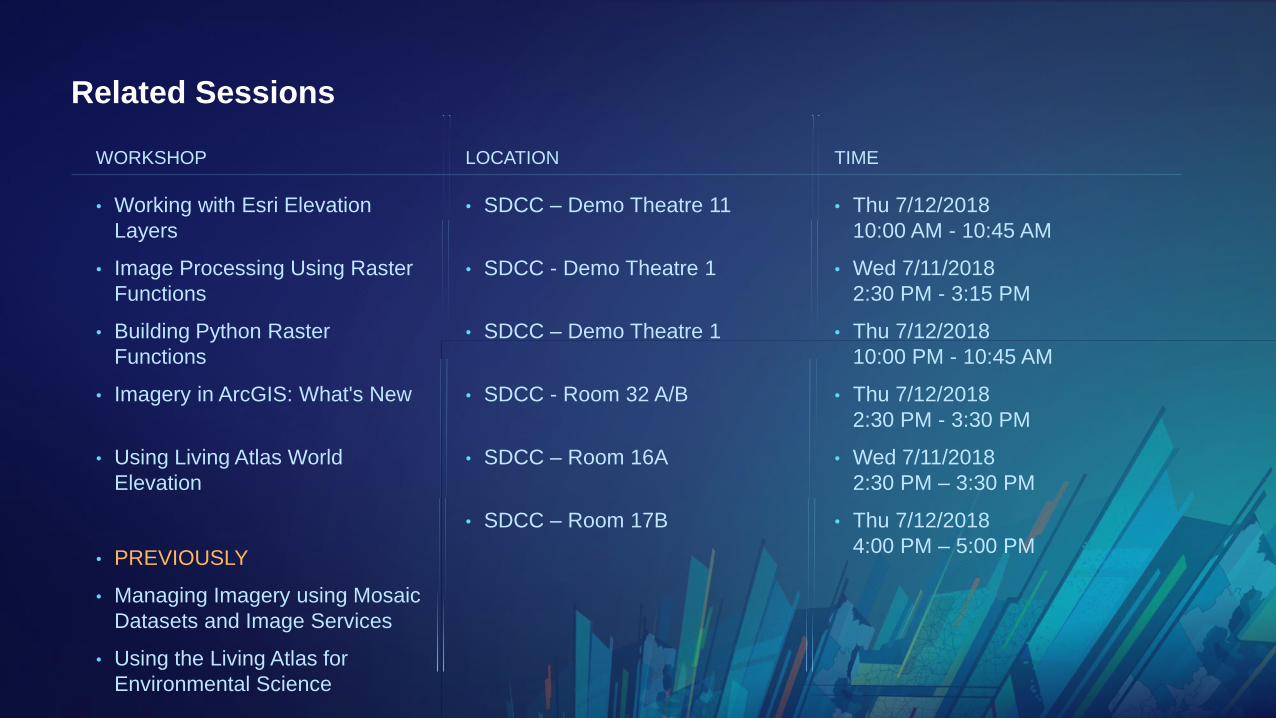
Related Sessions
• Working with Esri Elevation
Layers
• Image Processing Using Raster
Functions
• Building Python Raster
Functions
• Imagery in ArcGIS: What's New
• Using Living Atlas World
Elevation
• PREVIOUSLY
• Managing Imagery using Mosaic
Datasets and Image Services
• Using the Living Atlas for
Environmental Science
WORKSHOP LOCATION
• SDCC – Demo Theatre 11
• SDCC - Demo Theatre 1
• SDCC – Demo Theatre 1
• SDCC - Room 32 A/B
• SDCC – Room 16A
• SDCC – Room 17B
TIME
• Thu 7/12/2018
10:00 AM - 10:45 AM
• Wed 7/11/2018
2:30 PM - 3:15 PM
• Thu 7/12/2018
10:00 PM - 10:45 AM
• Thu 7/12/2018
2:30 PM - 3:30 PM
• Wed 7/11/2018
2:30 PM – 3:30 PM
• Thu 7/12/2018
4:00 PM – 5:00 PM

Please remember to fill out the survey – your feedback is important to us!
Thank You!
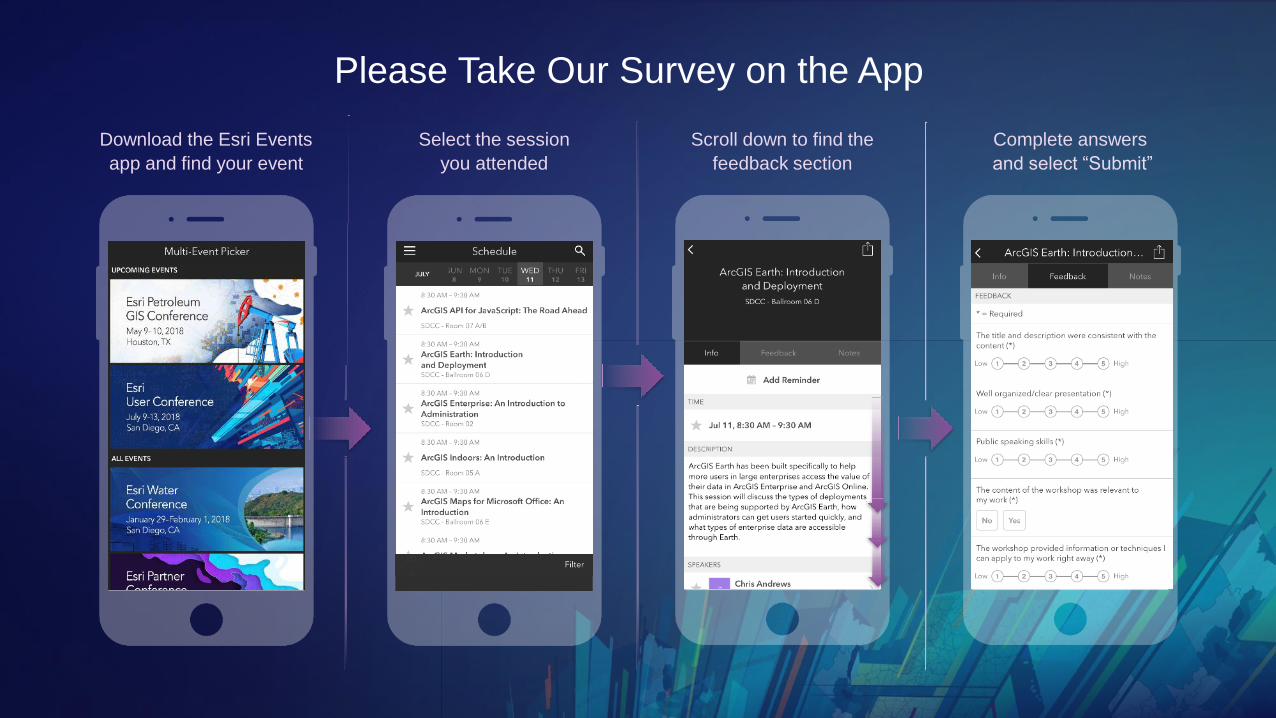
Please Take Our Survey on the App
Download the Esri Events
app and find your event
Select the session
you attended
Scroll down to find the
feedback section
Complete answers
and select “Submit”