Embed Size (px)
Citation preview

Making the Most of Your Forage Program
Thanks to:Dr. Dennis Hancock
Extension Forage SpecialistCrop and Soil Sciences - UGA
Kevin FergusonExtension Area SpecialistFarm ManagementUniversity of Tennessee Extension

World Demand for Food Global population increases from 7 to almost 9 billion by
2040.
The number of middle class consumers increases by 3 billion over the next 20 years.
Demand for resources will increase exponentially . . . .
By 2030, the world will need at least:◦ 50 percent more food◦ 45 percent more energy◦ 30 percent more water
Source: United Nations Report, “Resilient People, Resilient Planet, A Future Worth Choosing”, Pre-report Overview – January, 2012.

College Majors that are Useless
#1 Agriculture #2 Fashion Design #3 Theater #4 Animal Science #5 Horticulture
By Terrence Loose –January 2012
Make sure you read the fine print!!

Many people like to . . .
“Torture the data until it confesses the answer they
want!”

20 Most Useless Degrees Newsweek - - June, 2011
1. 2. Horticulture 3. Agriculture 4. Advertising 5. Fashion Design 6. Child & Family Studies 7. Music 8. Mechanical Eng. 9. Chemistry 10. Nutrition
11. Human Resources 12. Theater 13. Art History 14. Photography 15. Literature 16. Art 17. Fine Arts 18. Psychology 19. English 20 Animal Science

# 1 Most Useless Degree
20 Most Useless Degrees Newsweek - - June, 2011
Something to think about . . . .
“In today’s environment of instantaneous, constant and social media . . . we have developed a culture where emotions, sympathy and fear trump science, logic and reason.”

Cattleman’s MBA Summary - 2009
Soil Test pH - - Lime if Needed Evaluate per unit Costs and Revenue Evaluate Weed Control / Fertility
Options Clovers / Reseeding Options
Forage Utilization Stocking Rates / Controlled & Extended
Grazing

Food for Thought
“I can’t afford to soil test and fertilize!”
Remember that hay crops remove more nutrients than almost any other commercial crop!
In pastures, approximately 80% of the nutrients are returned to the pasture.◦ Importance of rotational grazing and distribution
of nutrients!

Tradition and Confusion “I have always used 300 pounds
of triple 19 per acre!”
◦ “I firmly believe that adhering to tradition is the greatest obstacle to production agriculture.” James A. Bennet
Former Sunbelt Farmer of the Year for Virginia
“I’ll put 60 units of nitrate on it . . . ” “I put 50 units of ammonium nitrate on it . . .”

Challenges and Opportunities
“T’weren’t the things I didn’t know that done me in, T’were the things I knew and didn’t do.
So, we don’t need to be taught,Just reminded!”
Dr. John Ikerd

U.S. Average Cow/Calf Cash Production Expenses
367
361
355
371
371
347 37
138
536
436
5
384
396
404
416
435
448 52
2 543
565
552
550
631
678
0
100
200
300
400
500
600
700
Dol
lars
per
Cow
*
'90 '92 '94 '96 '98 '00 '02 '04 '06 '08 '10 '12Year
* Includes interest costs and a pasture rental charge.
Source: Livestock Marketing Information Center – Updated July 2012


Over the next few minutes….
• Improving returns on your fertilizer investment
• Getting at the root of it!
• Focusing on forage use efficiency
• Making every bite count

Forage Cost ($/lb) Total Cost ($/Acre)
Forage Yield (lbs/Acre
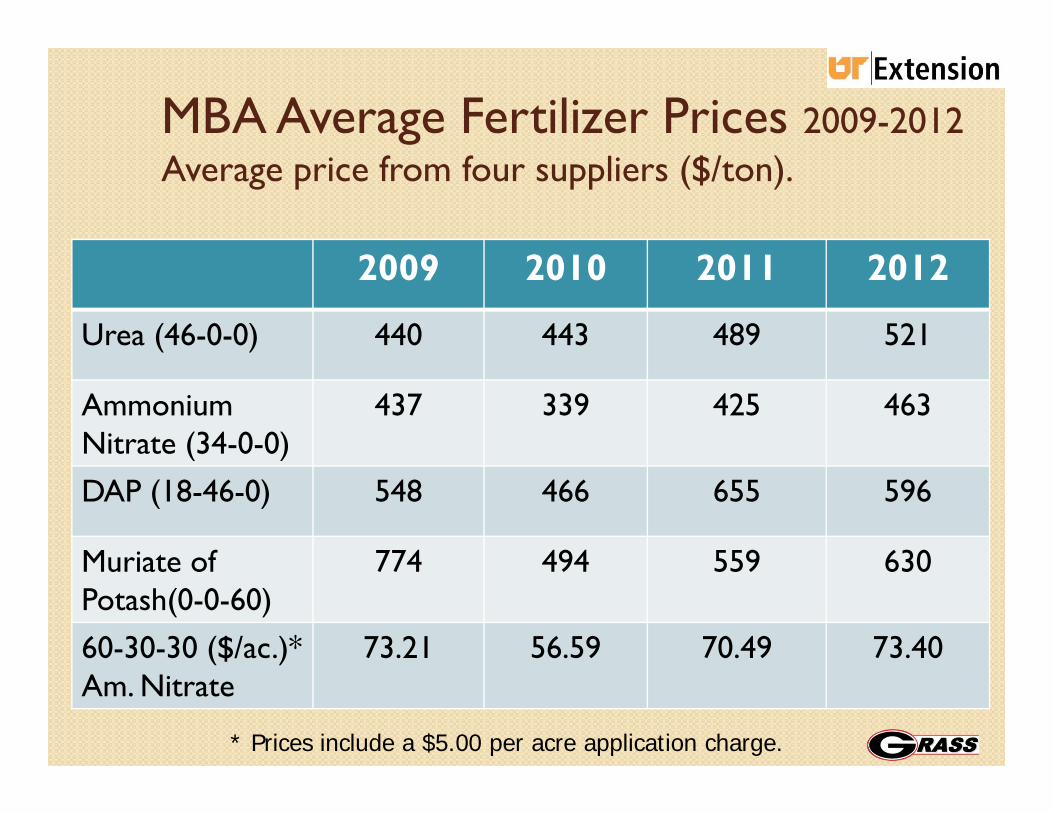
MBA Average Fertilizer Prices 2009-2012Average price from four suppliers ($/ton).
2009 2010 2011 2012
Urea (46-0-0) 440 443 489 521
Ammonium Nitrate (34-0-0)
437 339 425 463
DAP (18-46-0) 548 466 655 596
Muriate ofPotash(0-0-60)
774 494 559 630
60-30-30 ($/ac.)*Am. Nitrate
73.21 56.59 70.49 73.40
* Prices include a $5.00 per acre application charge.

Northeast TN Fertilizer Prices ($/ton) 2010-2012Source: Input Supply Survey, David Bilderback, UT Extension
June 2010
March 2011
February2012
July2012
Urea (46-0-0) 456 520 554 782$0.85/lb. N
Ammonium Nitrate (34-0-0)
411 497 518 587$0.86/lb. N
DAP (18-46-0) 532 711 672 677
Muriate ofPotash(0-0-60)
531 613 694 707
60-30-30 ($/ac.)*Am. Nitrate
64.79 78.78 81.03 86.41
* Prices include a $5.00 per acre application charge.

Fertilizer Calculator Spreadsheet
http://economics.ag.utk.edu/soft.html

Food for Thought
Value of Clover ◦ 60lbs of N / Acre
◦ 2009 MBA◦ N from Urea @ 0.48/lb $28.80/Acre◦ N from Am. Nitrate @ 0.64/lb $38.40/Acre
◦ 2012 Northeast TN◦ N from Urea @ 0.85/lb $51.00/Acre◦ N from Am. Nitrate @ 0.86/lb $51.60/Acre

The False Economy of Shortcuts
Adapted from R.C. Lacy, 2008
Cost of Production Compared to AverageYield
(tn/ac) 60% 75% 90% 100% 110% 125%8 $45 $56 $68 $75 $83 $94 7 $51 $64 $77 $86 $94 $107 6 $60 $75 $90 $100 $110 $125 5 $72 $90 $108 $120 $132 $150 4 $90 $113 $135 $150 $165 $188 3 $120 $150 $180 $200 $220 $250

Soil Test and Follow Fertility Recommendations
Sample hayfields every year and 1/3 of your pastures each year.

DO NOT cut back on lime!
Get your priorities right!1.Lime is still job #1.

How Soil pH Affects Availability of Plant Nutrients
The difference of a soil pH of 5.6 vs. 6.2
NutrientAmt. Used Annually
Unit Price
Dec. in Efficiency
Value of Decrease
(Lbs/acre) ($/lb) ($/acre)
N 60 $0.86 35% -$18.06P2O5 30 $0.74 50% -$ 11.10K2O 30 $0.59 10% -$ 1.77
Total -$30.93
60-30-30 = $86.41 per acre

Fertilization Strategies
Hayfield 2 & 3pH = 5.5P = 15K = 90OM = 1.5%
Hayfield 2 & 3pH = 5.5P = 15K = 90OM = 1.5%
Hayfield 1pH = 6.0P = 25K = 120OM = 2.5%
Hayfield 1pH = 6.0P = 25K = 120OM = 2.5%
Pasture ApH = 6.2P = 35K = 180OM = 3%
Pasture ApH = 6.2P = 35K = 180OM = 3%

Low Soil pH
Photo credit: Auburn University

Drought Tolerance of Forage Species
SpeciesWater Use Efficiency
Max. Root Depth
DM lbs/inch inches
Coastal Bermudagrass 1646 78
Common Bermudagrass* ~1000 ~50
Pensacola Bahiagrass 1194 79
Tall Fescue 1064 48
Ladino Clover 480 38
Red Clover 436 45From: Southern Forages, as adapted from Doss et al. (1960; 1962; 1963)* Estimates.

The Most Popular Question in a Drought Year:
“Why are my hayfields green and my pastures
brown?”
Get to the root of the problem.

Write this down in BIG BOLD letters!
“GRASS GROWS GRASS.”

What you don’t see….
Roots die back
Roots die back even
more
Graze/Cut Regrowth Begins
Graze/CutAgainAdequate
Rest

In continuously grazed pastures, most plants are grazed every 2 – 7 days.
With recommended rest periods, roots will redevelop to approximately the same depth as uncut plants.
21 days
7 days
2 days
Proper Rest Following Grazing is Key!
Picture staged by: C. Mackoviak, Univ. of Florida

Grazing Rules of Thumb
Crop
Target Height (inches) RecommendedRest Period
(days)Begin
GrazingEnd
Grazing*
Alfalfa (grazing types) 10-16 2-4 15-30Annual Ryegrass 6-12 3-4 7-25Bahiagrass 6-10 1-2 10-20Bermudagrass 6-12 2-6 10-20Clover, White 6-8 1-3 7-15Clovers, Other 8-10 3-5 10-20Orchardgrass 8-12 3-6 15-30Pearl millet 20-24 8-12 10-20Small grains 8-12 4 7-30Sorghum/sudan 20-24 8-12 10-20Switchgrass 18-22 8-12 30-45Tall Fescue 4-8 2-3 15-30* Height at end of grazing may need to be higher to optimize intake
of quality forage or vigorous re-growth.

Be Careful of Cutting Height
Dr. Dennis Hancock, Univ. of Georgia

Leave a Few Leaves
Dr. Dennis Hancock, Univ. of Georgia

“If used incorrectly, this will be the biggest limit to your profitability.”

Problem with “Heavy Metal”?Let there be no doubt,
The most profitable forage-based livestock systems store very little forage.
• “The most cost-effective forage harvester has four legs.”
• Just like other harvesters, the four legged harvesters have to be driven.

Just purchased our dream home and 20 acres in the country!
Farm /country living is the life for me!
Now I need a new . . .
Killer Toy
Avoid KTs . . .

Efficiencies of Grazing Systems
System EfficiencyGrazing
Continuous Stocking 30-40%Slow Rotation (3-4 paddocks) 50-60%Moderate Rotation (6-8 paddocks) 60-70%Strip Grazing 70-80%

Effects of rotational stocking on performance of beef cattle grazing bermudagrass and endophyte-free tall fescue in central Georgia.
Item Continuous Rotational Difference*Cow weight at calving, lbs 1037 1017 NSCow weight at weaning, lbs 1090 1071 NSStocking rate, cows/acre 0.50 0.69 +38%Pregnancy rate, % 93 95 NSWeaning weight, lb 490 486 NSCalf production, lb/ac 243 334 +37%
* NS = not statistically significant

Increase in gain per acre in rotational compared to continuous grazing in studies from various southern states.
State % IncreaseArkansas 44 Georgia 37 Oklahoma 35 Virginia 61

Manure Distribution
Rotation Frequency
Years to Get 1 Pile/sq. yard
Continuous 27
14 day 8
4 day 4 – 5
2 day 2

Efficiency of Four-legged Manure Spreaders
White et al., 2001 J. Environ. Qual. 30:2180–2187

Effect of Grazing System on Hay Needs
Lbs. hay fed/cow
‐25% ‐22%
‐39%
‐31%
$37.54/cow savingsusing $100/ton hay

Efficiencies of Grazing and Mechanized Harvest
MechanicalHay 30-70%
Silage 60-85%Green Chop 70-95%
System EfficiencyGrazing
Continuous Stocking 30-40%Slow Rotation (3-4 paddocks) 50-60%Moderate Rotation (6-8 paddocks) 60-70%Strip Grazing 70-80%
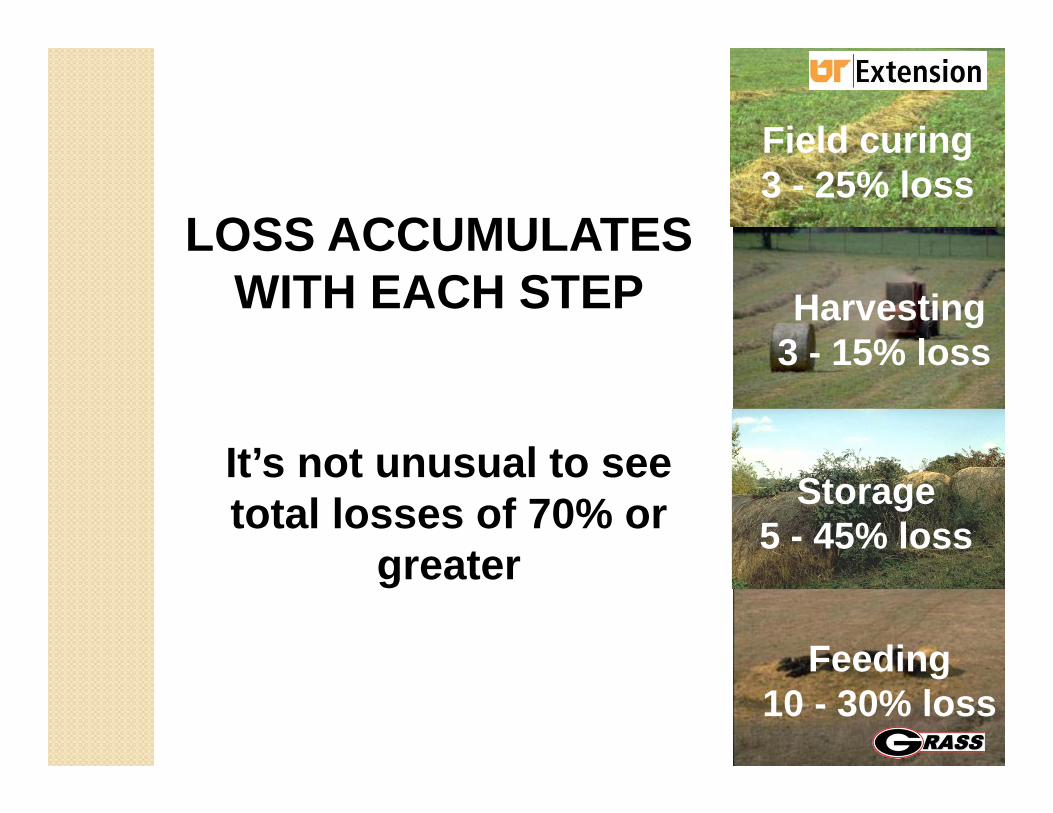
Storage5 - 45% loss
Harvesting3 - 15% loss
Feeding10 - 30% loss
Field curing3 - 25% loss
It’s not unusual to see total losses of 70% or
greater
LOSS ACCUMULATES WITH EACH STEP

14 inches14 inches
~74% of the bales volume is contained in that 14 inches.

Feeding LossesFeeding Losses
Item % Waste
Cone 2 - 5
Ring 4 - 7
Trailer 10 - 13
Cradle 15 - 20
Adapted from: Southern Forages (4th ed.) andBuskirk et al., 2003. J. Anim. Sci. 81:109-115

What does a round bale weigh? The only way to know the weight of a
bale is to put the bale on the scales.

The least used and least understood element of a good forage management plan.
Photo credit: Bobby Smith, Morgan CEC
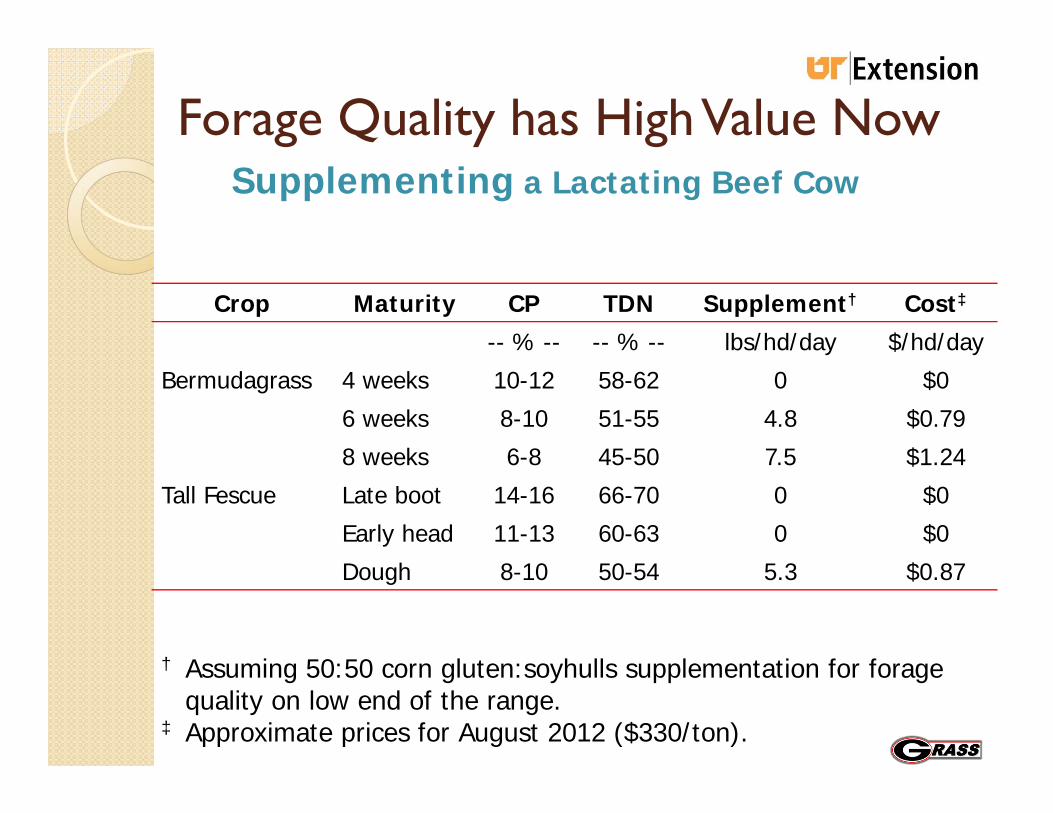
Forage Quality has High Value Now
Crop Maturity CP TDN Supplement† Cost‡
-- % -- -- % -- lbs/hd/day $/hd/day
Bermudagrass 4 weeks 10-12 58-62 0 $0
6 weeks 8-10 51-55 4.8 $0.79
8 weeks 6-8 45-50 7.5 $1.24
Tall Fescue Late boot 14-16 66-70 0 $0
Early head 11-13 60-63 0 $0
Dough 8-10 50-54 5.3 $0.87
† Assuming 50:50 corn gluten:soyhulls supplementation for forage quality on low end of the range.
‡ Approximate prices for August 2012 ($330/ton).
Supplementing a Lactating Beef Cow

“Change is inevitable, adaption and survival are
optional!”
Dee LikesKansas Livestock
Association
Challenges and Opportunities

“In times of change, the learners will inherit the Earth, while the knowers will find themselves beautifully prepared for
a world that no longer exists!”
Eric HofferAmerican Philosopher and
Writer
Challenges and Opportunities

What is the difference?
1) Digestible energy2) How much can be
eaten
1) Digestible energy2) How much can be
eaten

What is “high quality forage?”
Forage that is highly digestible (i.e., high TDN)
Large amounts of the forage can be consumed (i.e., high DMI).
Relative Forage Quality (RFQ) = TDN * DMI/1.23

Relative Forage Quality (RFQ)100 110 120 130 140 150 160
Qua
lity
Req
uire
d
Adapted from Undersander et al., 2011.
• Heifer, 18-24 mo.• Dry cow• Idle horse
• Brood mare• Working horse
• Heifer, 12-18 mo.• Lactating beef cow
• Nursing mare• Hard-working horse
• Dairy, last 200 days• Heifer, 3-12 mo.• Stocker cattle
• Dairy, 1st 120 days• Dairy calf

Typical Range in Quality of Common Forages

Cattleman’s MBA Forage Plan of Action - 2012
Soil Test pH - - Lime if Needed Evaluate per unit Costs and Revenue Evaluate Weed Control / Fertility
Options Clovers / Reseeding Options
Forage Utilization Stocking Rates / Controlled & Extended
Grazing

A Real Cowboy . . . Has NO FEAR!

www.georgiaforages.com
http://forages.tennessee.edu