Embed Size (px)
Citation preview

Making the Transition FromRecovery to ExpansionAUGUSTINE FAUCHER, DIRECTOR OF MACROECONOMICS
FROM MOODY’S ECONOMY.COM
2FROM MOODY’S ECONOMY.COM
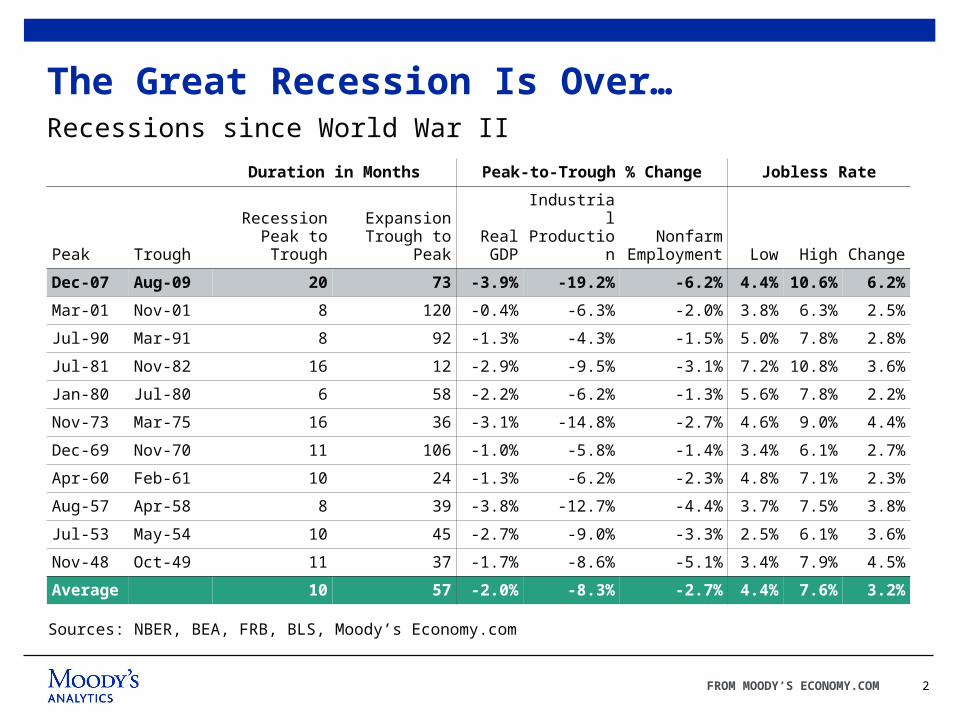
The Great Recession Is Over…Recessions since World War II
Sources: NBER, BEA, FRB, BLS, Moody’s Economy.com
Duration in Months Peak-to-Trough % Change Jobless Rate
Peak TroughRecession
Peak to TroughExpansion
Trough to PeakReal GDP
Industrial Production
Nonfarm Employment Low High Change
Dec-07 Aug-09 20 73 -3.9% -19.2% -6.2% 4.4% 10.6% 6.2%
Mar-01 Nov-01 8 120 -0.4% -6.3% -2.0% 3.8% 6.3% 2.5%
Jul-90 Mar-91 8 92 -1.3% -4.3% -1.5% 5.0% 7.8% 2.8%
Jul-81 Nov-82 16 12 -2.9% -9.5% -3.1% 7.2% 10.8% 3.6%
Jan-80 Jul-80 6 58 -2.2% -6.2% -1.3% 5.6% 7.8% 2.2%
Nov-73 Mar-75 16 36 -3.1% -14.8% -2.7% 4.6% 9.0% 4.4%
Dec-69 Nov-70 11 106 -1.0% -5.8% -1.4% 3.4% 6.1% 2.7%
Apr-60 Feb-61 10 24 -1.3% -6.2% -2.3% 4.8% 7.1% 2.3%
Aug-57 Apr-58 8 39 -3.8% -12.7% -4.4% 3.7% 7.5% 3.8%
Jul-53 May-54 10 45 -2.7% -9.0% -3.3% 2.5% 6.1% 3.6%
Nov-48 Oct-49 11 37 -1.7% -8.6% -5.1% 3.4% 7.9% 4.5%
Average 10 57 -2.0% -8.3% -2.7% 4.4% 7.6% 3.2%
3FROM MOODY’S ECONOMY.COM
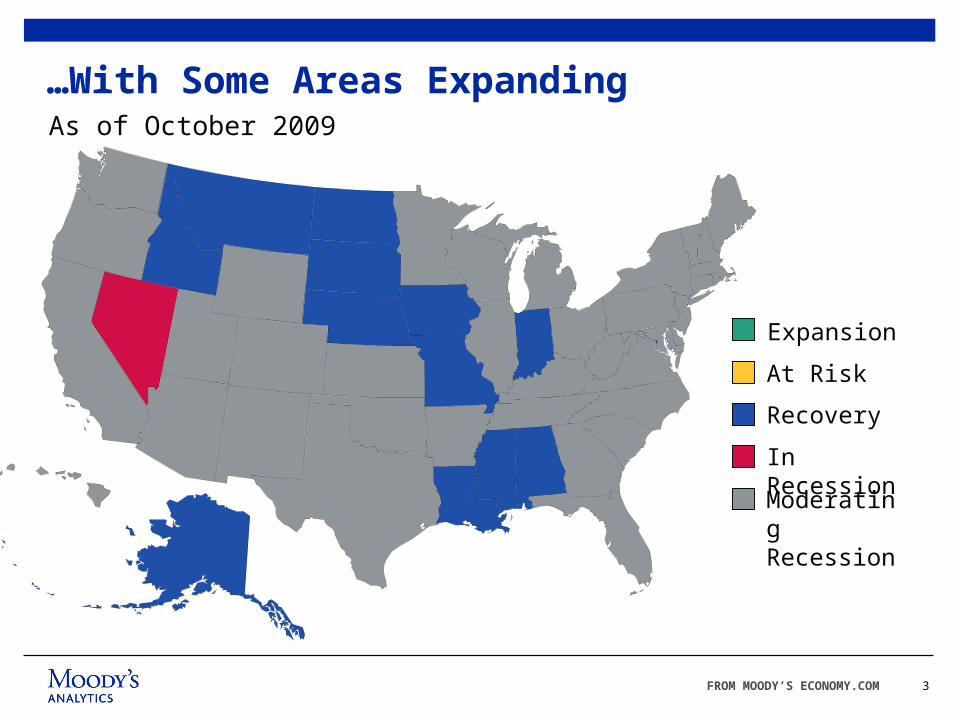
…With Some Areas ExpandingAs of October 2009
Expansion
At Risk
Recovery
In Recession
Moderating Recession
4FROM MOODY’S ECONOMY.COM
0.0
0.5
1.0
1.5
2.0
2.5
3.0
3.5
4.0
4.5
5.0
Jan-07 Jul-07 Jan-08 Jul-08 Jan-09 Jul-09
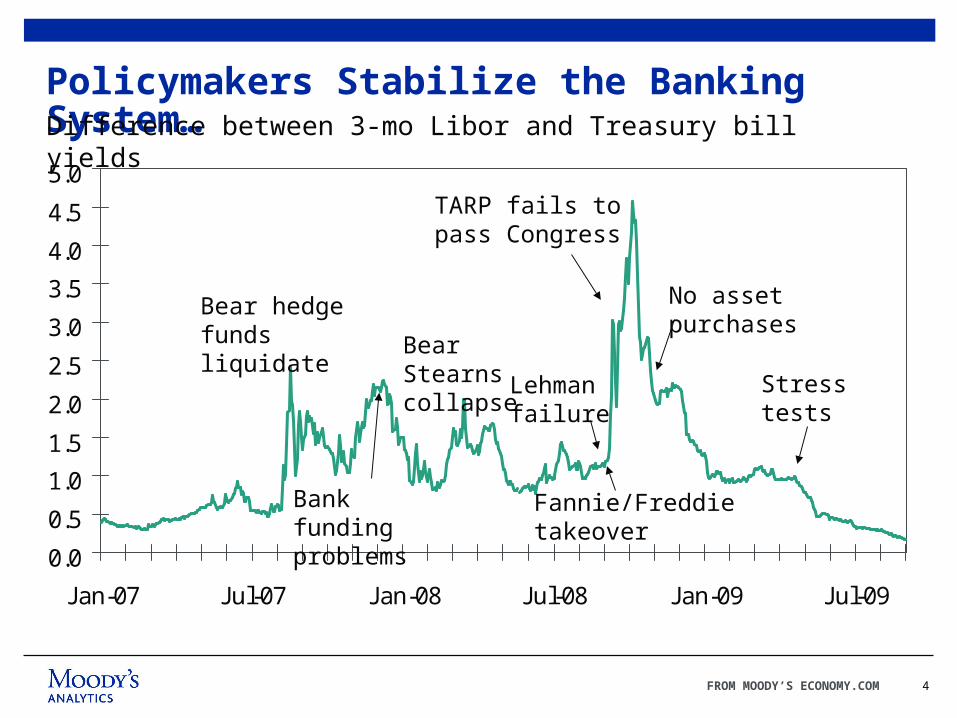
Policymakers Stabilize the Banking System…
Bear hedgefunds liquidate
Bank fundingproblems
Difference between 3-mo Libor and Treasury bill yields
Bear Stearnscollapse Lehman
failure
Fannie/Freddietakeover
TARP fails topass Congress
No assetpurchases
Stresstests
5FROM MOODY’S ECONOMY.COM
(1)
0
1
2
3
4
09Q1 09Q2 09Q3 09Q4 10Q1 10Q2 10Q3 10Q4
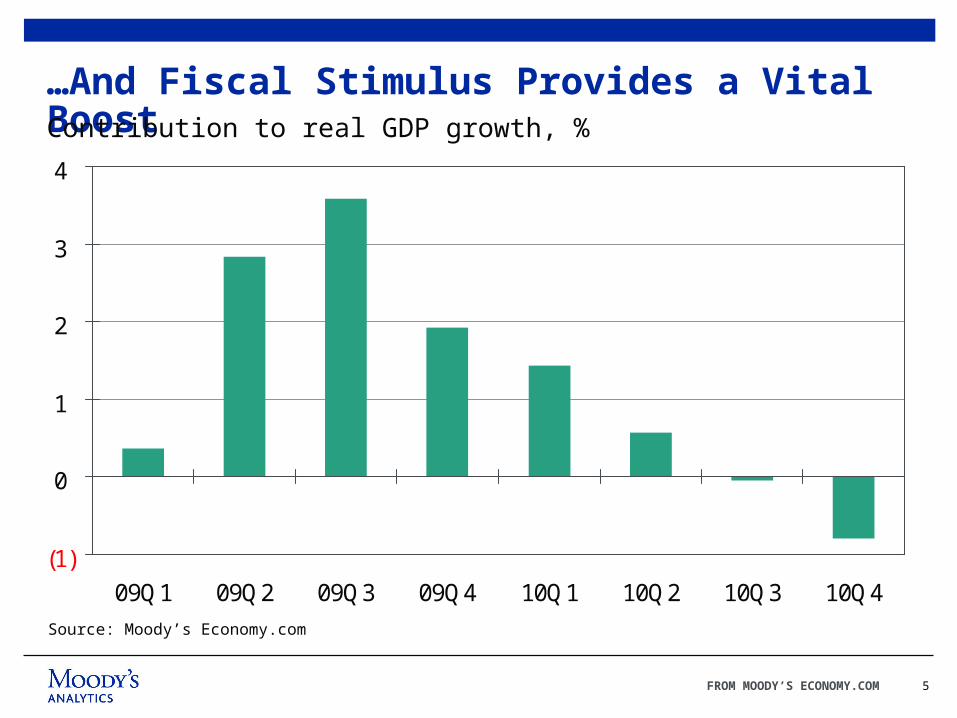
…And Fiscal Stimulus Provides a Vital Boost
Source: Moody’s Economy.com
Contribution to real GDP growth, %

6FROM MOODY’S ECONOMY.COM
5
6
7
8
9
92 94 96 98 00 02 04 06 08
Job Creation Craters…Rate of job creation and destruction, %
Job Creation
Source: BLS
Job Destruction

7FROM MOODY’S ECONOMY.COM
0
1
2
3
4
5
6
-3 -2 -1 0 1 2 3 4 5
Difference between actual and natural unemployment rate
Com
pens
atio
n gr
owth
Source: BLS
y = -0.48x + 3.40R2 = 0.32
2009Q3Unemployment rate=9.6%
Natural rate=5.4%Compensation growth=1.5%
…Threatening to Undermine Compensation…1985Q1-2009Q3
8FROM MOODY’S ECONOMY.COM
…But Fiscal Policymakers Are Responding
» Recently passed: $45 billion in more aid to unemployed workers, extension and expansion of homebuyer tax credit, extended higher conforming loans limits, and NOL.
» High odds of passage: $100 billion in aid for workers losing jobs in 2010.
» Better than even odds of passage: $50 billion in more SBA lending, job tax credit, weatherization program.
» Even odds of passage: $50 billion in another round of help to financially stressed state and local government for FMAP.
9FROM MOODY’S ECONOMY.COM
100
120
140
160
180
200
00 01 02 03 04 05 06 07 08 09 10 11 12
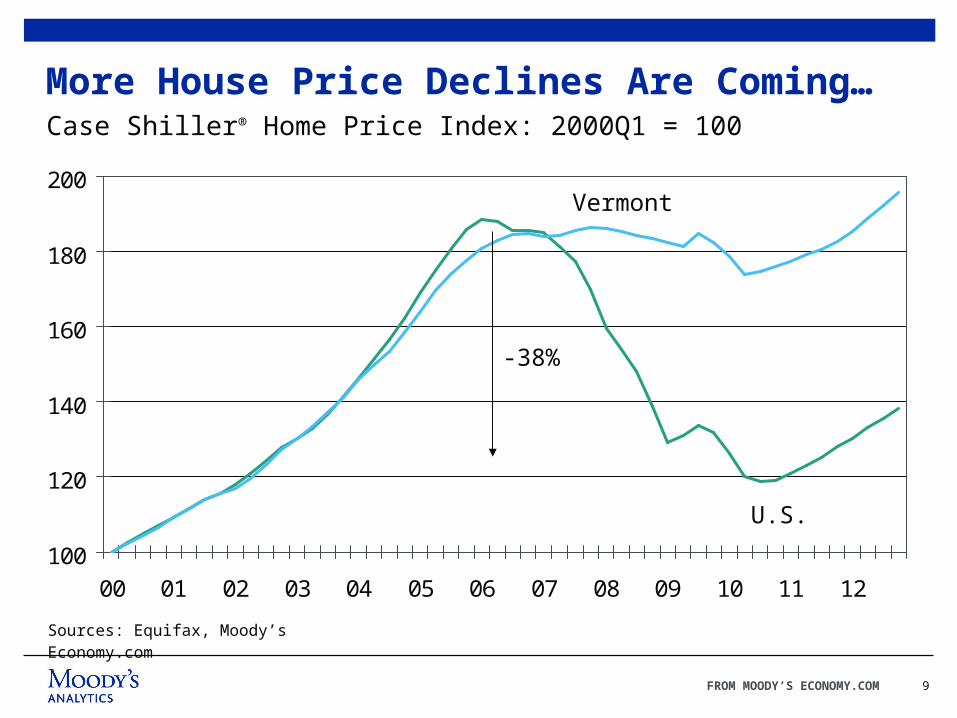
More House Price Declines Are Coming…
Case Shiller® Home Price Index: 2000Q1 = 100
Sources: Equifax, Moody’s Economy.com
-38%
U.S.
Vermont
10FROM MOODY’S ECONOMY.COM
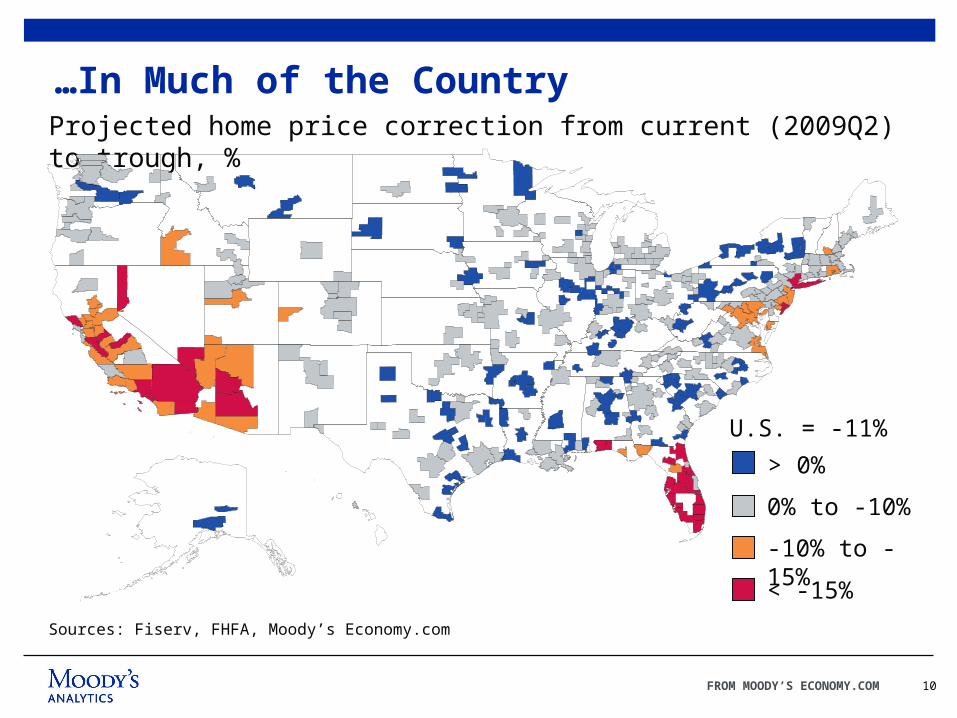
…In Much of the CountryProjected home price correction from current (2009Q2) to trough, %
Sources: Fiserv, FHFA, Moody’s Economy.com
> 0%
0% to -10%
-10% to -15%
< -15%
U.S. = -11%
11FROM MOODY’S ECONOMY.COM
0
5
10
15
20
25
30
35
40
45
50
05 06 07 08 09
-25
-20
-15
-10
-5
0
5
10
15
20
25
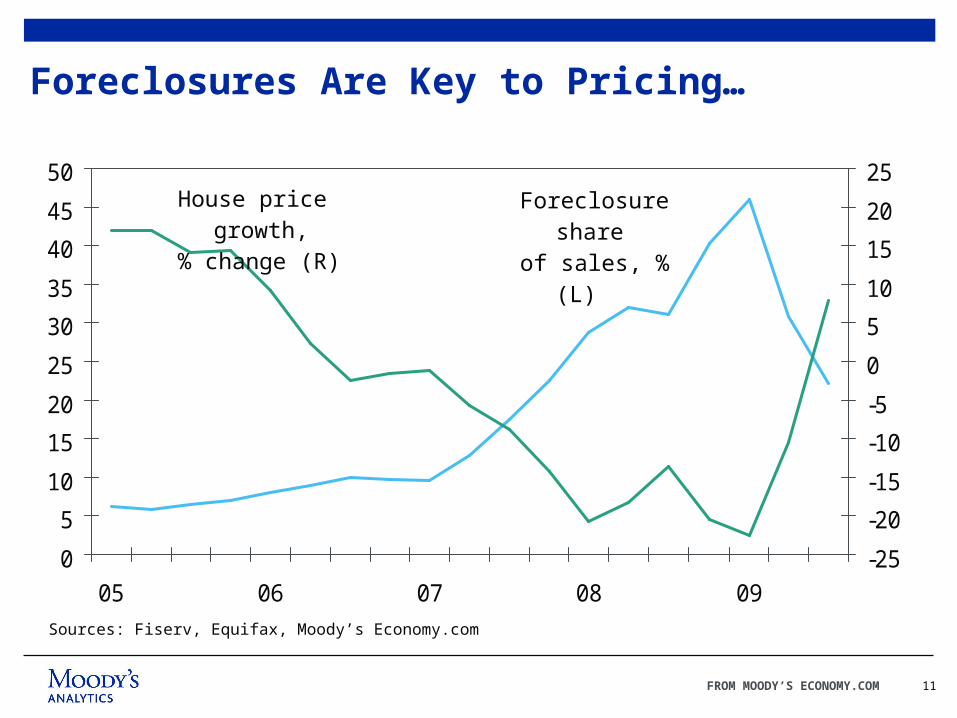
Foreclosures Are Key to Pricing…
Sources: Fiserv, Equifax, Moody’s Economy.com
House price growth, % change (R)
Foreclosure share
of sales, % (L)
12FROM MOODY’S ECONOMY.COM
0
500
1,000
1,500
2,000
2,500
3,000
3,500
4,000
4,500
05 06 07 08 09
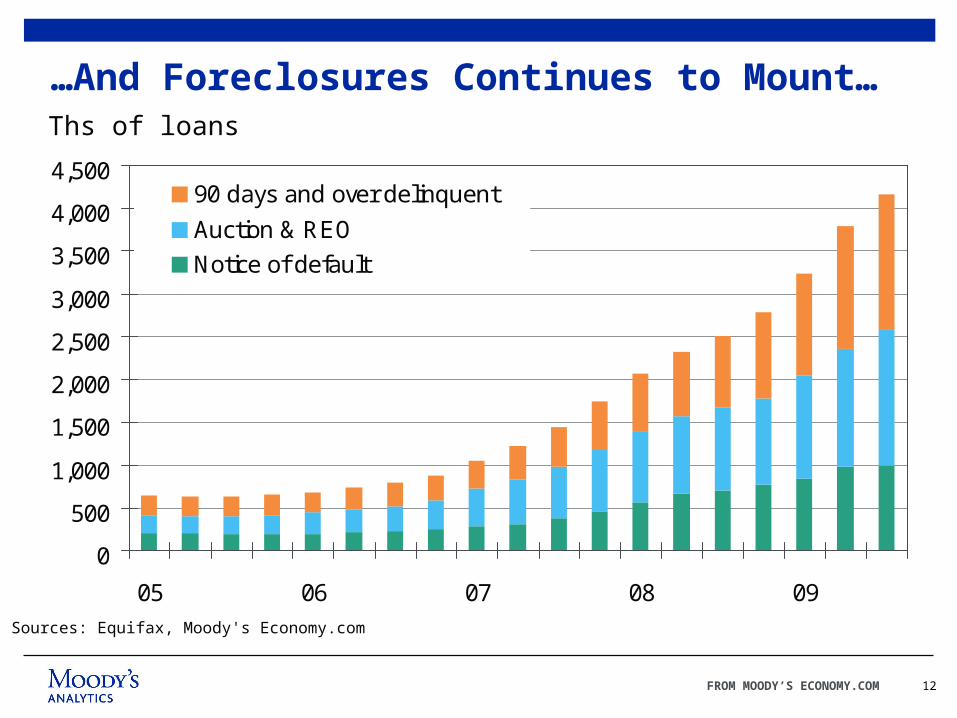
90 days and over delinquent
Auction & REO
Notice of default
Sources: Equifax, Moody's Economy.com
…And Foreclosures Continues to Mount…Ths of loans
13FROM MOODY’S ECONOMY.COM
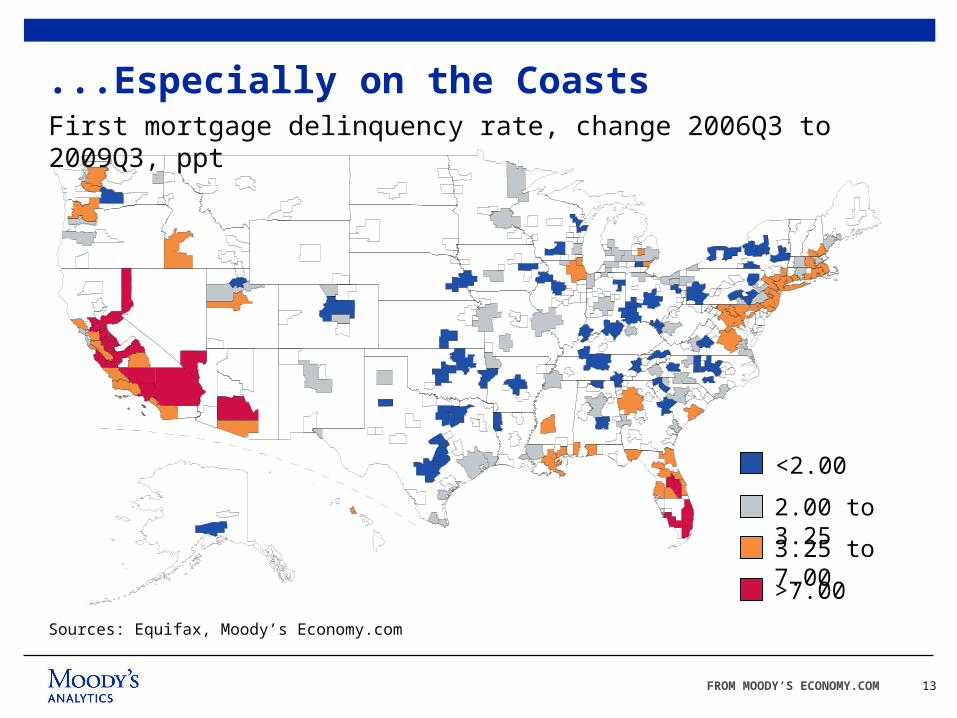
...Especially on the CoastsFirst mortgage delinquency rate, change 2006Q3 to 2009Q3, ppt
Sources: Equifax, Moody’s Economy.com
<2.00
2.00 to 3.25
3.25 to 7.00
>7.00
14FROM MOODY’S ECONOMY.COM
0
2,000
4,000
6,000
8,000
10,000
12,000
14,000
16,000
06 07 08 09
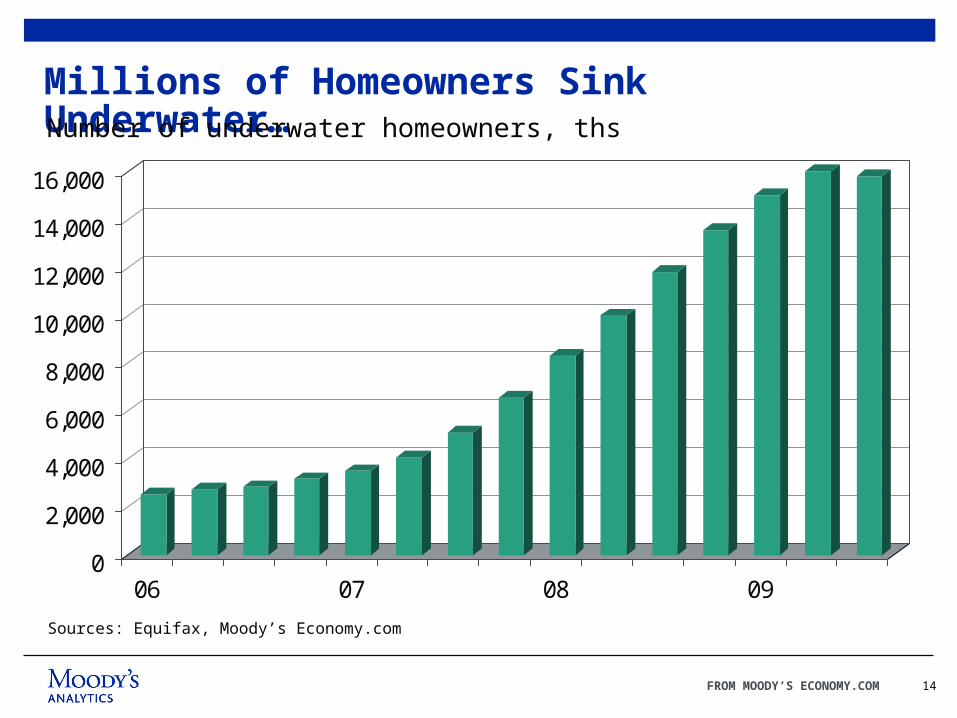
Millions of Homeowners Sink Underwater…Number of underwater homeowners, ths
Sources: Equifax, Moody’s Economy.com

15FROM MOODY’S ECONOMY.COM
2 3 4 5 6 7 8 9 10
< 6060-6565-7070-7575-8080-8585-9090-95
95-100100-105105-110110-115115-120
> 120
…And Strategic Defaults Are on the Rise90 Days and Over Delinquency Rate, % of #, by CLTV, 30-35% DTI
Sources: Equifax, Moody’s Economy.com
16FROM MOODY’S ECONOMY.COM
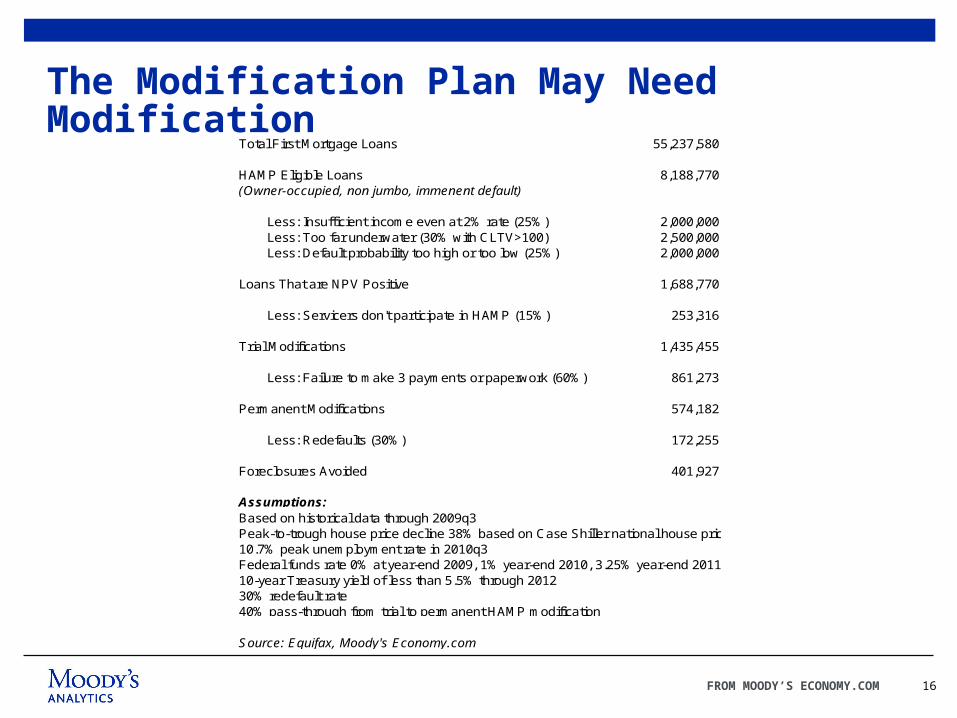
The Modification Plan May Need Modification
Total First Mortgage Loans 55,237,580
HAMP Eligible Loans 8,188,770(Owner-occupied, non jumbo, immenent default)
Less: Insufficient income even at 2% rate (25%) 2,000,000Less: Too far underwater (30% with CLTV>100) 2,500,000Less: Default probability too high or too low (25%) 2,000,000
Loans That are NPV Positive 1,688,770
Less: Servicers don't participate in HAMP (15%) 253,316
Trial Modifications 1,435,455
Less: Failure to make 3 payments or paperwork (60%) 861,273
Permanent Modifications 574,182
Less: Redefaults (30%) 172,255
Foreclosures Avoided 401,927
Assumptions:Based on historical data through 2009q3Peak-to-trough house price decline 38% based on Case Shiller national house price index; trough in 1010q310.7% peak unemployment rate in 2010q3Federal funds rate 0% at year-end 2009, 1% year-end 2010, 3.25% year-end 2011, 4.5% by year-end 201210-year Treasury yield of less than 5.5% through 201230% redefault rate40% pass-through from trial to permanent HAMP modification
Source: Equifax, Moody's Economy.com
17FROM MOODY’S ECONOMY.COM
0
500
1,000
1,500
2,000
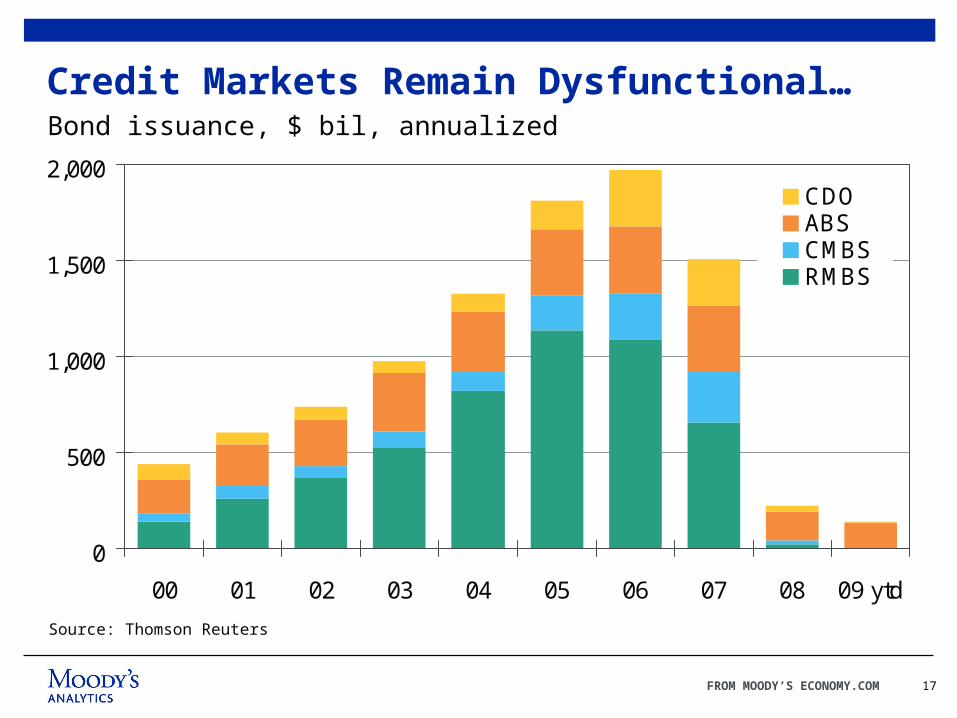
00 01 02 03 04 05 06 07 08 09 ytd
CDOABSCMBSRMBS
Credit Markets Remain Dysfunctional…Bond issuance, $ bil, annualized
Source: Thomson Reuters
18FROM MOODY’S ECONOMY.COM
-1
0
1
2
3
4
5
6
7
00 01 02 03 04 05 06 07 08 09
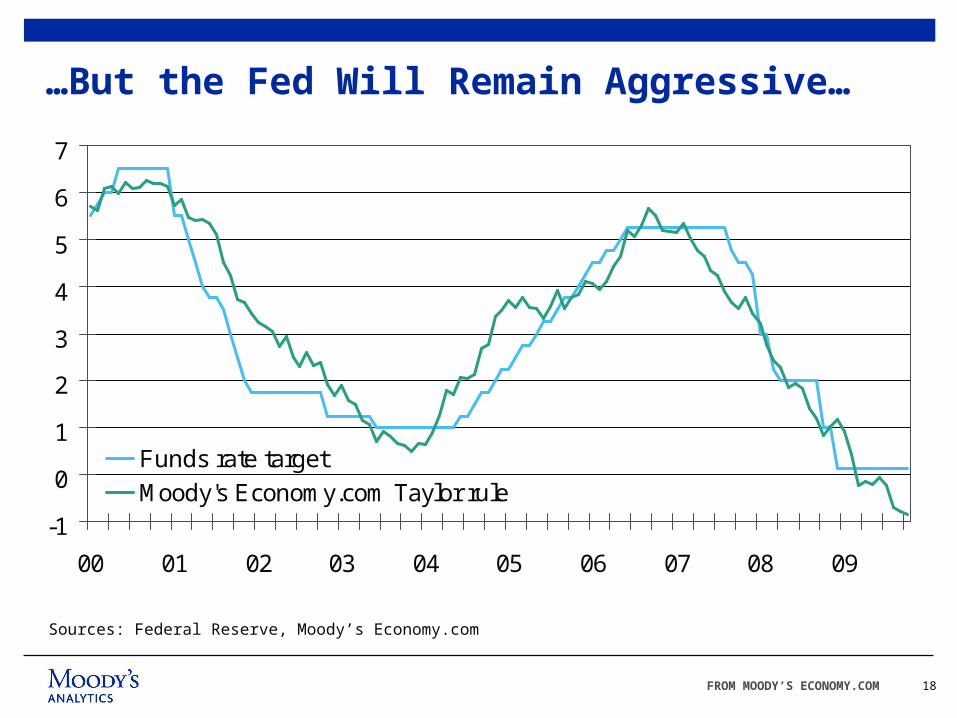
Funds rate target
Moody's Economy.com Taylor rule
…But the Fed Will Remain Aggressive…
Sources: Federal Reserve, Moody’s Economy.com
19FROM MOODY’S ECONOMY.COM
1.25
1.50
1.75
2.00
2.25
2.50
2.75
3.00
Jan-09 Apr-09 Jul-09 Oct-09
0
200
400
600
800
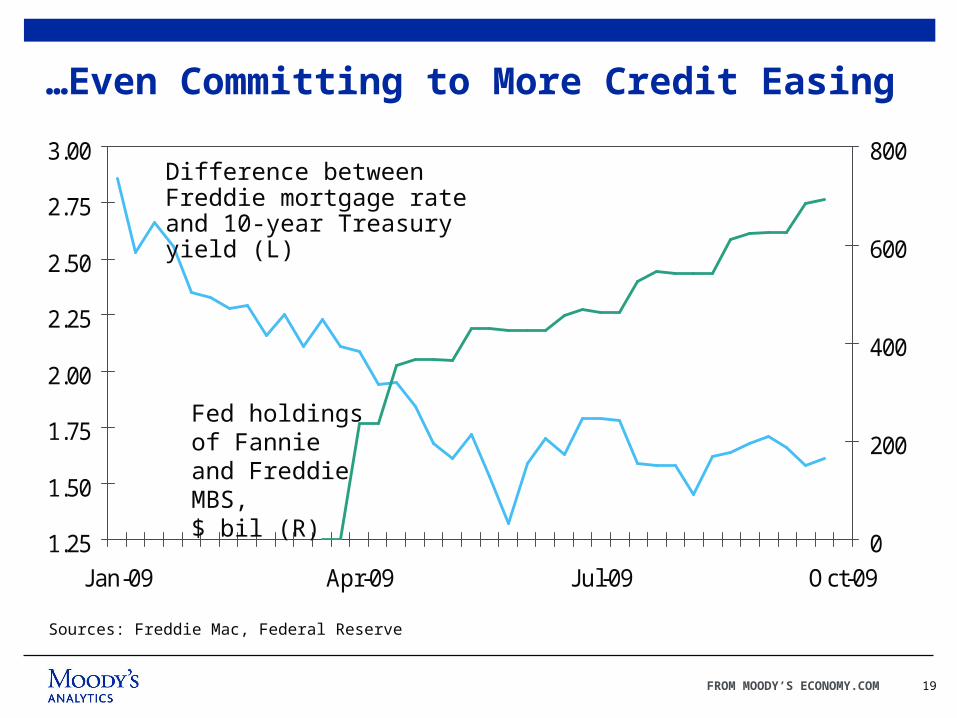
…Even Committing to More Credit Easing
Sources: Freddie Mac, Federal Reserve
Fed holdings of Fannie and Freddie MBS, $ bil (R)
Difference between Freddie mortgage rate and 10-year Treasury yield (L)
20FROM MOODY’S ECONOMY.COM
35
45
55
65
75
85
08 09 10 11 12 13 14 15 16 17 18 19
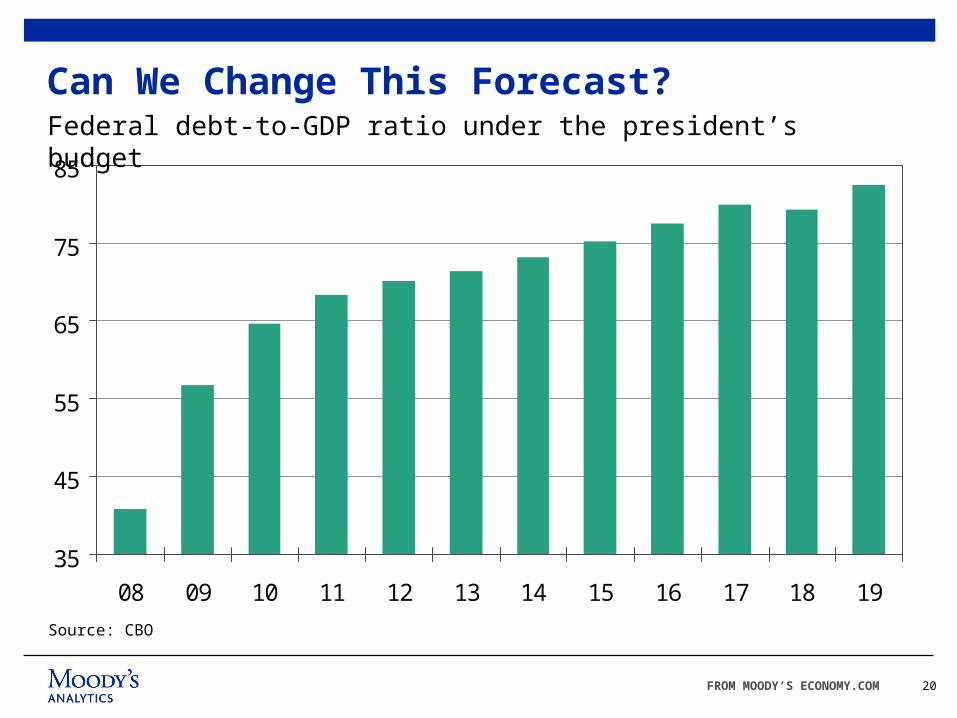
Can We Change This Forecast?Federal debt-to-GDP ratio under the president’s budget
Source: CBO
Improving Expanding
SlippingContracting
An
nu
aliz
ed
3 m
o.
% c
han
ge
o
n 3
mo
. M
A
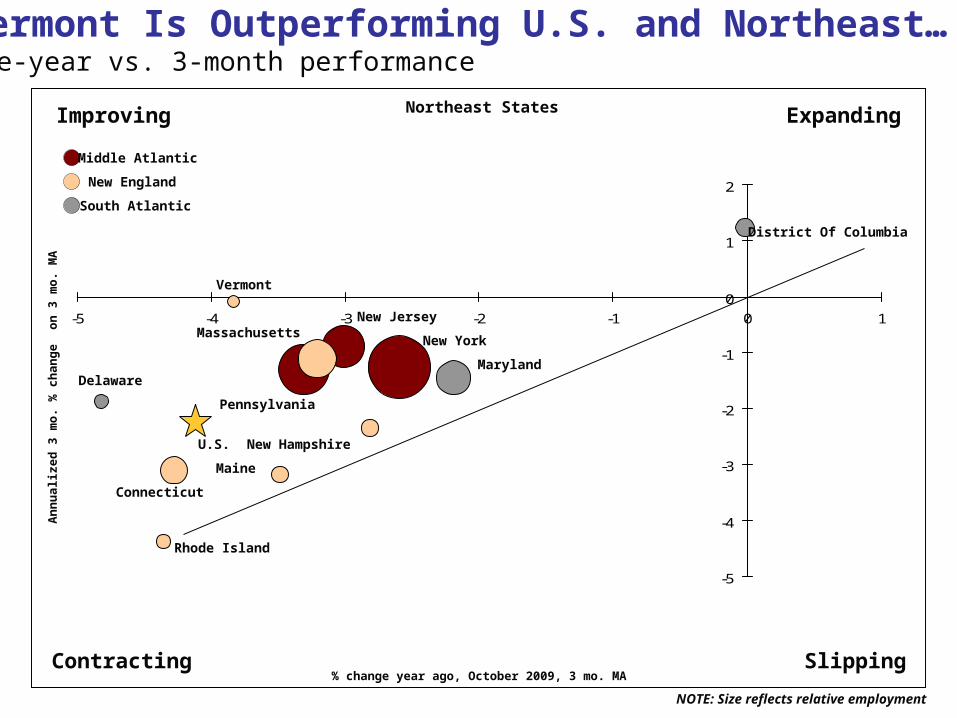
NOTE: Size reflects relative employment
% change year ago, October 2009, 3 mo. MA
Middle Atlantic
New England
South Atlantic
Vermont Is Outperforming U.S. and Northeast…One-year vs. 3-month performance
Northeast States
-5
-4
-3
-2
-1
0
1
2
-5 -4 -3 -2 -1 0 1
New York
Pennsylvania
New JerseyMassachusetts
Connecticut
New Hampshire
Maine
Rhode Island
Vermont
Maryland
District Of Columbia
Delaware
U.S.
22FROM MOODY’S ECONOMY.COM
-5
-4
-3
-2
-1
0
1
2
3
4
08 09 10 11 12
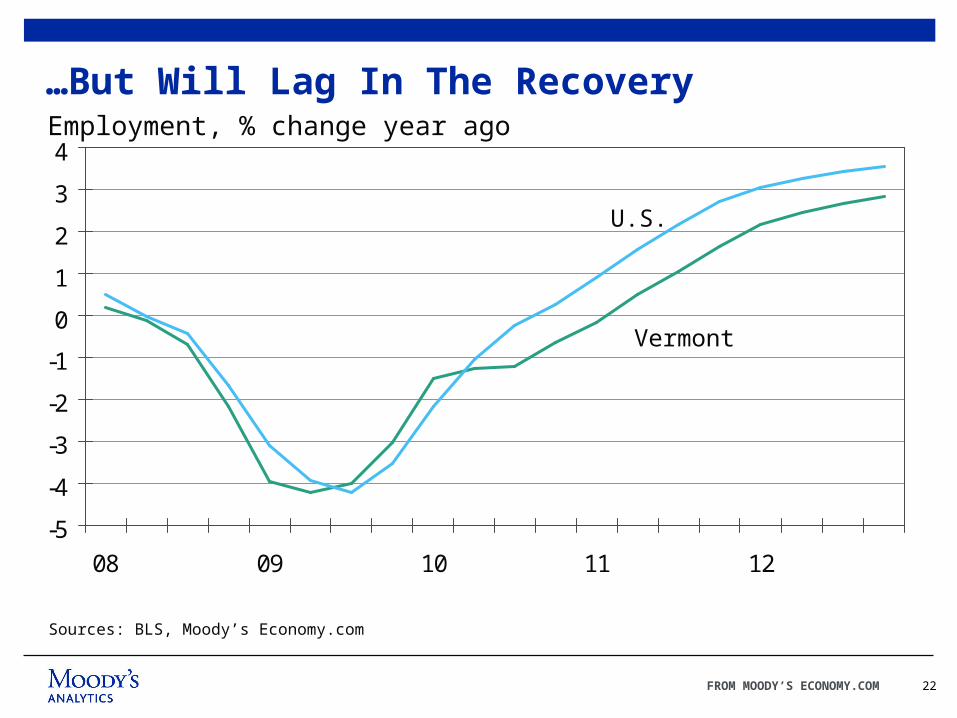
…But Will Lag In The Recovery
Sources: BLS, Moody’s Economy.com
Employment, % change year ago
U.S.
Vermont
23FROM MOODY’S ECONOMY.COM
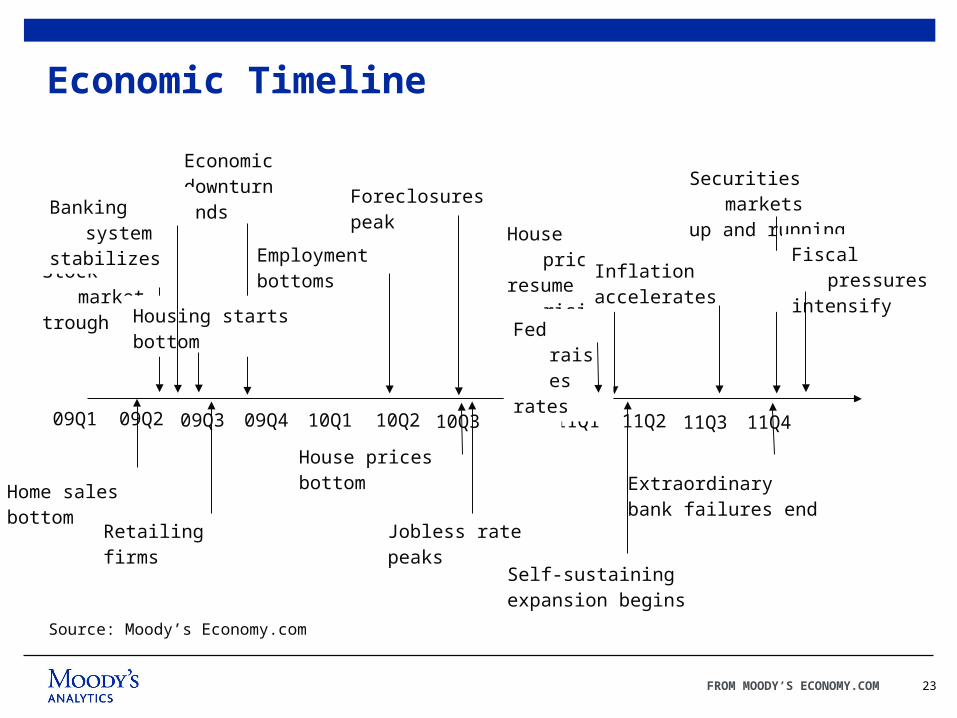
Economic Timeline
Source: Moody’s Economy.com
09Q1 09Q2 09Q3 09Q4 10Q1 10Q2 10Q4 11Q1 11Q2 11Q3 11Q4
Stock markettrough
Extraordinarybank failures end
Home salesbottom
Housing startsbottom
Employmentbottoms
House pricesbottom
Foreclosurespeak
Jobless ratepeaks
House pricesresume rising
Economicdownturnends
Self-sustainingexpansion begins
Banking systemstabilizes
Retailingfirms
10Q3
Securities marketsup and running
Fed raisesrates
Inflationaccelerates
Fiscal pressuresintensify

24FROM MOODY’S ECONOMY.COM
www.economy.com
25FROM MOODY’S ECONOMY.COM
© 2009 Moody’s Analytics, Inc. and/or its licensors and affiliates (collectively, “MOODY’S”). All rights reserved. ALL INFORMATION CONTAINED HEREIN IS PROTECTED BY COPYRIGHT LAW AND NONE OF SUCH INFORMATION MAY BE COPIED OR OTHERWISE REPRODUCED, REPACKAGED, FURTHER TRANSMITTED, TRANSFERRED, DISSEMINATED, REDISTRIBUTED OR RESOLD, OR STORED FOR SUBSEQUENT USE FOR ANY SUCH PURPOSE, IN WHOLE OR IN PART, IN ANY FORM OR MANNER OR BY ANY MEANS WHATSOEVER, BY ANY PERSON WITHOUT MOODY’S PRIOR WRITTEN CONSENT. All information contained herein is obtained by MOODY’S from sources believed by it to be accurate and reliable. Because of the possibility of human or mechanical error as well as other factors, however, all information contained herein is provided “AS IS” without warranty of any kind. Under no circumstances shall MOODY’S have any liability to any person or entity for (a) any loss or damage in whole or in part caused by, resulting from, or relating to, any error (negligent or otherwise) or other circumstance or contingency within or outside the control of MOODY’S or any of its directors, officers, employees or agents in connection with the procurement, collection, compilation, analysis, interpretation, communication, publication or delivery of any such information, or (b) any direct, indirect, special, consequential, compensatory or incidental damages whatsoever (including without limitation, lost profits), even if MOODY’S is advised in advance of the possibility of such damages, resulting from the use of or inability to use, any such information. The ratings, financial reporting analysis, projections, and other observations, if any, constituting part of the information contained herein are, and must be construed solely as, statements of opinion and not statements of fact or recommendations to purchase, sell or hold any securities. NO WARRANTY, EXPRESS OR IMPLIED, AS TO THE ACCURACY, TIMELINESS, COMPLETENESS, MERCHANTABILITY OR FITNESS FOR ANY PARTICULAR PURPOSE OF ANY SUCH RATING OR OTHER OPINION OR INFORMATION IS GIVEN OR MADE BY MOODY’S IN ANY FORM OR MANNER WHATSOEVER. Each rating or other opinion must be weighed solely as one factor in any investment decision made by or on behalf of any user of the information contained herein, and each such user must accordingly make its own study and evaluation of each security and of each issuer and guarantor of, and each provider of credit support for, each security that it may consider purchasing, holding, or selling.


![Index [genealogiestemarie.ca] de décès/Marie dfts... · 2018. 4. 26. · Faucher, Gérard 03/04/2016 Faucher, Madeleine 25/02/2016 Faucher, Noëlla 06/05/2016 Faucher, Yolande 10/04/2016](https://img.pdfslide.net/doc/110x75/5ff505a3753e9e028708a834/index-de-dcsmarie-dfts-2018-4-26-faucher-grard-03042016.jpg)