Embed Size (px)
Citation preview

Making the Web equal ProfitMaking the Web equal ProfitSurfing for GeneticsSurfing for Genetics
Dorian Garrick & Mark EnnsDorian Garrick & Mark Enns
Department of Animal SciencesDepartment of Animal Sciences
Colorado State UniversityColorado State University

Surfing for GeneticsSurfing for Genetics
• Surfing for Convenience
• Surfing to Support Decisions based on your own Customized Computations
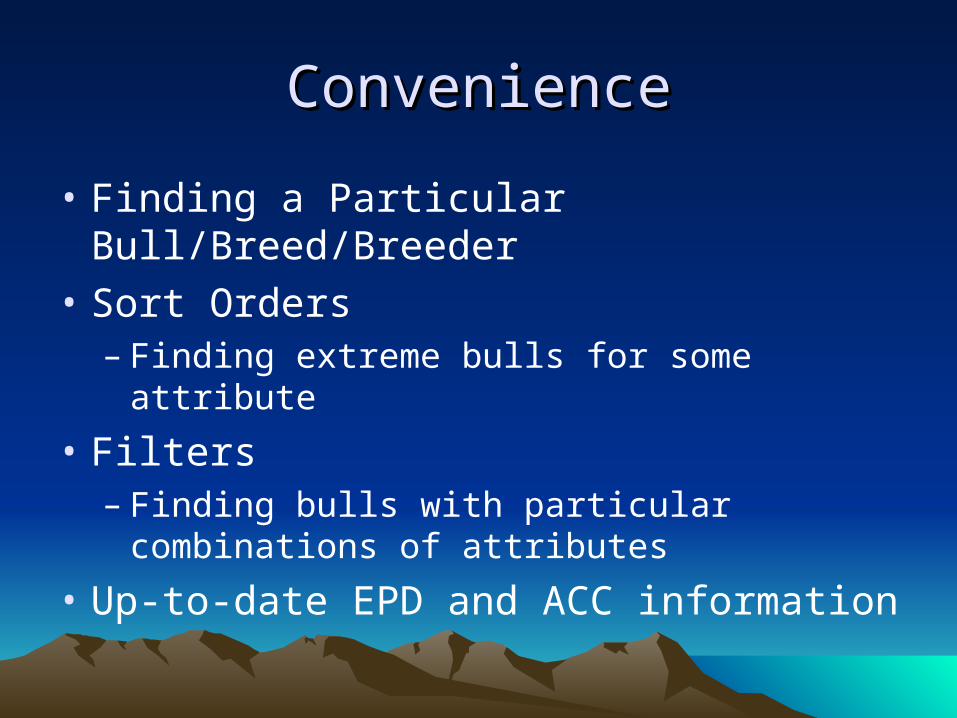
ConvenienceConvenience
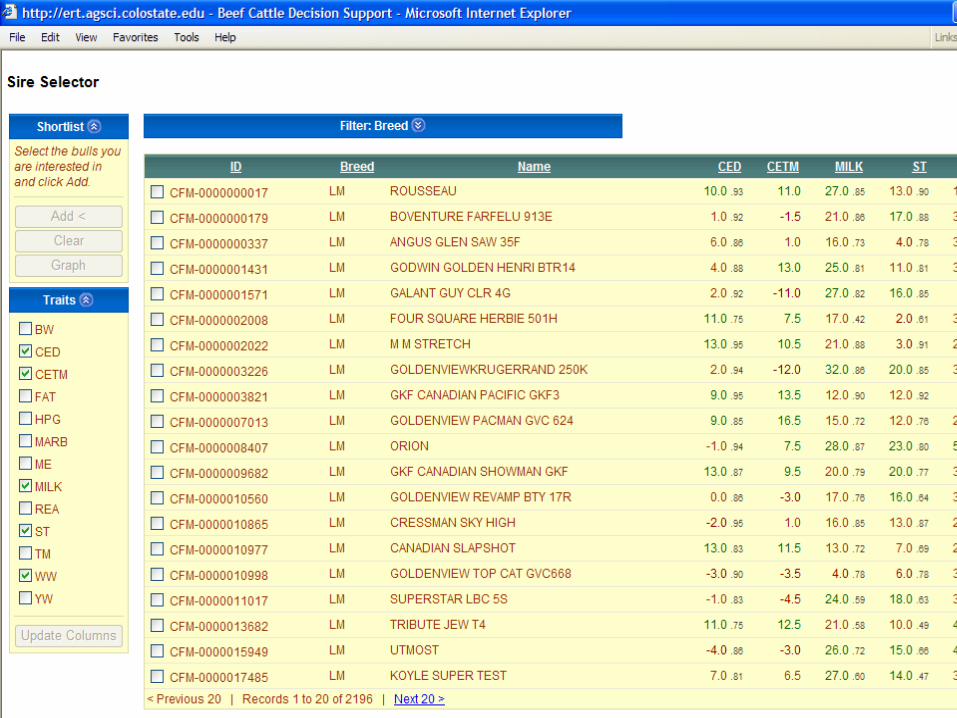
• Finding a Particular Bull/Breed/Breeder
• Sort Orders– Finding extreme bulls for some attribute
• Filters– Finding bulls with particular combinations of
attributes
• Up-to-date EPD and ACC information

Customized ComputationsCustomized Computations
• Interpretation of Threshold Traits
• Interactions between ERTs
• Assessment of Nutritional Implications
• Assessment of Financial Implications– Perhaps also Economic Implications
• Accounting for Risk
• Multibreed Evaluation & Crossbreeding
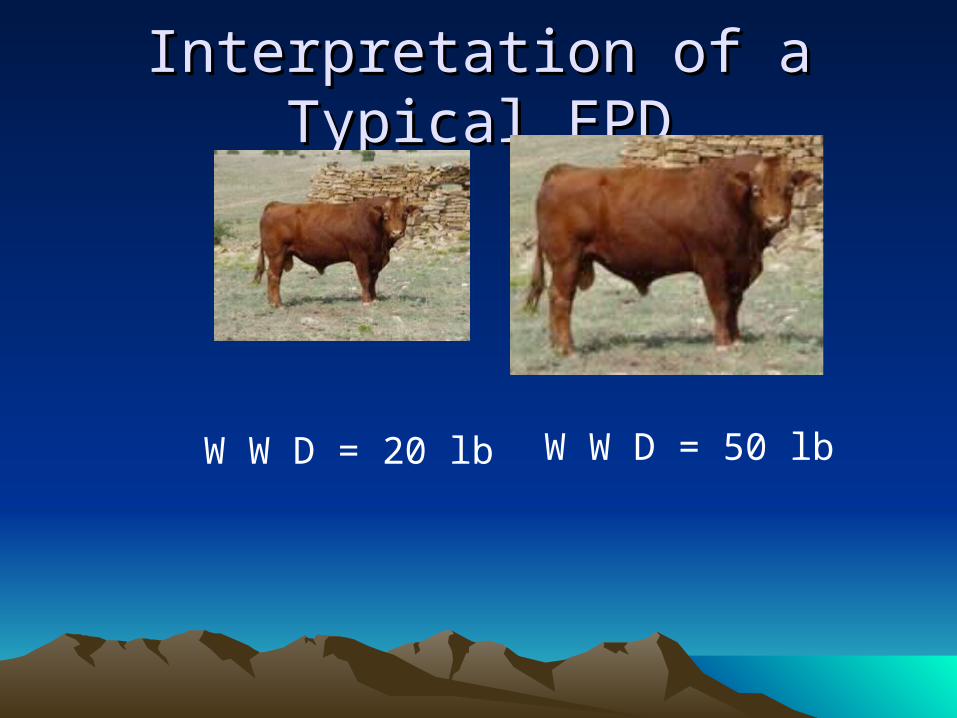
Interpretation of a Typical EPDInterpretation of a Typical EPD
W W D = 20 lb W W D = 50 lb
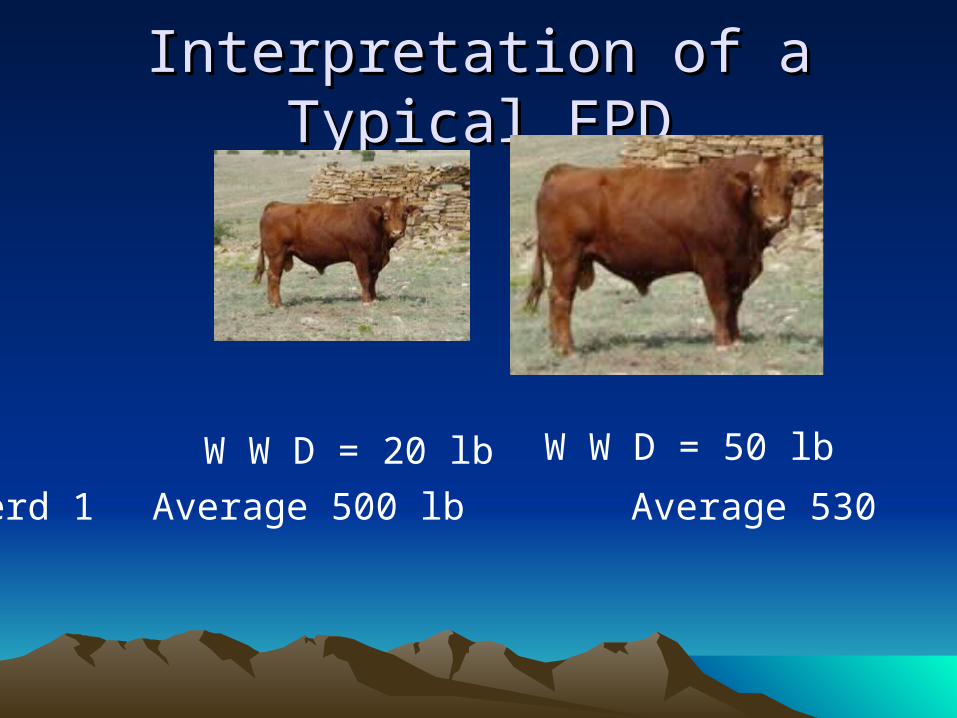
Interpretation of a Typical EPDInterpretation of a Typical EPD
W W D = 20 lb W W D = 50 lb
Herd 1 Average 500 lb Average 530

Interpretation of a Typical EPDInterpretation of a Typical EPD
W W D = 20 lb W W D = 50 lb
Herd 1 Average 500 lb Average 530Herd 2 Average 550 lb Average 580

Interpretation of Threshold TraitsInterpretation of Threshold Traits
• Calving Ease EPD
• Stayability EDP
• Heifer Pregnancy EPD

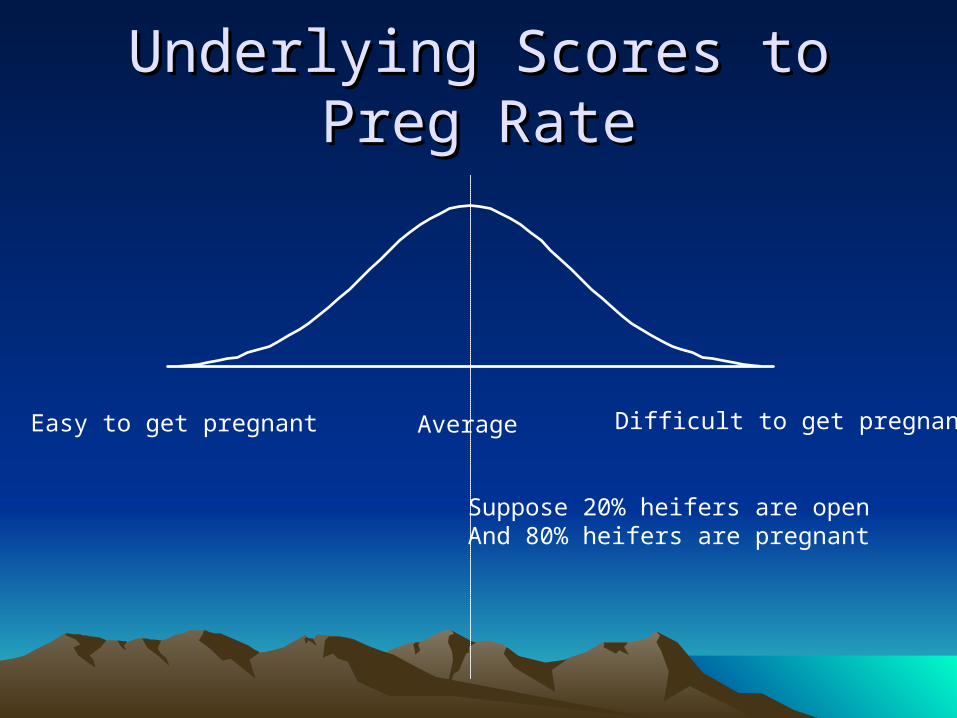
Underlying Scores to Preg RateUnderlying Scores to Preg Rate
Easy to get pregnant Difficult to get pregnantAverage
Underlying Scores to Preg RateUnderlying Scores to Preg Rate
Easy to get pregnant Difficult to get pregnantAverage
Suppose 20% heifers are openAnd 80% heifers are pregnant
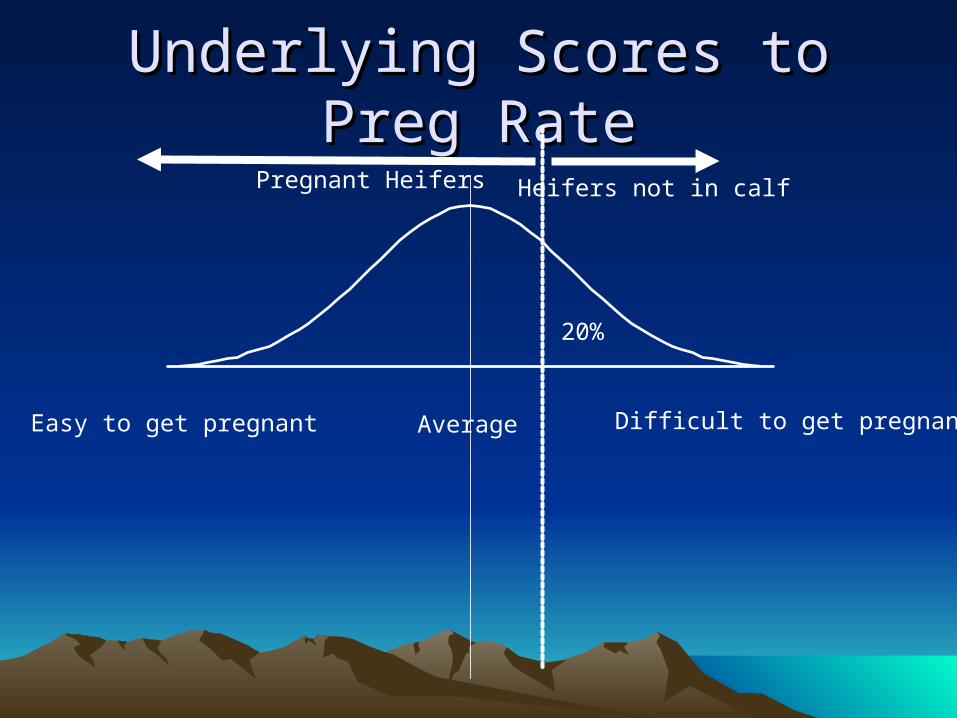
Underlying Scores to Preg RateUnderlying Scores to Preg Rate
20%
Heifers not in calfPregnant Heifers
Easy to get pregnant Difficult to get pregnantAverage
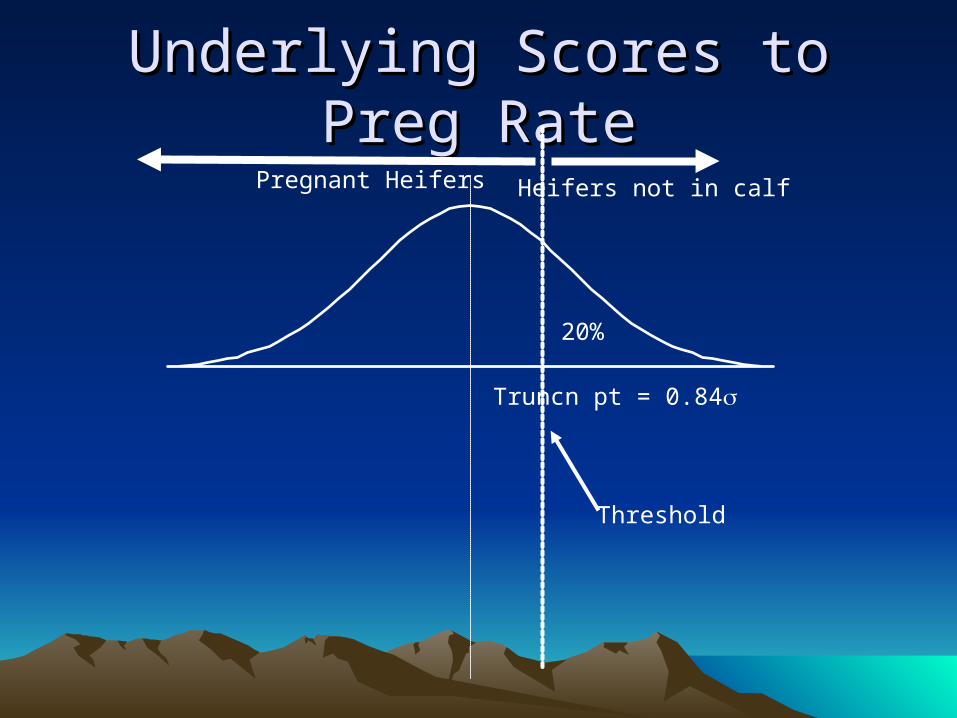
Underlying Scores to Preg RateUnderlying Scores to Preg Rate
20%
Truncn pt = 0.84
Heifers not in calfPregnant Heifers
Threshold
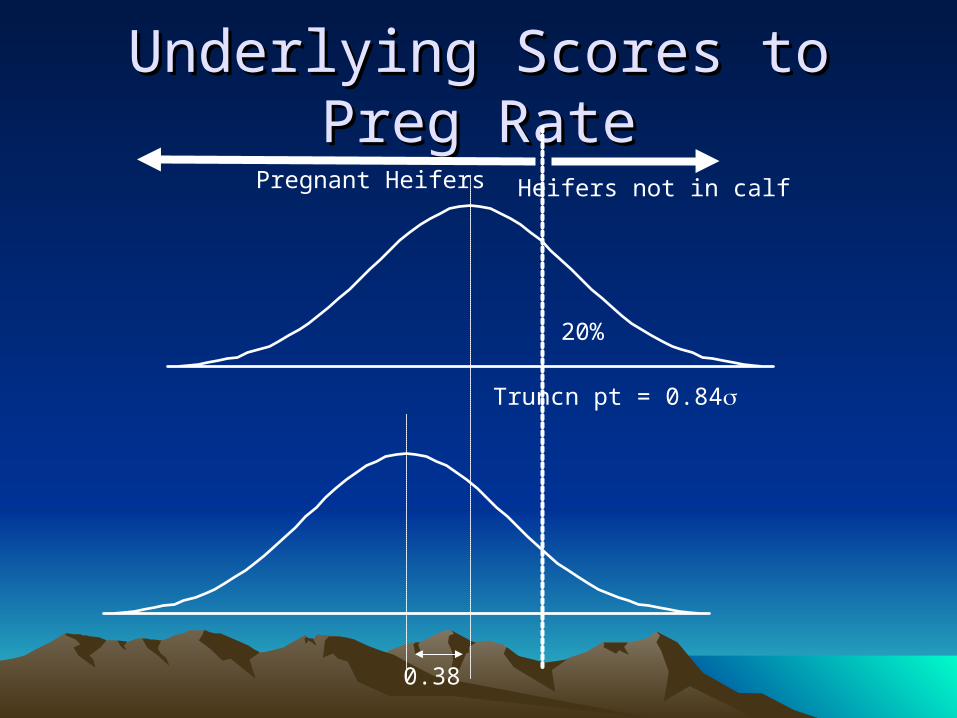
Underlying Scores to Preg RateUnderlying Scores to Preg Rate
0.38
20%
Truncn pt = 0.84
Heifers not in calfPregnant Heifers
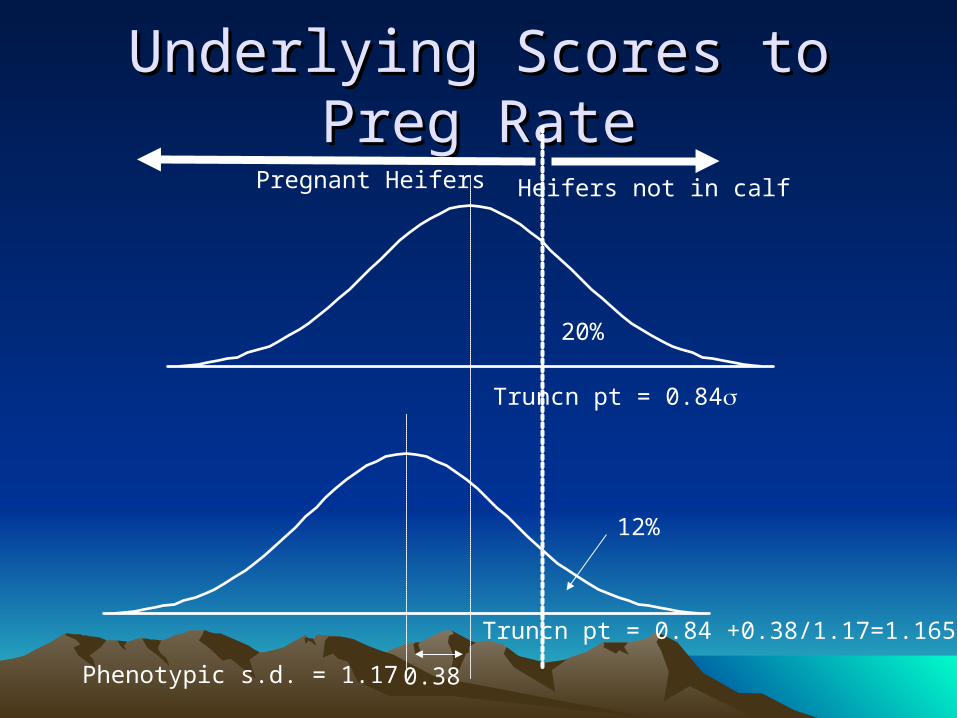
Underlying Scores to Preg RateUnderlying Scores to Preg Rate
0.38Phenotypic s.d. = 1.17
20%
Truncn pt = 0.84
Truncn pt = 0.84 +0.38/1.17=1.165
12%
Heifers not in calfPregnant Heifers
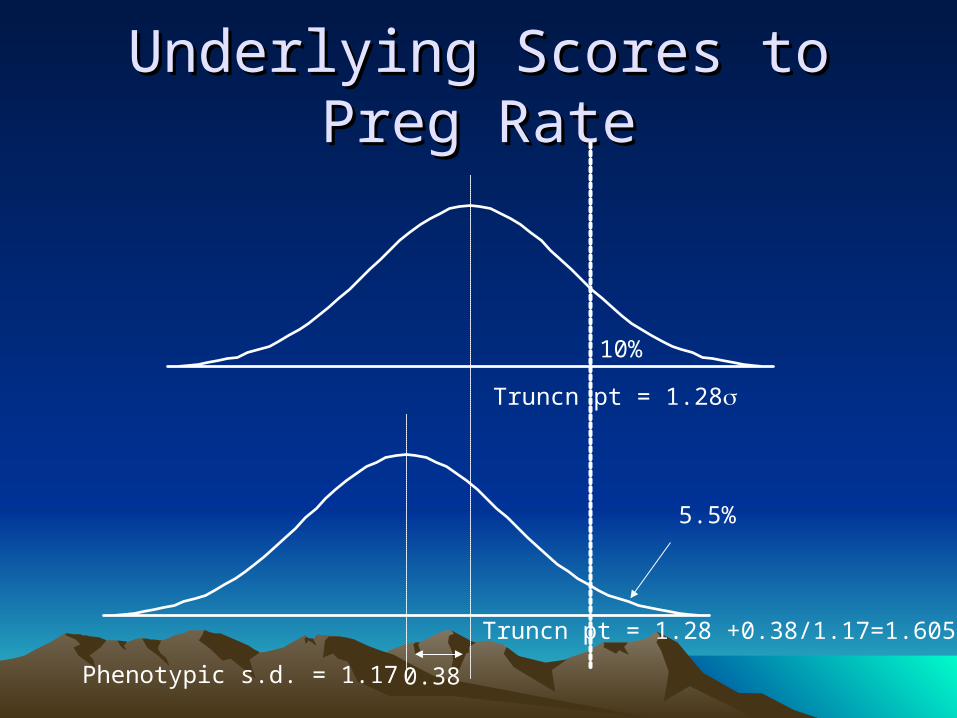
Underlying Scores to Preg RateUnderlying Scores to Preg Rate
0.38Phenotypic s.d. = 1.17
10%
Truncn pt = 1.28
Truncn pt = 1.28 +0.38/1.17=1.605
5.5%
Sensitive to the AverageSensitive to the Average
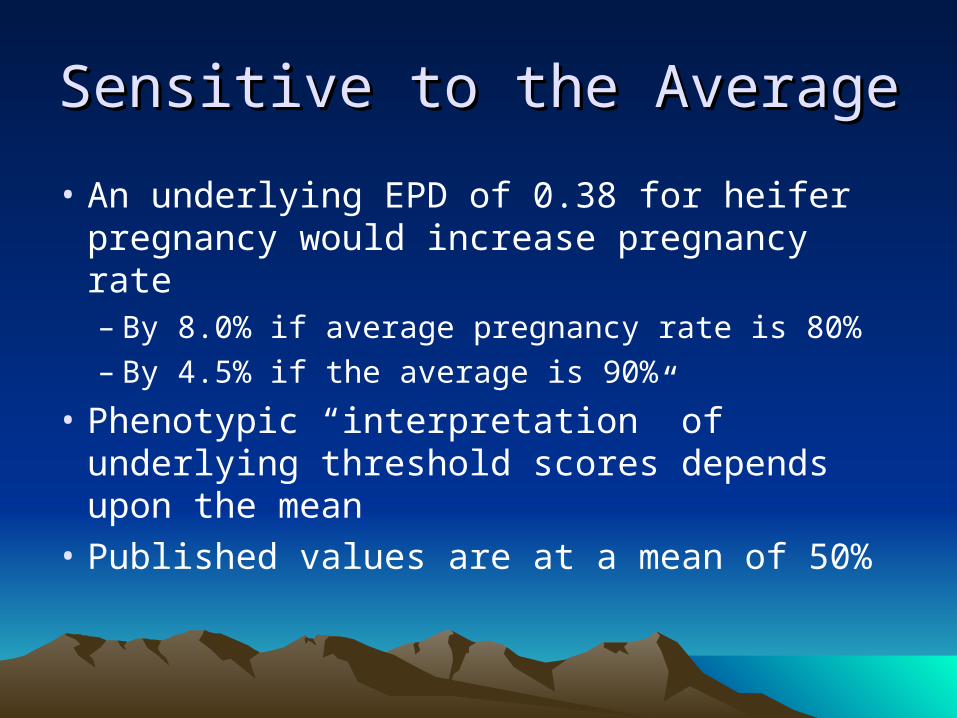
• An underlying EPD of 0.38 for heifer pregnancy would increase pregnancy rate– By 8.0% if average pregnancy rate is 80%– By 4.5% if the average is 90%
• Phenotypic “interpretation” of underlying threshold scores depends upon the mean
• Published values are at a mean of 50%
SolutionSolution
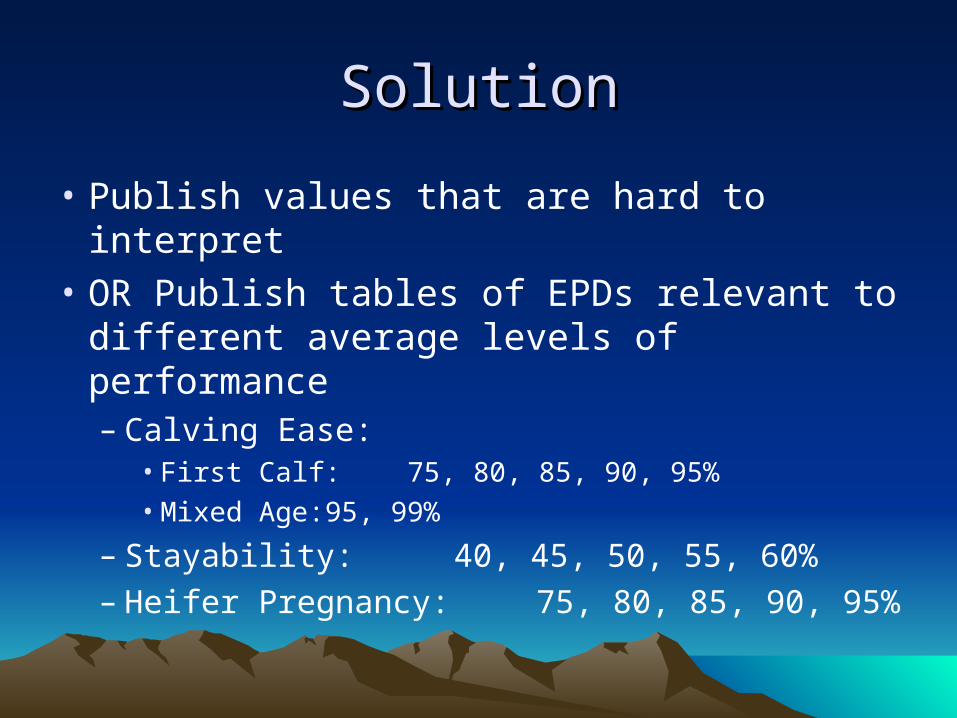
• Publish values that are hard to interpret
• OR Publish tables of EPDs relevant to different average levels of performance– Calving Ease:
• First Calf: 75, 80, 85, 90, 95%• Mixed Age: 95, 99%
– Stayability: 40, 45, 50, 55, 60%– Heifer Pregnancy: 75, 80, 85, 90, 95%
Solutions (cont)Solutions (cont)
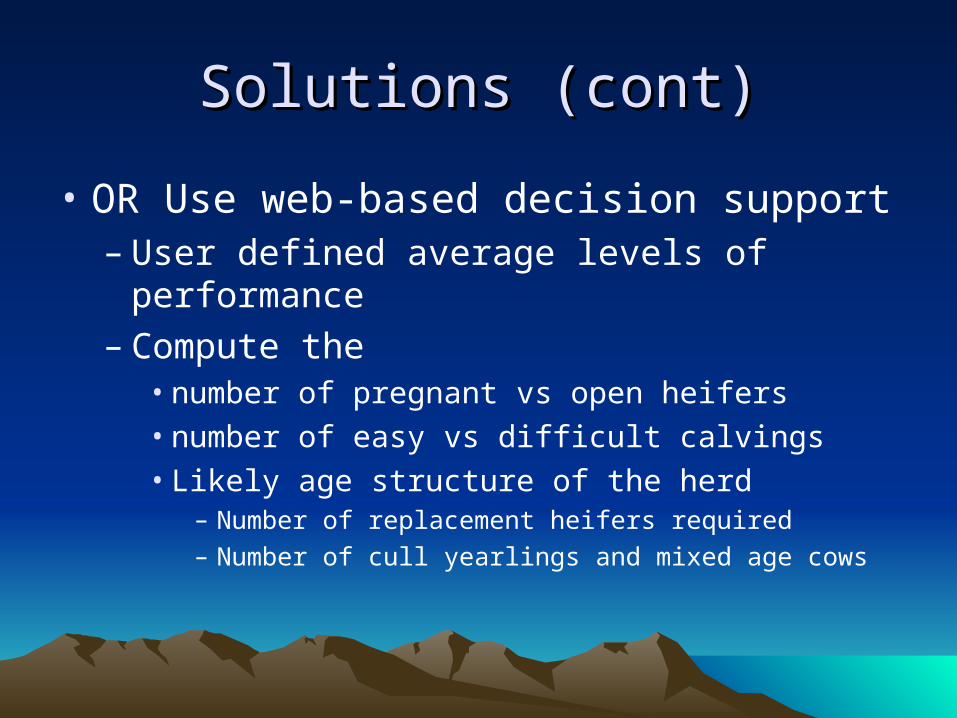
• OR Use web-based decision support– User defined average levels of performance– Compute the
• number of pregnant vs open heifers• number of easy vs difficult calvings• Likely age structure of the herd
– Number of replacement heifers required– Number of cull yearlings and mixed age cows
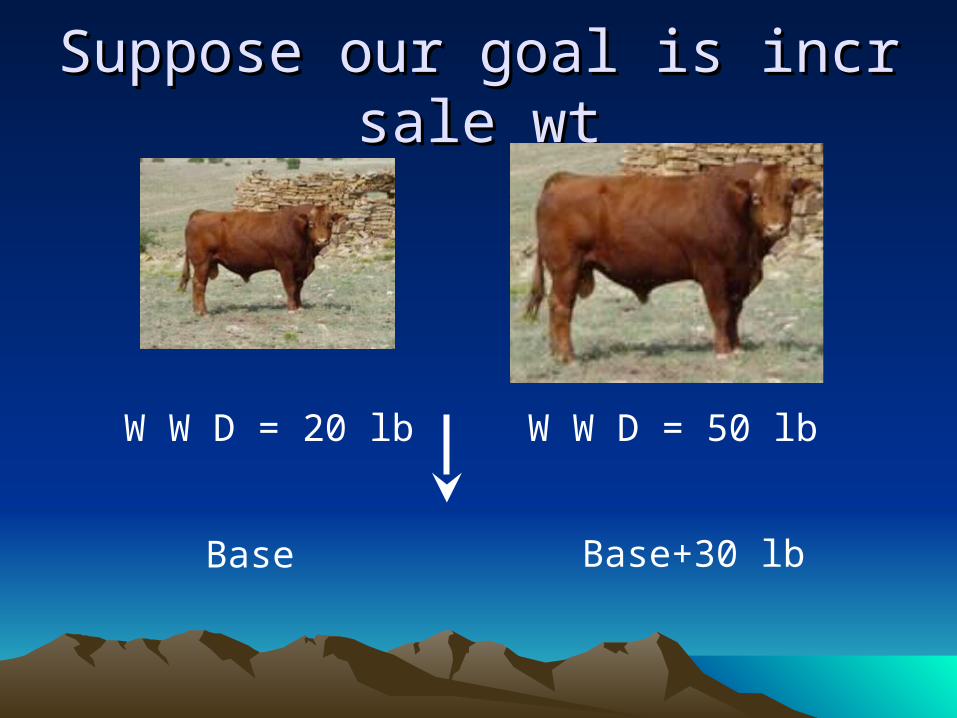
Suppose our goal is incr sale wtSuppose our goal is incr sale wt
W W D = 20 lb W W D = 50 lb
Base Base+30 lb
Interactions between ERTsInteractions between ERTs
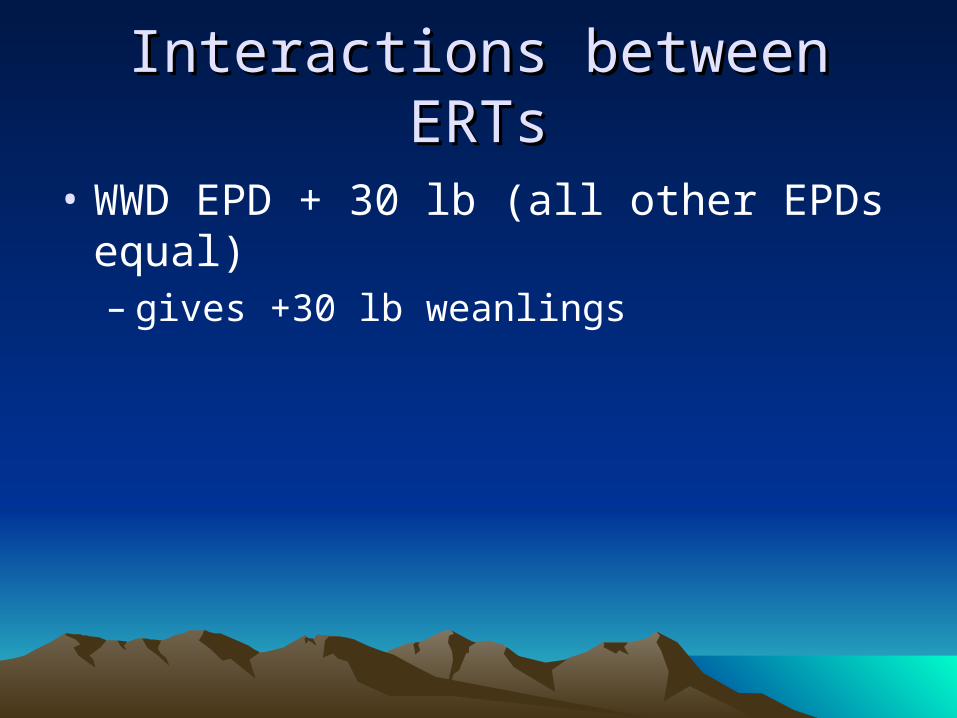
• WWD EPD + 30 lb (all other EPDs equal)– gives +30 lb weanlings
Interactions between ERTsInteractions between ERTs
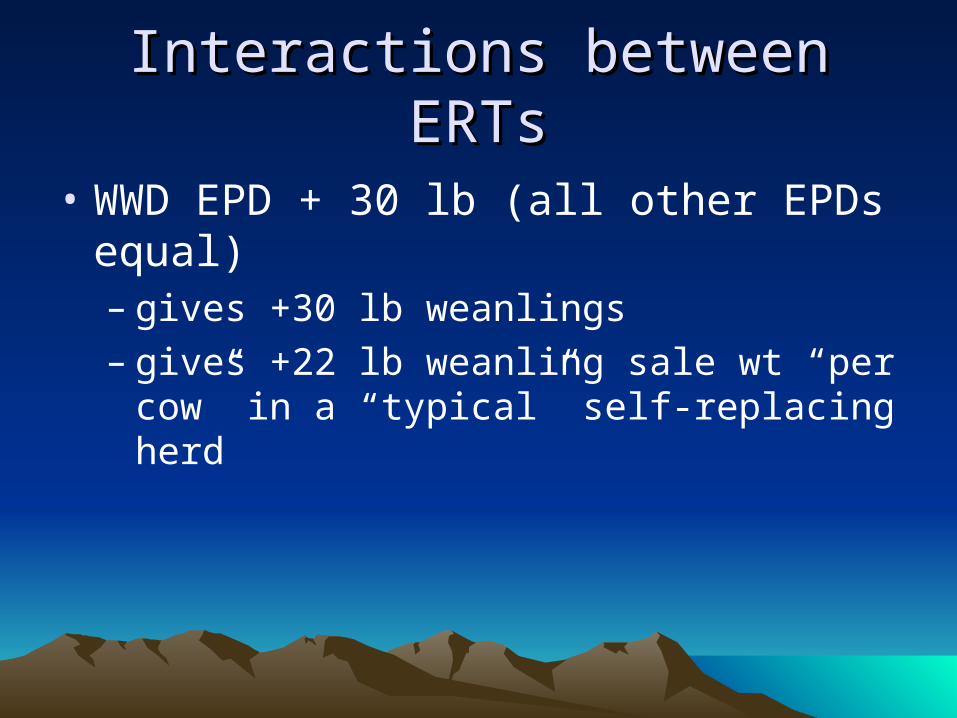
• WWD EPD + 30 lb (all other EPDs equal)– gives +30 lb weanlings– gives +22 lb weanling sale wt “per cow” in a
“typical” self-replacing herd

Interactions between ERTsInteractions between ERTs
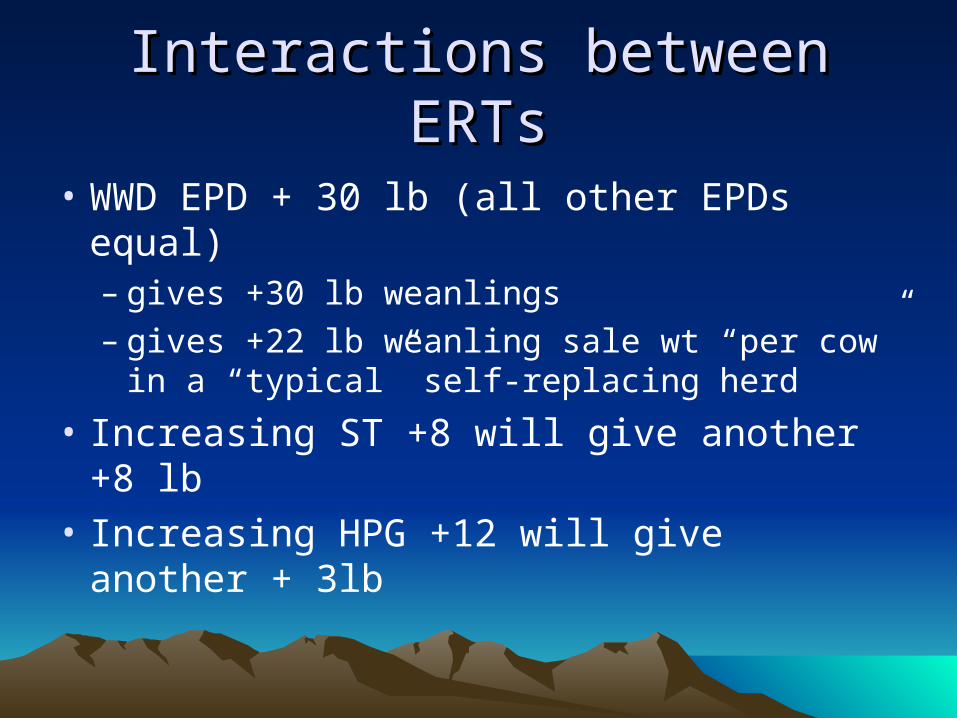
• WWD EPD + 30 lb (all other EPDs equal)– gives +30 lb weanlings– gives +22 lb weanling sale wt “per cow” in a
“typical” self-replacing herd
• Increasing ST +8 will give another +8 lb
Interactions between ERTsInteractions between ERTs
• WWD EPD + 30 lb (all other EPDs equal)– gives +30 lb weanlings– gives +22 lb weanling sale wt “per cow” in a
“typical” self-replacing herd
• Increasing ST +8 will give another +8 lb
• Increasing HPG +12 will give another + 3lb
Interactions between ERTsInteractions between ERTs
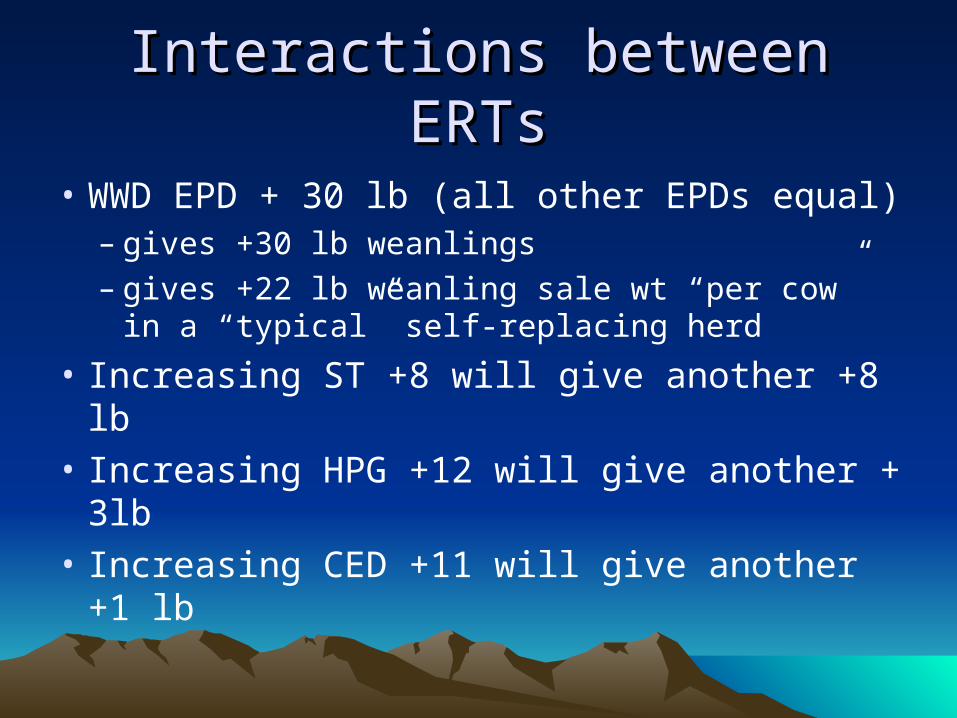
• WWD EPD + 30 lb (all other EPDs equal)– gives +30 lb weanlings– gives +22 lb weanling sale wt “per cow” in a
“typical” self-replacing herd
• Increasing ST +8 will give another +8 lb
• Increasing HPG +12 will give another + 3lb
• Increasing CED +11 will give another +1 lb
Interactions between ERTsInteractions between ERTs
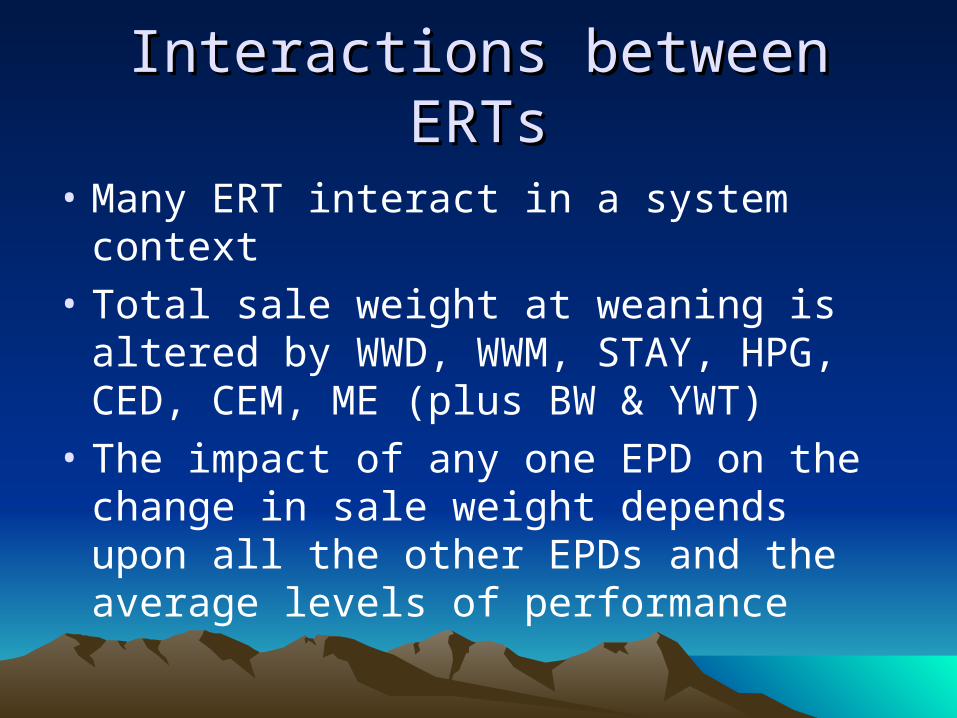
• Many ERT interact in a system context
• Total sale weight at weaning is altered by WWD, WWM, STAY, HPG, CED, CEM, ME (plus BW & YWT)
• The impact of any one EPD on the change in sale weight depends upon all the other EPDs and the average levels of performance
Assessment of Nutritional Assessment of Nutritional (& other input) Implications(& other input) Implications
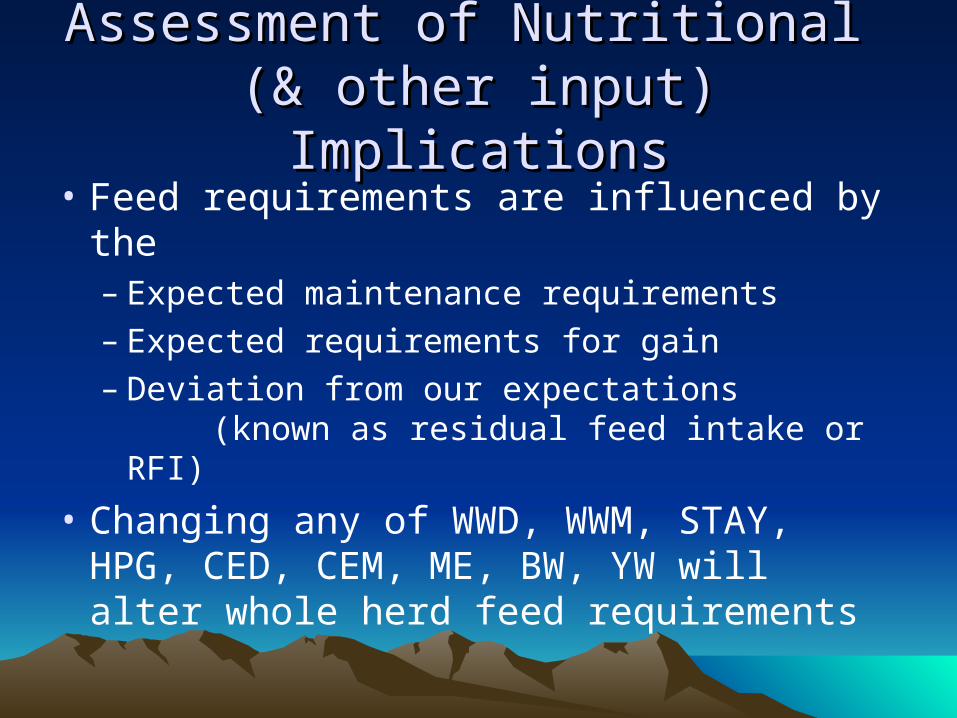
• Feed requirements are influenced by the– Expected maintenance requirements– Expected requirements for gain– Deviation from our expectations
(known as residual feed intake or RFI)
• Changing any of WWD, WWM, STAY, HPG, CED, CEM, ME, BW, YW will alter whole herd feed requirements
Assessment of Financial Assessment of Financial ImplicationsImplications
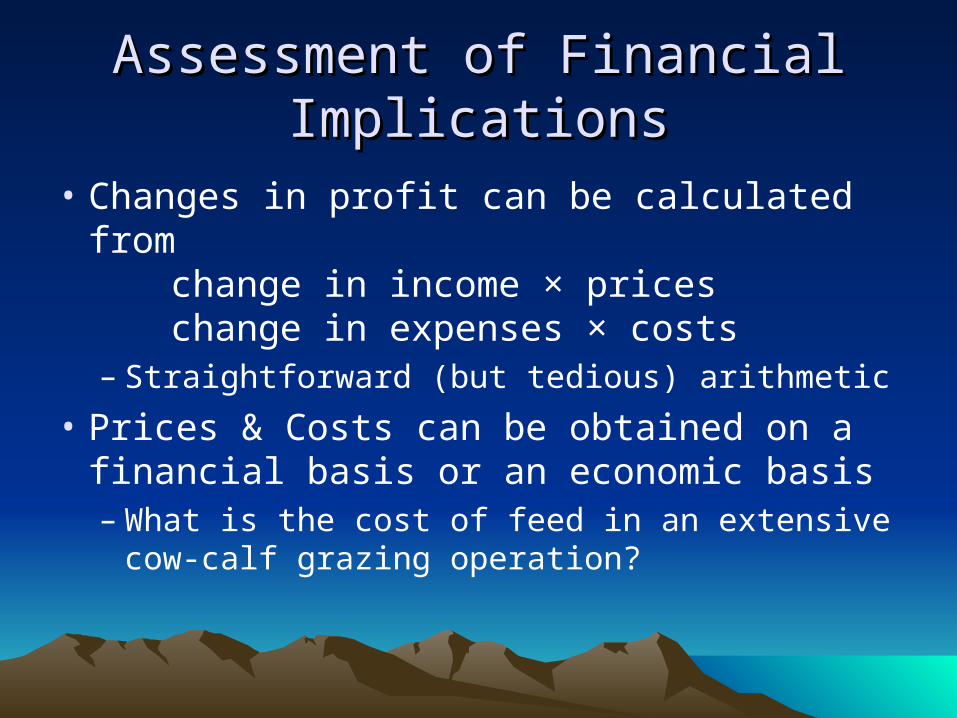
• Changes in profit can be calculated from change in income × priceschange in expenses × costs
– Straightforward (but tedious) arithmetic
• Prices & Costs can be obtained on a financial basis or an economic basis– What is the cost of feed in an extensive cow-
calf grazing operation?

Economic Cost of FeedEconomic Cost of Feed
• Feed “cost” can be calculated from its “opportunity” cost– Measure of what net income would be given
up if you had less feed (and less cows)– Can be calculated from comparing the system
profit of two herds of alternative genotypes with different stocking rates such that each consume the same amount of feed

SolutionsSolutions
• Leave it to bull buyers to struggle thru facts & calculations
• OR put it all together via the web
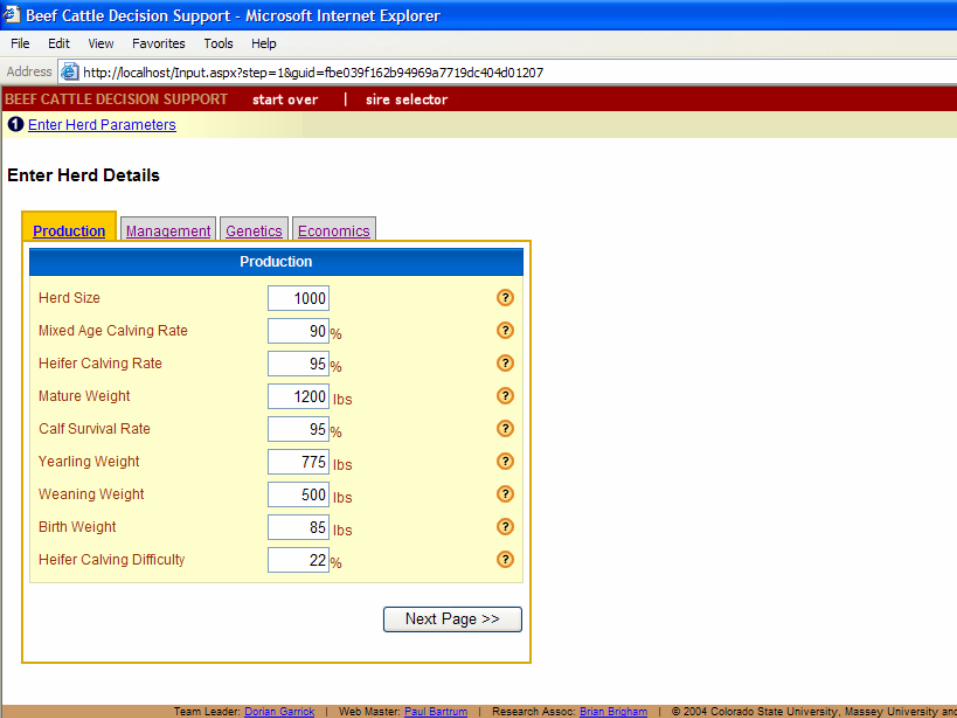
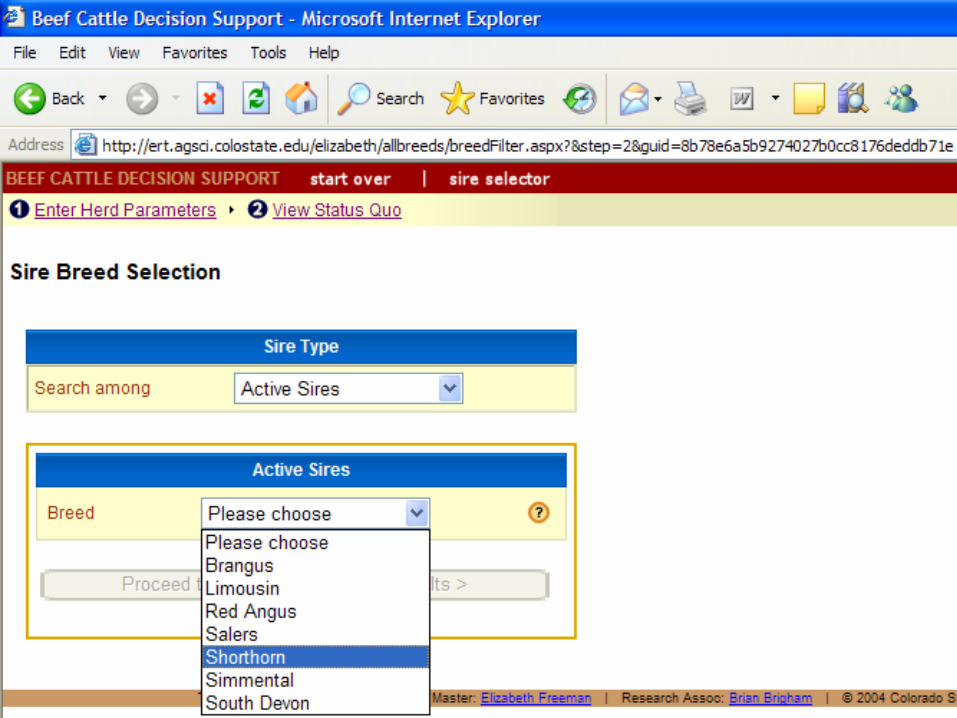
Website ert.agsci.colostate.edu

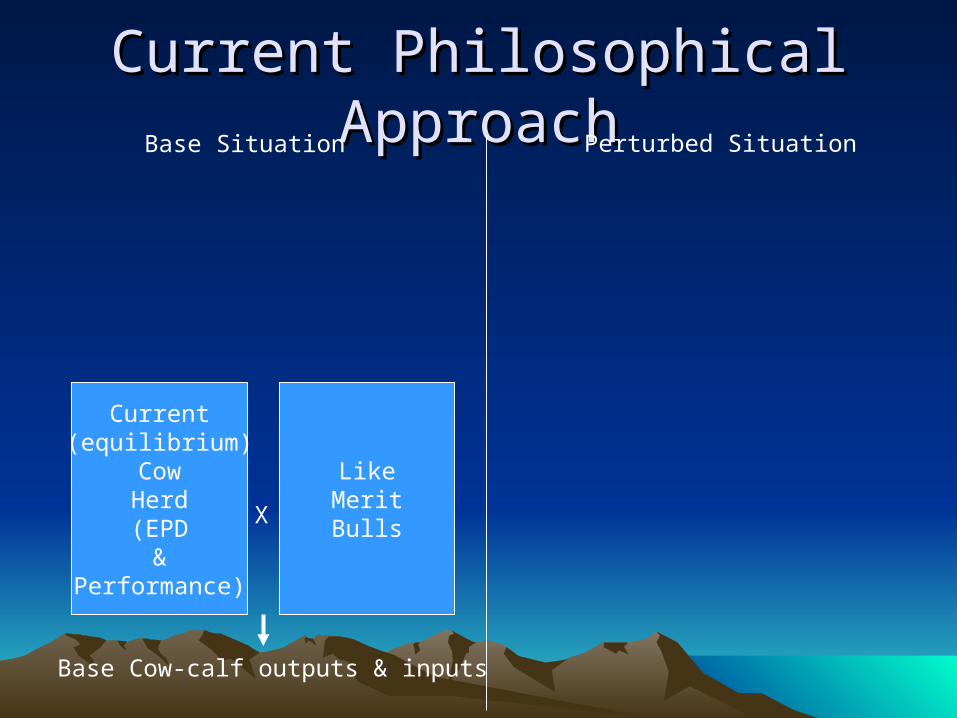
Current Philosophical ApproachCurrent Philosophical Approach
Current(equilibrium)
CowHerd(EPD
&Performance)
LikeMeritBulls
Base Cow-calf outputs & inputs
Base Situation Perturbed Situation
X
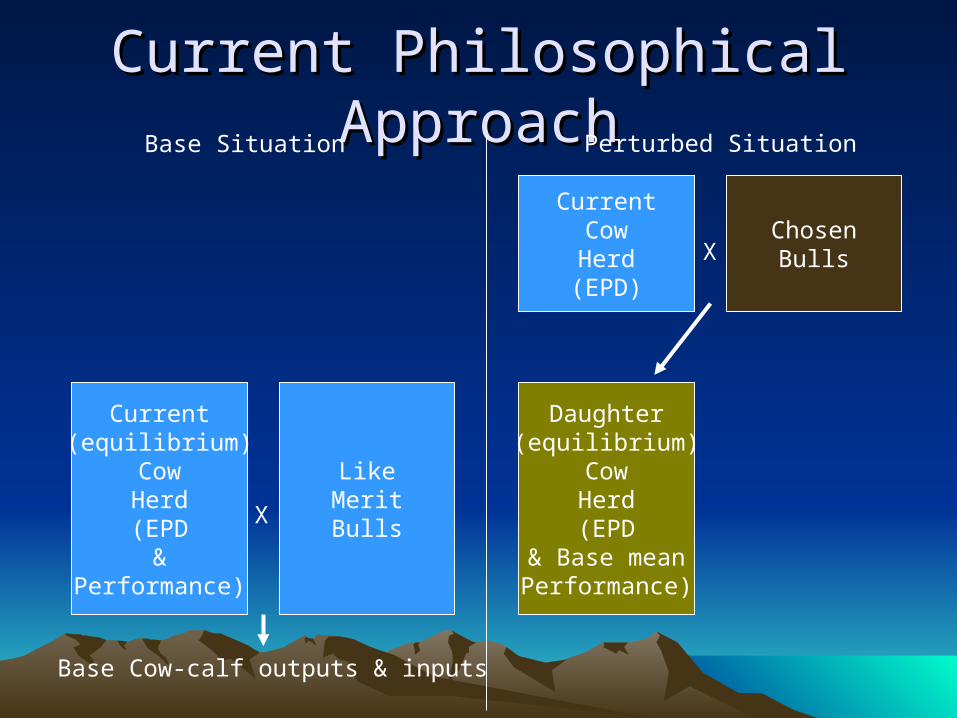
Current Philosophical ApproachCurrent Philosophical Approach
Current(equilibrium)
CowHerd(EPD
&Performance)
LikeMeritBulls
Base Cow-calf outputs & inputs
Base Situation Perturbed Situation
CurrentCowHerd
(EPD)
ChosenBulls
Daughter(equilibrium)
CowHerd(EPD
& Base meanPerformance)
X
X
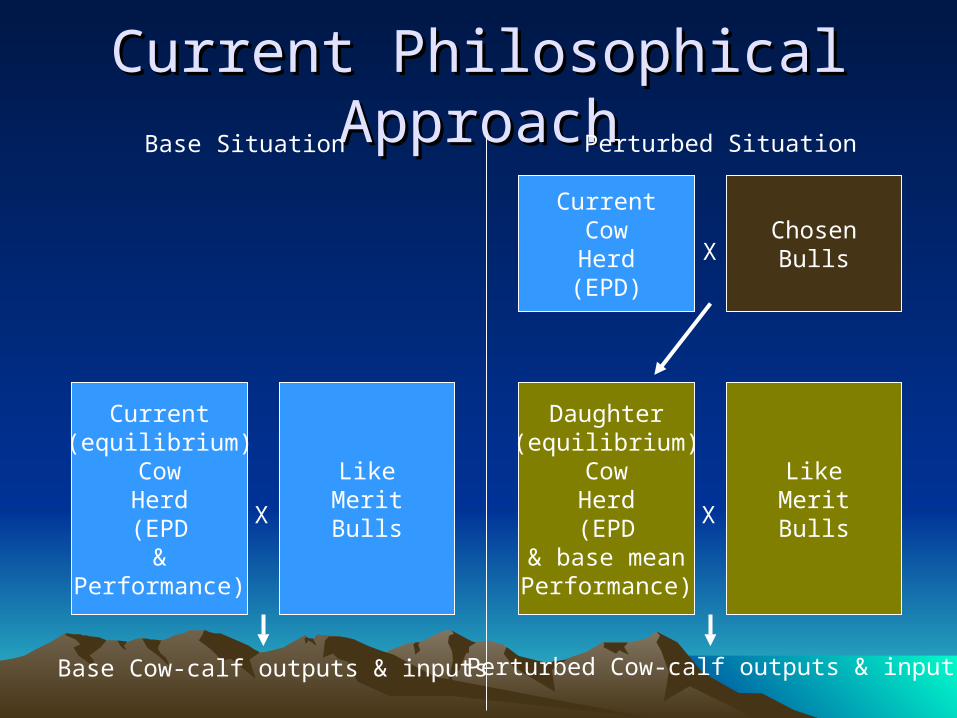
Current Philosophical ApproachCurrent Philosophical Approach
Current(equilibrium)
CowHerd(EPD
&Performance)
LikeMeritBulls
Base Cow-calf outputs & inputs
Base Situation Perturbed Situation
CurrentCowHerd
(EPD)
ChosenBulls
Daughter(equilibrium)
CowHerd(EPD
& base meanPerformance)
LikeMeritBulls
Perturbed Cow-calf outputs & inputs
X
X
X
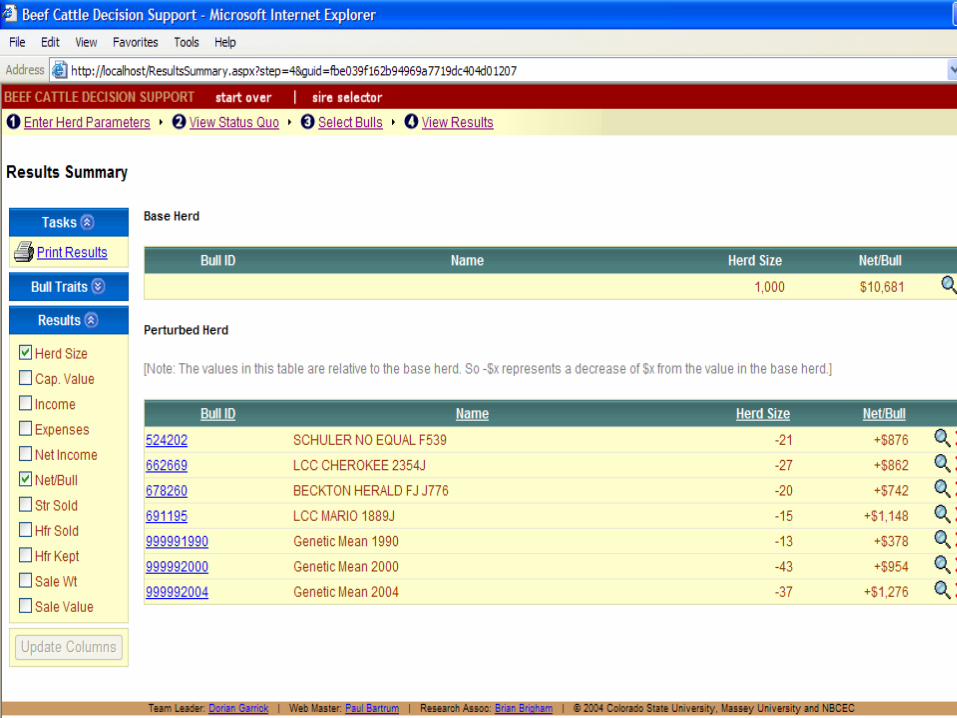

Accounting for RiskAccounting for Risk
Consider the following three bulls
Bull #prog Acc Profit
Lima 30 0.5 to 0.6 $908
Sierra 240 0.7 to 0.8 $729
Bravo 3700 0.8 to 0.95 $648

Accounting for RiskAccounting for Risk
• On average, true EPD is equally likely to be greater or lesser than published
• ACC allows us to quantify the extent to which the estimate may vary from true
• Considering just BW, WW, YW, Milk, ME and not (in this example) CED, CETM, HPG, ST we can compute many possible “realizations” of each bull
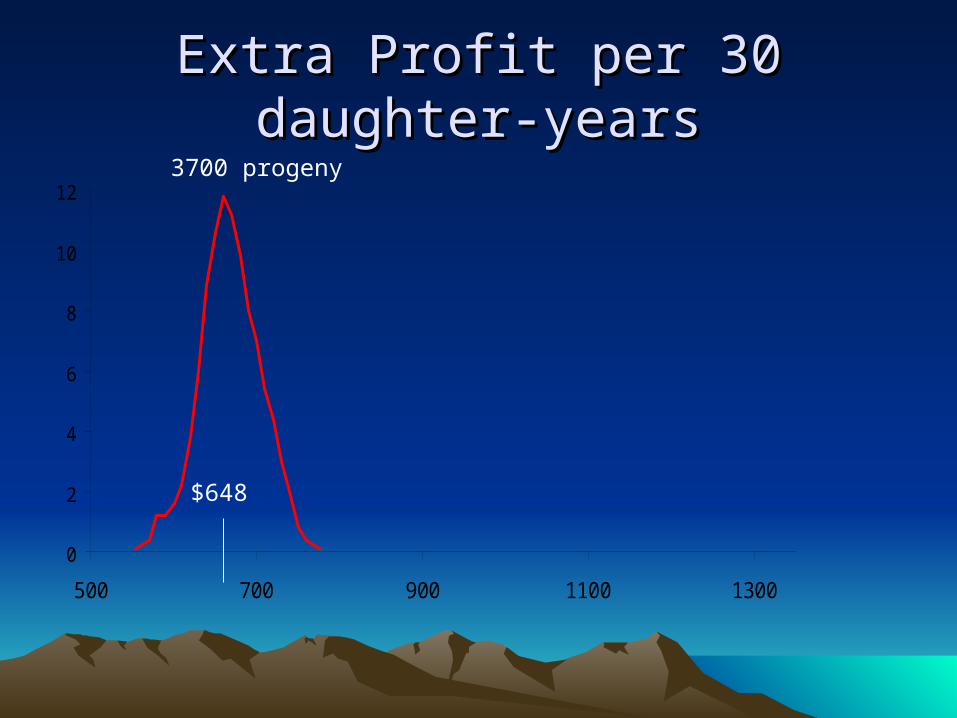
Extra Profit per 30 daughter-yearsExtra Profit per 30 daughter-years
0
2
4
6
8
10
12
500 700 900 1100 1300
$648
3700 progeny

Accounting for RiskAccounting for Risk
0
2
4
6
8
10
12
500 700 900 1100 1300
$729
3700 progeny
240 progeny
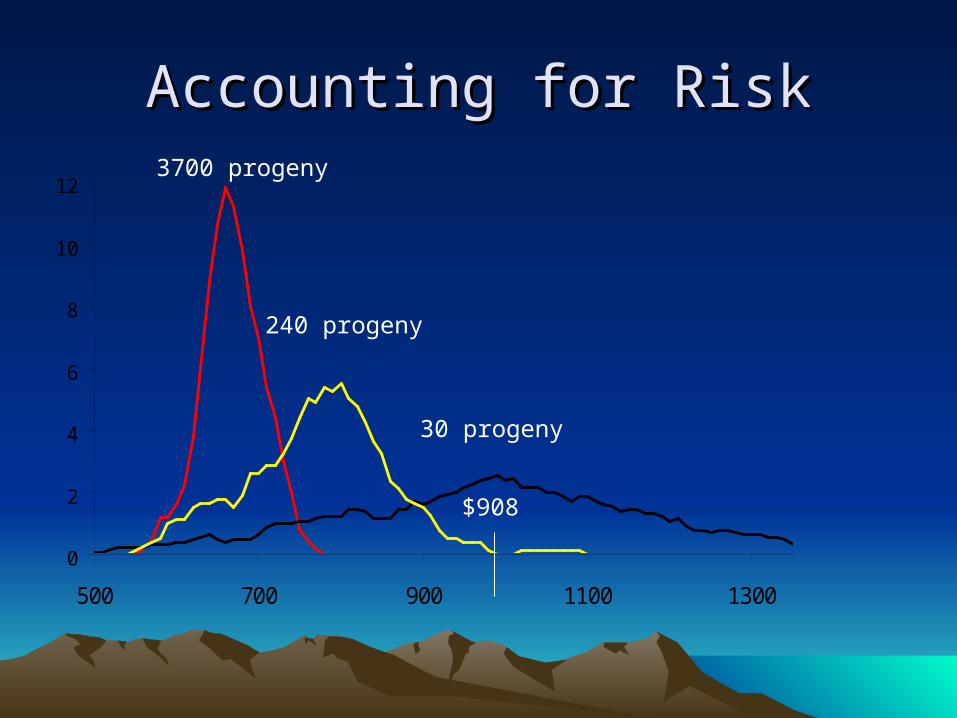
Accounting for RiskAccounting for Risk
0
2
4
6
8
10
12
500 700 900 1100 1300
$908
3700 progeny
240 progeny
30 progeny
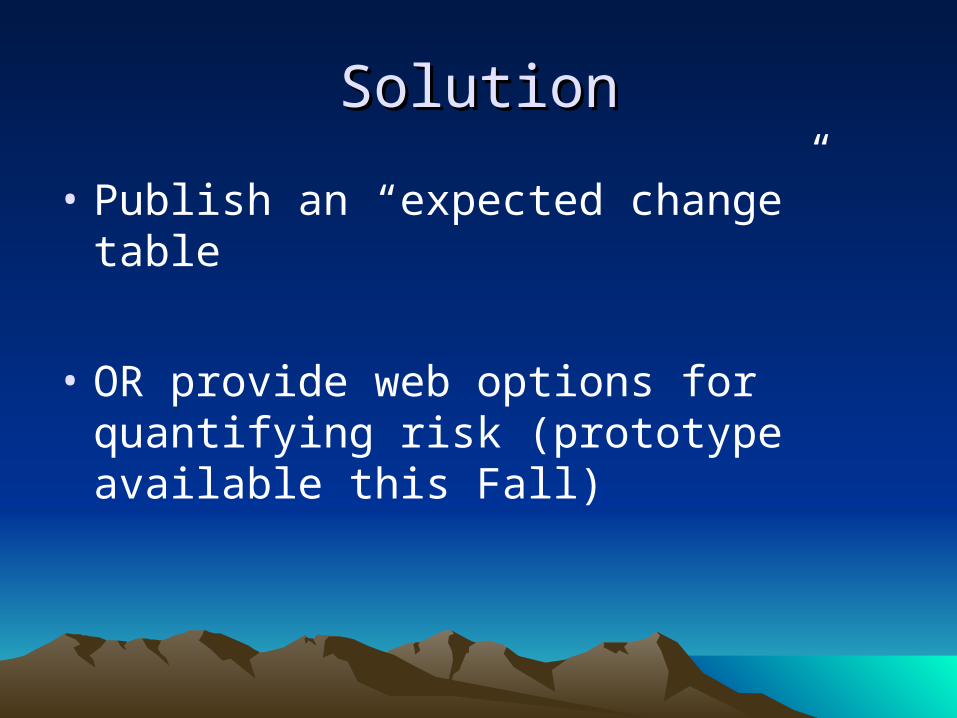
SolutionSolution
• Publish an “expected change” table
• OR provide web options for quantifying risk (prototype available this Fall)

Multibreed Evaluation & XbreedingMultibreed Evaluation & Xbreeding
EPD
Bull Within Breed
Angus 1* +65
Angus 2 +80
Simmental 3* +58
Simmental 4 +68
*A1 & S3 are breed average EPDs
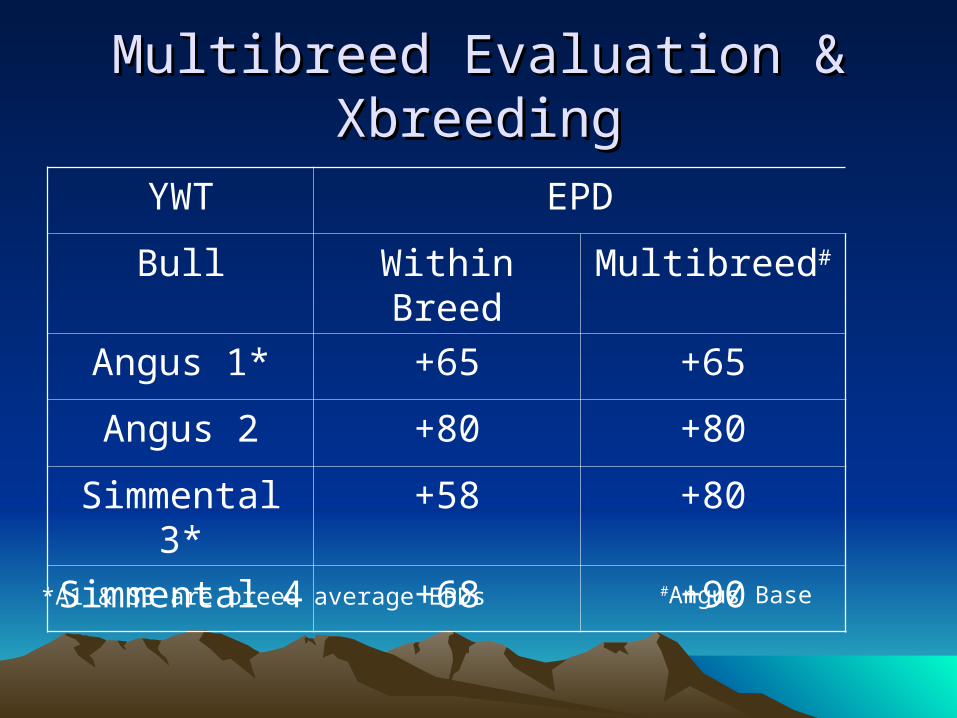
Multibreed Evaluation & XbreedingMultibreed Evaluation & Xbreeding
YWT EPD
Bull Within Breed Multibreed#
Angus 1* +65 +65
Angus 2 +80 +80
Simmental 3* +58 +80
Simmental 4 +68 +90
*A1 & S3 are breed average EPDs #Angus Base

Multibreed Evaluation & XbreedingMultibreed Evaluation & Xbreeding
YWT Cow Breed
MBE Angus Simm Heref
Angus 1 +65 Base
Angus 2 +80 +15
Simm 3 +80
Simm 4 +90
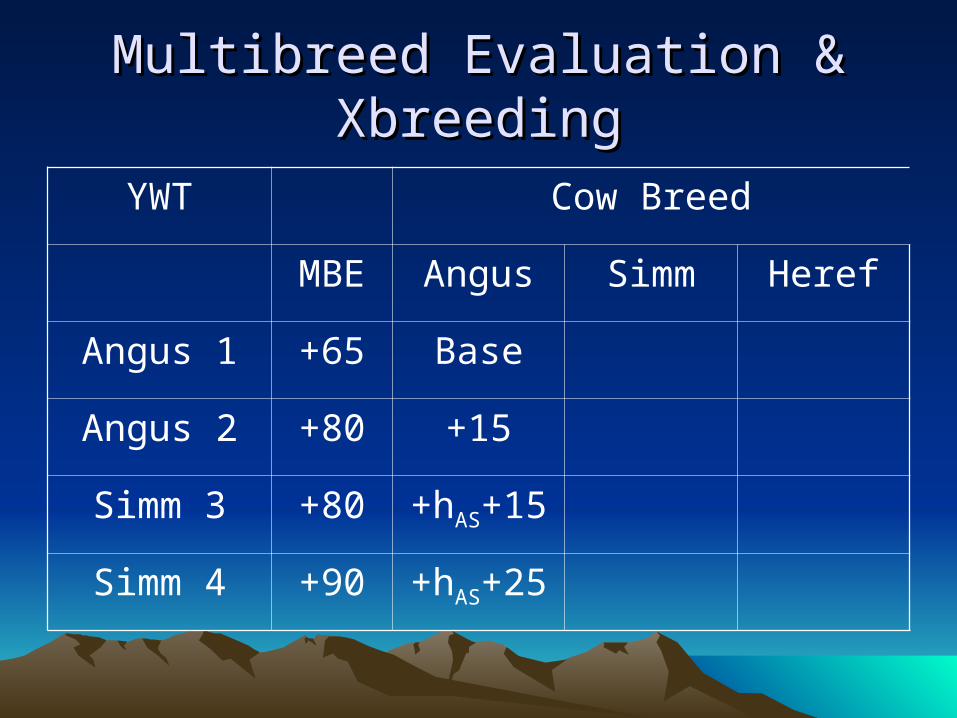
Multibreed Evaluation & XbreedingMultibreed Evaluation & Xbreeding
YWT Cow Breed
MBE Angus Simm Heref
Angus 1 +65 Base
Angus 2 +80 +15
Simm 3 +80 +hAS+15
Simm 4 +90 +hAS+25
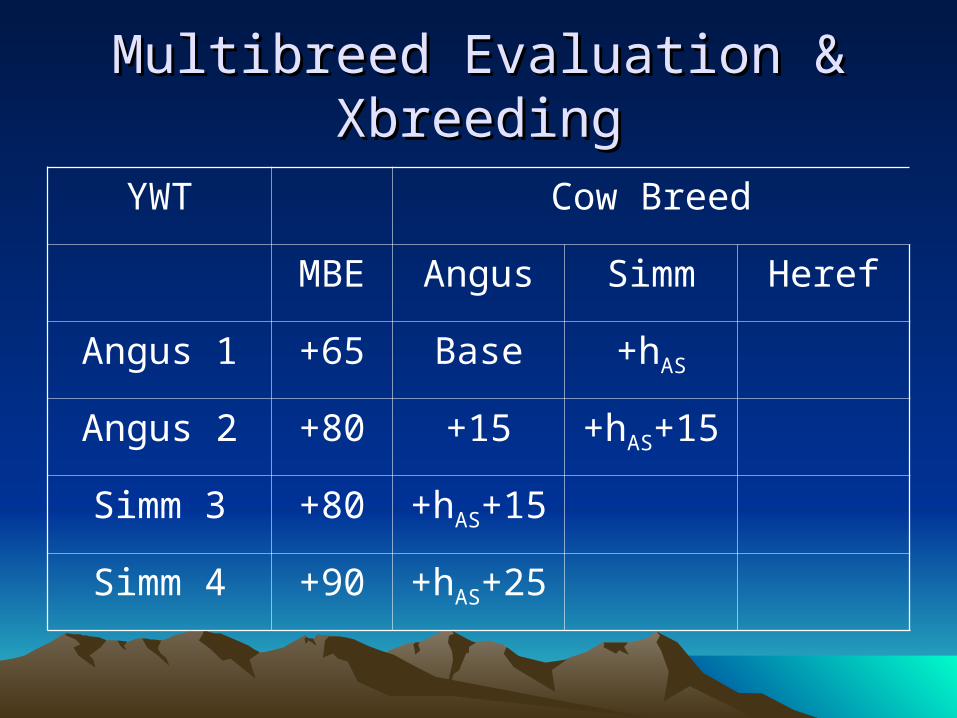
Multibreed Evaluation & XbreedingMultibreed Evaluation & Xbreeding
YWT Cow Breed
MBE Angus Simm Heref
Angus 1 +65 Base +hAS
Angus 2 +80 +15 +hAS+15
Simm 3 +80 +hAS+15
Simm 4 +90 +hAS+25

Multibreed Evaluation & XbreedingMultibreed Evaluation & Xbreeding
YWT Cow Breed
MBE Angus Simm Heref
Angus 1 +65 Base +hAS
Angus 2 +80 +15 +hAS+15
Simm 3 +80 +hAS+15 +15
Simm 4 +90 +hAS+25 +25
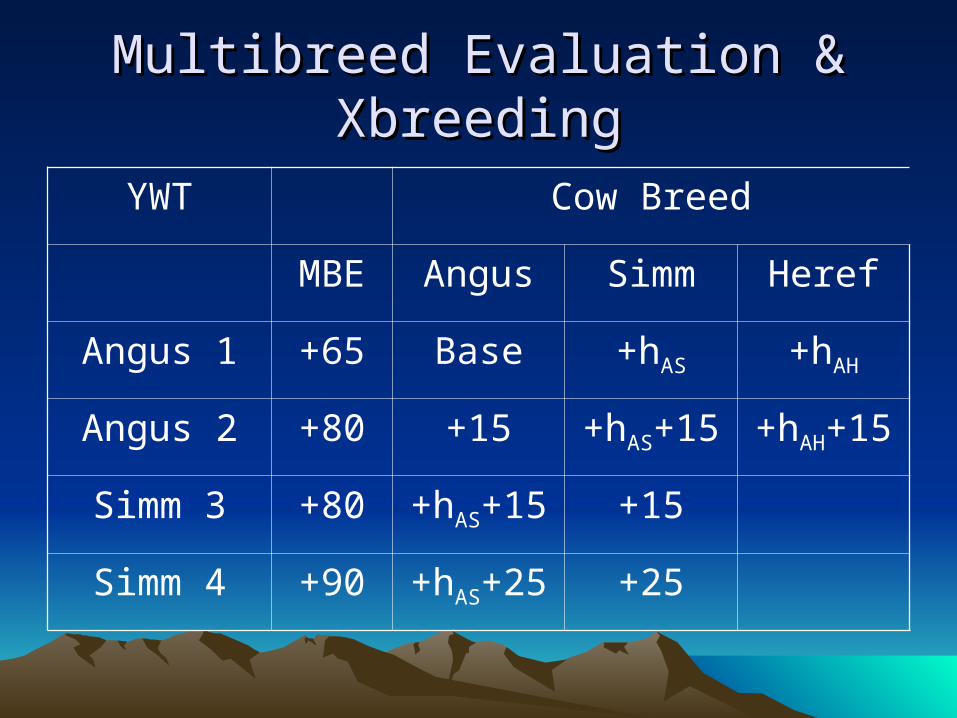
Multibreed Evaluation & XbreedingMultibreed Evaluation & Xbreeding
YWT Cow Breed
MBE Angus Simm Heref
Angus 1 +65 Base +hAS +hAH
Angus 2 +80 +15 +hAS+15 +hAH+15
Simm 3 +80 +hAS+15 +15
Simm 4 +90 +hAS+25 +25

Multibreed Evaluation & XbreedingMultibreed Evaluation & Xbreeding
YWT Cow Breed
MBE Angus Simm Heref
Angus 1 +65 Base +hAS +hAH
Angus 2 +80 +15 +hAS+15 +hAH+15
Simm 3 +80 +hAS+15 +15 +hHS+15
Simm 4 +90 +hAS+25 +25 +hHS+25
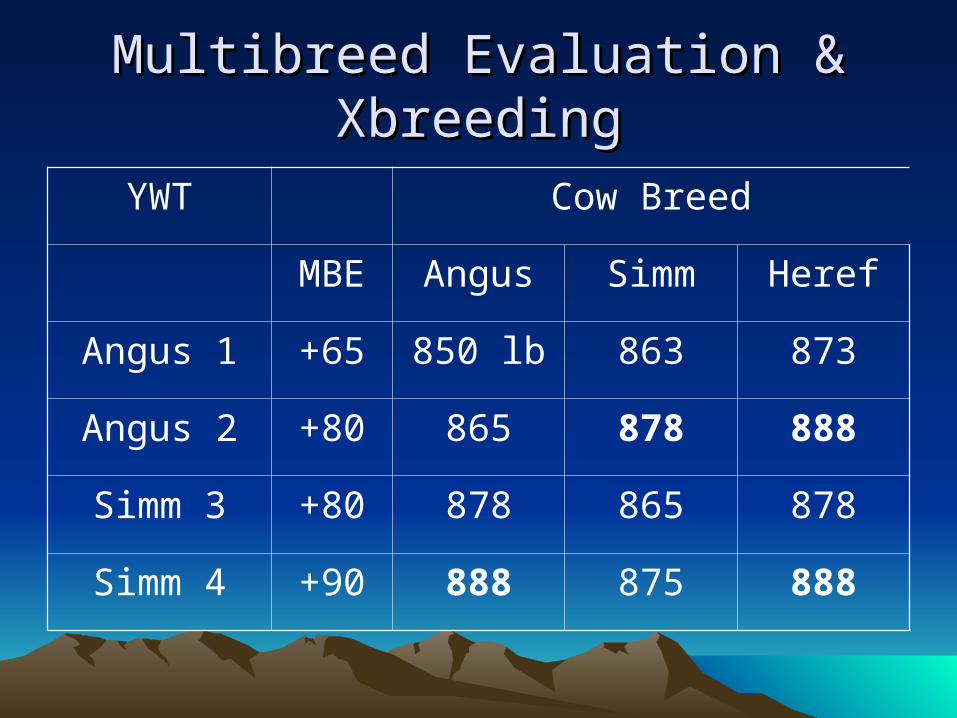
Multibreed Evaluation & XbreedingMultibreed Evaluation & Xbreeding
YWT Cow Breed
MBE Angus Simm Heref
Angus 1 +65 850 lb 863 873
Angus 2 +80 865 878 888
Simm 3 +80 878 865 878
Simm 4 +90 888 875 888

SolutionSolution
• Publish within-breed EPDs– Let users find breed adjustments & heterosis
• Publish multibreed EPDs– Let users deal with heterosis coefficients &
heterosis
• Publish all EPDs on a multibreed base with heterosis factors included according to the breed of dam for every ERT
• Use web-based decision support

SummarySummary
• To date, the major value of the web has been convenience
• In future, the web will provide an interface to knowledge (eg nutritional requirements and heterosis factors) and information that for customized calculations to support your decisions
• Better decision support will give better decisions (eg more profit)