Embed Size (px)
Citation preview
Making Zero Accidents A Reality
John Mathis
Bechtel Corporation
John Mathis
Bechtel Corporation
Making Zero Accidents A Reality
Project Team
Making Zero Accidents A Reality
Project Team
CPI Conference 2001
John Mathis
Bechtel
John Mathis
Bechtel
Making Zero Accidents A Reality
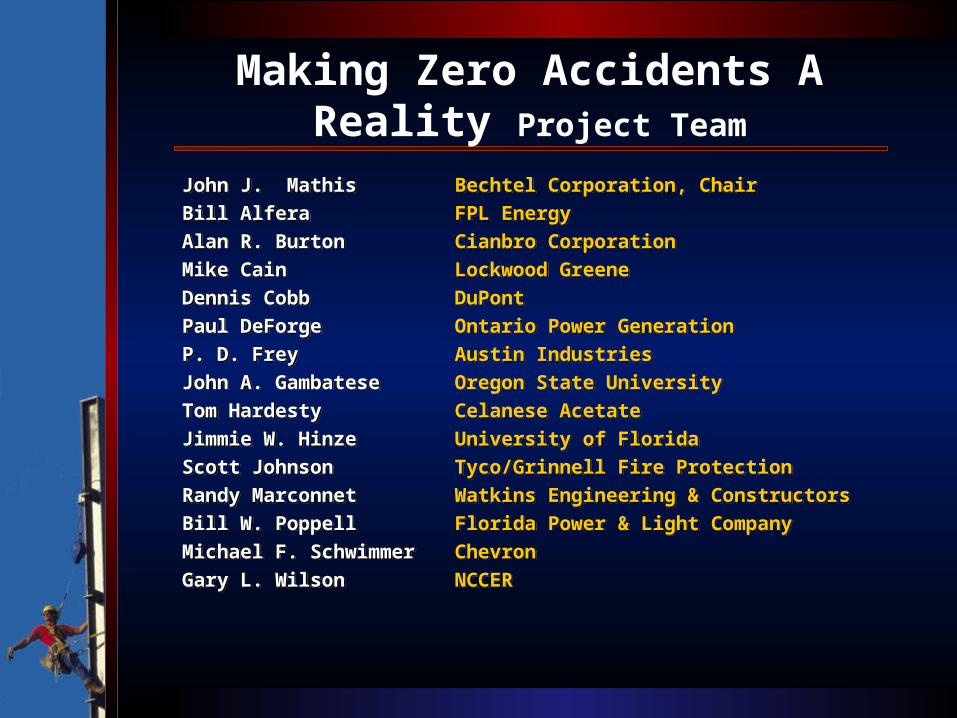
Making Zero Accidents A Reality Project Team
John J. Mathis Bechtel Corporation, ChairBill Alfera FPL EnergyAlan R. Burton Cianbro CorporationMike Cain Lockwood GreeneDennis Cobb DuPontPaul DeForge Ontario Power GenerationP. D. Frey Austin IndustriesJohn A. Gambatese Oregon State UniversityTom Hardesty Celanese AcetateJimmie W. Hinze University of FloridaScott Johnson Tyco/Grinnell Fire ProtectionRandy Marconnet Watkins Engineering & ConstructorsBill W. Poppell Florida Power & Light CompanyMichael F. Schwimmer ChevronGary L. Wilson NCCER
John J. Mathis Bechtel Corporation, ChairBill Alfera FPL EnergyAlan R. Burton Cianbro CorporationMike Cain Lockwood GreeneDennis Cobb DuPontPaul DeForge Ontario Power GenerationP. D. Frey Austin IndustriesJohn A. Gambatese Oregon State UniversityTom Hardesty Celanese AcetateJimmie W. Hinze University of FloridaScott Johnson Tyco/Grinnell Fire ProtectionRandy Marconnet Watkins Engineering & ConstructorsBill W. Poppell Florida Power & Light CompanyMichael F. Schwimmer ChevronGary L. Wilson NCCER
Plenary Session
• Take a safety journey.
•Review the project team mission.
•Review the research methodology.
•Reveal best practices identified.
•Provide examples of key findings.
•Provide overview of our Implementation Session.
• Take a safety journey.
•Review the project team mission.
•Review the research methodology.
•Reveal best practices identified.
•Provide examples of key findings.
•Provide overview of our Implementation Session.
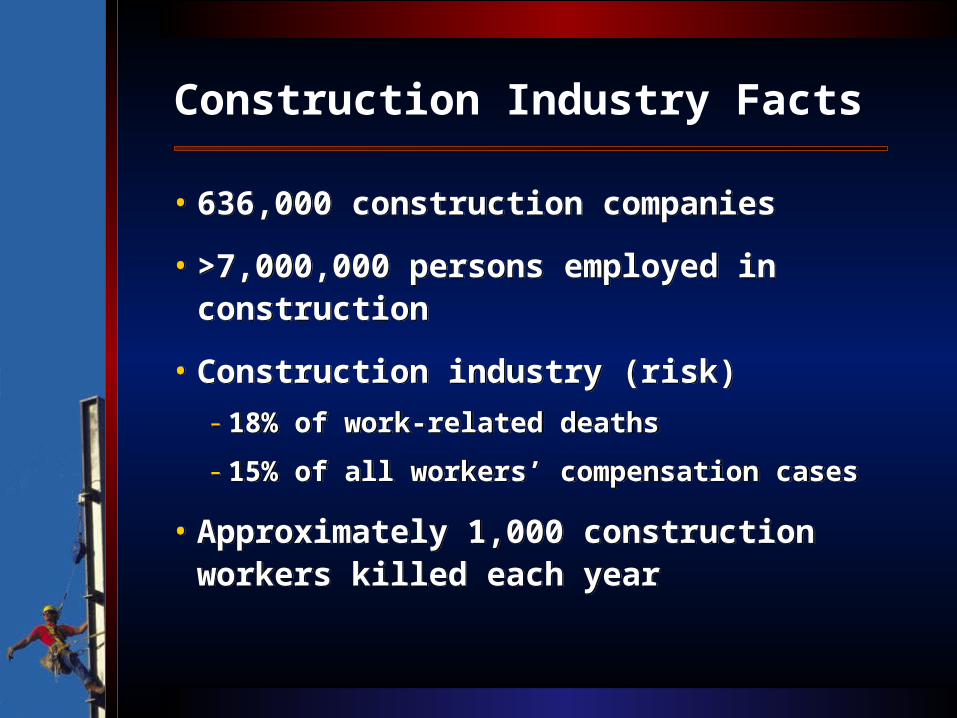
Construction Industry Facts
• 636,000 construction companies
•>7,000,000 persons employed in construction
•Construction industry (risk)
- 18% of work-related deaths
- 15% of all workers’ compensation cases
•Approximately 1,000 construction workers killed each year
• 636,000 construction companies
•>7,000,000 persons employed in construction
•Construction industry (risk)
- 18% of work-related deaths
- 15% of all workers’ compensation cases
•Approximately 1,000 construction workers killed each year
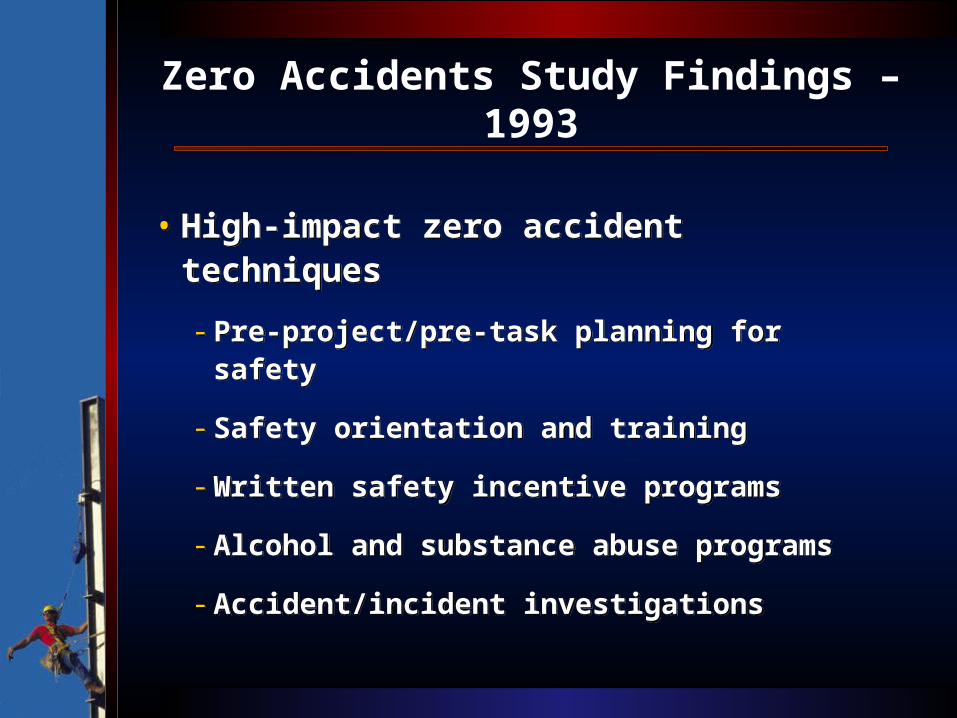
Zero Accidents Study Findings – 1993
•High-impact zero accident techniques
- Pre-project/pre-task planning for safety
- Safety orientation and training
- Written safety incentive programs
- Alcohol and substance abuse programs
- Accident/incident investigations
•High-impact zero accident techniques
- Pre-project/pre-task planning for safety
- Safety orientation and training
- Written safety incentive programs
- Alcohol and substance abuse programs
- Accident/incident investigations
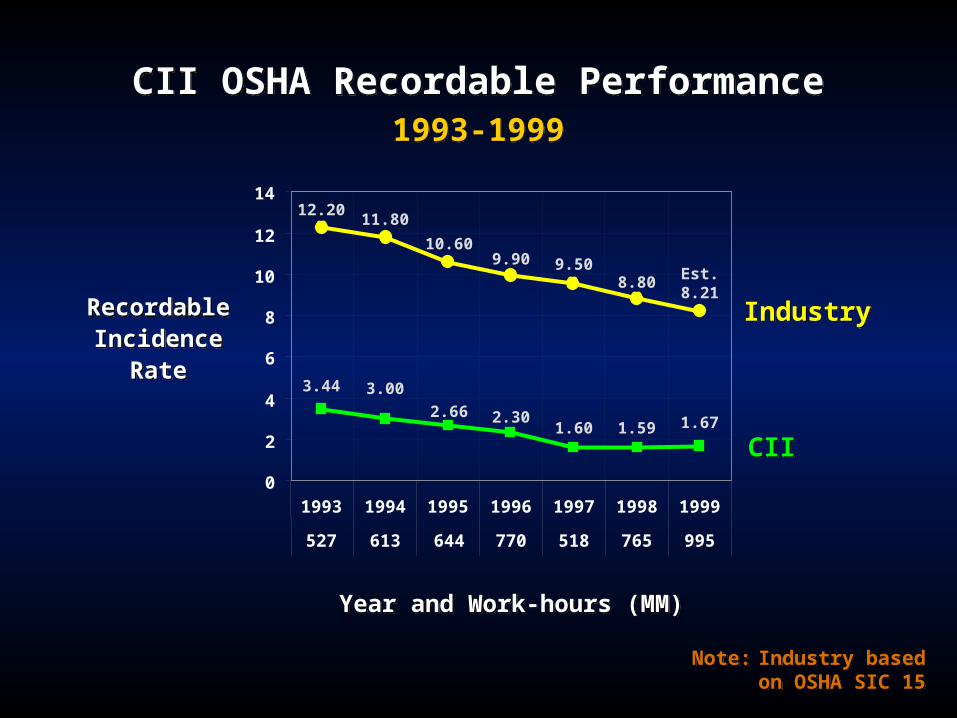
CII OSHA Recordable Performance1993-1999
CII OSHA Recordable Performance1993-1999
8.809.509.90
10.60
11.8012.20
Est.8.21
1.591.602.302.66
3.003.44
1.67
0
2
4
6
8
10
12
14
1993 1994 1995 1996 1997 1998 1999
527 613 644 770 518 765 995
Year and Work-hours (MM)Year and Work-hours (MM)
Recordable Incidence
Rate
Recordable Incidence
Rate
IndustryIndustry
CIICII
Note: Industry based on OSHA SIC 15
Note: Industry based on OSHA SIC 15
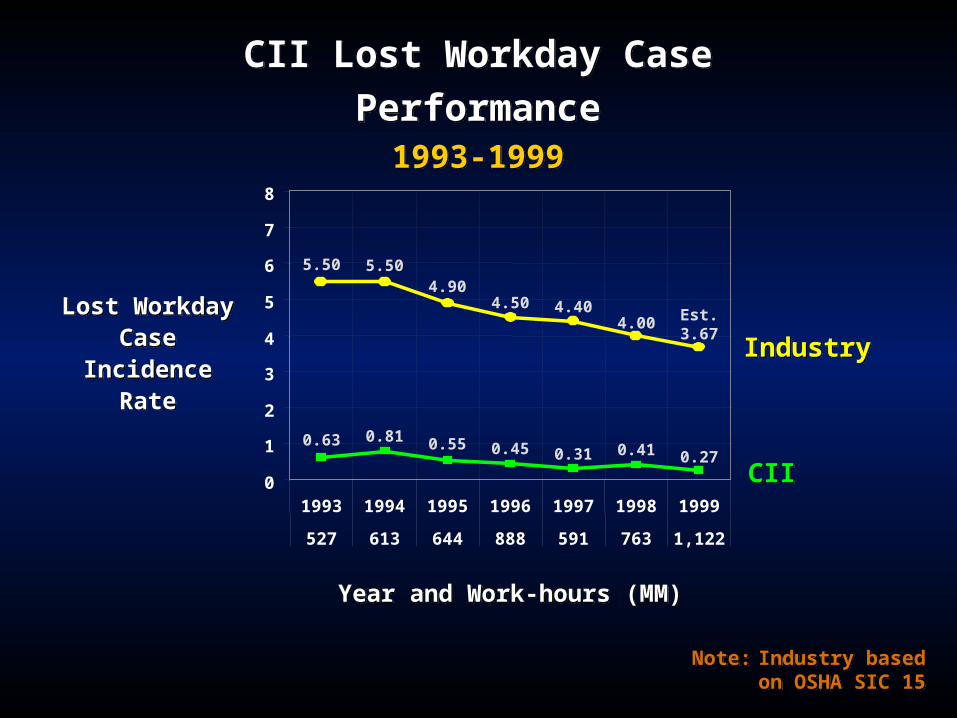
CII Lost Workday Case Performance
1993-1999
CII Lost Workday Case Performance
1993-1999
5.50 5.504.90
4.50 4.404.00 Est.
3.67
0.63 0.81 0.55 0.45 0.31 0.41 0.27
0
1
2
3
4
5
6
7
8
1993 1994 1995 1996 1997 1998 1999
527 613 644 888 591 763 1,122
Year and Work-hours (MM)Year and Work-hours (MM)
Lost Workday Case
Incidence Rate
Lost Workday Case
Incidence Rate
IndustryIndustry
CIICII
Note: Industry based on OSHA SIC 15
Note: Industry based on OSHA SIC 15
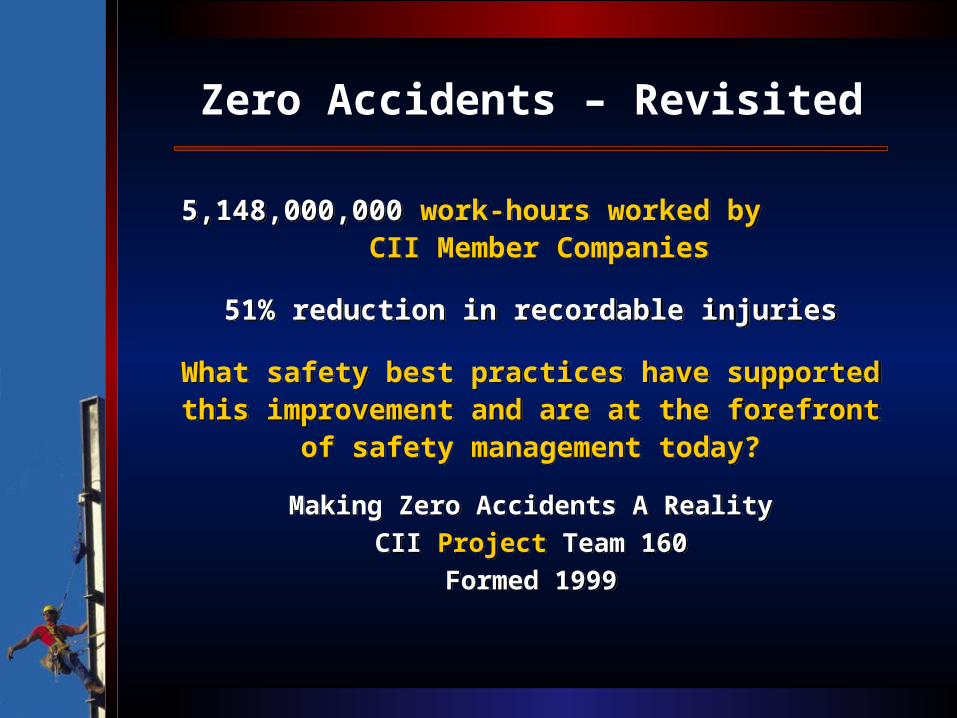
Zero Accidents – Revisited
5,148,000,000 work-hours worked by CII Member Companies
51% reduction in recordable injuries
What safety best practices have supported this improvement and are at the forefront
of safety management today?
Making Zero Accidents A RealityCII Project Team 160
Formed 1999
5,148,000,000 work-hours worked by CII Member Companies
51% reduction in recordable injuries
What safety best practices have supported this improvement and are at the forefront
of safety management today?
Making Zero Accidents A RealityCII Project Team 160
Formed 1999
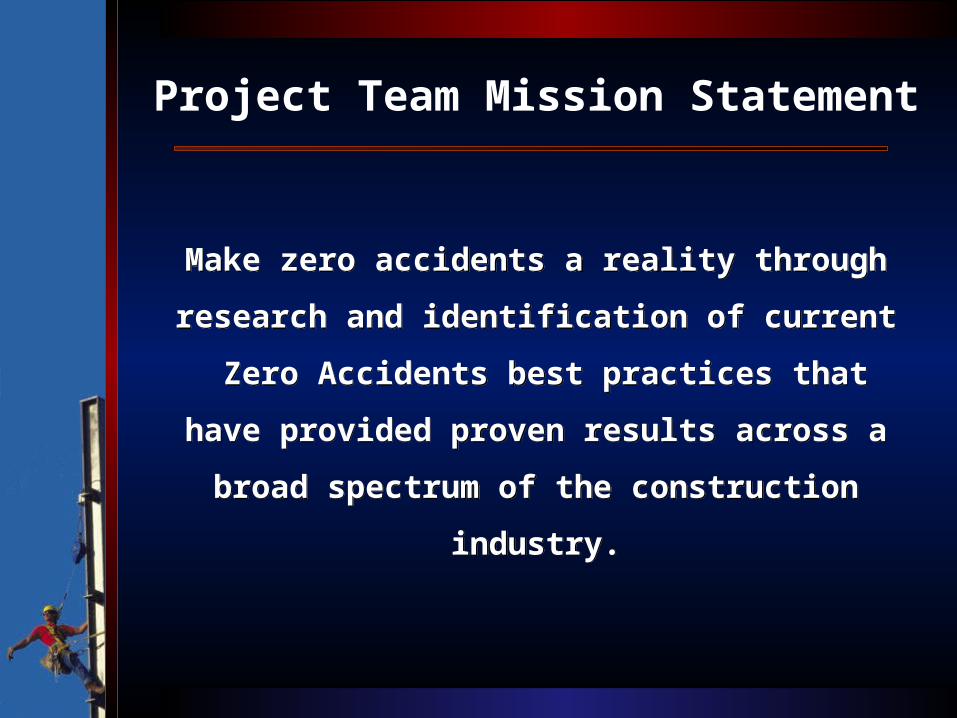
Project Team Mission Statement
Make zero accidents a reality through
research and identification of current
Zero Accidents best practices that have
provided proven results across a broad
spectrum of the construction industry.
Make zero accidents a reality through
research and identification of current
Zero Accidents best practices that have
provided proven results across a broad
spectrum of the construction industry.
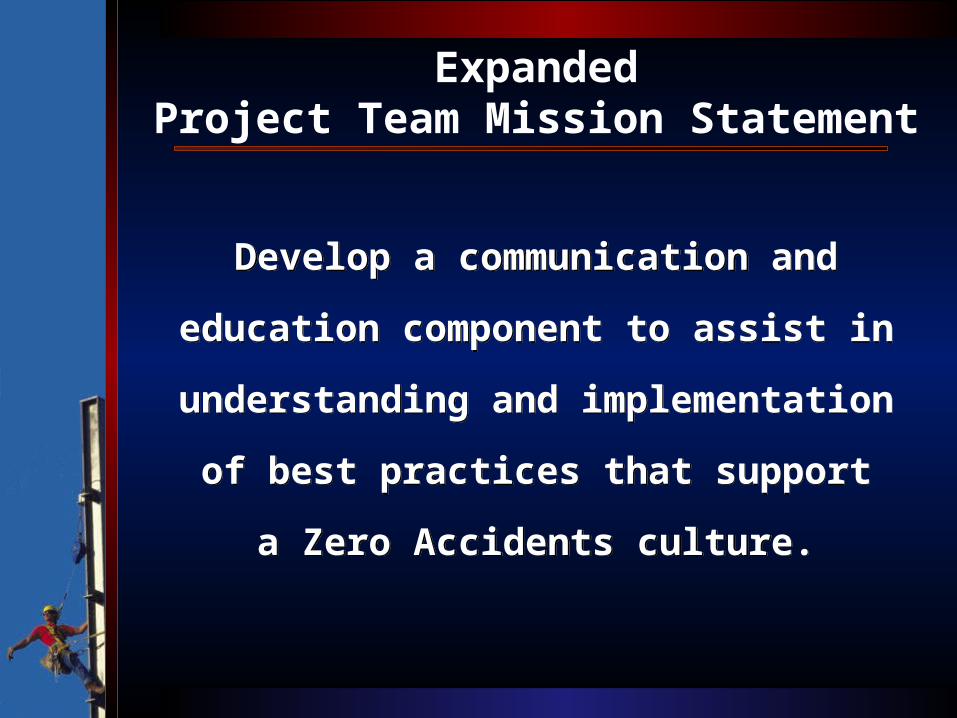
ExpandedProject Team Mission Statement
Develop a communication and
education component to assist in
understanding and implementation
of best practices that support
a Zero Accidents culture.
Develop a communication and
education component to assist in
understanding and implementation
of best practices that support
a Zero Accidents culture.
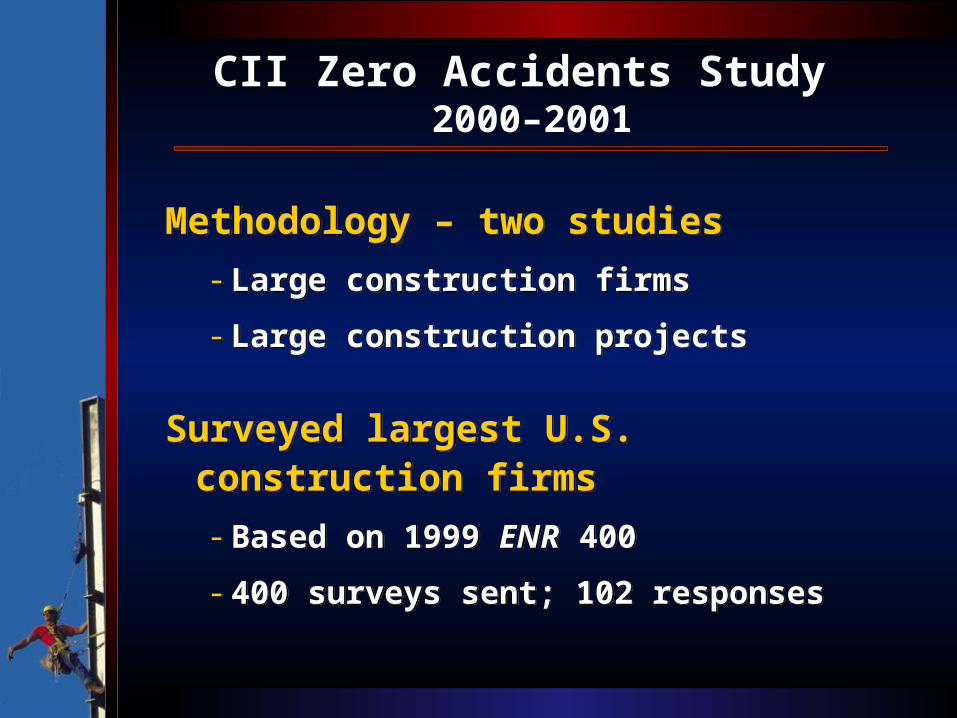
CII Zero Accidents Study 2000–2001
Methodology – two studies
- Large construction firms
- Large construction projects
Surveyed largest U.S. construction firms
- Based on 1999 ENR 400
- 400 surveys sent; 102 responses
Methodology – two studies
- Large construction firms
- Large construction projects
Surveyed largest U.S. construction firms
- Based on 1999 ENR 400
- 400 surveys sent; 102 responses
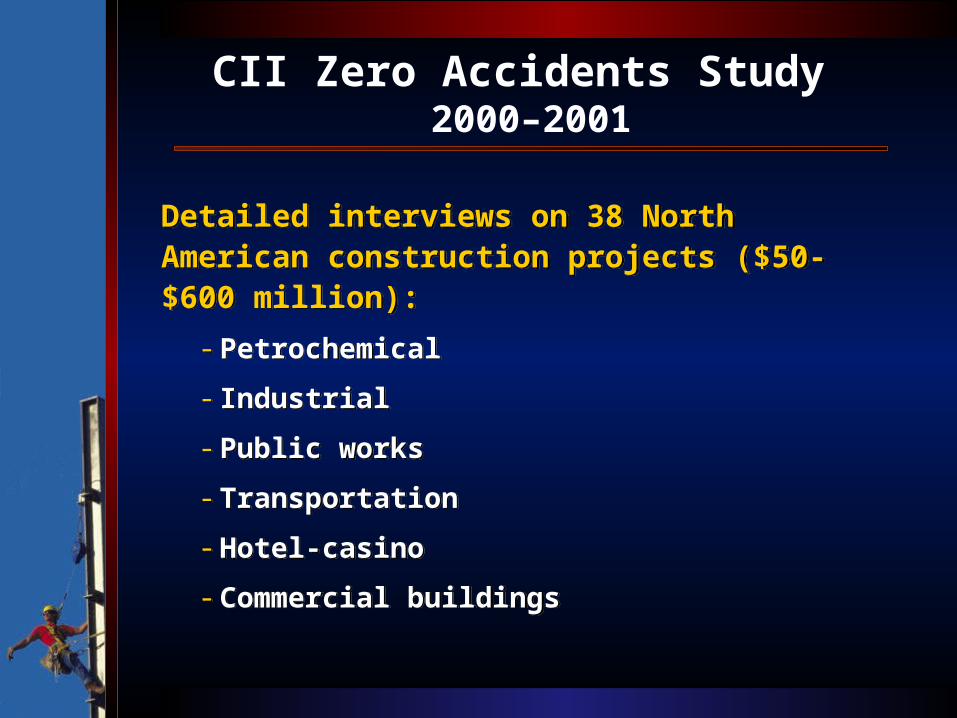
CII Zero Accidents Study 2000–2001
Detailed interviews on 38 North American construction projects ($50-$600 million):
- Petrochemical
- Industrial
- Public works
- Transportation
- Hotel-casino
- Commercial buildings
Detailed interviews on 38 North American construction projects ($50-$600 million):
- Petrochemical
- Industrial
- Public works
- Transportation
- Hotel-casino
- Commercial buildings
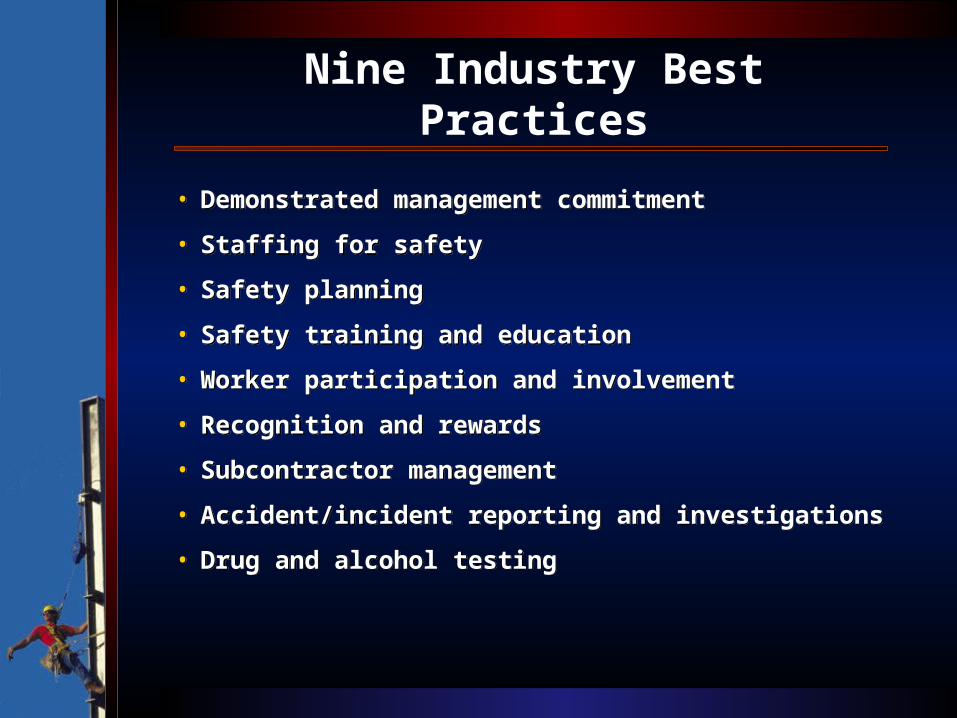
Nine Industry Best Practices
• Demonstrated management commitment
• Staffing for safety
• Safety planning
• Safety training and education
• Worker participation and involvement
• Recognition and rewards
• Subcontractor management
• Accident/incident reporting and investigations
• Drug and alcohol testing
• Demonstrated management commitment
• Staffing for safety
• Safety planning
• Safety training and education
• Worker participation and involvement
• Recognition and rewards
• Subcontractor management
• Accident/incident reporting and investigations
• Drug and alcohol testing
Best Practice Results
Over 30 key findings
revealed that companies
utilizing these best
practices have significantly
lower recordable injury
rates.
Over 30 key findings
revealed that companies
utilizing these best
practices have significantly
lower recordable injury
rates.
Zero Accidents Study2000-2001
Of the 38 construction projects
interviewed, four projects have
achieved zero accidents.
Of the 38 construction projects
interviewed, four projects have
achieved zero accidents.
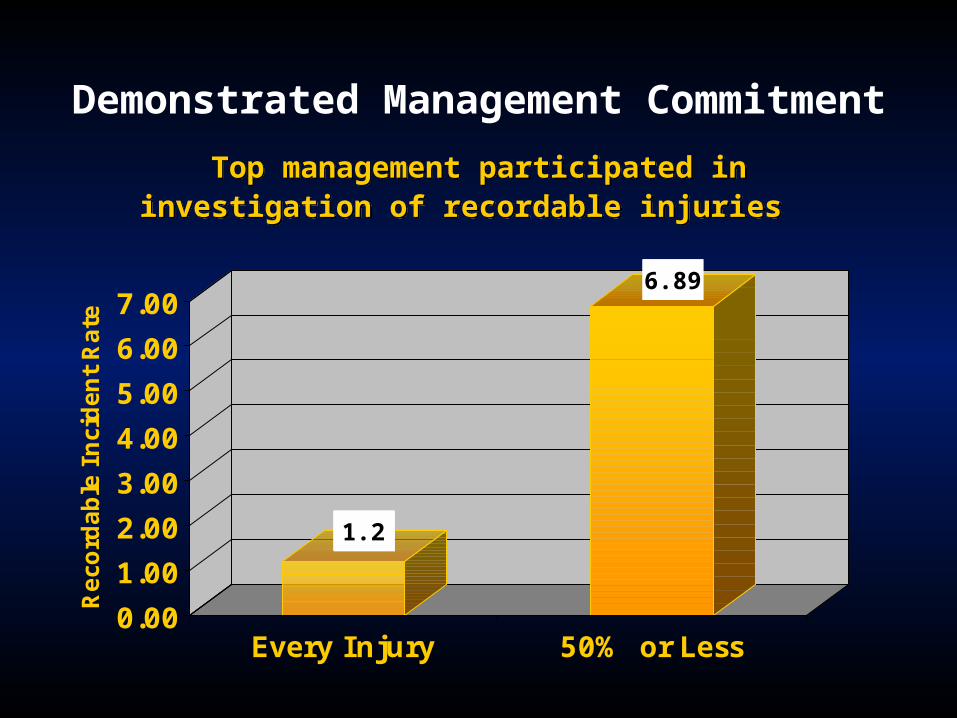
Demonstrated Management Commitment
Top management participated in investigation of recordable injuries
Top management participated in investigation of recordable injuries
1.20
6.89
0.00
1.00
2.00
3.00
4.00
5.00
6.00
7.00
Reco
rdable
Inci
dent
Rate
Every Injury 50% or Less
1.2
6.89
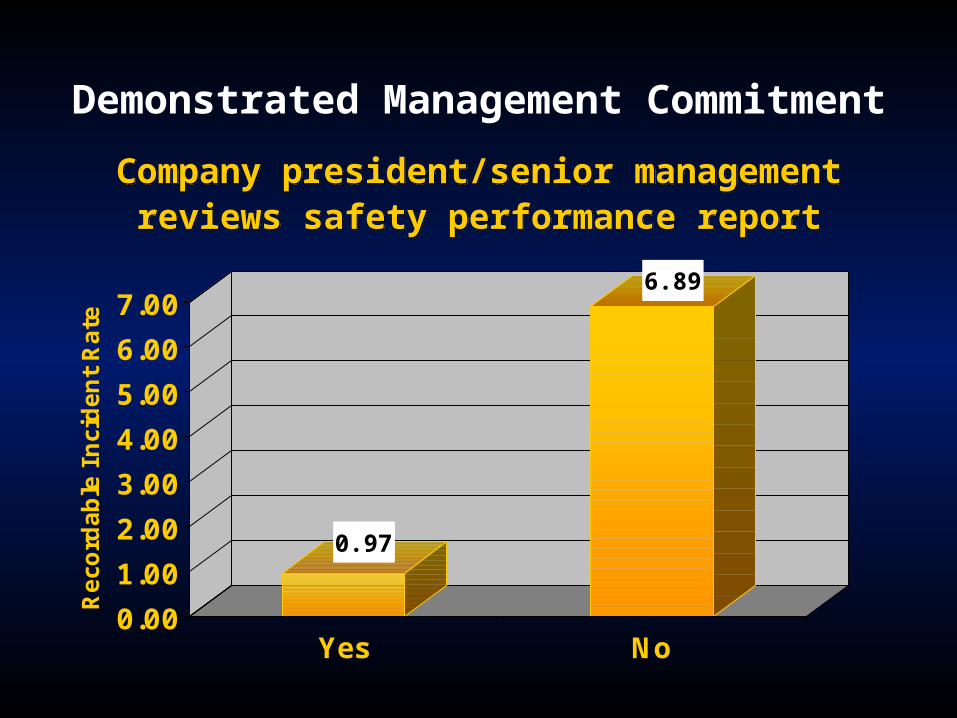
Demonstrated Management Commitment
Company president/senior management reviews safety performance report
Company president/senior management reviews safety performance report
0.97
6.89
0.00
1.00
2.00
3.00
4.00
5.00
6.00
7.00
Reco
rdable
Inci
dent
Rate
Yes No
0.97
6.89
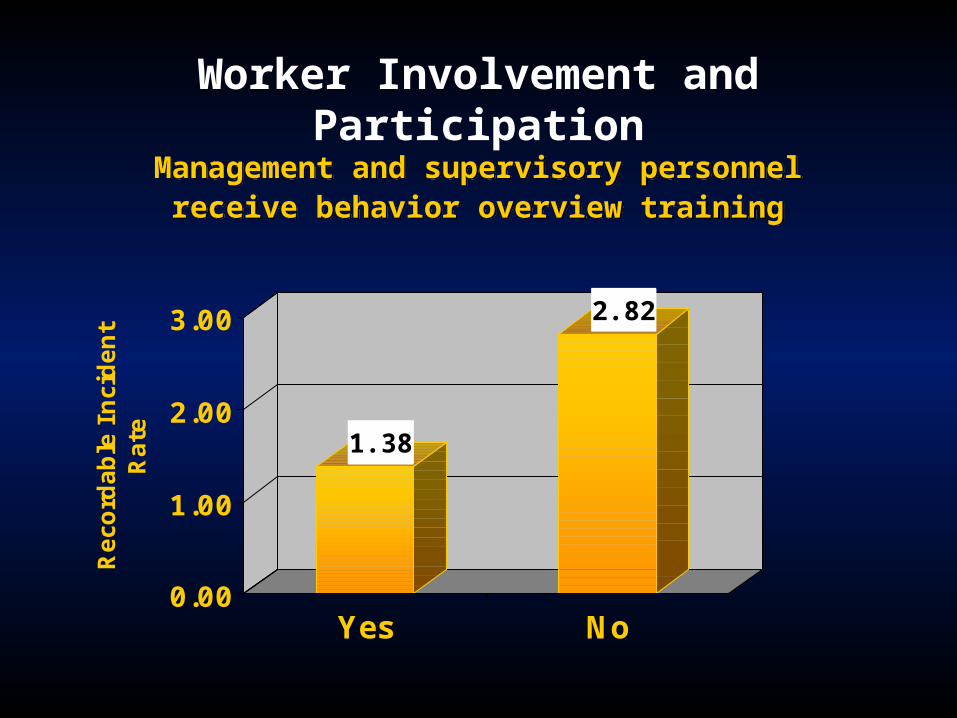
Worker Involvement and Participation
Management and supervisory personnel receive behavior overview training
Management and supervisory personnel receive behavior overview training
1.38
2.82
0.00
1.00
2.00
3.00
Reco
rdable
Inci
dent
Rate
Yes No
1.38
2.82
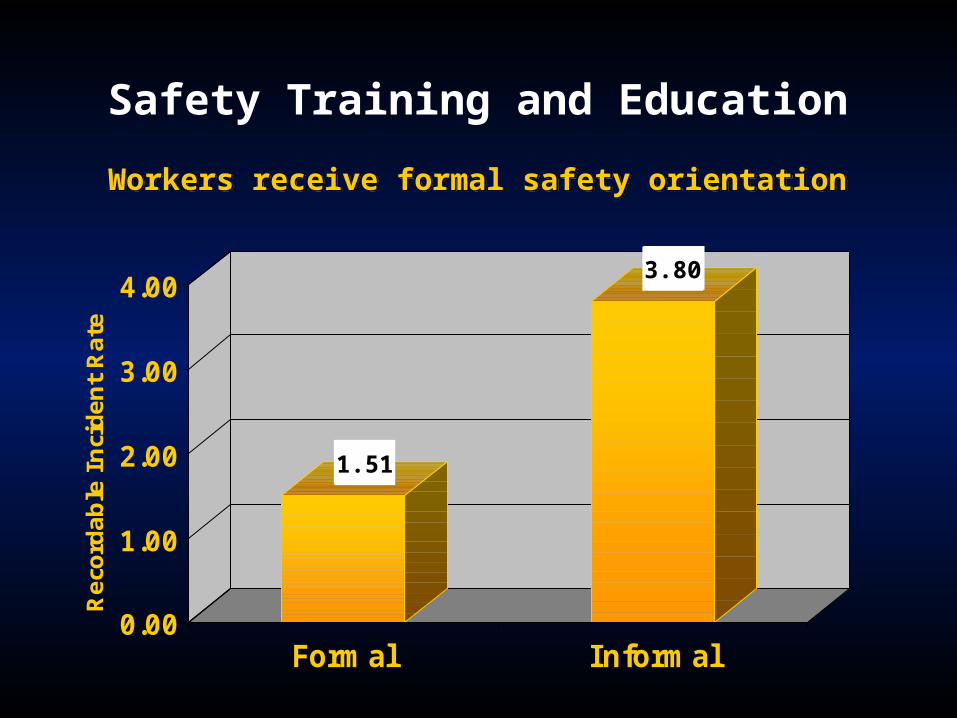
Safety Training and Education
Workers receive formal safety orientationWorkers receive formal safety orientation
1.51
3.80
0.00
1.00
2.00
3.00
4.00
Rec
orda
ble
Inci
dent
Rat
e
Formal Informal
1.51
3.80
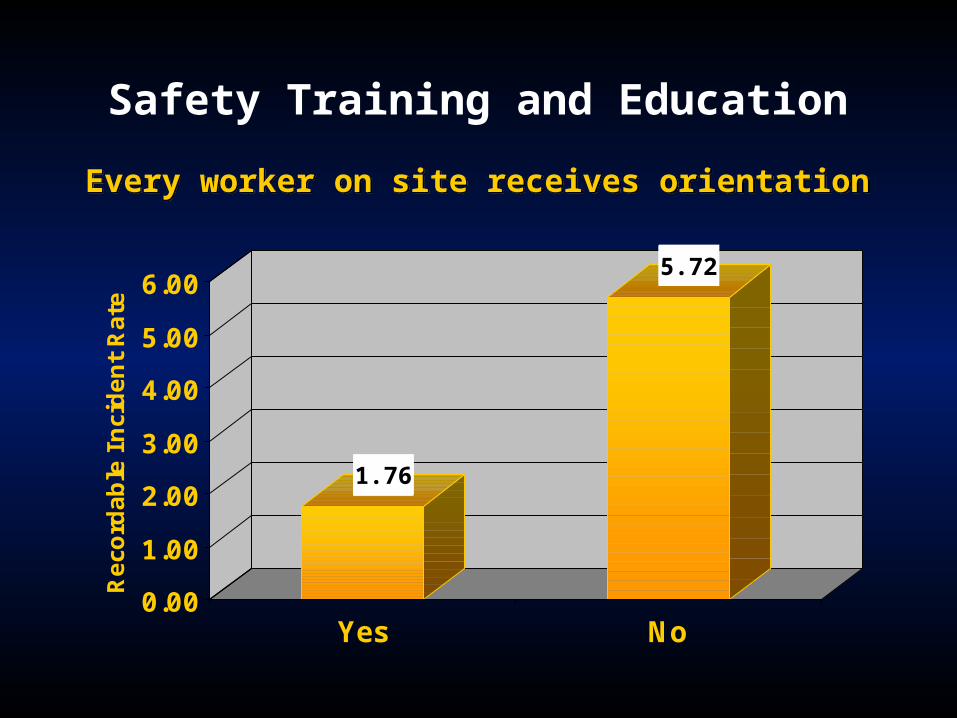
Safety Training and Education
Every worker on site receives orientationEvery worker on site receives orientation
1.76
5.72
0.00
1.00
2.00
3.00
4.00
5.00
6.00
Rec
ord
able
Inci
den
t R
ate
Yes No
1.76
5.72
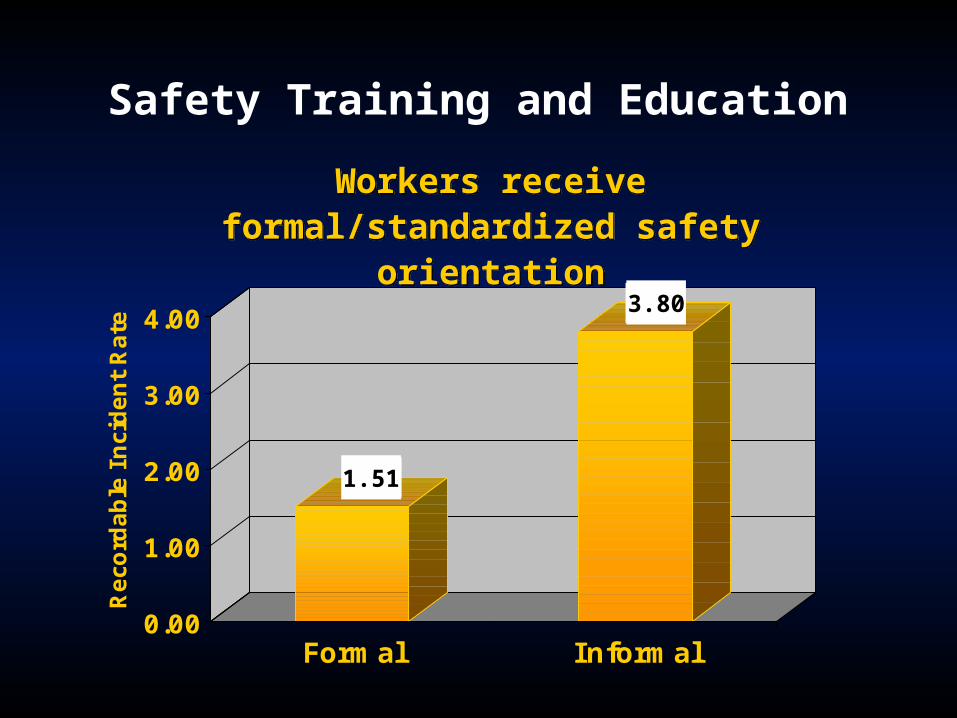
Safety Training and Education
Workers receive formal/standardized safety
orientation
Workers receive formal/standardized safety
orientation
1.51
3.80
0.00
1.00
2.00
3.00
4.00
Reco
rdable
Inci
dent
Rate
Formal Informal
1.51
3.80
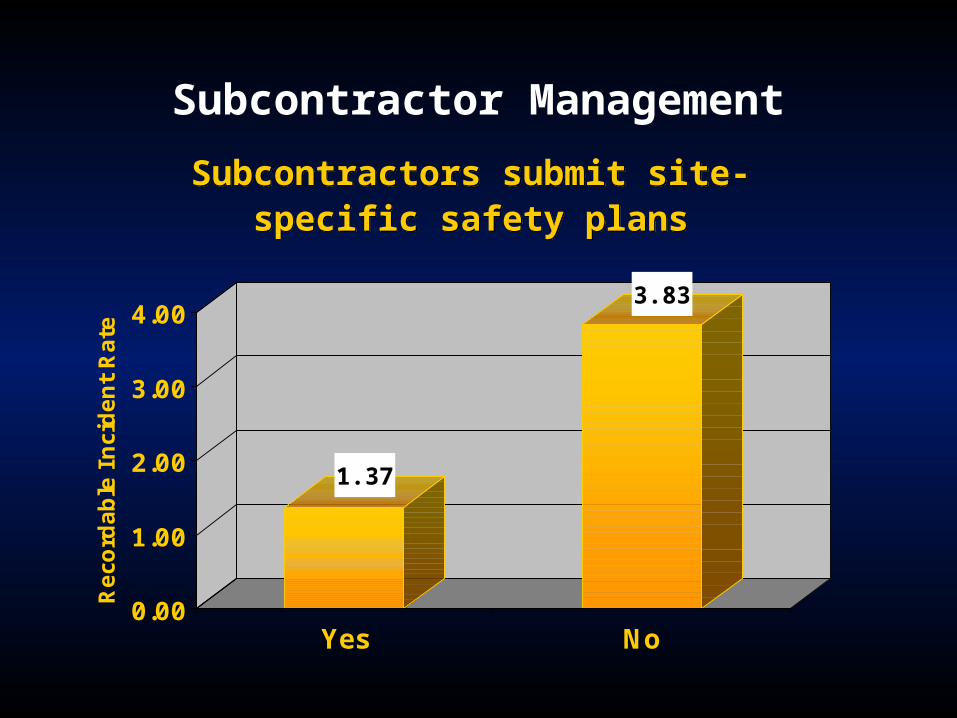
Subcontractor Management
Subcontractors submit site-specific safety plans
Subcontractors submit site-specific safety plans
1.37
3.83
0.00
1.00
2.00
3.00
4.00
Reco
rdable
Inci
dent
Rate
Yes No
1.37
3.83
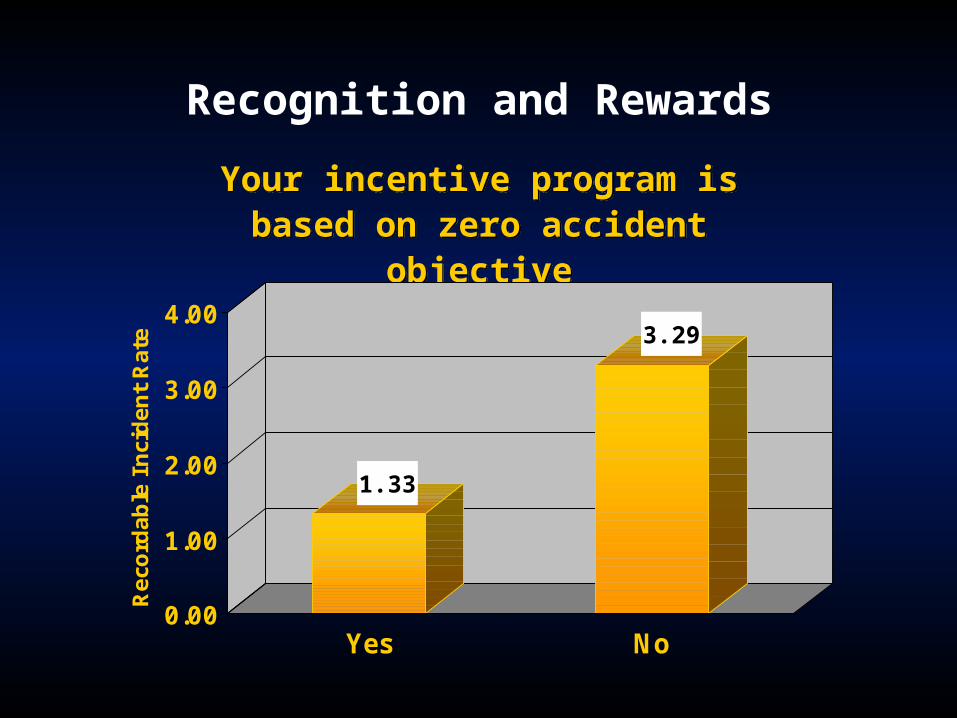
Recognition and Rewards
Your incentive program is based on zero accident
objective
Your incentive program is based on zero accident
objective
1.33
3.29
0.00
1.00
2.00
3.00
4.00
Rec
ord
able
Inci
den
t R
ate
Yes No
1.33
3.29
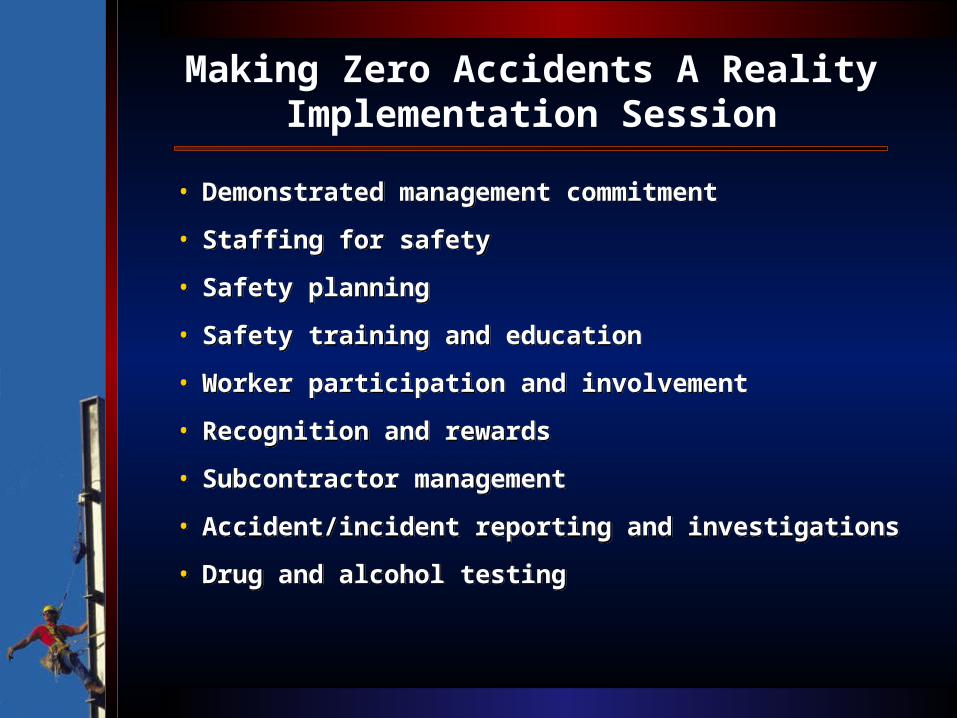
Making Zero Accidents A RealityImplementation Session
• Demonstrated management commitment
• Staffing for safety
• Safety planning
• Safety training and education
• Worker participation and involvement
• Recognition and rewards
• Subcontractor management
• Accident/incident reporting and investigations
• Drug and alcohol testing
• Demonstrated management commitment
• Staffing for safety
• Safety planning
• Safety training and education
• Worker participation and involvement
• Recognition and rewards
• Subcontractor management
• Accident/incident reporting and investigations
• Drug and alcohol testing
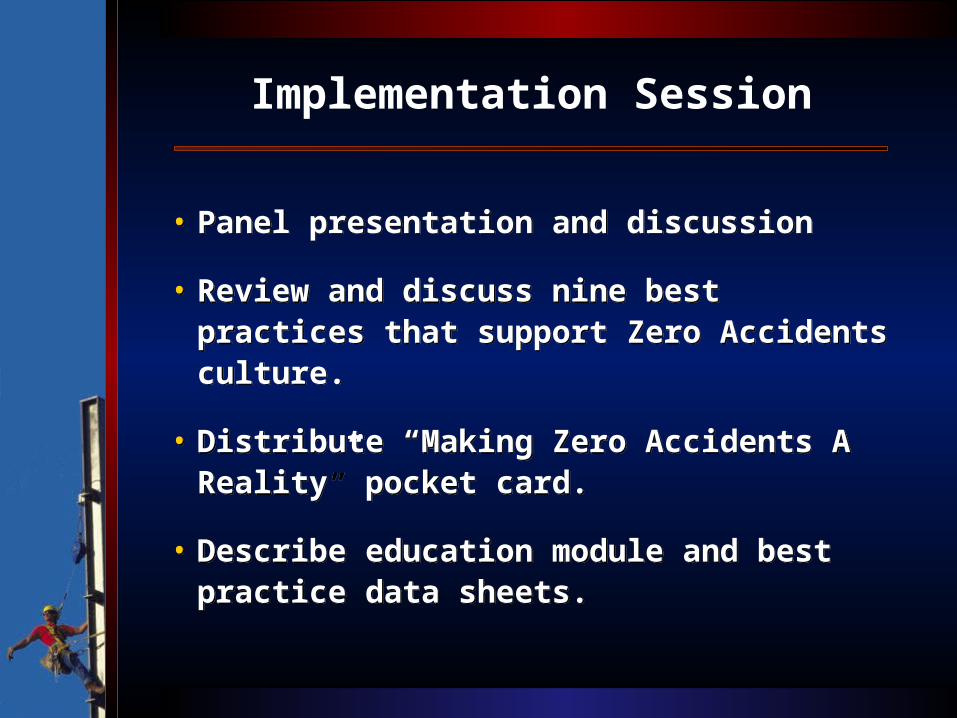
Implementation Session
• Panel presentation and discussion
• Review and discuss nine best practices that support Zero Accidents culture.
• Distribute “Making Zero Accidents A Reality” pocket card.
• Describe education module and best practice data sheets.
• Panel presentation and discussion
• Review and discuss nine best practices that support Zero Accidents culture.
• Distribute “Making Zero Accidents A Reality” pocket card.
• Describe education module and best practice data sheets.
0.00
1.00
2.00
3.00
4.00
Record
ab
le I
ncid
en
t R
ate
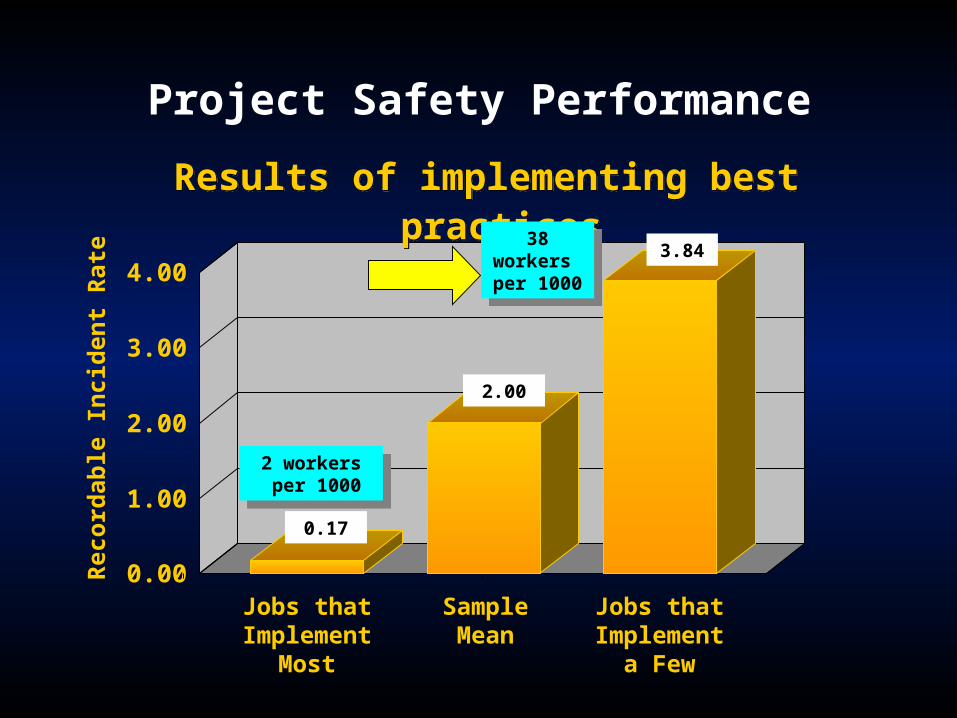
Project Safety Performance
Results of implementing best practices
Results of implementing best practices
2 workers per 1000
2 workers per 1000
Jobs thatImplemen
t a Few
Sample Mean
Jobs that Implement
Most
0.17
38 workers per 1000
38 workers per 1000
3.84
2.00
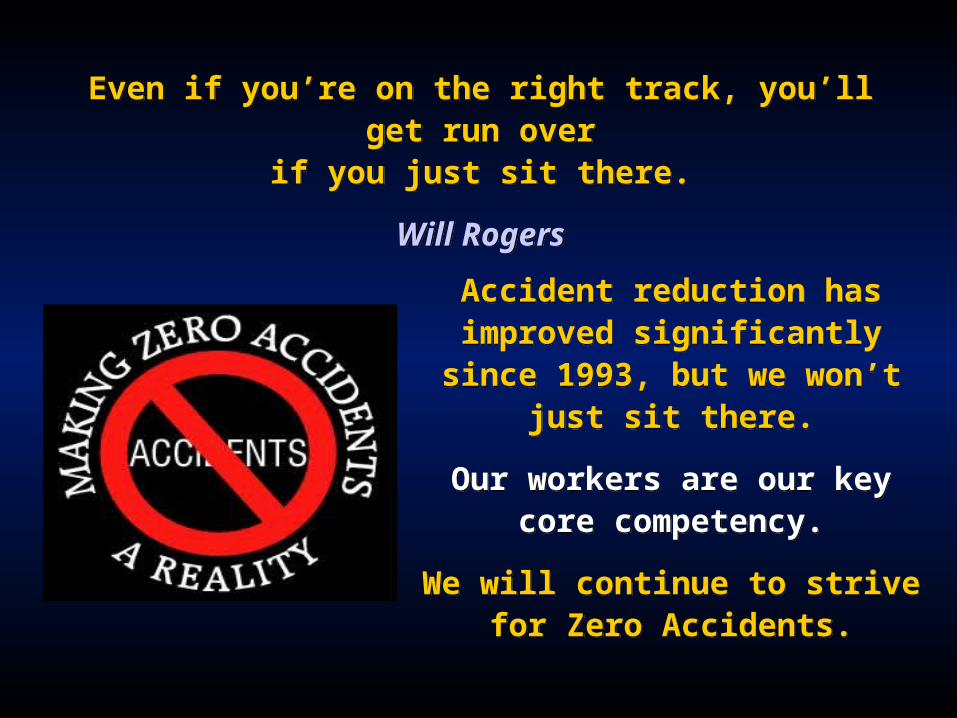
Accident reduction has improved significantly
since 1993, but we won’t just sit there.
Our workers are our key core competency.
We will continue to strive for Zero Accidents.
Accident reduction has improved significantly
since 1993, but we won’t just sit there.
Our workers are our key core competency.
We will continue to strive for Zero Accidents.
Even if you’re on the right track, you’ll get run over
if you just sit there.
Will Rogers
Even if you’re on the right track, you’ll get run over
if you just sit there.
Will Rogers
Construction Project Improvement Conference
Construction Industry Institute
Austin, Texas
2001: A Construction Odyssey
Trends and Perspectives
2001: A Construction Odyssey
Trends and Perspectives