Embed Size (px)
Citation preview
Journal of Fish Biology (2014) 85, 1927–1945
doi:10.1111/jfb.12543, available online at wileyonlinelibrary.com
REVIEW PAPER
Maladaptation and phenotypic mismatch in hatchery-rearedAtlantic salmon Salmo salar released in the wild
R. Stringwell*, A. Lock*, C. J. Stutchbury*, E. Baggett*, J. Taylor†,P. J. Gough† and C. Garcia de Leaniz*‡
*Swansea University, Centre for Sustainable Aquatic Research, Department of BioSciences,Swansea SA2 8PP, U.K. and †Natural Resources Wales, Cynrig Fish Culture Unit,
Llanfrynach, Powys LD3 7AQ, U.K.
Changes in body shape, fluctuating asymmetry (FA) and crypsis were compared among Atlanticsalmon Salmo salar fry kept as controls in captivity and those released and subsequently recapturedin the wild according to a before-after-control-impact (BACI) design. Hatchery fish that survived inthe wild became more cryptic and displayed a much lower incidence of fin erosion and of asymmetricindividuals than control fish kept in captivity. Significant differences in body shape were also apparent,and survivors had longer heads, thicker caudal peduncles and a more streamlined body shape thanhatchery controls as early as 20 days following stocking, most likely as a result of phenotypic plasticityand non-random, selective mortality of maladapted phenotypes. Hatchery-reared fish typically performpoorly in the wild and the results of this study indicate that this may be due to phenotypic mismatch,i.e. because hatcheries generate fish that are phenotypically mismatched to the natural environment.
© 2014 The Fisheries Society of the British Isles
Key words: domestication; feralization; hatcheries; phenotypic plasticity; selection; stocking.
INTRODUCTION
Stocking of hatchery-reared juveniles is a common practice in many salmonidconservation programmes. The phenotype of fish, however, can diverge greatly in cap-tivity, and this may affect post-release survival. The question remains about how longit takes for hatchery fish to adapt to the natural environment and for how long hatcherytraits persist in the wild. Rearing animals in captivity, free from predators and with aplentiful supply of food, tends to relax natural selection and this can generate individ-uals with extreme phenotypes that can persist under favourable conditions, but thatwould have otherwise perished in the wild (Trut et al., 2009). Indeed, as Darwin firstnoted (Darwin, 1875), one of the defining traits of domesticated organisms is that theytend to exhibit extreme morphological, behavioural and physiological traits rarely seenunder natural conditions (Balon, 2004; Teletchea & Fontaine, 2014). For example,hatchery-reared fish often display extreme growth rates (Saikkonen et al., 2011),
‡Author to whom correspondence should be addressed. Tel.: +44 (0) 1792 29 53 83; email:[email protected]
1927
© 2014 The Fisheries Society of the British Isles
1928 R . S T R I N G W E L L E T A L.
aggression levels (Blanchet et al., 2008), risk-taking behaviour (Roberts et al., 2011)and predator naïvety (Álvarez & Nicieza, 2003) rarely seen among wild fish. Suchphenotypic mismatch makes survival of hatchery-reared fish typically low in naturalstreams (Brown et al., 2003; Jokikokko et al., 2006), and this offers good opportunitiesfor understanding what makes a successful fish: individuals that survive under naturalconditions may be expected to be those that are able to adapt most rapidly, or thosethat resemble wild fish the most (Brown et al., 2003).
Studying adaptive responses in the wild is difficult because the capacity to manip-ulate phenotypic variation is typically limited (Endler, 1986). Hatcheries, however,can generate large numbers of individuals, some of which will have extreme pheno-types, and if these are released into the natural environment they will probably beexposed to the same selective pressures as wild fish. Thus, monitoring how hatcheryfish with contrasting phenotypes fare in the wild could shed light on the nature ofselective forces acting upon juvenile fish in general. Feralization, i.e. the adaptation ofcaptive-reared animals to natural conditions, may be expected to involve two differentprocesses: (1) selective mortality of maladapted phenotypes (Chittenden et al., 2010),and (2) phenotypic plasticity, i.e. the production of alternative phenotypes in responseto environmental change (West-Eberhard, 1989) though their relative roles remainunclear.
High phenotypic plasticity is common in many fish (Smith & Skúlason, 1996), andfor some migratory species such as Atlantic salmon Salmo salar L. 1758 plasticity isprobably the consequence of ontogenetic habitat shifts (Von Cramon-Taubadel et al.,2010), which serves to underline the important role that environmental variation hason levels of phenotypic variation of this and other salmonids (Garcia de Leaniz et al.,2007a, b). For example, body shape variation in juvenile salmonids can be substantialeven over small spatial scales, and this is thought to reflect adaptations to local hydro-logical conditions (Pakkasmaa & Piironen, 2001a; Solem & Berg, 2011; Drinan et al.,2012; Stelkens et al., 2012). Indeed, experimentally increasing water velocity tendsto produce more streamlined fish (Pakkasmaa & Piironen, 2001b). Studies of plas-ticity in fish have tended to examine phenotypic changes occurring during artificialrearing, and have compared the phenotype of wild and hatchery-reared fish (Kostow,2004; Von Cramon-Taubadel et al., 2010); studies addressing changes occurring duringadaptation to the natural environment are relatively recent (Rogell et al., 2012, 2013;Skaala et al., 2012). Comparisons between wild and hatchery fish can reveal divergenceowing to the effects of artificial selection and domestication (Fleming & Einum, 1997;Solem et al., 2006) but results are not always easy to interpret because variation inrearing conditions is typically confounded by maternal effects and genetic origin, andwhat is being compared are essentially different fish (Garcia de Leaniz et al., 2007b).To better understand the responses of fish to changes in rearing environment, a BACI(before-after-control-impact) design (Manly, 2001) is required, so that phenotypic vari-ation can be partitioned into effects due to the environment and effects due to ontogeny.With this approach, the same group of fish (from the same mothers) is compared beforeand after they are released into the wild, and the influence of natural v. artificial con-ditions can become clearer. Moreover, because survival in hatcheries is typically veryhigh, any phenotypic shifts will be mostly due to phenotypic plasticity, in contrast tonatural conditions where changes in trait means will probably be the result of both plas-ticity and non-random (selective) mortality of some phenotypes. Monitoring changesundergone by hatchery fish in captivity and in the wild, therefore, offers a powerful way
© 2014 The Fisheries Society of the British Isles, Journal of Fish Biology 2014, 85, 1927–1945
P H E N OT Y P I C M I S M AT C H I N S T O C K E D S A L M O S A L A R 1929
of examining the responses of fish to environmental variation because the differentialroles of selection and plasticity can be teased out.
In this study, first-generation hatchery-reared juvenile S. salar from a single popula-tion were released into four different river environments while a group was kept at thehatchery to serve as a control. Juveniles were then recaptured twice over their first sum-mer and screened at three phenotypic traits shown previously to be related to fitnessin salmonids: morphology (Garcia de Leaniz et al., 2007a, b), fluctuating asymme-try (FA; i.e. random deviations from perfect bilateral symmetry; Eriksen et al., 2008)and crypsis (Donnelly & Whoriskey, 1993; Culling et al., 2013). The expectation wasthat fish released in the wild and subjected to high mortality and large environmentalfluctuations would diverge more over time than those kept under more stable hatch-ery conditions, which would be affected mostly by phenotypic plasticity. It was alsoexpected that different river environments might select for different phenotypes.
MATERIALS AND METHODS
O R I G I N O F F I S H
Eighteen anadromous S. salar females (mean± s.d. fork length, LF, 71⋅3± 7⋅3 cm) werecrossed with 12 anadromous males (mean± s.d. LF 68⋅3± 11⋅0 cm) from the River Taff (SouthWales, U.K.) at the Natural Resources Wales, Cynrig Fish Culture Unit (Brecon, Wales) to pro-duce 36 families according to a 1:2 breeding design (whereby milt from a male was added tohalf the eggs from a female) on 12–19 December 2012. Eggs were incubated under standardhatchery conditions on a flow-through system at ambient temperature (mean± s.d. 5⋅83± 1⋅91∘C). Families were kept separated until first feeding (30 April 2013) and were then distributedevenly into six 2 m2 tanks (density c. 1⋅77 g l−1) and fed at 2⋅0–3⋅5% body mass day−1 undernatural photoperiod (52∘ N) until late June 2013.
E X P E R I M E N TA L R E L E A S E S
On 25 June 2013, S. salar 0+ fry were accurately hand counted into four groups of 15 000 fisheach and transferred into four separate tanks (one per stocking site) to produce 60 000 fish intotal. Fish were released along 50 m sections of four first-order stream sites on the headwaters ofthe River Taff between 27 June and 1 July. Experimental release sites were selected based on theabsence of S. salar spawning owing to impassable barriers and their location along an altitudinalgradient (from 280 to 153 m above sea level) to maximize environmental variation: RhonddaFach at Maerdy, River Clydach at St Gwyno Forest, River Dare at Aberdare and River Cynon atPenderyn (Table I). At each site, pH, water temperature (∘C), river width (m), water depth (cm),dominant substratum diameter (mm), water velocity (cm s−1) and extent of vegetation cover (%)were recorded along three evenly spaced transects, one at the downstream end, one midstreamand one at the upstream end. Sightings (or markings) of three common fish predators (grey heronArdea cinerea, common kingfisher Alcedo atthis and Eurasian otter Lutra lutra) were also notedat the time of stocking and at each recapture time to provide an index of predation pressure. Asa control group, 300 fish from the same batch of fish were brought to a recirculation system atSwansea University on the day of stocking (time 0), where they were kept under standard hatch-ery conditions in three 0⋅65 m diameter× 0⋅85 m depth circular tanks (stocking density∼ 0⋅22g l−1) and fed 2⋅5% body mass day−1 on commercial fish food under a 14L:10D photoperiod.
R E C A P T U R E O F S T O C K E D F I S H I N T H E F I E L D
At each of the four stocking sites, fish were sampled along 6× 50 m stations (distributed evenlythroughout the whole length of the site) using semi-quantitative point electrofishing carried out
© 2014 The Fisheries Society of the British Isles, Journal of Fish Biology 2014, 85, 1927–1945
1930 R . S T R I N G W E L L E T A L.
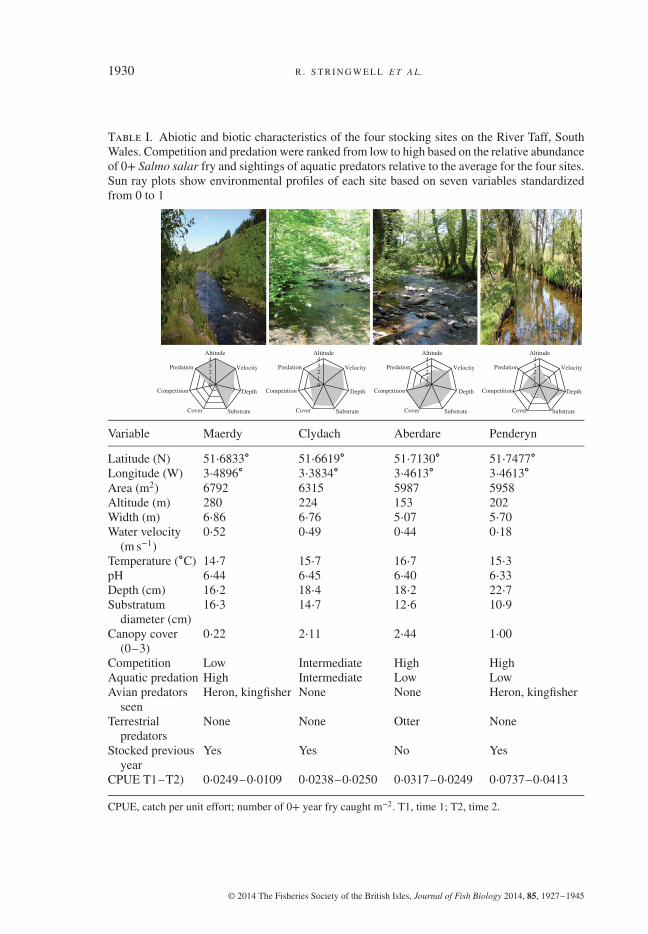
Table I. Abiotic and biotic characteristics of the four stocking sites on the River Taff, SouthWales. Competition and predation were ranked from low to high based on the relative abundanceof 0+ Salmo salar fry and sightings of aquatic predators relative to the average for the four sites.Sun ray plots show environmental profiles of each site based on seven variables standardizedfrom 0 to 1
Cover Substrate
Depth
Velocity
Altitude
Predation
Competition
43210
Cover Substrate
Depth
Velocity
Altitude
Predation
Competition
43210
Cover Substrate
Depth
Velocity
Altitude
Predation
Competition
43210
Cover Substrate
Depth
Velocity
Altitude
Predation
Competition
43210
Variable Maerdy Clydach Aberdare Penderyn
Latitude (N) 51⋅6833∘ 51⋅6619∘ 51⋅7130∘ 51⋅7477∘Longitude (W) 3⋅4896∘ 3⋅3834∘ 3⋅4613∘ 3⋅4613∘Area (m2) 6792 6315 5987 5958Altitude (m) 280 224 153 202Width (m) 6⋅86 6⋅76 5⋅07 5⋅70Water velocity
(m s−1)0⋅52 0⋅49 0⋅44 0⋅18
Temperature (∘C) 14⋅7 15⋅7 16⋅7 15⋅3pH 6⋅44 6⋅45 6⋅40 6⋅33Depth (cm) 16⋅2 18⋅4 18⋅2 22⋅7Substratum
diameter (cm)16⋅3 14⋅7 12⋅6 10⋅9
Canopy cover(0–3)
0⋅22 2⋅11 2⋅44 1⋅00
Competition Low Intermediate High HighAquatic predation High Intermediate Low LowAvian predators
seenHeron, kingfisher None None Heron, kingfisher
Terrestrialpredators
None None Otter None
Stocked previousyear
Yes Yes No Yes
CPUE T1–T2) 0⋅0249–0⋅0109 0⋅0238–0⋅0250 0⋅0317–0⋅0249 0⋅0737–0⋅0413
CPUE, catch per unit effort; number of 0+ year fry caught m−2. T1, time 1; T2, time 2.
© 2014 The Fisheries Society of the British Isles, Journal of Fish Biology 2014, 85, 1927–1945
P H E N OT Y P I C M I S M AT C H I N S T O C K E D S A L M O S A L A R 1931
Time 1 (20 days)Time 0 Time 2 (55 days)
Site 1
Site 2
Site 3
Site 4
Site 1
Site 2
Site 3
Site 4
Site 1
Site 2
Site 3
Site 4
Control
Impact
Before After
Hatchery Hatchery Hatchery
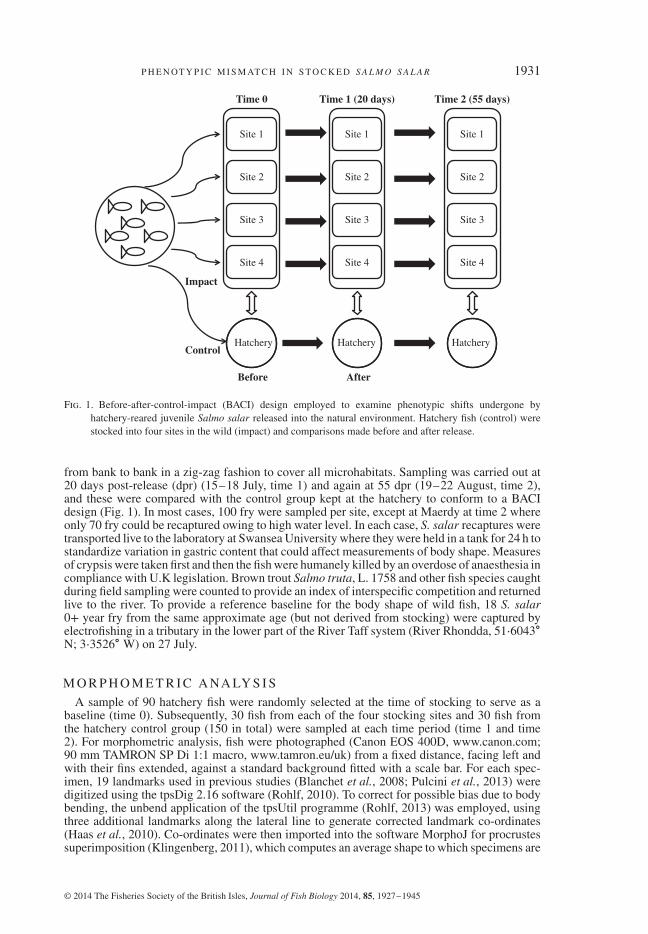
Fig. 1. Before-after-control-impact (BACI) design employed to examine phenotypic shifts undergone byhatchery-reared juvenile Salmo salar released into the natural environment. Hatchery fish (control) werestocked into four sites in the wild (impact) and comparisons made before and after release.
from bank to bank in a zig-zag fashion to cover all microhabitats. Sampling was carried out at20 days post-release (dpr) (15–18 July, time 1) and again at 55 dpr (19–22 August, time 2),and these were compared with the control group kept at the hatchery to conform to a BACIdesign (Fig. 1). In most cases, 100 fry were sampled per site, except at Maerdy at time 2 whereonly 70 fry could be recaptured owing to high water level. In each case, S. salar recaptures weretransported live to the laboratory at Swansea University where they were held in a tank for 24 h tostandardize variation in gastric content that could affect measurements of body shape. Measuresof crypsis were taken first and then the fish were humanely killed by an overdose of anaesthesia incompliance with U.K legislation. Brown trout Salmo truta, L. 1758 and other fish species caughtduring field sampling were counted to provide an index of interspecific competition and returnedlive to the river. To provide a reference baseline for the body shape of wild fish, 18 S. salar0+ year fry from the same approximate age (but not derived from stocking) were captured byelectrofishing in a tributary in the lower part of the River Taff system (River Rhondda, 51⋅6043∘N; 3⋅3526∘ W) on 27 July.
M O R P H O M E T R I C A NA LY S I S
A sample of 90 hatchery fish were randomly selected at the time of stocking to serve as abaseline (time 0). Subsequently, 30 fish from each of the four stocking sites and 30 fish fromthe hatchery control group (150 in total) were sampled at each time period (time 1 and time2). For morphometric analysis, fish were photographed (Canon EOS 400D, www.canon.com;90 mm TAMRON SP Di 1:1 macro, www.tamron.eu/uk) from a fixed distance, facing left andwith their fins extended, against a standard background fitted with a scale bar. For each spec-imen, 19 landmarks used in previous studies (Blanchet et al., 2008; Pulcini et al., 2013) weredigitized using the tpsDig 2.16 software (Rohlf, 2010). To correct for possible bias due to bodybending, the unbend application of the tpsUtil programme (Rohlf, 2013) was employed, usingthree additional landmarks along the lateral line to generate corrected landmark co-ordinates(Haas et al., 2010). Co-ordinates were then imported into the software MorphoJ for procrustessuperimposition (Klingenberg, 2011), which computes an average shape to which specimens are
© 2014 The Fisheries Society of the British Isles, Journal of Fish Biology 2014, 85, 1927–1945
1932 R . S T R I N G W E L L E T A L.
aligned in order to remove the effect of size from the study of morphological variation (Vehanen& Huusko, 2011).
Principal component analysis (PCA) was carried out on the covariance matrix followed byseparate two-way ANOVA on the first two PCA scores to assess the effects of rearing envi-ronment (field v. hatchery control) and time on the major features of body shape variation.Phenotypic trajectories of hatchery controls and fish recaptured in the wild were generated bycalculating temporal changes in mean PC1 and PC2 along with their 95% c.i. (Adams & Col-lyer, 2009). Following PCA, discriminant function analysis (DFA) was carried out to quantifythe ability to discriminate between hatchery controls and field recaptures at each time point;cross-classification reliability was assessed by using the leave-one-out procedure, and visualizedby plots of canonical variate scores at each site and time period.
To assess variation in pectoral-fin length, pectoral fins were digitized separately using ImageJ(Abràmoff et al., 2004) and analysed via ANCOVA with LF as a covariate in log10-transformedvalues. Opercular and caudal-fin erosion were visually assessed on a scale from 0 (no erosion)to 3 (completely eroded) according to Roberts et al. (2011), and comparisons assessed via theMann–Whitney or Kruskal–Wallis tests. The observer was blind to the origin of fish when scor-ing erosion levels, which have been found to be highly repeatable (Hoyle et al., 2007). Statisticalanalyses were carried in R 3.0.0 (www.r-project.org).
VA R I AT I O N I N C RY P S I S
To quantify variation in crypsis, fish were first placed in individual 25 l white buckets filled toc. 10 cm with aerated water and covered with a lid. After 10 min in the white bucket, a photograph(white photo) was taken of each fish against a standard, low-reflectance grey background fittedwith a Tiffen Q-13 colour separation guide (www.tiffen.com) and a scale bar, using the samecamera and settings as for the morphometric measurements described above. Fry were thentransferred to 25 l aerated black buckets, held for another 10 min, and a second photograph (blackphoto) taken as above. Reflectance values were obtained from each pair of fish photographs(white v. black) along three points on each of the three central parr marks of the fish and theircorresponding flanks using ImageJ, following the procedure described in Culling et al. (2013).Grey-scale calibration was achieved by taking three readings from the white and black TiffenQ-13 reference colours, and these were then used to derive standardized reflectance values foreach fish. Parr mark contrast was defined as the difference between the readings on the parrmarks and the flanks, and a crypsis index was calculated as the difference in parr mark contrastbetween the black and the white photographs taken on the same fish. Two-way ANOVA wasused to test for variation in crypsis index and parr-mark contrast with sampling period and fishorigin as fixed factors; for parr-mark contrast separate tests were carried out for photographsagainst white and black backgrounds to avoid pseudoreplication.
F L U C T UAT I N G A S Y M M E T RY
FA was assessed in relation to three bilateral meristic structures fixed in formaldehyde andviewed under an Olympus SZ40 stereo microscope (www.olympus.co.uk) at ×4 magnification:(1) number of gill rakers in the upper and lower sections of the first gill arch, (2) number ofrays in the pectoral fins and (3) number of rays in the pelvic fins. Fin-ray counts were recordeddisregarding any branching, scoring only the base of each ray. To test the reliability of the FAscoring, 30 fish were selected with the help of random number generator and meristic countson each structure were carried out twice in a blind fashion. Repeatability was calculated as theagreement intraclass correlation coefficient (ICC) with the ‘psy’ R-package, defined as the ratioof the subject variance divided by the sum of the subject variance, the observer variance andthe residual variance (Wolak et al., 2012). The proportion of asymmetric individuals for at leastone trait was analysed in relation to sampling period and origin of fish as fixed factors by ageneralized linear model with a binomial or quasibinomial error structure using R 3.0.0 as byCrawley (2007). The apparent relative mortality of asymmetrical fish in the wild was determinedby calculating the proportion of asymmetrical fish that must have died (or emigrated) from thepopulation compared with symmetrical fish that was taken as a baseline equal to one.
© 2014 The Fisheries Society of the British Isles, Journal of Fish Biology 2014, 85, 1927–1945
P H E N OT Y P I C M I S M AT C H I N S T O C K E D S A L M O S A L A R 1933
RESULTS
P H E N OT Y P I C T R A J E C T O R I E S A N D B O DY S H A P ED I V E R G E N C E
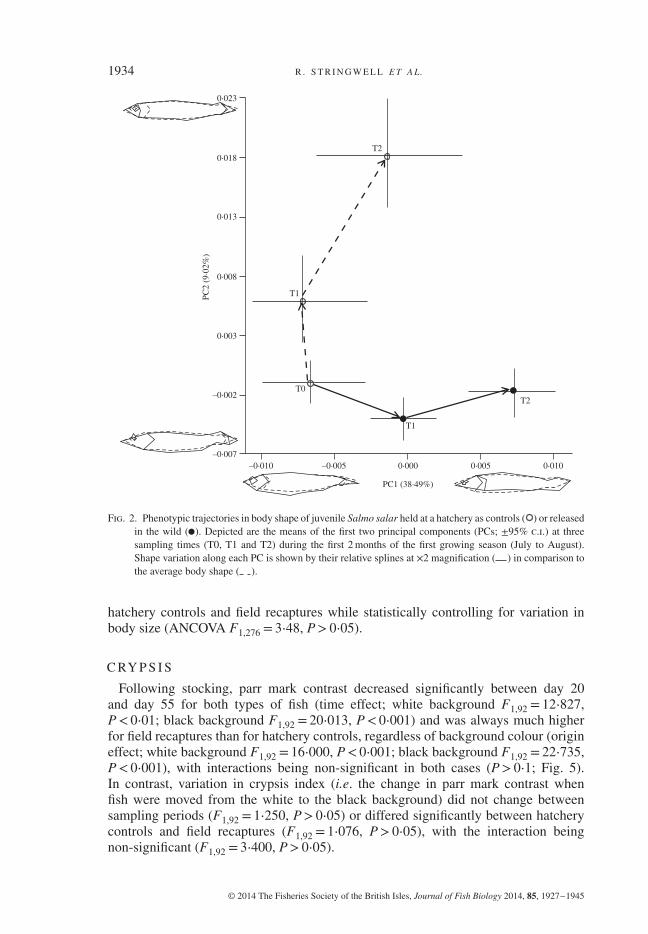
Analysis of phenotypic trajectories via PCA plots revealed a marked effect of rearingenvironment on the body shape of juvenile S. salar, resulting in increasing phenotypicdivergence of fish in the wild compared with control fish held at the hatchery (Fig. 2).Ontogenetic changes in body shape in the hatchery environment occur mostly alongPC2 and result in fish with shorter heads and deeper bodies, whereas changes inbody shape in the natural environment occur mostly along PC1 and result in fishwith more streamlined bodies and thicker caudal peduncles. Results of ANOVAon PC scores confirm that body shape changes significantly with both time (PC1,F1,333 = 21⋅51, P< 0⋅001; PC2, F1,333 = 18⋅82, P< 0⋅001) and rearing environment(PC1, F1⋅333 = 23⋅19, P< 0⋅001; PC2, F1,333 = 63⋅78, P< 0⋅001); a significant time ×rearing environment interaction was found for PC2 (F1,333 = 22⋅87, P< 0⋅001) but notfor PC1 (F1,333 = 1⋅29, P> 0⋅05).
B O DY S H A P E D I S C R I M I NAT I O N
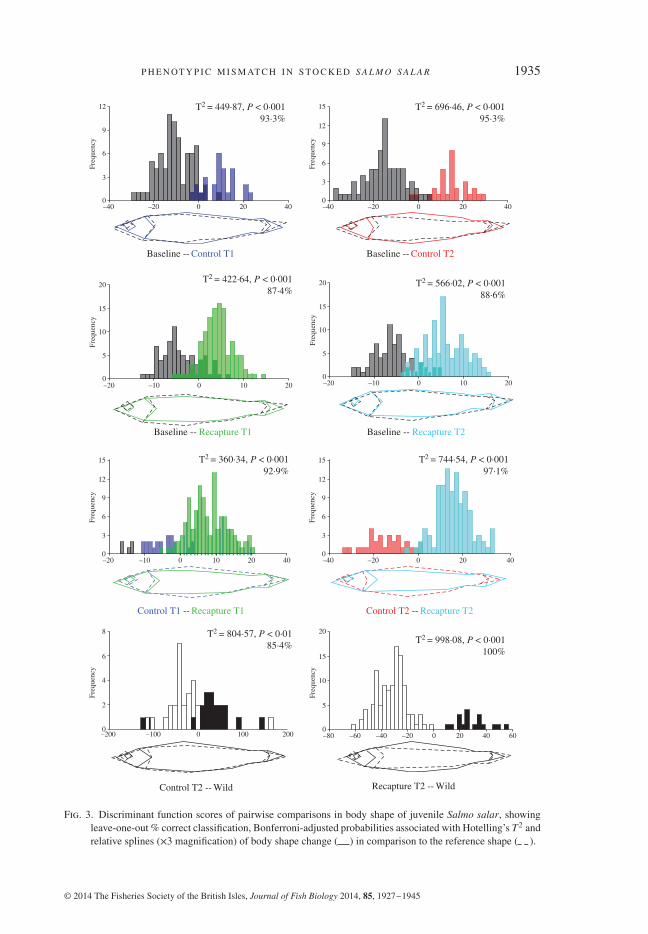
Results of DFA are highly significant for all pairwise body-shape comparisons(Fig. 3), and reveal a high discrimination in body shape between hatchery controls andfield recaptures (93–97%), as well as between fish sampled at different time periods(87–95%), confirming the results of PC ANOVA. DFA comparisons also indicate thatdifferences in body shape provide good discrimination not only between hatcherycontrols and wild fish (84%, Hotelling’s T2 = 805⋅6, P< 0⋅001) but also between wildand stocked fish (100%, Hotelling’s T2 = 998⋅01, P< 0⋅001). In general, comparedto initial baseline values at stocking time, fish kept in the hatchery develop deeperbodies, shorter heads and shorter caudal peduncles over time, whereas almost exactlythe opposite occurs when they are released in the wild.
VA R I AT I O N I N B O DY S H A P E A M O N G R E L E A S E S I T E S
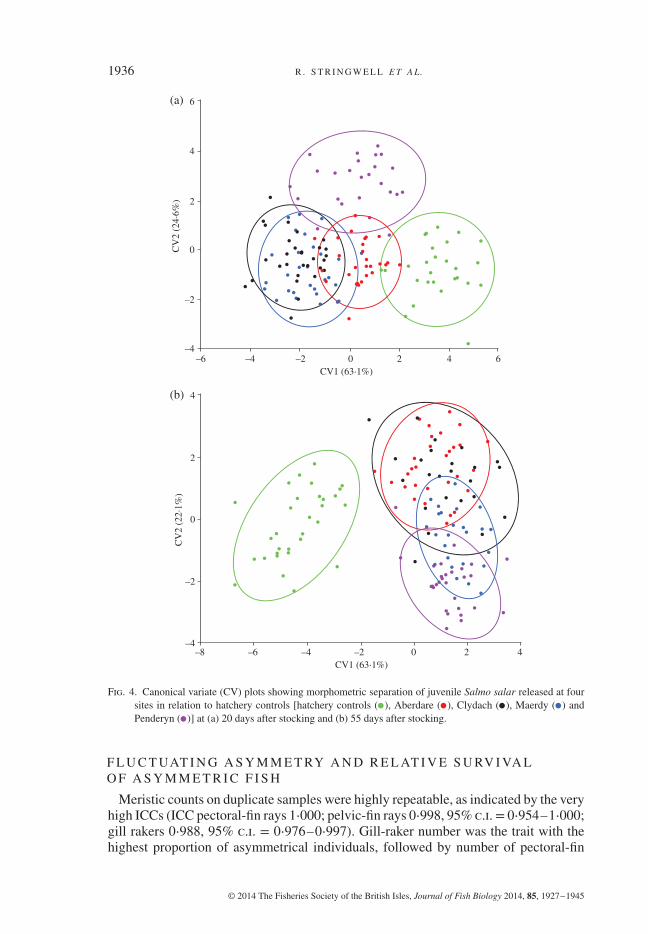
Plots of the first two canonical variate scores (CV1–CV2) clearly separate hatcheryfish from fish released in the wild and, to a lesser extent, also serve to identify fishrecaptured in different field sites on the basis of their body shape (Fig. 4). All pairwiseDFA comparisons of body shape were significantly different among release sites atP< 0⋅01, except between Maerdy and Clydach (first recapture T1, P> 0⋅05; secondrecapture T2, P> 0⋅05), with fish stocked in the River Cynon at Penderyn being theones most different from the rest (Fig. 4).
F I N A N D O P E R C U L A E RO S I O N
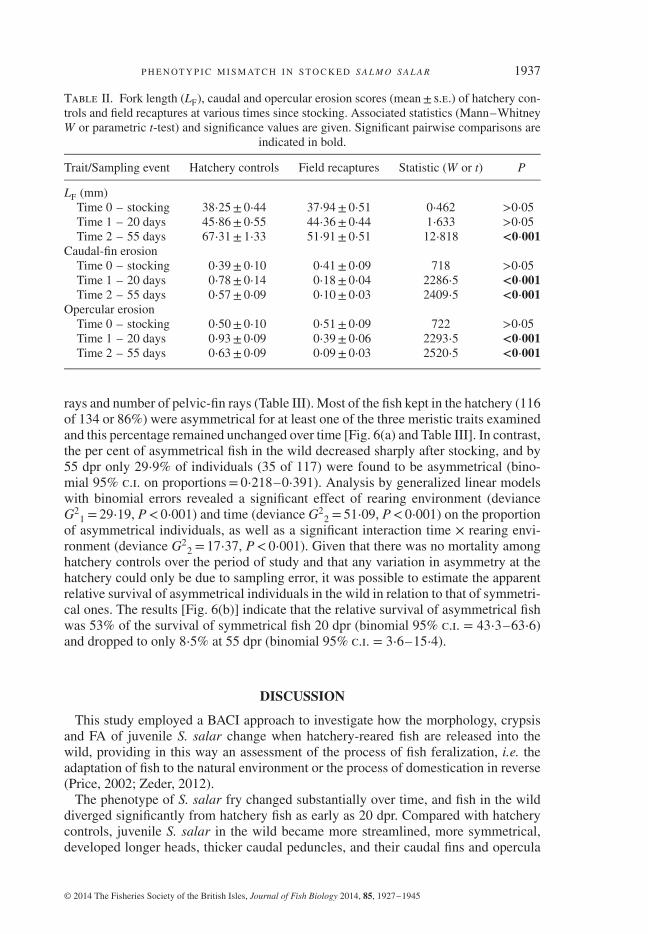
Compared with hatchery controls, fish recaptured in the wild had significantly lesserosion in the caudal fin (Mann–Whiney, P< 0⋅001) and the operculum (P< 0⋅001)on both sampling occasions (Table II). Also, unlike in the hatchery, where fish showedno change in caudal-fin erosion (P> 0⋅05) or even increased their opercular erosion(P> 0⋅01), erosion among stocked fish decreased significantly with time spent in thewild (P< 0⋅001). The length of the pectoral fins did not differ significantly between
© 2014 The Fisheries Society of the British Isles, Journal of Fish Biology 2014, 85, 1927–1945
1934 R . S T R I N G W E L L E T A L.
–0·005 0·000
PC1 (38·49%)
0·005
T2
T1
T0
T1
T2
0·010–0·010–0·007
–0·002
0·003
0·008
PC2
(9·0
2%)
0·013
0·018
0·023
Fig. 2. Phenotypic trajectories in body shape of juvenile Salmo salar held at a hatchery as controls ( ) or releasedin the wild ( ). Depicted are the means of the first two principal components (PCs; ±95% c.i.) at threesampling times (T0, T1 and T2) during the first 2 months of the first growing season (July to August).Shape variation along each PC is shown by their relative splines at ×2 magnification ( ) in comparison tothe average body shape ( ).
hatchery controls and field recaptures while statistically controlling for variation inbody size (ANCOVA F1,276 = 3⋅48, P> 0⋅05).
C RY P S I S
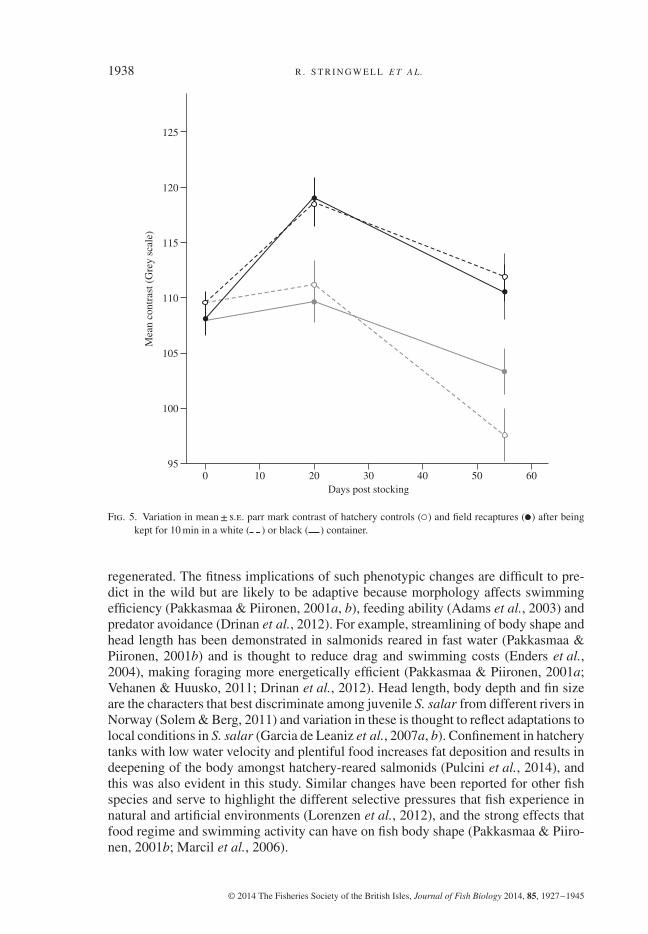
Following stocking, parr mark contrast decreased significantly between day 20and day 55 for both types of fish (time effect; white background F1,92 = 12⋅827,P< 0⋅01; black background F1,92 = 20⋅013, P< 0⋅001) and was always much higherfor field recaptures than for hatchery controls, regardless of background colour (origineffect; white background F1,92 = 16⋅000, P< 0⋅001; black background F1,92 = 22⋅735,P< 0⋅001), with interactions being non-significant in both cases (P> 0⋅1; Fig. 5).In contrast, variation in crypsis index (i.e. the change in parr mark contrast whenfish were moved from the white to the black background) did not change betweensampling periods (F1,92 = 1⋅250, P> 0⋅05) or differed significantly between hatcherycontrols and field recaptures (F1,92 = 1⋅076, P> 0⋅05), with the interaction beingnon-significant (F1,92 = 3⋅400, P> 0⋅05).
© 2014 The Fisheries Society of the British Isles, Journal of Fish Biology 2014, 85, 1927–1945
P H E N OT Y P I C M I S M AT C H I N S T O C K E D S A L M O S A L A R 1935
–400
3
6
9
12
Freque
ncy
–20 0 20 40
Baseline --
T2 = 449·87, P < 0·00193·3%
Control T1
–400
3
6
12
15
Freque
ncy
–20 0 20 40
Baseline --
T2 = 696·46, P < 0·00195·3%
Control T2
9
Baseline --
T2 = 422·64, P < 0·00187·4%
Recapture T1
–200
5
10
20
Freque
ncy
–10 0 10 20–20 –10 0 10 20
Baseline --
T2 = 566·02, P < 0·00188·6%
Recapture T2
15
0
5
10
20
Freque
ncy
15
–200
3
6
9
15
Freque
ncy
–10 0 20 40
Control T1 --
T2 = 360·34, P < 0·00192·9%
Recapture T1
10
12
–400
3
6
12
15
Freque
ncy
–20 0 20 40
Control T2 --
T2 = 744·54, P < 0·00197·1%
Recapture T2
9
T2 = 804·57, P < 0·0185·4%
–800
5
10
20
Freque
ncy
–60 0 20 40 60
Recapture T2 --
T2 = 998·08, P < 0·001100%
WildControl T2 --Wild
–40 –20
15
–2000
2
4
8
Freque
ncy
–100 0 100 200
6
Fig. 3. Discriminant function scores of pairwise comparisons in body shape of juvenile Salmo salar, showingleave-one-out % correct classification, Bonferroni-adjusted probabilities associated with Hotelling’s T2 andrelative splines (×3 magnification) of body shape change ( ) in comparison to the reference shape ( ).
© 2014 The Fisheries Society of the British Isles, Journal of Fish Biology 2014, 85, 1927–1945
1936 R . S T R I N G W E L L E T A L.
–8–4
–2
0
CV
2 (2
2·1%
)
2
4(b)
–6 –4 –2 0CV1 (63·1%)
2 4
–6–4
–2
0CV
2 (2
4·6%
) 2
4
6(a)
–4 –2 0 2CV1 (63·1%)
4 6
Fig. 4. Canonical variate (CV) plots showing morphometric separation of juvenile Salmo salar released at foursites in relation to hatchery controls [hatchery controls ( ), Aberdare ( ), Clydach ( ), Maerdy ( ) andPenderyn ( )] at (a) 20 days after stocking and (b) 55 days after stocking.
F L U C T UAT I N G A S Y M M E T RY A N D R E L AT I V E S U RV I VA LO F A S Y M M E T R I C F I S H
Meristic counts on duplicate samples were highly repeatable, as indicated by the veryhigh ICCs (ICC pectoral-fin rays 1⋅000; pelvic-fin rays 0⋅998, 95% c.i.= 0⋅954–1⋅000;gill rakers 0⋅988, 95% c.i. = 0⋅976–0⋅997). Gill-raker number was the trait with thehighest proportion of asymmetrical individuals, followed by number of pectoral-fin
© 2014 The Fisheries Society of the British Isles, Journal of Fish Biology 2014, 85, 1927–1945
P H E N OT Y P I C M I S M AT C H I N S T O C K E D S A L M O S A L A R 1937
Table II. Fork length (LF), caudal and opercular erosion scores (mean± s.e.) of hatchery con-trols and field recaptures at various times since stocking. Associated statistics (Mann–WhitneyW or parametric t-test) and significance values are given. Significant pairwise comparisons are
indicated in bold.
Trait/Sampling event Hatchery controls Field recaptures Statistic (W or t) P
LF (mm)Time 0 – stocking 38⋅25± 0⋅44 37⋅94± 0⋅51 0⋅462 >0⋅05Time 1 – 20 days 45⋅86± 0⋅55 44⋅36± 0⋅44 1⋅633 >0⋅05Time 2 – 55 days 67⋅31± 1⋅33 51⋅91± 0⋅51 12⋅818 <0⋅001
Caudal-fin erosionTime 0 – stocking 0⋅39± 0⋅10 0⋅41± 0⋅09 718 >0⋅05Time 1 – 20 days 0⋅78± 0⋅14 0⋅18± 0⋅04 2286⋅5 <0⋅001Time 2 – 55 days 0⋅57± 0⋅09 0⋅10± 0⋅03 2409⋅5 <0⋅001
Opercular erosionTime 0 – stocking 0⋅50± 0⋅10 0⋅51± 0⋅09 722 >0⋅05Time 1 – 20 days 0⋅93± 0⋅09 0⋅39± 0⋅06 2293⋅5 <0⋅001Time 2 – 55 days 0⋅63± 0⋅09 0⋅09± 0⋅03 2520⋅5 <0⋅001
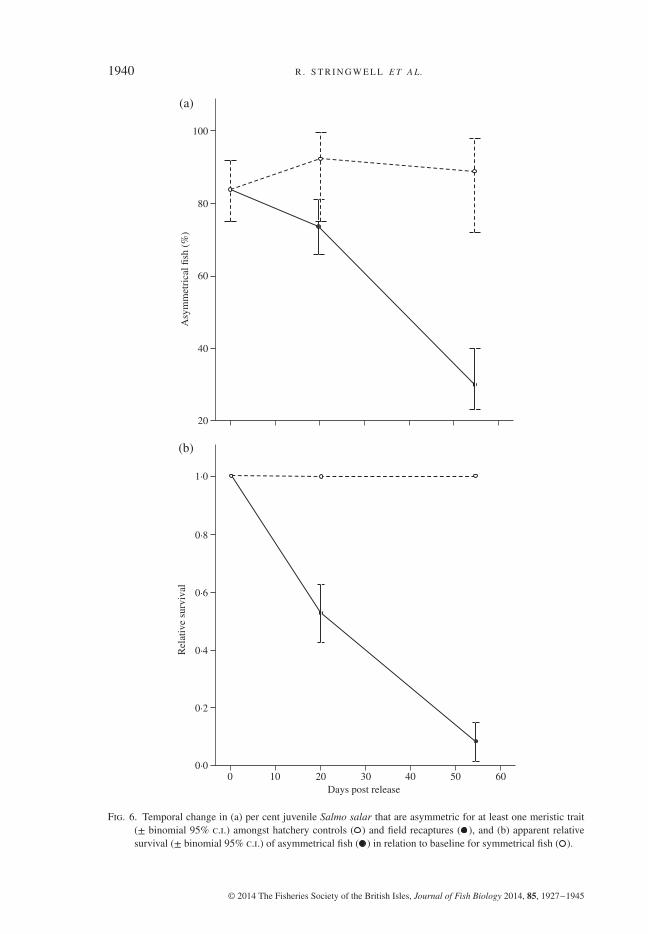
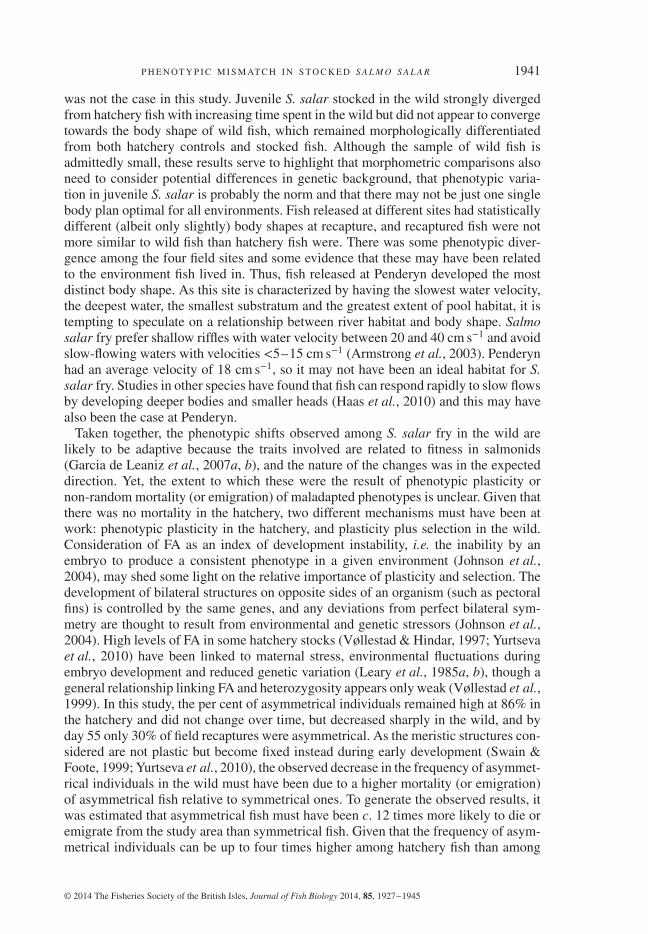
rays and number of pelvic-fin rays (Table III). Most of the fish kept in the hatchery (116of 134 or 86%) were asymmetrical for at least one of the three meristic traits examinedand this percentage remained unchanged over time [Fig. 6(a) and Table III]. In contrast,the per cent of asymmetrical fish in the wild decreased sharply after stocking, and by55 dpr only 29⋅9% of individuals (35 of 117) were found to be asymmetrical (bino-mial 95% c.i. on proportions= 0⋅218–0⋅391). Analysis by generalized linear modelswith binomial errors revealed a significant effect of rearing environment (devianceG2
1 = 29⋅19, P< 0⋅001) and time (deviance G22 = 51⋅09, P< 0⋅001) on the proportion
of asymmetrical individuals, as well as a significant interaction time × rearing envi-ronment (deviance G2
2 = 17⋅37, P< 0⋅001). Given that there was no mortality amonghatchery controls over the period of study and that any variation in asymmetry at thehatchery could only be due to sampling error, it was possible to estimate the apparentrelative survival of asymmetrical individuals in the wild in relation to that of symmetri-cal ones. The results [Fig. 6(b)] indicate that the relative survival of asymmetrical fishwas 53% of the survival of symmetrical fish 20 dpr (binomial 95% c.i. = 43⋅3–63⋅6)and dropped to only 8⋅5% at 55 dpr (binomial 95% c.i. = 3⋅6–15⋅4).
DISCUSSION
This study employed a BACI approach to investigate how the morphology, crypsisand FA of juvenile S. salar change when hatchery-reared fish are released into thewild, providing in this way an assessment of the process of fish feralization, i.e. theadaptation of fish to the natural environment or the process of domestication in reverse(Price, 2002; Zeder, 2012).
The phenotype of S. salar fry changed substantially over time, and fish in the wilddiverged significantly from hatchery fish as early as 20 dpr. Compared with hatcherycontrols, juvenile S. salar in the wild became more streamlined, more symmetrical,developed longer heads, thicker caudal peduncles, and their caudal fins and opercula
© 2014 The Fisheries Society of the British Isles, Journal of Fish Biology 2014, 85, 1927–1945
1938 R . S T R I N G W E L L E T A L.
095
100
105
110
Mea
n co
ntrast
(G
rey sc
ale)
115
120
125
10 20 30Days post stocking
40 50 60
Fig. 5. Variation in mean± s.e. parr mark contrast of hatchery controls ( ) and field recaptures ( ) after beingkept for 10 min in a white ( ) or black ( ) container.
regenerated. The fitness implications of such phenotypic changes are difficult to pre-dict in the wild but are likely to be adaptive because morphology affects swimmingefficiency (Pakkasmaa & Piironen, 2001a, b), feeding ability (Adams et al., 2003) andpredator avoidance (Drinan et al., 2012). For example, streamlining of body shape andhead length has been demonstrated in salmonids reared in fast water (Pakkasmaa &Piironen, 2001b) and is thought to reduce drag and swimming costs (Enders et al.,2004), making foraging more energetically efficient (Pakkasmaa & Piironen, 2001a;Vehanen & Huusko, 2011; Drinan et al., 2012). Head length, body depth and fin sizeare the characters that best discriminate among juvenile S. salar from different rivers inNorway (Solem & Berg, 2011) and variation in these is thought to reflect adaptations tolocal conditions in S. salar (Garcia de Leaniz et al., 2007a, b). Confinement in hatcherytanks with low water velocity and plentiful food increases fat deposition and results indeepening of the body amongst hatchery-reared salmonids (Pulcini et al., 2014), andthis was also evident in this study. Similar changes have been reported for other fishspecies and serve to highlight the different selective pressures that fish experience innatural and artificial environments (Lorenzen et al., 2012), and the strong effects thatfood regime and swimming activity can have on fish body shape (Pakkasmaa & Piiro-nen, 2001b; Marcil et al., 2006).
© 2014 The Fisheries Society of the British Isles, Journal of Fish Biology 2014, 85, 1927–1945
P H E N OT Y P I C M I S M AT C H I N S T O C K E D S A L M O S A L A R 1939
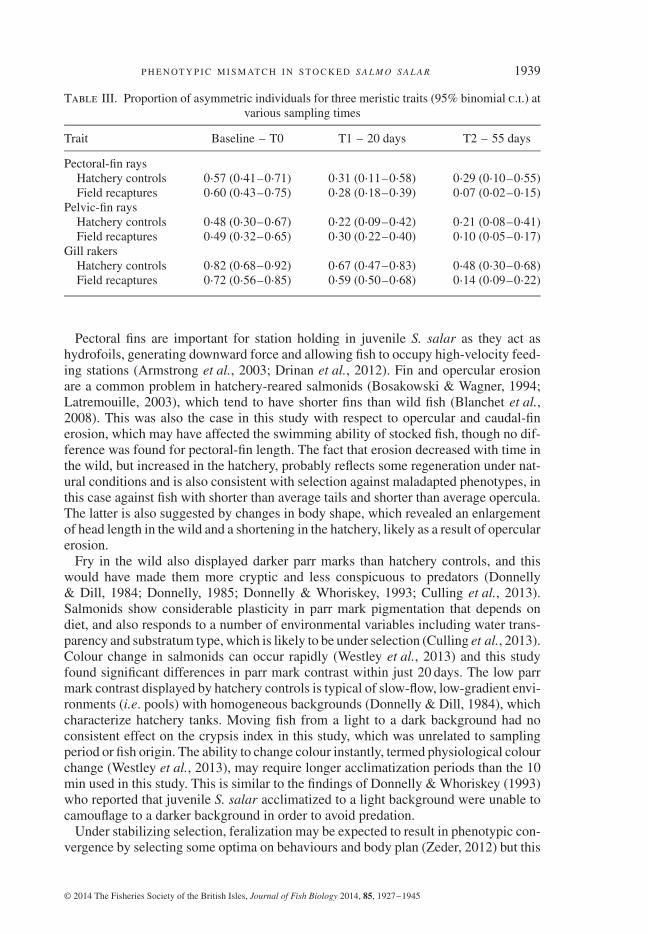
Table III. Proportion of asymmetric individuals for three meristic traits (95% binomial c.i.) atvarious sampling times
Trait Baseline – T0 T1 – 20 days T2 – 55 days
Pectoral-fin raysHatchery controls 0⋅57 (0⋅41–0⋅71) 0⋅31 (0⋅11–0⋅58) 0⋅29 (0⋅10–0⋅55)Field recaptures 0⋅60 (0⋅43–0⋅75) 0⋅28 (0⋅18–0⋅39) 0⋅07 (0⋅02–0⋅15)
Pelvic-fin raysHatchery controls 0⋅48 (0⋅30–0⋅67) 0⋅22 (0⋅09–0⋅42) 0⋅21 (0⋅08–0⋅41)Field recaptures 0⋅49 (0⋅32–0⋅65) 0⋅30 (0⋅22–0⋅40) 0⋅10 (0⋅05–0⋅17)
Gill rakersHatchery controls 0⋅82 (0⋅68–0⋅92) 0⋅67 (0⋅47–0⋅83) 0⋅48 (0⋅30–0⋅68)Field recaptures 0⋅72 (0⋅56–0⋅85) 0⋅59 (0⋅50–0⋅68) 0⋅14 (0⋅09–0⋅22)
Pectoral fins are important for station holding in juvenile S. salar as they act ashydrofoils, generating downward force and allowing fish to occupy high-velocity feed-ing stations (Armstrong et al., 2003; Drinan et al., 2012). Fin and opercular erosionare a common problem in hatchery-reared salmonids (Bosakowski & Wagner, 1994;Latremouille, 2003), which tend to have shorter fins than wild fish (Blanchet et al.,2008). This was also the case in this study with respect to opercular and caudal-finerosion, which may have affected the swimming ability of stocked fish, though no dif-ference was found for pectoral-fin length. The fact that erosion decreased with time inthe wild, but increased in the hatchery, probably reflects some regeneration under nat-ural conditions and is also consistent with selection against maladapted phenotypes, inthis case against fish with shorter than average tails and shorter than average opercula.The latter is also suggested by changes in body shape, which revealed an enlargementof head length in the wild and a shortening in the hatchery, likely as a result of opercularerosion.
Fry in the wild also displayed darker parr marks than hatchery controls, and thiswould have made them more cryptic and less conspicuous to predators (Donnelly& Dill, 1984; Donnelly, 1985; Donnelly & Whoriskey, 1993; Culling et al., 2013).Salmonids show considerable plasticity in parr mark pigmentation that depends ondiet, and also responds to a number of environmental variables including water trans-parency and substratum type, which is likely to be under selection (Culling et al., 2013).Colour change in salmonids can occur rapidly (Westley et al., 2013) and this studyfound significant differences in parr mark contrast within just 20 days. The low parrmark contrast displayed by hatchery controls is typical of slow-flow, low-gradient envi-ronments (i.e. pools) with homogeneous backgrounds (Donnelly & Dill, 1984), whichcharacterize hatchery tanks. Moving fish from a light to a dark background had noconsistent effect on the crypsis index in this study, which was unrelated to samplingperiod or fish origin. The ability to change colour instantly, termed physiological colourchange (Westley et al., 2013), may require longer acclimatization periods than the 10min used in this study. This is similar to the findings of Donnelly & Whoriskey (1993)who reported that juvenile S. salar acclimatized to a light background were unable tocamouflage to a darker background in order to avoid predation.
Under stabilizing selection, feralization may be expected to result in phenotypic con-vergence by selecting some optima on behaviours and body plan (Zeder, 2012) but this
© 2014 The Fisheries Society of the British Isles, Journal of Fish Biology 2014, 85, 1927–1945
1940 R . S T R I N G W E L L E T A L.
20
40
60
Asymm
etri
cal fi
sh (
%)
80
100
(a)
(b)
4030Days post release
6050201000·0
0·2
0·4
0·6
0·8
Rel
ativ
e su
rviv
al
1·0
Fig. 6. Temporal change in (a) per cent juvenile Salmo salar that are asymmetric for at least one meristic trait(± binomial 95% c.i.) amongst hatchery controls ( ) and field recaptures ( ), and (b) apparent relativesurvival (± binomial 95% c.i.) of asymmetrical fish ( ) in relation to baseline for symmetrical fish ( ).
© 2014 The Fisheries Society of the British Isles, Journal of Fish Biology 2014, 85, 1927–1945
P H E N OT Y P I C M I S M AT C H I N S T O C K E D S A L M O S A L A R 1941
was not the case in this study. Juvenile S. salar stocked in the wild strongly divergedfrom hatchery fish with increasing time spent in the wild but did not appear to convergetowards the body shape of wild fish, which remained morphologically differentiatedfrom both hatchery controls and stocked fish. Although the sample of wild fish isadmittedly small, these results serve to highlight that morphometric comparisons alsoneed to consider potential differences in genetic background, that phenotypic varia-tion in juvenile S. salar is probably the norm and that there may not be just one singlebody plan optimal for all environments. Fish released at different sites had statisticallydifferent (albeit only slightly) body shapes at recapture, and recaptured fish were notmore similar to wild fish than hatchery fish were. There was some phenotypic diver-gence among the four field sites and some evidence that these may have been relatedto the environment fish lived in. Thus, fish released at Penderyn developed the mostdistinct body shape. As this site is characterized by having the slowest water velocity,the deepest water, the smallest substratum and the greatest extent of pool habitat, it istempting to speculate on a relationship between river habitat and body shape. Salmosalar fry prefer shallow riffles with water velocity between 20 and 40 cm s−1 and avoidslow-flowing waters with velocities <5–15 cm s−1 (Armstrong et al., 2003). Penderynhad an average velocity of 18 cm s−1, so it may not have been an ideal habitat for S.salar fry. Studies in other species have found that fish can respond rapidly to slow flowsby developing deeper bodies and smaller heads (Haas et al., 2010) and this may havealso been the case at Penderyn.
Taken together, the phenotypic shifts observed among S. salar fry in the wild arelikely to be adaptive because the traits involved are related to fitness in salmonids(Garcia de Leaniz et al., 2007a, b), and the nature of the changes was in the expecteddirection. Yet, the extent to which these were the result of phenotypic plasticity ornon-random mortality (or emigration) of maladapted phenotypes is unclear. Given thatthere was no mortality in the hatchery, two different mechanisms must have been atwork: phenotypic plasticity in the hatchery, and plasticity plus selection in the wild.Consideration of FA as an index of development instability, i.e. the inability by anembryo to produce a consistent phenotype in a given environment (Johnson et al.,2004), may shed some light on the relative importance of plasticity and selection. Thedevelopment of bilateral structures on opposite sides of an organism (such as pectoralfins) is controlled by the same genes, and any deviations from perfect bilateral sym-metry are thought to result from environmental and genetic stressors (Johnson et al.,2004). High levels of FA in some hatchery stocks (Vøllestad & Hindar, 1997; Yurtsevaet al., 2010) have been linked to maternal stress, environmental fluctuations duringembryo development and reduced genetic variation (Leary et al., 1985a, b), though ageneral relationship linking FA and heterozygosity appears only weak (Vøllestad et al.,1999). In this study, the per cent of asymmetrical individuals remained high at 86% inthe hatchery and did not change over time, but decreased sharply in the wild, and byday 55 only 30% of field recaptures were asymmetrical. As the meristic structures con-sidered are not plastic but become fixed instead during early development (Swain &Foote, 1999; Yurtseva et al., 2010), the observed decrease in the frequency of asymmet-rical individuals in the wild must have been due to a higher mortality (or emigration)of asymmetrical fish relative to symmetrical ones. To generate the observed results, itwas estimated that asymmetrical fish must have been c. 12 times more likely to die oremigrate from the study area than symmetrical fish. Given that the frequency of asym-metrical individuals can be up to four times higher among hatchery fish than among
© 2014 The Fisheries Society of the British Isles, Journal of Fish Biology 2014, 85, 1927–1945
1942 R . S T R I N G W E L L E T A L.
wild fish (Crozier, 1997; Moran et al., 1997; Vøllestad & Hindar, 1997), much of thephenotypic changes in this study must therefore be attributed to non-random mortality(or emigration) of maladapted hatchery phenotypes and not simply to plasticity.
A significant decrease in FA with time has been reported previously for wild S. salarby Moran et al. (1997), who noted that such changes did not occur in captivity, andwho suggested a role for natural selection in the purging of asymmetrical individualsfrom wild populations. Several authors have also found a positive association betweenFA and environmental stress in fish (Allenbach, 2011), as well as a decrease of FAwith fish age, which is suggestive of non-random mortality of asymmetrical fish and,therefore, of selection (Sánchez-Galán et al., 1998). Comparison of different meristicstructures indicates that the highest incidence of asymmetrical individuals was foundfor the number of gill rakers, followed by number of pectoral-fin rays and by the num-ber of pelvic-fin rays, in agreement with previous studies on S. salar (Crozier, 1997).In general, field recaptures were two to four times more symmetrical than hatcherycontrols, depending on the structure, but the extent to which FA for individual traitscan be related to their effect on fitness remains unclear (Moran et al., 1997; Vøllestad& Hindar, 1997).
A link between form and function is assumed to exist in the body shape of fish(Thompson & Bonner, 1961) and natural selection may be expected to favourthose phenotypes that increase fitness in local environments (Solem et al., 2006).Hatchery-reared fish typically perform poorly in the wild (Munakata et al., 2000;Jokikokko et al., 2006) and the results of this study suggest that this may be due tophenotypic mismatch, i.e. because hatcheries generate fish that are phenotypicallymismatched to the natural environment.
We are grateful to a number of Swansea University volunteers and to staff at Natural ResourcesWales for rearing the fish at Cynrig and for help with the sampling in the River Taff. This workwas in part funded by the European Social Fund (ESF) through the European Union’s Conver-gence programme administered by the Welsh Government.
References
Abràmoff, M. D., Magelhaes, P. J. & Ram, S. J. (2004). Image processing with ImageJ. Biopho-tonics International 11, 36–42.
Adams, D. C. & Collyer, M. L. (2009). A general framework for the analysis of phenotypictrajectories in evolutionary studies. Evolution 63, 1143–1154.
Adams, C. E., Woltering, C. & Alexander, G. (2003). Epigenetic regulation of trophic morphol-ogy through feeding behaviour in Arctic charr, Salvelinus alpinus. Biological Journal ofthe Linnean Society 78, 43–49.
Allenbach, D. M. (2011). Fluctuating asymmetry and exogenous stress in fishes: a review.Reviews in Fish Biology and Fisheries 21, 355–376.
Álvarez, D. & Nicieza, A. G. (2003). Predator avoidance behaviour in wild and hatchery-rearedbrown trout: the role of experience and domestication. Journal of Fish Biology 63,1565–1577.
Armstrong, J., Kemp, P., Kennedy, G., Ladle, M. & Milner, N. (2003). Habitat requirements ofAtlantic salmon and brown trout in rivers and streams. Fisheries Research 62, 143–170.
Balon, E. K. (2004). About the oldest domesticates among fishes. Journal of Fish Biology65(Suppl. A), 1–27.
Blanchet, S., Páez, D. J., Bernatchez, L. & Dodson, J. J. (2008). An integrated comparison ofcaptive-bred and wild Atlantic salmon (Salmo salar): implications for supportive breed-ing programs. Biological Conservation 141, 1989–1999.
© 2014 The Fisheries Society of the British Isles, Journal of Fish Biology 2014, 85, 1927–1945
P H E N OT Y P I C M I S M AT C H I N S T O C K E D S A L M O S A L A R 1943
Bosakowski, T. & Wagner, E. J. (1994). Assessment of fin erosion by comparison of relativefin length in hatchery and wild trout in Utah. Canadian Journal of Fisheries and AquaticSciences 51, 636–641.
Brown, C., Davidson, T. & Laland, K. (2003). Environmental enrichment and prior experienceof live prey improve foraging behaviour in hatchery-reared Atlantic salmon. Journal ofFish Biology 63, 187–196.
Chittenden, C. M., Biagi, C. A., Davidsen, J. G., Davidsen, A. G., Kondo, H., McKnight, A.,Pedersen, O.-P., Raven, P. A., Rikardsen, A. H., Shrimpton, J. M., Zuehlke, B., McKinley,R. S. & Devlin, R. H. (2010). Genetic versus rearing-environment effects on phenotype:hatchery and natural rearing effects on hatchery- and wild-born coho salmon. PLoS ONE5, e12261.
von Cramon-Taubadel, N., Ling, E. N., Cotter, D. & Wilkins, N. P. (2010). Determination ofbody shape variation in Irish hatchery-reared and wild Atlantic salmon. Journal of FishBiology 66, 1471–1482.
Crawley, M. J. (2007). The R Book. Chichester: Wiley.Crozier, W. W. (1997). Genetic heterozygosity and meristic character variance in a wild Atlantic
salmon population and a hatchery strain derived from it. Aquaculture International 5,407–414.
Culling, M., Freamo, H., Patterson, K., Berg, P. R., Lien, S. & Boulding, E. G. (2013). Signaturesof selection on growth, shape, parr marks, and SNPs among seven Canadian Atlanticsalmon (Salmo salar) populations. Open Evolution Journal 7, 1–16.
Darwin, C. (1875). The Variation of Animals and Plants Under Domestication. London: JohnMurray.
Donnelly, W. A. (1985). The adaptive significance of stream colouration parr mark patterns andcrypsis in coho salmon (Oncorhynchus kisutch). PhD Thesis, Simon Fraser University,Burnaby, BC, Canada.
Donnelly, W. A. & Dill, L. M. (1984). Evidence for crypsis in coho salmon, Oncorhynchuskisutch (Walbaum), parr: substrate colour preference and achromatic reflectance. Journalof Fish Biology 25, 183–195.
Donnelly, W. A. & Whoriskey, F. G. (1993). Transplantation of Atlantic salmon (Salmo salar)and crypsis breakdown. Canadian Special Publication of Fisheries and Aquatic Sciences118, 25–34.
Drinan, T. J., McGinnity, P., Coughlan, J. P., Cross, T. F. & Harrison, S. S. C. (2012). Mor-phological variability of Atlantic salmon Salmo salar and brown trout Salmo trutta indifferent river environments. Ecology of Freshwater Fish 21, 420–432.
Enders, E. C., Boisclair, D. & Roy, A. G. (2004). The costs of habitat utilization of wild, farmed,and domesticated juvenile Atlantic salmon (Salmo salar). Canadian Journal of Fisheriesand Aquatic Sciences 61, 2302–2313.
Endler, J. A. (1986). Natural Selection in the Wild. Princeton, NJ: Princeton University Press.Eriksen, M. S., Espmark, Å. M., Poppe, T., Braastad, B. O., Salte, R. & Bakken, M. (2008). Fluc-
tuating asymmetry in farmed Atlantic salmon (Salmo salar) juveniles: also a maternalmatter? Environmental Biology of Fishes 81, 87–99.
Fleming, I. A. & Einum, S. (1997). Experimental tests of genetic divergence of farmed from wildAtlantic salmon due to domestication. ICES Journal of Marine Science 54, 1051–1063.
Garcia de Leaniz, C., Fleming, I. A., Einum, S., Verspoor, E., Consuegra, S., Jordan, W. C.,Aubin-Horth, N., Lajus, D. L., Villanueva, B., Ferguson, A., Youngson, A. F. & Quinn,T. P. (2007a). Local adaptation. In The Atlantic Salmon: Genetics, Conservation andManagement (Verspoor, E., Stradmeyer, L. & Nielsen, J., eds), pp. 200–239. Oxford:Blackwell.
Garcia de Leaniz, C., Fleming, I. A., Einum, S., Verspoor, E., Jordan, W. C., Consuegra, S.,Aubin-Horth, N., Lajus, D., Letcher, B. H., Youngson, A. F., Webb, J. H., Vøllestad, L.A., Villanueva, B., Ferguson, A. & Quinn, T. P. (2007b). A critical review of adaptivegenetic variation in Atlantic salmon: implications for conservation. Biological Reviews(Cambridge) 82, 173–211.
Haas, T. C., Blum, M. J. & Heins, D. C. (2010). Morphological responses of a stream fish towater impoundment. Biology Letters 6, 803–806.
© 2014 The Fisheries Society of the British Isles, Journal of Fish Biology 2014, 85, 1927–1945
1944 R . S T R I N G W E L L E T A L.
Hoyle, I., Oidtmann, B., Ellis, T., Turnbull, J., North, B., Nikolaidis, J. & Knowles, T. G. (2007).A validated macroscopic key to assess fin damage in farmed rainbow trout (Oncorhynchusmykiss). Aquaculture 270, 142–148.
Johnson, O., Neely, K. & Waples, R. (2004). Lopsided fish in the Snake River Basin – fluc-tuating asymmetry as a way of assessing impact of hatchery supplementation in chi-nook salmon, Oncorhynchus tshawytscha. In Genetics of Subpolar Fish and Invertebrates(Gharrett, A., Gustafson, R., Nielsen, J., Seeb, J., Seeb, L., Smoker, W., Thorgaard, G. &Wilmot, R., eds), pp. 379–393. Netherlands: Juneau, Alaska.
Jokikokko, E., Kallio-Nyberg, I., Saloniemi, I. & Jutila, E. (2006). The survival of semi-wild,wild and hatchery-reared Atlantic salmon smolts of the Simojoki River in the Baltic Sea.Journal of Fish Biology 68, 430–442.
Klingenberg, C. P. (2011). MorphoJ: an integrated software package for geometric morphomet-rics. Molecular Ecology Resources 11, 353–357.
Kostow, K. E. (2004). Differences in juvenile phenotypes and survival between hatchery stocksand a natural population provide evidence for modified selection due to captive breeding.Canadian Journal of Fisheries and Aquatic Sciences 61, 577–589.
Latremouille, D. N. (2003). Fin erosion in aquaculture and natural environments. Reviews inFisheries Science 11, 315–335.
Leary, R. F., Allendorf, F. W. & Knudsen, K. L. (1985a). Development instability as an indicatorof reduced genetic variation in hatchery trout. Transactions of the American FisheriesSociety 114, 230–235.
Leary, R. F., Allendorf, F. W. & Knudsen, K. L. (1985b). Developmental instability and highmeristic counts in interspecific hybrids of salmonid fishes. Evolution 39, 1318–1326.
Lorenzen, K., Beveridge, M. C. M. & Mangel, M. (2012). Cultured fish: integrative biologyand management of domestication and interactions with wild fish. Biological Reviews87, 639–660.
Manly, B. F. J. (2001). Statistics for Environmental Science and Management. Boca Raton, FL:Chapman & Hall/CRC.
Marcil, J., Swain, D. P. & Hutchings, J. A. (2006). Genetic and environmental components ofphenotypic variation in body shape among populations of Atlantic cod (Gadus morhuaL.). Biological Journal of the Linnean Society 88, 351–365.
Moran, P., Izquierdo, J. I., Pendas, A. M. & Garcia-Vazquez, E. (1997). Fluctuating asymme-try and isozyme variation in Atlantic salmon: relation to age of wild and hatchery fish.Transactions of the American Fisheries Society 126, 194–199.
Munakata, A., Björnsson, B. Th., Jönsson, E., Amano, M., Ikuta, K., Kitamura, S., Kurokawa, T.& Aida, K. (2000). Post-release adaptation processes of hatchery-reared honmasu salmonparr. Journal of Fish Biology 56, 163–172.
Pakkasmaa, S. & Piironen, J. (2001a). Morphological differentiation among local trout (Salmotrutta) populations. Biological Journal of the Linnean Society 72, 231–239.
Pakkasmaa, S. & Piironen, J. (2001b). Water velocity shapes juvenile salmonids. EvolutionaryEcology 14, 721–730.
Price, E. (2002). Reintroductions and feralization. In Animal Domestication and Behavior(Price, E., ed), pp. 182–203. Egham: CAB eBooks.
Pulcini, D., Wheeler, P. A., Cataudella, S., Russo, T. & Thorgaard, G. H. (2013). Domesticationshapes morphology in rainbow trout Oncorhynchus mykiss. Journal of Fish Biology 82,390–407.
Pulcini, D., Russo, T., Reale, P., Massa-Gallucci, A., Brennan, G. & Cataudella, S. (2014). Rain-bow trout (Oncorhynchus mykiss, Walbaum) develop a more robust body shape underorganic rearing. Aquaculture Research 45, 397–409.
Roberts, L. J., Taylor, J. & Garcia de Leaniz, C. (2011). Environmental enrichment reduces mal-adaptive risk-taking behavior in salmon reared for conservation. Biological Conservation144, 1972–1979.
Rogell, B., Dannewitz, J., Palm, S., Petersson, E., Dahl, J., Prestegaard, T., Järvi, T. & Laurila,A. (2012). Strong divergence in trait means but not in plasticity across hatchery and wildpopulations of sea-run brown trout Salmo trutta. Molecular Ecology 21, 2963–2976.
Rogell, B., Dannewitz, J., Palm, S., Dahl, J., Petersson, E. & Laurila, A. (2013). Adaptive diver-gence in body size overrides the effects of plasticity across natural habitats in the browntrout. Ecology and Evolution 3, 1931–1941.
© 2014 The Fisheries Society of the British Isles, Journal of Fish Biology 2014, 85, 1927–1945
P H E N OT Y P I C M I S M AT C H I N S T O C K E D S A L M O S A L A R 1945
Rohlf, F. J. (2010). tps Series. Stony Brook, NY: Department of Ecology and Evolution, StateUniversity of New York, Stony Brook.
Rohlf, F. J. (2013). tpsUtil. Stony Brook, NY: Department of Ecology and Evolution, StateUniversity of New York, Stony Brook.
Saikkonen, A., Kekäläinen, J. & Piironen, J. (2011). Rapid growth of Atlantic salmon juve-niles in captivity may indicate poor performance in nature. Biological Conservation 144,2320–2327.
Sánchez-Galán, S., Linde, A. R., Izquierdo, J. I. & Garc𝚤a-Vázquez, E. (1998). Micronuclei andfluctuating asymmetry in brown trout (Salmo trutta): complementary methods to biomon-itor freshwater ecosystems. Mutation Research/Genetic Toxicology and EnvironmentalMutagenesis 412, 219–225.
Skaala, Ø., Glover, K. A., Barlaup, B. T., Svåsand, T., Besnier, F., Hansen, M. M., Borgstrøm, R.& Fleming, I. (2012). Performance of farmed, hybrid, and wild Atlantic salmon (Salmosalar) families in a natural river environment. Canadian Journal of Fisheries and AquaticSciences 69, 1994–2006.
Smith, T. B. & Skúlason, S. (1996). Evolutionary significance of resource polymorphisms infishes, amphibians, and birds. Annual Review of Ecology and Systematics 27, 111–133.
Solem, Ø. & Berg, O. K. (2011). Morphological differences in parr of Atlantic salmon Salmosalar from three regions in Norway. Journal of Fish Biology 78, 1451–1469.
Solem, Ø., Berg, O. K. & Kjøsnes, A. J. (2006). Inter- and intra-population morphological dif-ferences between wild and farmed Atlantic salmon juveniles. Journal of Fish Biology 69,1466–1481.
Stelkens, R. B., Jaffuel, G., Escher, M. & Wedekind, C. (2012). Genetic and phenotypic pop-ulation divergence on a microgeographic scale in brown trout. Molecular Ecology 21,2896–2915.
Swain, D. P. & Foote, C. J. (1999). Stocks and chameleons: the use of phenotypic variation instock identification. Fisheries Research 43, 113–128.
Teletchea, F. & Fontaine, P. (2014). Levels of domestication in fish: implications for the sustain-able future of aquaculture. Fish and Fisheries 15, 181–195.
Thompson, D. A. W. & Bonner, J. T. (1961). On Growth and Form (Abridged Edition). Cam-bridge: Cambridge University Press.
Trut, L., Oskina, I. & Kharlamova, A. (2009). Animal evolution during domestication: thedomesticated fox as a model. Bioessays 31, 349–360.
Vehanen, T. & Huusko, A. (2011). Brown trout Salmo trutta express different morphometricsdue to divergence in the rearing environment. Journal of Fish Biology 79, 1167–1181.
Vøllestad, L. A. & Hindar, K. (1997). Developmental stability and environmental stress in Salmosalar (Atlantic salmon). Heredity 78, 215–222.
Vøllestad, L. A., Hindar, K. & Møller, A. P. (1999). A meta-analysis of fluctuating asymmetryin relation to heterozygosity. Heredity 83, 206–218.
West-Eberhard, M. J. (1989). Phenotypic plasticity and the origins of diversity. Annual Reviewof Ecology and Systematics 20, 249–278.
Westley, P. A. H., Stanley, R. & Fleming, I. A. (2013). Experimental tests for heritable morpho-logical color plasticity in non-native brown trout (Salmo trutta) populations. PLoS ONE8, e80401.
Wolak, M. E., Fairbairn, D. J. & Paulsen, Y. R. (2012). Guidelines for estimating repeatability.Methods in Ecology and Evolution 3, 129–137.
Yurtseva, A., Lajus, D., Artamonova, V. & Makhrov, A. (2010). Effect of hatchery environmenton cranial morphology and developmental stability of Atlantic salmon (Salmo salar L.)from North-West Russia. Journal of Applied Ichthyology 26, 307–314.
Zeder, M. A. (2012). Pathways to animal domestication. In Biodiversity in Agriculture: Domes-tication, Evolution, and Sustainability (Gepts, P., Famula, T. R., Bettinger, R. L., Brush,S. B., Damania, A. B., McGuire, P. E. & Qualset, C. O., eds), pp. 227–259. Cambridge:Cambridge University Press.
© 2014 The Fisheries Society of the British Isles, Journal of Fish Biology 2014, 85, 1927–1945