Embed Size (px)
Citation preview

Malaria: Bringing Down The Burden
In Odisha
Dr. MM Pradhan
Dy. Director,
NVBDCP, Odisha
MMV Stakeholders’ Meeting, Delhi (India), 8th Nov, 2012

Odisha at a glance Area: 156,000 sq kms (4% of
India’s land area)
Popln: 42 million (3% of India)
Rural : 82% , Urban : 18%
Tribal - 22% + sch. caste -16%
( St & SC = 36%) Out of 75 Primitive Tribal Groups in
India ,13 are in Odisha.
There are 30 district with 314 blocks
and >51,000 villages
Favourable geo-ecotypes: Perennial streams in forest areas
-Forest area are also rich in minerals with mining activities and high
migratory population
Average temperature : 15 0 to 35 0С (extreme: 50С to 48 0С)
Rain fall : 1452 mm with high humidity (>60%)}

14
15
12
15
11
11
15
28
21
14
19
23
15
13
12
23
14
19
25
22
19
16
31
38
2 4
7
2
9 8
15 15
4
10
16
8
0
5
10
15
20
25
30
35
40
0
10000
20000
30000
40000
50000
60000
Jan Feb Mar Apr May Jun Jul Aug Sep Oct Nov Dec
2009 - Death 2010 - Death
2011 - Death 2009 - Cases
Transmission seasonality

Transmission is perennial with one peak in forested districts (mostly tribal dominated)
0
500
1000
1500
2000
2500
3000
3500
4000
4500
5000
Jan Feb Mar Apr May June July Aug Sep Oct Nov Dec
Malaria cases 1765 1864 2193 2691 2542 3760 4154 4826 4363 3190 2865 2338
Pf cases 1678 1771 2077 2549 2410 3583 3935 4543 4143 2975 2644 2203
Death 1 2 7 3 5 7 3 2 3 3 3 0
No
of
case
s
Kandhamal ( Pf > 90%) Forest covers 34.2%

Year Total
Tested +ve PF Death ABER SPR Pf% API
2002 4570466 473223 393523 465 12.21 10.35 83.16 12.64
2007 4945551 371879 323150 221 12.22 7.52 86.90 9.19
2008 5029677 375430 329631 239 12.23 7.46 87.80 9.13
2009 5015489 380904 336047 198 12.00 7.59 88.22 9.12
2010 5240458 395651 350428 247 12.30 7.55 88.57 9.29
2011 4657978 298423 272971 100 11.13 6.41 91.47 7.13
2010 – upto Sept.
3743258 277915 244744 162 7.42 88.06
2011 – upto Sept.
3452288 232911 213029 66 6.75 91.46
2012 – upto Sept.
3457988 187176 173137 46 5.41 92.50
Malaria cases decreased by 20% & deaths by 30% (2011 vs 2012 by September)
Malaria Epidemiological Situation, 2002-12

2011
2010
2009
2008
2007Status of Malaria API of Odisha from 2007-2011
Year 0-2 2-5 5-10 >10
2007 7 3 6 14
2008 7 5 5 13
2009 10 3 4 14
2010 10 4 4 12
2011 12 5 3 10
The
re is
a d
ecr
eas
e in
AP
I
Year wise distribution of Districts with API

Malaria control strategy: As per the National program with
state specific appropriation
A. Primary:
1. Early diagnosis (Microscopy & RDT) and completer treatment with effective & appropriate Antimalaria drugs
2. Integrated vector control : LLIN , IRS, source reduction
B. Supportive: Monitoring & evaluation, capacity building IEC & BCC – PPP & Social mobilisation advocacy, Operational research

30 Districts with 32 Dist Hospital
314 Blocks (125K pop per block)
Primary Health Center (20-30K pop) 4-5 PHCs per block
Sub-center (5K pop) (4-5 SCs per PHC)
51,000 villages (0.5-1K pop per village) (8-10 villages per SC)
Structure of health services in Odisha
Malaria
surveillance,
Diagnosis &
treatment available
free of cost at each
Health facility

11
99
00
0
70
00
00
19
02
668
0
25
43
56
0
0
10
13
50
12
17
00
27
74
000
17
50
725
68
34
00
0
0
50
00
00
0
0
65
00
00
83
91
1
67
43
24
62
28
75
15
00
0
15
00
0
62
20
198
247
100
9.12
9.29
7.13
0
50
100
150
200
250
300
0
500000
1000000
1500000
2000000
2500000
3000000
2009-10 2010-11 2011-12
LLIN
ITN
MO-Mashari
RDT
RDT(Bi-valent)procure byState
RDT(Mono-valent) procureby Sate
ACT
ASHA Capacitybuilding
API
Death
Inputs & interventions for malaria control from 2009 onwards.

Surveillance and Early Diagnosis & Complete Treatment (RDT + ACT) at village level
Out of 41264 ASHAs, >38000 have been trained (92% )
646 AYUSH doctors & around 2000 tribal school teachers have been trained on EDCT
Around 500 Forest (VSS)
Animators have been trained as
FTD to provide EDCT service in
Forest villages in four tribal
districts (Rayagada, Gajapati,
Kandhamal and Koraput)

Sentinel Site Malaria laboratories-2011
380987
25139 (6.59%) 7203
(1.89%) 0
50000
100000
150000
200000
250000
300000
350000
400000
450000
Total In Patient In patient suspectedas malaria
Confirmed Malariacases
No
of
in p
atie
nts
Characteristics of IPD patients at SSL, 2011
1957077
158871 (8.1%)
11175 (.57%)
1000
501000
1001000
1501000
2001000
2501000
Total New OPDCases
Suspected malariaCases
Confirmed Malariacases
Characteristics of OPD cases at SSL, 2011

Seasonality of IPD cases in 2011
74
36
8
85
84
4
12
66
19
94
15
6
42
20
57
73
10
57
5
45
71
14
05
19
49
22
80
15
69
0
500
1000
1500
2000
2500
0
20000
40000
60000
80000
100000
120000
140000Ja
n -
Mar
ch
Ap
r -
Jun
Jul -
Se
p
Oct
- D
ec
Total IPD
Total In patients suspected as malaria
Total Positive

Integrated Vector Control: IRS
Hand Compression Sprayer Pumps (HCSP) have been introduced
IRS – 2 rounds protect high risk
population ( API > 5) - around 8.7
million in 22 districts

Integrated Vector Control : LLIN
State specific LLIN guidelines adopted for LLIN distribution
Total 18.99 Lakhs LLIN distributed in 2009-10 and another 19 Lakh in 2011-12 (total around 38 lakh LLIN) - protect around 90 lakh population,
LLIN distribution was done through GKS (village health sanitation committee),followed by intensified IEC & BCC

API trend after 1st phase LLIN distribution ( around 19 lakh)
11
10
00
65
00
0
68
50
0
94
00
0
40
00
0
90
00
0
30
00
0
10
00
00
10
00
00
10
26
00
50
00
0
40
00
0
15
00
00
30
00
0
40
00
0
80
00
0
30
00
0
95
00
0
15
00
00
0.00
20.00
40.00
60.00
80.00
100.00
120.00
0
20000
40000
60000
80000
100000
120000
140000
160000
An
gul
Bar
garh
Bo
lan
gir
Dh
en
kan
al
Gaj
apat
i
Gan
jam
Jhar
sugu
da
Kal
ahan
di
Kan
dh
amal
Keo
njh
ar
Ko
rap
ut
Mal
kan
giri
May
urb
han
j
Naw
aran
gap
ur
Nu
apad
a
Ray
agad
a
Sam
bal
pu
r
Son
epu
r
Sun
dar
garh
LLIN Distribution 2009-10
API-10
API-11

Encouraging results after the new interventions:
pf
2037
925
1707
690
336235
positive pf pv•LLIN in 2009 along with
ACT
•Special awareness
campaign- NIDHI RATH
•Nil reported death
0
1000
2000
3000
4000
5000
50
150
250
350
450
550
650
2008 2009 2010 2011
No
. of
Po
siti
ve c
ase
se
K. Nagar Sub. Divisonal Hospital catering
the population of a High Endemic Tribal
block of Dhenkanal district
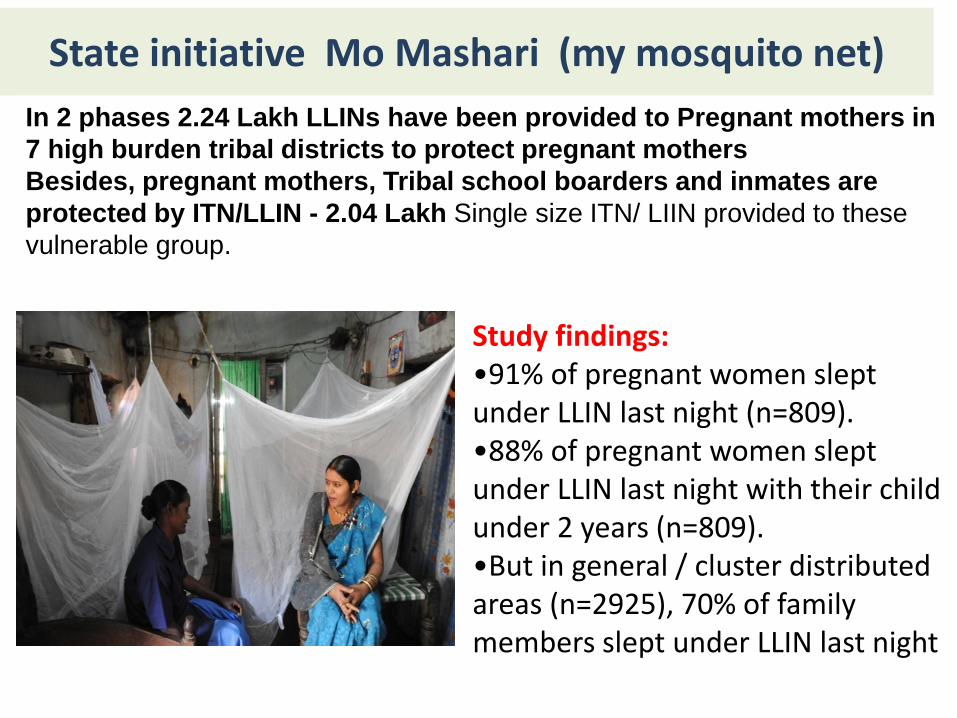
State initiative Mo Mashari (my mosquito net)
In 2 phases 2.24 Lakh LLINs have been provided to Pregnant mothers in
7 high burden tribal districts to protect pregnant mothers
Besides, pregnant mothers, Tribal school boarders and inmates are
protected by ITN/LLIN - 2.04 Lakh Single size ITN/ LIIN provided to these
vulnerable group.
Study findings: •91% of pregnant women slept under LLIN last night (n=809). •88% of pregnant women slept under LLIN last night with their child under 2 years (n=809). •But in general / cluster distributed areas (n=2925), 70% of family members slept under LLIN last night

• Use of traditional folk theatre, Jatra
etc.
• Partnership with GKS & CBOs
• Advocacy & Inter-sectoral
coordination
• Involvement of School teacher &
student, Traditional / Faith healers
Innovative IEC &BCC
Nidhi Mausa Adalat

NGO/PPP and Inter Sectoral Co-ordination NGOs engaged under NRHM
are involved in screening of
malaria cases, impregnation of
bed nets, laboratory diagnosis
and community mobilization
and monitoring.
Other departments: Women & Child Development., Forest and Environment, Schedule Caste &
Schedule Tribe, School and Mass Education, Panchayati Raj Institutions, ICMR institutes

LQAS : ME tool in malaria program. Conducted twice a year –at present conducted in 21 districts.
The LQAS findings from 2009 to 2011 on % of people protected either by ITN/LLIN.
Lot Quality Assurance Sampling: LQAS
Sundargarh
Mayurbhanj
Nabarangpur
Kandhamal
Mon Target0%
10%
20%
30%
40%
50%
60%
70%
Nov (2009) Aug (2010) Nov(2010) Aug(2011) Nov (2011)
Sundargarh Mayurbhanj Nabarangpur Kandhamal Mon Target

Operational research
(Dfid support):
• Vector study by VCRC in 10 southern districts- publication awaited
• Mo-Mashari (my mosquito nets) by T & MST (of Dfid) – report released
• LLIN impact study by ICMR institutes – reports awaited
Guidelines and reports:
– LLIN state Guidelines
– Operational manuals
– Annual Activity report – used for advocacy
– Training manuals for doctors, Health workers, ASHA
– FAQs for school students and others
Research & Documentation

Comprehensive case management-
(Pilot): MMV-NIMR - Odisha 3Ts: test, treat & tract
Rationale:
• Case management of malaria, beyond ‘treating the sick’, could reduce the infectious reservoir.
• The size of the infectious reservoir is an important determinant of malaria transmission in low & medium endemic areas
Universal vector control is difficult and expensive
where large populations are at variable risk
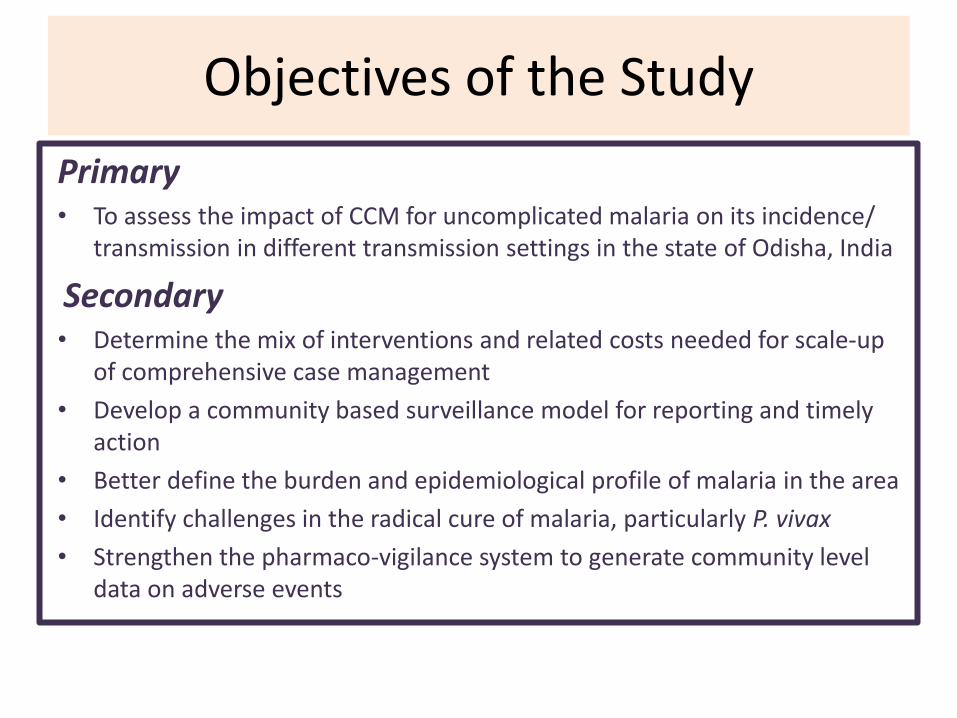
Objectives of the Study
Primary • To assess the impact of CCM for uncomplicated malaria on its incidence/
transmission in different transmission settings in the state of Odisha, India
Secondary • Determine the mix of interventions and related costs needed for scale-up
of comprehensive case management
• Develop a community based surveillance model for reporting and timely action
• Better define the burden and epidemiological profile of malaria in the area
• Identify challenges in the radical cure of malaria, particularly P. vivax
• Strengthen the pharmaco-vigilance system to generate community level data on adverse events

Inte
rven
tio
n /
Co
ntr
ol
High transmission (API: 18)
Low vivax (10%)
High case load (ca. 2000 patients p.a) In
terv
enti
on
/ c
on
tro
l Medium transmission (API: 8)
Mixed vivax (30%)
Medium case load (ca. 1000 patients p.a.)
Inte
rven
tio
n /
Co
ntr
ol
Low transmission (API: 3)
High vivax (50%)
Low case load (ca. 300 patients p.a)
Project design
• Operational research project with NVBDCP
• Total study population 800,000
• 3 year study period (October 2012 – 2015)

I want to play at school - help me for no malaria
Thanks
Challenges: •Tribal areas - cultural
and language barrier
•Forest villages
•Inaccessibility and poor
health services
•Inadequate health staff
•Increased mining and
developmental activities
•Urban set ups with
migratory population &
poor health structure for
public health activities
Challenges: More research for newer
interventions
Health system research
-functioning of ASHA
& other health volunteers
-Community based
organizations (GKS)
-Community mechanism
- Role of Traditional
healers in tribal areas
-Role of general
practitioners, chemists,
private and other sectors