Embed Size (px)
Citation preview
Malaria in the Eastern Mediterranean Region 2013
Malaria in the Eastern Mediterranean Region 2013
WHO Library Cataloguing in Publication DataWorld Health Organization. Regional Office for the Eastern MediterraneanMalaria in the Eastern Mediterranean Region 2013 / World Health Organization. Regional Office for the Eastern Mediterraneanp.ISBN: 978-92-9021-950-7ISBN: 978-92-9021-951-4 (online)1. Malaria - prevention & control 2. Malaria - epidemiology - Eastern Mediterranean Region I. Title II. Regional Office for the Eastern Mediterranean (NLM Classification: WC 765)
© World Health Organization 2014All rights reserved.
The designations employed and the presentation of the material in this publication do not imply the expression of any opinion whatsoever on the part of the World Health Organization concerning the legal status of any country, territory, city or area or of its authorities, or concerning the delimitation of its frontiers or boundaries. Dotted lines on maps represent approximate border lines for which there may not yet be full agreement.
The mention of specific companies or of certain manufacturers’ products does not imply that they are endorsed or recommended by the World Health Organization in preference to others of a similar nature that are not mentioned. Errors and omissions excepted, the names of proprietary products are distinguished by initial capital letters.
All reasonable precautions have been taken by the World Health Organization to verify the information contained in this publication. However, the published material is being distributed without warranty of any kind, either expressed or implied. The responsibility for the interpretation and use of the material lies with the reader. In no event shall the World Health Organization be liable for damages arising from its use.
Publications of the World Health Organization can be obtained from Knowledge Sharing and Production, World Health Organization, Regional Office for the Eastern Mediterranean, PO Box 7608, Nasr City, Cairo 11371, Egypt (tel: +202 2670 2535, fax: +202 2670 2492; email: [email protected]). Requests for permission to reproduce, in part or in whole, or to translate publications of WHO Regional Office for the Eastern Mediterranean – whether for sale or for noncommercial distribution – should be addressed to WHO Regional Office for the Eastern Mediterranean, at the above address; email: [email protected].
Design, layout and printing by the WHO Regional Office for the Eastern Mediterranean, Cairo.
Contents
1. Introduction ...........................................................................................................................5
2. Regional malaria situation ...................................................................................................5
2.1 Regional overview ........................................................................................................... 5
2.2 Regional burden ............................................................................................................. 6
2.3 Coverage of key anti-malaria interventions ........................................................................ 7
3. Malaria country profiles .......................................................................................................9
Annex 1. Regional summary profile........................................................................................ 11
Annex 2. Country profiles ...................................................................................................... 15
Annex 3. Abbreviations ..........................................................................................................71

Malaria in the Eastern Mediterranean Region 2013
5
1. Introduction
This report summarizes the malaria situation in the WHO Eastern Mediterranean Region by end 2012. It provides a summary of the regional burden and the key interventions in the seven countries in the Region with a high burden of malaria. The report expands on the annual World malaria report, providing comprehensive country profiles for all countries, including those that are malaria-free and those targeting elimination, as well as the high-burden countries.
In 1999, the Roll Back Malaria initiative was launched in the Eastern Mediterranean Region. All countries in the Region committed themselves to the objectives of the initiative and updated their national strategies for malaria control and elimination accordingly. By 2012, the objectives of the regional strategy had been reached in some countries of the Region. The United Arab Emirates and Morocco were certified as malaria-free, Syrian Arab Republic and Iraq were reporting no local transmission and Oman was reporting only a few introduced locally transmitted cases due to imported malaria. There was a significant reduction in the malaria burden in the Islamic Republic of Iran and Saudi Arabia. Reduction of morbidity was also recorded in several high burden countries, such as Afghanistan, and certain areas in Somalia, Sudan and Yemen.
2. Regional malaria situation
2.1 Regional overview
In 2012, the WHO Eastern Mediterranean Region comprised 23 countries located in north Africa (Egypt, Libya, Morocco and Tunisia), sub-Saharan Africa (Djibouti, Somalia, Sudan and South Sudan) and south-west Asia (Afghanistan, Bahrain, Iraq, Islamic Republic of Iran, Jordan, Kuwait, Lebanon, Oman, Pakistan, occupied Palestinian territory, Qatar, Saudi Arabia, Syrian Arab Republic, United Arab Emirates and Yemen).
Geographical diversity in the Region determines malaria variability in terms of endemicity, intensity of transmission and type of malaria. The malaria-endemic countries of the Region are situated in the three eco-epidemiological zones of malaria: afrotropical, oriental and palaearctic. In Saudi Arabia, Yemen and the sub-Saharan countries of the Region (Djibouti, Somalia, Sudan, South Sudan), P. falciparum is predominant and the main vectors are An. arabiensis and An. funestus. In the other endemic countries, mainly Afghanistan, Islamic Republic of Iran and Pakistan, both P. falciparum and P. vivax are transmitted and the main vectors are An. culicifacies, An. stephensi, An. superpictus, An. sakharovi and An. fluviatilis.
Countries of the Region have encountered strikingly dissimilar challenges that range from maintaining malaria-free status to controlling unstable and stable types of malaria, thus demanding different malaria control approaches. Currently, the countries are in different phases. Seven countries are in the control phase (Afghanistan, Djibouti, Pakistan, Somalia, Sudan, South Sudan and Yemen). Two countries have low, geographically limited malaria transmission and are in the elimination phase (Islamic Republic of Iran and Saudi Arabia). The remaining countries are in the stage of prevention of re-introduction of malaria. Some eliminated malaria a long time ago (Bahrain, Jordan, Kuwait, Lebanon, Libya, occupied Palestinian territory, Qatar and Tunisia) or in the recent past. Of the latter, two countries have achieved certification of elimination (Morocco and United Arab Emirates) and four countries are not yet certified (Egypt, Iraq, Oman and Syrian Arab Republic). The risk of malaria reintroduction as a result of importation in these countries still exists. Egypt and Oman have had reports of introduced cases or limited outbreaks of indigenous cases.
Malaria in the Eastern Mediterranean Region 2013
6
2.2 Regional burden
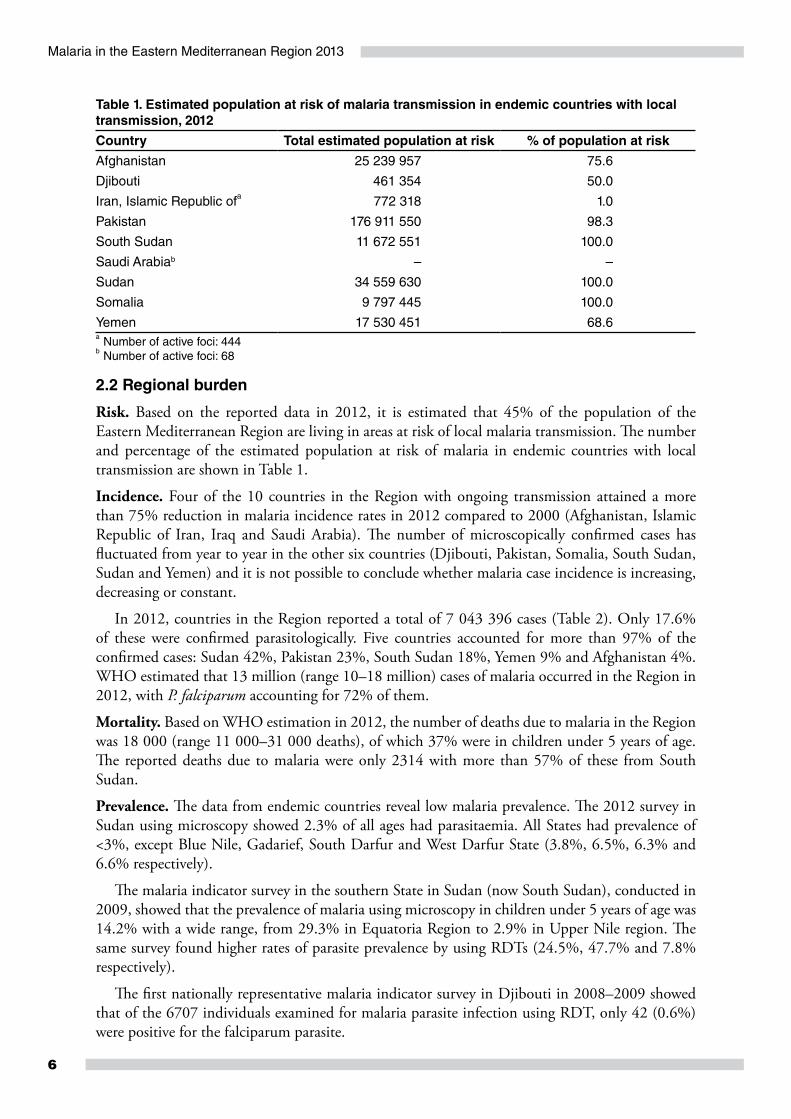
Risk. Based on the reported data in 2012, it is estimated that 45% of the population of the Eastern Mediterranean Region are living in areas at risk of local malaria transmission. The number and percentage of the estimated population at risk of malaria in endemic countries with local transmission are shown in Table 1.
Incidence. Four of the 10 countries in the Region with ongoing transmission attained a more than 75% reduction in malaria incidence rates in 2012 compared to 2000 (Afghanistan, Islamic Republic of Iran, Iraq and Saudi Arabia). The number of microscopically confirmed cases has fluctuated from year to year in the other six countries (Djibouti, Pakistan, Somalia, South Sudan, Sudan and Yemen) and it is not possible to conclude whether malaria case incidence is increasing, decreasing or constant.
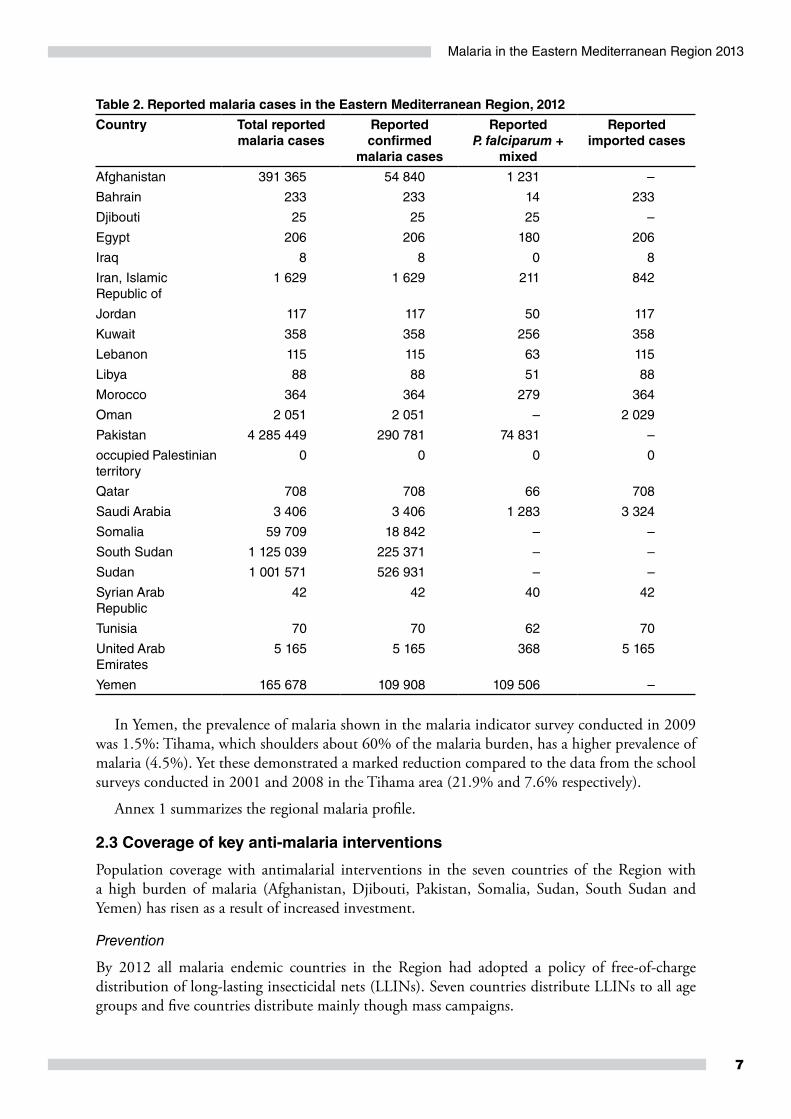
In 2012, countries in the Region reported a total of 7 043 396 cases (Table 2). Only 17.6% of these were confirmed parasitologically. Five countries accounted for more than 97% of the confirmed cases: Sudan 42%, Pakistan 23%, South Sudan 18%, Yemen 9% and Afghanistan 4%. WHO estimated that 13 million (range 10–18 million) cases of malaria occurred in the Region in 2012, with P. falciparum accounting for 72% of them.
Mortality. Based on WHO estimation in 2012, the number of deaths due to malaria in the Region was 18 000 (range 11 000–31 000 deaths), of which 37% were in children under 5 years of age. The reported deaths due to malaria were only 2314 with more than 57% of these from South Sudan.
Prevalence. The data from endemic countries reveal low malaria prevalence. The 2012 survey in Sudan using microscopy showed 2.3% of all ages had parasitaemia. All States had prevalence of <3%, except Blue Nile, Gadarief, South Darfur and West Darfur State (3.8%, 6.5%, 6.3% and 6.6% respectively).
The malaria indicator survey in the southern State in Sudan (now South Sudan), conducted in 2009, showed that the prevalence of malaria using microscopy in children under 5 years of age was 14.2% with a wide range, from 29.3% in Equatoria Region to 2.9% in Upper Nile region. The same survey found higher rates of parasite prevalence by using RDTs (24.5%, 47.7% and 7.8% respectively).
The first nationally representative malaria indicator survey in Djibouti in 2008–2009 showed that of the 6707 individuals examined for malaria parasite infection using RDT, only 42 (0.6%) were positive for the falciparum parasite.
Table 1. Estimated population at risk of malaria transmission in endemic countries with local transmission, 2012
Country Total estimated population at risk % of population at risk
Afghanistan 25 239 957 75.6
Djibouti 461 354 50.0
Iran, Islamic Republic ofa 772 318 1.0
Pakistan 176 911 550 98.3
South Sudan 11 672 551 100.0
Saudi Arabiab – –
Sudan 34 559 630 100.0
Somalia 9 797 445 100.0
Yemen 17 530 451 68.6a Number of active foci: 444b Number of active foci: 68
Malaria in the Eastern Mediterranean Region 2013
7
In Yemen, the prevalence of malaria shown in the malaria indicator survey conducted in 2009 was 1.5%: Tihama, which shoulders about 60% of the malaria burden, has a higher prevalence of malaria (4.5%). Yet these demonstrated a marked reduction compared to the data from the school surveys conducted in 2001 and 2008 in the Tihama area (21.9% and 7.6% respectively).
Annex 1 summarizes the regional malaria profile.
2.3 Coverage of key anti-malaria interventions
Population coverage with antimalarial interventions in the seven countries of the Region with a high burden of malaria (Afghanistan, Djibouti, Pakistan, Somalia, Sudan, South Sudan and Yemen) has risen as a result of increased investment.
Prevention
By 2012 all malaria endemic countries in the Region had adopted a policy of free-of-charge distribution of long-lasting insecticidal nets (LLINs). Seven countries distribute LLINs to all age groups and five countries distribute mainly though mass campaigns.
Table 2. Reported malaria cases in the Eastern Mediterranean Region, 2012
Country Total reported malaria cases
Reported confirmed
malaria cases
Reported P. falciparum +
mixed
Reported imported cases
Afghanistan 391 365 54 840 1 231 –
Bahrain 233 233 14 233
Djibouti 25 25 25 –
Egypt 206 206 180 206
Iraq 8 8 0 8
Iran, Islamic Republic of
1 629 1 629 211 842
Jordan 117 117 50 117
Kuwait 358 358 256 358
Lebanon 115 115 63 115
Libya 88 88 51 88
Morocco 364 364 279 364
Oman 2 051 2 051 – 2 029
Pakistan 4 285 449 290 781 74 831 –
occupied Palestinian territory
0 0 0 0
Qatar 708 708 66 708
Saudi Arabia 3 406 3 406 1 283 3 324
Somalia 59 709 18 842 – –
South Sudan 1 125 039 225 371 – –
Sudan 1 001 571 526 931 – –
Syrian Arab Republic
42 42 40 42
Tunisia 70 70 62 70
United Arab Emirates
5 165 5 165 368 5 165
Yemen 165 678 109 908 109 506 –
Malaria in the Eastern Mediterranean Region 2013
8
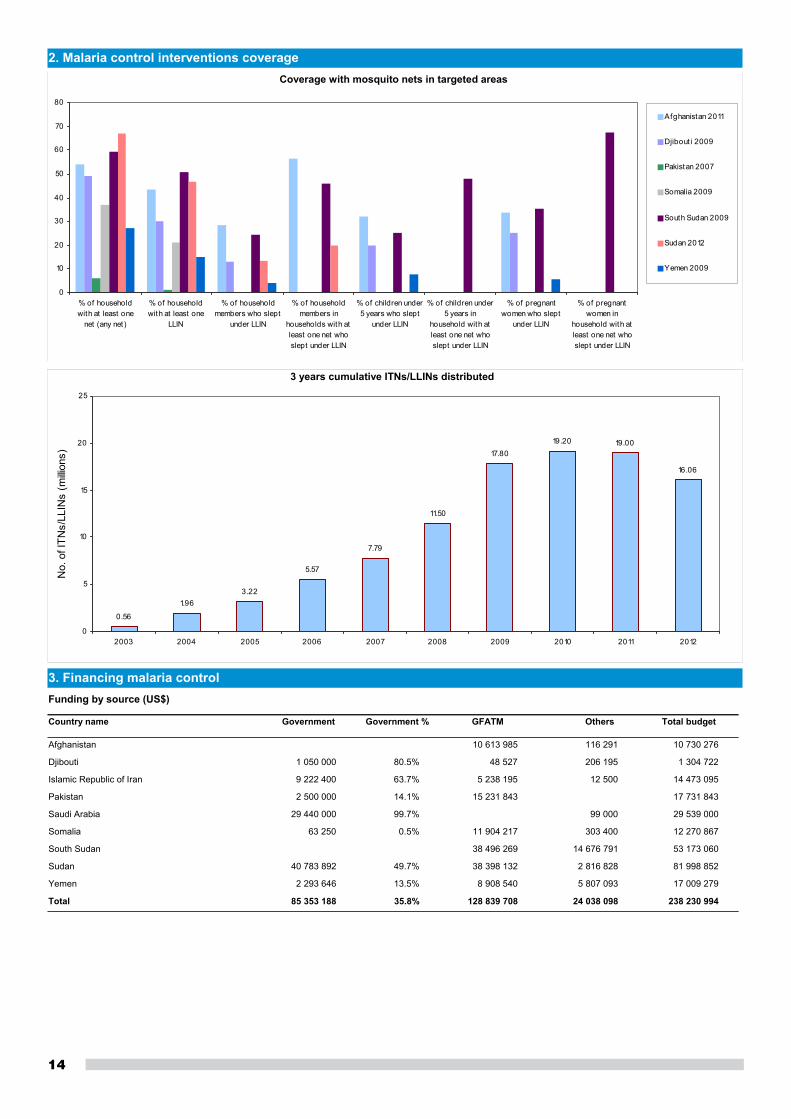
The Sudan malaria indicator survey conducted in 2012 showed that ownership of insecticide-treated nets was 62% in targeted states. In Afghanistan, the percentage of households that had at least one LLIN in targeted areas was 43.4%, far below the target of 80%. Usage of LLINs was low, yet slightly higher in children under 5 years of age.
There has been a gradual increase in the number of LLINs distributed in the Region in recent years. The number of LLINs distributed in 2009–2011 showed a marked and significant rise. However, in 2012 there was some decrease in the number of distributed LLINs. Considering that the duration of an LLIN is an average of 3 years and that one net will protect two persons, about 32 million people were protected in 2012, representing 16% decrease in comparison with 2011.
Indoor residual spraying (IRS) is recommended as one of the main vector control interventions in six endemic countries in the Region. IRS and LLINs are used together for malaria control in at least some areas in three countries. The quality of data reported by countries on IRS operations is not good and is incomplete in many countries. The total reported number of people protected by IRS in endemic countries is more than 13.2 million. The highest number is in Sudan with more than 4.5 million, mainly in agricultural areas.
Diagnosis
Malaria diagnosis is free of charge in the public sector in all malaria-endemic countries. three countries reported that RDTs are used at the community level. Access to diagnostic facilities for malaria is still limited. The health facility survey in Sudan 2009 showed that only 43% of facilities had functional microscopy and 15.8% had RDTs. The 2009 Pakistan survey showed 34% of health facilities had arrangements for diagnosis of malaria either through malaria microscopy or RDT. A total of more than 3.8 million RDTs were delivered in 2012 for malaria diagnosis in six countries (Pakistan, Saudi Arabia, Somalia, South Sudan, Sudan and Yemen). In 2012, based on the surveillance reports from all countries of the Region, only 17.6% of cases were diagnosed either by microscopy or RDT and the rest were treated on clinical basis.
Treatment
Artemisinin-based combination therapies (ACTs) have been adopted as the first-line treatment in all countries of the Region where falciparum malaria is endemic. In 2012 nine endemic countries reported that ACTs are free of charge for all age groups in the public sector. In five countries ACTs are delivered at community level. Six countries reported that they have adopted pre-referral treatment with quinine/artemether/artesunate suppositories. A 2012 survey in Sudan showed that 56.3% of fever cases among children under 5 years of age who were treated for malaria received ACTs. In some countries many patients are still being treated with artemisinin monotherapies, particularly in the private sector. Access to diagnostic testing is insufficient, resulting in unnecessary use of artemisinin-based combination therapy for patients without malaria. Guided by a pilot project in South Kordofan, Sudan developed a national strategy of community-based management of malaria and other fevers using the services of trained volunteers. Afghanistan developed the national community-based strategy for malaria in late 2010.
Malaria in the Eastern Mediterranean Region 2013
9
3. Malaria country profiles
The Eastern Mediterranean Region spans three different eco-epidemiological zones and includes countries with wide variation in socioeconomic development status. The diversity of environment influences the malaria situation and is a major determinant of success in malaria control between and even within countries. To address these variations, the regional malaria programme has categorized the countries of the Region into three groups (based on information available in 2012. For individual country profiles, see Annex 2 (and Annex 3 for abbreviations).
Group 1: Countries with moderate/high malaria burden, weak health systems, and/or complex emergencies
Objective: To continue reducing the incidence of malaria by the end of 2015 (>75% in comparison to 2000) and reduce malaria mortality to zero in all countries.
The countries of this group are currently Afghanistan, Djibouti, Pakistan, Somalia, Sudan, South Sudan and Yemen. They represent about 48% of the population of the Region. These countries have areas that are at high risk of malaria transmission or are threatened by epidemics and/or complex emergency situations.
Afghanistan reported reductions in confirmed malaria cases of >50% between 2000 and 2010. Djibouti, Pakistan, Somalia, Sudan, South Sudan and Yemen have not reported consistent decreases in the number of cases. Significant reduction of cases was recorded in certain geographic areas such as Khartoum (Sudan) and Socotra (Yemen), the latter being almost malaria-free with no local cases since 2006.
Malaria is considered to be important heath problem. Inadequacy, or in some instances lack, of human resources and capacity at the country level is one of the major constraints impeding development, implementation and sustainability of malaria control in the countries of this group. Management of the logistics system continues to be a major problem due to high operational costs. The security situation in some countries also continues to pose a challenge.
Priority is being given to strengthening the capacity of malaria control programmes, especially at lower levels, for country-wide implementation of malaria control interventions. Ensuring universal access to effective diagnostic and treatment services for testing, treating and tracking every case and rational use of cost-effective prevention measures should be emphasized in all malaria-risk areas.
Group 2: Countries with low malaria transmission limited to small geographic areas and targeting malaria elimination
Objective: To interrupt malaria transmission in 50% of endemic districts.
This group currently comprises two countries, Islamic Republic of Iran and Saudi Arabia, which account for 17% of the regional population. These countries have achieved a steady decline in malaria over the past decade. The remaining malaria in these countries includes all epidemiological types of malaria (Palaearctic and Oriental types in the Islamic Republic of Iran and Afrotropical type in Saudi Arabia). The malaria control programme in these countries is self-reliant, has strong political and financial support from the national authorities and is also well-supported by developed health systems at the central and peripheral levels. Certain epidemiological and socioeconomic factors, such as education, equity in resource allocation for marginalized populations and general development in the social and economic infrastructure, also contribute favourably towards the objective of malaria elimination.
Malaria in the Eastern Mediterranean Region 2013
10
The Islamic Republic of Iran recorded a low of 787 local cases in 2012, with significant reduction of P. falciparum and mixed cases (only 76 cases). With planned intensification of elimination efforts it is expected that falciparum malaria will be eliminated in the very near future.
In 2012 Saudia Arabia reported 82 local cases only, compared to 4736 in 2000. Saudi Arabia is very close to elimination, but faces several challenges in the last mile of elimination. Addressing these will require a very strong surveillance system and border coordination with Yemen.
The major challenges to achieving the objectives and sustaining these achievements are competing priorities from other communicable and noncommunicable diseases, huge population movement from several malaria-endemic countries and the need for cooperation and coordination of malaria activities with neighbouring countries, especially across the border areas.
Group 3: Countries which have eliminated malaria
Objective: To prevent re-establishment of malaria transmission.
This group comprises the countries in which malaria was eliminated a long time ago (Bahrain, Jordan, Kuwait, Lebanon, Libya, occupied Palestinian territory, Qatar and Tunisia), and those which have achieved certification of elimination in the past decade (Morocco and United Arab Emirates). It also includes countries that have interrupted local transmission for more than three years within the past decade, but where elimination is not yet certified (Egypt, Iraq, Oman and Syrian Arab Republic). In all these countries a few local cases may occur as a result of importation but the programme is strongly committed and capable of proper response to prevent re-establishment of local malaria transmission.
The main challenge for this group is to prevent re-establishment of local malaria transmission in the presence of continual population movements from malaria-endemic countries. Other challenges include maintaining collaboration in border areas and maintaining awareness of malaria risk and the skills to diagnose and promptly treat the disease among the health staff of governmental and private health care facilities. It is equally important to maintain malaria awareness among members of the community, particularly among those individuals regularly travelling to malaria-endemic countries.
Annex 1.Regional summary profile
The boundaries and names shown and the designations used on this map do not imply the expression of any opinion whatsoever on the part of the World Health Organization concerning the legal status of any country, territory, city or area or of its authorities, or concerning the delimitation of its frontiers or boundaries. Dotted and dashed lines on maps represent approximate border lines for which there may not yet be full agreement.
Data source: Ministry of Health-annual surveillance reports to WHOMap production: WHO Regional Office for the Eastern MediterraneanWorld Health Organization© WHO 2014. All rights reserved.

13
Malaria in the Eastern Mediterranean Region
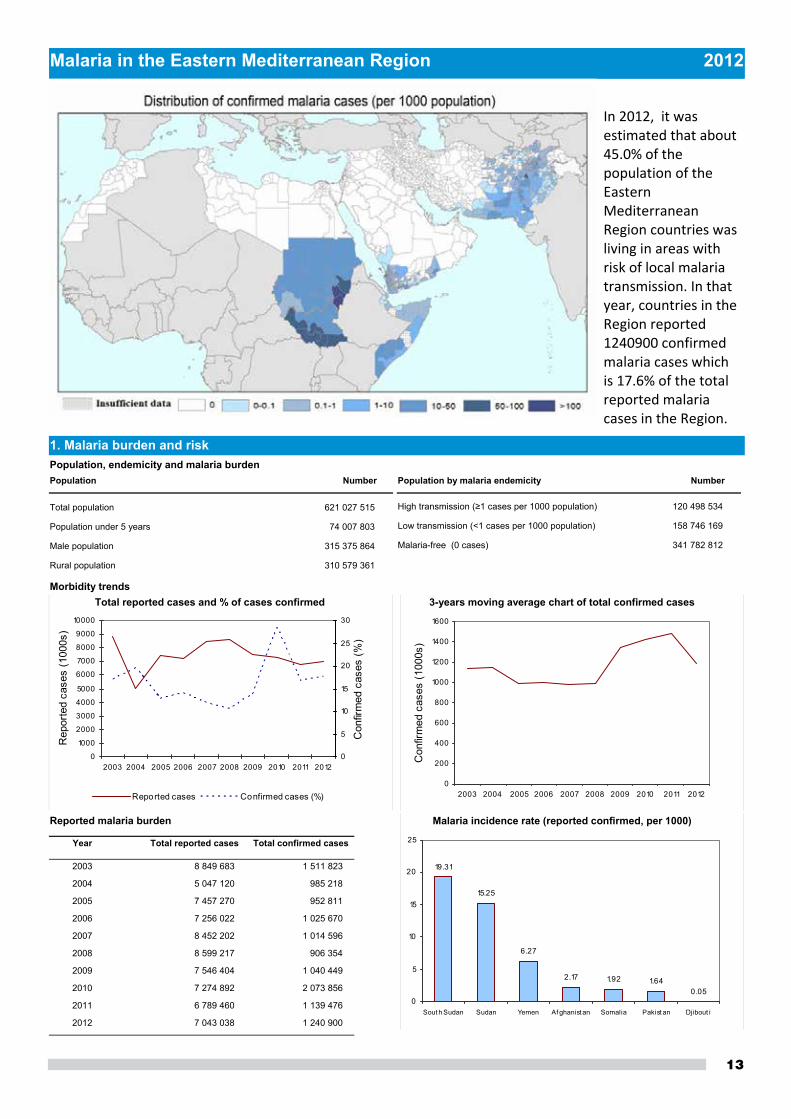
In 2012, it was estimated that about 45.0% of the population of the Eastern Mediterranean Region countries was living in areas with risk of local malaria transmission. In that year, countries in the Region reported 1240900 confirmed malaria cases which is 17.6% of the total reported malaria cases in the Region.
2012
Morbidity trends
1. Malaria burden and riskPopulation, endemicity and malaria burden
Total population 621 027 515
Population under 5 years 74 007 803
Male population 315 375 864
Rural population 310 579 361
Population Number
3-years moving average chart of total confirmed cases
0
200
400
600
800
1000
1200
1400
1600
2003 2004 2005 2006 2007 2008 2009 2010 2011 2012
Con
firm
ed c
ases
(100
0s)
Total reported cases and % of cases confirmed
0
1000
2000
3000
4000
5000
6000
7000
8000
9000
10000
2003 2004 2005 2006 2007 2008 2009 2010 2011 2012
Rep
orte
d ca
ses
(100
0s)
0
5
10
15
20
25
30
Con
firm
ed c
ases
(%)
Reported cases Confirmed cases (%)
Year Total reported cases Total confirmed cases
Reported malaria burden
2003 8 849 683 1 511 823
2004 5 047 120 985 218
2005 7 457 270 952 811
2006 7 256 022 1 025 670
2007 8 452 202 1 014 596
2008 8 599 217 906 354
2009 7 546 404 1 040 449
2010 7 274 892 2 073 856
2011 6 789 460 1 139 476
2012 7 043 038 1 240 900
Malaria incidence rate (reported confirmed, per 1000)
19.31
15.25
6.27
2.17 1.92 1.640.05
0
5
10
15
20
25
Sout h Sudan Sudan Yemen Af ghanist an Somalia Pakist an Djibout i
High transmission (≥1 cases per 1000 population) 120 498 534
Low transmission (<1 cases per 1000 population) 158 746 169
Malaria-free (0 cases) 341 782 812
Population by malaria endemicity Number
14
2. Malaria control interventions coverage
3. Financing malaria control
0
10
20
30
40
50
60
70
80
% of householdwith at least one
net (any net)
% of householdwith at least one
LLIN
% of householdmembers who slept
under LLIN
% of householdmembers in
households with atleast one net whoslept under LLIN
% of children under5 years who slept
under LLIN
% of children under5 years in
household with atleast one net whoslept under LLIN
% of pregnantwomen who slept
under LLIN
% of pregnantwomen in
household with atleast one net whoslept under LLIN
Afghanistan 2011
Djibouti 2009
Pakistan 2007
Somalia 2009
South Sudan 2009
Sudan 2012
Yemen 2009
Coverage with mosquito nets in targeted areas
3 years cumulative ITNs/LLINs distributed
0.56
1.963.22
5.57
7.79
11.50
17.8019.20 19.00
16.06
0
5
10
15
20
25
2003 2004 2005 2006 2007 2008 2009 2010 2011 2012
No.
of I
TNs/
LLIN
s (m
illion
s)
Country name Government GFATM
Funding by source (US$)
Total budgetOthersGovernment %
Afghanistan 10 613 985 10 730 276116 291
Djibouti 1 050 000 48 527 1 304 722206 19580.5%
Islamic Republic of Iran 9 222 400 5 238 195 14 473 09512 50063.7%
Pakistan 2 500 000 15 231 843 17 731 84314.1%
Saudi Arabia 29 440 000 29 539 00099 00099.7%
Somalia 63 250 11 904 217 12 270 867303 4000.5%
South Sudan 38 496 269 53 173 06014 676 791
Sudan 40 783 892 38 398 132 81 998 8522 816 82849.7%
Yemen 2 293 646 8 908 540 17 009 2795 807 09313.5%
85 353 188 128 839 708 238 230 99424 038 098Total 35.8%
Annex 2.Country profiles
The boundaries and names shown and the designations used on these maps do not imply the expression of any opinion whatsoever on the part of the World Health Organization concerning the legal status of any country, territory, city or area or of its authorities, or concerning the delimitation of its frontiers or boundaries. Dotted and dashed lines on maps represent approximate border lines for which there may not yet be full agreement.
Data source: Ministry of Health annual surveillance reports to WHOMap production: WHO Regional Office for the Eastern MediterraneanWorld Health Organization© WHO 2014. All rights reserved.

17
Afghanistan 2012
Afghanistan accounts for 7.5% of the population at high risk of malaria in the Eastern Mediterranean Region and 4.4% of the confirmed cases. 16.7% of households in targeted areas have at least one ITN for every two household members (2011). The total reported number of available and functional LLINs in the country is 4312833.
1. Malaria burden and risk
Morbidity and mortality trends
Population, endemicity and malaria burden
Total population 33 397 058
Population under 5 years 5 816 834
Male population 17 275 734
Rural population 25 849 323
High transmission (≥1 cases per 1000 population) 8 987 937
Low transmission (<1 cases per 1000 population) 16 252 020
Malaria-free (0 cases) 8 157 101
Population
Population by malaria endemicity
51.7
17.4
77.4
26.9
48.7
24.4
Number %
Total confirmed cases and % of P. falciparum + mixed cases
0
50
100
150
200
250
300
350
400
2003 2004 2005 2006 2007 2008 2009 2010 2011 2012
Con
firm
ed c
ases
(100
0s)
0
2
4
6
8
10
12
14
P. fa
lcip
arum
+ m
ixed
(%)
Confirmed cases P falciparum+ mixed (%)
Total reported cases and % of cases confirmed
0
100
200
300
400
500
600
700
2003 2004 2005 2006 2007 2008 2009 2010 2011 2012
Rep
orte
d ca
ses
(100
0s)
0
10
20
30
40
50
60
70
80
90
100
Con
firm
ed c
ases
(%)
Reported cases Confirmed cases (%)
Total slides examined
0
100
200
300
400
500
600
2003 2004 2005 2006 2007 2008 2009 2010 2011 2012
Slid
es (1
000s
)
3-years moving average chart of total confirmed cases
0
50
100
150
200
250
300
350
400
2003 2004 2005 2006 2007 2008 2009 2010 2011 2012
Con
firm
ed c
ases
(100
0s)
Vector profile
An. stephensi
An. superpictus
An. hyrcanus
An. pulcherrimus
An. culicifacies
An. fluviatilis
Parasite profile
P. vivax>P. falciparum

18
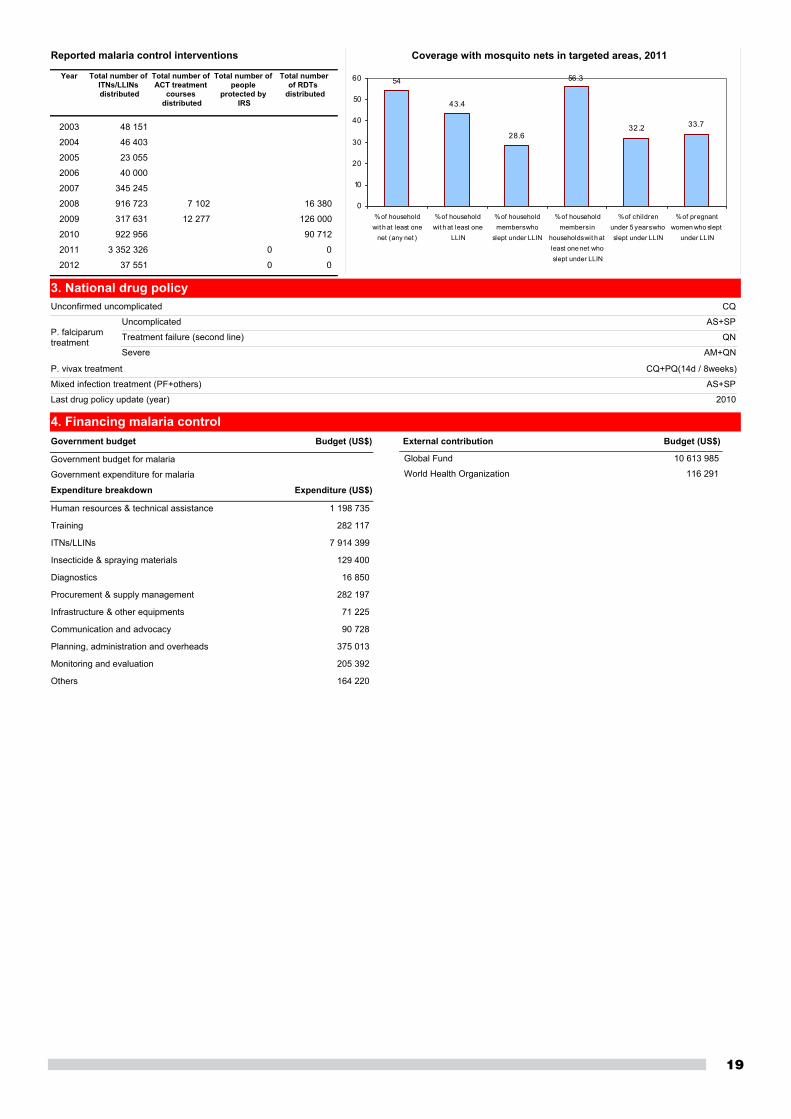
2. Malaria control interventions coverage
Malaria admissions and number of malaria deaths
0
1
2
3
4
5
6
2003 2004 2005 2006 2007 2008 2009 2010 2011 2012
Adm
issi
on (1
000s
)
0
5
10
15
20
25
30
35
40
45
50
Mal
aria
dea
ths
M alaria admission M alaria deaths
Year Total reported cases
Total Microscopy RDTs Total Microscopy RDTs
P. falciparum + mixed
P. vivax + others
Confirmed cases Number of tests
Reported malaria burden
2003 585 602 360 940 360 940 44 243 316 697
2004 273 377 242 022 242 022 248 946 248 946 12 789 229 233
2005 326 694 116 444 116 444 338 253 338 253 5 917 110 527
2006 414 407 86 129 86 129 460 908 460 908 6 216 79 913
2007 456 490 92 202 92 202 504 856 504 856 6 283 85 919
2008 467 123 81 574 81 574 549 494 549 494 4 355 77 219
2009 390 729 64 880 64 880 521 817 521 817 4 026 60 854
2010 392 463 69 397 69 397 524 523 524 523 6 142 63 255
2011 482 748 77 549 77 549 0 531 053 531 053 0 5 581 71 968
2012 391 365 54 840 54 840 0 511 408 511 408 0 1 231 53 609
Year
All ages Under 5 years All ages Under 5 years
Malaria admissions Malaria deaths
Malaria admissions and deaths
2003
2004
2005 0
2006 4 233 1 467
2007 4 793 1 865 25
2008 4 434 1 239 46
2009 3 920 923 32
2010 4 724 1 649 22
2011 5 144 2 324 40
2012 4 220 1 616 36
Total number of ITNs/LLINs distributed
0
500
1000
1500
2000
2500
3000
3500
4000
2003 2004 2005 2006 2007 2008 2009 2010 2011 2012
No.
of I
TNs/
LLIN
s (1
000s
)
Total number of people protected by IRS
0
0.0001
0.0002
0.0003
0.0004
0.0005
0.0006
0.0007
0.0008
0.0009
0.001
2003 2004 2005 2006 2007 2008 2009 2010 2011 2012
No.
of p
eopl
e pr
otec
ted
(100
0s)
Total number of ACT treatment courses distributed
0
2
4
6
8
10
12
14
2003 2004 2005 2006 2007 2008 2009 2010 2011 2012
No.
of c
ours
es (1
000s
)
Total number of RDTs distributed
0
20
40
60
80
100
120
140
2003 2004 2005 2006 2007 2008 2009 2010 2011 2012
No.
of R
DTs
dis
tibut
ed (1
000s
)
19
3. National drug policy
4. Financing malaria control
Coverage with mosquito nets in targeted areas, 2011
54
43.4
28.6
56.3
32.2 33.7
0
10
20
30
40
50
60
% of householdwit h at least one
net (any net )
% of householdwit h at least one
LLIN
% of householdmembers who
slept under LLIN
% of householdmembers in
households wit h atleast one net whoslept under LLIN
% of childrenunder 5 years whoslept under LLIN
% of pregnantwomen who slept
under LLIN
CQ
AS+SP
QN
AM+QN
CQ+PQ(14d / 8weeks)
AS+SP
2010
Unconfirmed uncomplicated
Uncomplicated
Treatment failure (second line)
Severe
P. vivax treatment
Last drug policy update (year)
P. falciparumtreatment
Mixed infection treatment (PF+others)
Government budget Budget (US$)
Government budget for malaria
Government expenditure for malaria
External contribution Budget (US$)
Global Fund 10 613 985
World Health Organization 116 291
Expenditure (US$)Expenditure breakdown
1 198 735Human resources & technical assistance
282 117Training
7 914 399ITNs/LLINs
129 400Insecticide & spraying materials
16 850Diagnostics
282 197Procurement & supply management
71 225Infrastructure & other equipments
90 728Communication and advocacy
375 013Planning, administration and overheads
205 392Monitoring and evaluation
164 220Others
Year Total number of ITNs/LLINs distributed
Total number of ACT treatment
courses distributed
Total number of people
protected by IRS
Total number of RDTs
distributed
Reported malaria control interventions
2003 48 151
2004 46 403
2005 23 055
2006 40 000
2007 345 245
2008 916 723 7 102 16 380
2009 317 631 12 277 126 000
2010 922 956 90 712
2011 3 352 326 0 0
2012 37 551 0 0
20
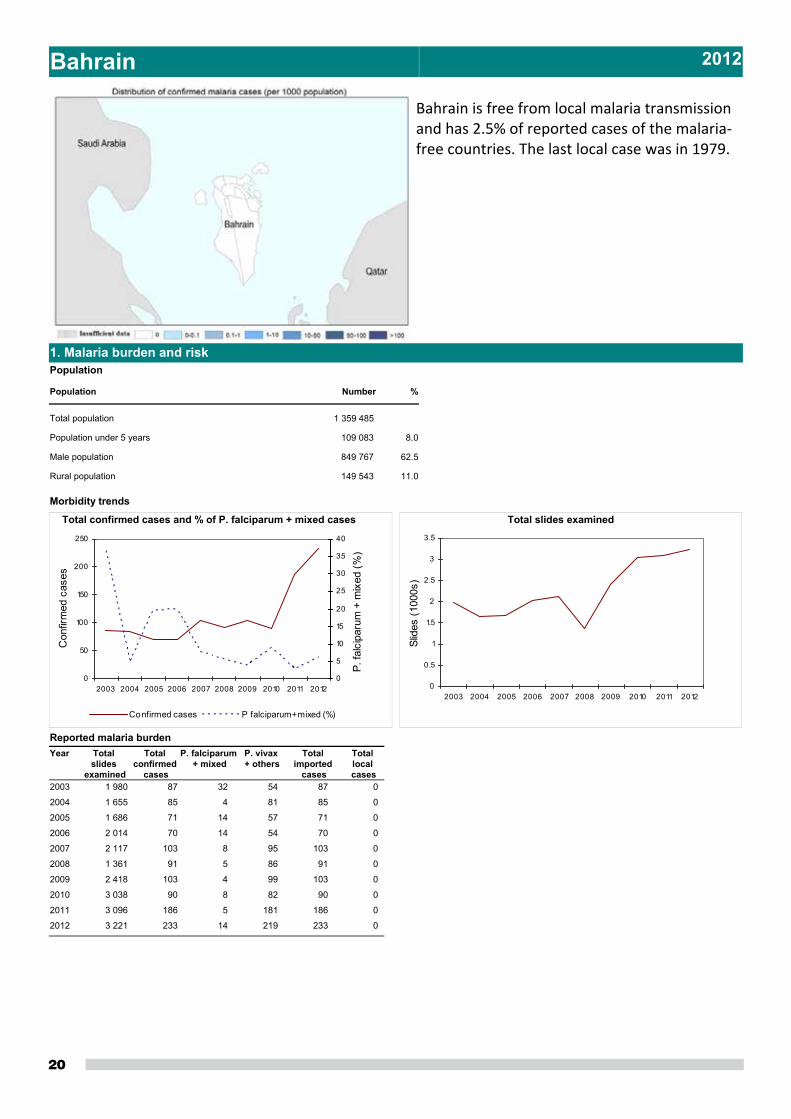
Bahrain 2012
Bahrain is free from local malaria transmission and has 2.5% of reported cases of the malaria‐free countries. The last local case was in 1979.
Morbidity trends
1. Malaria burden and riskPopulation
Total population 1 359 485
Population under 5 years 109 083
Male population 849 767
Rural population 149 543
Population
62.5
8.0
11.0
Number %
Total slides examined
0
0.5
1
1.5
2
2.5
3
3.5
2003 2004 2005 2006 2007 2008 2009 2010 2011 2012
Slid
es (1
000s
)
Total confirmed cases and % of P. falciparum + mixed cases
0
50
100
150
200
250
2003 2004 2005 2006 2007 2008 2009 2010 2011 2012
Con
firm
ed c
ases
0
5
10
15
20
25
30
35
40
P. fa
lcip
arum
+ m
ixed
(%)
Confirmed cases P falciparum+ mixed (%)
Year Total slides
examined
Total confirmed
cases
P. falciparum + mixed
Reported malaria burdenP. vivax + others
Total imported
cases
Total local cases
2003 1 980 87 32 54 87 0
2004 1 655 85 4 81 85 0
2005 1 686 71 14 57 71 0
2006 2 014 70 14 54 70 0
2007 2 117 103 8 95 103 0
2008 1 361 91 5 86 91 0
2009 2 418 103 4 99 103 0
2010 3 038 90 8 82 90 0
2011 3 096 186 5 181 186 0
2012 3 221 233 14 219 233 0
21
2. National drug policy
3. Financing malaria control
QN+D
SP
QN
CQ+PQ
2006
Unconfirmed uncomplicated
Uncomplicated
Treatment failure (second line)
Severe
P. vivax treatment
Last drug policy update (year)
P. falciparumtreatment
Mixed infection treatment (PF+others)
22
Djibouti 2012
Djibouti accounts for 0.0% of the population at high risk of malaria in the Eastern Mediterranean Region and 0.0% of the confirmed cases. The total reported number of available and functional LLINs in the country is 54800.
1. Malaria burden and risk
Morbidity and mortality trends
Population, endemicity and malaria burden
Total population 922 708
Population under 5 years 116 475
Male population 461 633
Rural population 219 290
High transmission (≥1 cases per 1000 population) 0
Low transmission (<1 cases per 1000 population) 461 354
Malaria-free (0 cases) 461 354
Population
Population by malaria endemicity
50.0
12.6
23.8
0.0
50.0
50.0
Number %
Total confirmed cases and % of P. falciparum + mixed cases
0
1
2
3
4
5
6
2003 2004 2005 2006 2007 2008 2009 2010 2011 2012
Con
firm
ed c
ases
(100
0s)
0
20
40
60
80
100
120
P. fa
lcip
arum
+ m
ixed
(%)
Confirmed cases P falciparum+ mixed (%)
Total reported cases and % of cases confirmed
0
1
2
3
4
5
6
7
2003 2004 2005 2006 2007 2008 2009 2010 2011 2012
Rep
orte
d ca
ses
(100
0s)
0
20
40
60
80
100
120
Con
firm
ed c
ases
(%)
Reported cases Confirmed cases (%)
Total slides examined
0
0.5
1
1.5
2
2.5
3
3.5
4
2003 2004 2005 2006 2007 2008 2009 2010 2011 2012
Slid
es (1
000s
)
3-years moving average chart of total confirmed cases
0
0.5
1
1.5
2
2.5
3
2003 2004 2005 2006 2007 2008 2009 2010 2011 2012
Con
firm
ed c
ases
(100
0s)
Vector profile
An. gambiae
An. arabiensis
Parasite profile
P. falciparum>P. vivax
23
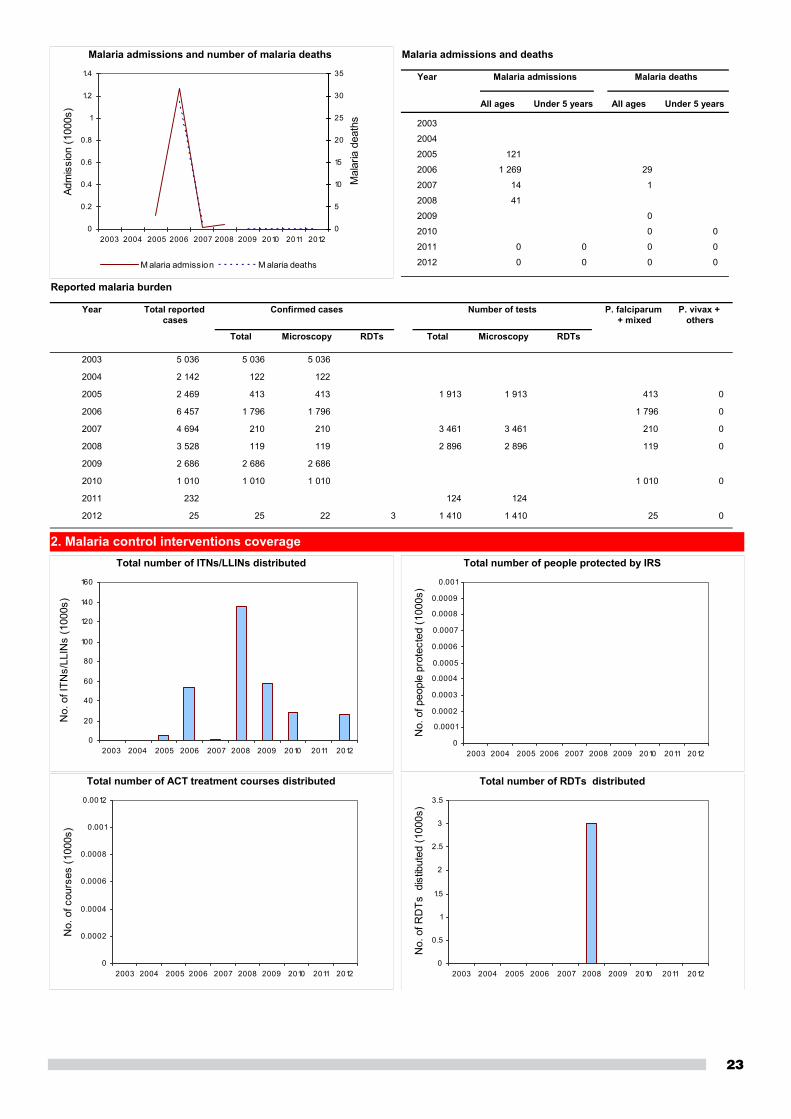
2. Malaria control interventions coverage
Malaria admissions and number of malaria deaths
0
0.2
0.4
0.6
0.8
1
1.2
1.4
2003 2004 2005 2006 2007 2008 2009 2010 2011 2012
Adm
issi
on (1
000s
)
0
5
10
15
20
25
30
35
Mal
aria
dea
ths
M alaria admission M alaria deaths
Year Total reported cases
Total Microscopy RDTs Total Microscopy RDTs
P. falciparum + mixed
P. vivax + others
Confirmed cases Number of tests
Reported malaria burden
2003 5 036 5 036 5 036
2004 2 142 122 122
2005 2 469 413 413 1 913 1 913 413 0
2006 6 457 1 796 1 796 1 796 0
2007 4 694 210 210 3 461 3 461 210 0
2008 3 528 119 119 2 896 2 896 119 0
2009 2 686 2 686 2 686
2010 1 010 1 010 1 010 1 010 0
2011 232 124 124
2012 25 25 22 3 1 410 1 410 25 0
Year
All ages Under 5 years All ages Under 5 years
Malaria admissions Malaria deaths
Malaria admissions and deaths
2003
2004
2005 121
2006 1 269 29
2007 14 1
2008 41
2009 0
2010 0 0
2011 0 0 0 0
2012 0 0 0 0
Total number of ITNs/LLINs distributed
0
20
40
60
80
100
120
140
160
2003 2004 2005 2006 2007 2008 2009 2010 2011 2012
No.
of I
TNs/
LLIN
s (1
000s
)
Total number of people protected by IRS
0
0.0001
0.0002
0.0003
0.0004
0.0005
0.0006
0.0007
0.0008
0.0009
0.001
2003 2004 2005 2006 2007 2008 2009 2010 2011 2012
No.
of p
eopl
e pr
otec
ted
(100
0s)
Total number of ACT treatment courses distributed
0
0.0002
0.0004
0.0006
0.0008
0.001
0.0012
2003 2004 2005 2006 2007 2008 2009 2010 2011 2012
No.
of c
ours
es (1
000s
)
Total number of RDTs distributed
0
0.5
1
1.5
2
2.5
3
3.5
2003 2004 2005 2006 2007 2008 2009 2010 2011 2012
No.
of R
DTs
dis
tibut
ed (1
000s
)
24
3. National drug policy
4. Financing malaria control
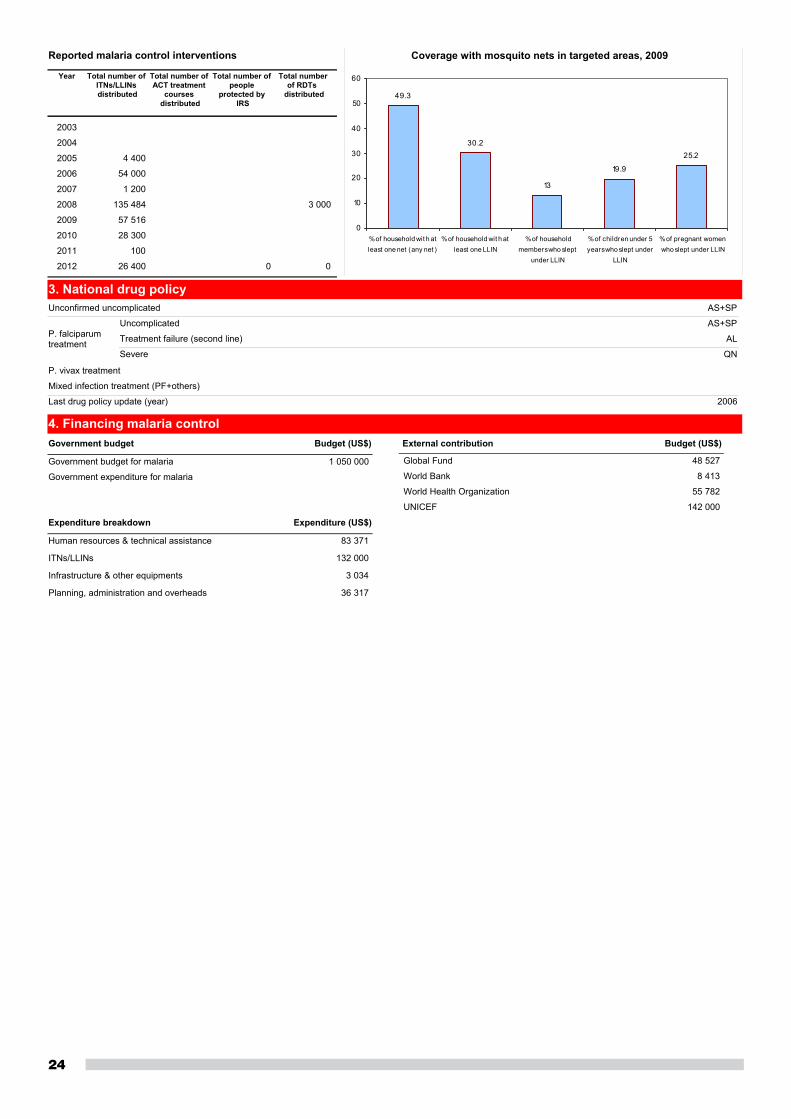
Coverage with mosquito nets in targeted areas, 2009
49.3
30.2
13
19.9
25.2
0
10
20
30
40
50
60
% of household wit h atleast one net (any net )
% of household wit h atleast one LLIN
% of householdmembers who slept
under LLIN
% of children under 5years who slept under
LLIN
% of pregnant womenwho slept under LLIN
AS+SP
AS+SP
AL
QN
2006
Unconfirmed uncomplicated
Uncomplicated
Treatment failure (second line)
Severe
P. vivax treatment
Last drug policy update (year)
P. falciparumtreatment
Mixed infection treatment (PF+others)
Government budget Budget (US$)
1 050 000Government budget for malaria
Government expenditure for malaria
External contribution Budget (US$)
Global Fund 48 527
World Bank 8 413
World Health Organization 55 782
UNICEF 142 000
Expenditure (US$)Expenditure breakdown
83 371Human resources & technical assistance
132 000ITNs/LLINs
3 034Infrastructure & other equipments
36 317Planning, administration and overheads
Year Total number of ITNs/LLINs distributed
Total number of ACT treatment
courses distributed
Total number of people
protected by IRS
Total number of RDTs
distributed
Reported malaria control interventions
2003
2004
2005 4 400
2006 54 000
2007 1 200
2008 135 484 3 000
2009 57 516
2010 28 300
2011 100
2012 26 400 0 0
25
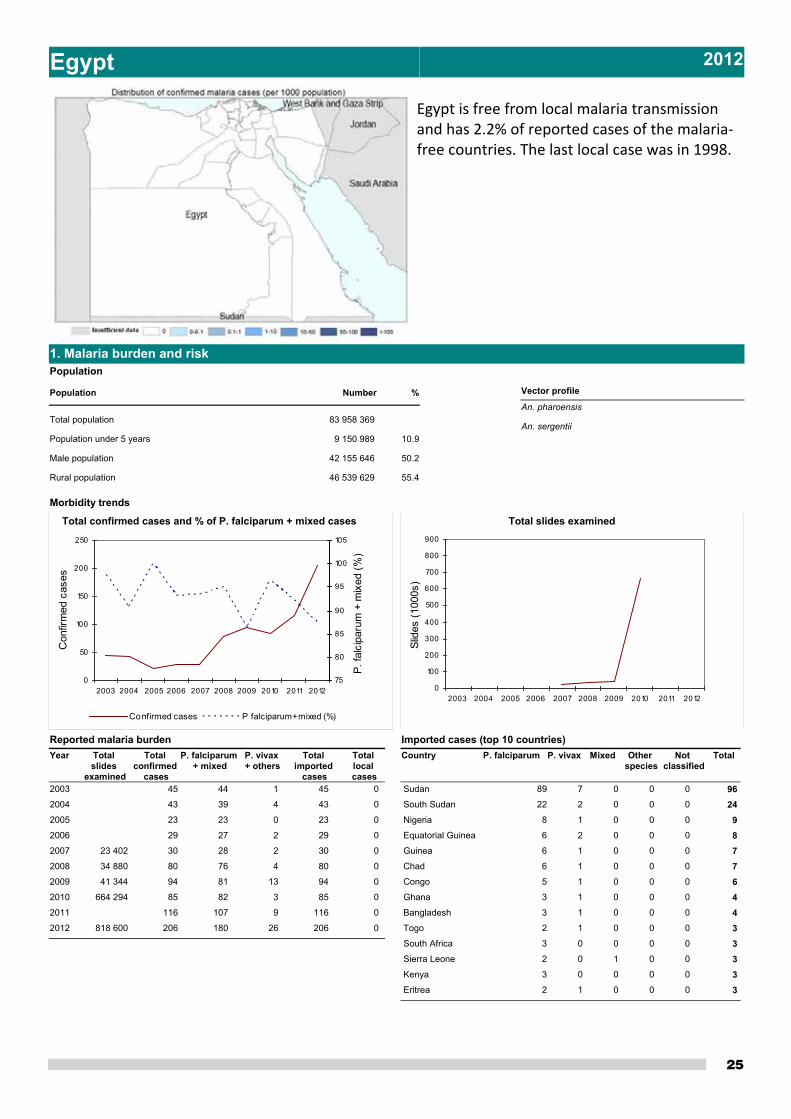
Egypt 2012
Egypt is free from local malaria transmission and has 2.2% of reported cases of the malaria‐free countries. The last local case was in 1998.
Morbidity trends
1. Malaria burden and riskPopulation
Total population 83 958 369
Population under 5 years 9 150 989
Male population 42 155 646
Rural population 46 539 629
Population
50.2
10.9
55.4
Number %
Total slides examined
0
100
200
300
400
500
600
700
800
900
2003 2004 2005 2006 2007 2008 2009 2010 2011 2012
Slid
es (1
000s
)
Total confirmed cases and % of P. falciparum + mixed cases
0
50
100
150
200
250
2003 2004 2005 2006 2007 2008 2009 2010 2011 2012
Con
firm
ed c
ases
75
80
85
90
95
100
105
P. fa
lcip
arum
+ m
ixed
(%)
Confirmed cases P falciparum+ mixed (%)
Vector profile
An. pharoensis
An. sergentii
Year Total slides
examined
Total confirmed
cases
P. falciparum + mixed
Reported malaria burdenP. vivax + others
Total imported
cases
Total local cases
2003 45 44 1 45 0
2004 43 39 4 43 0
2005 23 23 0 23 0
2006 29 27 2 29 0
2007 23 402 30 28 2 30 0
2008 34 880 80 76 4 80 0
2009 41 344 94 81 13 94 0
2010 664 294 85 82 3 85 0
2011 116 107 9 116 0
2012 818 600 206 180 26 206 0
P. falciparumCountry P. vivax Mixed TotalOther species
Notclassified
Imported cases (top 10 countries)
Sudan 89 7 0 960 0
South Sudan 22 2 0 240 0
Nigeria 8 1 0 90 0
Equatorial Guinea 6 2 0 80 0
Guinea 6 1 0 70 0
Chad 6 1 0 70 0
Congo 5 1 0 60 0
Ghana 3 1 0 40 0
Bangladesh 3 1 0 40 0
Togo 2 1 0 30 0
South Africa 3 0 0 30 0
Sierra Leone 2 0 1 30 0
Kenya 3 0 0 30 0
Eritrea 2 1 0 30 0

26
2. National drug policy
3. Financing malaria control
AL
AL
QN
QN
AL+PQ
AL+PQ
Unconfirmed uncomplicated
Uncomplicated
Treatment failure (second line)
Severe
P. vivax treatment
Last drug policy update (year)
P. falciparumtreatment
Mixed infection treatment (PF+others)
27
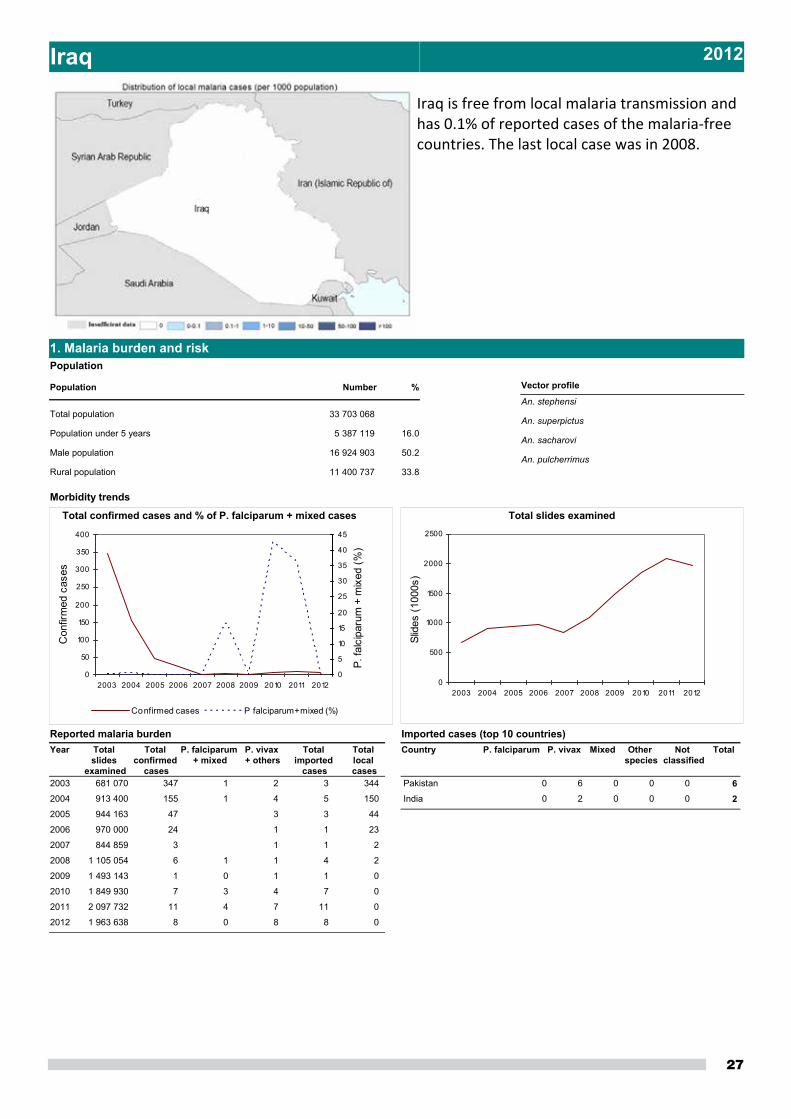
Iraq 2012
Iraq is free from local malaria transmission and has 0.1% of reported cases of the malaria‐free countries. The last local case was in 2008.
Morbidity trends
1. Malaria burden and riskPopulation
Total population 33 703 068
Population under 5 years 5 387 119
Male population 16 924 903
Rural population 11 400 737
Population
50.2
16.0
33.8
Number %
Total slides examined
0
500
1000
1500
2000
2500
2003 2004 2005 2006 2007 2008 2009 2010 2011 2012
Slid
es (1
000s
)
Total confirmed cases and % of P. falciparum + mixed cases
0
50
100
150
200
250
300
350
400
2003 2004 2005 2006 2007 2008 2009 2010 2011 2012
Con
firm
ed c
ases
0
5
10
15
20
25
30
35
40
45
P. fa
lcip
arum
+ m
ixed
(%)
Confirmed cases P falciparum+ mixed (%)
Vector profile
An. stephensi
An. superpictus
An. sacharovi
An. pulcherrimus
Year Total slides
examined
Total confirmed
cases
P. falciparum + mixed
Reported malaria burdenP. vivax + others
Total imported
cases
Total local cases
2003 681 070 347 1 2 3 344
2004 913 400 155 1 4 5 150
2005 944 163 47 3 3 44
2006 970 000 24 1 1 23
2007 844 859 3 1 1 2
2008 1 105 054 6 1 1 4 2
2009 1 493 143 1 0 1 1 0
2010 1 849 930 7 3 4 7 0
2011 2 097 732 11 4 7 11 0
2012 1 963 638 8 0 8 8 0
P. falciparumCountry P. vivax Mixed TotalOther species
Notclassified
Imported cases (top 10 countries)
Pakistan 0 6 0 60 0
India 0 2 0 20 0
28
2. National drug policy
3. Financing malaria control
AL
QN+D
QN
CQ+PQ
2011
Unconfirmed uncomplicated
Uncomplicated
Treatment failure (second line)
Severe
P. vivax treatment
Last drug policy update (year)
P. falciparumtreatment
Mixed infection treatment (PF+others)

29
Islamic Republic of Iran 2012
In 2012, the number of locally transmitted malaria cases decreased by 95.4% compared with 2003. During the period 2010 to 2012 the average number of reported locally transmitted cases was 1448.
Morbidity trends
1. Malaria burden and riskPopulation, endemicity and malaria burden
Total population 75 611 798
Population under 5 years 6 270 737
Male population 38 323 334
Rural population 22 114 184
No. of active foci 444
No. of people living within active foci 772 318
No. of people living in malaria-free areas 74 839 480
Population
Population by malaria endemicity
50.7
8.3
29.2
1.0
99.0
Number %
Local cases and % of P. falciparum+ mixed cases
0
2
4
6
8
10
12
14
16
18
2003 2004 2005 2006 2007 2008 2009 2010 2011 2012
Loca
l cas
es (1
000s
)
0
2
4
6
8
10
12
14
P. fa
lcip
arum
+ m
ixed
(%)
Local cases P falciparum+ mixed (%)
Confirmed cases and % of local cases
0
5
10
15
20
25
2003 2004 2005 2006 2007 2008 2009 2010 2011 2012
Con
firm
ed c
ases
(100
0s)
0
10
20
30
40
50
60
70
80
90
Loca
l cas
es (%
)
Confirmed cases Local cases (%)
Total slides examined
0
200
400
600
800
1000
1200
1400
1600
1800
2003 2004 2005 2006 2007 2008 2009 2010 2011 2012
Slid
es (1
000s
)
P. falciparumCountry P. vivax Mixed TotalOther species
Notclassified
Imported cases (top 10 countries)
Pakistan 89 499 28 6160 0
Afghanistan 7 202 7 2160 0
Vector profile
An. stephensi
An. culicifacies
An. fluviatilis
An. superpictus
Parasite profile
P. vivax>P. falciparum
30
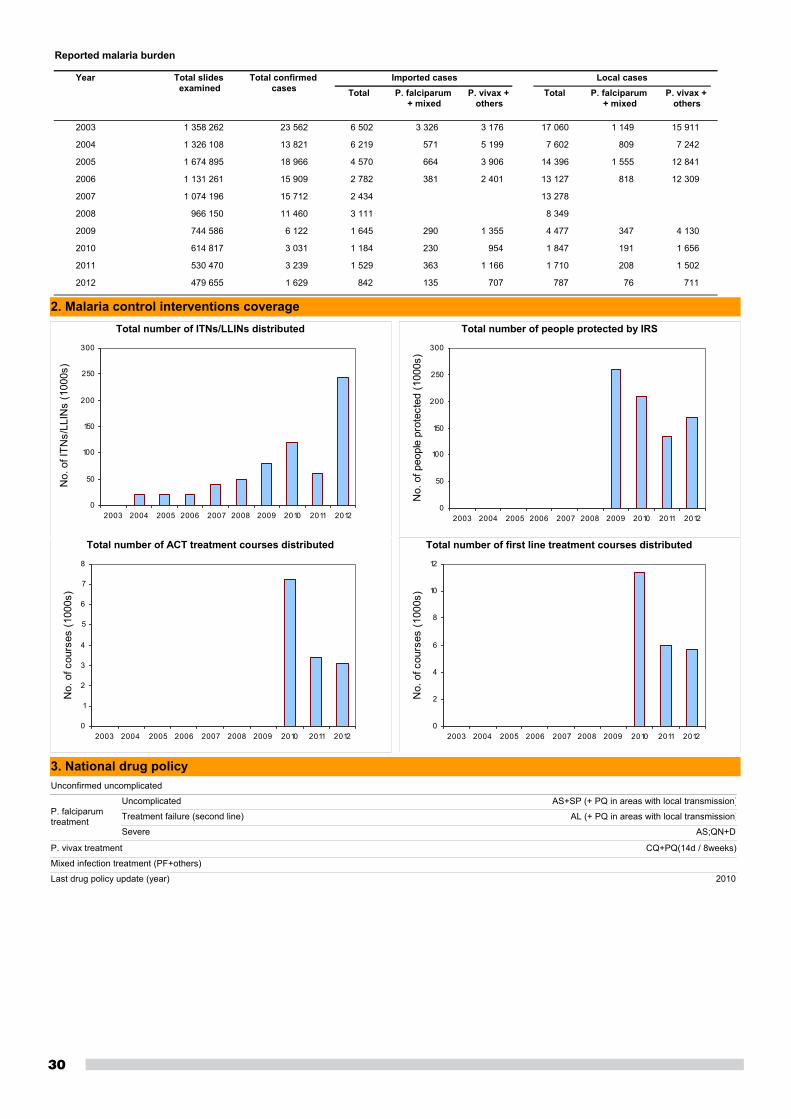
2. Malaria control interventions coverage
3. National drug policy
Year Total slides examined
Total confirmed cases Total P. falciparum
+ mixedTotal P. falciparum
+ mixedP. vivax +
others
Imported cases Local cases
Reported malaria burden
P. vivax + others
2003 1 358 262 23 562 6 502 3 326 17 060 1 149 15 9113 176
2004 1 326 108 13 821 6 219 571 7 602 809 7 2425 199
2005 1 674 895 18 966 4 570 664 14 396 1 555 12 8413 906
2006 1 131 261 15 909 2 782 381 13 127 818 12 3092 401
2007 1 074 196 15 712 2 434 13 278
2008 966 150 11 460 3 111 8 349
2009 744 586 6 122 1 645 290 4 477 347 4 1301 355
2010 614 817 3 031 1 184 230 1 847 191 1 656954
2011 530 470 3 239 1 529 363 1 710 208 1 5021 166
2012 479 655 1 629 842 135 787 76 711707
Total number of ITNs/LLINs distributed
0
50
100
150
200
250
300
2003 2004 2005 2006 2007 2008 2009 2010 2011 2012
No.
of I
TNs/
LLIN
s (1
000s
)
Total number of people protected by IRS
0
50
100
150
200
250
300
2003 2004 2005 2006 2007 2008 2009 2010 2011 2012
No.
of p
eopl
e pr
otec
ted
(100
0s)
Total number of ACT treatment courses distributed
0
1
2
3
4
5
6
7
8
2003 2004 2005 2006 2007 2008 2009 2010 2011 2012
No.
of c
ours
es (1
000s
)
Total number of first line treatment courses distributed
0
2
4
6
8
10
12
2003 2004 2005 2006 2007 2008 2009 2010 2011 2012
No.
of c
ours
es (1
000s
)
AS+SP (+ PQ in areas with local transmission)
AL (+ PQ in areas with local transmission)
AS;QN+D
CQ+PQ(14d / 8weeks)
2010
Unconfirmed uncomplicated
Uncomplicated
Treatment failure (second line)
Severe
P. vivax treatment
Last drug policy update (year)
P. falciparumtreatment
Mixed infection treatment (PF+others)
31
4. Financing malaria controlGovernment budget Budget (US$)
9 222 400
8 000 000
Government budget for malaria
Government expenditure for malaria
External contribution Budget (US$)
Global Fund 5 238 195
World Health Organization 12 500
Expenditure (US$)Expenditure breakdown
582 875Human resources & technical assistance
694 959Training
1 393 328ITNs/LLINs
2 270 404Insecticide & spraying materials
1 762 444Diagnostics
83 692Anti-malarial medicines
710 980Procurement & supply management
3 036 110Infrastructure & other equipments
208 546Communication and advocacy
155 554Planning, administration and overheads
141 488Monitoring and evaluation
2 210 315Others
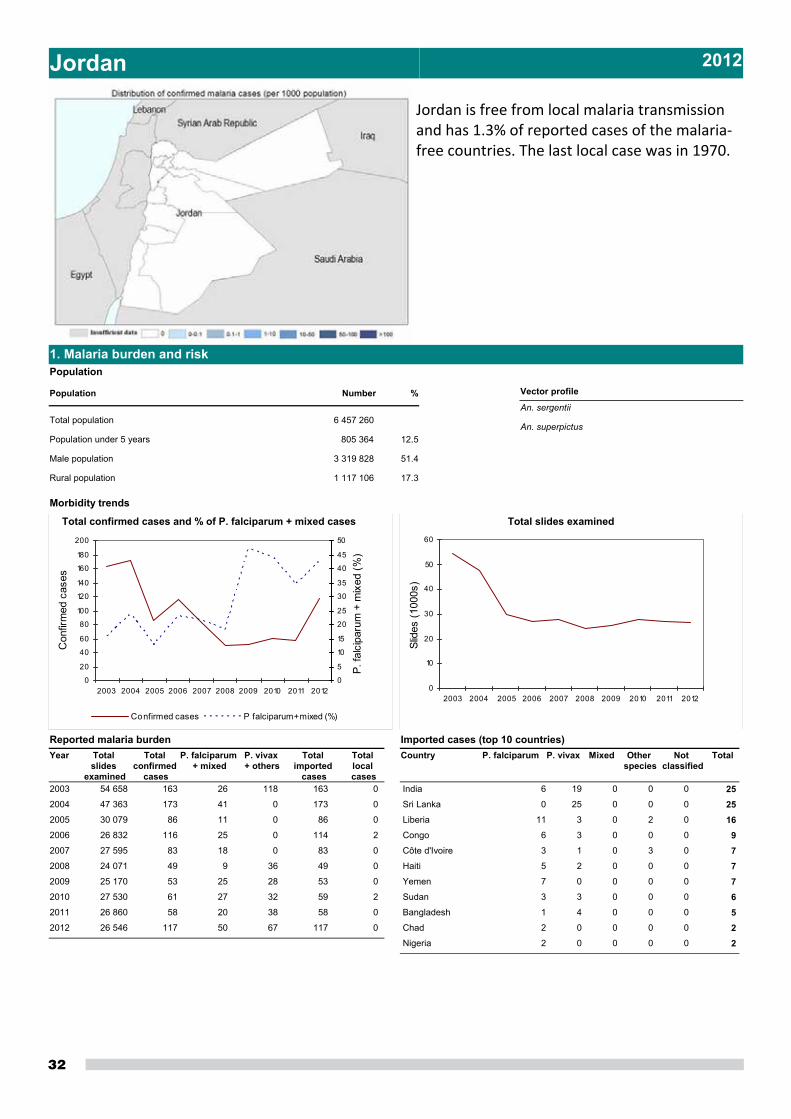
32
Jordan 2012
Jordan is free from local malaria transmission and has 1.3% of reported cases of the malaria‐free countries. The last local case was in 1970.
Morbidity trends
1. Malaria burden and riskPopulation
Total population 6 457 260
Population under 5 years 805 364
Male population 3 319 828
Rural population 1 117 106
Population
51.4
12.5
17.3
Number %
Total slides examined
0
10
20
30
40
50
60
2003 2004 2005 2006 2007 2008 2009 2010 2011 2012
Slid
es (1
000s
)
Total confirmed cases and % of P. falciparum + mixed cases
0
20
40
60
80
100
120
140
160
180
200
2003 2004 2005 2006 2007 2008 2009 2010 2011 2012
Con
firm
ed c
ases
0
5
10
15
20
25
30
35
40
45
50
P. fa
lcip
arum
+ m
ixed
(%)
Confirmed cases P falciparum+ mixed (%)
Vector profile
An. sergentii
An. superpictus
Year Total slides
examined
Total confirmed
cases
P. falciparum + mixed
Reported malaria burdenP. vivax + others
Total imported
cases
Total local cases
2003 54 658 163 26 118 163 0
2004 47 363 173 41 0 173 0
2005 30 079 86 11 0 86 0
2006 26 832 116 25 0 114 2
2007 27 595 83 18 0 83 0
2008 24 071 49 9 36 49 0
2009 25 170 53 25 28 53 0
2010 27 530 61 27 32 59 2
2011 26 860 58 20 38 58 0
2012 26 546 117 50 67 117 0
P. falciparumCountry P. vivax Mixed TotalOther species
Notclassified
Imported cases (top 10 countries)
India 6 19 0 250 0
Sri Lanka 0 25 0 250 0
Liberia 11 3 0 162 0
Congo 6 3 0 90 0
Côte d'Ivoire 3 1 0 73 0
Haiti 5 2 0 70 0
Yemen 7 0 0 70 0
Sudan 3 3 0 60 0
Bangladesh 1 4 0 50 0
Chad 2 0 0 20 0
Nigeria 2 0 0 20 0
33
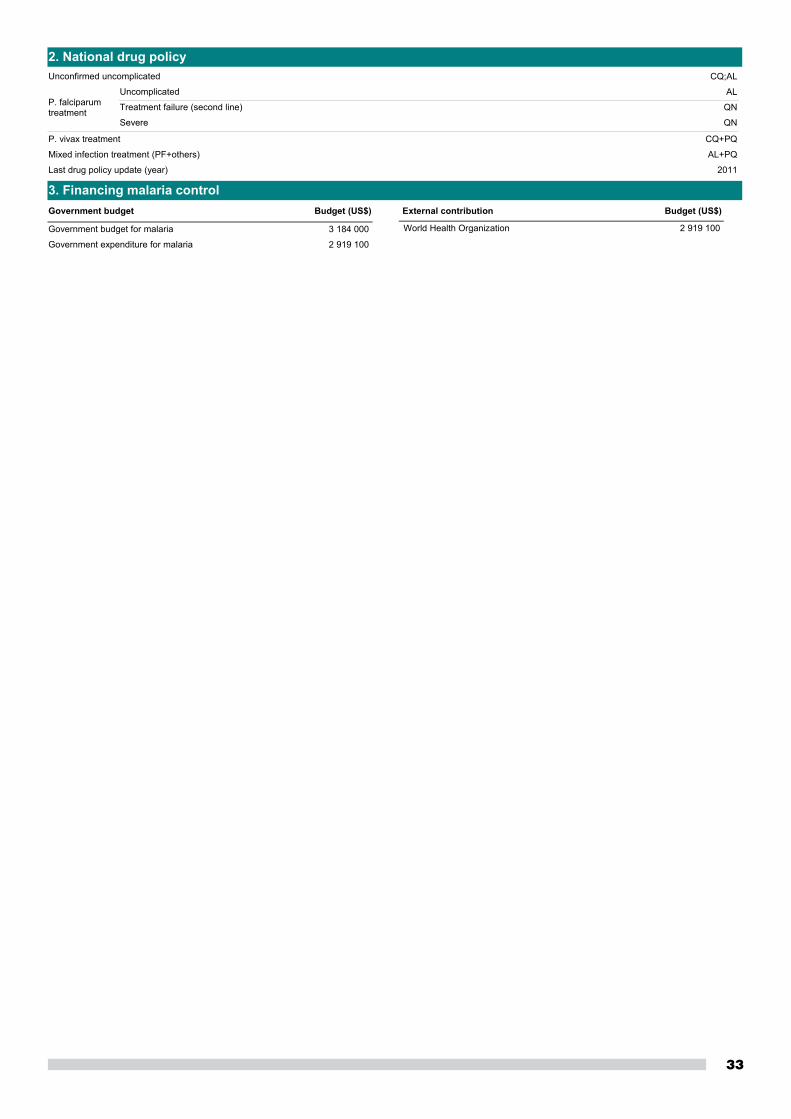
2. National drug policy
3. Financing malaria control
CQ;AL
AL
QN
QN
CQ+PQ
AL+PQ
2011
Unconfirmed uncomplicated
Uncomplicated
Treatment failure (second line)
Severe
P. vivax treatment
Last drug policy update (year)
P. falciparumtreatment
Mixed infection treatment (PF+others)
Government budget Budget (US$)
3 184 000
2 919 100
Government budget for malaria
Government expenditure for malaria
External contribution Budget (US$)
World Health Organization 2 919 100
34
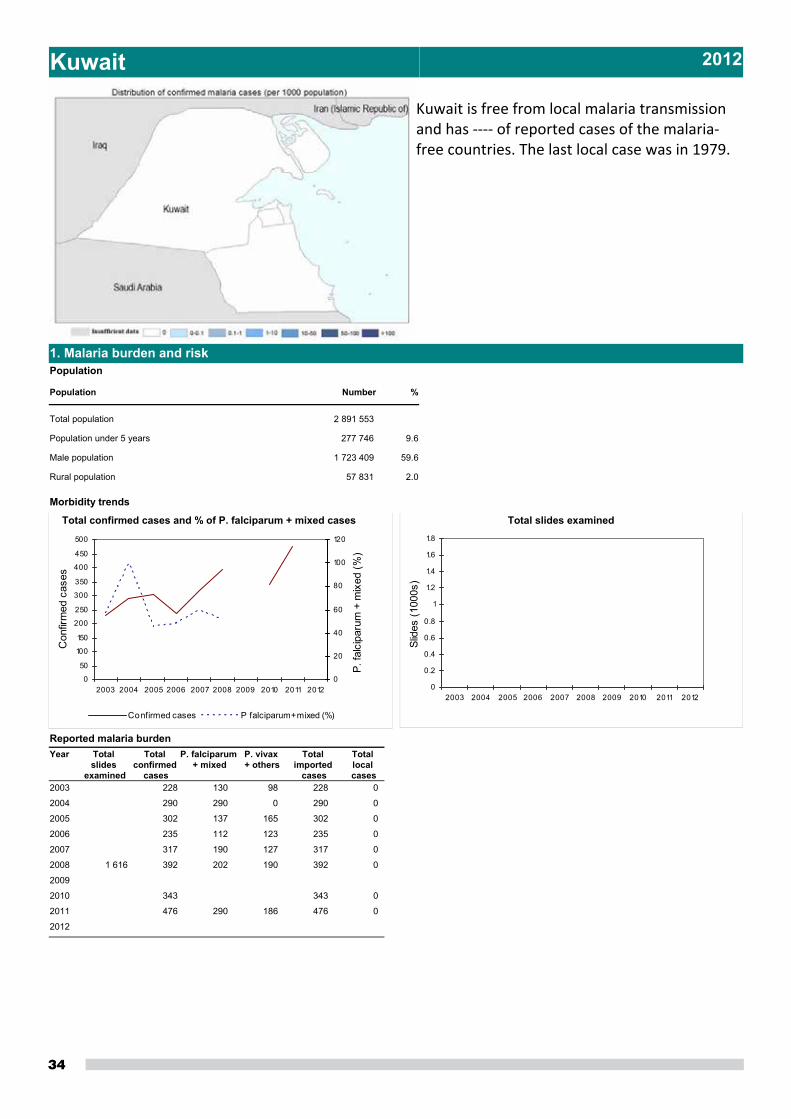
Kuwait 2012
Kuwait is free from local malaria transmission and has ‐‐‐‐ of reported cases of the malaria‐free countries. The last local case was in 1979.
Morbidity trends
1. Malaria burden and riskPopulation
Total population 2 891 553
Population under 5 years 277 746
Male population 1 723 409
Rural population 57 831
Population
59.6
9.6
2.0
Number %
Total slides examined
0
0.2
0.4
0.6
0.8
1
1.2
1.4
1.6
1.8
2003 2004 2005 2006 2007 2008 2009 2010 2011 2012
Slid
es (1
000s
)
Total confirmed cases and % of P. falciparum + mixed cases
0
50
100
150
200
250
300
350
400
450
500
2003 2004 2005 2006 2007 2008 2009 2010 2011 2012
Con
firm
ed c
ases
0
20
40
60
80
100
120
P. fa
lcip
arum
+ m
ixed
(%)
Confirmed cases P falciparum+ mixed (%)
Year Total slides
examined
Total confirmed
cases
P. falciparum + mixed
Reported malaria burdenP. vivax + others
Total imported
cases
Total local cases
2003 228 130 98 228 0
2004 290 290 0 290 0
2005 302 137 165 302 0
2006 235 112 123 235 0
2007 317 190 127 317 0
2008 1 616 392 202 190 392 0
2009
2010 343 343 0
2011 476 290 186 476 0
2012
35
2. National drug policy
3. Financing malaria control
Unconfirmed uncomplicated
Uncomplicated
Treatment failure (second line)
Severe
P. vivax treatment
Last drug policy update (year)
P. falciparumtreatment
Mixed infection treatment (PF+others)
36
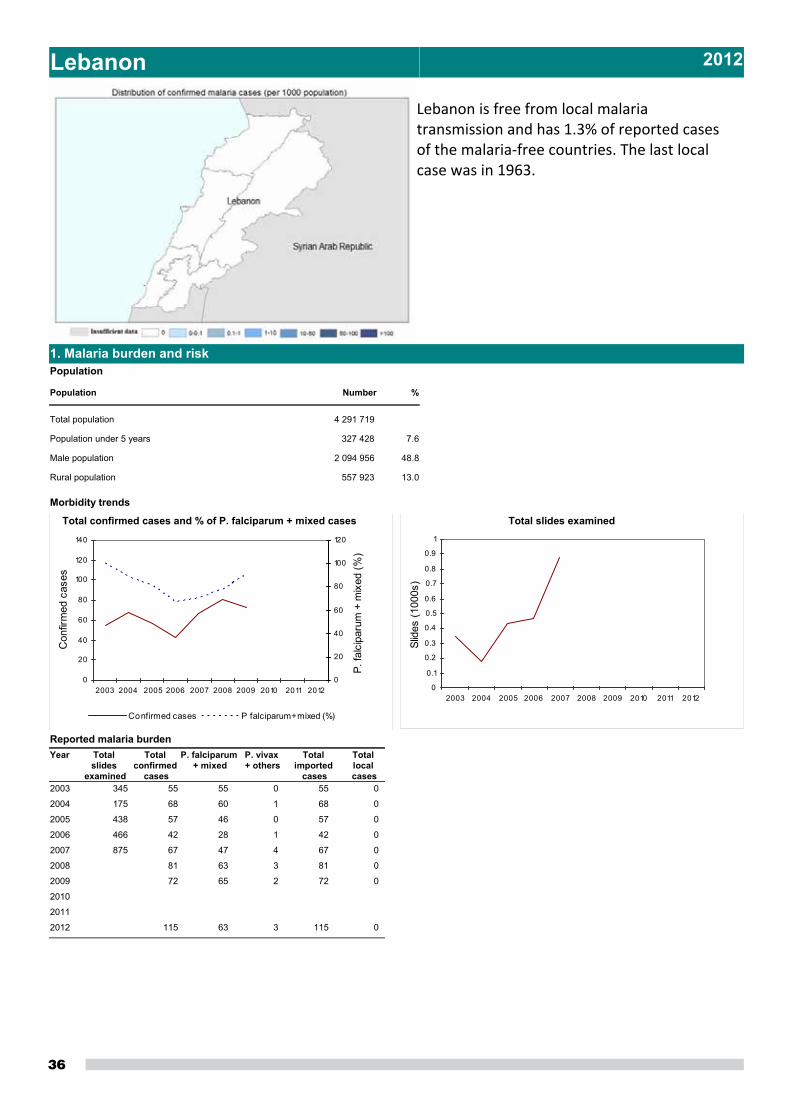
Lebanon 2012
Lebanon is free from local malaria transmission and has 1.3% of reported cases of the malaria‐free countries. The last local case was in 1963.
Morbidity trends
1. Malaria burden and riskPopulation
Total population 4 291 719
Population under 5 years 327 428
Male population 2 094 956
Rural population 557 923
Population
48.8
7.6
13.0
Number %
Total slides examined
0
0.1
0.2
0.3
0.4
0.5
0.6
0.7
0.8
0.9
1
2003 2004 2005 2006 2007 2008 2009 2010 2011 2012
Slid
es (1
000s
)
Total confirmed cases and % of P. falciparum + mixed cases
0
20
40
60
80
100
120
140
2003 2004 2005 2006 2007 2008 2009 2010 2011 2012
Con
firm
ed c
ases
0
20
40
60
80
100
120
P. fa
lcip
arum
+ m
ixed
(%)
Confirmed cases P falciparum+ mixed (%)
Year Total slides
examined
Total confirmed
cases
P. falciparum + mixed
Reported malaria burdenP. vivax + others
Total imported
cases
Total local cases
2003 345 55 55 0 55 0
2004 175 68 60 1 68 0
2005 438 57 46 0 57 0
2006 466 42 28 1 42 0
2007 875 67 47 4 67 0
2008 81 63 3 81 0
2009 72 65 2 72 0
2010
2011
2012 115 63 3 115 0

37
2. National drug policy
3. Financing malaria control
MQ
AL
QN+D
QN
CQ+PQ
2008
Unconfirmed uncomplicated
Uncomplicated
Treatment failure (second line)
Severe
P. vivax treatment
Last drug policy update (year)
P. falciparumtreatment
Mixed infection treatment (PF+others)
38
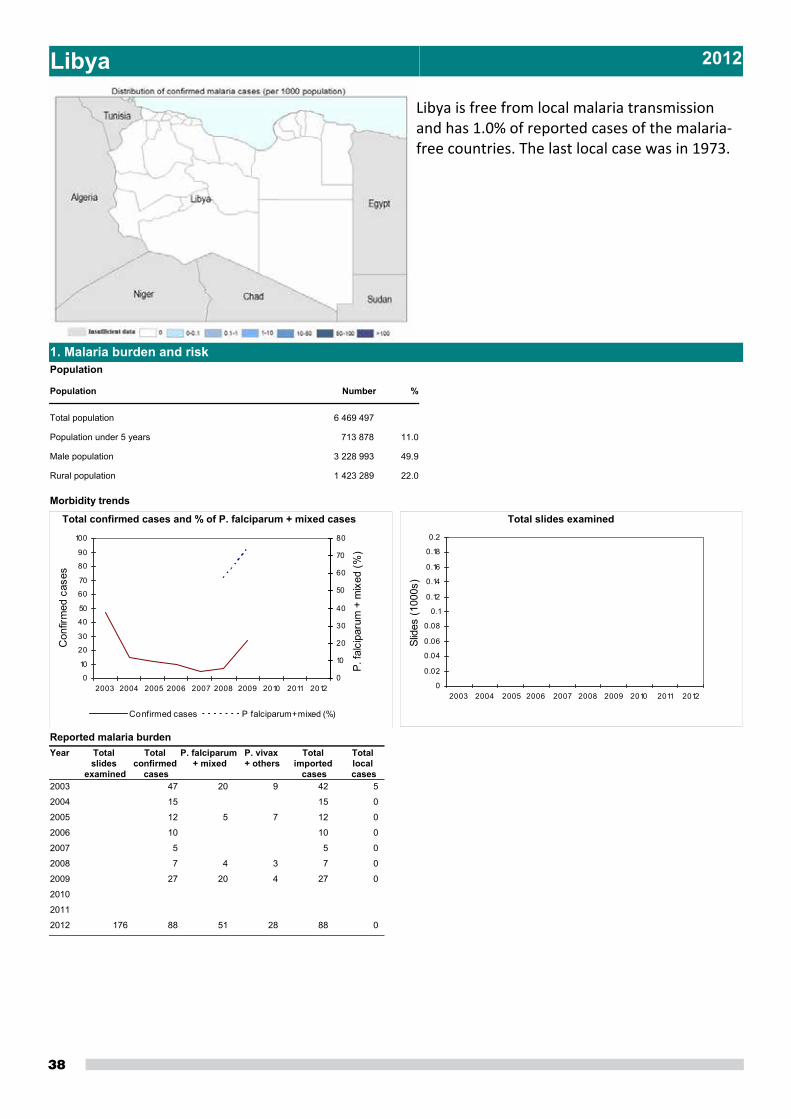
Libya 2012
Libya is free from local malaria transmission and has 1.0% of reported cases of the malaria‐free countries. The last local case was in 1973.
Morbidity trends
1. Malaria burden and riskPopulation
Total population 6 469 497
Population under 5 years 713 878
Male population 3 228 993
Rural population 1 423 289
Population
49.9
11.0
22.0
Number %
Total slides examined
0
0.02
0.04
0.06
0.08
0.1
0.12
0.14
0.16
0.18
0.2
2003 2004 2005 2006 2007 2008 2009 2010 2011 2012
Slid
es (1
000s
)
Total confirmed cases and % of P. falciparum + mixed cases
0
10
20
30
40
50
60
70
80
90
100
2003 2004 2005 2006 2007 2008 2009 2010 2011 2012
Con
firm
ed c
ases
0
10
20
30
40
50
60
70
80
P. fa
lcip
arum
+ m
ixed
(%)
Confirmed cases P falciparum+ mixed (%)
Year Total slides
examined
Total confirmed
cases
P. falciparum + mixed
Reported malaria burdenP. vivax + others
Total imported
cases
Total local cases
2003 47 20 9 42 5
2004 15 15 0
2005 12 5 7 12 0
2006 10 10 0
2007 5 5 0
2008 7 4 3 7 0
2009 27 20 4 27 0
2010
2011
2012 176 88 51 28 88 0
39
2. National drug policy
3. Financing malaria control
QN;MQ
QN
QN
CQ+PQ
2009
Unconfirmed uncomplicated
Uncomplicated
Treatment failure (second line)
Severe
P. vivax treatment
Last drug policy update (year)
P. falciparumtreatment
Mixed infection treatment (PF+others)
40
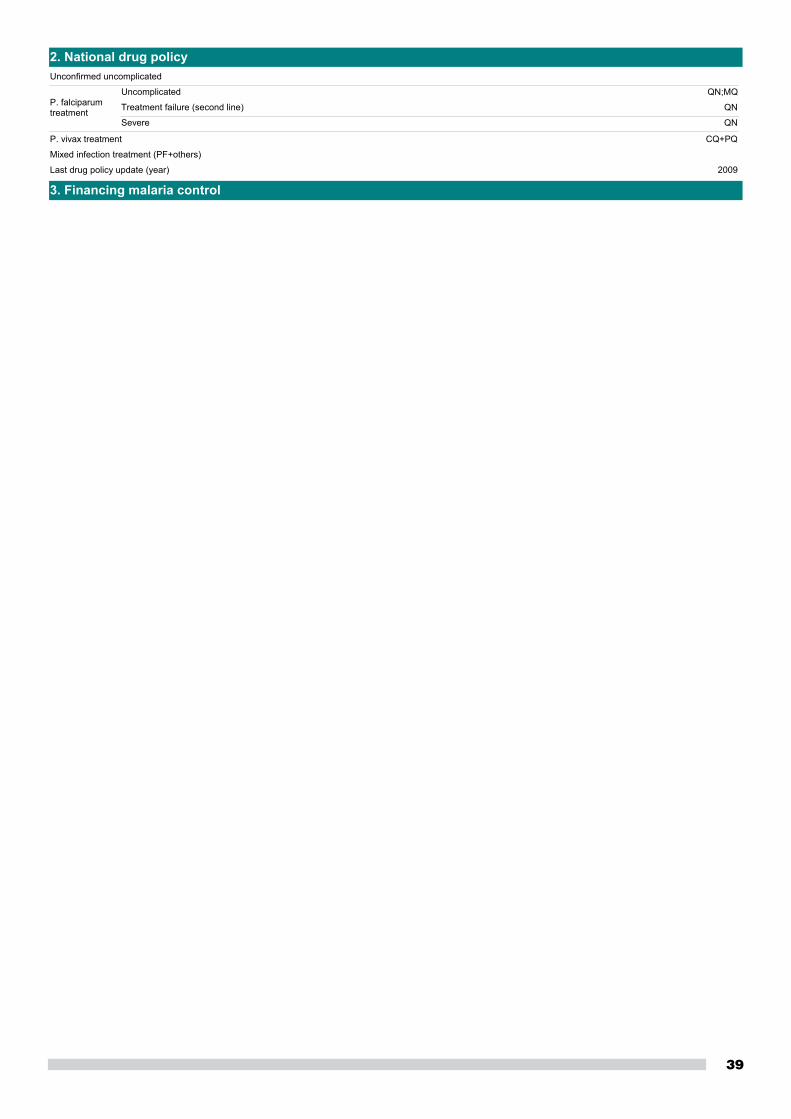
Morocco 2012
Morocco is free from local malaria transmission and has 4.0% of reported cases of the malaria‐free countries. The last local case was in 2004. The country was certified as malaria‐free in 2010.
Morbidity trends
1. Malaria burden and riskPopulation
Total population 32 598 536
Population under 5 years 3 043 283
Male population 15 956 829
Rural population 13 852 287
Population
48.9
9.3
42.5
Number %
Total slides examined
0
50
100
150
200
250
300
350
400
450
2003 2004 2005 2006 2007 2008 2009 2010 2011 2012
Slid
es (1
000s
)
Total confirmed cases and % of P. falciparum + mixed cases
0
50
100
150
200
250
300
350
400
2003 2004 2005 2006 2007 2008 2009 2010 2011 2012
Con
firm
ed c
ases
0
10
20
30
40
50
60
70
80
90
100
P. fa
lcip
arum
+ m
ixed
(%)
Confirmed cases P falciparum+ mixed (%)
Year Total slides
examined
Total confirmed
cases
P. falciparum + mixed
Reported malaria burdenP. vivax + others
Total imported
cases
Total local cases
2003 405 800 73 62 7 69 4
2004 405 601 56 47 8 55 1
2005 100 93 0 100 0
2006 83 69 0 83 0
2007 367 705 75 66 9 75 0
2008 292 826 142 118 24 142 0
2009 290 566 145 136 3 145 0
2010 232 598 218 194 21 215 0
2011 171 400 312 264 48 312 0
2012 285 039 364 280 84 364 0
P. falciparumCountry P. vivax Mixed TotalOther species
Notclassified
Imported cases (top 10 countries)
Côte d'Ivoire 69 0 0 8920 0
Equatorial Guinea 70 0 0 8717 0
Mauritania 6 24 0 311 0
Guinea 16 0 0 160 0
Mali 16 0 0 160 0
Burkina Faso 15 0 0 161 0
Congo 10 0 0 155 0
Senegal 9 1 0 100 0
Gabon 3 0 1 51 0
Niger 4 0 0 40 0
41
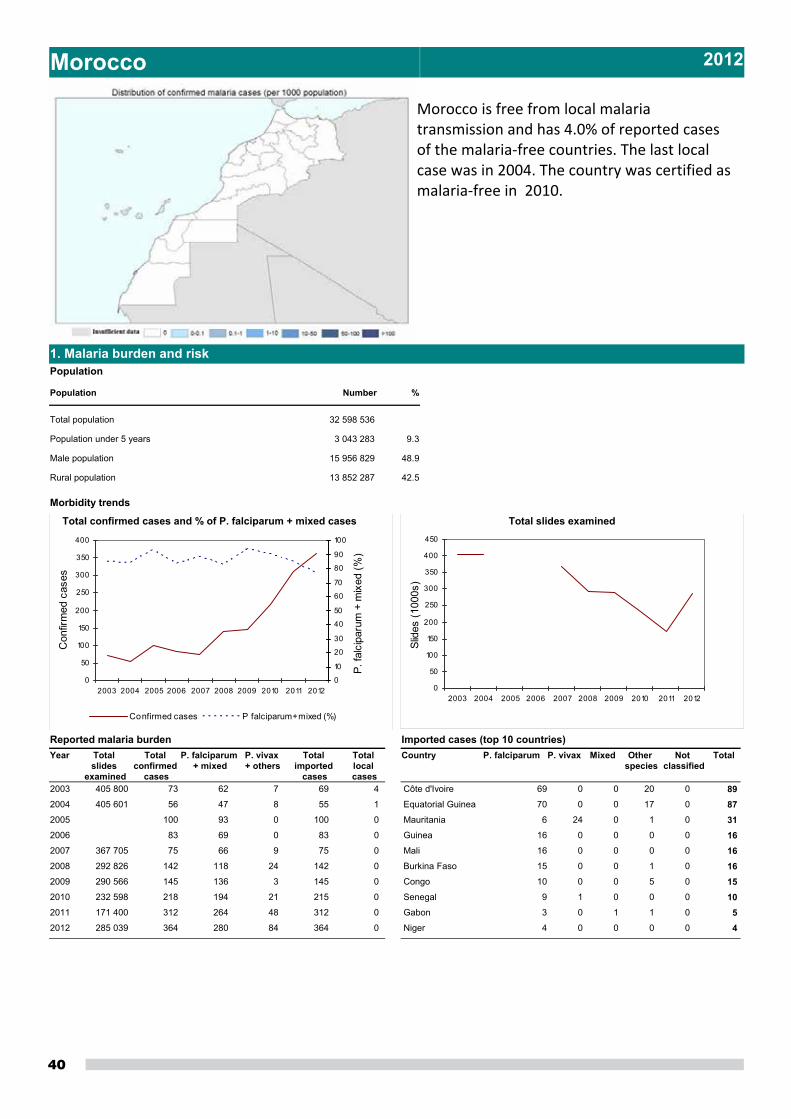
2. National drug policy
3. Financing malaria control
AL+PQ
QN+D
QN+D
CQ+PQ
2004
Unconfirmed uncomplicated
Uncomplicated
Treatment failure (second line)
Severe
P. vivax treatment
Last drug policy update (year)
P. falciparumtreatment
Mixed infection treatment (PF+others)
42
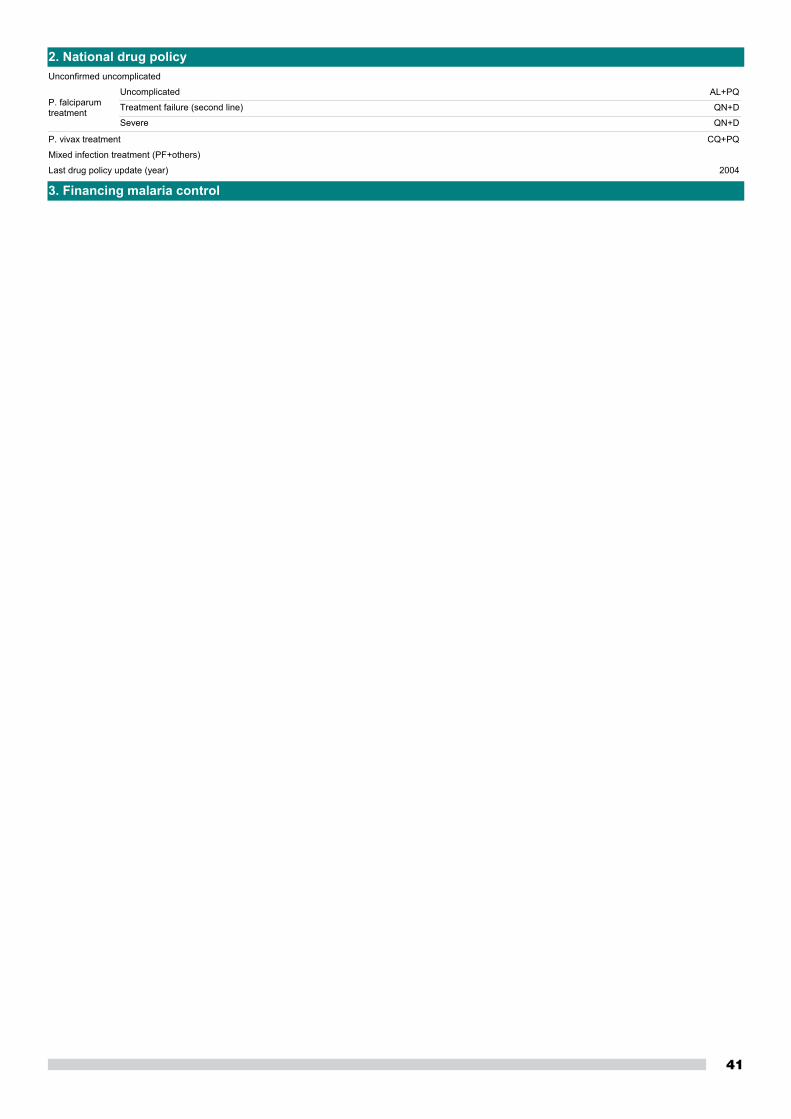
Oman 2012
Oman was free from local malaria transmission from 2004 to 2006. Introduced local transmission happened in 2007, 2008 and from 2010 to 2012. Oman accounts for 22.4% of reported cases of the malaria‐free countries.
Morbidity trends
1. Malaria burden and riskPopulation
Total population 2 904 037
Population under 5 years 288 874
Male population 1 716 013
Rural population 729 734
Population
59.1
9.9
25.1
Number %
Total slides examined
0
50
100
150
200
250
300
350
400
450
2003 2004 2005 2006 2007 2008 2009 2010 2011 2012
Slid
es (1
000s
)
Total confirmed cases and % of P. falciparum + mixed cases
0
500
1000
1500
2000
2500
2003 2004 2005 2006 2007 2008 2009 2010 2011 2012
Con
firm
ed c
ases
0
5
10
15
20
25
30
35
40
45
P. fa
lcip
arum
+ m
ixed
(%)
Confirmed cases P falciparum+ mixed (%)
Year Total slides
examined
Total confirmed
cases
P. falciparum + mixed
Reported malaria burdenP. vivax + others
Total imported
cases
Total local cases
2003 409 532 740 302 430 734 6
2004 326 127 615 158 457 615 0
2005 258 981 544 153 391 544 0
2006 242 635 443 100 343 443 0
2007 244 346 705 101 598 701 4
2008 245 113 965 94 863 957 8
2009 234 803 898 178 718 898 0
2010 226 009 1 193 138 1 031 1 169 24
2011 267 353 1 531 103 1 415 1 518 13
2012 2 051 2 029 22
43
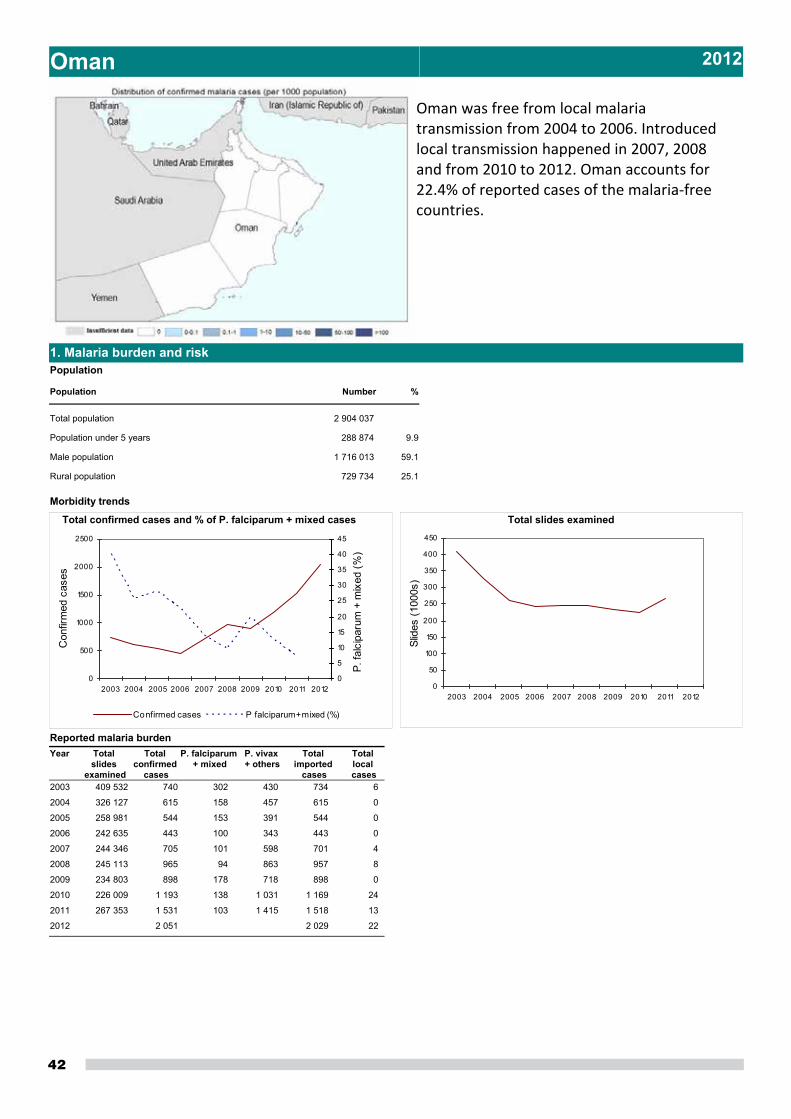
2. National drug policy
3. Financing malaria control
AL+PQ
QN
CQ+PQ
2007
Unconfirmed uncomplicated
Uncomplicated
Treatment failure (second line)
Severe
P. vivax treatment
Last drug policy update (year)
P. falciparumtreatment
Mixed infection treatment (PF+others)
44
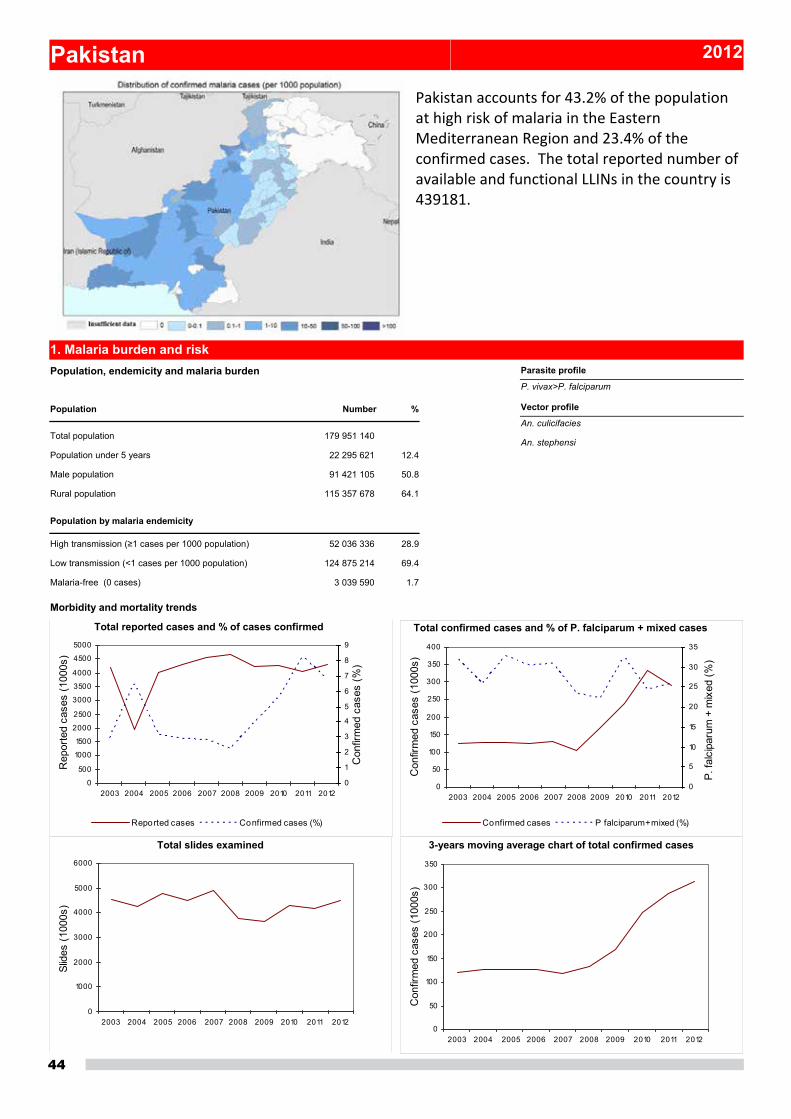
Pakistan 2012
Pakistan accounts for 43.2% of the population at high risk of malaria in the Eastern Mediterranean Region and 23.4% of the confirmed cases. The total reported number of available and functional LLINs in the country is 439181.
1. Malaria burden and risk
Morbidity and mortality trends
Population, endemicity and malaria burden
Total population 179 951 140
Population under 5 years 22 295 621
Male population 91 421 105
Rural population 115 357 678
High transmission (≥1 cases per 1000 population) 52 036 336
Low transmission (<1 cases per 1000 population) 124 875 214
Malaria-free (0 cases) 3 039 590
Population
Population by malaria endemicity
50.8
12.4
64.1
28.9
69.4
1.7
Number %
Total confirmed cases and % of P. falciparum + mixed cases
0
50
100
150
200
250
300
350
400
2003 2004 2005 2006 2007 2008 2009 2010 2011 2012
Con
firm
ed c
ases
(100
0s)
0
5
10
15
20
25
30
35
P. fa
lcip
arum
+ m
ixed
(%)
Confirmed cases P falciparum+ mixed (%)
Total reported cases and % of cases confirmed
0
500
1000
1500
2000
2500
3000
3500
4000
4500
5000
2003 2004 2005 2006 2007 2008 2009 2010 2011 2012
Rep
orte
d ca
ses
(100
0s)
0
1
2
3
4
5
6
7
8
9
Con
firm
ed c
ases
(%)
Reported cases Confirmed cases (%)
Total slides examined
0
1000
2000
3000
4000
5000
6000
2003 2004 2005 2006 2007 2008 2009 2010 2011 2012
Slid
es (1
000s
)
3-years moving average chart of total confirmed cases
0
50
100
150
200
250
300
350
2003 2004 2005 2006 2007 2008 2009 2010 2011 2012
Con
firm
ed c
ases
(100
0s)
Vector profile
An. culicifacies
An. stephensi
Parasite profile
P. vivax>P. falciparum
45
2. Malaria control interventions coverage
Malaria admissions and number of malaria deaths
44
46
48
50
52
54
56
58
60
62
2003 2004 2005 2006 2007 2008 2009 2010 2011 2012
Adm
issi
on (1
000s
)
0
50
100
150
200
250
300
Mal
aria
dea
ths
M alaria admission M alaria deaths
Year Total reported cases
Total Microscopy RDTs Total Microscopy RDTs
P. falciparum + mixed
P. vivax + others
Confirmed cases Number of tests
Reported malaria burden
2003 4 210 611 125 152 125 152 4 577 037 4 577 037 39 976 85 176
2004 1 958 350 126 719 126 719 4 243 108 4 243 108 32 796 93 923
2005 4 022 823 127 826 127 826 4 776 274 4 776 274 42 078 85 748
2006 4 314 637 124 910 124 910 4 490 577 4 490 577 37 911 86 999
2007 4 553 732 128 570 128 570 4 905 561 4 905 561 39 856 88 714
2008 4 658 701 104 454 104 454 3 775 793 3 775 793 24 550 79 904
2009 4 242 032 167 579 132 688 34 891 3 898 793 3 655 272 243 521 37 084 95 604
2010 4 281 356 240 591 220 870 19 721 4 561 070 4 281 346 279 724 77 734 143 136
2011 4 065 802 334 589 287 592 46 997 4 687 357 4 168 648 518 709 81 713 205 879
2012 4 285 449 290 781 250 526 40 255 4 908 279 4 497 330 410 949 74 831 215 950
Year
All ages Under 5 years All ages Under 5 years
Malaria admissions Malaria deaths
Malaria admissions and deaths
2003 29
2004 58 389 24 714
2005 52 52
2006 60 162 21 847 9 9
2007 50 409 18 812 24 24
2008 20
2009
2010
2011 4
2012 57 188 260
Total number of ITNs/LLINs distributed
0
50
100
150
200
250
300
350
400
450
500
2003 2004 2005 2006 2007 2008 2009 2010 2012
No.
of I
TNs/
LLIN
s (1
000s
)
Total number of people protected by IRS
0
1000
2000
3000
4000
5000
6000
2003 2004 2005 2006 2007 2008 2009 2010 2012
No.
of p
eopl
e pr
otec
ted
(100
0s)
Total number of ACT treatment courses distributed
0
100
200
300
400
500
600
700
2003 2004 2005 2006 2007 2008 2009 2010 2012
No.
of c
ours
es (1
000s
)
Total number of RDTs distributed
0
200
400
600
800
1000
1200
1400
2003 2004 2005 2006 2007 2008 2009 2010 2012
No.
of R
DTs
dis
tibut
ed (1
000s
)
46
3. National drug policy
4. Financing malaria control
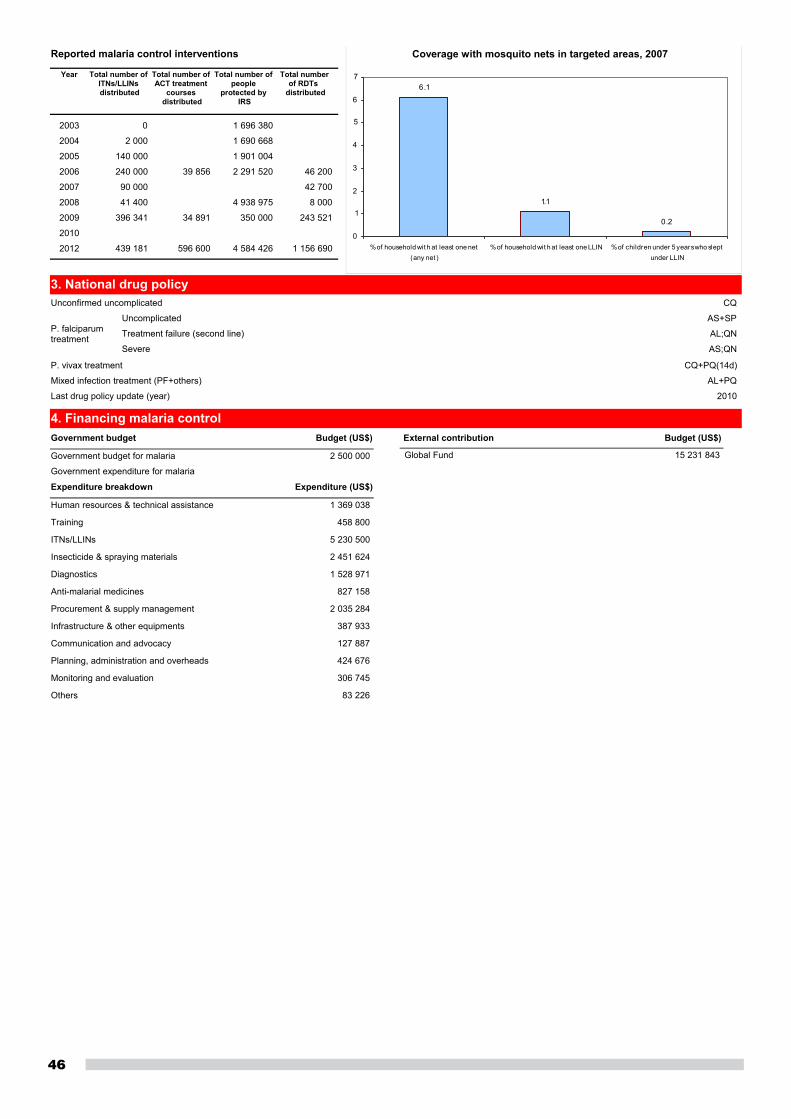
Coverage with mosquito nets in targeted areas, 2007
6.1
1.1
0.2
0
1
2
3
4
5
6
7
% of household wit h at least one net(any net )
% of household wit h at least one LLIN % of children under 5 years who sleptunder LLIN
CQ
AS+SP
AL;QN
AS;QN
CQ+PQ(14d)
AL+PQ
2010
Unconfirmed uncomplicated
Uncomplicated
Treatment failure (second line)
Severe
P. vivax treatment
Last drug policy update (year)
P. falciparumtreatment
Mixed infection treatment (PF+others)
Government budget Budget (US$)
2 500 000Government budget for malaria
Government expenditure for malaria
External contribution Budget (US$)
Global Fund 15 231 843
Expenditure (US$)Expenditure breakdown
1 369 038Human resources & technical assistance
458 800Training
5 230 500ITNs/LLINs
2 451 624Insecticide & spraying materials
1 528 971Diagnostics
827 158Anti-malarial medicines
2 035 284Procurement & supply management
387 933Infrastructure & other equipments
127 887Communication and advocacy
424 676Planning, administration and overheads
306 745Monitoring and evaluation
83 226Others
Year Total number of ITNs/LLINs distributed
Total number of ACT treatment
courses distributed
Total number of people
protected by IRS
Total number of RDTs
distributed
Reported malaria control interventions
2003 0 1 696 380
2004 2 000 1 690 668
2005 140 000 1 901 004
2006 240 000 39 856 2 291 520 46 200
2007 90 000 42 700
2008 41 400 4 938 975 8 000
2009 396 341 34 891 350 000 243 521
2010
2012 439 181 596 600 4 584 426 1 156 690
47
Occupied Palestinian Territory 2012
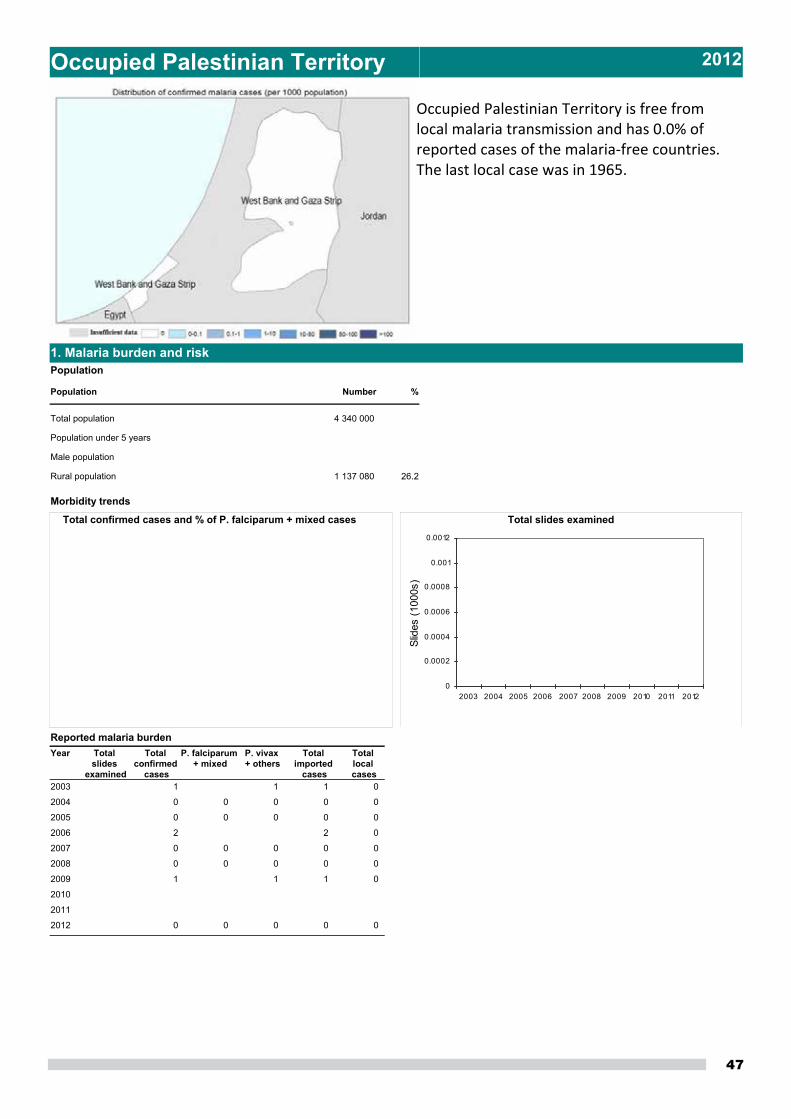
Occupied Palestinian Territory is free from local malaria transmission and has 0.0% of reported cases of the malaria‐free countries. The last local case was in 1965.
Morbidity trends
1. Malaria burden and riskPopulation
Total population 4 340 000
Population under 5 years
Male population
Rural population 1 137 080
Population
26.2
Number %
Total slides examined
0
0.0002
0.0004
0.0006
0.0008
0.001
0.0012
2003 2004 2005 2006 2007 2008 2009 2010 2011 2012
Slid
es (1
000s
)
Total confirmed cases and % of P. falciparum + mixed cases
Year Total slides
examined
Total confirmed
cases
P. falciparum + mixed
Reported malaria burdenP. vivax + others
Total imported
cases
Total local cases
2003 1 1 1 0
2004 0 0 0 0 0
2005 0 0 0 0 0
2006 2 2 0
2007 0 0 0 0 0
2008 0 0 0 0 0
2009 1 1 1 0
2010
2011
2012 0 0 0 0 0
48
2. National drug policy
3. Financing malaria control
Unconfirmed uncomplicated
Uncomplicated
Treatment failure (second line)
Severe
P. vivax treatment
Last drug policy update (year)
P. falciparumtreatment
Mixed infection treatment (PF+others)
49
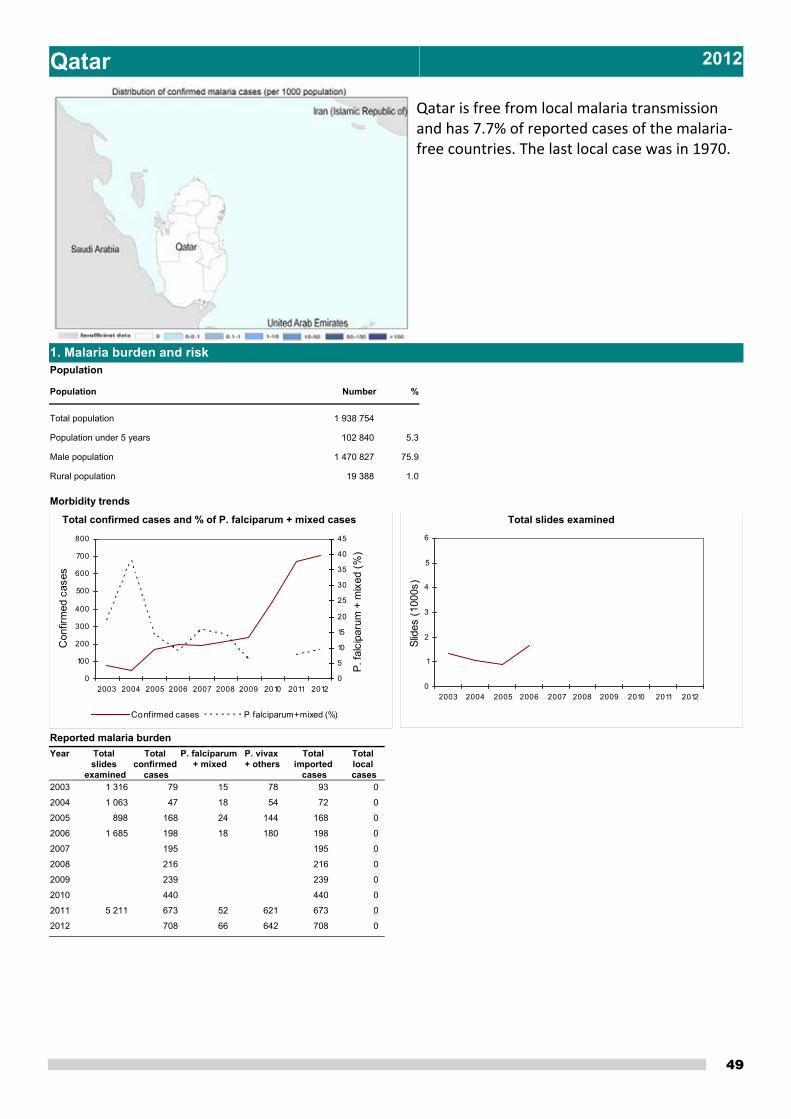
Qatar 2012
Qatar is free from local malaria transmission and has 7.7% of reported cases of the malaria‐free countries. The last local case was in 1970.
Morbidity trends
1. Malaria burden and riskPopulation
Total population 1 938 754
Population under 5 years 102 840
Male population 1 470 827
Rural population 19 388
Population
75.9
5.3
1.0
Number %
Total slides examined
0
1
2
3
4
5
6
2003 2004 2005 2006 2007 2008 2009 2010 2011 2012
Slid
es (1
000s
)
Total confirmed cases and % of P. falciparum + mixed cases
0
100
200
300
400
500
600
700
800
2003 2004 2005 2006 2007 2008 2009 2010 2011 2012
Con
firm
ed c
ases
0
5
10
15
20
25
30
35
40
45
P. fa
lcip
arum
+ m
ixed
(%)
Confirmed cases P falciparum+ mixed (%)
Year Total slides
examined
Total confirmed
cases
P. falciparum + mixed
Reported malaria burdenP. vivax + others
Total imported
cases
Total local cases
2003 1 316 79 15 78 93 0
2004 1 063 47 18 54 72 0
2005 898 168 24 144 168 0
2006 1 685 198 18 180 198 0
2007 195 195 0
2008 216 216 0
2009 239 239 0
2010 440 440 0
2011 5 211 673 52 621 673 0
2012 708 66 642 708 0
50
2. National drug policy
3. Financing malaria control
AL
AL
AS
CQ
2012
Unconfirmed uncomplicated
Uncomplicated
Treatment failure (second line)
Severe
P. vivax treatment
Last drug policy update (year)
P. falciparumtreatment
Mixed infection treatment (PF+others)
51
Saudi Arabia 2012
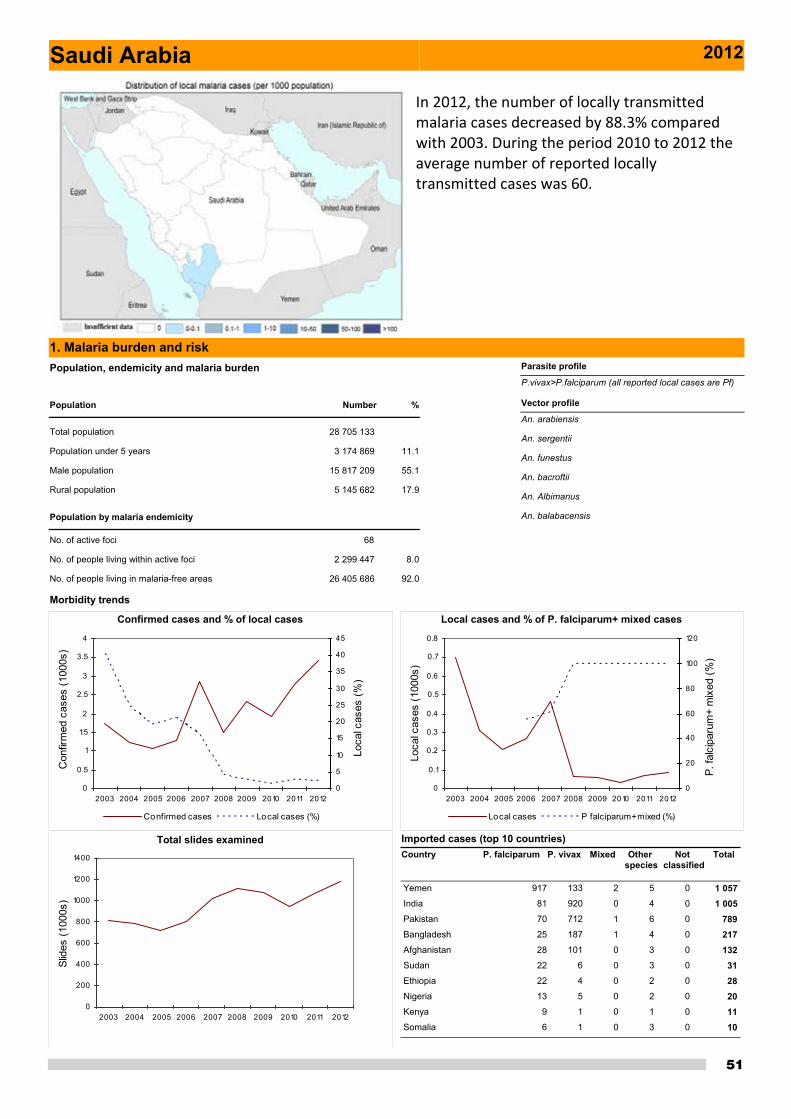
In 2012, the number of locally transmitted malaria cases decreased by 88.3% compared with 2003. During the period 2010 to 2012 the average number of reported locally transmitted cases was 60.
Morbidity trends
1. Malaria burden and riskPopulation, endemicity and malaria burden
Total population 28 705 133
Population under 5 years 3 174 869
Male population 15 817 209
Rural population 5 145 682
No. of active foci 68
No. of people living within active foci 2 299 447
No. of people living in malaria-free areas 26 405 686
Population
Population by malaria endemicity
55.1
11.1
17.9
8.0
92.0
Number %
Local cases and % of P. falciparum+ mixed cases
0
0.1
0.2
0.3
0.4
0.5
0.6
0.7
0.8
2003 2004 2005 2006 2007 2008 2009 2010 2011 2012
Loca
l cas
es (1
000s
)
0
20
40
60
80
100
120
P. fa
lcip
arum
+ m
ixed
(%)
Local cases P falciparum+ mixed (%)
Confirmed cases and % of local cases
0
0.5
1
1.5
2
2.5
3
3.5
4
2003 2004 2005 2006 2007 2008 2009 2010 2011 2012
Con
firm
ed c
ases
(100
0s)
0
5
10
15
20
25
30
35
40
45
Loca
l cas
es (%
)
Confirmed cases Local cases (%)
Total slides examined
0
200
400
600
800
1000
1200
1400
2003 2004 2005 2006 2007 2008 2009 2010 2011 2012
Slid
es (1
000s
)
P. falciparumCountry P. vivax Mixed TotalOther species
Notclassified
Imported cases (top 10 countries)
Yemen 917 133 2 1 0575 0
India 81 920 0 1 0054 0
Pakistan 70 712 1 7896 0
Bangladesh 25 187 1 2174 0
Afghanistan 28 101 0 1323 0
Sudan 22 6 0 313 0
Ethiopia 22 4 0 282 0
Nigeria 13 5 0 202 0
Kenya 9 1 0 111 0
Somalia 6 1 0 103 0
Vector profile
An. arabiensis
An. sergentii
An. funestus
An. bacroftii
An. Albimanus
An. balabacensis
Parasite profile
P.vivax>P.falciparum (all reported local cases are Pf)
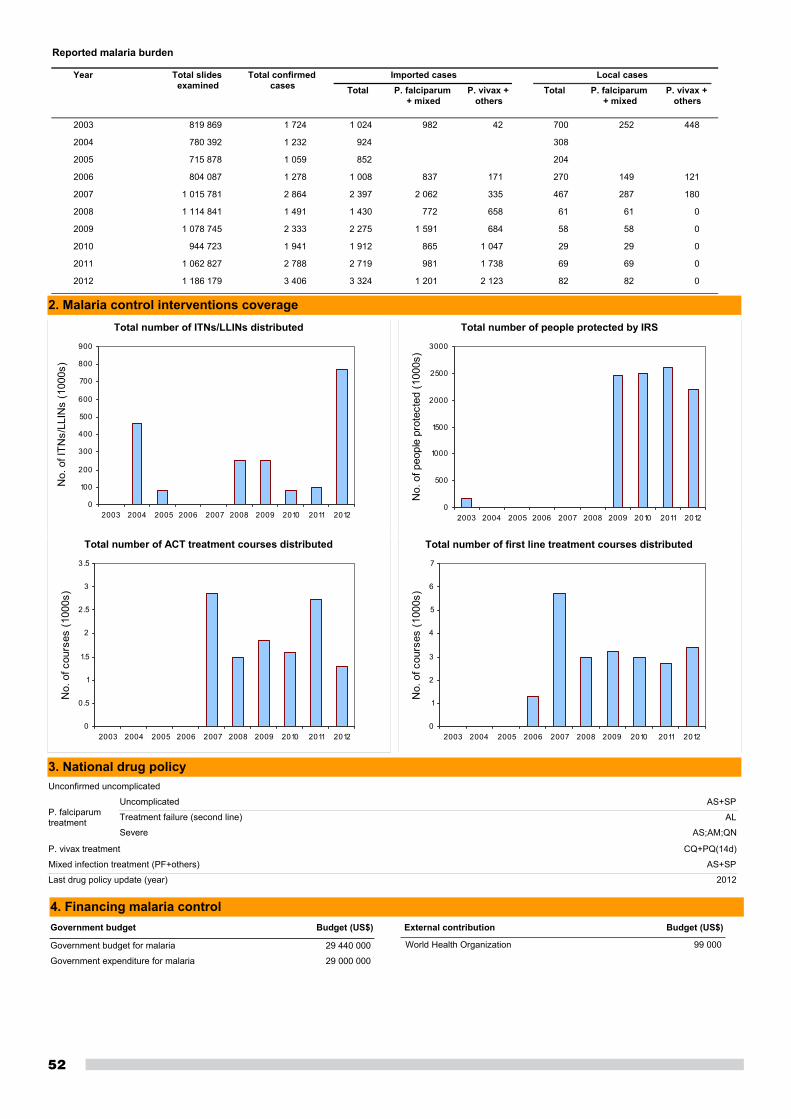
52
2. Malaria control interventions coverage
3. National drug policy
Year Total slides examined
Total confirmed cases Total P. falciparum
+ mixedTotal P. falciparum
+ mixedP. vivax +
others
Imported cases Local cases
Reported malaria burden
P. vivax + others
2003 819 869 1 724 1 024 982 700 252 44842
2004 780 392 1 232 924 308
2005 715 878 1 059 852 204
2006 804 087 1 278 1 008 837 270 149 121171
2007 1 015 781 2 864 2 397 2 062 467 287 180335
2008 1 114 841 1 491 1 430 772 61 61 0658
2009 1 078 745 2 333 2 275 1 591 58 58 0684
2010 944 723 1 941 1 912 865 29 29 01 047
2011 1 062 827 2 788 2 719 981 69 69 01 738
2012 1 186 179 3 406 3 324 1 201 82 82 02 123
Total number of ITNs/LLINs distributed
0
100
200
300
400
500
600
700
800
900
2003 2004 2005 2006 2007 2008 2009 2010 2011 2012
No.
of I
TNs/
LLIN
s (1
000s
)
Total number of people protected by IRS
0
500
1000
1500
2000
2500
3000
2003 2004 2005 2006 2007 2008 2009 2010 2011 2012
No.
of p
eopl
e pr
otec
ted
(100
0s)
Total number of ACT treatment courses distributed
0
0.5
1
1.5
2
2.5
3
3.5
2003 2004 2005 2006 2007 2008 2009 2010 2011 2012
No.
of c
ours
es (1
000s
)
Total number of first line treatment courses distributed
0
1
2
3
4
5
6
7
2003 2004 2005 2006 2007 2008 2009 2010 2011 2012
No.
of c
ours
es (1
000s
)
AS+SP
AL
AS;AM;QN
CQ+PQ(14d)
AS+SP
2012
Unconfirmed uncomplicated
Uncomplicated
Treatment failure (second line)
Severe
P. vivax treatment
Last drug policy update (year)
P. falciparumtreatment
Mixed infection treatment (PF+others)
4. Financing malaria controlGovernment budget Budget (US$)
29 440 000
29 000 000
Government budget for malaria
Government expenditure for malaria
External contribution Budget (US$)
World Health Organization 99 000
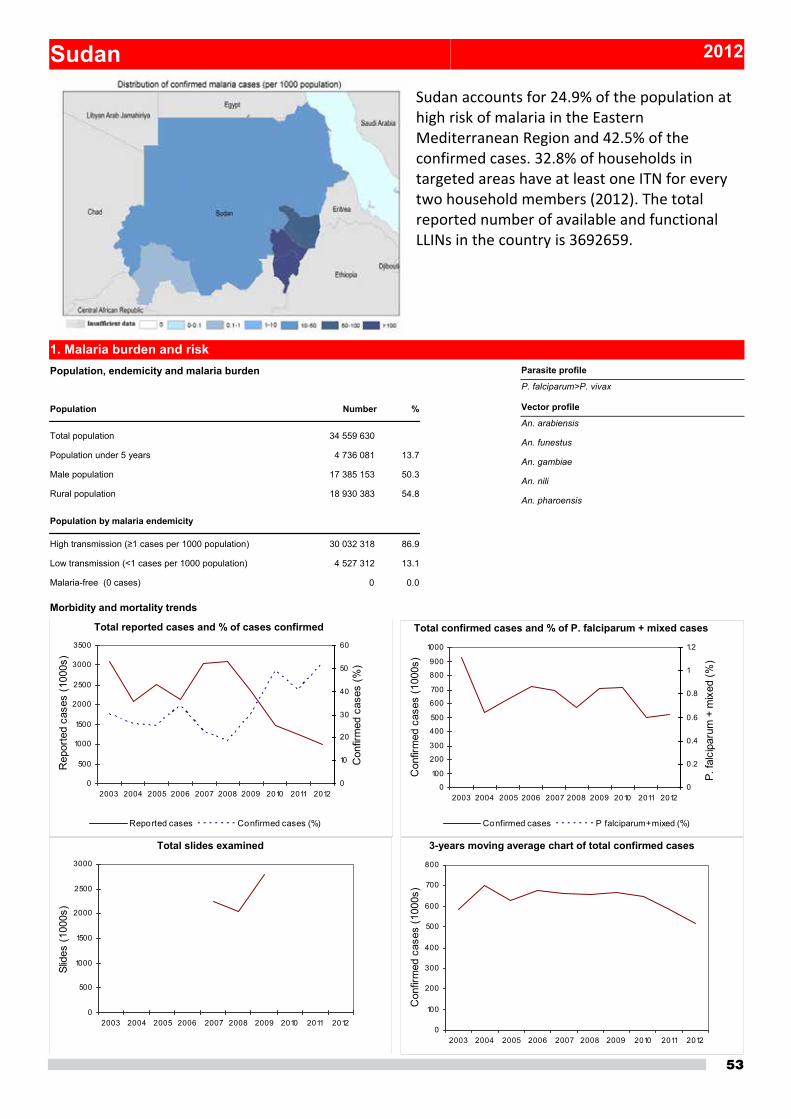
53
Sudan 2012
Sudan accounts for 24.9% of the population at high risk of malaria in the Eastern Mediterranean Region and 42.5% of the confirmed cases. 32.8% of households in targeted areas have at least one ITN for every two household members (2012). The total reported number of available and functional LLINs in the country is 3692659.
1. Malaria burden and risk
Morbidity and mortality trends
Population, endemicity and malaria burden
Total population 34 559 630
Population under 5 years 4 736 081
Male population 17 385 153
Rural population 18 930 383
High transmission (≥1 cases per 1000 population) 30 032 318
Low transmission (<1 cases per 1000 population) 4 527 312
Malaria-free (0 cases) 0
Population
Population by malaria endemicity
50.3
13.7
54.8
86.9
13.1
0.0
Number %
Total confirmed cases and % of P. falciparum + mixed cases
0
100
200
300
400
500
600
700
800
900
1000
2003 2004 2005 2006 2007 2008 2009 2010 2011 2012
Con
firm
ed c
ases
(100
0s)
0
0.2
0.4
0.6
0.8
1
1.2
P. fa
lcip
arum
+ m
ixed
(%)
Confirmed cases P falciparum+ mixed (%)
Total reported cases and % of cases confirmed
0
500
1000
1500
2000
2500
3000
3500
2003 2004 2005 2006 2007 2008 2009 2010 2011 2012
Rep
orte
d ca
ses
(100
0s)
0
10
20
30
40
50
60
Con
firm
ed c
ases
(%)
Reported cases Confirmed cases (%)
Total slides examined
0
500
1000
1500
2000
2500
3000
2003 2004 2005 2006 2007 2008 2009 2010 2011 2012
Slid
es (1
000s
)
3-years moving average chart of total confirmed cases
0
100
200
300
400
500
600
700
800
2003 2004 2005 2006 2007 2008 2009 2010 2011 2012
Con
firm
ed c
ases
(100
0s)
Vector profile
An. arabiensis
An. funestus
An. gambiae
An. nili
An. pharoensis
Parasite profile
P. falciparum>P. vivax
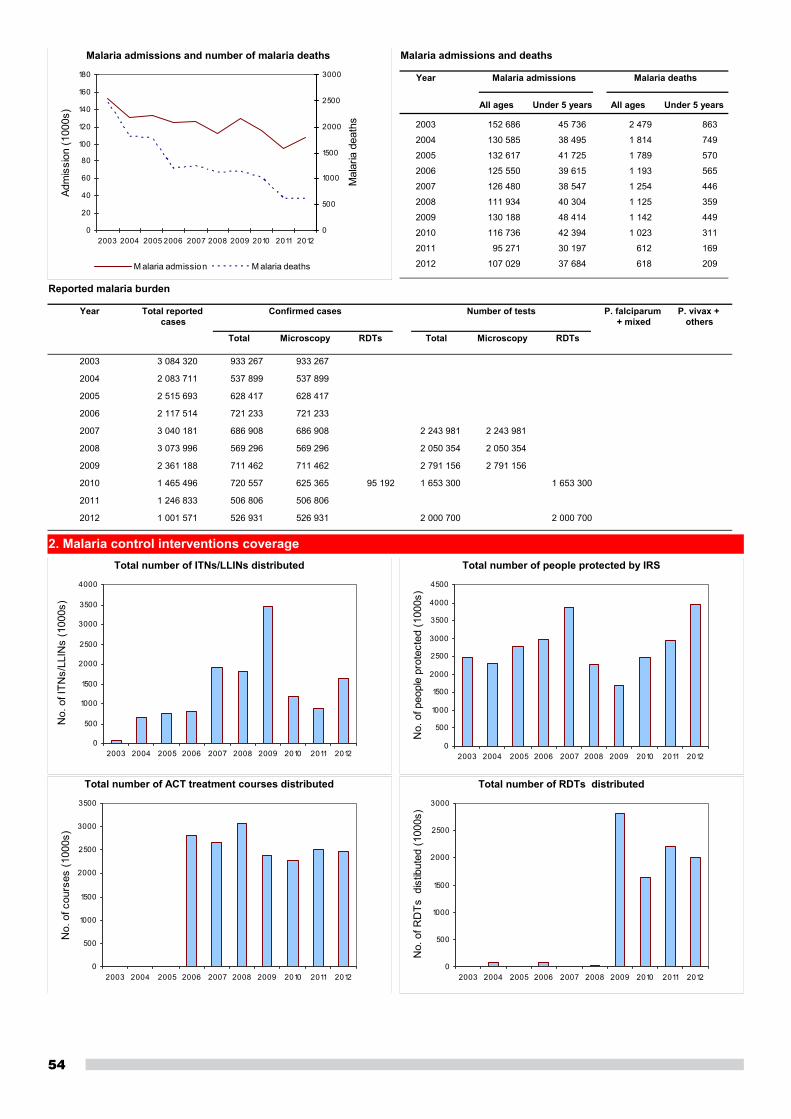
54
2. Malaria control interventions coverage
Malaria admissions and number of malaria deaths
0
20
40
60
80
100
120
140
160
180
2003 2004 2005 2006 2007 2008 2009 2010 2011 2012
Adm
issi
on (1
000s
)
0
500
1000
1500
2000
2500
3000
Mal
aria
dea
ths
M alaria admission M alaria deaths
Year Total reported cases
Total Microscopy RDTs Total Microscopy RDTs
P. falciparum + mixed
P. vivax + others
Confirmed cases Number of tests
Reported malaria burden
2003 3 084 320 933 267 933 267
2004 2 083 711 537 899 537 899
2005 2 515 693 628 417 628 417
2006 2 117 514 721 233 721 233
2007 3 040 181 686 908 686 908 2 243 981 2 243 981
2008 3 073 996 569 296 569 296 2 050 354 2 050 354
2009 2 361 188 711 462 711 462 2 791 156 2 791 156
2010 1 465 496 720 557 625 365 95 192 1 653 300 1 653 300
2011 1 246 833 506 806 506 806
2012 1 001 571 526 931 526 931 2 000 700 2 000 700
Year
All ages Under 5 years All ages Under 5 years
Malaria admissions Malaria deaths
Malaria admissions and deaths
2003 152 686 45 736 2 479 863
2004 130 585 38 495 1 814 749
2005 132 617 41 725 1 789 570
2006 125 550 39 615 1 193 565
2007 126 480 38 547 1 254 446
2008 111 934 40 304 1 125 359
2009 130 188 48 414 1 142 449
2010 116 736 42 394 1 023 311
2011 95 271 30 197 612 169
2012 107 029 37 684 618 209
Total number of ITNs/LLINs distributed
0
500
1000
1500
2000
2500
3000
3500
4000
2003 2004 2005 2006 2007 2008 2009 2010 2011 2012
No.
of I
TNs/
LLIN
s (1
000s
)
Total number of people protected by IRS
0
500
1000
1500
2000
2500
3000
3500
4000
4500
2003 2004 2005 2006 2007 2008 2009 2010 2011 2012
No.
of p
eopl
e pr
otec
ted
(100
0s)
Total number of ACT treatment courses distributed
0
500
1000
1500
2000
2500
3000
3500
2003 2004 2005 2006 2007 2008 2009 2010 2011 2012
No.
of c
ours
es (1
000s
)
Total number of RDTs distributed
0
500
1000
1500
2000
2500
3000
2003 2004 2005 2006 2007 2008 2009 2010 2011 2012
No.
of R
DTs
dis
tibut
ed (1
000s
)
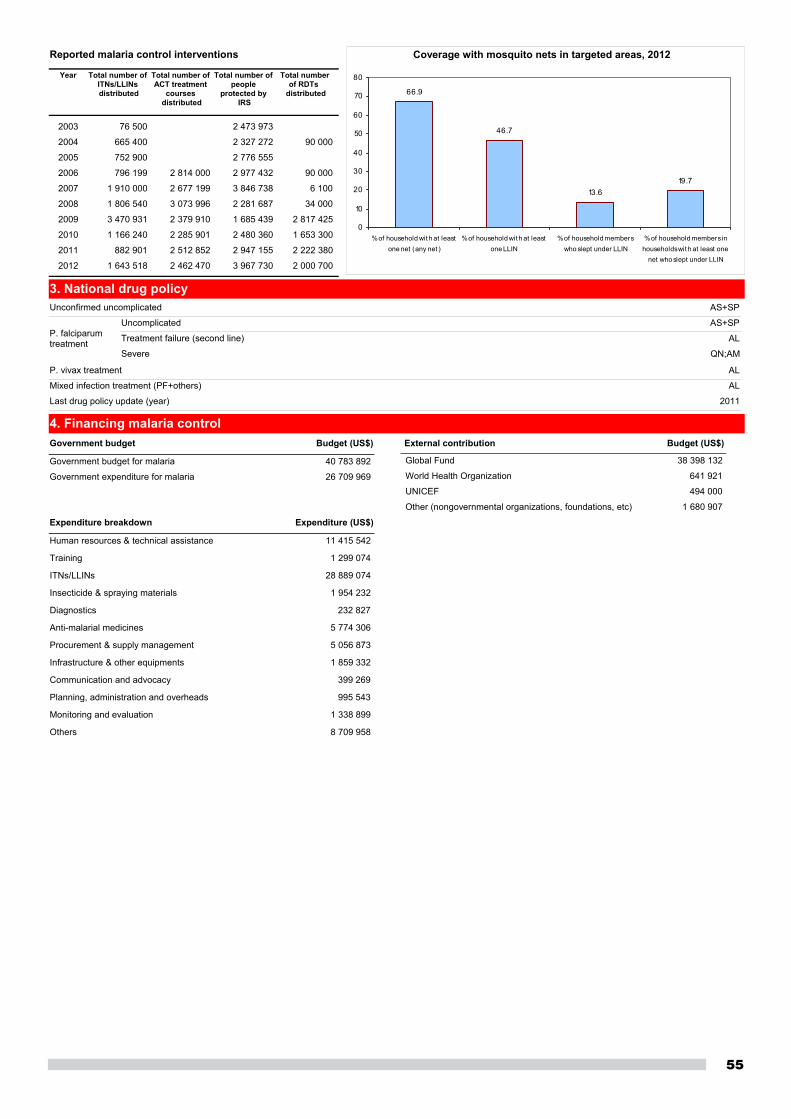
55
3. National drug policy
4. Financing malaria control
Coverage with mosquito nets in targeted areas, 2012
66.9
46.7
13.619.7
0
10
20
30
40
50
60
70
80
% of household wit h at leastone net (any net )
% of household wit h at leastone LLIN
% of household memberswho slept under LLIN
% of household members inhouseholds wit h at least one
net who slept under LLIN
AS+SP
AS+SP
AL
QN;AM
AL
AL
2011
Unconfirmed uncomplicated
Uncomplicated
Treatment failure (second line)
Severe
P. vivax treatment
Last drug policy update (year)
P. falciparumtreatment
Mixed infection treatment (PF+others)
Government budget Budget (US$)
40 783 892
26 709 969
Government budget for malaria
Government expenditure for malaria
External contribution Budget (US$)
Global Fund 38 398 132
World Health Organization 641 921
UNICEF 494 000
Other (nongovernmental organizations, foundations, etc) 1 680 907
Expenditure (US$)Expenditure breakdown
11 415 542Human resources & technical assistance
1 299 074Training
28 889 074ITNs/LLINs
1 954 232Insecticide & spraying materials
232 827Diagnostics
5 774 306Anti-malarial medicines
5 056 873Procurement & supply management
1 859 332Infrastructure & other equipments
399 269Communication and advocacy
995 543Planning, administration and overheads
1 338 899Monitoring and evaluation
8 709 958Others
Year Total number of ITNs/LLINs distributed
Total number of ACT treatment
courses distributed
Total number of people
protected by IRS
Total number of RDTs
distributed
Reported malaria control interventions
2003 76 500 2 473 973
2004 665 400 2 327 272 90 000
2005 752 900 2 776 555
2006 796 199 2 814 000 2 977 432 90 000
2007 1 910 000 2 677 199 3 846 738 6 100
2008 1 806 540 3 073 996 2 281 687 34 000
2009 3 470 931 2 379 910 1 685 439 2 817 425
2010 1 166 240 2 285 901 2 480 360 1 653 300
2011 882 901 2 512 852 2 947 155 2 222 380
2012 1 643 518 2 462 470 3 967 730 2 000 700
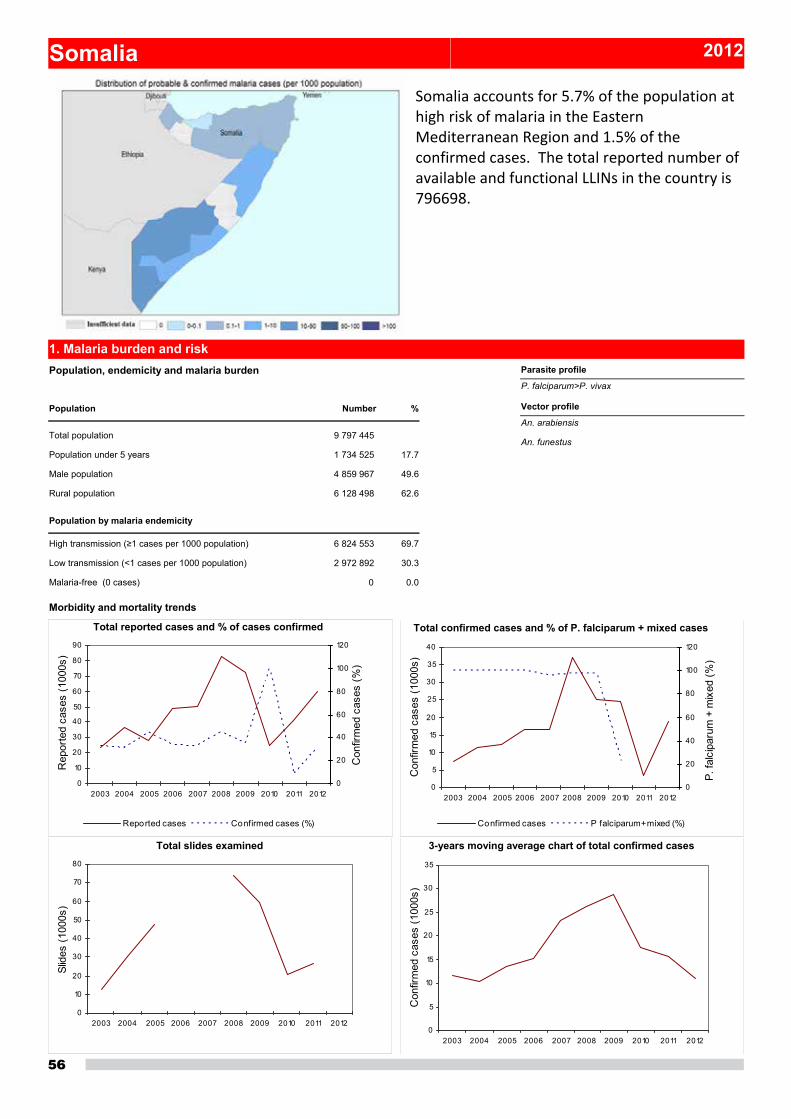
56
Somalia 2012
Somalia accounts for 5.7% of the population at high risk of malaria in the Eastern Mediterranean Region and 1.5% of the confirmed cases. The total reported number of available and functional LLINs in the country is 796698.
1. Malaria burden and risk
Morbidity and mortality trends
Population, endemicity and malaria burden
Total population 9 797 445
Population under 5 years 1 734 525
Male population 4 859 967
Rural population 6 128 498
High transmission (≥1 cases per 1000 population) 6 824 553
Low transmission (<1 cases per 1000 population) 2 972 892
Malaria-free (0 cases) 0
Population
Population by malaria endemicity
49.6
17.7
62.6
69.7
30.3
0.0
Number %
Total confirmed cases and % of P. falciparum + mixed cases
0
5
10
15
20
25
30
35
40
2003 2004 2005 2006 2007 2008 2009 2010 2011 2012
Con
firm
ed c
ases
(100
0s)
0
20
40
60
80
100
120
P. fa
lcip
arum
+ m
ixed
(%)
Confirmed cases P falciparum+ mixed (%)
Total reported cases and % of cases confirmed
0
10
20
30
40
50
60
70
80
90
2003 2004 2005 2006 2007 2008 2009 2010 2011 2012
Rep
orte
d ca
ses
(100
0s)
0
20
40
60
80
100
120
Con
firm
ed c
ases
(%)
Reported cases Confirmed cases (%)
Total slides examined
0
10
20
30
40
50
60
70
80
2003 2004 2005 2006 2007 2008 2009 2010 2011 2012
Slid
es (1
000s
)
3-years moving average chart of total confirmed cases
0
5
10
15
20
25
30
35
2003 2004 2005 2006 2007 2008 2009 2010 2011 2012
Con
firm
ed c
ases
(100
0s)
Vector profile
An. arabiensis
An. funestus
Parasite profile
P. falciparum>P. vivax
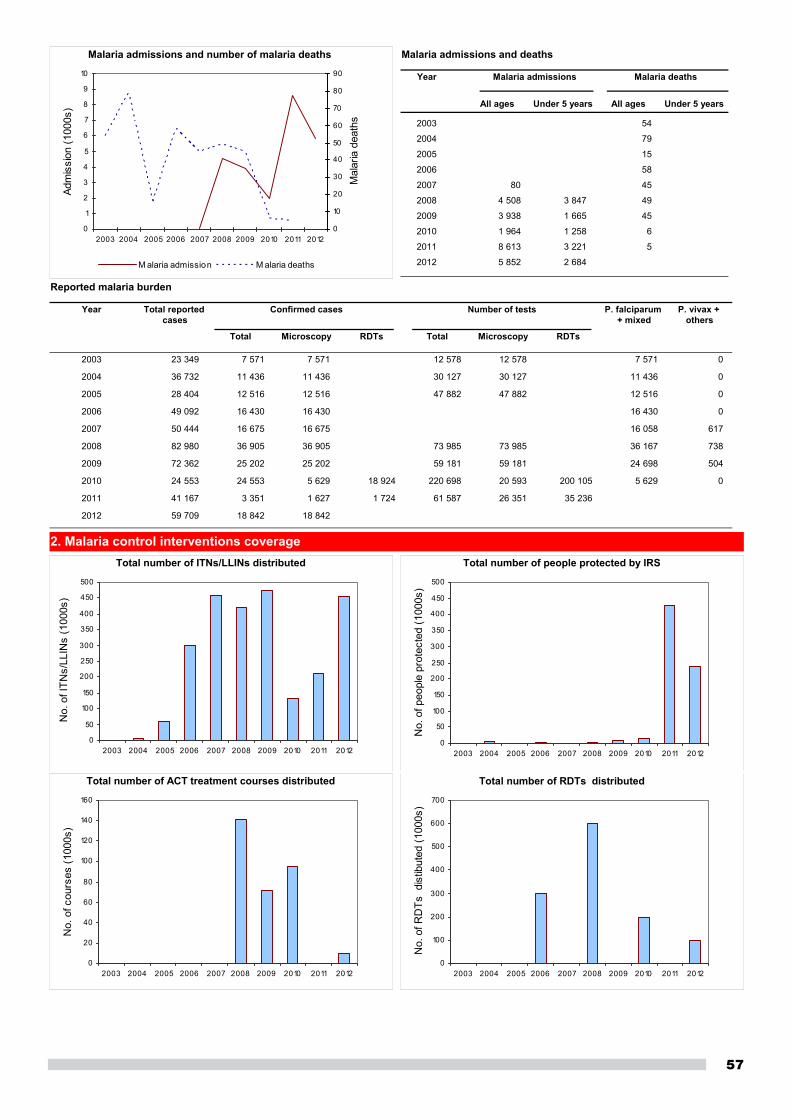
57
2. Malaria control interventions coverage
Malaria admissions and number of malaria deaths
0
1
2
3
4
5
6
7
8
9
10
2003 2004 2005 2006 2007 2008 2009 2010 2011 2012
Adm
issi
on (1
000s
)
0
10
20
30
40
50
60
70
80
90
Mal
aria
dea
ths
M alaria admission M alaria deaths
Year Total reported cases
Total Microscopy RDTs Total Microscopy RDTs
P. falciparum + mixed
P. vivax + others
Confirmed cases Number of tests
Reported malaria burden
2003 23 349 7 571 7 571 12 578 12 578 7 571 0
2004 36 732 11 436 11 436 30 127 30 127 11 436 0
2005 28 404 12 516 12 516 47 882 47 882 12 516 0
2006 49 092 16 430 16 430 16 430 0
2007 50 444 16 675 16 675 16 058 617
2008 82 980 36 905 36 905 73 985 73 985 36 167 738
2009 72 362 25 202 25 202 59 181 59 181 24 698 504
2010 24 553 24 553 5 629 18 924 220 698 20 593 200 105 5 629 0
2011 41 167 3 351 1 627 1 724 61 587 26 351 35 236
2012 59 709 18 842 18 842
Year
All ages Under 5 years All ages Under 5 years
Malaria admissions Malaria deaths
Malaria admissions and deaths
2003 54
2004 79
2005 15
2006 58
2007 80 45
2008 4 508 3 847 49
2009 3 938 1 665 45
2010 1 964 1 258 6
2011 8 613 3 221 5
2012 5 852 2 684
Total number of ITNs/LLINs distributed
0
50
100
150
200
250
300
350
400
450
500
2003 2004 2005 2006 2007 2008 2009 2010 2011 2012
No.
of I
TNs/
LLIN
s (1
000s
)
Total number of people protected by IRS
0
50
100
150
200
250
300
350
400
450
500
2003 2004 2005 2006 2007 2008 2009 2010 2011 2012
No.
of p
eopl
e pr
otec
ted
(100
0s)
Total number of ACT treatment courses distributed
0
20
40
60
80
100
120
140
160
2003 2004 2005 2006 2007 2008 2009 2010 2011 2012
No.
of c
ours
es (1
000s
)
Total number of RDTs distributed
0
100
200
300
400
500
600
700
2003 2004 2005 2006 2007 2008 2009 2010 2011 2012
No.
of R
DTs
dis
tibut
ed (1
000s
)
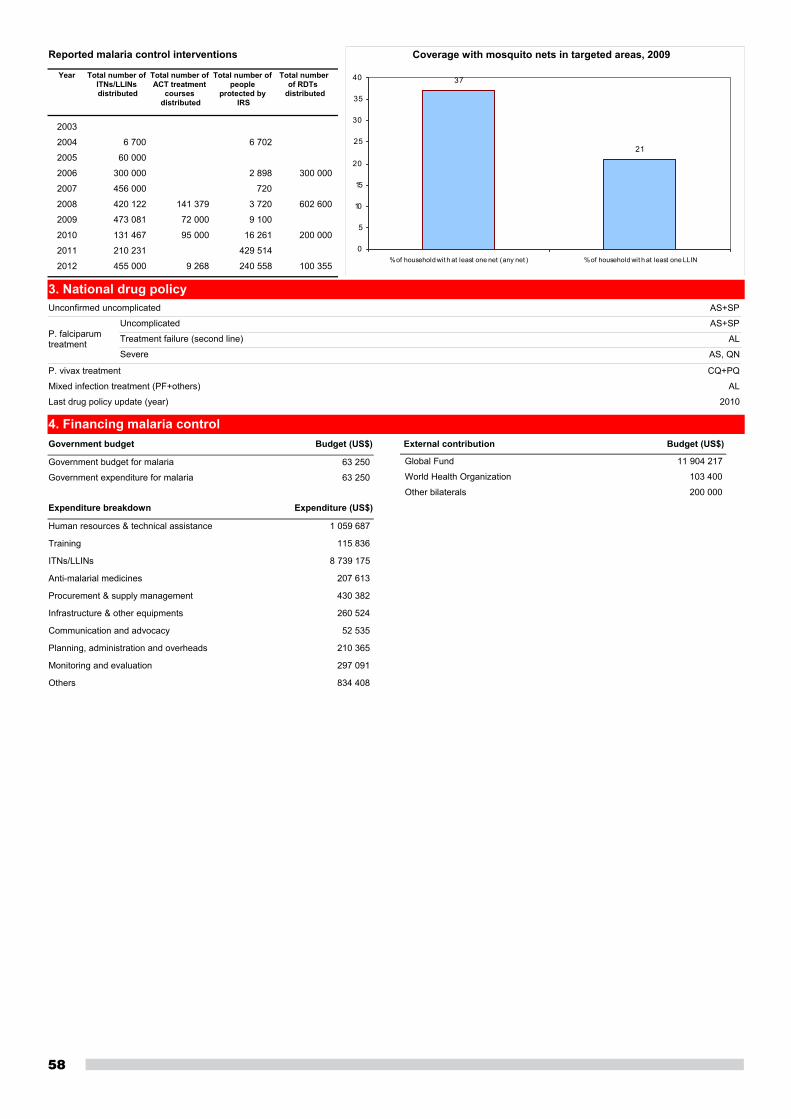
58
3. National drug policy
4. Financing malaria control
Coverage with mosquito nets in targeted areas, 2009
37
21
0
5
10
15
20
25
30
35
40
% of household wit h at least one net (any net ) % of household wit h at least one LLIN
AS+SP
AS+SP
AL
AS, QN
CQ+PQ
AL
2010
Unconfirmed uncomplicated
Uncomplicated
Treatment failure (second line)
Severe
P. vivax treatment
Last drug policy update (year)
P. falciparumtreatment
Mixed infection treatment (PF+others)
Government budget Budget (US$)
63 250
63 250
Government budget for malaria
Government expenditure for malaria
External contribution Budget (US$)
Global Fund 11 904 217
World Health Organization 103 400
Other bilaterals 200 000
Expenditure (US$)Expenditure breakdown
1 059 687Human resources & technical assistance
115 836Training
8 739 175ITNs/LLINs
207 613Anti-malarial medicines
430 382Procurement & supply management
260 524Infrastructure & other equipments
52 535Communication and advocacy
210 365Planning, administration and overheads
297 091Monitoring and evaluation
834 408Others
Year Total number of ITNs/LLINs distributed
Total number of ACT treatment
courses distributed
Total number of people
protected by IRS
Total number of RDTs
distributed
Reported malaria control interventions
2003
2004 6 700 6 702
2005 60 000
2006 300 000 2 898 300 000
2007 456 000 720
2008 420 122 141 379 3 720 602 600
2009 473 081 72 000 9 100
2010 131 467 95 000 16 261 200 000
2011 210 231 429 514
2012 455 000 9 268 240 558 100 355
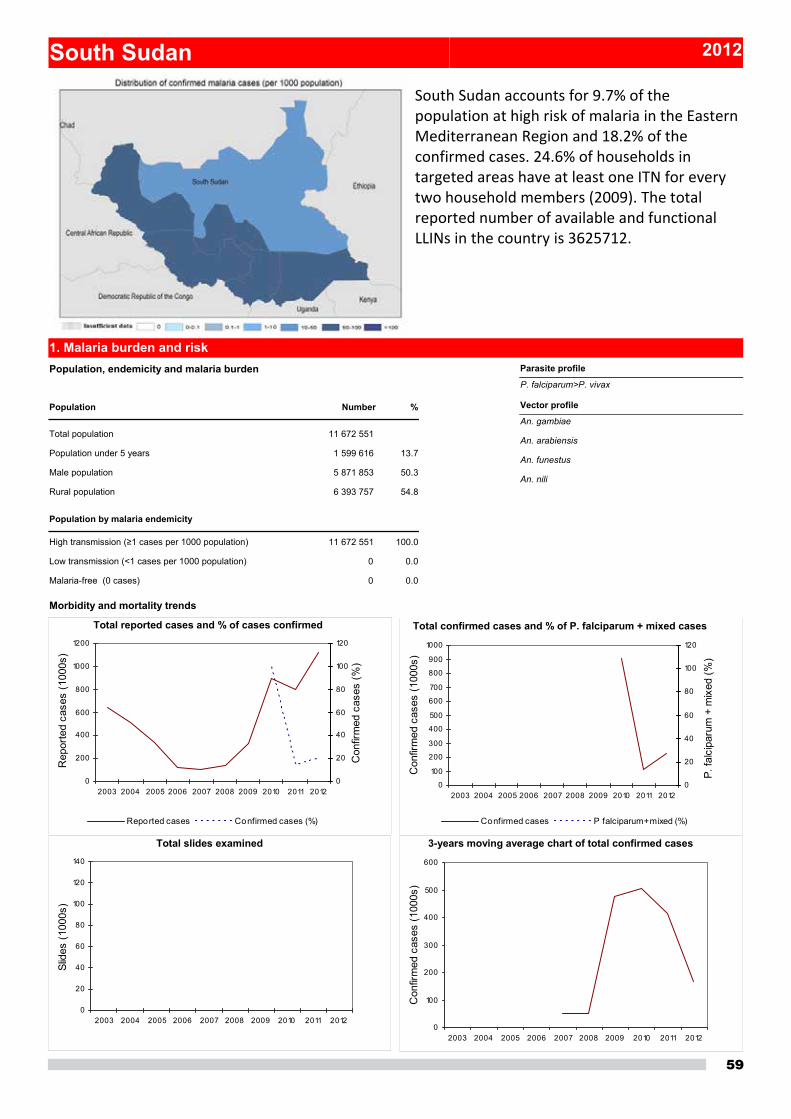
59
South Sudan 2012
South Sudan accounts for 9.7% of the population at high risk of malaria in the Eastern Mediterranean Region and 18.2% of the confirmed cases. 24.6% of households in targeted areas have at least one ITN for every two household members (2009). The total reported number of available and functional LLINs in the country is 3625712.
1. Malaria burden and risk
Morbidity and mortality trends
Population, endemicity and malaria burden
Total population 11 672 551
Population under 5 years 1 599 616
Male population 5 871 853
Rural population 6 393 757
High transmission (≥1 cases per 1000 population) 11 672 551
Low transmission (<1 cases per 1000 population) 0
Malaria-free (0 cases) 0
Population
Population by malaria endemicity
50.3
13.7
54.8
100.0
0.0
0.0
Number %
Total confirmed cases and % of P. falciparum + mixed cases
0
100
200
300
400
500
600
700
800
900
1000
2003 2004 2005 2006 2007 2008 2009 2010 2011 2012
Con
firm
ed c
ases
(100
0s)
0
20
40
60
80
100
120
P. fa
lcip
arum
+ m
ixed
(%)
Confirmed cases P falciparum+ mixed (%)
Total reported cases and % of cases confirmed
0
200
400
600
800
1000
1200
2003 2004 2005 2006 2007 2008 2009 2010 2011 2012
Rep
orte
d ca
ses
(100
0s)
0
20
40
60
80
100
120
Con
firm
ed c
ases
(%)
Reported cases Confirmed cases (%)
Total slides examined
0
20
40
60
80
100
120
140
2003 2004 2005 2006 2007 2008 2009 2010 2011 2012
Slid
es (1
000s
)
3-years moving average chart of total confirmed cases
0
100
200
300
400
500
600
2003 2004 2005 2006 2007 2008 2009 2010 2011 2012
Con
firm
ed c
ases
(100
0s)
Vector profile
An. gambiae
An. arabiensis
An. funestus
An. nili
Parasite profile
P. falciparum>P. vivax
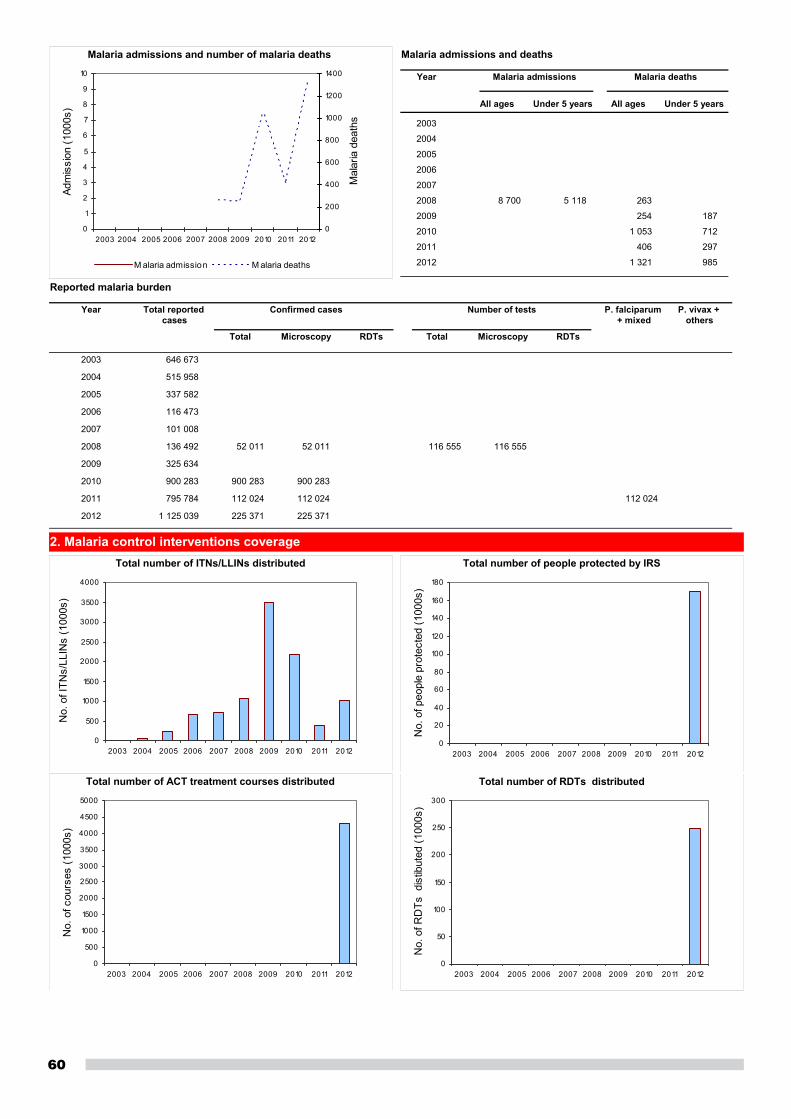
60
2. Malaria control interventions coverage
Malaria admissions and number of malaria deaths
0
1
2
3
4
5
6
7
8
9
10
2003 2004 2005 2006 2007 2008 2009 2010 2011 2012
Adm
issi
on (1
000s
)
0
200
400
600
800
1000
1200
1400
Mal
aria
dea
ths
M alaria admission M alaria deaths
Year Total reported cases
Total Microscopy RDTs Total Microscopy RDTs
P. falciparum + mixed
P. vivax + others
Confirmed cases Number of tests
Reported malaria burden
2003 646 673
2004 515 958
2005 337 582
2006 116 473
2007 101 008
2008 136 492 52 011 52 011 116 555 116 555
2009 325 634
2010 900 283 900 283 900 283
2011 795 784 112 024 112 024 112 024
2012 1 125 039 225 371 225 371
Year
All ages Under 5 years All ages Under 5 years
Malaria admissions Malaria deaths
Malaria admissions and deaths
2003
2004
2005
2006
2007
2008 8 700 5 118 263
2009 254 187
2010 1 053 712
2011 406 297
2012 1 321 985
Total number of ITNs/LLINs distributed
0
500
1000
1500
2000
2500
3000
3500
4000
2003 2004 2005 2006 2007 2008 2009 2010 2011 2012
No.
of I
TNs/
LLIN
s (1
000s
)
Total number of people protected by IRS
0
20
40
60
80
100
120
140
160
180
2003 2004 2005 2006 2007 2008 2009 2010 2011 2012
No.
of p
eopl
e pr
otec
ted
(100
0s)
Total number of ACT treatment courses distributed
0
500
1000
1500
2000
2500
3000
3500
4000
4500
5000
2003 2004 2005 2006 2007 2008 2009 2010 2011 2012
No.
of c
ours
es (1
000s
)
Total number of RDTs distributed
0
50
100
150
200
250
300
2003 2004 2005 2006 2007 2008 2009 2010 2011 2012
No.
of R
DTs
dis
tibut
ed (1
000s
)
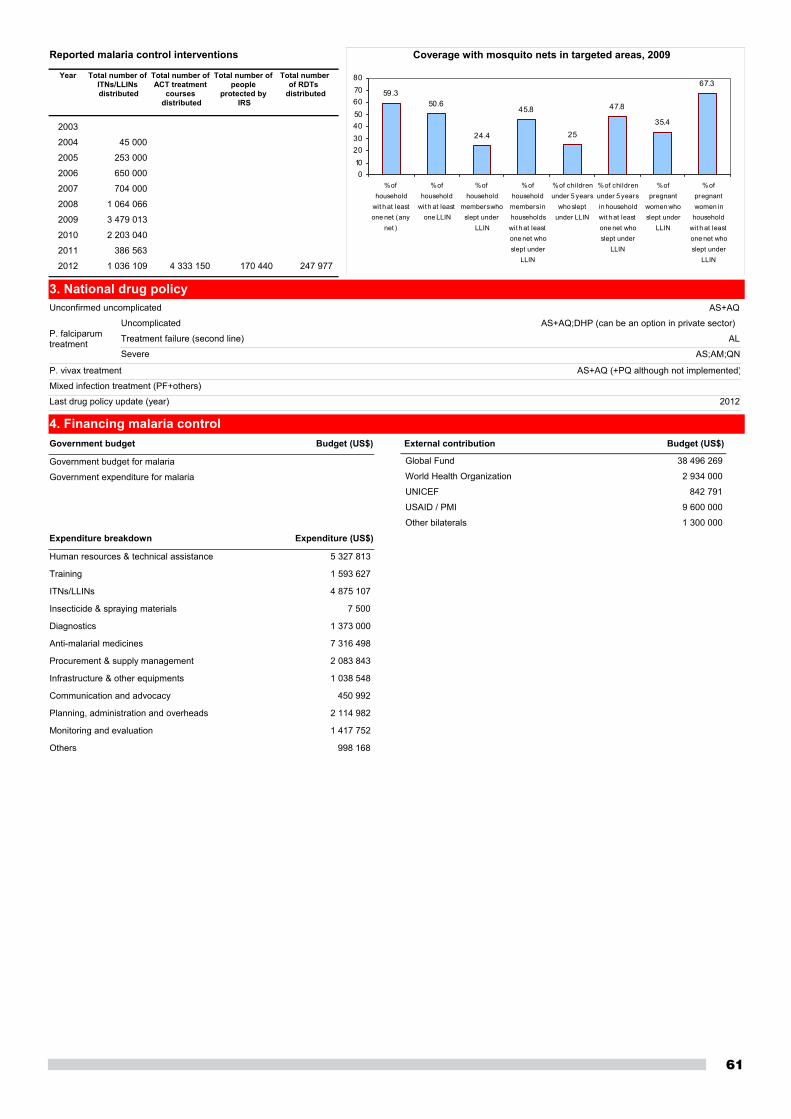
61
3. National drug policy
4. Financing malaria control
Coverage with mosquito nets in targeted areas, 2009
59.350.6
24.4
45.8
25
47.8
35.4
67.3
01020304050607080
% ofhousehold
wit h at leastone net (any
net )
% ofhousehold
wit h at leastone LLIN
% ofhousehold
members whoslept under
LLIN
% ofhousehold
members inhouseholds
wit h at leastone net whoslept under
LLIN
% of childrenunder 5 years
who sleptunder LLIN
% of childrenunder 5 yearsin householdwit h at leastone net whoslept under
LLIN
% ofpregnant
women whoslept under
LLIN
% ofpregnantwomen in
householdwit h at leastone net whoslept under
LLIN
AS+AQ
AS+AQ;DHP (can be an option in private sector)
AL
AS;AM;QN
AS+AQ (+PQ although not implemented)
2012
Unconfirmed uncomplicated
Uncomplicated
Treatment failure (second line)
Severe
P. vivax treatment
Last drug policy update (year)
P. falciparumtreatment
Mixed infection treatment (PF+others)
Government budget Budget (US$)
Government budget for malaria
Government expenditure for malaria
External contribution Budget (US$)
Global Fund 38 496 269
World Health Organization 2 934 000
UNICEF 842 791
USAID / PMI 9 600 000
Other bilaterals 1 300 000
Expenditure (US$)Expenditure breakdown
5 327 813Human resources & technical assistance
1 593 627Training
4 875 107ITNs/LLINs
7 500Insecticide & spraying materials
1 373 000Diagnostics
7 316 498Anti-malarial medicines
2 083 843Procurement & supply management
1 038 548Infrastructure & other equipments
450 992Communication and advocacy
2 114 982Planning, administration and overheads
1 417 752Monitoring and evaluation
998 168Others
Year Total number of ITNs/LLINs distributed
Total number of ACT treatment
courses distributed
Total number of people
protected by IRS
Total number of RDTs
distributed
Reported malaria control interventions
2003
2004 45 000
2005 253 000
2006 650 000
2007 704 000
2008 1 064 066
2009 3 479 013
2010 2 203 040
2011 386 563
2012 1 036 109 4 333 150 170 440 247 977
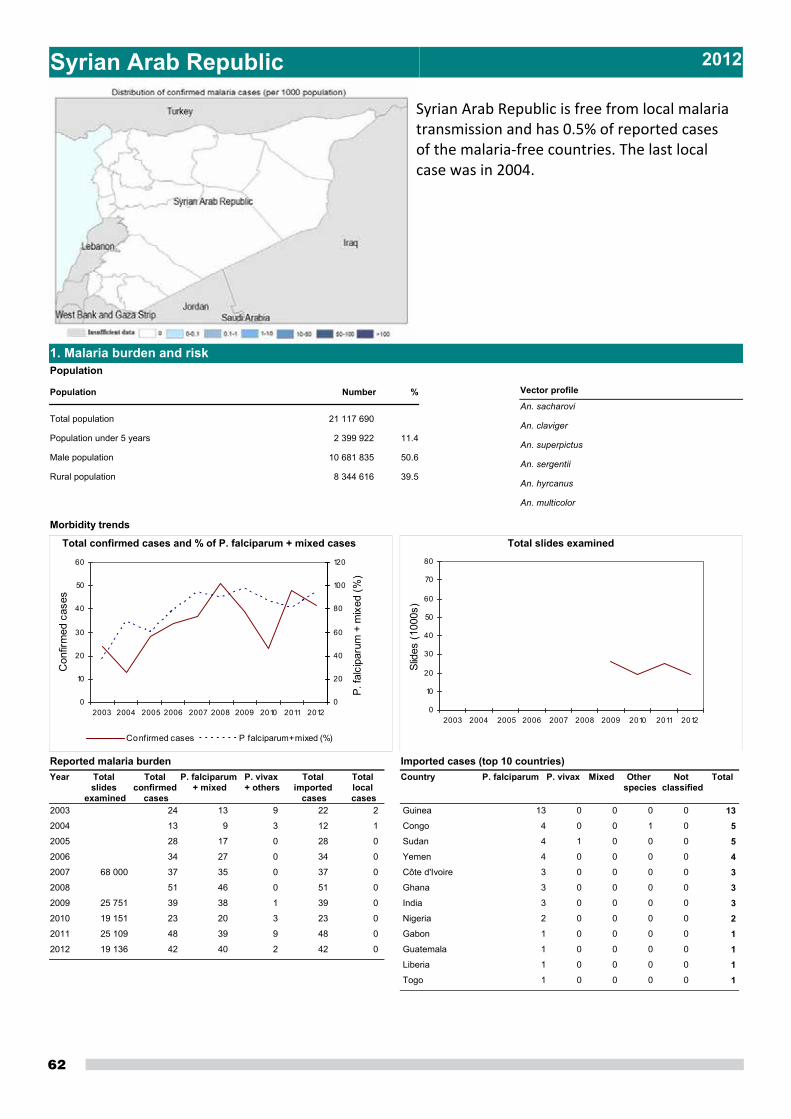
62
Syrian Arab Republic 2012
Syrian Arab Republic is free from local malaria transmission and has 0.5% of reported cases of the malaria‐free countries. The last local case was in 2004.
Morbidity trends
1. Malaria burden and riskPopulation
Total population 21 117 690
Population under 5 years 2 399 922
Male population 10 681 835
Rural population 8 344 616
Population
50.6
11.4
39.5
Number %
Total slides examined
0
10
20
30
40
50
60
70
80
2003 2004 2005 2006 2007 2008 2009 2010 2011 2012
Slid
es (1
000s
)
Total confirmed cases and % of P. falciparum + mixed cases
0
10
20
30
40
50
60
2003 2004 2005 2006 2007 2008 2009 2010 2011 2012
Con
firm
ed c
ases
0
20
40
60
80
100
120
P. fa
lcip
arum
+ m
ixed
(%)
Confirmed cases P falciparum+ mixed (%)
Vector profile
An. sacharovi
An. claviger
An. superpictus
An. sergentii
An. hyrcanus
An. multicolor
Year Total slides
examined
Total confirmed
cases
P. falciparum + mixed
Reported malaria burdenP. vivax + others
Total imported
cases
Total local cases
2003 24 13 9 22 2
2004 13 9 3 12 1
2005 28 17 0 28 0
2006 34 27 0 34 0
2007 68 000 37 35 0 37 0
2008 51 46 0 51 0
2009 25 751 39 38 1 39 0
2010 19 151 23 20 3 23 0
2011 25 109 48 39 9 48 0
2012 19 136 42 40 2 42 0
P. falciparumCountry P. vivax Mixed TotalOther species
Notclassified
Imported cases (top 10 countries)
Guinea 13 0 0 130 0
Congo 4 0 0 51 0
Sudan 4 1 0 50 0
Yemen 4 0 0 40 0
Côte d'Ivoire 3 0 0 30 0
Ghana 3 0 0 30 0
India 3 0 0 30 0
Nigeria 2 0 0 20 0
Gabon 1 0 0 10 0
Guatemala 1 0 0 10 0
Liberia 1 0 0 10 0
Togo 1 0 0 10 0
63
2. National drug policy
3. Financing malaria control
AL+PQ
QN+D
AS+QN
CQ+PQ
AL+PQ
2010
Unconfirmed uncomplicated
Uncomplicated
Treatment failure (second line)
Severe
P. vivax treatment
Last drug policy update (year)
P. falciparumtreatment
Mixed infection treatment (PF+others)
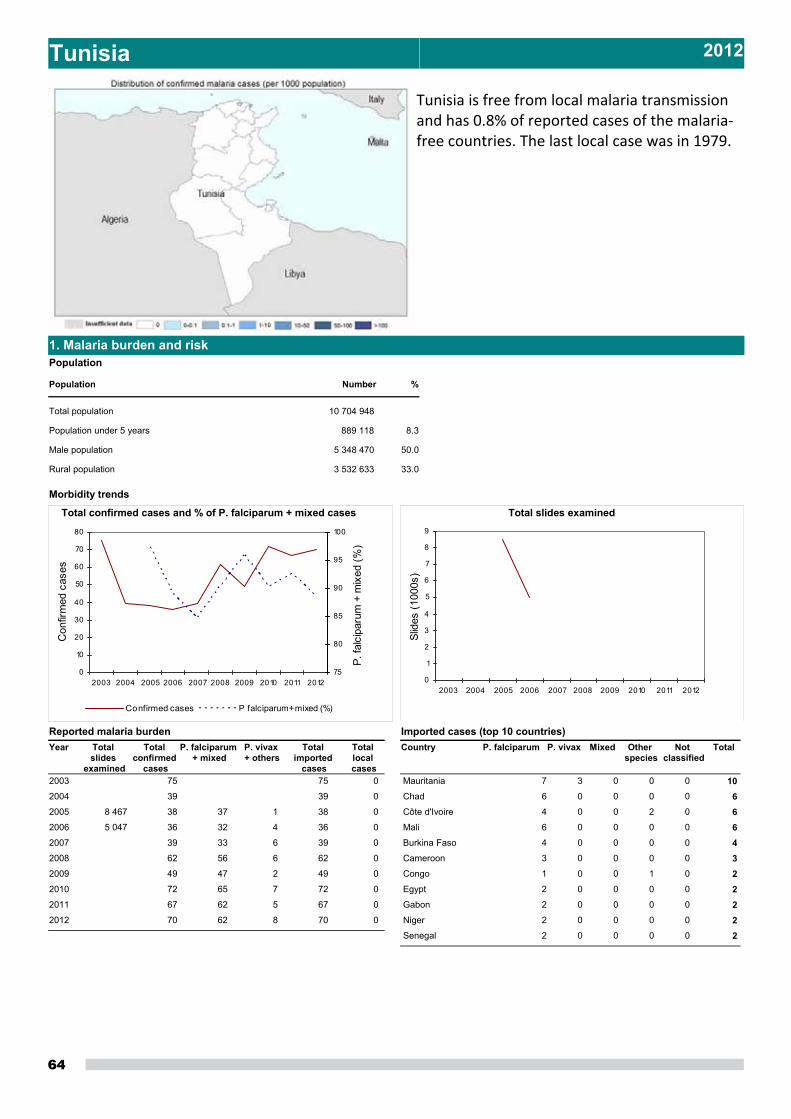
64
Tunisia 2012
Tunisia is free from local malaria transmission and has 0.8% of reported cases of the malaria‐free countries. The last local case was in 1979.
Morbidity trends
1. Malaria burden and riskPopulation
Total population 10 704 948
Population under 5 years 889 118
Male population 5 348 470
Rural population 3 532 633
Population
50.0
8.3
33.0
Number %
Total slides examined
0
1
2
3
4
5
6
7
8
9
2003 2004 2005 2006 2007 2008 2009 2010 2011 2012
Slid
es (1
000s
)
Total confirmed cases and % of P. falciparum + mixed cases
0
10
20
30
40
50
60
70
80
2003 2004 2005 2006 2007 2008 2009 2010 2011 2012
Con
firm
ed c
ases
75
80
85
90
95
100
P. fa
lcip
arum
+ m
ixed
(%)
Confirmed cases P falciparum+ mixed (%)
Year Total slides
examined
Total confirmed
cases
P. falciparum + mixed
Reported malaria burdenP. vivax + others
Total imported
cases
Total local cases
2003 75 75 0
2004 39 39 0
2005 8 467 38 37 1 38 0
2006 5 047 36 32 4 36 0
2007 39 33 6 39 0
2008 62 56 6 62 0
2009 49 47 2 49 0
2010 72 65 7 72 0
2011 67 62 5 67 0
2012 70 62 8 70 0
P. falciparumCountry P. vivax Mixed TotalOther species
Notclassified
Imported cases (top 10 countries)
Mauritania 7 3 0 100 0
Chad 6 0 0 60 0
Côte d'Ivoire 4 0 0 62 0
Mali 6 0 0 60 0
Burkina Faso 4 0 0 40 0
Cameroon 3 0 0 30 0
Congo 1 0 0 21 0
Egypt 2 0 0 20 0
Gabon 2 0 0 20 0
Niger 2 0 0 20 0
Senegal 2 0 0 20 0
65
2. National drug policy
3. Financing malaria control
AL
QN
QN
CQ+PQ
2007
Unconfirmed uncomplicated
Uncomplicated
Treatment failure (second line)
Severe
P. vivax treatment
Last drug policy update (year)
P. falciparumtreatment
Mixed infection treatment (PF+others)
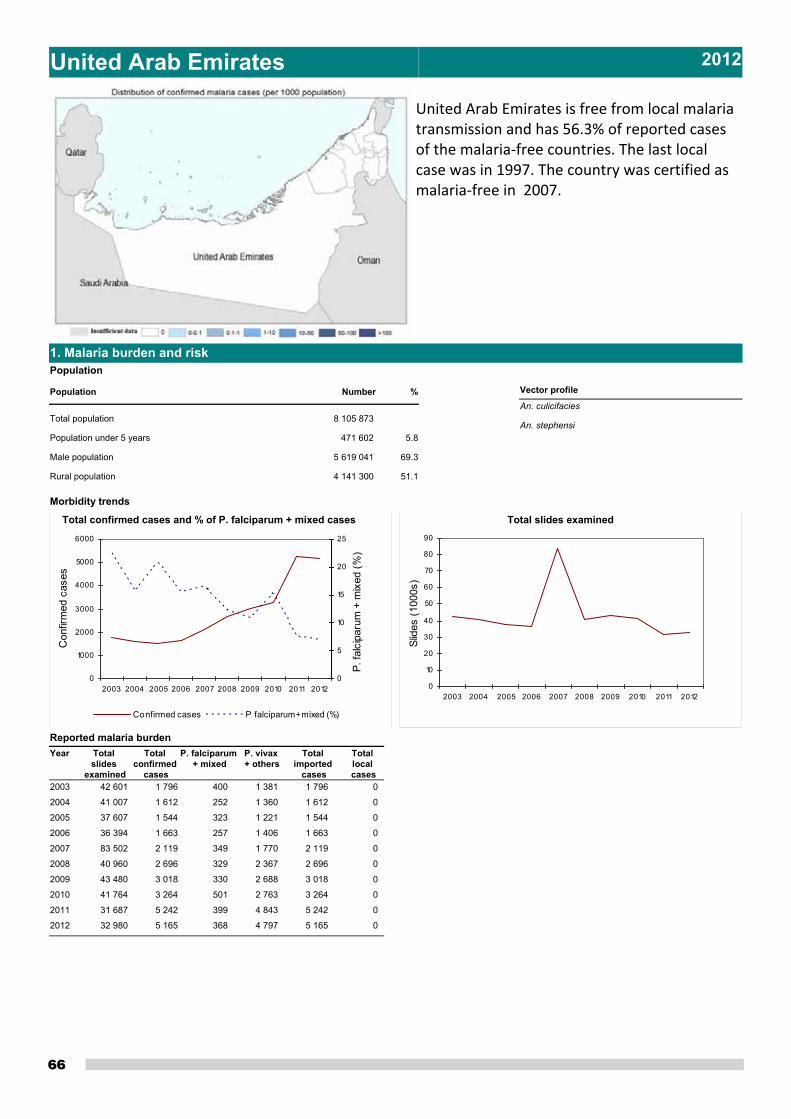
66
United Arab Emirates 2012
United Arab Emirates is free from local malaria transmission and has 56.3% of reported cases of the malaria‐free countries. The last local case was in 1997. The country was certified as malaria‐free in 2007.
Morbidity trends
1. Malaria burden and riskPopulation
Total population 8 105 873
Population under 5 years 471 602
Male population 5 619 041
Rural population 4 141 300
Population
69.3
5.8
51.1
Number %
Total slides examined
0
10
20
30
40
50
60
70
80
90
2003 2004 2005 2006 2007 2008 2009 2010 2011 2012
Slid
es (1
000s
)
Total confirmed cases and % of P. falciparum + mixed cases
0
1000
2000
3000
4000
5000
6000
2003 2004 2005 2006 2007 2008 2009 2010 2011 2012
Con
firm
ed c
ases
0
5
10
15
20
25
P. fa
lcip
arum
+ m
ixed
(%)
Confirmed cases P falciparum+ mixed (%)
Vector profile
An. culicifacies
An. stephensi
Year Total slides
examined
Total confirmed
cases
P. falciparum + mixed
Reported malaria burdenP. vivax + others
Total imported
cases
Total local cases
2003 42 601 1 796 400 1 381 1 796 0
2004 41 007 1 612 252 1 360 1 612 0
2005 37 607 1 544 323 1 221 1 544 0
2006 36 394 1 663 257 1 406 1 663 0
2007 83 502 2 119 349 1 770 2 119 0
2008 40 960 2 696 329 2 367 2 696 0
2009 43 480 3 018 330 2 688 3 018 0
2010 41 764 3 264 501 2 763 3 264 0
2011 31 687 5 242 399 4 843 5 242 0
2012 32 980 5 165 368 4 797 5 165 0
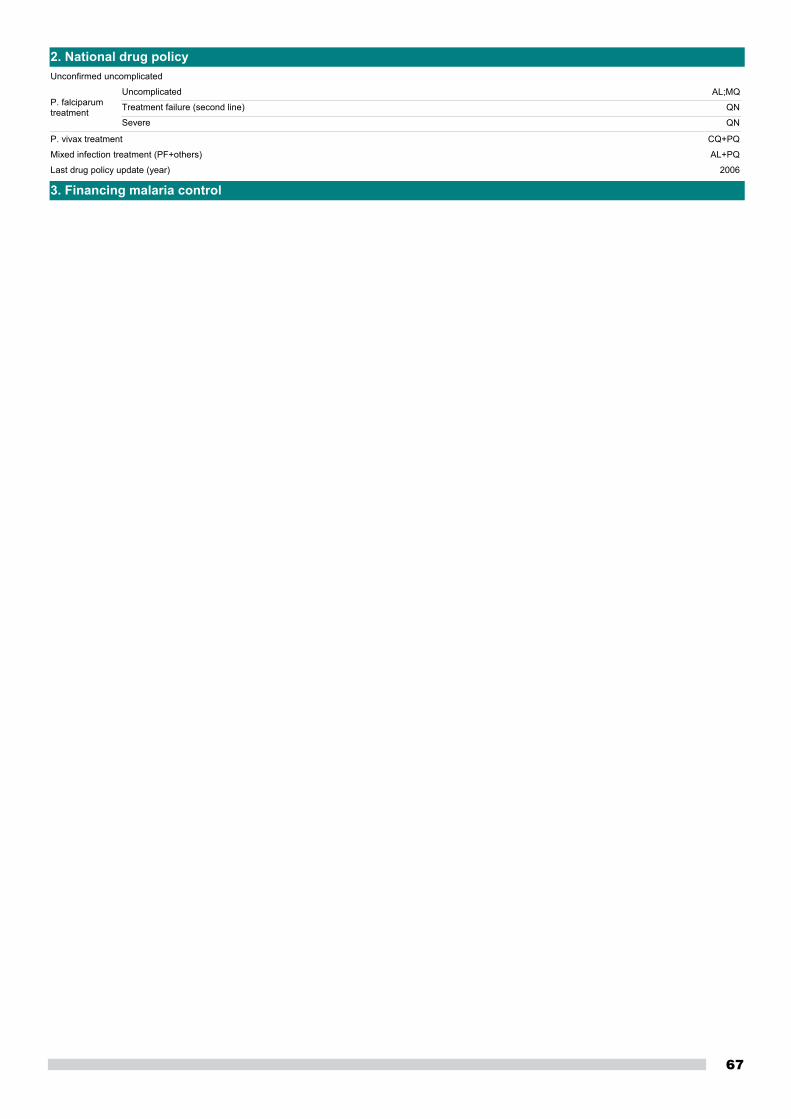
67
2. National drug policy
3. Financing malaria control
AL;MQ
QN
QN
CQ+PQ
AL+PQ
2006
Unconfirmed uncomplicated
Uncomplicated
Treatment failure (second line)
Severe
P. vivax treatment
Last drug policy update (year)
P. falciparumtreatment
Mixed infection treatment (PF+others)
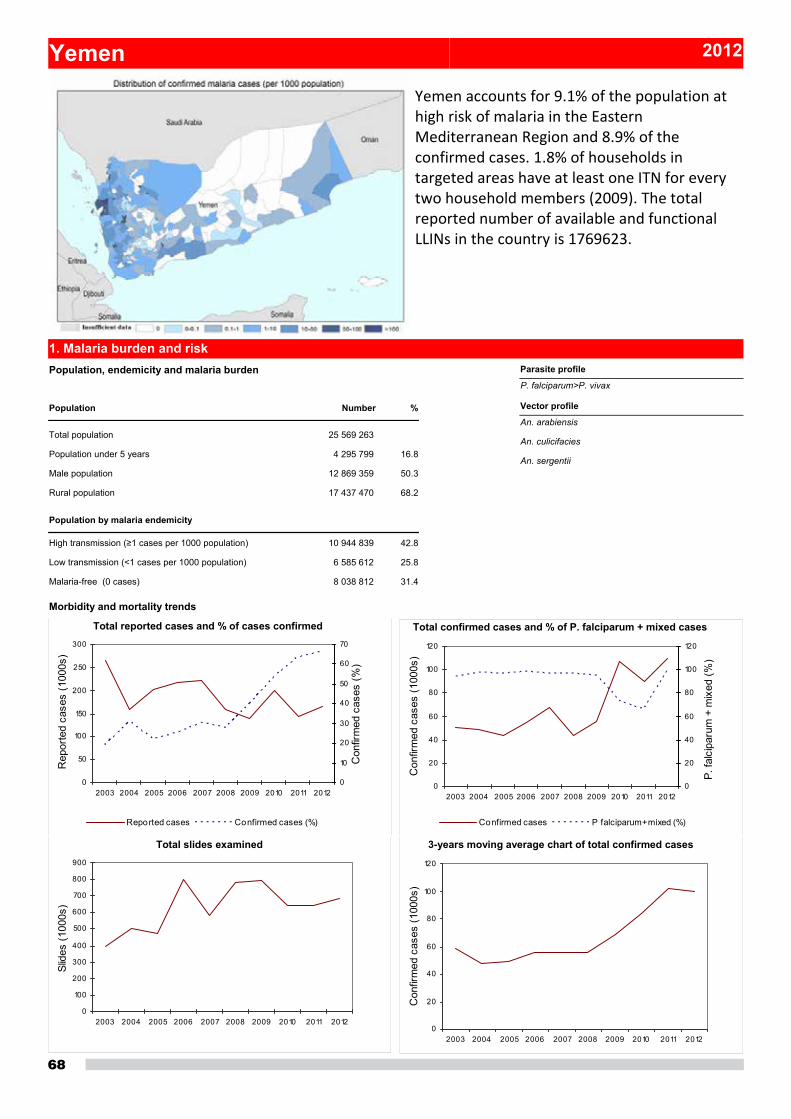
68
Yemen 2012
Yemen accounts for 9.1% of the population at high risk of malaria in the Eastern Mediterranean Region and 8.9% of the confirmed cases. 1.8% of households in targeted areas have at least one ITN for every two household members (2009). The total reported number of available and functional LLINs in the country is 1769623.
1. Malaria burden and risk
Morbidity and mortality trends
Population, endemicity and malaria burden
Total population 25 569 263
Population under 5 years 4 295 799
Male population 12 869 359
Rural population 17 437 470
High transmission (≥1 cases per 1000 population) 10 944 839
Low transmission (<1 cases per 1000 population) 6 585 612
Malaria-free (0 cases) 8 038 812
Population
Population by malaria endemicity
50.3
16.8
68.2
42.8
25.8
31.4
Number %
Total confirmed cases and % of P. falciparum + mixed cases
0
20
40
60
80
100
120
2003 2004 2005 2006 2007 2008 2009 2010 2011 2012
Con
firm
ed c
ases
(100
0s)
0
20
40
60
80
100
120
P. fa
lcip
arum
+ m
ixed
(%)
Confirmed cases P falciparum+ mixed (%)
Total reported cases and % of cases confirmed
0
50
100
150
200
250
300
2003 2004 2005 2006 2007 2008 2009 2010 2011 2012
Rep
orte
d ca
ses
(100
0s)
0
10
20
30
40
50
60
70
Con
firm
ed c
ases
(%)
Reported cases Confirmed cases (%)
Total slides examined
0
100
200
300
400
500
600
700
800
900
2003 2004 2005 2006 2007 2008 2009 2010 2011 2012
Slid
es (1
000s
)
3-years moving average chart of total confirmed cases
0
20
40
60
80
100
120
2003 2004 2005 2006 2007 2008 2009 2010 2011 2012
Con
firm
ed c
ases
(100
0s)
Vector profile
An. arabiensis
An. culicifacies
An. sergentii
Parasite profile
P. falciparum>P. vivax
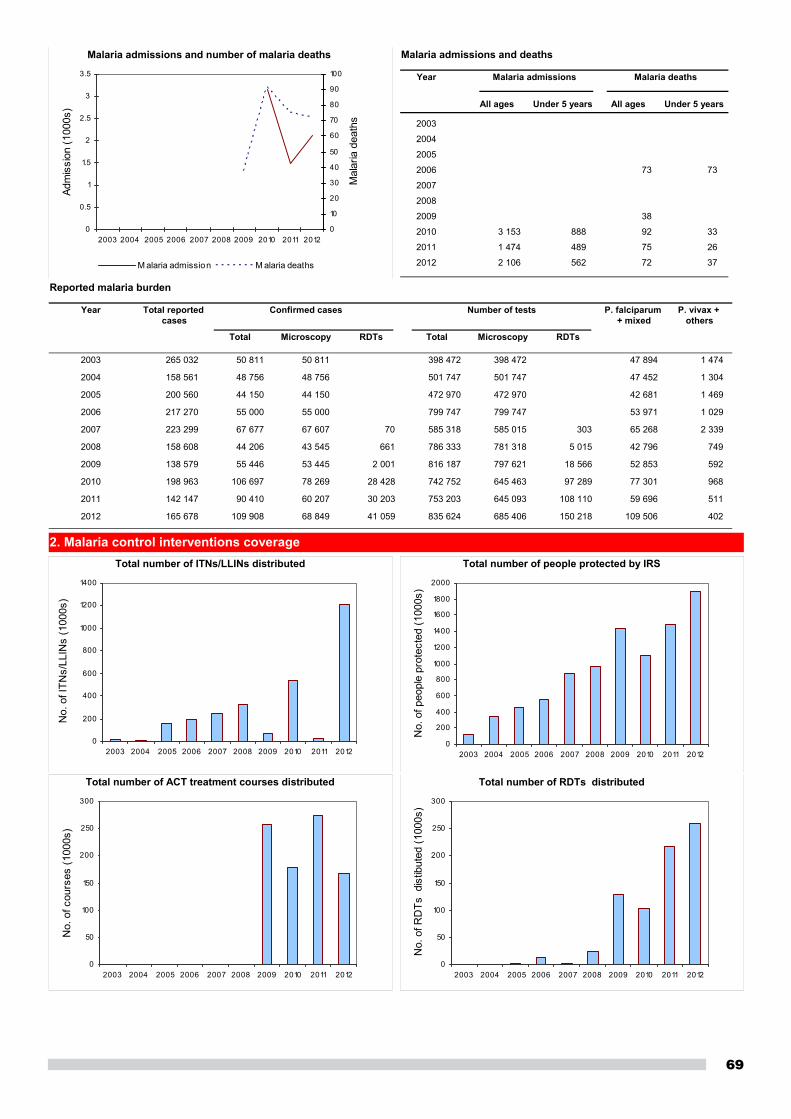
69
2. Malaria control interventions coverage
Malaria admissions and number of malaria deaths
0
0.5
1
1.5
2
2.5
3
3.5
2003 2004 2005 2006 2007 2008 2009 2010 2011 2012
Adm
issi
on (1
000s
)
0
10
20
30
40
50
60
70
80
90
100
Mal
aria
dea
ths
M alaria admission M alaria deaths
Year Total reported cases
Total Microscopy RDTs Total Microscopy RDTs
P. falciparum + mixed
P. vivax + others
Confirmed cases Number of tests
Reported malaria burden
2003 265 032 50 811 50 811 398 472 398 472 47 894 1 474
2004 158 561 48 756 48 756 501 747 501 747 47 452 1 304
2005 200 560 44 150 44 150 472 970 472 970 42 681 1 469
2006 217 270 55 000 55 000 799 747 799 747 53 971 1 029
2007 223 299 67 677 67 607 70 585 318 585 015 303 65 268 2 339
2008 158 608 44 206 43 545 661 786 333 781 318 5 015 42 796 749
2009 138 579 55 446 53 445 2 001 816 187 797 621 18 566 52 853 592
2010 198 963 106 697 78 269 28 428 742 752 645 463 97 289 77 301 968
2011 142 147 90 410 60 207 30 203 753 203 645 093 108 110 59 696 511
2012 165 678 109 908 68 849 41 059 835 624 685 406 150 218 109 506 402
Year
All ages Under 5 years All ages Under 5 years
Malaria admissions Malaria deaths
Malaria admissions and deaths
2003
2004
2005
2006 73 73
2007
2008
2009 38
2010 3 153 888 92 33
2011 1 474 489 75 26
2012 2 106 562 72 37
Total number of ITNs/LLINs distributed
0
200
400
600
800
1000
1200
1400
2003 2004 2005 2006 2007 2008 2009 2010 2011 2012
No.
of I
TNs/
LLIN
s (1
000s
)
Total number of people protected by IRS
0
200
400
600
800
1000
1200
1400
1600
1800
2000
2003 2004 2005 2006 2007 2008 2009 2010 2011 2012
No.
of p
eopl
e pr
otec
ted
(100
0s)
Total number of ACT treatment courses distributed
0
50
100
150
200
250
300
2003 2004 2005 2006 2007 2008 2009 2010 2011 2012
No.
of c
ours
es (1
000s
)
Total number of RDTs distributed
0
50
100
150
200
250
300
2003 2004 2005 2006 2007 2008 2009 2010 2011 2012
No.
of R
DTs
dis
tibut
ed (1
000s
)
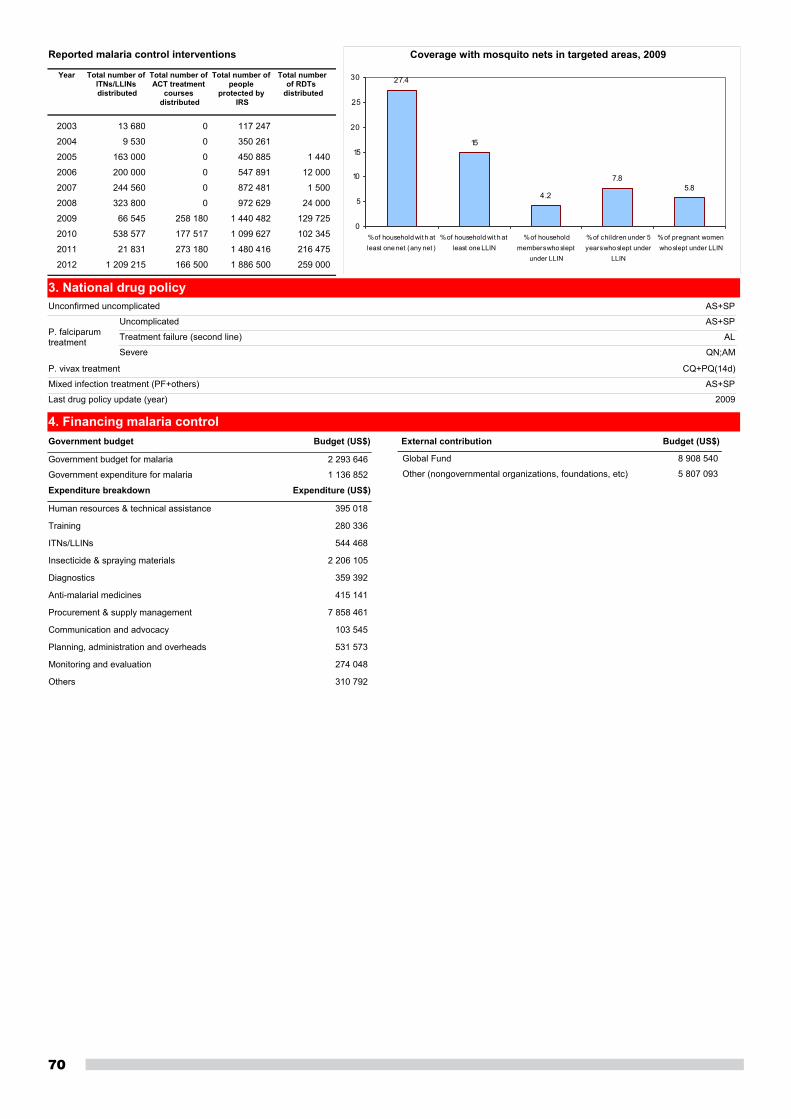
70
3. National drug policy
4. Financing malaria control
Coverage with mosquito nets in targeted areas, 2009
27.4
15
4.2
7.85.8
0
5
10
15
20
25
30
% of household wit h atleast one net (any net )
% of household wit h atleast one LLIN
% of householdmembers who slept
under LLIN
% of children under 5years who slept under
LLIN
% of pregnant womenwho slept under LLIN
AS+SP
AS+SP
AL
QN;AM
CQ+PQ(14d)
AS+SP
2009
Unconfirmed uncomplicated
Uncomplicated
Treatment failure (second line)
Severe
P. vivax treatment
Last drug policy update (year)
P. falciparumtreatment
Mixed infection treatment (PF+others)
Government budget Budget (US$)
2 293 646
1 136 852
Government budget for malaria
Government expenditure for malaria
External contribution Budget (US$)
Global Fund 8 908 540
Other (nongovernmental organizations, foundations, etc) 5 807 093
Expenditure (US$)Expenditure breakdown
395 018Human resources & technical assistance
280 336Training
544 468ITNs/LLINs
2 206 105Insecticide & spraying materials
359 392Diagnostics
415 141Anti-malarial medicines
7 858 461Procurement & supply management
103 545Communication and advocacy
531 573Planning, administration and overheads
274 048Monitoring and evaluation
310 792Others
Year Total number of ITNs/LLINs distributed
Total number of ACT treatment
courses distributed
Total number of people
protected by IRS
Total number of RDTs
distributed
Reported malaria control interventions
2003 13 680 0 117 247
2004 9 530 0 350 261
2005 163 000 0 450 885 1 440
2006 200 000 0 547 891 12 000
2007 244 560 0 872 481 1 500
2008 323 800 0 972 629 24 000
2009 66 545 258 180 1 440 482 129 725
2010 538 577 177 517 1 099 627 102 345
2011 21 831 273 180 1 480 416 216 475
2012 1 209 215 166 500 1 886 500 259 000
Malaria in the Eastern Mediterranean Region 2013
71
Annex 3. Abbreviations
ABER annual blood examination rate
ACT artemisinin-based combination therapy
AL artemether-lumefantrine
AM artemether
AQ amodiaquine
ART artemisinin
AS artesunate
CL clindamycin
CQ chloroquine
D doxycycline
DHA dihydroartemisinin
IPTp intermittent preventive treatment in pregnancy
IRS indoor residual spraying
ITN insecticide-treated mosquito net
LLIN long-lasting insecticidal net
MICS multiple indicator cluster survey
MIS malaria indicator survey
MQ mefloquine
PG proguanil
PPQ piperaquine
PQ primaquine
QN quinine
RDT rapid diagnostic test
SP sulfadoxine-pyrimethamine
SPR slide positivity rate
T tetracycline

This report summarizes the malaria situation in the WHO Eastern Mediterranean Region by end 2012. It provides a summary of the regional burden and the key interventions in the seven countries in the Region with a high burden of malaria. The report expands on the annual World malaria report, providing comprehensive country profiles for all countries, including those that are malaria-free and those targeting elimination, as well as the high-burden countries.