Embed Size (px)
Citation preview
Turmoil to Transformation20 Years after the Asian Financial Crisis
MALAYSIA ECONOMIC MONITOR
DECEMBER 2017
Pub
lic D
iscl
osur
e A
utho
rized
Pub
lic D
iscl
osur
e A
utho
rized
Pub
lic D
iscl
osur
e A
utho
rized
Pub
lic D
iscl
osur
e A
utho
rized

CONNECT WITH US
wbg.org/Malaysia
@WorldBankMalaysia
@WB_AsiaPacific
blogs.worldbank.org/category/countries/malaysia
Turmoil to Transformation20 Years after the Asian Financial Crisis
MALAYSIA ECONOMIC MONITOR
DECEMBER 2017
This edition of the Malaysia Economic Monitor was prepared by Richard Record (task team leader), Wei Zhang, Yew Keat Chong, Jose De Luna Martinez, Gabriel Zaourak, Alan Lau, Nur Idayu Ibrahim, Boon Seong Lim, Nor Hidayah Abdul Rahman, Uma Rajoo, Ana Maria Aviles, Djauhari Sitorus, Ahmad Hafiz Abdul Aziz, Mohamed Rozani Mohamed Osman, Ashraf Arshad and Ilias Skamnelos. Norman Loayza, Samuel Fraiberger, Trevor Monroe, Kenneth Simler and Achim Schmillen provided additional contributions.
Ulrich Zachau, Faris Hadad-Zervos and Deepak Mishra provided overall guidance. The team is grateful to Sudhir Shetty, Shabih Ali Mohib, Shakira Teh Sharifuddin, Jeeva Govindasamy, Congyan Tan and Ekaterine Vashakmadze for their constructive input.
This report benefited from productive discussions with current and former officials in the Economic Planning Unit in the Prime Minister’s Department, Bank Negara Malaysia, the Ministry of Finance, the Securities Commission Malaysia, Bursa Malaysia and many other Government ministries and agencies, which provided valuable information and useful feedback.
In particular, the team would like to thank the International Cooperation Section of the Economic Planning Unit and the Economics Department of Bank Negara Malaysia for close ongoing collaboration with the World Bank and crucial support to the launch of this report. The team would also like to express its gratitude to analysts at several private financial firms and rating institutions, whose participation in a constructive dialogue informed the preparation of this report.
Joshua Foong, and Min Hui Lee led external communications, production and design of the report. Irfan Kortschak edited the document, and Gillian Gan provided administrative support.
Cover & Report Design: Kane ChongPhotography: Samuel Goh
The findings, interpretations, and conclusions expressed in this report do not necessarily reflect the views of the Executive Directors of the World Bank or the Governments they represent. The World Bank does not guarantee the accuracy of the data included in this work. The boundaries, colors, denominations, and other information shown on any map in this work do not imply any judgment on the part of the World Bank concerning the legal status of any territory or the endorsement or acceptance of such boundaries. The report is based on information current as of December 8, 2017.
EnquiriesPlease contact Richard Record ([email protected]) or Yew Keat Chong ([email protected]) if you have any questions or comments on the Malaysia Economic Monitor.
Acknowledgements
2 MALAYSIA ECONOMIC MONITOR | DECEMBER 2017
AbbreviationsAFC Asian financial crisis
AML/CFT Anti-Money Laundering and Counter Financing of Terrorism
ASEAN Association of Southeast Asian Nations
BNM Bank Negara Malaysia
BR1M 1Malaysia People’s Aid (Bantuan Rakyat 1Malaysia)
B40 Bottom 40 percent
CDRC Corporate Debt Restructuring Committee
CEIC Census and Economic Information Center
CET1 Common Equity Tier 1
CMP Capital Markets Masterplan
CPI Consumer Price Index
CPO Crude Palm Oil
DOSM Department of Statistics Malaysia
E&E Electrical and Electronics
EAP East Asia and Pacific
FDI Foreign Direct Investment
FSMP Financial Sector Master Plan
GDP Gross Domestic Product
GFC Global financial crisis
GNI Gross National Income
GST Goods and Services Tax
IADI International Association of Deposit Insurers
IBFC Labuan International Business and Financial Centre
IMF International Monetary Fund
IOSCO International Organization of Securities Commissions
LCR Liquidity Coverage Ratio
MEM Malaysia Economic Monitor
MFRS Malaysia Financial Reporting Standards
MOF Ministry of Finance
NAPIC National Property Information Centre
NFPCs Non-Financial Public Corporations
NPLs Non-Performing Loans
OPR Overnight Policy Rate
PIDM Malaysia Deposit Insurance Corporation (Perbadanan Insurans Deposit Malaysia)
Q/Q Quarter-on-Quarter
RCEP Regional Comprehensive Economic Partnership
SAAR Seasonally Adjusted Annual Rate
SME Small and Medium Enterprises
SRI Sustainable and Responsible Investment
Y/Y Year-on-Year
3MALAYSIA ECONOMIC MONITOR | DECEMBER 2017
AcknowledgementsAbbreviationsSummary
PART ONERecent economic developments
Stronger than expected growth across the region
Malaysia’s economy is expanding due to broad-based domestic and external demand
The current account surplus grew mainly due to a larger goods surplus
The headline inflation rate declined slightly due to lower inflation in the transportation category
Conditions in the domestic financial sector remain stable
The financial account recorded a net outflow due to increased resident outflows
Fiscal consolidation remains on track
Further reductions in the fiscal deficit will require deeper reforms
Economic outlookWith strong domestic and external demand, Malaysia’s growth is expected to remain strong into 2018
Risks relate primarily to unforeseen changes in the external environment
A strengthening economy offers an opportunity to focus on structural reforms for the transition to a
high-income economy
PART TWOTurmoil to Transformation: 20 Years after the Asian Financial Crisis
East Asia did not let a crisis go to waste
The origins of the Asian financial crisis
How Malaysia’s response differed from other affected countries
Strengthening macroeconomic management after the crisis
Building a more resilient financial sector after the crisis
Increasing the sophistication of Malaysia’s financial system
Diversifying the capital market after the crisis
Improving standards of corporate governance
Challenges ahead
AppendixAdditional tables
An index for measuring exchange rate flexibility and monetary independence
References
2
3
6
15
16
16
17
18
22
26
27
28
30
34
34
36
36
39
40
40
41
43
47
51
52
55
58
59
54
54
69
70
Table of Contents
5MALAYSIA ECONOMIC MONITOR | DECEMBER 2017
Summary
The aim of the Malaysia Economic Monitor (MEM) is to foster better-informed policy analysis and debate regarding the key challenges that Malaysia faces in its endeavor to achieve rapid, inclusive and sustainable economic growth. The MEM consists of two parts: Part 1 presents a review of recent economic developments and a macroeconomic outlook. Part 2 focuses on a selected special topic that is key to Malaysia’s development prospects, particularly as the country moves towards becoming a high-income economy.
In this edition, the focus of the special topic is macro-financial policy. This year marks 20 years since the onset of the Asian financial crisis (AFC), which caused a major shock to Malaysia’s economy. At the time, Malaysia’s policy response was considered unorthodox. This response included the imposition of selective capital controls, counter-cyclical fiscal policies as well as bank and corporate restructuring. Yet with the passage of time, many of these policies have become part of the standard toolkit for policymakers in both developing and developed economies when faced with a crisis.
Malaysia’s experience, both during the crisis and in the years since, offers important insights for other countries. While sharing a common destination, not all East Asian countries took the same path towards a more resilient set of macro-financial policies. Clearly not all of Malaysia’s experience is likely to be transferable to the specific contexts of other countries, but there are useful lessons for other highly open trading economies that are exposed to the risks associated with international capital flows.
The well-known adage “don’t let a crisis go to waste” is apt for Malaysia’s experience after the events of 1997–98. This edition of the MEM highlights the key lessons learned from Malaysia’s experience of the AFC, and outlines how the crisis triggered a series of deep macro-financial reforms that served to increase the country’s level of resilience from that of 20 years ago. The MEM also highlights future challenges as Malaysia builds a modern and resilient financial sector that will facilitate the achievement of its goal of becoming a high-income economy.
The Malaysia Economic Monitor presents an analysis of economic and structural development issues in Malaysia
6 MALAYSIA ECONOMIC MONITOR | DECEMBER 2017
Summary
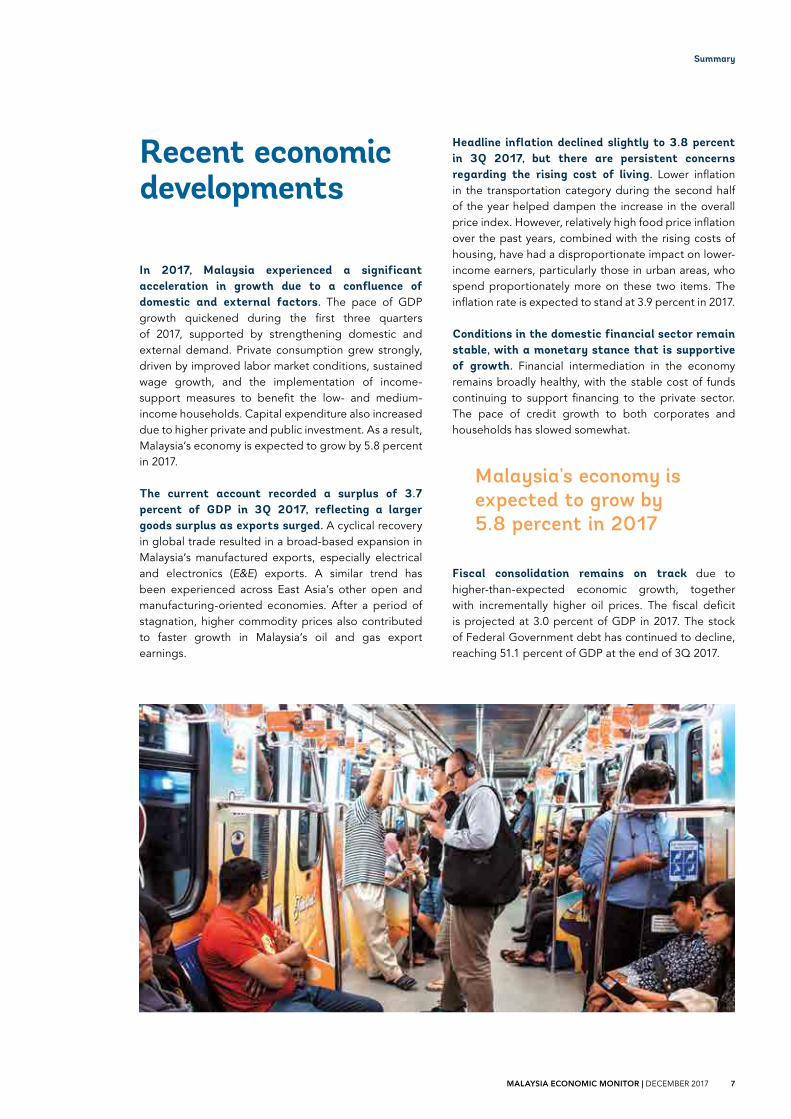
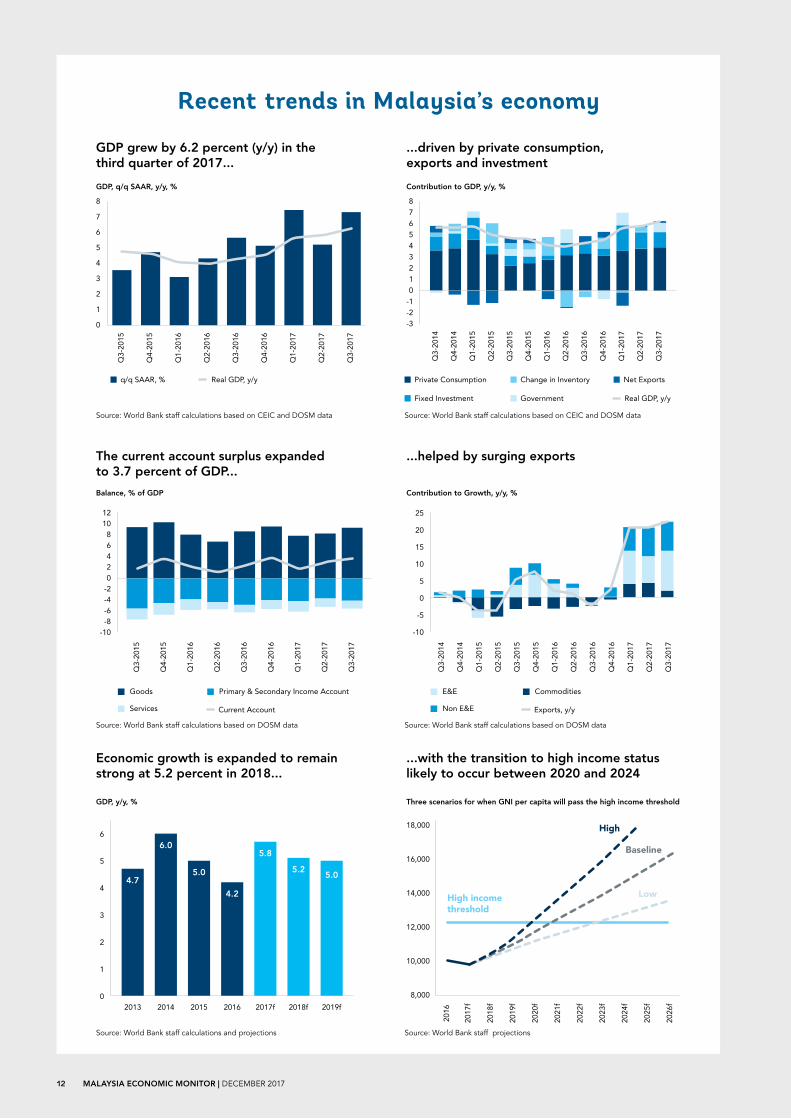
In 2017, Malaysia experienced a significant acceleration in growth due to a confluence of domestic and external factors. The pace of GDP growth quickened during the first three quarters of 2017, supported by strengthening domestic and external demand. Private consumption grew strongly, driven by improved labor market conditions, sustained wage growth, and the implementation of income-support measures to benefit the low- and medium-income households. Capital expenditure also increased due to higher private and public investment. As a result, Malaysia’s economy is expected to grow by 5.8 percent in 2017.
The current account recorded a surplus of 3.7 percent of GDP in 3Q 2017, reflecting a larger goods surplus as exports surged. A cyclical recovery in global trade resulted in a broad-based expansion in Malaysia’s manufactured exports, especially electrical and electronics (E&E) exports. A similar trend has been experienced across East Asia’s other open and manufacturing-oriented economies. After a period of stagnation, higher commodity prices also contributed to faster growth in Malaysia’s oil and gas export earnings.
Headline inflation declined slightly to 3.8 percent in 3Q 2017, but there are persistent concerns regarding the rising cost of living. Lower inflation in the transportation category during the second half of the year helped dampen the increase in the overall price index. However, relatively high food price inflation over the past years, combined with the rising costs of housing, have had a disproportionate impact on lower-income earners, particularly those in urban areas, who spend proportionately more on these two items. The inflation rate is expected to stand at 3.9 percent in 2017.
Conditions in the domestic financial sector remain stable, with a monetary stance that is supportive of growth. Financial intermediation in the economy remains broadly healthy, with the stable cost of funds continuing to support financing to the private sector. The pace of credit growth to both corporates and households has slowed somewhat.
Recent economic developments
Malaysia’s economy is expected to grow by 5.8 percent in 2017
Fiscal consolidation remains on track due to higher-than-expected economic growth, together with incrementally higher oil prices. The fiscal deficit is projected at 3.0 percent of GDP in 2017. The stock of Federal Government debt has continued to decline, reaching 51.1 percent of GDP at the end of 3Q 2017.
7MALAYSIA ECONOMIC MONITOR | DECEMBER 2017
Summary
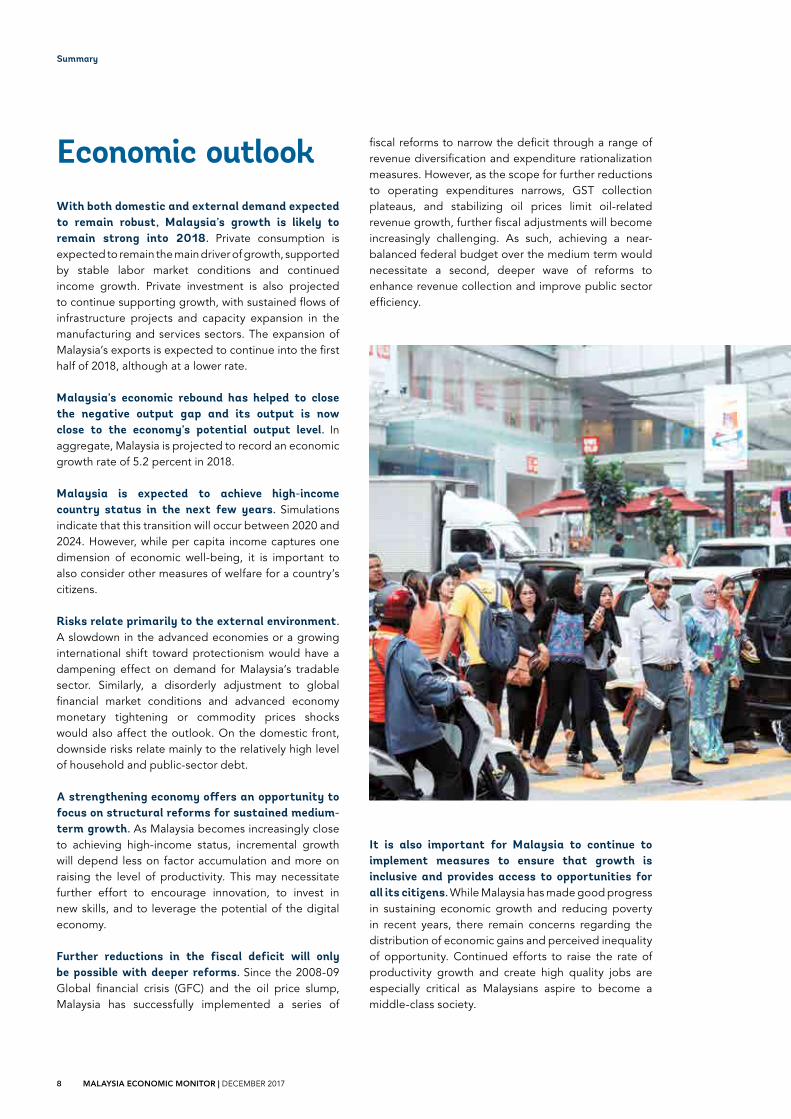
Economic outlookWith both domestic and external demand expected to remain robust, Malaysia’s growth is likely to remain strong into 2018. Private consumption is expected to remain the main driver of growth, supported by stable labor market conditions and continued income growth. Private investment is also projected to continue supporting growth, with sustained flows of infrastructure projects and capacity expansion in the manufacturing and services sectors. The expansion of Malaysia’s exports is expected to continue into the first half of 2018, although at a lower rate.
Malaysia’s economic rebound has helped to close the negative output gap and its output is now close to the economy’s potential output level. In aggregate, Malaysia is projected to record an economic growth rate of 5.2 percent in 2018.
Malaysia is expected to achieve high-income country status in the next few years. Simulations indicate that this transition will occur between 2020 and 2024. However, while per capita income captures one dimension of economic well-being, it is important to also consider other measures of welfare for a country’s citizens.
Risks relate primarily to the external environment. A slowdown in the advanced economies or a growing international shift toward protectionism would have a dampening effect on demand for Malaysia’s tradable sector. Similarly, a disorderly adjustment to global financial market conditions and advanced economy monetary tightening or commodity prices shocks would also affect the outlook. On the domestic front, downside risks relate mainly to the relatively high level of household and public-sector debt.
A strengthening economy offers an opportunity to focus on structural reforms for sustained medium-term growth. As Malaysia becomes increasingly close to achieving high-income status, incremental growth will depend less on factor accumulation and more on raising the level of productivity. This may necessitate further effort to encourage innovation, to invest in new skills, and to leverage the potential of the digital economy.
Further reductions in the fiscal deficit will only be possible with deeper reforms. Since the 2008-09 Global financial crisis (GFC) and the oil price slump, Malaysia has successfully implemented a series of
fiscal reforms to narrow the deficit through a range of revenue diversification and expenditure rationalization measures. However, as the scope for further reductions to operating expenditures narrows, GST collection plateaus, and stabilizing oil prices limit oil-related revenue growth, further fiscal adjustments will become increasingly challenging. As such, achieving a near-balanced federal budget over the medium term would necessitate a second, deeper wave of reforms to enhance revenue collection and improve public sector efficiency.
It is also important for Malaysia to continue to implement measures to ensure that growth is inclusive and provides access to opportunities for all its citizens. While Malaysia has made good progress in sustaining economic growth and reducing poverty in recent years, there remain concerns regarding the distribution of economic gains and perceived inequality of opportunity. Continued efforts to raise the rate of productivity growth and create high quality jobs are especially critical as Malaysians aspire to become a middle-class society.
8 MALAYSIA ECONOMIC MONITOR | DECEMBER 2017
Summary
Turmoil to Transformation: 20 Years after the Asian Financial Crisis
The AFC was a major turning point for macro-financial policy in Malaysia. The year 2017 marks the 20th anniversary of the crisis and provides an appropriate milestone to take stock of lessons learned in Malaysia, which could be of particular relevance for similar small and open developing economies around the world.
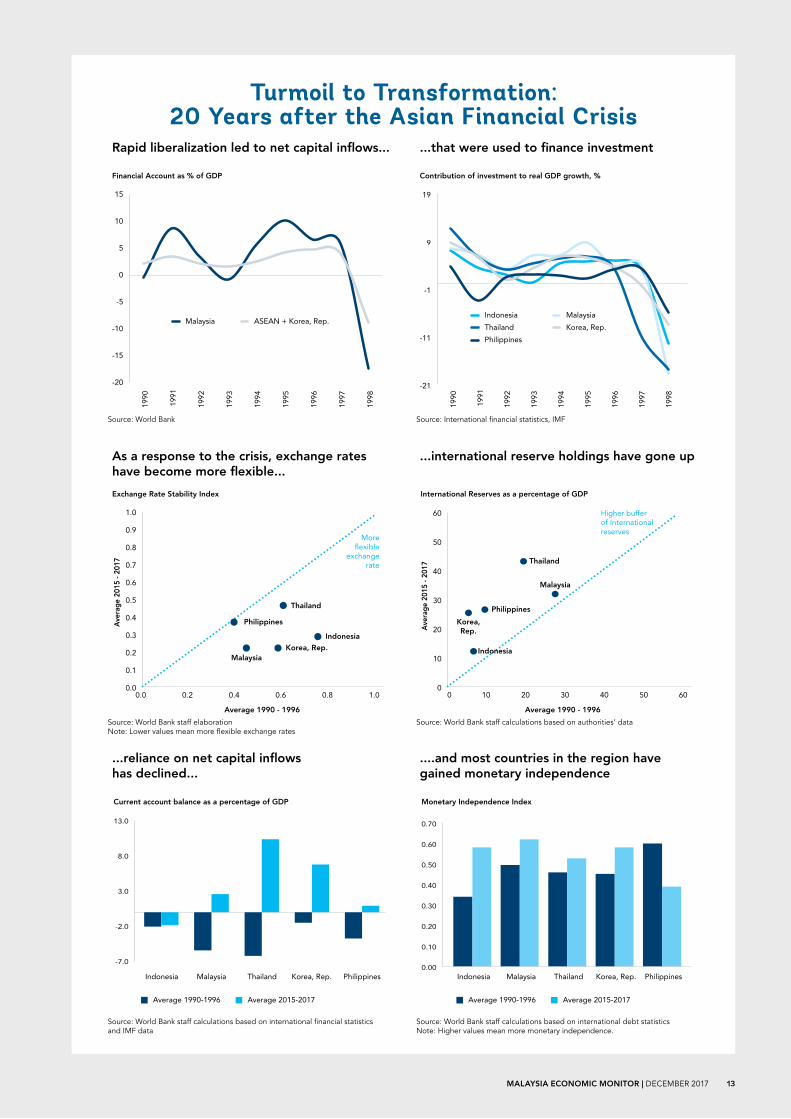
The crisis was the result of accumulating financial imbalances that spiraled out of control in an environment of weak financial regulation and rapid financial account liberalization. Rapid capital inflows created mismatches between the currency of borrowing and the currency of investment returns. Fixed exchange rates also built up risks. On top of the currency mismatches, mismatches in the maturity of loans compared to investment projects exacerbated the financial risks. However, capital account liberalization proceeded more slowly in Malaysia compared to other countries in the region, and external debt challenges were less severe.
Malaysia did not engage in an IMF program. As the external debt situation was much less of a challenge than in other crisis-affected countries, Malaysia had a wider range of available policy options. The country’s initial response to the crisis was to implement measures consistent with the conventional wisdom at the time; including tight monetary and fiscal policies. However, the initial policy response put significant pressure on the real economy. The increase in interest rates created a credit crunch that particularly affected small and medium-sized firms and sapped the strength of Malaysia’s private sector.
Malaysia’s response was to restore market confidence, restructure corporate debt, recapitalize the banking sector, and to stimulate the economy through countercyclical fiscal and monetary policies. The central bank reduced interest
rates and reserve requirements to inject more liquidity into the financial system. Expansionary fiscal policy was introduced to support the economic recovery during the crisis, with a change in the fiscal balance of four percentage points over the course of a year. New institutional structures were established to streamline the management of Malaysia’s response to the crisis.
In perhaps the most controversial measure at the time, Malaysia introduced selective capital controls. The purpose of these measures was to discourage speculative investments in the short run, while safeguarding the interest of long-term investors. But the outcome of these policies was different from what most mainstream economists predicted. The controls allowed BNM to reduce interest rates to a level that would have been impossible without the imposition of capital controls. This alleviated the credit crunch, affecting both strong and weak firms alike, and implied that fewer firms went bankrupt and subsequently the costs of financial sector restructuring and recapitalization were smaller.
The economy rebounded strongly after the crisis, driven by the restored dynamism of Malaysia’s export manufacturing sector. The combination of a depreciated exchange rate together with a recovery in robust external demand generated the conditions for a substantial increase in exports.
The consolidation of Malaysia’s banking sector resulted in strong institutions anchored by a core group of domestic banks. Effective regulation and supervision has underpinned the stability of Malaysia’s financial system. The sector has adopted internationally accepted practices, with a high degree of compliance with global standards for supervision and regulation of financial institutions.
Malaysia adopted an institutional framework to deal with the rising nonperforming loans in the industry. The Government decided to assist domestic
The year 2017 marks the 20th anniversary of the crisis and provides an appropriate milestone to take stock of lessons learned in Malaysia
9MALAYSIA ECONOMIC MONITOR | DECEMBER 2017
Summary
corporates and financial institutions that were facing financial difficulties or imminent insolvency. The crisis expedited planned reforms, resulting in a stronger, more diversified and inclusive financial system.
Malaysia’s bond market expanded significantly after the AFC to become a major financing source for corporates. There is now significantly less reliance by corporates on banks for funding requirements, which was one of the banking sector vulnerabilities highlighted during the crisis.
Malaysia has become a global leader in Islamic finance, in parallel to and complementing the conventional financial system. With the well-established Islamic capital markets and regulatory frameworks, as well as the relevant incentives to motivate market participants, Malaysia has been able to support financial innovation in Islamic finance. One of the latest innovations is the issuance of the world’s first green sukuk (shari’ah-compliant investment certificate) in 2017 to fund a renewable energy project in Malaysia.
In 2017, Malaysia and the other economies affected by the AFC are more resilient to external shocks and financial instability, having learned many lessons from the crisis of 1997–98. Due to the construction of buffers built and reforms undertaken during the last 20 years, the region is more resilient and better prepared to react to external shocks and financial turbulence.
Five important lessons, in particular, have been learned from the AFC, and are commonly accepted among policy makers in developing countries: (a) flexible exchange rate regimes tend to lower the risk of currency crashes; (b) a large “war-chest” of international reserves can be a good insurance against future crisis; (c) selective and temporary capital controls may help stabilize capital flows during periods of crisis; (d) rapid financial account liberalization can be dangerous; and, and (e) strong oversight institutions and the careful and prudential regulation of the domestic financial sector is essential.
Following the regional trend, Malaysia has moved to a more flexible exchange rate regime. Holdings of international reserves have grown significantly over time, while reliance on net capital inflows has declined. Exposure to dollar-denominated debt has declined in Malaysia, although reliance on short-term debt has increased somewhat. Today Malaysia is much less exposed to the risk of an exchange rate depreciation triggering increased debt obligations, giving the authorities more space to adjust to external shocks.
The lessons from the crisis led to an evolution in the consensus over the costs, benefits, and sequencing of capital account liberalization in developing countries. Before the crisis, one of the “standard” set of policy recommendations was to rapidly liberalize the financial account in order to allow capital to flow across countries and take advantage of the differences in marginal products of capital. Today, policy recommendations have turned toward a more cautious approach with measured pace of liberalization that is more nuanced with respect to country context. In particular, there is considerable emphasis on the need for adequate capacity at the country level to monitor and control inflows of funds, as a pre-requisite to capital account liberalization.
The approach adopted in dealing with the AFC and in implementing the reforms in the financial sector in the last 20 years has served to transform Malaysia’s financial sector into what it is today: sound, resilient, and diversified. Malaysia emerged from the crisis with no bank closures, a high recovery rate on nonperforming loans, and stronger banking institutions. Subsequent reforms in the financial sector after the crisis resulted in an improved regulatory and supervisory framework for the financial system, better capacity to monitor financial stability risks, a full-fledged Islamic financial system, and a deeper capital market. As a result, Malaysia was able to successfully absorb the shocks of the GFC.
However, going forward Malaysia should remain attentive to new challenges and emerging areas of risk. Financial sector vulnerabilities and risks to economic stability may develop as the economy becomes significantly larger (three times larger since the crisis), and more closely integrated into the global economy. At the same time, an increasingly sophisticated financial sector with new instruments and financial innovations bring constant challenges to the overall risk oversight framework.
The reforms implemented in the financial sector in the last 20 years has served to transform Malaysia’s financial sector into what it is today: sound, resilient, and diversified
10 MALAYSIA ECONOMIC MONITOR | DECEMBER 2017
Summary

The balance sheets of households and corporations will need to be carefully monitored for signs of stress. Although the slowdown in credit growth has stabilized the ratio of credit to the private sector to GDP, and it has not reached levels observed during the AFC, close monitoring is necessary to avoid systemic problems, particularly given the rapid increases in real house prices since 2008.
Efforts to further strengthen governance of financial institutions will need to continue. Overall, the post-crisis reforms have strengthened the financial system, but sustained measures are needed to address new systemic risks from a more modern financial sector. For example, the transition to a digital economy introduces new cybersecurity risks from technology-enabled innovation in financial services.
Finally, efforts to strengthen fiscal space should continue in order to preserve flexibility for future contractionary shocks. While the Government has made significant progress toward fiscal consolidation since the GFC, the overall public debt stock has remained relatively elevated due to continued accumulation of fiscal deficits and increased public infrastructure spending.
11MALAYSIA ECONOMIC MONITOR | DECEMBER 2017
Summary
Recent trends in Malaysia’s economy
GDP grew by 6.2 percent (y/y) in thethird quarter of 2017...
...driven by private consumption,exports and investment
GDP, q/q SAAR, y/y, %
0
1
2
3
4
5
6
7
8
Contribution to GDP, y/y, %
-3-2-1012345678
The current account surplus expandedto 3.7 percent of GDP...
...helped by surging exports
Balance, % of GDP
-10-8-6-4-202468
1012
Contribution to Growth, y/y, %
-10
-5
0
5
10
15
20
25
Q3-
2015
Q4-
2015
Q1-
2016
Q2-
2016
Q3-
2016
Q4-
2016
Q1-
2017
Q2-
2017
Q3-
2017
Q3-
2014
Q4-
2014
Q1-
2015
Q2-
2015
Q3-
2015
Q4-
2015
Q1-
2016
Q2-
2016
Q3-
2016
Q4-
2016
Q1-
2017
Q2-
2017
Q3-
2017
GDP, y/y, %
0
1
2
3
4
5
6
4.7
6.0
5.0
4.2
5.8
5.25.0
Economic growth is expanded to remainstrong at 5.2 percent in 2018...
...with the transition to high income statuslikely to occur between 2020 and 2024
Three scenarios for when GNI per capita will pass the high income threshold
8,000
10,000
12,000
14,000
16,000
18,000
High incomethreshold
High
Baseline
Low
Q3-
2015
Q4-
2015
Q1-
2016
Q2-
2016
Q3-
2016
Q4-
2016
Q1-
2017
Q2-
2017
Q3-
2017
Q3-
2014
Q4-
2014
Q1-
2015
Q2-
2015
Q3-
2015
Q4-
2015
Q1-
2016
Q2-
2016
Q3-
2016
Q4-
2016
Q1-
2017
Q2-
2017
Q3-
2017
Real GDP, y/yq/q SAAR, %
Fixed Investment
Private Consumption
Government
Change in Inventory
Real GDP, y/y
Net Exports
Primary & Secondary Income AccountGoods
Services Current Account
E&E Commodities
Non E&E Exports, y/y
2013 2014 2015 2016 2017f 2018f 2019f
2016
2017
f
2018
f
2019
f
2020
f
2021
f
2022
f
2023
f
2024
f
2025
f
2026
f
Source: World Bank staff calculations based on CEIC and DOSM data Source: World Bank staff calculations based on CEIC and DOSM data
Source: World Bank staff calculations based on DOSM data Source: World Bank staff calculations based on DOSM data
Source: World Bank staff calculations and projections Source: World Bank staff projections
12 MALAYSIA ECONOMIC MONITOR | DECEMBER 2017
Turmoil to Transformation:20 Years after the Asian Financial Crisis
As a response to the crisis, exchange rateshave become more flexible...
...international reserve holdings have gone up
Exchange Rate Stability Index International Reserves as a percentage of GDP
0.0
0.1
0.2
0.3
0.4
0.5
0.6
0.7
0.8
0.9
1.0
0.0 0.2 0.4 0.6 0.8 1.0
Ave
rage
201
5 - 2
017
Average 1990 - 1996
0
10
20
30
40
50
60
0 10 20 30 40 50 60
Ave
rage
201
5 - 2
017
Average 1990 - 1996
Philippines
Philippines
Malaysia
Malaysia
Moreflexible
exchangerate
Thailand
Thailand
Indonesia
Korea, Rep.
Korea,Rep.
Indonesia
Higher bufferof Internationalreserves
Rapid liberalization led to net capital inflows... ...that were used to finance investment
Financial Account as % of GDP Contribution of investment to real GDP growth, %
-21
-11
-1
9
19
Indonesia Malaysia
Thailand Korea, Rep.
Philippines
-20
-15
-10
-5
0
5
10
15
Malaysia ASEAN + Korea, Rep.
1990
1991
1992
1993
1994
1995
1996
1997
1998
1990
1991
1992
1993
1994
1995
1996
1997
1998
...reliance on net capital inflowshas declined...
....and most countries in the region havegained monetary independence
Current account balance as a percentage of GDP
-7.0
-2.0
3.0
8.0
13.0
Monetary Independence Index
0.00
0.10
0.20
0.30
0.40
0.50
0.60
0.70
PhilippinesKorea, Rep.ThailandMalaysiaIndonesia Indonesia Malaysia Thailand Korea, Rep. Philippines
Average 1990-1996 Average 2015-2017 Average 1990-1996 Average 2015-2017
Source: World Bank Source: International financial statistics, IMF
Source: World Bank staff elaborationNote: Lower values mean more flexible exchange rates
Source: World Bank staff calculations based on authorities’ data
Source: World Bank staff calculations based on international financial statisticsand IMF data
Source: World Bank staff calculations based on international debt statisticsNote: Higher values mean more monetary independence.
13MALAYSIA ECONOMIC MONITOR | DECEMBER 2017

PART ONE
Recent Economic Developments and Outlook
15MALAYSIA ECONOMIC MONITOR | DECEMBER 2017
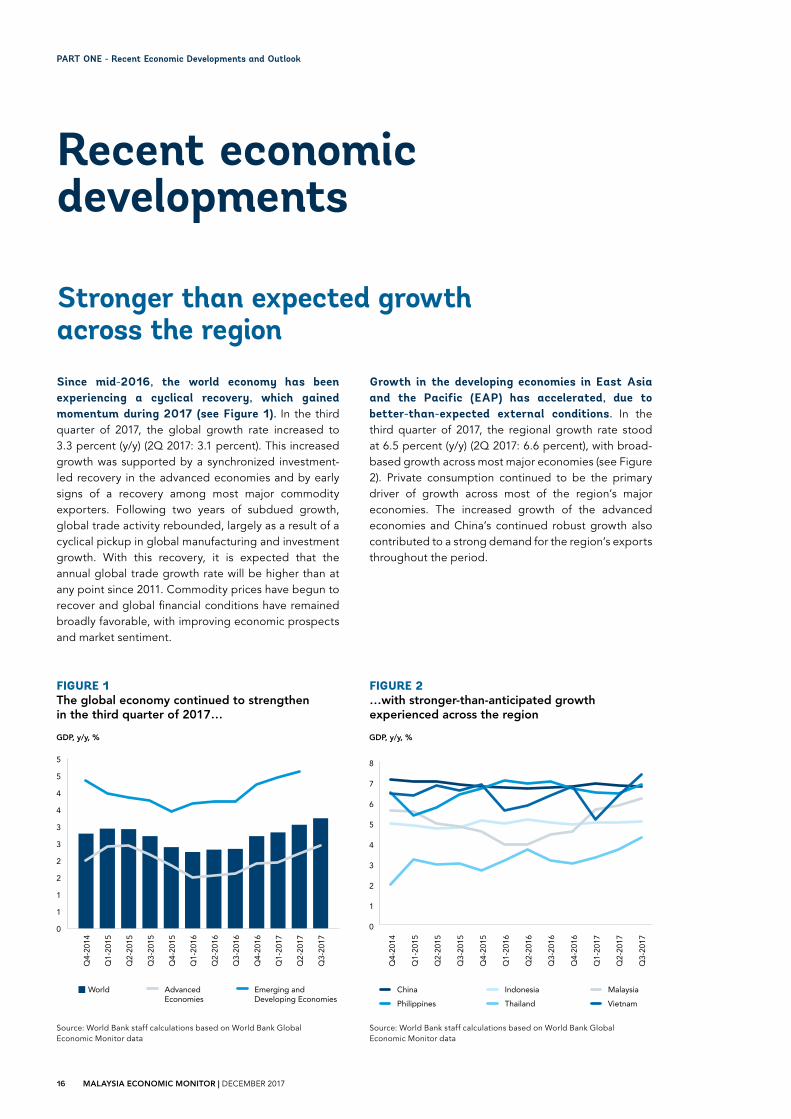
Since mid-2016, the world economy has been experiencing a cyclical recovery, which gained momentum during 2017 (see Figure 1). In the third quarter of 2017, the global growth rate increased to 3.3 percent (y/y) (2Q 2017: 3.1 percent). This increased growth was supported by a synchronized investment-led recovery in the advanced economies and by early signs of a recovery among most major commodity exporters. Following two years of subdued growth, global trade activity rebounded, largely as a result of a cyclical pickup in global manufacturing and investment growth. With this recovery, it is expected that the annual global trade growth rate will be higher than at any point since 2011. Commodity prices have begun to recover and global financial conditions have remained broadly favorable, with improving economic prospects and market sentiment.
FIGURE 1The global economy continued to strengthen in the third quarter of 2017…
FIGURE 2…with stronger-than-anticipated growth experienced across the region
Stronger than expected growth across the region
Growth in the developing economies in East Asia and the Pacific (EAP) has accelerated, due to better-than-expected external conditions. In the third quarter of 2017, the regional growth rate stood at 6.5 percent (y/y) (2Q 2017: 6.6 percent), with broad-based growth across most major economies (see Figure 2). Private consumption continued to be the primary driver of growth across most of the region’s major economies. The increased growth of the advanced economies and China’s continued robust growth also contributed to a strong demand for the region’s exports throughout the period.
Recent economic developments
GDP, y/y, %
0
1
1
2
2
3
3
4
4
5
5
Q4-
2014
Q1-
2015
Q2-
2015
Q3-
2015
Q4-
2015
Q1-
2016
Q2-
2016
Q3-
2016
Q4-
2016
Q1-
2017
Q2-
2017
Q3-
2017
AdvancedEconomies
Emerging andDeveloping Economies
World
GDP, y/y, %
China
Philippines
Indonesia
Thailand
Malaysia
Vietnam
0
1
2
3
4
5
6
7
8
Q4-
2014
Q1-
2015
Q2-
2015
Q3-
2015
Q4-
2015
Q1-
2016
Q2-
2016
Q3-
2016
Q4-
2016
Q1-
2017
Q2-
2017
Q3-
2017
Source: World Bank staff calculations based on World Bank Global Economic Monitor data
Source: World Bank staff calculations based on World Bank Global Economic Monitor data
16 MALAYSIA ECONOMIC MONITOR | DECEMBER 2017
PART ONE - Recent Economic Developments and Outlook
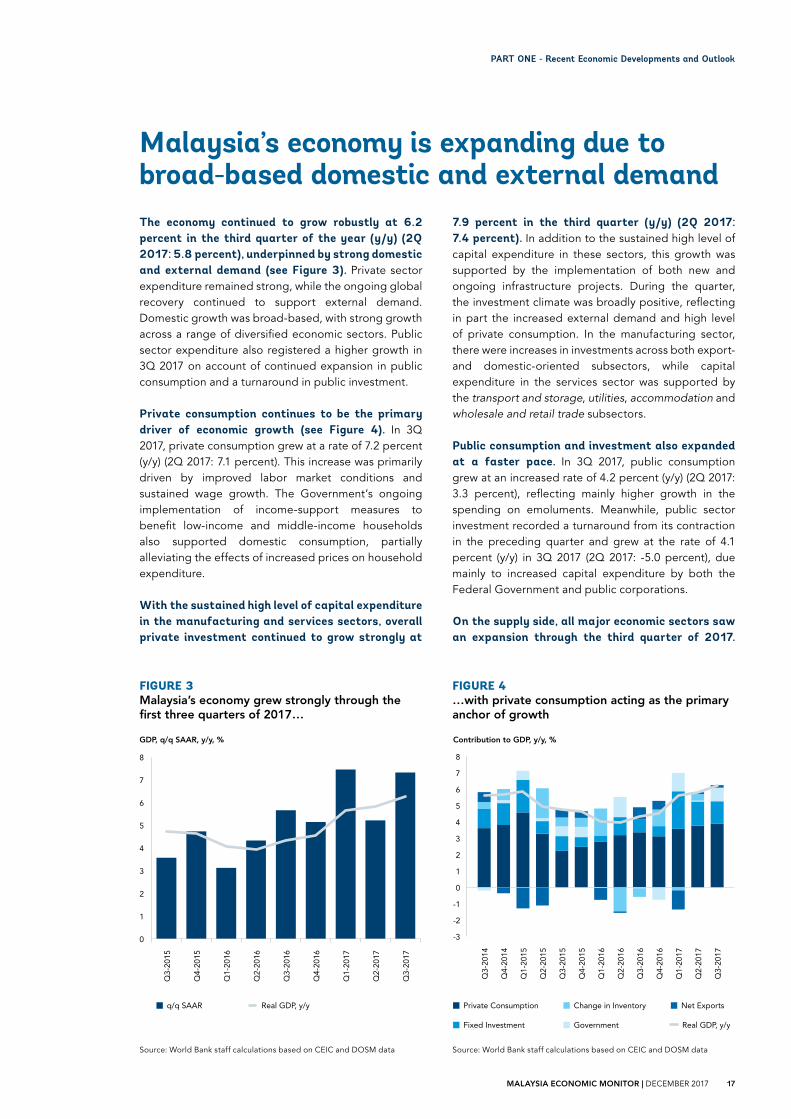
FIGURE 3Malaysia’s economy grew strongly through the first three quarters of 2017…
FIGURE 4…with private consumption acting as the primary anchor of growth
Malaysia’s economy is expanding due to broad-based domestic and external demandThe economy continued to grow robustly at 6.2 percent in the third quarter of the year (y/y) (2Q 2017: 5.8 percent), underpinned by strong domestic and external demand (see Figure 3). Private sector expenditure remained strong, while the ongoing global recovery continued to support external demand. Domestic growth was broad-based, with strong growth across a range of diversified economic sectors. Public sector expenditure also registered a higher growth in 3Q 2017 on account of continued expansion in public consumption and a turnaround in public investment.
Private consumption continues to be the primary driver of economic growth (see Figure 4). In 3Q 2017, private consumption grew at a rate of 7.2 percent (y/y) (2Q 2017: 7.1 percent). This increase was primarily driven by improved labor market conditions and sustained wage growth. The Government’s ongoing implementation of income-support measures to benefit low-income and middle-income households also supported domestic consumption, partially alleviating the effects of increased prices on household expenditure.
With the sustained high level of capital expenditure in the manufacturing and services sectors, overall private investment continued to grow strongly at
7.9 percent in the third quarter (y/y) (2Q 2017: 7.4 percent). In addition to the sustained high level of capital expenditure in these sectors, this growth was supported by the implementation of both new and ongoing infrastructure projects. During the quarter, the investment climate was broadly positive, reflecting in part the increased external demand and high level of private consumption. In the manufacturing sector, there were increases in investments across both export- and domestic-oriented subsectors, while capital expenditure in the services sector was supported by the transport and storage, utilities, accommodation and wholesale and retail trade subsectors.
Public consumption and investment also expanded at a faster pace. In 3Q 2017, public consumption grew at an increased rate of 4.2 percent (y/y) (2Q 2017: 3.3 percent), reflecting mainly higher growth in the spending on emoluments. Meanwhile, public sector investment recorded a turnaround from its contraction in the preceding quarter and grew at the rate of 4.1 percent (y/y) in 3Q 2017 (2Q 2017: -5.0 percent), due mainly to increased capital expenditure by both the Federal Government and public corporations.
On the supply side, all major economic sectors saw an expansion through the third quarter of 2017.
GDP, q/q SAAR, y/y, %
0
1
2
3
4
5
6
7
8
Q3-
2015
Q4-
2015
Q1-
2016
Q2-
2016
Q3-
2016
Q4-
2016
Q1-
2017
Q2-
2017
Q3-
2017
Real GDP, y/yq/q SAAR
Contribution to GDP, y/y, %
-3
-2
-1
0
1
2
3
4
5
6
7
8
Q3-
2014
Q4-
2014
Q1-
2015
Q2-
2015
Q3-
2015
Q4-
2015
Q1-
2016
Q2-
2016
Q3-
2016
Q4-
2016
Q1-
2017
Q2-
2017
Q3-
2017
Fixed Investment
Private Consumption
Government
Change in Inventory
Real GDP, y/y
Net Exports
Source: World Bank staff calculations based on CEIC and DOSM data Source: World Bank staff calculations based on CEIC and DOSM data
17MALAYSIA ECONOMIC MONITOR | DECEMBER 2017
PART ONE - Recent Economic Developments and Outlook
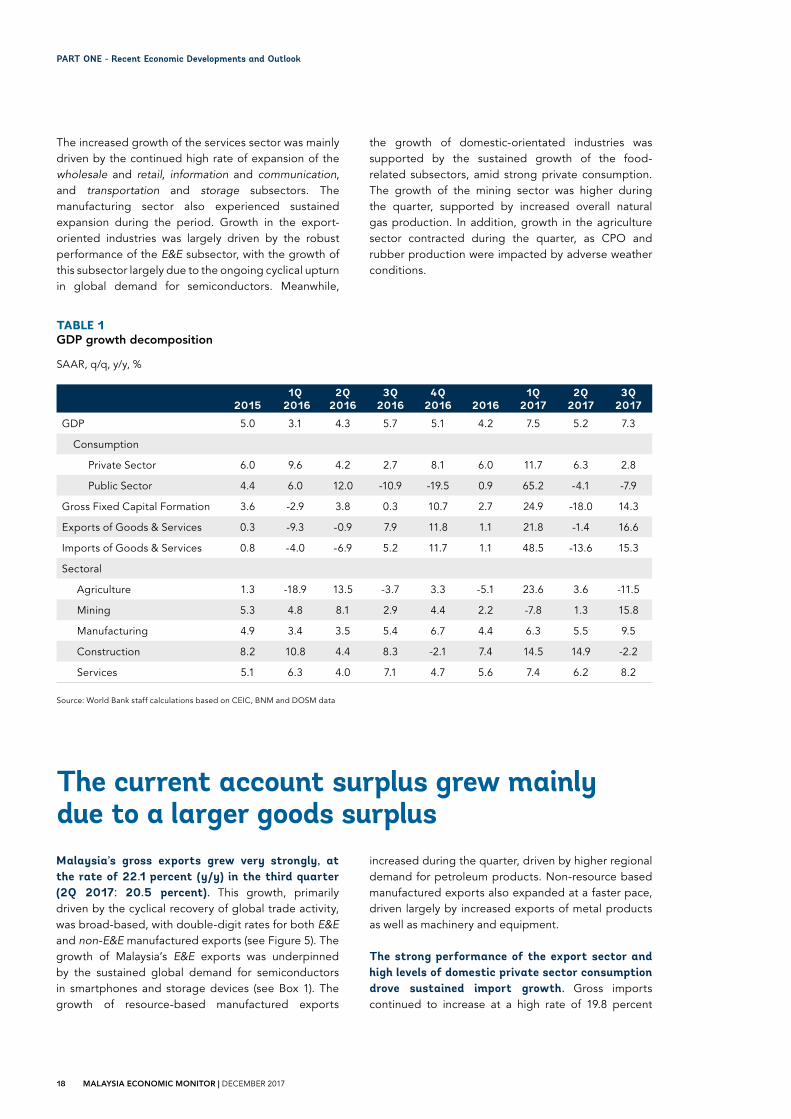
The increased growth of the services sector was mainly driven by the continued high rate of expansion of the wholesale and retail, information and communication, and transportation and storage subsectors. The manufacturing sector also experienced sustained expansion during the period. Growth in the export-oriented industries was largely driven by the robust performance of the E&E subsector, with the growth of this subsector largely due to the ongoing cyclical upturn in global demand for semiconductors. Meanwhile,
the growth of domestic-orientated industries was supported by the sustained growth of the food-related subsectors, amid strong private consumption. The growth of the mining sector was higher during the quarter, supported by increased overall natural gas production. In addition, growth in the agriculture sector contracted during the quarter, as CPO and rubber production were impacted by adverse weather conditions.
The current account surplus grew mainly due to a larger goods surplusMalaysia’s gross exports grew very strongly, at the rate of 22.1 percent (y/y) in the third quarter (2Q 2017: 20.5 percent). This growth, primarily driven by the cyclical recovery of global trade activity, was broad-based, with double-digit rates for both E&E and non-E&E manufactured exports (see Figure 5). The growth of Malaysia’s E&E exports was underpinned by the sustained global demand for semiconductors in smartphones and storage devices (see Box 1). The growth of resource-based manufactured exports
TABLE 1GDP growth decomposition
Source: World Bank staff calculations based on CEIC, BNM and DOSM data
SAAR, q/q, y/y, %
20151Q
20162Q
20163Q
20164Q
2016 20161Q
20172Q
20173Q
2017
GDP 5.0 3.1 4.3 5.7 5.1 4.2 7.5 5.2 7.3
Consumption
Private Sector 6.0 9.6 4.2 2.7 8.1 6.0 11.7 6.3 2.8
Public Sector 4.4 6.0 12.0 -10.9 -19.5 0.9 65.2 -4.1 -7.9
Gross Fixed Capital Formation 3.6 -2.9 3.8 0.3 10.7 2.7 24.9 -18.0 14.3
Exports of Goods & Services 0.3 -9.3 -0.9 7.9 11.8 1.1 21.8 -1.4 16.6
Imports of Goods & Services 0.8 -4.0 -6.9 5.2 11.7 1.1 48.5 -13.6 15.3
Sectoral
Agriculture 1.3 -18.9 13.5 -3.7 3.3 -5.1 23.6 3.6 -11.5
Mining 5.3 4.8 8.1 2.9 4.4 2.2 -7.8 1.3 15.8
Manufacturing 4.9 3.4 3.5 5.4 6.7 4.4 6.3 5.5 9.5
Construction 8.2 10.8 4.4 8.3 -2.1 7.4 14.5 14.9 -2.2
Services 5.1 6.3 4.0 7.1 4.7 5.6 7.4 6.2 8.2
increased during the quarter, driven by higher regional demand for petroleum products. Non-resource based manufactured exports also expanded at a faster pace, driven largely by increased exports of metal products as well as machinery and equipment.
The strong performance of the export sector and high levels of domestic private sector consumption drove sustained import growth. Gross imports continued to increase at a high rate of 19.8 percent
18 MALAYSIA ECONOMIC MONITOR | DECEMBER 2017
PART ONE - Recent Economic Developments and Outlook
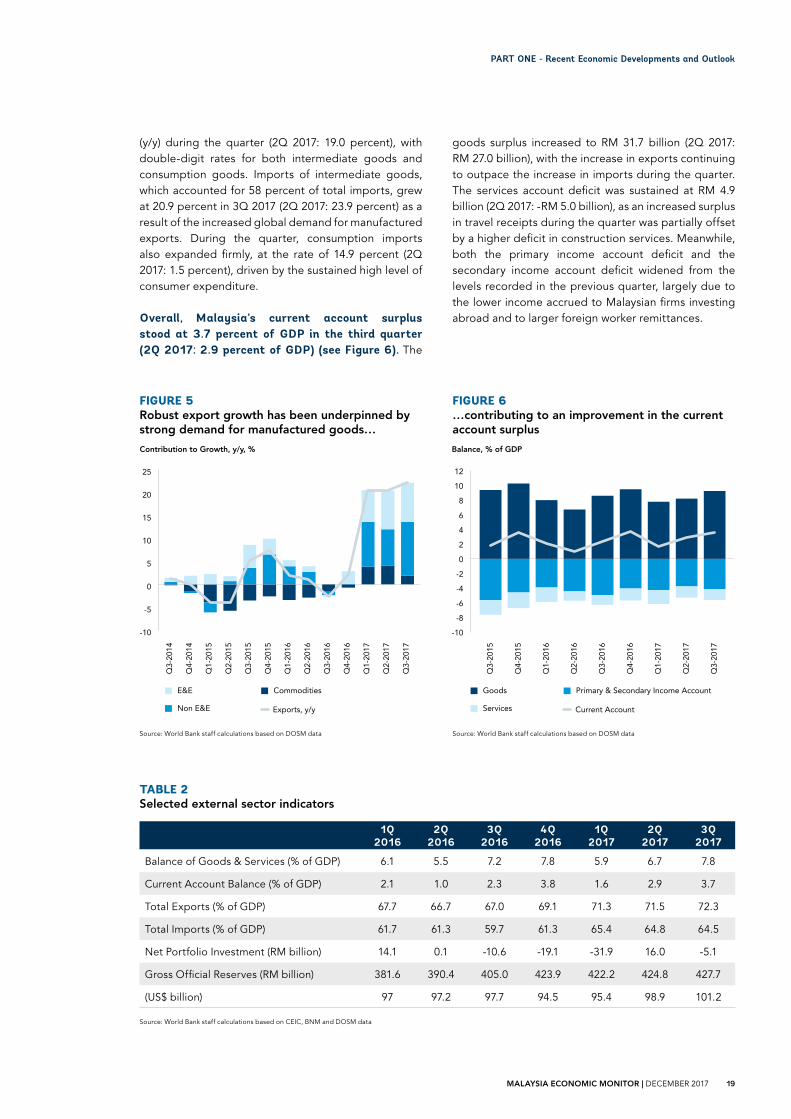
FIGURE 5Robust export growth has been underpinned by strong demand for manufactured goods…
FIGURE 6…contributing to an improvement in the current account surplus
goods surplus increased to RM 31.7 billion (2Q 2017: RM 27.0 billion), with the increase in exports continuing to outpace the increase in imports during the quarter. The services account deficit was sustained at RM 4.9 billion (2Q 2017: -RM 5.0 billion), as an increased surplus in travel receipts during the quarter was partially offset by a higher deficit in construction services. Meanwhile, both the primary income account deficit and the secondary income account deficit widened from the levels recorded in the previous quarter, largely due to the lower income accrued to Malaysian firms investing abroad and to larger foreign worker remittances.
Source: World Bank staff calculations based on CEIC, BNM and DOSM data
Source: World Bank staff calculations based on DOSM data Source: World Bank staff calculations based on DOSM data
1Q2016
2Q2016
3Q2016
4Q2016
1Q2017
2Q2017
3Q2017
Balance of Goods & Services (% of GDP) 6.1 5.5 7.2 7.8 5.9 6.7 7.8
Current Account Balance (% of GDP) 2.1 1.0 2.3 3.8 1.6 2.9 3.7
Total Exports (% of GDP) 67.7 66.7 67.0 69.1 71.3 71.5 72.3
Total Imports (% of GDP) 61.7 61.3 59.7 61.3 65.4 64.8 64.5
Net Portfolio Investment (RM billion) 14.1 0.1 -10.6 -19.1 -31.9 16.0 -5.1
Gross Official Reserves (RM billion) 381.6 390.4 405.0 423.9 422.2 424.8 427.7
(US$ billion) 97 97.2 97.7 94.5 95.4 98.9 101.2
TABLE 2Selected external sector indicators
(y/y) during the quarter (2Q 2017: 19.0 percent), with double-digit rates for both intermediate goods and consumption goods. Imports of intermediate goods, which accounted for 58 percent of total imports, grew at 20.9 percent in 3Q 2017 (2Q 2017: 23.9 percent) as a result of the increased global demand for manufactured exports. During the quarter, consumption imports also expanded firmly, at the rate of 14.9 percent (2Q 2017: 1.5 percent), driven by the sustained high level of consumer expenditure.
Overall, Malaysia’s current account surplus stood at 3.7 percent of GDP in the third quarter (2Q 2017: 2.9 percent of GDP) (see Figure 6). The
Contribution to Growth, y/y, %
E&E Commodities
Non E&E Exports, y/y
Q3-
2014
Q4-
2014
Q1-
2015
Q2-
2015
Q3-
2015
Q4-
2015
Q1-
2016
Q2-
2016
Q3-
2016
Q4-
2016
Q1-
2017
Q2-
2017
Q3-
2017
-10
-5
0
5
10
15
20
25
Q3-
2015
Q4-
2015
Q1-
2016
Q2-
2016
Q3-
2016
Q4-
2016
Q1-
2017
Q2-
2017
Q3-
2017
Balance, % of GDP
Primary & Secondary Income AccountGoods
Services Current Account
-10
-8
-6
-4
-2
0
2
4
6
8
10
12
19MALAYSIA ECONOMIC MONITOR | DECEMBER 2017
PART ONE - Recent Economic Developments and Outlook
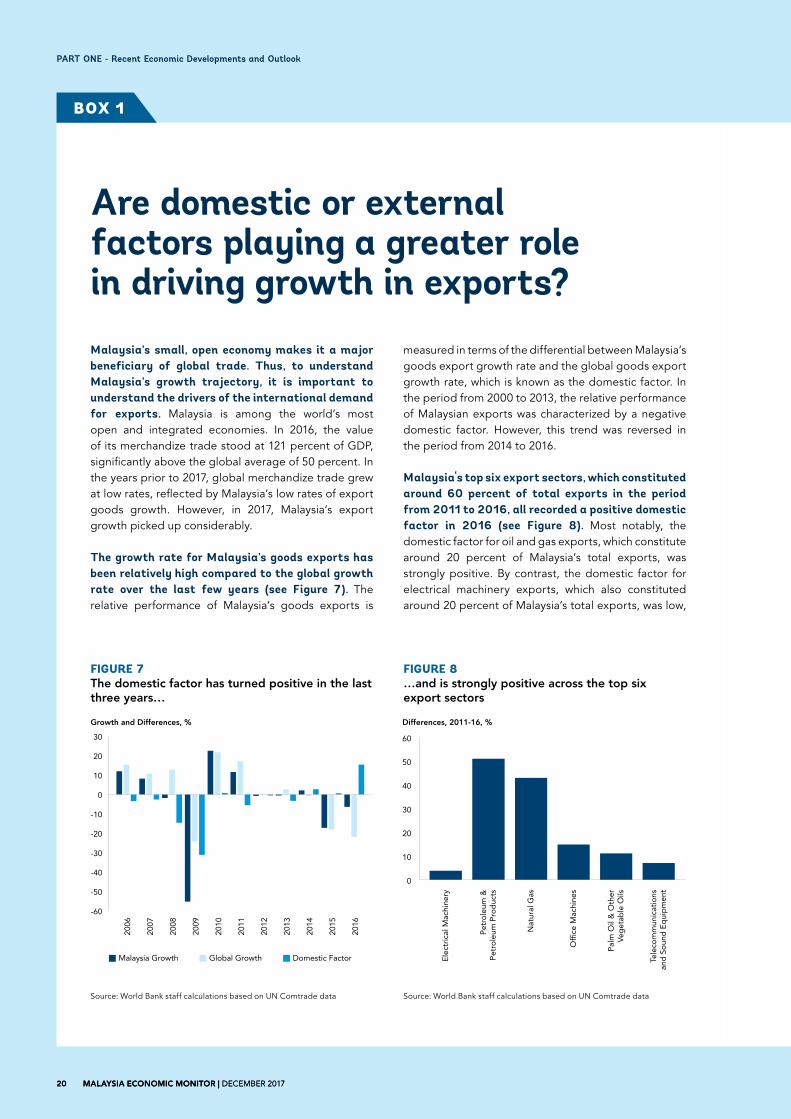
Are domestic or external factors playing a greater role in driving growth in exports?Malaysia’s small, open economy makes it a major beneficiary of global trade. Thus, to understand Malaysia’s growth trajectory, it is important to understand the drivers of the international demand for exports. Malaysia is among the world’s most open and integrated economies. In 2016, the value of its merchandize trade stood at 121 percent of GDP, significantly above the global average of 50 percent. In the years prior to 2017, global merchandize trade grew at low rates, reflected by Malaysia’s low rates of export goods growth. However, in 2017, Malaysia‘s export growth picked up considerably.
The growth rate for Malaysia’s goods exports has been relatively high compared to the global growth rate over the last few years (see Figure 7). The relative performance of Malaysia’s goods exports is
BOX 1
FIGURE 7The domestic factor has turned positive in the last three years…
FIGURE 8…and is strongly positive across the top six export sectors
measured in terms of the differential between Malaysia’s goods export growth rate and the global goods export growth rate, which is known as the domestic factor. In the period from 2000 to 2013, the relative performance of Malaysian exports was characterized by a negative domestic factor. However, this trend was reversed in the period from 2014 to 2016.
Malaysia‘s top six export sectors, which constituted around 60 percent of total exports in the period from 2011 to 2016, all recorded a positive domestic factor in 2016 (see Figure 8). Most notably, the domestic factor for oil and gas exports, which constitute around 20 percent of Malaysia’s total exports, was strongly positive. By contrast, the domestic factor for electrical machinery exports, which also constituted around 20 percent of Malaysia’s total exports, was low,
Source: World Bank staff calculations based on UN Comtrade data Source: World Bank staff calculations based on UN Comtrade data
Growth and Differences, %
-60
-50
-40
-30
-20
-10
0
10
20
30
2006
2007
2008
2009
2010
2011
2012
2013
2014
2015
2016
Malaysia Growth Global Growth Domestic Factor
Differences, 2011-16, %
0
10
20
30
40
50
60
Tele
com
mun
icat
ions
and
So
und
Eq
uip
men
t
Pal
m O
il &
Oth
erVe
get
able
Oils
Offi
ce M
achi
nes
Nat
ural
Gas
Pet
role
um &
Pet
role
um P
rod
ucts
Ele
ctri
cal M
achi
nery
20 MALAYSIA ECONOMIC MONITOR | DECEMBER 201720 MALAYSIA ECONOMIC MONITOR | DECEMBER 2017
PART ONE - Recent Economic Developments and Outlook
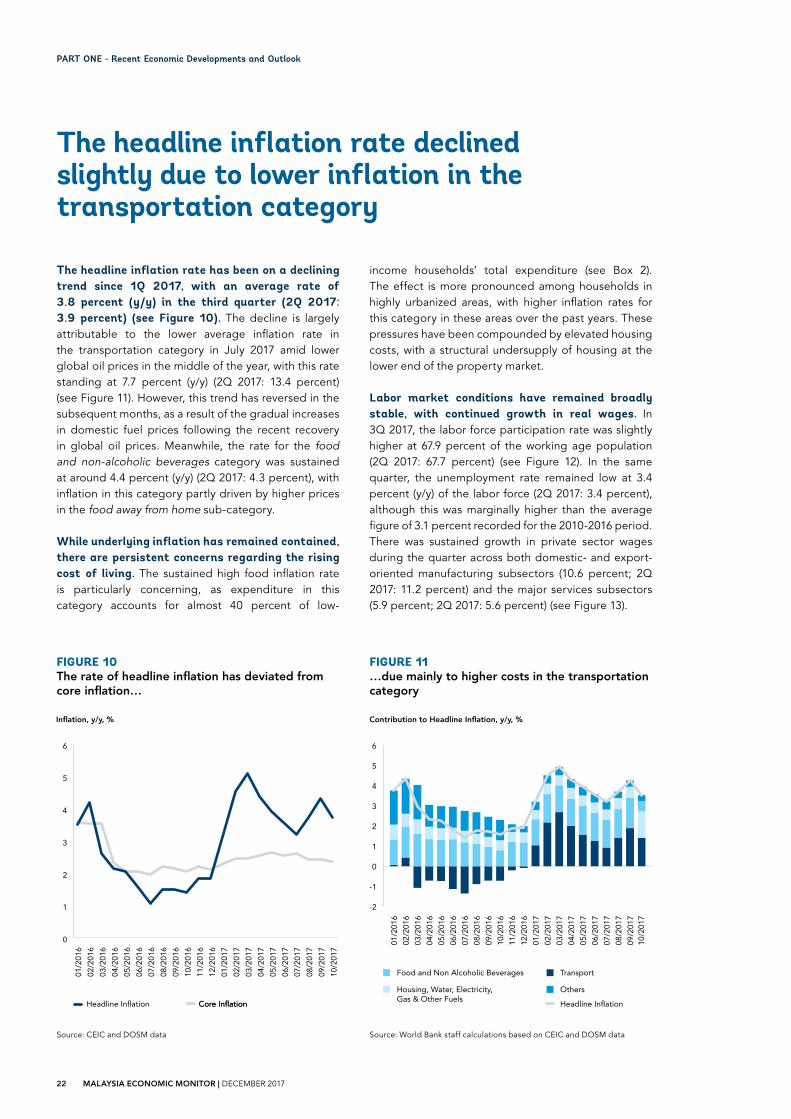
FIGURE 9Malaysia’s petroleum and petroleum products exports exhibited a strong domestic factor in recent years
indicating that the growth of this sector in Malaysia was only slightly higher than the average global growth rate. A similar situation applies to Malaysia’s telecommunications equipment and office machinery exports.
The positive domestic factor suggests that external factors have been the dominant driver of the growth in Malaysia’s goods exports over the past few years. External factors, such as the global level of demand for goods or trade policies in other countries, are more likely to have played a bigger role than domestic factors. Also, interestingly, Malaysia’s relative performance was heavily driven by the strong performance of its oil and gas exports. The decline in the growth of its petroleum and petroleum products exports was significantly lower than the global rate in 2016 (see Figure 9). Over the past few years, there has been a drastic drop in global oil and gas exports, coming at a period of sharply lower prices.
Source: World Bank staff calculations based on UN Comtrade data
Growth and Differences, %
-80
-60
-40
-20
0
20
40
60
2010
2011
2012
2013
2014
2015
2016
Malaysia Growth Global Growth Domestic Factor
21MALAYSIA ECONOMIC MONITOR | DECEMBER 2017 21MALAYSIA ECONOMIC MONITOR | DECEMBER 2017
PART ONE - Recent Economic Developments and Outlook
The headline inflation rate declined slightly due to lower inflation in the transportation category
The headline inflation rate has been on a declining trend since 1Q 2017, with an average rate of 3.8 percent (y/y) in the third quarter (2Q 2017: 3.9 percent) (see Figure 10). The decline is largely attributable to the lower average inflation rate in the transportation category in July 2017 amid lower global oil prices in the middle of the year, with this rate standing at 7.7 percent (y/y) (2Q 2017: 13.4 percent) (see Figure 11). However, this trend has reversed in the subsequent months, as a result of the gradual increases in domestic fuel prices following the recent recovery in global oil prices. Meanwhile, the rate for the food and non-alcoholic beverages category was sustained at around 4.4 percent (y/y) (2Q 2017: 4.3 percent), with inflation in this category partly driven by higher prices in the food away from home sub-category.
While underlying inflation has remained contained, there are persistent concerns regarding the rising cost of living. The sustained high food inflation rate is particularly concerning, as expenditure in this category accounts for almost 40 percent of low-
FIGURE 10The rate of headline inflation has deviated from core inflation…
Source: CEIC and DOSM data
FIGURE 11…due mainly to higher costs in the transportation category
Source: World Bank staff calculations based on CEIC and DOSM data
income households’ total expenditure (see Box 2). The effect is more pronounced among households in highly urbanized areas, with higher inflation rates for this category in these areas over the past years. These pressures have been compounded by elevated housing costs, with a structural undersupply of housing at the lower end of the property market.
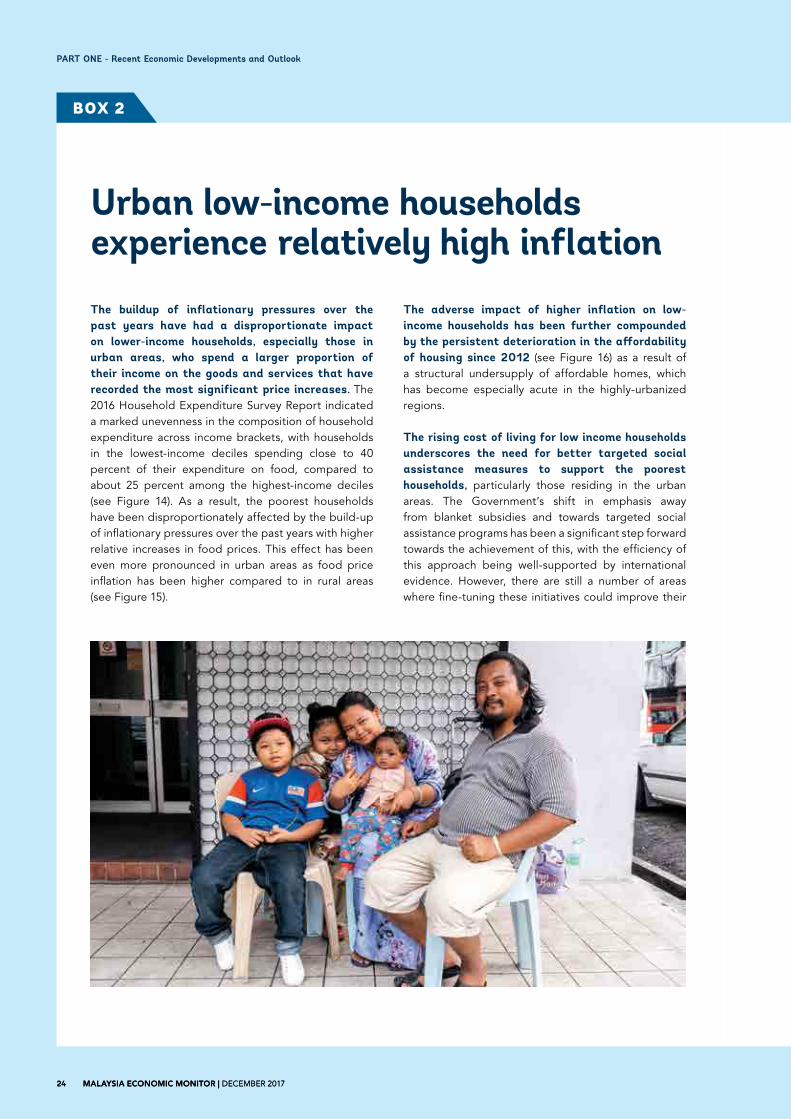
Labor market conditions have remained broadly stable, with continued growth in real wages. In 3Q 2017, the labor force participation rate was slightly higher at 67.9 percent of the working age population (2Q 2017: 67.7 percent) (see Figure 12). In the same quarter, the unemployment rate remained low at 3.4 percent (y/y) of the labor force (2Q 2017: 3.4 percent), although this was marginally higher than the average figure of 3.1 percent recorded for the 2010-2016 period. There was sustained growth in private sector wages during the quarter across both domestic- and export-oriented manufacturing subsectors (10.6 percent; 2Q 2017: 11.2 percent) and the major services subsectors (5.9 percent; 2Q 2017: 5.6 percent) (see Figure 13).
Inflation, y/y, %
Headline Inflation
0
1
2
3
4
5
6
01/2
016
02/2
016
03/2
016
04/2
016
05/2
016
06/2
016
07/2
016
08/2
016
09/2
016
10/2
016
11/2
016
12/2
016
01/2
017
02/2
017
03/2
017
04/2
017
05/2
017
06/2
017
07/2
017
08/2
017
09/2
017
10/2
017
Core InflationCore Inflation
Contribution to Headline Inflation, y/y, %
-2
-1
0
1
2
3
4
5
6
01/2
016
02/2
016
03/2
016
04/2
016
05/2
016
06/2
016
07/2
016
08/2
016
09/2
016
10/2
016
11/2
016
12/2
016
01/2
017
02/2
017
03/2
017
04/2
017
05/2
017
06/2
017
07/2
017
08/2
017
09/2
017
10/2
017
Food and Non Alcoholic Beverages
Housing, Water, Electricity,Gas & Other Fuels
Transport
Others
Headline Inflation
22 MALAYSIA ECONOMIC MONITOR | DECEMBER 2017
PART ONE - Recent Economic Developments and Outlook
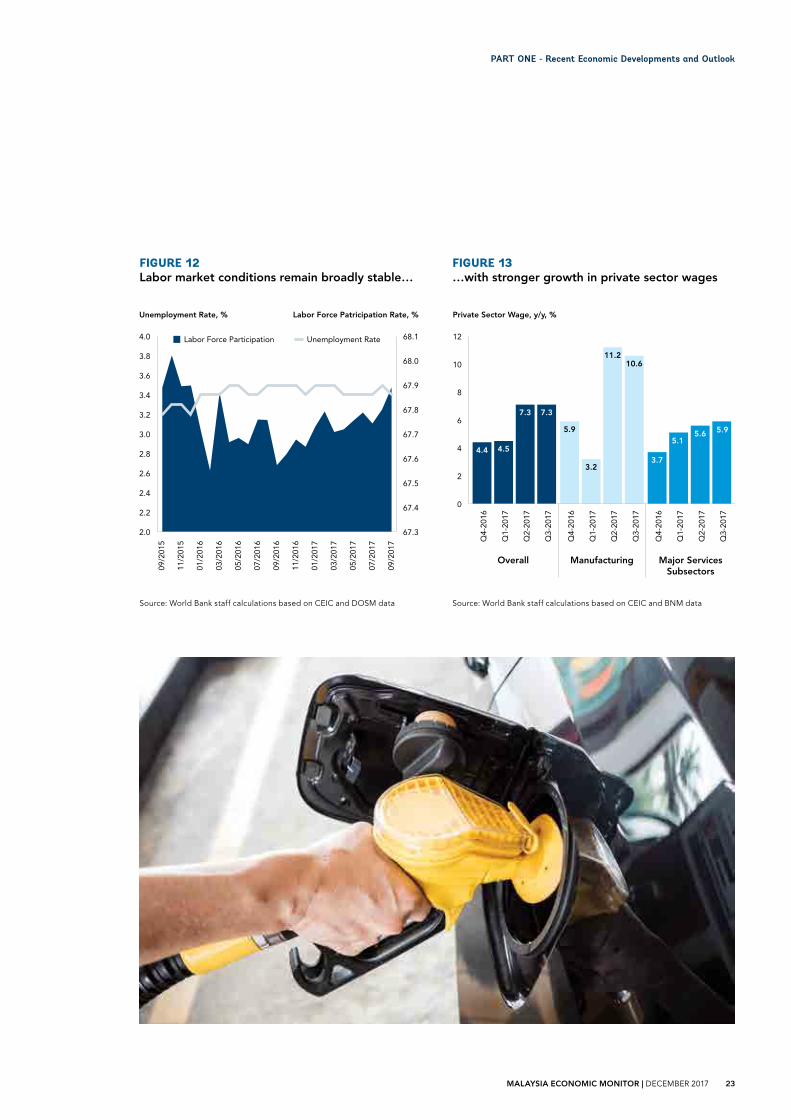
FIGURE 12Labor market conditions remain broadly stable…
FIGURE 13…with stronger growth in private sector wages
Source: World Bank staff calculations based on CEIC and DOSM data Source: World Bank staff calculations based on CEIC and BNM data
Unemployment Rate, %
Unemployment RateLabor Force Participation
Labor Force Patricipation Rate, %
67.3
67.4
67.5
67.6
67.7
67.8
67.9
68.0
68.1
2.0
2.2
2.4
2.6
2.8
3.0
3.2
3.4
3.6
3.8
4.0
09/2
015
11/2
015
01/2
016
03/2
016
05/2
016
07/2
016
09/2
016
11/2
016
01/2
017
03/2
017
05/2
017
07/2
017
09/2
017
Overall Manufacturing Major ServicesSubsectors
4.4 4.5
7.3 7.3
5.9
3.2
11.210.6
3.7
5.15.6 5.9
Q4-
2016
Q1-
2017
Q2-
2017
Q3-
2017
Q4-
2016
Q1-
2017
Q2-
2017
Q3-
2017
Q4-
2016
Q1-
2017
Q2-
2017
Q3-
2017
Private Sector Wage, y/y, %
0
2
4
6
8
10
12
23MALAYSIA ECONOMIC MONITOR | DECEMBER 2017
PART ONE - Recent Economic Developments and Outlook
Urban low-income households experience relatively high inflationThe buildup of inflationary pressures over the past years have had a disproportionate impact on lower-income households, especially those in urban areas, who spend a larger proportion of their income on the goods and services that have recorded the most significant price increases. The 2016 Household Expenditure Survey Report indicated a marked unevenness in the composition of household expenditure across income brackets, with households in the lowest-income deciles spending close to 40 percent of their expenditure on food, compared to about 25 percent among the highest-income deciles (see Figure 14). As a result, the poorest households have been disproportionately affected by the build-up of inflationary pressures over the past years with higher relative increases in food prices. This effect has been even more pronounced in urban areas as food price inflation has been higher compared to in rural areas (see Figure 15).
The adverse impact of higher inflation on low-income households has been further compounded by the persistent deterioration in the affordability of housing since 2012 (see Figure 16) as a result of a structural undersupply of affordable homes, which has become especially acute in the highly-urbanized regions.
The rising cost of living for low income households underscores the need for better targeted social assistance measures to support the poorest households, particularly those residing in the urban areas. The Government’s shift in emphasis away from blanket subsidies and towards targeted social assistance programs has been a significant step forward towards the achievement of this, with the efficiency of this approach being well-supported by international evidence. However, there are still a number of areas where fine-tuning these initiatives could improve their
BOX 2
24 MALAYSIA ECONOMIC MONITOR | DECEMBER 201724 MALAYSIA ECONOMIC MONITOR | DECEMBER 2017
PART ONE - Recent Economic Developments and Outlook
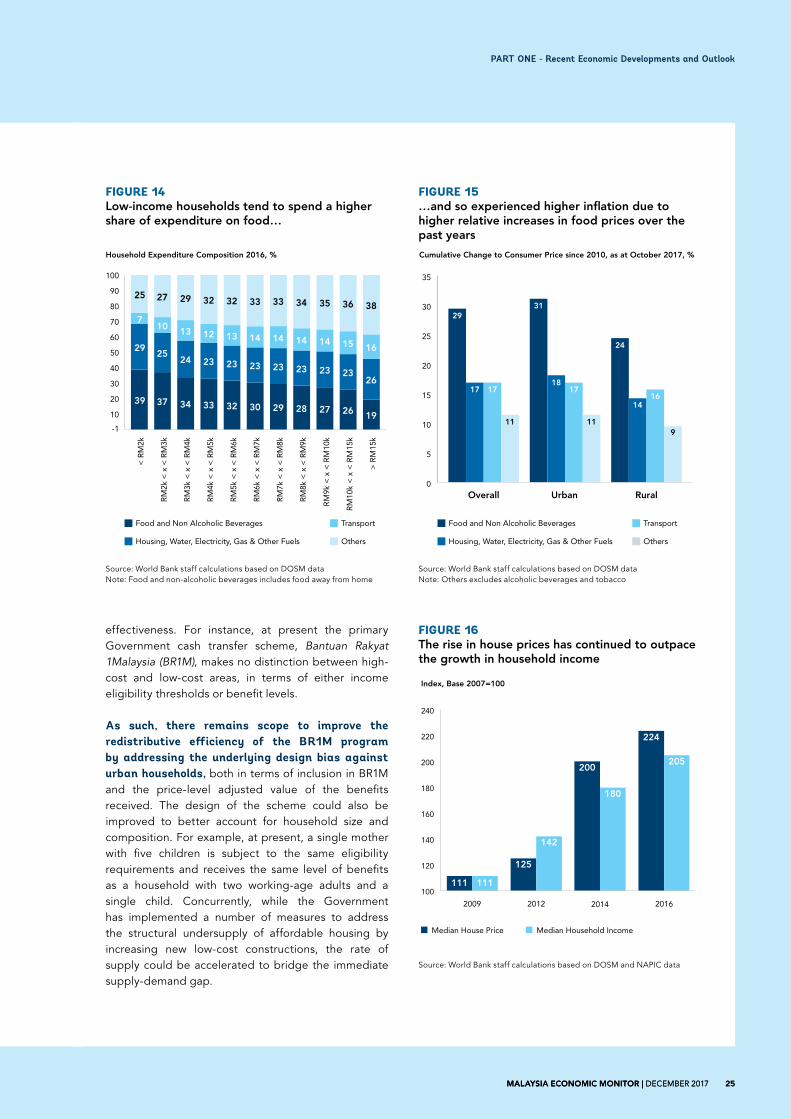
effectiveness. For instance, at present the primary Government cash transfer scheme, Bantuan Rakyat 1Malaysia (BR1M), makes no distinction between high-cost and low-cost areas, in terms of either income eligibility thresholds or benefit levels.
As such, there remains scope to improve the redistributive efficiency of the BR1M program by addressing the underlying design bias against urban households, both in terms of inclusion in BR1M and the price-level adjusted value of the benefits received. The design of the scheme could also be improved to better account for household size and composition. For example, at present, a single mother with five children is subject to the same eligibility requirements and receives the same level of benefits as a household with two working-age adults and a single child. Concurrently, while the Government has implemented a number of measures to address the structural undersupply of affordable housing by increasing new low-cost constructions, the rate of supply could be accelerated to bridge the immediate supply-demand gap.
FIGURE 14Low-income households tend to spend a higher share of expenditure on food…
FIGURE 15…and so experienced higher inflation due to higher relative increases in food prices over the past years
Source: World Bank staff calculations based on DOSM dataNote: Food and non-alcoholic beverages includes food away from home
Source: World Bank staff calculations based on DOSM dataNote: Others excludes alcoholic beverages and tobacco
FIGURE 16The rise in house prices has continued to outpace the growth in household income
Source: World Bank staff calculations based on DOSM and NAPIC data
Household Expenditure Composition 2016, %
10
-1
20
30
40
50
60
70
80
90
100
19
26
16
38
> R
M15
k
26
23
15
36
RM
10k
< x
< R
M15
k
27
23
14
35
RM
9k <
x <
RM
10k
28
23
14
34R
M8k
< x
< R
M9k
29
23
14
33
RM
7k <
x <
RM
8k
30
23
14
33
RM
6k <
x <
RM
7k
32
23
13
32
RM
5k <
x <
RM
6k
33
23
12
32
RM
4k <
x <
RM
5k
34
24
13
29
RM
3k <
x <
RM
4k
37
25
10
27
RM
2k <
x <
RM
3k
39
29
7
25
< R
M2k
Others
Transport
Housing, Water, Electricity, Gas & Other Fuels
Food and Non Alcoholic Beverages
OthersHousing, Water, Electricity, Gas & Other Fuels
TransportFood and Non Alcoholic Beverages
Cumulative Change to Consumer Price since 2010, as at October 2017, %
0
5
10
15
20
25
30
35
24
1416
9
Rural
31
1817
11
Urban
29
17 17
11
Overall
Median House Price Median Household Income
Index, Base 2007=100
224
205
2016
200
180
2014
125
142
2012
111 111
2009
100
120
140
160
180
200
220
240
25MALAYSIA ECONOMIC MONITOR | DECEMBER 2017 25MALAYSIA ECONOMIC MONITOR | DECEMBER 2017
PART ONE - Recent Economic Developments and Outlook
Conditions in the domestic financial sector remain stableMonetary policy has remained stable, with the Overnight Policy Rate (OPR) held at three percent. In its November 2017 monetary policy statement, BNM noted that Malaysia’s economic growth has become more entrenched, with growth driven by the robust performance of both the domestic and external sectors. An assessment of recent indicators suggests that Malaysia’s current rates of growth will be sustained into 2018, with private consumption continuing to be the primary driver of growth. Meanwhile, the headline inflation rate is projected to decline, with expectations of a reduced effect from global cost factors. At the same time, underlying inflation is expected to be sustained by strong domestic demand. BNM also indicated the possibility of a review of its current monetary policy stance in future meetings, with the review intended to ensure the sustainability of domestic growth.
Financial soundness indicators show that the banking system remains resilient. Throughout the quarter, the banking system’s capacity to absorb losses remained robust, with levels of capitalization significantly in excess of the statutory minimum. As of 3Q 2017, the Common Equity Tier 1 (CET1) Capital Ratio was marginally higher at 13.2 percent (2Q 2017: 12.9
percent), while the Tier 1 and Total Capital Ratio were also marginally higher than in the previous quarter, at 14.1 percent (2Q 2017: 13.8 percent) and 17.1 percent (2Q 2017: 17.0 percent) respectively. The overall quality of banking system loans also remained broadly stable, with the share of net impaired loans remaining at around 1.2 percent. Inter-bank obligations continued to account for the bulk of total external borrowings, minimizing funding and rollover risks. Banking system liquidity remained adequate and the Basel III Liquidity Coverage Ratio (LCR) was at 136 percent in 3Q 2017, far above the statutory minimum of 80. However, this was a marginal decrease from 141 percent in 2Q 2017.
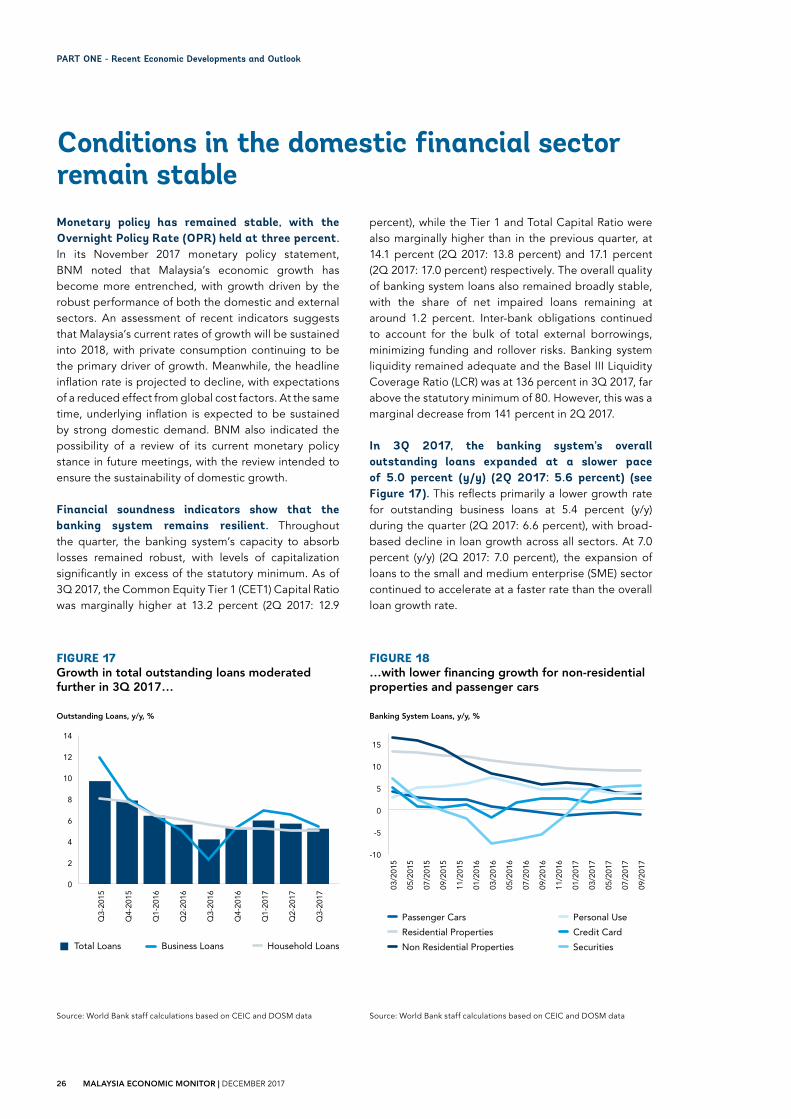
In 3Q 2017, the banking system’s overall outstanding loans expanded at a slower pace of 5.0 percent (y/y) (2Q 2017: 5.6 percent) (see Figure 17). This reflects primarily a lower growth rate for outstanding business loans at 5.4 percent (y/y) during the quarter (2Q 2017: 6.6 percent), with broad-based decline in loan growth across all sectors. At 7.0 percent (y/y) (2Q 2017: 7.0 percent), the expansion of loans to the small and medium enterprise (SME) sector continued to accelerate at a faster rate than the overall loan growth rate.
FIGURE 17Growth in total outstanding loans moderated further in 3Q 2017…
FIGURE 18…with lower financing growth for non-residential properties and passenger cars
Source: World Bank staff calculations based on CEIC and DOSM dataSource: World Bank staff calculations based on CEIC and DOSM data
Outstanding Loans, y/y, %
0
2
4
6
8
10
12
14
Q3-
2015
Q4-
2015
Q1-
2016
Q2-
2016
Q3-
2016
Q4-
2016
Q1-
2017
Q2-
2017
Q3-
2017
Business LoansTotal Loans Household Loans
Banking System Loans, y/y, %
-10
0
5
15
-5
10
03/2
015
05/2
015
07/2
015
09/2
015
11/2
015
01/2
016
03/2
016
05/2
016
07/2
016
09/2
016
11/2
016
01/2
017
03/2
017
05/2
017
07/2
017
09/2
017
Personal Use
Credit Card
Securities
Passenger Cars
Residential Properties
Non Residential Properties
26 MALAYSIA ECONOMIC MONITOR | DECEMBER 2017
PART ONE - Recent Economic Developments and Outlook
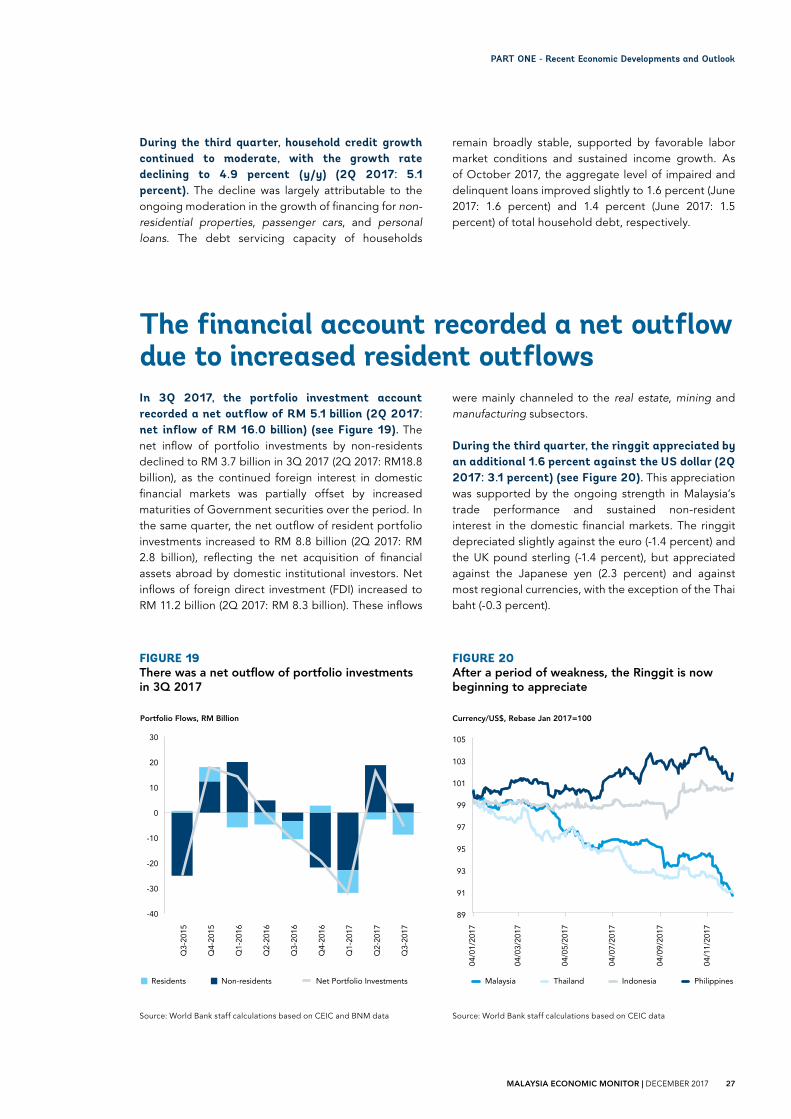
The financial account recorded a net outflow due to increased resident outflowsIn 3Q 2017, the portfolio investment account recorded a net outflow of RM 5.1 billion (2Q 2017: net inflow of RM 16.0 billion) (see Figure 19). The net inflow of portfolio investments by non-residents declined to RM 3.7 billion in 3Q 2017 (2Q 2017: RM18.8 billion), as the continued foreign interest in domestic financial markets was partially offset by increased maturities of Government securities over the period. In the same quarter, the net outflow of resident portfolio investments increased to RM 8.8 billion (2Q 2017: RM 2.8 billion), reflecting the net acquisition of financial assets abroad by domestic institutional investors. Net inflows of foreign direct investment (FDI) increased to RM 11.2 billion (2Q 2017: RM 8.3 billion). These inflows
FIGURE 19There was a net outflow of portfolio investments in 3Q 2017
FIGURE 20After a period of weakness, the Ringgit is now beginning to appreciate
Source: World Bank staff calculations based on CEIC and BNM data Source: World Bank staff calculations based on CEIC data
were mainly channeled to the real estate, mining and manufacturing subsectors.
During the third quarter, the ringgit appreciated by an additional 1.6 percent against the US dollar (2Q 2017: 3.1 percent) (see Figure 20). This appreciation was supported by the ongoing strength in Malaysia’s trade performance and sustained non-resident interest in the domestic financial markets. The ringgit depreciated slightly against the euro (-1.4 percent) and the UK pound sterling (-1.4 percent), but appreciated against the Japanese yen (2.3 percent) and against most regional currencies, with the exception of the Thai baht (-0.3 percent).
During the third quarter, household credit growth continued to moderate, with the growth rate declining to 4.9 percent (y/y) (2Q 2017: 5.1 percent). The decline was largely attributable to the ongoing moderation in the growth of financing for non-residential properties, passenger cars, and personal loans. The debt servicing capacity of households
remain broadly stable, supported by favorable labor market conditions and sustained income growth. As of October 2017, the aggregate level of impaired and delinquent loans improved slightly to 1.6 percent (June 2017: 1.6 percent) and 1.4 percent (June 2017: 1.5 percent) of total household debt, respectively.
Portfolio Flows, RM Billion
-40
-30
-20
-10
0
10
20
30
Q3-
2015
Q4-
2015
Q1-
2016
Q2-
2016
Q3-
2016
Q4-
2016
Q1-
2017
Q2-
2017
Q3-
2017
Net Portfolio InvestmentsNon-residentsResidents
Currency/US$, Rebase Jan 2017=100
89
91
93
95
97
99
101
103
105
04/0
1/20
17
04/0
3/20
17
04/0
5/20
17
04/0
7/20
17
04/0
9/20
17
04/1
1/20
17
Malaysia IndonesiaThailand Philippines
27MALAYSIA ECONOMIC MONITOR | DECEMBER 2017
PART ONE - Recent Economic Developments and Outlook
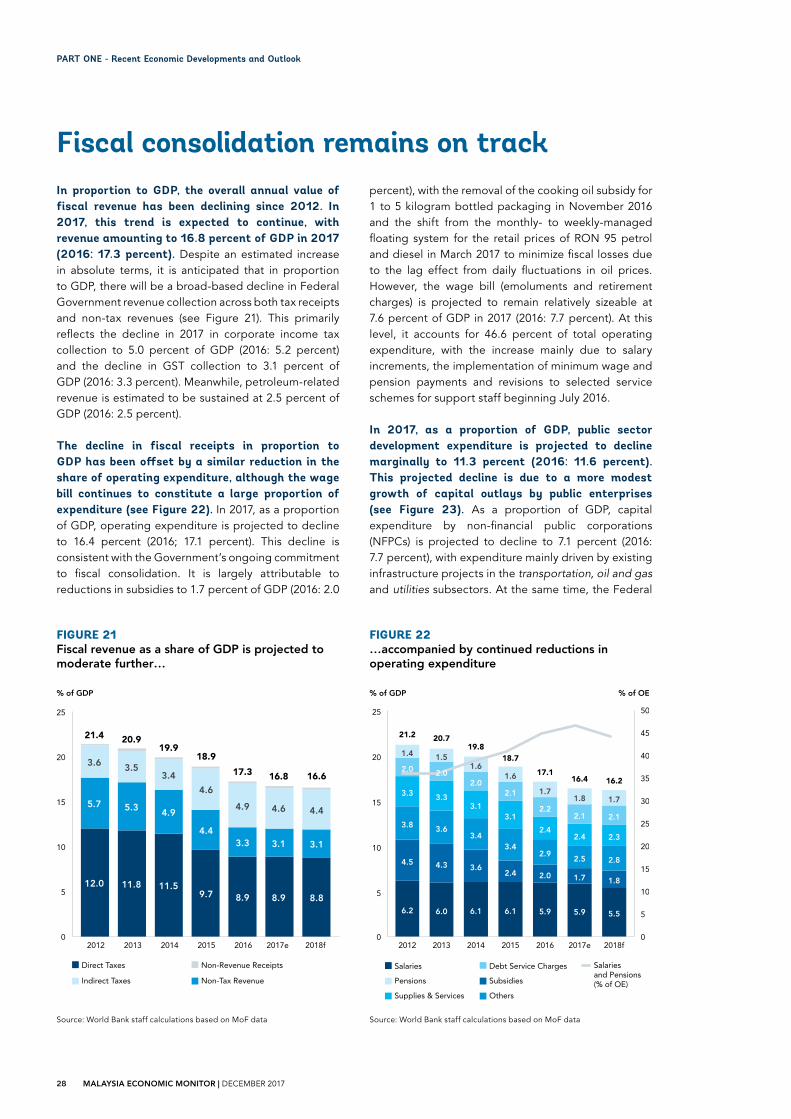
In proportion to GDP, the overall annual value of fiscal revenue has been declining since 2012. In 2017, this trend is expected to continue, with revenue amounting to 16.8 percent of GDP in 2017 (2016: 17.3 percent). Despite an estimated increase in absolute terms, it is anticipated that in proportion to GDP, there will be a broad-based decline in Federal Government revenue collection across both tax receipts and non-tax revenues (see Figure 21). This primarily reflects the decline in 2017 in corporate income tax collection to 5.0 percent of GDP (2016: 5.2 percent) and the decline in GST collection to 3.1 percent of GDP (2016: 3.3 percent). Meanwhile, petroleum-related revenue is estimated to be sustained at 2.5 percent of GDP (2016: 2.5 percent).
The decline in fiscal receipts in proportion to GDP has been offset by a similar reduction in the share of operating expenditure, although the wage bill continues to constitute a large proportion of expenditure (see Figure 22). In 2017, as a proportion of GDP, operating expenditure is projected to decline to 16.4 percent (2016; 17.1 percent). This decline is consistent with the Government’s ongoing commitment to fiscal consolidation. It is largely attributable to reductions in subsidies to 1.7 percent of GDP (2016: 2.0
Fiscal consolidation remains on trackpercent), with the removal of the cooking oil subsidy for 1 to 5 kilogram bottled packaging in November 2016 and the shift from the monthly- to weekly-managed floating system for the retail prices of RON 95 petrol and diesel in March 2017 to minimize fiscal losses due to the lag effect from daily fluctuations in oil prices. However, the wage bill (emoluments and retirement charges) is projected to remain relatively sizeable at 7.6 percent of GDP in 2017 (2016: 7.7 percent). At this level, it accounts for 46.6 percent of total operating expenditure, with the increase mainly due to salary increments, the implementation of minimum wage and pension payments and revisions to selected service schemes for support staff beginning July 2016.
In 2017, as a proportion of GDP, public sector development expenditure is projected to decline marginally to 11.3 percent (2016: 11.6 percent). This projected decline is due to a more modest growth of capital outlays by public enterprises (see Figure 23). As a proportion of GDP, capital expenditure by non-financial public corporations (NFPCs) is projected to decline to 7.1 percent (2016: 7.7 percent), with expenditure mainly driven by existing infrastructure projects in the transportation, oil and gas and utilities subsectors. At the same time, the Federal
FIGURE 21Fiscal revenue as a share of GDP is projected to moderate further…
FIGURE 22…accompanied by continued reductions in operating expenditure
Source: World Bank staff calculations based on MoF dataSource: World Bank staff calculations based on MoF data
Non-Revenue Receipts
Indirect Taxes Non-Tax Revenue
Direct Taxes
% of GDP
0
5
10
15
20
25
2018f
8.8
3.1
4.4
16.6
2017e
8.9
3.1
4.6
16.8
2016
8.9
3.3
4.9
17.3
2015
9.7
4.4
4.6
18.9
2014
11.5
4.9
3.4
19.9
2013
11.8
5.3
3.5
20.9
2012
12.0
5.7
3.6
21.4
% of GDP % of OE
Subsidies
Others
Debt Service Charges
Pensions
Supplies & Services
Salaries Salariesand Pensions(% of OE)
0
5
10
15
20
25
30
35
40
45
50
0
5
10
15
20
25
6.0
4.3
3.6
3.3
1.5
20.7
6.1
3.6
3.4
3.1
2.0
19.8
6.2
4.5
3.8
3.3
2.0
1.4
21.2
2.01.6
6.1
2.4
3.4
3.1
2.1
1.6
18.7
5.9
2.0
2.9
2.4
2.2
1.7
17.1
5.5
1.8
2.8
2.3
2.1
1.7
16.2
5.9
1.7
2.5
2.4
2.1
1.8
16.4
2013 20142012 2015 2016 2018f2017e
28 MALAYSIA ECONOMIC MONITOR | DECEMBER 2017
PART ONE - Recent Economic Developments and Outlook
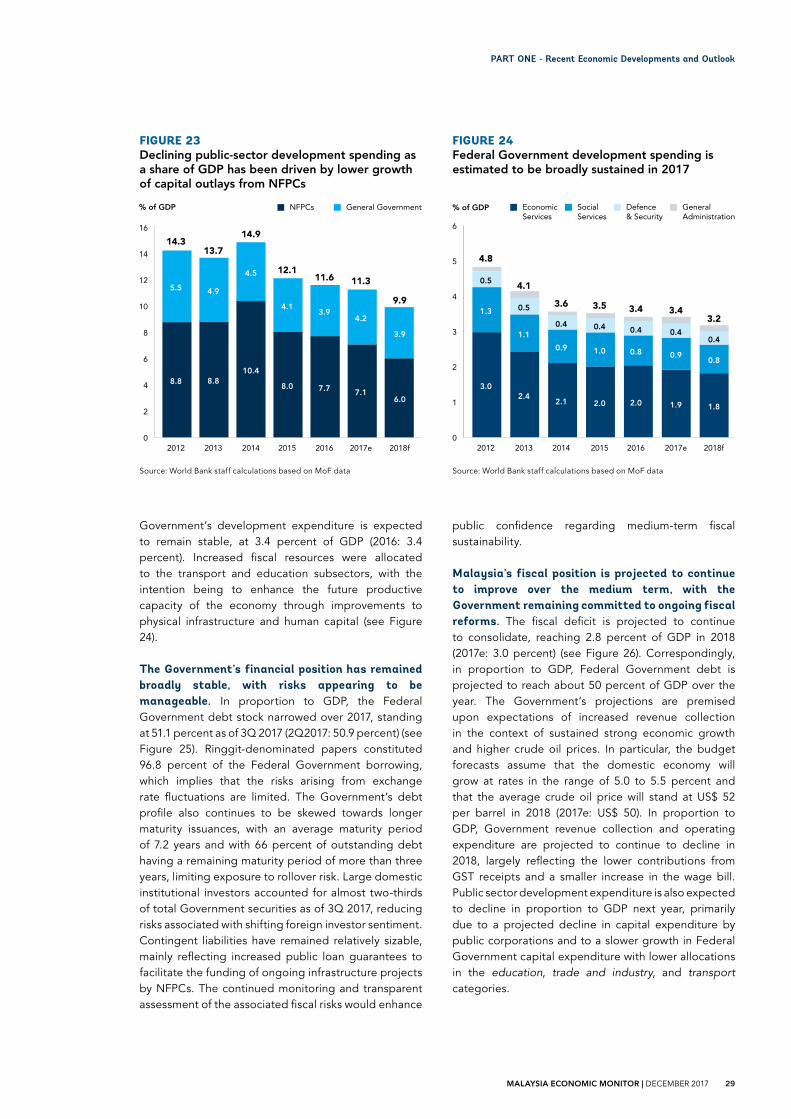
FIGURE 23Declining public-sector development spending as a share of GDP has been driven by lower growth of capital outlays from NFPCs
FIGURE 24Federal Government development spending is estimated to be broadly sustained in 2017
Source: World Bank staff calculations based on MoF data Source: World Bank staff calculations based on MoF data
Government’s development expenditure is expected to remain stable, at 3.4 percent of GDP (2016: 3.4 percent). Increased fiscal resources were allocated to the transport and education subsectors, with the intention being to enhance the future productive capacity of the economy through improvements to physical infrastructure and human capital (see Figure 24).
The Government’s financial position has remained broadly stable, with risks appearing to be manageable. In proportion to GDP, the Federal Government debt stock narrowed over 2017, standing at 51.1 percent as of 3Q 2017 (2Q2017: 50.9 percent) (see Figure 25). Ringgit-denominated papers constituted 96.8 percent of the Federal Government borrowing, which implies that the risks arising from exchange rate fluctuations are limited. The Government’s debt profile also continues to be skewed towards longer maturity issuances, with an average maturity period of 7.2 years and with 66 percent of outstanding debt having a remaining maturity period of more than three years, limiting exposure to rollover risk. Large domestic institutional investors accounted for almost two-thirds of total Government securities as of 3Q 2017, reducing risks associated with shifting foreign investor sentiment. Contingent liabilities have remained relatively sizable, mainly reflecting increased public loan guarantees to facilitate the funding of ongoing infrastructure projects by NFPCs. The continued monitoring and transparent assessment of the associated fiscal risks would enhance
public confidence regarding medium-term fiscal sustainability.
Malaysia’s fiscal position is projected to continue to improve over the medium term, with the Government remaining committed to ongoing fiscal reforms. The fiscal deficit is projected to continue to consolidate, reaching 2.8 percent of GDP in 2018 (2017e: 3.0 percent) (see Figure 26). Correspondingly, in proportion to GDP, Federal Government debt is projected to reach about 50 percent of GDP over the year. The Government’s projections are premised upon expectations of increased revenue collection in the context of sustained strong economic growth and higher crude oil prices. In particular, the budget forecasts assume that the domestic economy will grow at rates in the range of 5.0 to 5.5 percent and that the average crude oil price will stand at US$ 52 per barrel in 2018 (2017e: US$ 50). In proportion to GDP, Government revenue collection and operating expenditure are projected to continue to decline in 2018, largely reflecting the lower contributions from GST receipts and a smaller increase in the wage bill. Public sector development expenditure is also expected to decline in proportion to GDP next year, primarily due to a projected decline in capital expenditure by public corporations and to a slower growth in Federal Government capital expenditure with lower allocations in the education, trade and industry, and transport categories.
% of GDP
0
2
4
6
8
10
12
14
16
General GovernmentNFPCs
8.8
5.5
2012
14.3
8.8
4.9
2013
13.7
10.4
4.5
2014
14.9
8.0
4.1
2015
12.1
7.7
3.9
2016
11.6
7.1
4.2
2017e
11.3
6.0
3.9
2018f
9.9
1.8
0.8
0.4
2018f
3.2
1.9
0.9
0.4
2017e
3.4
2.0
0.8
0.4
2016
3.4
2.0
1.0
0.4
2015
3.5
2.1
0.9
0.4
2014
3.6
2.4
1.1
0.5
2013
4.1
3.0
1.3
0.5
2012
4.8
Defence& Security
GeneralAdministration
SocialServices
EconomicServices
% of GDP
0
1
2
3
4
5
6
29MALAYSIA ECONOMIC MONITOR | DECEMBER 2017
PART ONE - Recent Economic Developments and Outlook
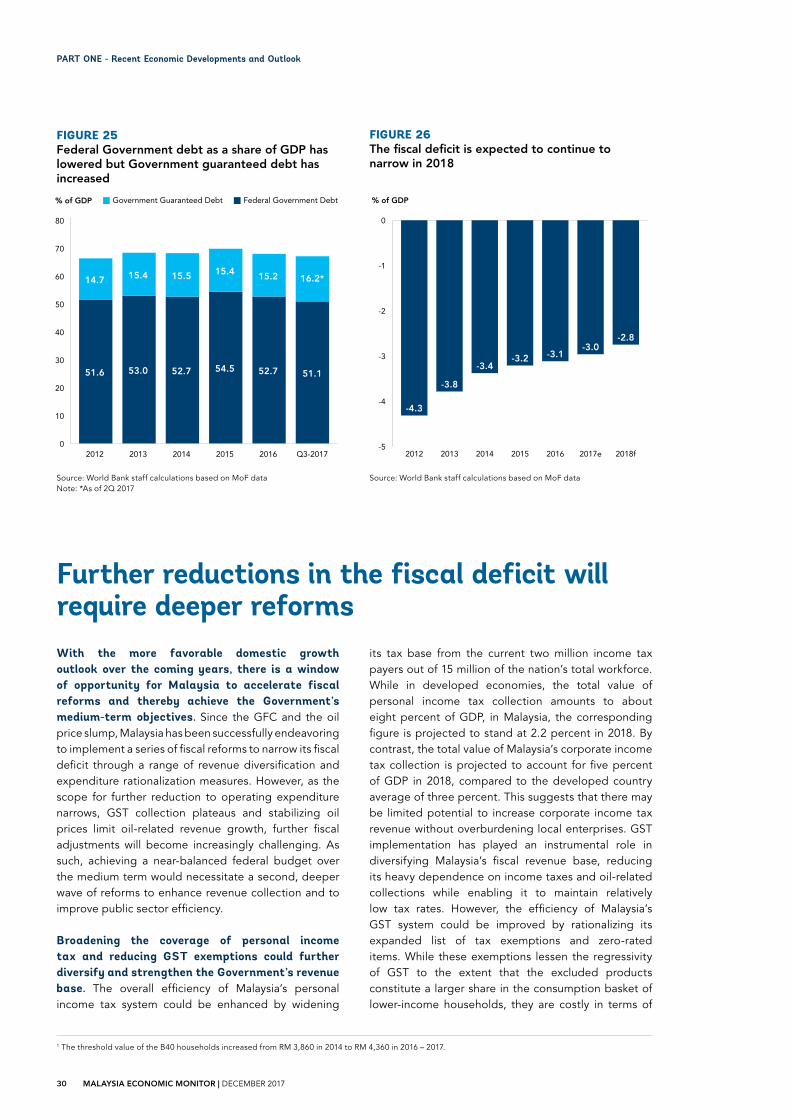
FIGURE 26The fiscal deficit is expected to continue to narrow in 2018
FIGURE 25Federal Government debt as a share of GDP has lowered but Government guaranteed debt has increased
Source: World Bank staff calculations based on MoF dataNote: *As of 2Q 2017
Source: World Bank staff calculations based on MoF data
With the more favorable domestic growth outlook over the coming years, there is a window of opportunity for Malaysia to accelerate fiscal reforms and thereby achieve the Government’s medium-term objectives. Since the GFC and the oil price slump, Malaysia has been successfully endeavoring to implement a series of fiscal reforms to narrow its fiscal deficit through a range of revenue diversification and expenditure rationalization measures. However, as the scope for further reduction to operating expenditure narrows, GST collection plateaus and stabilizing oil prices limit oil-related revenue growth, further fiscal adjustments will become increasingly challenging. As such, achieving a near-balanced federal budget over the medium term would necessitate a second, deeper wave of reforms to enhance revenue collection and to improve public sector efficiency.
Broadening the coverage of personal income tax and reducing GST exemptions could further diversify and strengthen the Government’s revenue base. The overall efficiency of Malaysia’s personal income tax system could be enhanced by widening
its tax base from the current two million income tax payers out of 15 million of the nation’s total workforce. While in developed economies, the total value of personal income tax collection amounts to about eight percent of GDP, in Malaysia, the corresponding figure is projected to stand at 2.2 percent in 2018. By contrast, the total value of Malaysia’s corporate income tax collection is projected to account for five percent of GDP in 2018, compared to the developed country average of three percent. This suggests that there may be limited potential to increase corporate income tax revenue without overburdening local enterprises. GST implementation has played an instrumental role in diversifying Malaysia’s fiscal revenue base, reducing its heavy dependence on income taxes and oil-related collections while enabling it to maintain relatively low tax rates. However, the efficiency of Malaysia’s GST system could be improved by rationalizing its expanded list of tax exemptions and zero-rated items. While these exemptions lessen the regressivity of GST to the extent that the excluded products constitute a larger share in the consumption basket of lower-income households, they are costly in terms of
Further reductions in the fiscal deficit will require deeper reforms
0
10
20
30
40
50
60
70
80
51.6 53.0 52.7 54.5 52.7 51.1
14.7 15.4 15.5 15.4 15.2
2012 2013 2014 2015 2016 Q3-2017
% of GDP Government Guaranteed Debt Federal Government Debt
16.2*
% of GDP
-5
-4
-3
-2
-1
0
-2.8
2018f2017e
-3.0
2016
-3.1
2015
-3.2
2014
-3.4
2013
-3.8
2012
-4.3
1 The threshold value of the B40 households increased from RM 3,860 in 2014 to RM 4,360 in 2016 – 2017.
30 MALAYSIA ECONOMIC MONITOR | DECEMBER 2017
PART ONE - Recent Economic Developments and Outlook
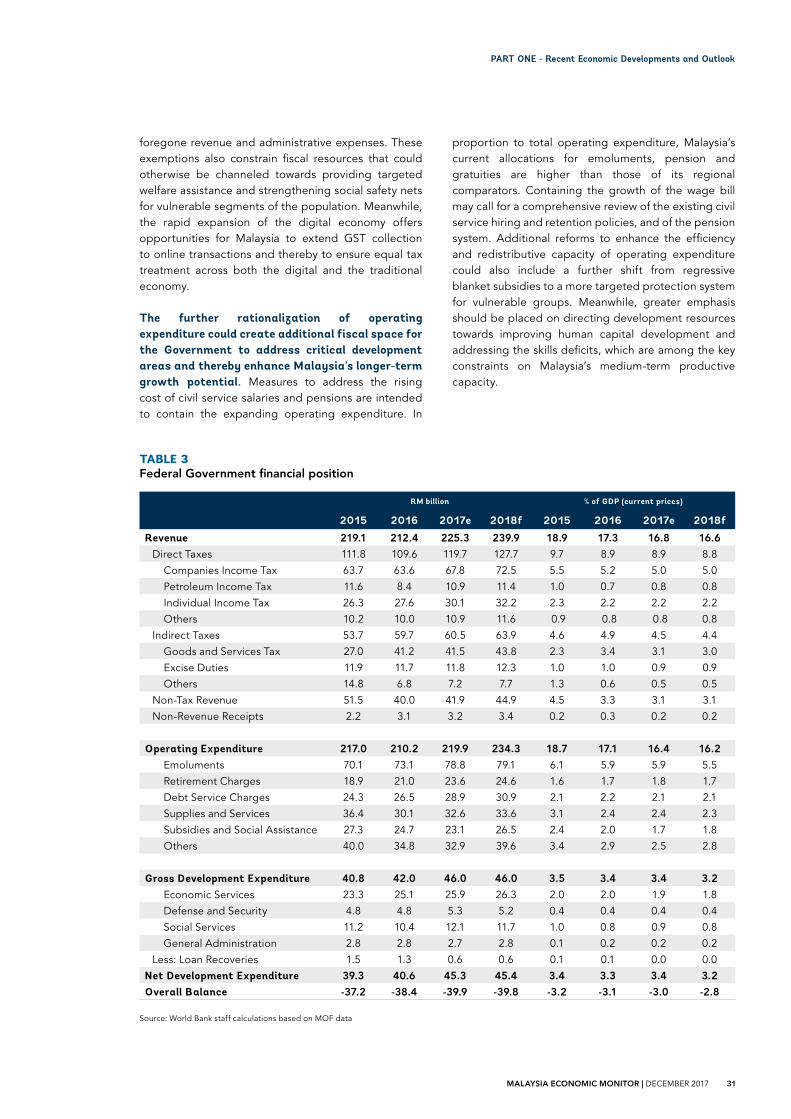
foregone revenue and administrative expenses. These exemptions also constrain fiscal resources that could otherwise be channeled towards providing targeted welfare assistance and strengthening social safety nets for vulnerable segments of the population. Meanwhile, the rapid expansion of the digital economy offers opportunities for Malaysia to extend GST collection to online transactions and thereby to ensure equal tax treatment across both the digital and the traditional economy.
The further rationalization of operating expenditure could create additional fiscal space for the Government to address critical development areas and thereby enhance Malaysia’s longer-term growth potential. Measures to address the rising cost of civil service salaries and pensions are intended to contain the expanding operating expenditure. In
RM billion % of GDP (current prices)
2015 2016 2017e 2018f 2015 2016 2017e 2018f
Revenue 219.1 212.4 225.3 239.9 18.9 17.3 16.8 16.6
Direct Taxes 111.8 109.6 119.7 127.7 9.7 8.9 8.9 8.8
Companies Income Tax 63.7 63.6 67.8 72.5 5.5 5.2 5.0 5.0
Petroleum Income Tax 11.6 8.4 10.9 11.4 1.0 0.7 0.8 0.8
Individual Income Tax 26.3 27.6 30.1 32.2 2.3 2.2 2.2 2.2
Others 10.2 10.0 10.9 11.6 0.9 0.8 0.8 0.8
Indirect Taxes 53.7 59.7 60.5 63.9 4.6 4.9 4.5 4.4
Goods and Services Tax 27.0 41.2 41.5 43.8 2.3 3.4 3.1 3.0
Excise Duties 11.9 11.7 11.8 12.3 1.0 1.0 0.9 0.9
Others 14.8 6.8 7.2 7.7 1.3 0.6 0.5 0.5
Non-Tax Revenue 51.5 40.0 41.9 44.9 4.5 3.3 3.1 3.1
Non-Revenue Receipts 2.2 3.1 3.2 3.4 0.2 0.3 0.2 0.2
Operating Expenditure 217.0 210.2 219.9 234.3 18.7 17.1 16.4 16.2
Emoluments 70.1 73.1 78.8 79.1 6.1 5.9 5.9 5.5
Retirement Charges 18.9 21.0 23.6 24.6 1.6 1.7 1.8 1.7
Debt Service Charges 24.3 26.5 28.9 30.9 2.1 2.2 2.1 2.1
Supplies and Services 36.4 30.1 32.6 33.6 3.1 2.4 2.4 2.3
Subsidies and Social Assistance 27.3 24.7 23.1 26.5 2.4 2.0 1.7 1.8
Others 40.0 34.8 32.9 39.6 3.4 2.9 2.5 2.8
Gross Development Expenditure 40.8 42.0 46.0 46.0 3.5 3.4 3.4 3.2
Economic Services 23.3 25.1 25.9 26.3 2.0 2.0 1.9 1.8
Defense and Security 4.8 4.8 5.3 5.2 0.4 0.4 0.4 0.4
Social Services 11.2 10.4 12.1 11.7 1.0 0.8 0.9 0.8
General Administration 2.8 2.8 2.7 2.8 0.1 0.2 0.2 0.2
Less: Loan Recoveries 1.5 1.3 0.6 0.6 0.1 0.1 0.0 0.0
Net Development Expenditure 39.3 40.6 45.3 45.4 3.4 3.3 3.4 3.2
Overall Balance -37.2 -38.4 -39.9 -39.8 -3.2 -3.1 -3.0 -2.8
TABLE 3Federal Government financial position
Source: World Bank staff calculations based on MOF data
proportion to total operating expenditure, Malaysia’s current allocations for emoluments, pension and gratuities are higher than those of its regional comparators. Containing the growth of the wage bill may call for a comprehensive review of the existing civil service hiring and retention policies, and of the pension system. Additional reforms to enhance the efficiency and redistributive capacity of operating expenditure could also include a further shift from regressive blanket subsidies to a more targeted protection system for vulnerable groups. Meanwhile, greater emphasis should be placed on directing development resources towards improving human capital development and addressing the skills deficits, which are among the key constraints on Malaysia’s medium-term productive capacity.
31MALAYSIA ECONOMIC MONITOR | DECEMBER 2017
PART ONE - Recent Economic Developments and Outlook
How can big data improve analysis of macroeconomic trends in Malaysia?Governments and private actors depend heavily on official statistics for the optimal allocation of resources. However, these statistics are costly to produce and are therefore generated at a low frequency. In the absence of official statistics, policymakers typically rely on analysts’ forecasts, which may not give an accurate picture of economic conditions. Following the AFC, Malaysia’s annual GDP growth rate declined drastically, going down from 7.3 percent in 1997 to -7.4 percent in 1998. However, the consensus forecast for the GDP growth rate in 1998 remained at -4.8 percent in September 1998 and at -6 percent in December 1998, a few weeks prior to the official statistics being released. A similar phenomenon occurred during the GFC, when the consensus forecast for the 2008 GDP growth rate stood at 5.5 percent in September 2008 and at 5.3 percent in December 2008. When an official assessment of the rate was released, it stood at 3.3 percent. Dependence on unreliable forecasts can have serious implications for the economy, including hampering the effective implementation of interventions during a crisis.
In the past decade, there has been a significant proliferation of large and often unstructured datasets. These may be generated from sources such as news articles, satellite images, mobile phone call records, social media data, and web searches and may contain valuable information on collective human behavior. While these datasets have mostly been utilized by private companies, they can also be leveraged by policymakers to improve the measurement and assessment of economic conditions and to inform policy decisions.
Staff of the World Bank’s Big Data program have collected a vast body of media reports, containing around four million news articles on issues related to the economy by Reuters in the period from 1996 to 2015. Information derived from media reports has two main advantages compared to official statistics. First, measurements of economic conditions can be calculated in real time, at a daily frequency, and across a large number of countries. Second, this information enables the measurement of economic forces that
BOX 3
32 MALAYSIA ECONOMIC MONITOR | DECEMBER 201732 MALAYSIA ECONOMIC MONITOR | DECEMBER 2017
PART ONE - Recent Economic Developments and Outlook
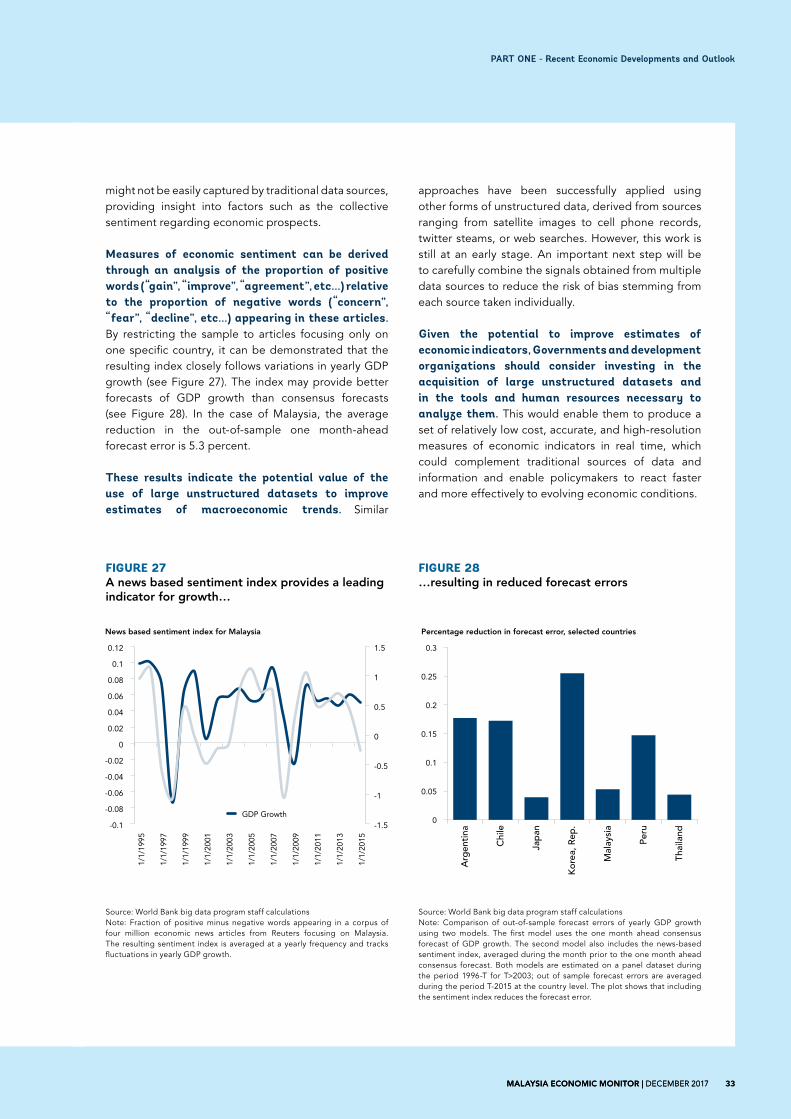
FIGURE 28…resulting in reduced forecast errors
FIGURE 27A news based sentiment index provides a leading indicator for growth…
Source: World Bank big data program staff calculations Note: Fraction of positive minus negative words appearing in a corpus of four million economic news articles from Reuters focusing on Malaysia. The resulting sentiment index is averaged at a yearly frequency and tracks fluctuations in yearly GDP growth.
Source: World Bank big data program staff calculationsNote: Comparison of out-of-sample forecast errors of yearly GDP growth using two models. The first model uses the one month ahead consensus forecast of GDP growth. The second model also includes the news-based sentiment index, averaged during the month prior to the one month ahead consensus forecast. Both models are estimated on a panel dataset during the period 1996-T for T>2003; out of sample forecast errors are averaged during the period T-2015 at the country level. The plot shows that including the sentiment index reduces the forecast error.
might not be easily captured by traditional data sources, providing insight into factors such as the collective sentiment regarding economic prospects.
Measures of economic sentiment can be derived through an analysis of the proportion of positive words (“gain”, “improve”, “agreement”, etc...) relative to the proportion of negative words (“concern”, “fear”, “decline”, etc...) appearing in these articles. By restricting the sample to articles focusing only on one specific country, it can be demonstrated that the resulting index closely follows variations in yearly GDP growth (see Figure 27). The index may provide better forecasts of GDP growth than consensus forecasts (see Figure 28). In the case of Malaysia, the average reduction in the out-of-sample one month-ahead forecast error is 5.3 percent.
These results indicate the potential value of the use of large unstructured datasets to improve estimates of macroeconomic trends. Similar
approaches have been successfully applied using other forms of unstructured data, derived from sources ranging from satellite images to cell phone records, twitter steams, or web searches. However, this work is still at an early stage. An important next step will be to carefully combine the signals obtained from multiple data sources to reduce the risk of bias stemming from each source taken individually.
Given the potential to improve estimates of economic indicators, Governments and development organizations should consider investing in the acquisition of large unstructured datasets and in the tools and human resources necessary to analyze them. This would enable them to produce a set of relatively low cost, accurate, and high-resolution measures of economic indicators in real time, which could complement traditional sources of data and information and enable policymakers to react faster and more effectively to evolving economic conditions.
News based sentiment index for Malaysia
1/1/
1995
1/1/
1997
1/1/
1999
1/1/
2001
1/1/
2003
1/1/
2005
1/1/
2007
1/1/
2009
1/1/
2011
1/1/
2013
1/1/
2015
-1.5
-1
-0.5
0
0.5
1
1.5
0
-0.1
-0.08
-0.06
-0.04
-0.02
0.02
0.04
0.06
0.08
0.1
0.12
GDP Growth
Percentage reduction in forecast error, selected countries
0
0.05
0.1
0.15
0.2
0.25
0.3
Arg
enti
na
Chi
le
Jap
an
Kor
ea, R
ep.
Mal
aysi
a
Peru
Thai
land
33MALAYSIA ECONOMIC MONITOR | DECEMBER 2017 33MALAYSIA ECONOMIC MONITOR | DECEMBER 2017
PART ONE - Recent Economic Developments and Outlook
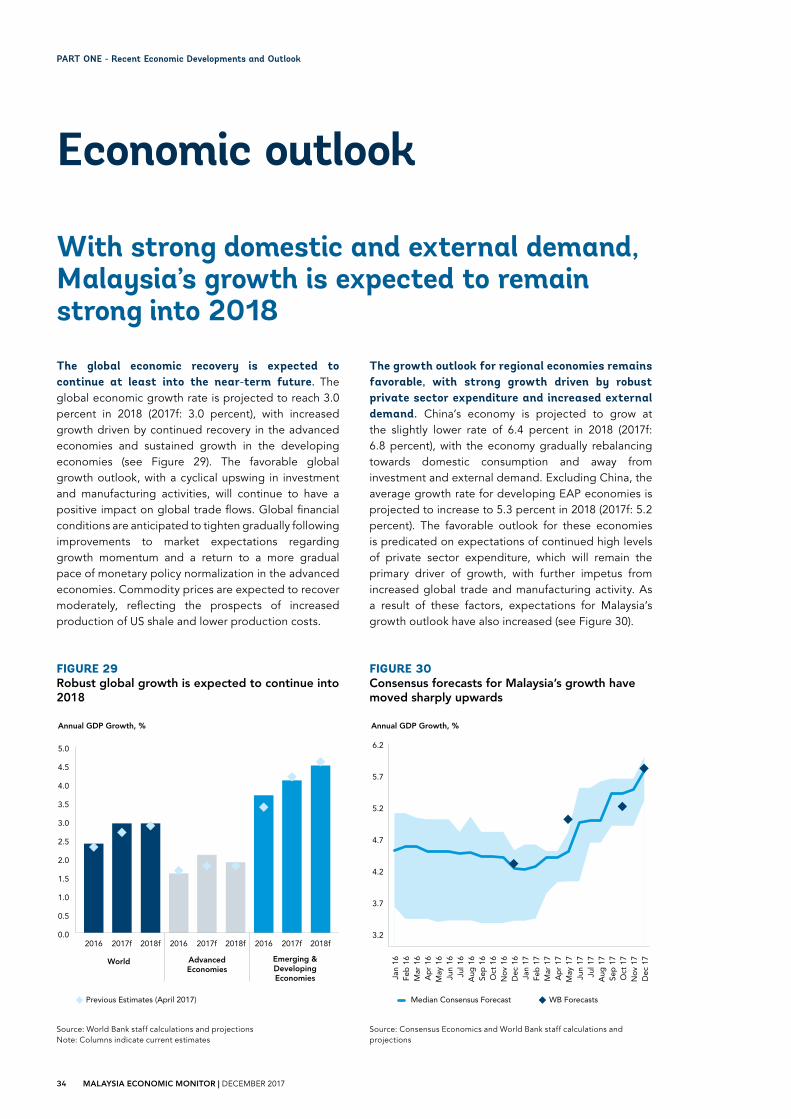
Economic outlook
The global economic recovery is expected to continue at least into the near-term future. The global economic growth rate is projected to reach 3.0 percent in 2018 (2017f: 3.0 percent), with increased growth driven by continued recovery in the advanced economies and sustained growth in the developing economies (see Figure 29). The favorable global growth outlook, with a cyclical upswing in investment and manufacturing activities, will continue to have a positive impact on global trade flows. Global financial conditions are anticipated to tighten gradually following improvements to market expectations regarding growth momentum and a return to a more gradual pace of monetary policy normalization in the advanced economies. Commodity prices are expected to recover moderately, reflecting the prospects of increased production of US shale and lower production costs.
The growth outlook for regional economies remains favorable, with strong growth driven by robust private sector expenditure and increased external demand. China’s economy is projected to grow at the slightly lower rate of 6.4 percent in 2018 (2017f: 6.8 percent), with the economy gradually rebalancing towards domestic consumption and away from investment and external demand. Excluding China, the average growth rate for developing EAP economies is projected to increase to 5.3 percent in 2018 (2017f: 5.2 percent). The favorable outlook for these economies is predicated on expectations of continued high levels of private sector expenditure, which will remain the primary driver of growth, with further impetus from increased global trade and manufacturing activity. As a result of these factors, expectations for Malaysia’s growth outlook have also increased (see Figure 30).
FIGURE 29Robust global growth is expected to continue into 2018
FIGURE 30Consensus forecasts for Malaysia’s growth have moved sharply upwards
Source: World Bank staff calculations and projectionsNote: Columns indicate current estimates
Source: Consensus Economics and World Bank staff calculations and projections
With strong domestic and external demand, Malaysia’s growth is expected to remain strong into 2018
Annual GDP Growth, %
2018f2017f20162018f2017f20162018f2017f20160.0
0.5
1.0
1.5
2.0
2.5
3.0
3.5
4.0
4.5
5.0
World AdvancedEconomies
Emerging &DevelopingEconomies
Previous Estimates (April 2017)
Annual GDP Growth, %
Median Consensus Forecast WB Forecasts
3.2
3.7
4.2
4.7
5.2
5.7
6.2
Jan
16Fe
b 1
6M
ar 1
6A
pr
16M
ay 1
6Ju
n 16
Jul 1
6A
ug 1
6Se
p 1
6O
ct 1
6N
ov
16D
ec 1
6Ja
n 17
Feb
17
Mar
17
Ap
r 17
May
17
Jun
17Ju
l 17
Aug
17
Sep
17
Oct
17
No
v 17
Dec
17
34 MALAYSIA ECONOMIC MONITOR | DECEMBER 2017
PART ONE - Recent Economic Developments and Outlook
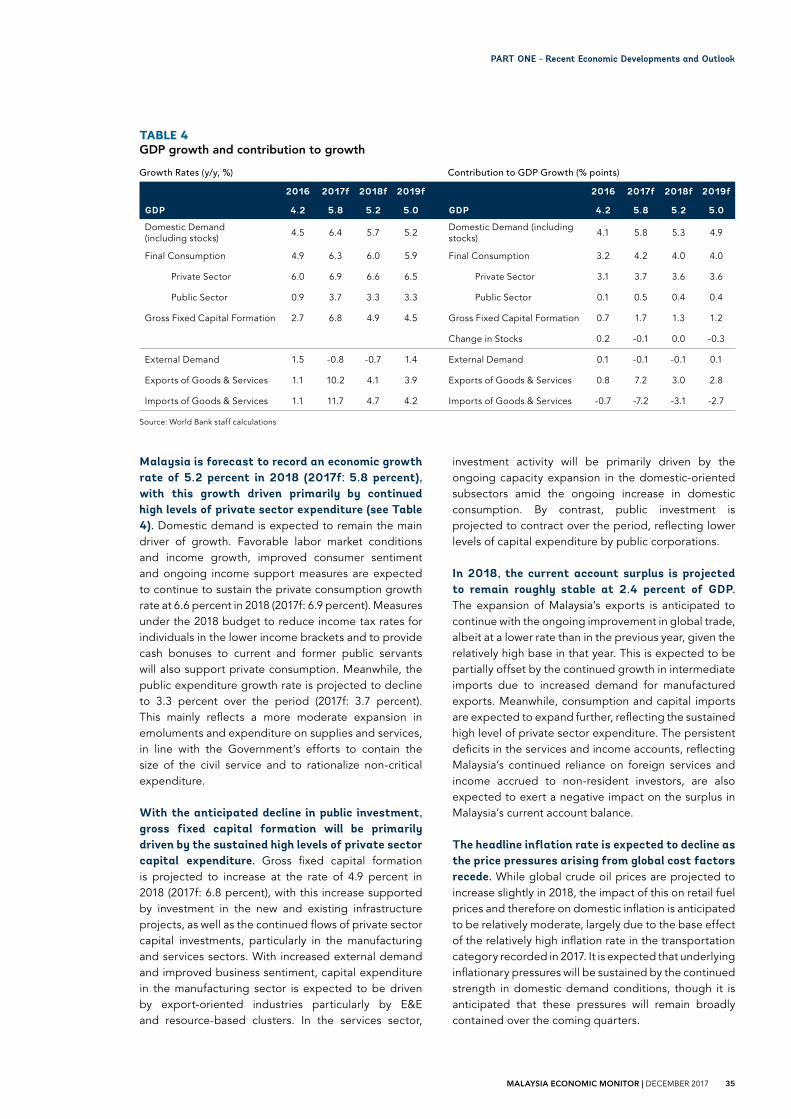
Malaysia is forecast to record an economic growth rate of 5.2 percent in 2018 (2017f: 5.8 percent), with this growth driven primarily by continued high levels of private sector expenditure (see Table 4). Domestic demand is expected to remain the main driver of growth. Favorable labor market conditions and income growth, improved consumer sentiment and ongoing income support measures are expected to continue to sustain the private consumption growth rate at 6.6 percent in 2018 (2017f: 6.9 percent). Measures under the 2018 budget to reduce income tax rates for individuals in the lower income brackets and to provide cash bonuses to current and former public servants will also support private consumption. Meanwhile, the public expenditure growth rate is projected to decline to 3.3 percent over the period (2017f: 3.7 percent). This mainly reflects a more moderate expansion in emoluments and expenditure on supplies and services, in line with the Government’s efforts to contain the size of the civil service and to rationalize non-critical expenditure.
With the anticipated decline in public investment, gross fixed capital formation will be primarily driven by the sustained high levels of private sector capital expenditure. Gross fixed capital formation is projected to increase at the rate of 4.9 percent in 2018 (2017f: 6.8 percent), with this increase supported by investment in the new and existing infrastructure projects, as well as the continued flows of private sector capital investments, particularly in the manufacturing and services sectors. With increased external demand and improved business sentiment, capital expenditure in the manufacturing sector is expected to be driven by export-oriented industries particularly by E&E and resource-based clusters. In the services sector,
TABLE 4GDP growth and contribution to growth
Source: World Bank staff calculations
2016 2017f 2018f 2019f 2016 2017f 2018f 2019f
GDP 4.2 5.8 5.2 5.0 GDP 4.2 5.8 5.2 5.0
Domestic Demand(including stocks) 4.5 6.4 5.7 5.2 Domestic Demand (including
stocks) 4.1 5.8 5.3 4.9
Final Consumption 4.9 6.3 6.0 5.9 Final Consumption 3.2 4.2 4.0 4.0
Private Sector 6.0 6.9 6.6 6.5 Private Sector 3.1 3.7 3.6 3.6
Public Sector 0.9 3.7 3.3 3.3 Public Sector 0.1 0.5 0.4 0.4
Gross Fixed Capital Formation 2.7 6.8 4.9 4.5 Gross Fixed Capital Formation 0.7 1.7 1.3 1.2
Change in Stocks 0.2 -0.1 0.0 -0.3
External Demand 1.5 -0.8 -0.7 1.4 External Demand 0.1 -0.1 -0.1 0.1
Exports of Goods & Services 1.1 10.2 4.1 3.9 Exports of Goods & Services 0.8 7.2 3.0 2.8
Imports of Goods & Services 1.1 11.7 4.7 4.2 Imports of Goods & Services -0.7 -7.2 -3.1 -2.7
Growth Rates (y/y, %) Contribution to GDP Growth (% points)
investment activity will be primarily driven by the ongoing capacity expansion in the domestic-oriented subsectors amid the ongoing increase in domestic consumption. By contrast, public investment is projected to contract over the period, reflecting lower levels of capital expenditure by public corporations.
In 2018, the current account surplus is projected to remain roughly stable at 2.4 percent of GDP. The expansion of Malaysia’s exports is anticipated to continue with the ongoing improvement in global trade, albeit at a lower rate than in the previous year, given the relatively high base in that year. This is expected to be partially offset by the continued growth in intermediate imports due to increased demand for manufactured exports. Meanwhile, consumption and capital imports are expected to expand further, reflecting the sustained high level of private sector expenditure. The persistent deficits in the services and income accounts, reflecting Malaysia’s continued reliance on foreign services and income accrued to non-resident investors, are also expected to exert a negative impact on the surplus in Malaysia’s current account balance.
The headline inflation rate is expected to decline as the price pressures arising from global cost factors recede. While global crude oil prices are projected to increase slightly in 2018, the impact of this on retail fuel prices and therefore on domestic inflation is anticipated to be relatively moderate, largely due to the base effect of the relatively high inflation rate in the transportation category recorded in 2017. It is expected that underlying inflationary pressures will be sustained by the continued strength in domestic demand conditions, though it is anticipated that these pressures will remain broadly contained over the coming quarters.
35MALAYSIA ECONOMIC MONITOR | DECEMBER 2017
PART ONE - Recent Economic Developments and Outlook
Risks relate primarily to unforeseen changes in the external environmentMalaysia‘s economy continues to face risks related to uncertainty in the external environment. In particular, the growing shift towards protectionism could have a dampening effect on global trade and investment flows, with disproportionate adverse spillovers on Malaysia, given its high level of integration with the global economy and financial markets. Within the developing EAP, heightened geopolitical risks, mainly related to an increase in tensions in the Korean peninsula, could have severe economic implications for regional economies if these tensions escalate. Other significant downside risks include a disorderly adjustment to global financial market conditions, weaker-than-anticipated growth by Malaysia‘s major trading partners, including China, and/or renewed decline in global commodity prices and export demand if cyclical factors diminish. Conversely, a stronger-than-expected recovery in the advanced and emerging market economies could lead to continued strong demand for Malaysia’s exports.
On the domestic front, downside risks to growth relate mainly to the relatively high level of household and public-sector debt. Despite a recent decline, Malaysia’s high level of household debt in proportion to GDP in the context of persistent property market imbalances continues to pose a risk to the maintenance of macroeconomic and financial stability. This could also have an impact on private consumption if prices increase, particularly as domestic financial conditions are likely to tighten as a result of BNM’s monetary policy normalization measures. In terms of public sector debt, while the level of Federal Government debt has declined over the recent years, contingent federal liabilities remains relatively high, presenting a potential source of medium-term fiscal risks. Lastly, political uncertainties related to Malaysia’s upcoming general election, which is scheduled to be held by August 2018, may lead to some near-term financial market volatility.
A strengthening economy offers an opportunity to focus on structural reforms for the transition to a high-income economyMalaysia’s stronger-than-expected growth creates opportunities for the Government to increase its initiatives to address the deeper structural challenges that limit the economy’s growth potential. With both strong domestic and external demand, Malaysia’s economic rebound has helped to close the negative output gap and its output is now close to the economy’s potential output level.
A strong growth environment, therefore, offers a crucial window of opportunity to accelerate structural reforms that will facilitate Malaysia’s transition towards the achievement of high-income status in the coming years. Simulations suggest that Malaysia will likely pass the high-income threshold between 2020 and 2024 (see Box 4). However, while per capita income is a useful proxy for economic well-being, there are many additional dimensions of development that will also need to be taken into account.
A key area of policy focus are measures to increase productivity growth and to strengthen competitiveness, as Malaysia faces diminishing
returns from its factor-accumulation-led growth model. Reforms to enhance productivity could be intensified to address the key constraints, such as a lack of competition in key markets and critical human capital and skills deficits. While Malaysia’s increased fiscal space creates opportunities to increase its investment in these areas, it is important to recognize that in many areas, particularly in the areas of education and training, the challenge relates as much to the quality of spending as to the quantity.
It is also important for Malaysia to continue to implement measures to ensure that growth is inclusive and provides access to opportunities for all its citizens. While Malaysia has achieved good progress in sustaining economic growth and reducing poverty over the past years, there remain concerns regarding the distribution of economic gains and perceived inequality of opportunity. In particular, the income share of households in the bottom 40 percent (B40) fell from 16.8 percent in 2014 to 16.4 percent in 2016–171, after having increased steadily from 13.5 percent since 2004.
1 The threshold value of the B40 households increased from RM 3,860 in 2014 to RM 4,360 in 2016 – 2017.
36 MALAYSIA ECONOMIC MONITOR | DECEMBER 2017
PART ONE - Recent Economic Developments and Outlook
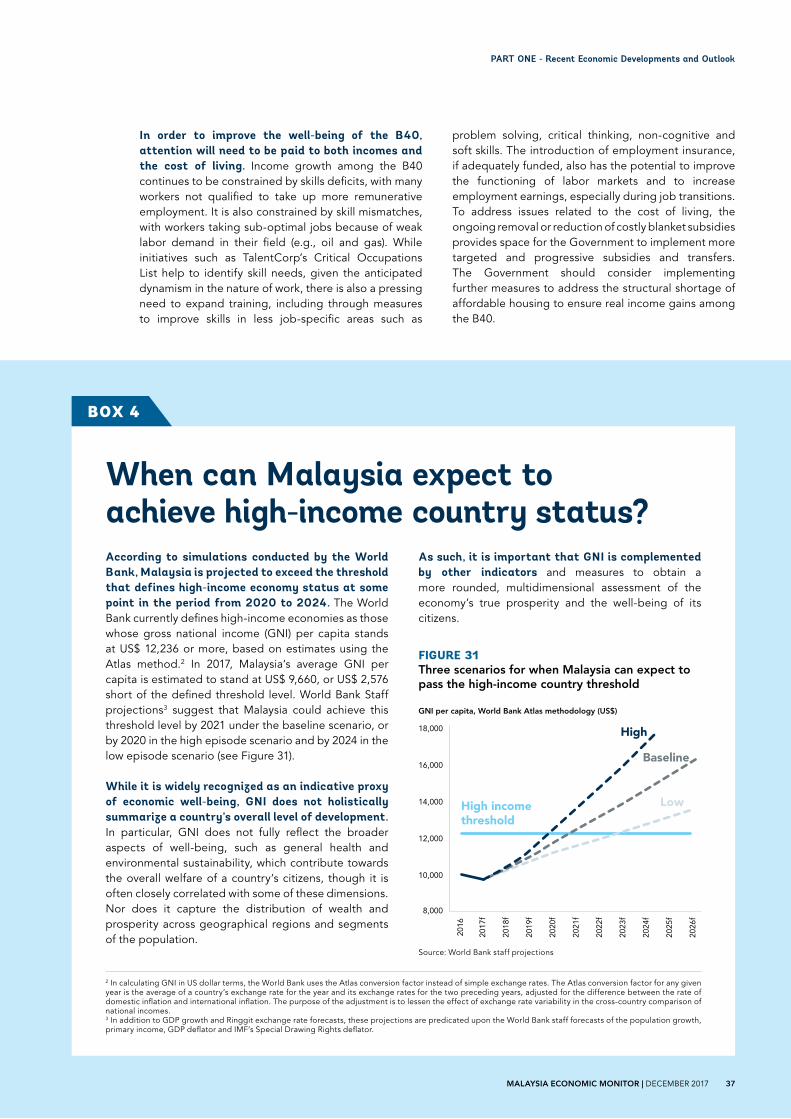
GNI per capita, World Bank Atlas methodology (US$)
8,000
10,000
12,000
14,000
16,000
18,000
2016
2017
f
2018
f
2019
f
2020
f
2021
f
2022
f
2023
f
2024
f
2025
f
2026
f
High
Baseline
High income threshold
Low
In order to improve the well-being of the B40, attention will need to be paid to both incomes and the cost of living. Income growth among the B40 continues to be constrained by skills deficits, with many workers not qualified to take up more remunerative employment. It is also constrained by skill mismatches, with workers taking sub-optimal jobs because of weak labor demand in their field (e.g., oil and gas). While initiatives such as TalentCorp’s Critical Occupations List help to identify skill needs, given the anticipated dynamism in the nature of work, there is also a pressing need to expand training, including through measures to improve skills in less job-specific areas such as
problem solving, critical thinking, non-cognitive and soft skills. The introduction of employment insurance, if adequately funded, also has the potential to improve the functioning of labor markets and to increase employment earnings, especially during job transitions. To address issues related to the cost of living, the ongoing removal or reduction of costly blanket subsidies provides space for the Government to implement more targeted and progressive subsidies and transfers. The Government should consider implementing further measures to address the structural shortage of affordable housing to ensure real income gains among the B40.
When can Malaysia expect to achieve high-income country status?
BOX 4
According to simulations conducted by the World Bank, Malaysia is projected to exceed the threshold that defines high-income economy status at some point in the period from 2020 to 2024. The World Bank currently defines high-income economies as those whose gross national income (GNI) per capita stands at US$ 12,236 or more, based on estimates using the Atlas method.2 In 2017, Malaysia‘s average GNI per capita is estimated to stand at US$ 9,660, or US$ 2,576 short of the defined threshold level. World Bank Staff projections3 suggest that Malaysia could achieve this threshold level by 2021 under the baseline scenario, or by 2020 in the high episode scenario and by 2024 in the low episode scenario (see Figure 31).
While it is widely recognized as an indicative proxy of economic well-being, GNI does not holistically summarize a country’s overall level of development. In particular, GNI does not fully reflect the broader aspects of well-being, such as general health and environmental sustainability, which contribute towards the overall welfare of a country’s citizens, though it is often closely correlated with some of these dimensions. Nor does it capture the distribution of wealth and prosperity across geographical regions and segments of the population.
As such, it is important that GNI is complemented by other indicators and measures to obtain a more rounded, multidimensional assessment of the economy’s true prosperity and the well-being of its citizens.
FIGURE 31Three scenarios for when Malaysia can expect to pass the high-income country threshold
Source: World Bank staff projections
2 In calculating GNI in US dollar terms, the World Bank uses the Atlas conversion factor instead of simple exchange rates. The Atlas conversion factor for any given year is the average of a country’s exchange rate for the year and its exchange rates for the two preceding years, adjusted for the difference between the rate of domestic inflation and international inflation. The purpose of the adjustment is to lessen the effect of exchange rate variability in the cross-country comparison of national incomes. 3 In addition to GDP growth and Ringgit exchange rate forecasts, these projections are predicated upon the World Bank staff forecasts of the population growth, primary income, GDP deflator and IMF’s Special Drawing Rights deflator.
37MALAYSIA ECONOMIC MONITOR | DECEMBER 2017
PART ONE - Recent Economic Developments and Outlook
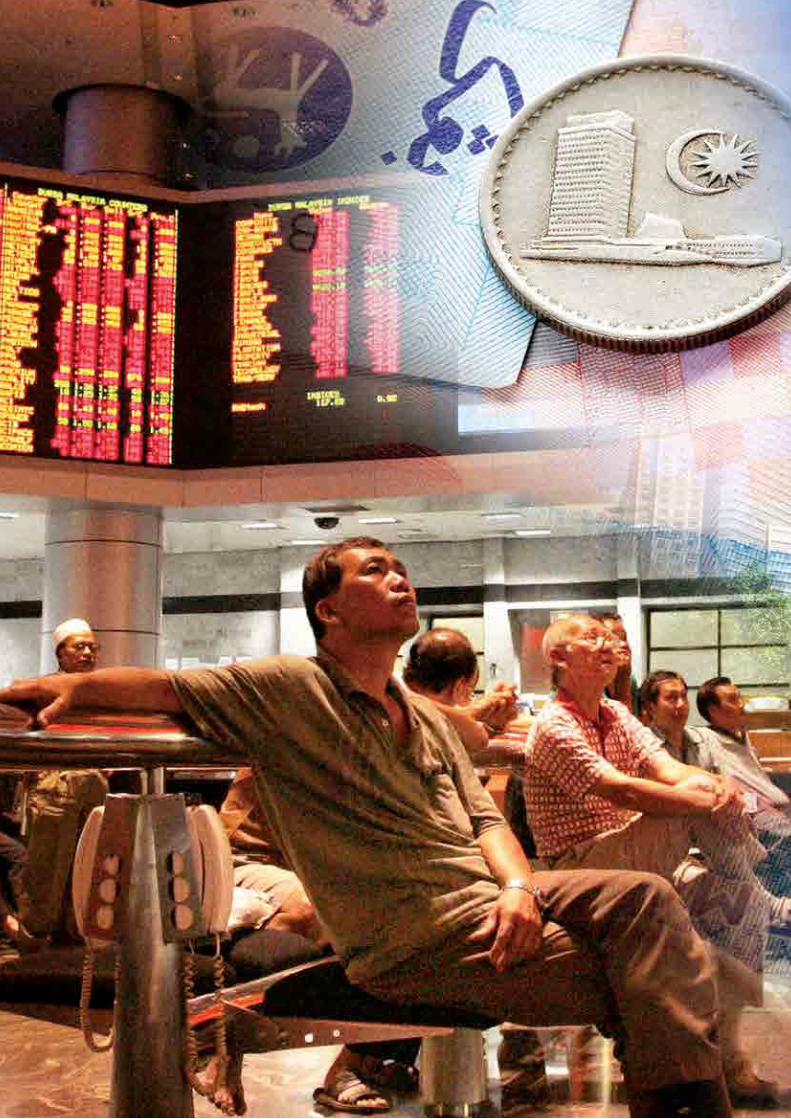
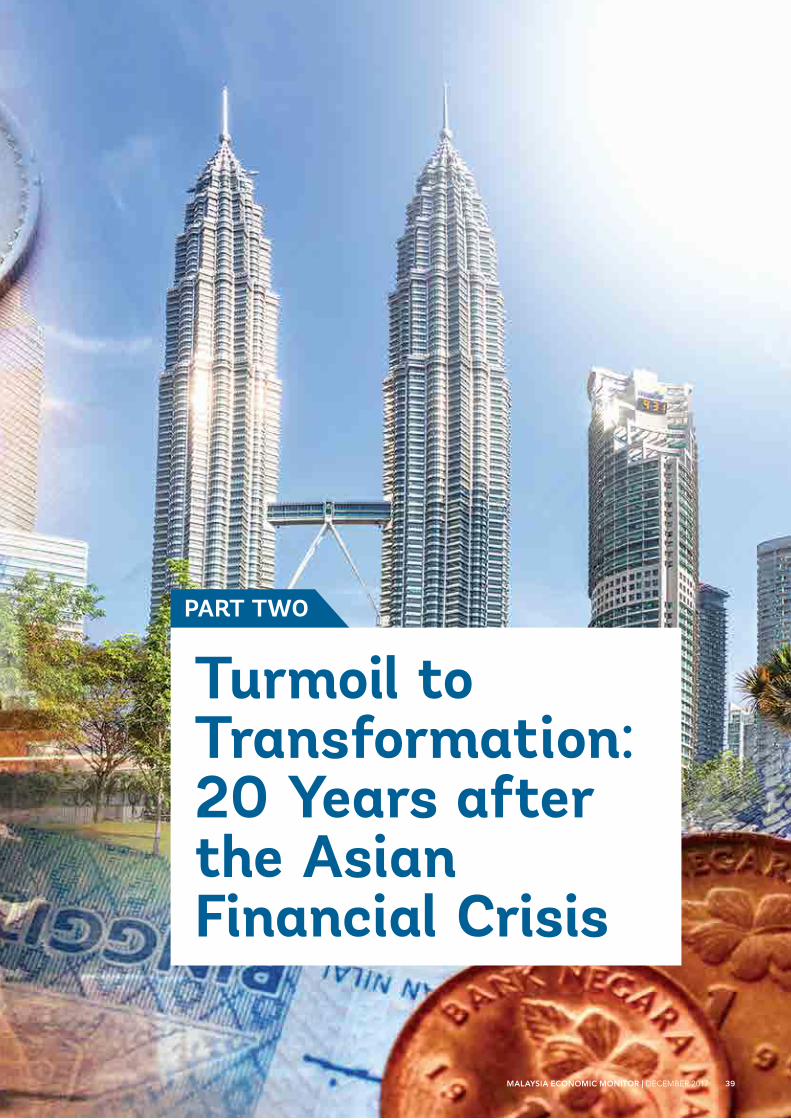
PART TWO
Turmoil to Transformation:20 Years after the Asian Financial Crisis
39MALAYSIA ECONOMIC MONITOR | DECEMBER 2017
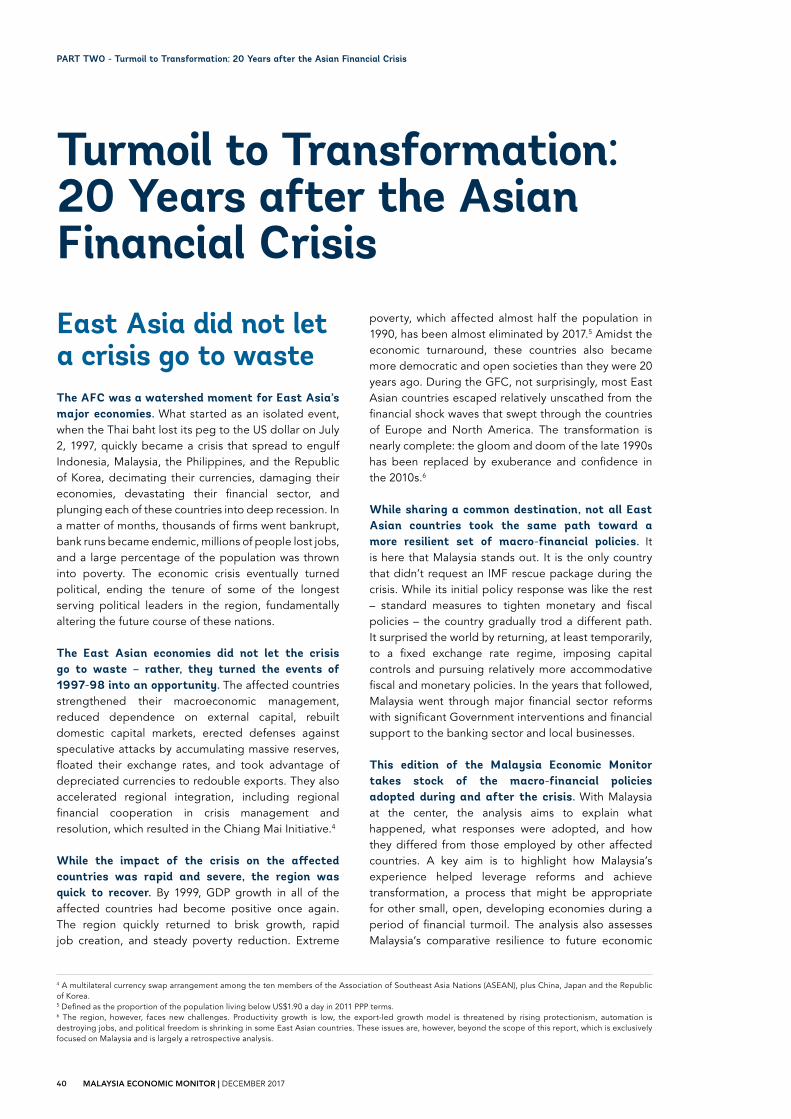
East Asia did not let a crisis go to waste
Turmoil to Transformation:20 Years after the Asian Financial Crisis
The AFC was a watershed moment for East Asia’s major economies. What started as an isolated event, when the Thai baht lost its peg to the US dollar on July 2, 1997, quickly became a crisis that spread to engulf Indonesia, Malaysia, the Philippines, and the Republic of Korea, decimating their currencies, damaging their economies, devastating their financial sector, and plunging each of these countries into deep recession. In a matter of months, thousands of firms went bankrupt, bank runs became endemic, millions of people lost jobs, and a large percentage of the population was thrown into poverty. The economic crisis eventually turned political, ending the tenure of some of the longest serving political leaders in the region, fundamentally altering the future course of these nations.
The East Asian economies did not let the crisis go to waste – rather, they turned the events of 1997-98 into an opportunity. The affected countries strengthened their macroeconomic management, reduced dependence on external capital, rebuilt domestic capital markets, erected defenses against speculative attacks by accumulating massive reserves, floated their exchange rates, and took advantage of depreciated currencies to redouble exports. They also accelerated regional integration, including regional financial cooperation in crisis management and resolution, which resulted in the Chiang Mai Initiative.4
While the impact of the crisis on the affected countries was rapid and severe, the region was quick to recover. By 1999, GDP growth in all of the affected countries had become positive once again. The region quickly returned to brisk growth, rapid job creation, and steady poverty reduction. Extreme
poverty, which affected almost half the population in 1990, has been almost eliminated by 2017.5 Amidst the economic turnaround, these countries also became more democratic and open societies than they were 20 years ago. During the GFC, not surprisingly, most East Asian countries escaped relatively unscathed from the financial shock waves that swept through the countries of Europe and North America. The transformation is nearly complete: the gloom and doom of the late 1990s has been replaced by exuberance and confidence in the 2010s.6
While sharing a common destination, not all East Asian countries took the same path toward a more resilient set of macro-financial policies. It is here that Malaysia stands out. It is the only country that didn’t request an IMF rescue package during the crisis. While its initial policy response was like the rest – standard measures to tighten monetary and fiscal policies – the country gradually trod a different path. It surprised the world by returning, at least temporarily, to a fixed exchange rate regime, imposing capital controls and pursuing relatively more accommodative fiscal and monetary policies. In the years that followed, Malaysia went through major financial sector reforms with significant Government interventions and financial support to the banking sector and local businesses.
This edition of the Malaysia Economic Monitor takes stock of the macro-financial policies adopted during and after the crisis. With Malaysia at the center, the analysis aims to explain what happened, what responses were adopted, and how they differed from those employed by other affected countries. A key aim is to highlight how Malaysia’s experience helped leverage reforms and achieve transformation, a process that might be appropriate for other small, open, developing economies during a period of financial turmoil. The analysis also assesses Malaysia’s comparative resilience to future economic
4 A multilateral currency swap arrangement among the ten members of the Association of Southeast Asia Nations (ASEAN), plus China, Japan and the Republic of Korea. 5 Defined as the proportion of the population living below US$1.90 a day in 2011 PPP terms.6 The region, however, faces new challenges. Productivity growth is low, the export-led growth model is threatened by rising protectionism, automation is destroying jobs, and political freedom is shrinking in some East Asian countries. These issues are, however, beyond the scope of this report, which is exclusively focused on Malaysia and is largely a retrospective analysis.
40 MALAYSIA ECONOMIC MONITOR | DECEMBER 2017
PART TWO - Turmoil to Transformation: 20 Years after the Asian Financial Crisis
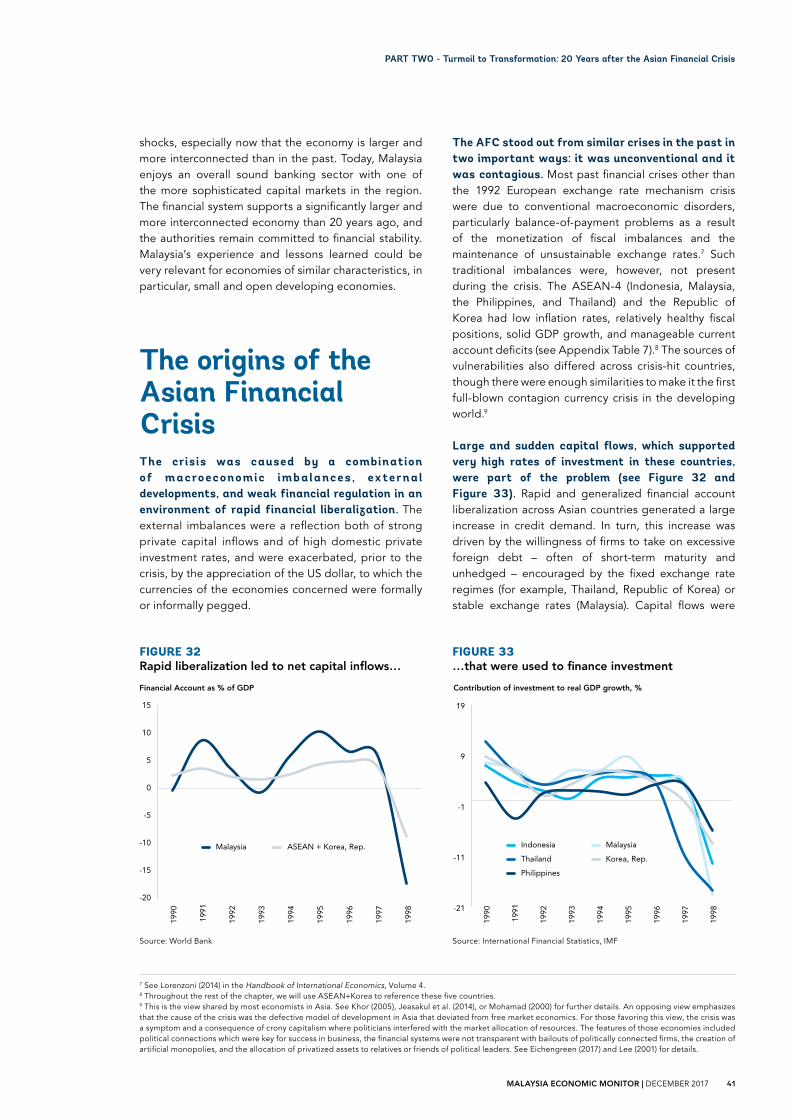
The origins of the Asian Financial CrisisThe crisis was caused by a combination of macroeconomic imbalances , externa l developments, and weak financial regulation in an environment of rapid financial liberalization. The external imbalances were a reflection both of strong private capital inflows and of high domestic private investment rates, and were exacerbated, prior to the crisis, by the appreciation of the US dollar, to which the currencies of the economies concerned were formally or informally pegged.
The AFC stood out from similar crises in the past in two important ways: it was unconventional and it was contagious. Most past financial crises other than the 1992 European exchange rate mechanism crisis were due to conventional macroeconomic disorders, particularly balance-of-payment problems as a result of the monetization of fiscal imbalances and the maintenance of unsustainable exchange rates.7 Such traditional imbalances were, however, not present during the crisis. The ASEAN-4 (Indonesia, Malaysia, the Philippines, and Thailand) and the Republic of Korea had low inflation rates, relatively healthy fiscal positions, solid GDP growth, and manageable current account deficits (see Appendix Table 7).8 The sources of vulnerabilities also differed across crisis-hit countries, though there were enough similarities to make it the first full-blown contagion currency crisis in the developing world.9
Large and sudden capital flows, which supported very high rates of investment in these countries, were part of the problem (see Figure 32 and Figure 33). Rapid and generalized financial account liberalization across Asian countries generated a large increase in credit demand. In turn, this increase was driven by the willingness of firms to take on excessive foreign debt – often of short-term maturity and unhedged – encouraged by the fixed exchange rate regimes (for example, Thailand, Republic of Korea) or stable exchange rates (Malaysia). Capital flows were
FIGURE 32Rapid liberalization led to net capital inflows…
FIGURE 33…that were used to finance investment
Source: International Financial Statistics, IMFSource: World Bank
shocks, especially now that the economy is larger and more interconnected than in the past. Today, Malaysia enjoys an overall sound banking sector with one of the more sophisticated capital markets in the region. The financial system supports a significantly larger and more interconnected economy than 20 years ago, and the authorities remain committed to financial stability. Malaysia’s experience and lessons learned could be very relevant for economies of similar characteristics, in particular, small and open developing economies.
7 See Lorenzoni (2014) in the Handbook of International Economics, Volume 4.8 Throughout the rest of the chapter, we will use ASEAN+Korea to reference these five countries.9 This is the view shared by most economists in Asia. See Khor (2005), Jeasakul et al. (2014), or Mohamad (2000) for further details. An opposing view emphasizes that the cause of the crisis was the defective model of development in Asia that deviated from free market economics. For those favoring this view, the crisis was a symptom and a consequence of crony capitalism where politicians interfered with the market allocation of resources. The features of those economies included political connections which were key for success in business, the financial systems were not transparent with bailouts of politically connected firms, the creation of artificial monopolies, and the allocation of privatized assets to relatives or friends of political leaders. See Eichengreen (2017) and Lee (2001) for details.
Financial Account as % of GDP
-20
-15
-10
-5
0
5
10
15
1990
1991
1992
1993
1994
1995
1996
1997
1998
Malaysia ASEAN + Korea, Rep.
1990
1991
1992
1993
1994
1995
1996
1997
1998
Contribution of investment to real GDP growth, %
-21
-11
-1
9
19
Indonesia Malaysia
Thailand Korea, Rep.
Philippines
41MALAYSIA ECONOMIC MONITOR | DECEMBER 2017
PART TWO - Turmoil to Transformation: 20 Years after the Asian Financial Crisis
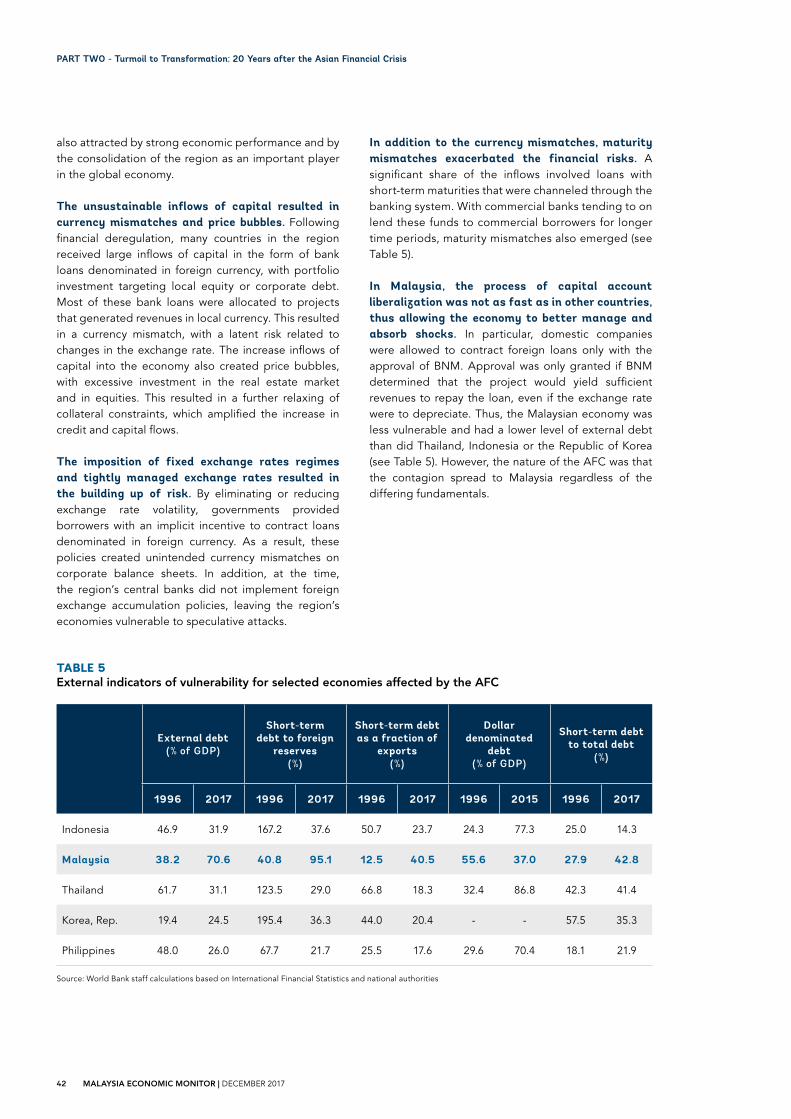
also attracted by strong economic performance and by the consolidation of the region as an important player in the global economy.
The unsustainable inflows of capital resulted in currency mismatches and price bubbles. Following financial deregulation, many countries in the region received large inflows of capital in the form of bank loans denominated in foreign currency, with portfolio investment targeting local equity or corporate debt. Most of these bank loans were allocated to projects that generated revenues in local currency. This resulted in a currency mismatch, with a latent risk related to changes in the exchange rate. The increase inflows of capital into the economy also created price bubbles, with excessive investment in the real estate market and in equities. This resulted in a further relaxing of collateral constraints, which amplified the increase in credit and capital flows.
The imposition of fixed exchange rates regimes and tightly managed exchange rates resulted in the building up of risk. By eliminating or reducing exchange rate volatility, governments provided borrowers with an implicit incentive to contract loans denominated in foreign currency. As a result, these policies created unintended currency mismatches on corporate balance sheets. In addition, at the time, the region’s central banks did not implement foreign exchange accumulation policies, leaving the region’s economies vulnerable to speculative attacks.
In addition to the currency mismatches, maturity mismatches exacerbated the financial risks. A significant share of the inflows involved loans with short-term maturities that were channeled through the banking system. With commercial banks tending to on lend these funds to commercial borrowers for longer time periods, maturity mismatches also emerged (see Table 5).
In Malaysia, the process of capital account liberalization was not as fast as in other countries, thus allowing the economy to better manage and absorb shocks. In particular, domestic companies were allowed to contract foreign loans only with the approval of BNM. Approval was only granted if BNM determined that the project would yield sufficient revenues to repay the loan, even if the exchange rate were to depreciate. Thus, the Malaysian economy was less vulnerable and had a lower level of external debt than did Thailand, Indonesia or the Republic of Korea (see Table 5). However, the nature of the AFC was that the contagion spread to Malaysia regardless of the differing fundamentals.
TABLE 5External indicators of vulnerability for selected economies affected by the AFC
Source: World Bank staff calculations based on International Financial Statistics and national authorities
External debt(% of GDP)
Short-term debt to foreign
reserves(%)
Short-term debt as a fraction of
exports(%)
Dollar denominated
debt(% of GDP)
Short-term debt to total debt
(%)
1996 2017 1996 2017 1996 2017 1996 2015 1996 2017
Indonesia 46.9 31.9 167.2 37.6 50.7 23.7 24.3 77.3 25.0 14.3
Malaysia 38.2 70.6 40.8 95.1 12.5 40.5 55.6 37.0 27.9 42.8
Thailand 61.7 31.1 123.5 29.0 66.8 18.3 32.4 86.8 42.3 41.4
Korea, Rep. 19.4 24.5 195.4 36.3 44.0 20.4 - - 57.5 35.3
Philippines 48.0 26.0 67.7 21.7 25.5 17.6 29.6 70.4 18.1 21.9
42 MALAYSIA ECONOMIC MONITOR | DECEMBER 2017
PART TWO - Turmoil to Transformation: 20 Years after the Asian Financial Crisis
How Malaysia’s response differed to other affected countries
Malaysia’s initial response to the crisis was similar to that of other affected countries. As the external debt situation was much less challenging than in other affected countries, Malaysia could choose whether or not to participate in an IMF supported program. Nevertheless, the Government initially responded to the Crisis by taking steps consistent with conventional economic wisdom at the time. In particular, Malaysia implemented the following measures: (i) increasing interest rates in order to contain the outflow of capital, combined with the imposition of a tight monetary policy; (ii) making fiscal adjustments to reduce Government expenditure; (iii) allowing the currency to float with minimal intervention; (iv) liberalizing the capital account; and (v) tightening credit reporting requirements, with a reduction in the number of months for a loan to be in arrears to be classified as non-performing (from six months to three months), resulting in a reduction in credit flows to the real economy. The objective of these measures was to restore investor confidence in the Malaysian economy and to restrain the capital outflows.
However, Malaysia’s implementation of these measures did not produce the intended results. In particular, the increased interest rates resulted in a credit crunch that particularly affected small and medium sized firms and that generally sapped the strength of Malaysia’s private sector. This undermined the prospects of a recovery, including in export-orientated businesses. As a result, the economy contracted by 7.4 percent in real terms, with a sharp decline in investment and private consumption. With the tightening of public expenditure, the Government announced a three percent surplus to the 1998 budget. The stock market lost 60 percent of its value and the ringgit depreciated sharply as a result of market speculation. By the beginning of 1998, it had become clear that far from facilitating recovery, the adopted policies were hurting the economy. Confidence continued to decline and the credit crunch exacted a heavy toll on the private sector, resulting in loss of employment and a fall in living standards. It became clear that a new approach was needed. Importantly, Malaysia’s differing fundamentals, including the relatively lower level of foreign debt and larger reserve coverage, meant that the country was able to consider a different set of policy responses to
the crisis compared to other affected countries.
The establishment of new coordinating institutions helped ensure streamlined decision making and timely policy responses as the crisis evolved, allowing for course corrections once it became clear that the initial response was not working. In January 1998, a National Economic Action Council was established. The Council was chaired by the Prime Minister and took responsibility for implementing a series of stabilization measures over the following six months. Following the implementation of these measures, in July 1998, the National Economic Recovery Plan was announced. This plan was intended to restore market confidence, to facilitate the restructuring of corporate debt, to recapitalize and restructure the banking sector, to stabilize the ringgit and to stimulate the economy through counter-cyclical fiscal and monetary policies.
To stimulate an economic recovery, BNM changed its approach and implemented a series of expansionary measures. First, the BNM gradually reduced interest rates, with these rates going down from 11 percent in July 1998 to 5.5 percent in August 1999. Second, the monetary authorities reduced reserve requirements to increase liquidity in the financial system, with the reserve requirement being reduced from 13.5 percent in February 1998 to four percent by September of that year. Also, to revitalize the credit market, BNM established targets for banks to achieve a minimum loan growth rate of eight percent for 1998. Finally, to increase the banking sector’s flexibility to operate in the stressed market, BNM reversed the decision it had initially made related to the definition of non-performing loans, when it had reduced the number of months for a loan to be in arrears to be classified as non-performing from six months to three months.
To support economic recovery, the Government also implemented an expansionary fiscal policy, synchronized with the accommodative monetary policy stance. In order to revitalize the economy and to restore confidence, the Government implemented a counter-cyclical fiscal policy that included both tax incentives and investments in infrastructure. In July 1998, the Government launched a fiscal stimulus package that implied a reduction in the fiscal balance by 4.2 percentage points, going from a surplus of 2.4 percent of GDP in 1997 to a deficit of 1.8 percent in 1998. By 1999, with the economic situation demanding increased efforts from the treasury, the fiscal budget was increased to 3.2 percent of GDP (see Figure 34 and Figure 35). In short, Malaysia adopted a much more aggressive fiscal response to the crisis than did the other crisis-affected countries.
43MALAYSIA ECONOMIC MONITOR | DECEMBER 2017
PART TWO - Turmoil to Transformation: 20 Years after the Asian Financial Crisis
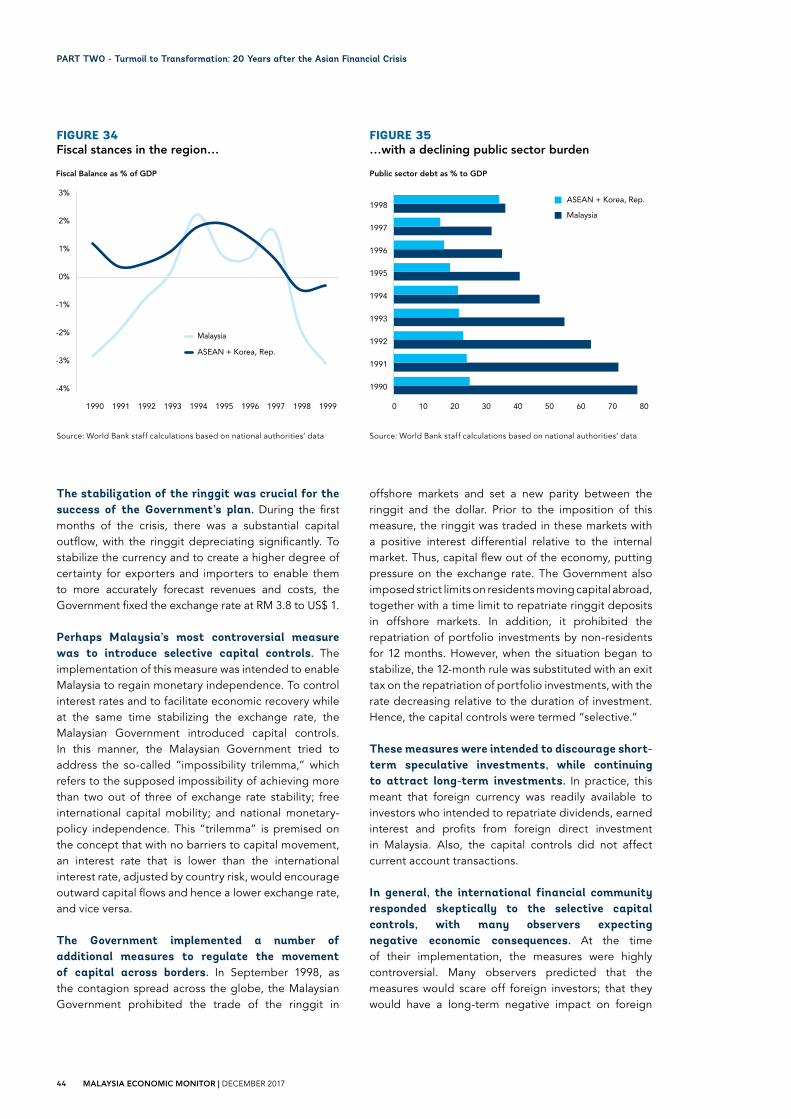
FIGURE 34Fiscal stances in the region…
FIGURE 35…with a declining public sector burden
Source: World Bank staff calculations based on national authorities’ dataSource: World Bank staff calculations based on national authorities’ data
The stabilization of the ringgit was crucial for the success of the Government’s plan. During the first months of the crisis, there was a substantial capital outflow, with the ringgit depreciating significantly. To stabilize the currency and to create a higher degree of certainty for exporters and importers to enable them to more accurately forecast revenues and costs, the Government fixed the exchange rate at RM 3.8 to US$ 1.
Perhaps Malaysia’s most controversial measure was to introduce selective capital controls. The implementation of this measure was intended to enable Malaysia to regain monetary independence. To control interest rates and to facilitate economic recovery while at the same time stabilizing the exchange rate, the Malaysian Government introduced capital controls. In this manner, the Malaysian Government tried to address the so-called “impossibility trilemma,” which refers to the supposed impossibility of achieving more than two out of three of exchange rate stability; free international capital mobility; and national monetary-policy independence. This “trilemma” is premised on the concept that with no barriers to capital movement, an interest rate that is lower than the international interest rate, adjusted by country risk, would encourage outward capital flows and hence a lower exchange rate, and vice versa.
The Government implemented a number of additional measures to regulate the movement of capital across borders. In September 1998, as the contagion spread across the globe, the Malaysian Government prohibited the trade of the ringgit in
offshore markets and set a new parity between the ringgit and the dollar. Prior to the imposition of this measure, the ringgit was traded in these markets with a positive interest differential relative to the internal market. Thus, capital flew out of the economy, putting pressure on the exchange rate. The Government also imposed strict limits on residents moving capital abroad, together with a time limit to repatriate ringgit deposits in offshore markets. In addition, it prohibited the repatriation of portfolio investments by non-residents for 12 months. However, when the situation began to stabilize, the 12-month rule was substituted with an exit tax on the repatriation of portfolio investments, with the rate decreasing relative to the duration of investment. Hence, the capital controls were termed “selective.”
These measures were intended to discourage short-term speculative investments, while continuing to attract long-term investments. In practice, this meant that foreign currency was readily available to investors who intended to repatriate dividends, earned interest and profits from foreign direct investment in Malaysia. Also, the capital controls did not affect current account transactions.
In general, the international financial community responded skeptically to the selective capital controls, with many observers expecting negative economic consequences. At the time of their implementation, the measures were highly controversial. Many observers predicted that the measures would scare off foreign investors; that they would have a long-term negative impact on foreign
-4%
-3%
-2%
-1%
0%
1%
2%
3%
1990 1991 1992 1993 1994 1995 1996 1997 1998 1999
Malaysia
ASEAN + Korea, Rep.
Fiscal Balance as % of GDP
0 10 20 30 40 50 60 70 80
1990
1991
1992
1993
1994
1995
1996
1997
1998
Public sector debt as % to GDP
ASEAN + Korea, Rep.
Malaysia
44 MALAYSIA ECONOMIC MONITOR | DECEMBER 2017
PART TWO - Turmoil to Transformation: 20 Years after the Asian Financial Crisis
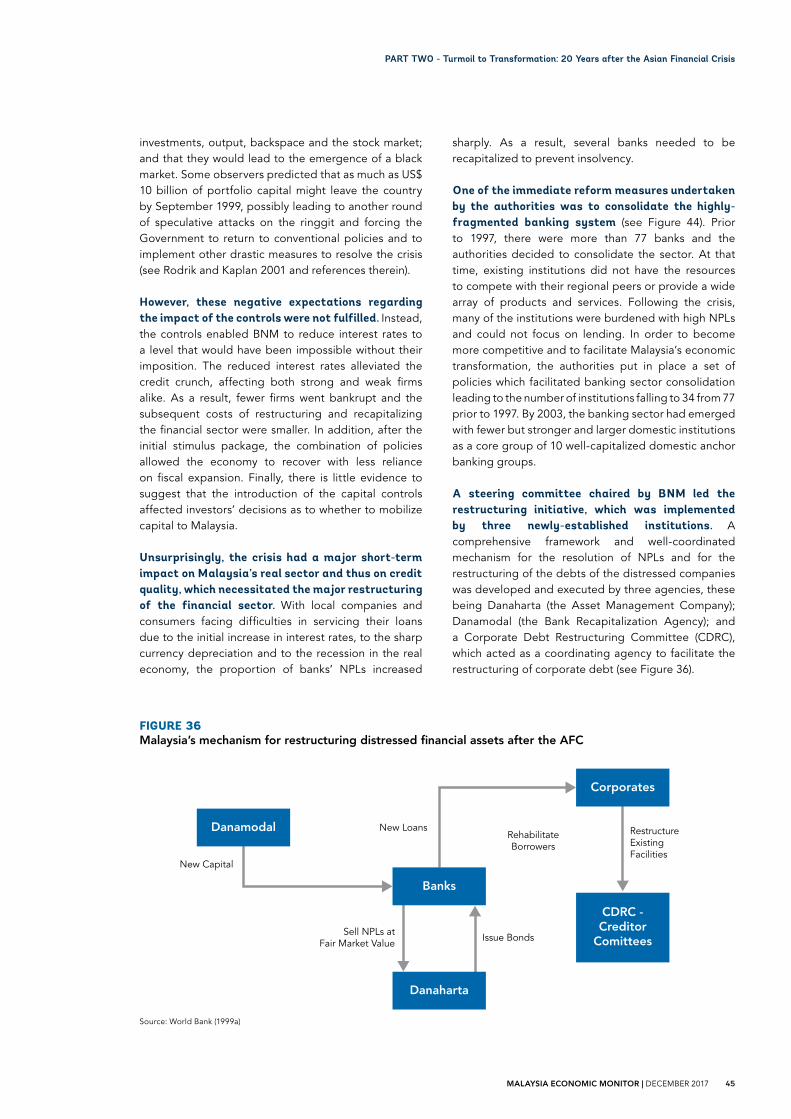
investments, output, backspace and the stock market; and that they would lead to the emergence of a black market. Some observers predicted that as much as US$ 10 billion of portfolio capital might leave the country by September 1999, possibly leading to another round of speculative attacks on the ringgit and forcing the Government to return to conventional policies and to implement other drastic measures to resolve the crisis (see Rodrik and Kaplan 2001 and references therein).
However, these negative expectations regarding the impact of the controls were not fulfilled. Instead, the controls enabled BNM to reduce interest rates to a level that would have been impossible without their imposition. The reduced interest rates alleviated the credit crunch, affecting both strong and weak firms alike. As a result, fewer firms went bankrupt and the subsequent costs of restructuring and recapitalizing the financial sector were smaller. In addition, after the initial stimulus package, the combination of policies allowed the economy to recover with less reliance on fiscal expansion. Finally, there is little evidence to suggest that the introduction of the capital controls affected investors’ decisions as to whether to mobilize capital to Malaysia.
Unsurprisingly, the crisis had a major short-term impact on Malaysia’s real sector and thus on credit quality, which necessitated the major restructuring of the financial sector. With local companies and consumers facing difficulties in servicing their loans due to the initial increase in interest rates, to the sharp currency depreciation and to the recession in the real economy, the proportion of banks’ NPLs increased
sharply. As a result, several banks needed to be recapitalized to prevent insolvency.
One of the immediate reform measures undertaken by the authorities was to consolidate the highly-fragmented banking system (see Figure 44). Prior to 1997, there were more than 77 banks and the authorities decided to consolidate the sector. At that time, existing institutions did not have the resources to compete with their regional peers or provide a wide array of products and services. Following the crisis, many of the institutions were burdened with high NPLs and could not focus on lending. In order to become more competitive and to facilitate Malaysia’s economic transformation, the authorities put in place a set of policies which facilitated banking sector consolidation leading to the number of institutions falling to 34 from 77 prior to 1997. By 2003, the banking sector had emerged with fewer but stronger and larger domestic institutions as a core group of 10 well-capitalized domestic anchor banking groups.
A steering committee chaired by BNM led the restructuring initiative, which was implemented by three newly-established institutions. A comprehensive framework and well-coordinated mechanism for the resolution of NPLs and for the restructuring of the debts of the distressed companies was developed and executed by three agencies, these being Danaharta (the Asset Management Company); Danamodal (the Bank Recapitalization Agency); and a Corporate Debt Restructuring Committee (CDRC), which acted as a coordinating agency to facilitate the restructuring of corporate debt (see Figure 36).
FIGURE 36Malaysia’s mechanism for restructuring distressed financial assets after the AFC
Source: World Bank (1999a)
New Capital
New Loans
Sell NPLs atFair Market Value
RestructureExistingFacilities
RehabilitateBorrowers
Issue Bonds
Danamodal
Banks
Danaharta
Corporates
CDRC -Creditor
Comittees
45MALAYSIA ECONOMIC MONITOR | DECEMBER 2017
PART TWO - Turmoil to Transformation: 20 Years after the Asian Financial Crisis
To enable commercial banks to unload their non-performing loans and foreclosed assets, the Government passed the Pengurusan Danaharta National Berhad Act in August 1998. This Act provided the basis for the establishment of Malaysia’s first public asset management company. It also conferred upon Danaharta three special abilities: (i) the ability to buy assets through statutory vesting, which was essential to enable Danaharta to acquire assets with certainty of title and to maximize value; (ii) the ability to appoint Special Administrators to manage the affairs of distressed companies; and (iii) the ability to sell foreclosed assets quickly through the disposal of properties by private treaty. Danaharta‘s NPL initiative commenced in September 1998 and ended in December 2001, at which time the value of its portfolio of NPLs stood at RM 47.7 billion. By September 2005, Danaharta had received RM 30.4 billion in recoveries, representing a commendable 58 percent recovery rate. In 2005, Danaharta closed its operation, a few years earlier than planned (see Appendix Table 8).
A second institution, Danamodal Nasional Berhad (Danamodal), was established as a special purpose vehicle under BNM to facilitate the recapitalization of viable banking institutions. Danamodal’s main role was to facilitate the consolidation and rationalization of the banking sector. It raised funds through the issuance of RM 11 billion worth of five-year zero-coupon unsecured redeemable bonds and injected capital into domestic banks in the form of equity or hybrid instruments. Once its objective was achieved, it was intended that it would sell its stakes in the banks. Recapitalized banks would have Danamodal representatives on their boards and would be required to sell all eligible NPLs to Danaharta.
During its operations, Danamodal injected a total of RM 7.6 billion into 10 banking institutions. It was wound down at the end of 2003, after having redeemed all its bonds by October 2003. As a strategic shareholder in the recapitalized banks, Danamodal could seek the mergers of selected banks to expedite the consolidation of the banking sector. By the end of 2000, the banking sector consolidation initiative had successfully seen a reduction in the number of domestic banks from more than 70 to 10 banking groups. These banks were backed by stronger, more resilient institutional shareholders and would now have the financial resources to compete regionally.
Thirdly, the Corporate Debt Restructuring Committee (CDRC) was established to provide a mechanism for banking institutions and debtors to formulate feasible debt restructuring schemes outside the court system. As such, it was established as a voluntary corporate debt restructuring mechanism. Banks would share information and voluntarily grant corporate entities a moratorium, during which consultants would assess the viability and devise feasible restructuring schemes for the company. Corporations that had not been placed under receivership or liquidation with viable businesses; with outstanding debt in excess of RM50 million; and with loans from more than one creditor could approach CDRC to facilitate a debt workout arrangement.
As a result, Malaysia emerged from the AFC with a significantly stronger banking sector. The country emerged from the crisis with no bank closures, with a high recovery rate on non-performing loans, and stronger banking institutions.
46 MALAYSIA ECONOMIC MONITOR | DECEMBER 2017
PART TWO - Turmoil to Transformation: 20 Years after the Asian Financial Crisis
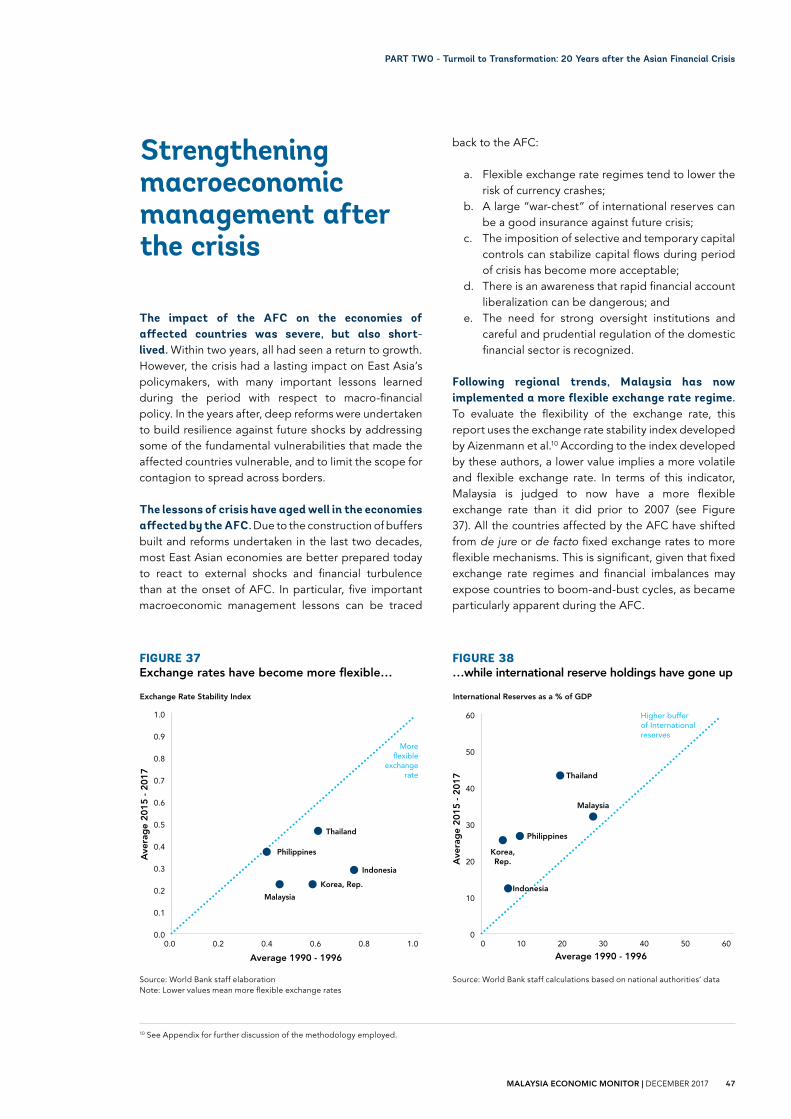
FIGURE 37Exchange rates have become more flexible…
FIGURE 38…while international reserve holdings have gone up
Source: World Bank staff elaborationNote: Lower values mean more flexible exchange rates
Source: World Bank staff calculations based on national authorities’ data
Strengthening macroeconomic management after the crisis
The impact of the AFC on the economies of affected countries was severe, but also short-lived. Within two years, all had seen a return to growth. However, the crisis had a lasting impact on East Asia’s policymakers, with many important lessons learned during the period with respect to macro-financial policy. In the years after, deep reforms were undertaken to build resilience against future shocks by addressing some of the fundamental vulnerabilities that made the affected countries vulnerable, and to limit the scope for contagion to spread across borders.
The lessons of crisis have aged well in the economies affected by the AFC. Due to the construction of buffers built and reforms undertaken in the last two decades, most East Asian economies are better prepared today to react to external shocks and financial turbulence than at the onset of AFC. In particular, five important macroeconomic management lessons can be traced
back to the AFC:
a. Flexible exchange rate regimes tend to lower the risk of currency crashes;
b. A large “war-chest” of international reserves can be a good insurance against future crisis;
c. The imposition of selective and temporary capital controls can stabilize capital flows during period of crisis has become more acceptable;
d. There is an awareness that rapid financial account liberalization can be dangerous; and
e. The need for strong oversight institutions and careful and prudential regulation of the domestic financial sector is recognized.
Following regional trends, Malaysia has now implemented a more flexible exchange rate regime. To evaluate the flexibility of the exchange rate, this report uses the exchange rate stability index developed by Aizenmann et al.10 According to the index developed by these authors, a lower value implies a more volatile and flexible exchange rate. In terms of this indicator, Malaysia is judged to now have a more flexible exchange rate than it did prior to 2007 (see Figure 37). All the countries affected by the AFC have shifted from de jure or de facto fixed exchange rates to more flexible mechanisms. This is significant, given that fixed exchange rate regimes and financial imbalances may expose countries to boom-and-bust cycles, as became particularly apparent during the AFC.
10 See Appendix for further discussion of the methodology employed.
Exchange Rate Stability Index
0.0
0.1
0.2
0.3
0.4
0.5
0.6
0.7
0.8
0.9
1.0
0.0 0.2 0.4 0.6 0.8 1.0
Ave
rag
e 20
15 -
201
7
Average 1990 - 1996
Philippines
Malaysia
Moreflexible
exchangerate
Thailand
Indonesia
Korea, Rep.
International Reserves as a % of GDP
0
10
20
30
40
50
60
0 10 20 30 40 50 60
Ave
rag
e 20
15 -
201
7
Average 1990 - 1996
Malaysia
Thailand
Philippines
Korea,Rep.
Indonesia
Higher bufferof Internationalreserves
47MALAYSIA ECONOMIC MONITOR | DECEMBER 2017
PART TWO - Turmoil to Transformation: 20 Years after the Asian Financial Crisis
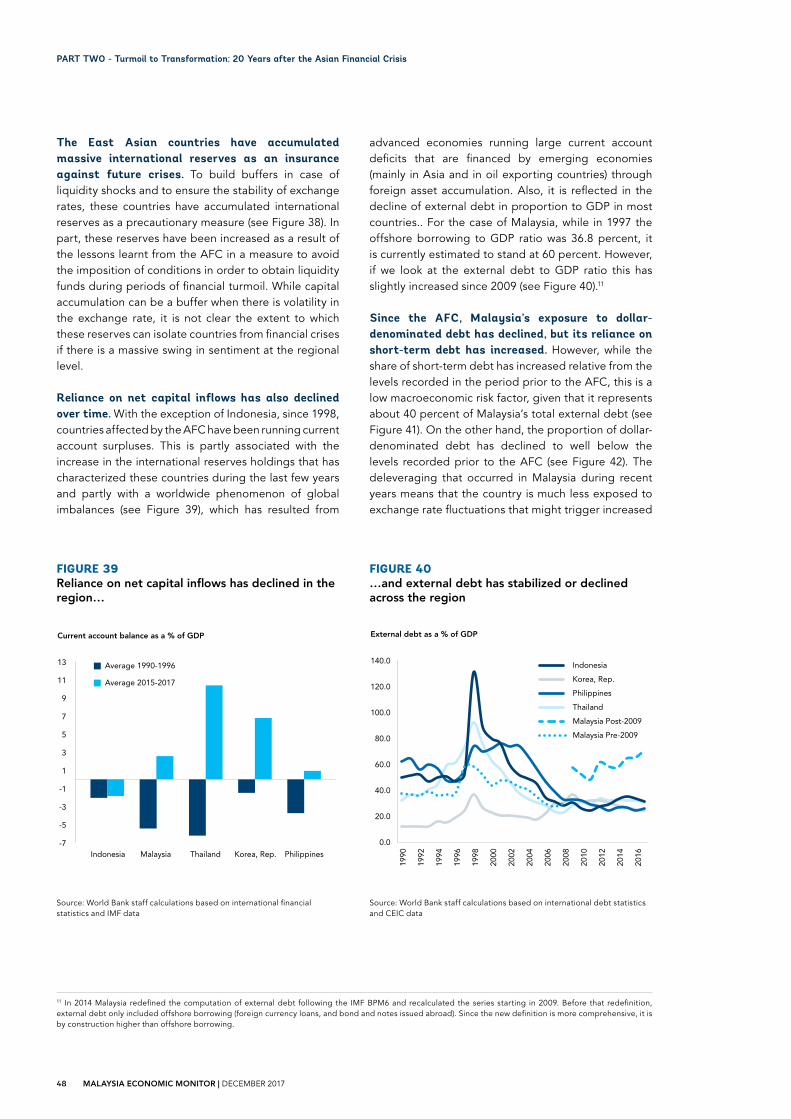
FIGURE 39Reliance on net capital inflows has declined in the region…
FIGURE 40…and external debt has stabilized or declined across the region
Source: World Bank staff calculations based on international financial statistics and IMF data
Source: World Bank staff calculations based on international debt statistics and CEIC data
The East Asian countries have accumulated massive international reserves as an insurance against future crises. To build buffers in case of liquidity shocks and to ensure the stability of exchange rates, these countries have accumulated international reserves as a precautionary measure (see Figure 38). In part, these reserves have been increased as a result of the lessons learnt from the AFC in a measure to avoid the imposition of conditions in order to obtain liquidity funds during periods of financial turmoil. While capital accumulation can be a buffer when there is volatility in the exchange rate, it is not clear the extent to which these reserves can isolate countries from financial crises if there is a massive swing in sentiment at the regional level.
Reliance on net capital inflows has also declined over time. With the exception of Indonesia, since 1998, countries affected by the AFC have been running current account surpluses. This is partly associated with the increase in the international reserves holdings that has characterized these countries during the last few years and partly with a worldwide phenomenon of global imbalances (see Figure 39), which has resulted from
advanced economies running large current account deficits that are financed by emerging economies (mainly in Asia and in oil exporting countries) through foreign asset accumulation. Also, it is reflected in the decline of external debt in proportion to GDP in most countries.. For the case of Malaysia, while in 1997 the offshore borrowing to GDP ratio was 36.8 percent, it is currently estimated to stand at 60 percent. However, if we look at the external debt to GDP ratio this has slightly increased since 2009 (see Figure 40).11
Since the AFC, Malaysia’s exposure to dollar-denominated debt has declined, but its reliance on short-term debt has increased. However, while the share of short-term debt has increased relative from the levels recorded in the period prior to the AFC, this is a low macroeconomic risk factor, given that it represents about 40 percent of Malaysia’s total external debt (see Figure 41). On the other hand, the proportion of dollar-denominated debt has declined to well below the levels recorded prior to the AFC (see Figure 42). The deleveraging that occurred in Malaysia during recent years means that the country is much less exposed to exchange rate fluctuations that might trigger increased
11 In 2014 Malaysia redefined the computation of external debt following the IMF BPM6 and recalculated the series starting in 2009. Before that redefinition, external debt only included offshore borrowing (foreign currency loans, and bond and notes issued abroad). Since the new definition is more comprehensive, it is by construction higher than offshore borrowing.
Current account balance as a % of GDP
-7
-5
-3
-1
1
3
5
7
9
11
13 Average 1990-1996
Average 2015-2017
Indonesia Malaysia Thailand Korea, Rep. Philippines
External debt as a % of GDP
1990
1992
1994
1996
1998
2000
2002
2004
2006
2008
2010
2012
2014
2016
0.0
20.0
40.0
60.0
80.0
100.0
120.0
140.0
Thailand
Indonesia
Korea, Rep.
Malaysia Post-2009
Malaysia Pre-2009
Philippines
48 MALAYSIA ECONOMIC MONITOR | DECEMBER 2017
PART TWO - Turmoil to Transformation: 20 Years after the Asian Financial Crisis
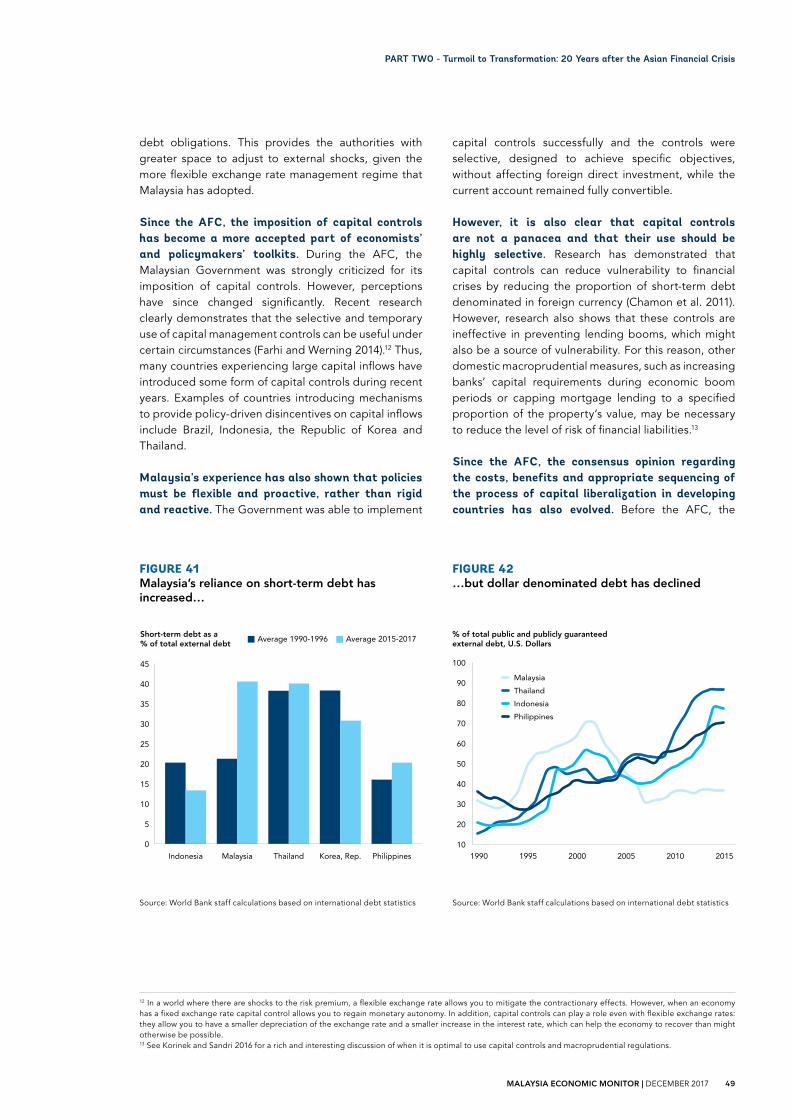
FIGURE 41Malaysia’s reliance on short-term debt has increased…
FIGURE 42…but dollar denominated debt has declined
Source: World Bank staff calculations based on international debt statistics Source: World Bank staff calculations based on international debt statistics
debt obligations. This provides the authorities with greater space to adjust to external shocks, given the more flexible exchange rate management regime that Malaysia has adopted.
Since the AFC, the imposition of capital controls has become a more accepted part of economists’ and policymakers’ toolkits. During the AFC, the Malaysian Government was strongly criticized for its imposition of capital controls. However, perceptions have since changed significantly. Recent research clearly demonstrates that the selective and temporary use of capital management controls can be useful under certain circumstances (Farhi and Werning 2014).12 Thus, many countries experiencing large capital inflows have introduced some form of capital controls during recent years. Examples of countries introducing mechanisms to provide policy-driven disincentives on capital inflows include Brazil, Indonesia, the Republic of Korea and Thailand.
Malaysia’s experience has also shown that policies must be flexible and proactive, rather than rigid and reactive. The Government was able to implement
capital controls successfully and the controls were selective, designed to achieve specific objectives, without affecting foreign direct investment, while the current account remained fully convertible.
However, it is also clear that capital controls are not a panacea and that their use should be highly selective. Research has demonstrated that capital controls can reduce vulnerability to financial crises by reducing the proportion of short-term debt denominated in foreign currency (Chamon et al. 2011). However, research also shows that these controls are ineffective in preventing lending booms, which might also be a source of vulnerability. For this reason, other domestic macroprudential measures, such as increasing banks’ capital requirements during economic boom periods or capping mortgage lending to a specified proportion of the property’s value, may be necessary to reduce the level of risk of financial liabilities.13
Since the AFC, the consensus opinion regarding the costs, benefits and appropriate sequencing of the process of capital liberalization in developing countries has also evolved. Before the AFC, the
12 In a world where there are shocks to the risk premium, a flexible exchange rate allows you to mitigate the contractionary effects. However, when an economy has a fixed exchange rate capital control allows you to regain monetary autonomy. In addition, capital controls can play a role even with flexible exchange rates: they allow you to have a smaller depreciation of the exchange rate and a smaller increase in the interest rate, which can help the economy to recover than might otherwise be possible.13 See Korinek and Sandri 2016 for a rich and interesting discussion of when it is optimal to use capital controls and macroprudential regulations.
Indonesia Malaysia Thailand Korea, Rep. Philippines
0
5
10
15
20
25
30
35
40
45
Average 1990-1996 Average 2015-2017Short-term debt as a% of total external debt
10
20
30
40
50
60
70
80
90
100
1990 1995 2000 2005 2010 2015
% of total public and publicly guaranteedexternal debt, U.S. Dollars
Malaysia
Thailand
Indonesia
Philippines
49MALAYSIA ECONOMIC MONITOR | DECEMBER 2017
PART TWO - Turmoil to Transformation: 20 Years after the Asian Financial Crisis
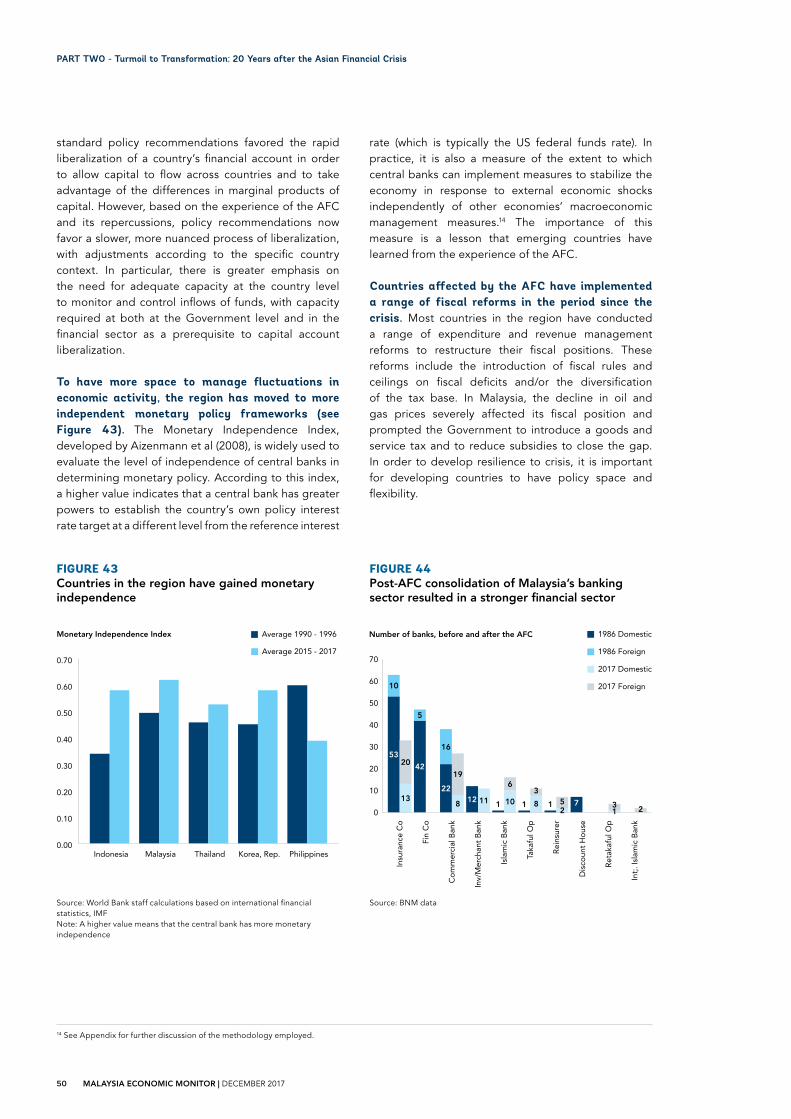
FIGURE 43Countries in the region have gained monetary independence
FIGURE 44Post-AFC consolidation of Malaysia’s banking sector resulted in a stronger financial sector
Source: World Bank staff calculations based on international financial statistics, IMFNote: A higher value means that the central bank has more monetary independence
Source: BNM data
standard policy recommendations favored the rapid liberalization of a country’s financial account in order to allow capital to flow across countries and to take advantage of the differences in marginal products of capital. However, based on the experience of the AFC and its repercussions, policy recommendations now favor a slower, more nuanced process of liberalization, with adjustments according to the specific country context. In particular, there is greater emphasis on the need for adequate capacity at the country level to monitor and control inflows of funds, with capacity required at both at the Government level and in the financial sector as a prerequisite to capital account liberalization.
To have more space to manage fluctuations in economic activity, the region has moved to more independent monetary policy frameworks (see Figure 43). The Monetary Independence Index, developed by Aizenmann et al (2008), is widely used to evaluate the level of independence of central banks in determining monetary policy. According to this index, a higher value indicates that a central bank has greater powers to establish the country’s own policy interest rate target at a different level from the reference interest
rate (which is typically the US federal funds rate). In practice, it is also a measure of the extent to which central banks can implement measures to stabilize the economy in response to external economic shocks independently of other economies’ macroeconomic management measures.14 The importance of this measure is a lesson that emerging countries have learned from the experience of the AFC.
Countries affected by the AFC have implemented a range of fiscal reforms in the period since the crisis. Most countries in the region have conducted a range of expenditure and revenue management reforms to restructure their fiscal positions. These reforms include the introduction of fiscal rules and ceilings on fiscal deficits and/or the diversification of the tax base. In Malaysia, the decline in oil and gas prices severely affected its fiscal position and prompted the Government to introduce a goods and service tax and to reduce subsidies to close the gap. In order to develop resilience to crisis, it is important for developing countries to have policy space and flexibility.
14 See Appendix for further discussion of the methodology employed.
Monetary Independence Index
0.00
0.10
0.20
0.30
0.40
0.50
0.60
0.70
Indonesia Malaysia Thailand Korea, Rep. Philippines
Average 1990 - 1996
Average 2015 - 2017
Number of banks, before and after the AFC
Insu
ranc
e C
o
Fin
Co
Co
mm
erci
al B
ank
Inv/
Mer
chan
t B
ank
Isla
mic
Ban
k
Taka
ful O
p
Rei
nsur
er
Dis
coun
t H
ous
e
Ret
akaf
ul O
p
Int;
. Isl
amic
Ban
k1986 Domestic
1986 Foreign
2017 Domestic
2017 Foreign
0
10
20
30
40
50
60
70
53
10
13
20 42
5
22
16
8
19
12 11 1 10
6
1 8
3
1 5 7 3 22 1
50 MALAYSIA ECONOMIC MONITOR | DECEMBER 2017
PART TWO - Turmoil to Transformation: 20 Years after the Asian Financial Crisis
Building a more resilient financial sector after the crisisThe financial sector in Malaysia has undergone major transformation since the AFC. These post-crisis reforms have enhanced financial stability and facilitated the emergence of a more resilient banking sector and deeper capital and bond markets (see Appendix Table 9). The basis for the transformation has been strategic long-term planning and programming in the financial sector, with a comprehensive vision for its development, a framework for the orderly sequencing of deregulation and liberalization of markets, and the strategic positioning of the Malaysian financial sector, both domestically and internationally.
In the period from 2000 to 2017, two blueprints that set out plans for the medium and long-term development of the financial sector were issued. Both these 10-year masterplans were conceived after a comprehensive review of the vulnerabilities and limitations of the financial sector that surfaced during the Crisis and of the key challenges preventing the financial sector from contributing positively to economic growth.
The first 10-year Financial Sector Master Plan (FSMP) (2001-2010) was aimed at diversification, strengthening resilience, and increasing the efficiency of the financial system. Recommendations were directed at the banking sector, with the clear objective of enhancing soundness and competitiveness. Similarly, for Islamic banking and financing, recommendations were formulated to build
capacity, to increase the number of Islamic banks and to deepen the Islamic financial market as an alternative means of financing.
The second Financial Sector Blueprint (2011-2020) continues to build on the foundations laid by the FSMP and broadly aims to strengthen the financial sector as a key enabler and catalyst of economic growth. The focus of reforms changed from a sector-based approach adopted during the previous decade to one that reflected a more integrated financial sector. During this period, the main reforms have included greater regional and international financial integration of the Malaysian financial sector, the internationalization of the Islamic financial sector, improving financial inclusion and promoting electronic payments as a means towards improving efficiency through cashless payment systems.
More recently, the banking sector has experienced gradual liberalization. Measures include the granting of new banking licenses; increasing foreign equity limits for investment banks, insurance companies and takaful operators to encourage greater participation of foreign players in domestic institutions; and allowing foreign banks to establish new branches to intensify competition. In the period from 2005 to 2016, eight new conventional banking licenses and three new Islamic banking licenses were issued, increasing the number of foreign owned banks from 16 to 25 in total.
51MALAYSIA ECONOMIC MONITOR | DECEMBER 2017
PART TWO - Turmoil to Transformation: 20 Years after the Asian Financial Crisis
Increasing the sophistication of Malaysia’s financial systemThe banking sector has expanded rapidly in line with the expansion of the economy in the past 20 years. Total outstanding loans in the banking system at the end of 2016 stood at RM1,521 billion, expanding 3.7 times, from RM416 billion at the end of 2000.15 With a more vibrant capital market, there is less reliance on banks by corporates for financing, and the Malaysian banking sector has seen a shift in its focus as lending to the household sector accounted for 56.8 percent of total financing in 2016 compared to 33.5 percent in 1997. Financing by banks is undertaken mainly through customer deposits.
The Malaysian financial system is now stronger, diversified and more resilient than at the time of the AFC. From 2000 to 2016, the capitalization ratio for banks increased from 11.7 to 16.5 percent. The ratio of non-performing loans in the banking system declined from 9.2 to 1.2 percent.16 The banking sector’s Basel III liquidity coverage ratio stood at 124.8 percent as at end of December 2016, which is above the BNM’s regulatory minimum target.17
Domestic capital markets have seen significant deepening. The development of the Malaysian bond market has been an important part of efforts to diversify the sources of funding available to support business activity. It is the fifth largest bond market in Asia with outstanding bonds of RM 1.16 trillion, or 95 percent of GDP, at the end of 2016.18 Malaysia’s bond market has grown at an annual average rate of 10.2 percent with total bonds outstanding almost tripling in size, from RM 440 billion in 2006. There is significantly less reliance by corporates on banks for funding requirements, which was one of the banking sector vulnerabilities highlighted during the crisis. The corporate bond market has developed as an alternative source of financing for the corporate sector, expanding 2.8 times from RM 189 billion in 2006 to RM 534 billion outstanding in 2016, or approximately 43 percent of GDP. Also, in 2009, to further enhance access to capital market financing, Malaysia established its first financial guarantee institution, Danajamin Nasional Berhad, to provide credit enhancements to viable corporations
and businesses. Since its establishment, Danajamin has provided guarantees of RM 9 billion for 32 company bonds and sukuk programs.19
Malaysia has become a global leader in Islamic banking and finance. The Government’s commitment to using Islamic banking as an integral part of its economic agenda has seen the development of a vibrant Islamic banking sector. Malaysia has emerged as the leading market for sukuk issuances accounting for 50.6 percent of global Islamic bonds (sukuk) issuance as at the end of 2016. In the banking sector, the contribution of Islamic banking and financing has increased significantly, both in terms of the number of players and in financing market share. The number of full-fledged Islamic banks increased from two in 2000, with a market share of less than 10 percent, to 16 at the end of 2016, with a market share of 28.6 percent.20 Islamic banking operations were initially undertaken as part of the conventional bank operations through Islamic windows, but these windows were later transformed into Islamic subsidiaries under the FSMP.
To support the long-term growth prospects of the financial sector, the development of human capital has been critically important as a means to enhance the efficiency and competitiveness of financial institutions. Financial institutions’ ability to compete depends on their capacity to innovate new products, on their ability to adapt to new environments, and on the quality of the employees. BNM has implemented a range of human capital development strategies to build the necessary capacities to meet the evolving needs of the market as it grows in size and complexity. BNM has helped to improve the skills and competencies of the financial sector industry’s human resources through partnerships with this industry’s associations. Banks have been encouraged to hire competent employees and to develop their skills. Charges equivalent to six months’ salary per employee are imposed to deter the poaching of staff between banks, which is used to supplement the industry’s staff training fund run by the Asian Institute of Chartered Bankers. BNM, in collaboration with financial sector industry associations,
15 BNM Monthly Statistical Bulletin 2015.16 BNM Financial Stability and Payment Systems Report 2016 and Annual Report 2000.17 BNM, Liquidity Coverage Ratio policy document, 2016.18 Asianbondsonline.19 Danajamin Nasional Berhad.20 BNM Monthly Statistical Bulletin, September 2017 and Annual Report 2000.
52 MALAYSIA ECONOMIC MONITOR | DECEMBER 2017
PART TWO - Turmoil to Transformation: 20 Years after the Asian Financial Crisis
has actively supported the establishment of various institutions to build capacity, address the expertise gap as well as provide a constant supply of talent to the industry which currently provides employment to 128,000 people (see Appendix Table 11).
The legal, regulatory and supervisory framework of the financial system has been strengthened since the AFC. Existing laws were reassessed and the temporary measures announced during the crisis were addressed through revised legislation. Prudential regulations have been enhanced to reflect the changes in the financial sector with strengthened requirements and assessments on shareholder suitability, criteria and processes for verifying the fitness and propriety of Board and senior management, acquisition of substantial interest, large exposures and loan classification and provisioning. In 2005 the Government guarantee was replaced with a deposit insurance scheme with the establishment of the Malaysia Deposit Insurance Corporation (PIDM). PIDM was mandated to insure both deposits and benefit payments under insurance and takaful in the case of banks’ and insurance companies’ failing. PIDM covers deposits up to US$ 62,500 per depositor (per bank) and up to US$ 125,000 per policyholder in insurance and takaful benefits. PIDM is also the resolution authority in Malaysia for its member institutions. The temporary powers accorded to Danaharta during the crisis have been written into its Act.
The Central Banking Act 2009 was also revised to allow the regulators more powers to better manage financial stability. In Malaysia, the financial stability mandate falls under the BNM and revisions have been made since the crisis to future-proof financial stability. The central bank now has extensive powers and tools to safeguard financial stability and provide liquidity assistance including to non-banking entities, overseas subsidiaries or branches of Malaysian financial institutions, to contain liquidity shocks. Major changes were also made to the regulatory and supervisory framework to adapt to the changing dynamics of the market place.
The Financial Services Act and Islamic Financial Services Act 2013 provided clarity in mandates for consumer protection, requirements to comply with business conduct standards, and effective tools to enforce standards. Prior to the Act, legal provisions were mainly requirements for financial institutions to comply with prudential regulatory prescriptions that promote safety and soundness. Another significant development in the banking sector was the emergence of financial conglomerates after the crisis. The key provisions for supervising these conglomerates includes approving financial holding companies, applying prudential standards to holding companies or other subsidiaries, including requiring corrective measures to address risks posed to the licensed institution or the financial group.
Malaysia’s financial sector has adopted internationally accepted practices and has a high degree of compliance with global standards for regulation and supervision of financial institutions. Malaysia underwent the Financial Sector Assessment Program in 2013 and was judged to be in compliance with major international standards, including the Core Principles for Effective Banking Supervision, International Organization of Securities Commissions (IOSCO), International Association of Deposit Insurers (IADI) and Anti-Money Laundering and Counter Financing of Terrorism (AML/CFT). The authorities are supportive of commitment to adopt and implement global standards, and banks are preparing for the adoption of MFRS 9.
The reforms undertaken by Malaysian authorities have had a positive impact on financial inclusion and facilitated the emergence of a strong, increasingly market-oriented banking system. At the same time, it is important to highlight that the process according to which these reforms were conceived and implemented has been equally important for Malaysia’s success in financial inclusion (see Box 5).
53MALAYSIA ECONOMIC MONITOR | DECEMBER 2017
PART TWO - Turmoil to Transformation: 20 Years after the Asian Financial Crisis
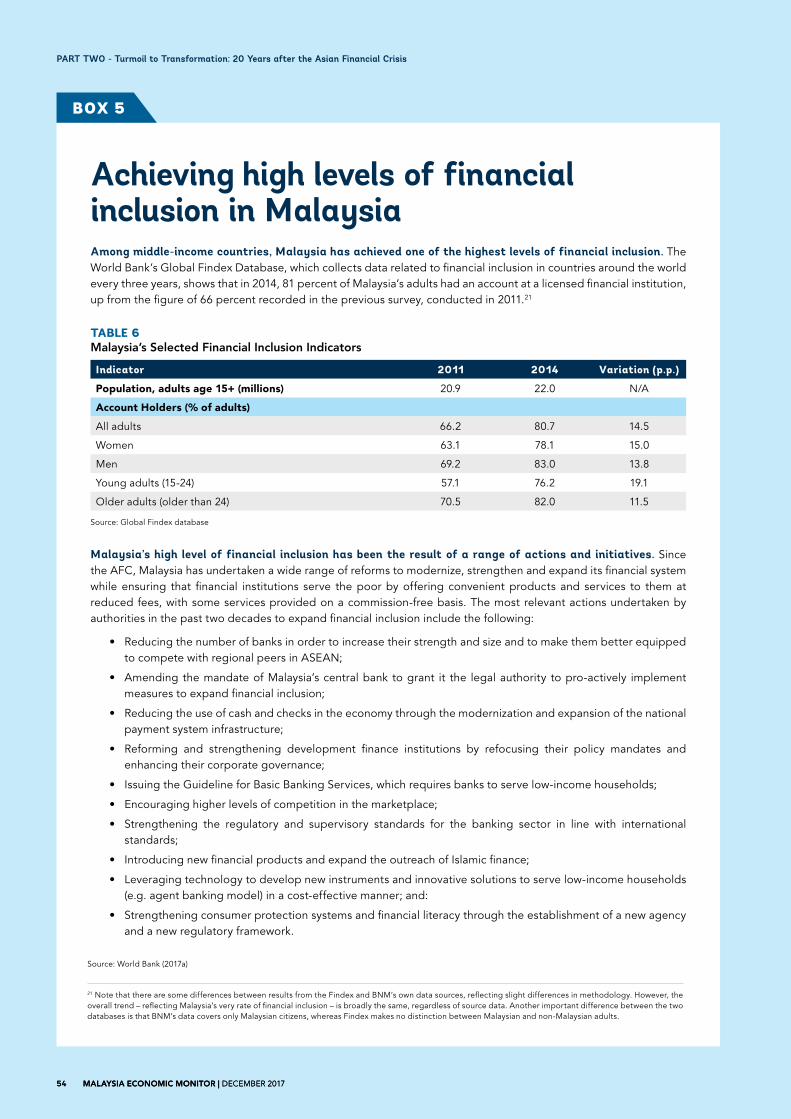
Source: World Bank (2017a)
Achieving high levels of financial inclusion in Malaysia
BOX 5
Among middle-income countries, Malaysia has achieved one of the highest levels of financial inclusion. The World Bank’s Global Findex Database, which collects data related to financial inclusion in countries around the world every three years, shows that in 2014, 81 percent of Malaysia’s adults had an account at a licensed financial institution, up from the figure of 66 percent recorded in the previous survey, conducted in 2011.21
21 Note that there are some differences between results from the Findex and BNM’s own data sources, reflecting slight differences in methodology. However, the overall trend – reflecting Malaysia’s very rate of financial inclusion – is broadly the same, regardless of source data. Another important difference between the two databases is that BNM’s data covers only Malaysian citizens, whereas Findex makes no distinction between Malaysian and non-Malaysian adults.
Malaysia’s high level of financial inclusion has been the result of a range of actions and initiatives. Since the AFC, Malaysia has undertaken a wide range of reforms to modernize, strengthen and expand its financial system while ensuring that financial institutions serve the poor by offering convenient products and services to them at reduced fees, with some services provided on a commission-free basis. The most relevant actions undertaken by authorities in the past two decades to expand financial inclusion include the following:
• Reducing the number of banks in order to increase their strength and size and to make them better equipped to compete with regional peers in ASEAN;
• Amending the mandate of Malaysia’s central bank to grant it the legal authority to pro-actively implement measures to expand financial inclusion;
• Reducing the use of cash and checks in the economy through the modernization and expansion of the national payment system infrastructure;
• Reforming and strengthening development finance institutions by refocusing their policy mandates and enhancing their corporate governance;
• Issuing the Guideline for Basic Banking Services, which requires banks to serve low-income households;
• Encouraging higher levels of competition in the marketplace;
• Strengthening the regulatory and supervisory standards for the banking sector in line with international standards;
• Introducing new financial products and expand the outreach of Islamic finance;
• Leveraging technology to develop new instruments and innovative solutions to serve low-income households (e.g. agent banking model) in a cost-effective manner; and:
• Strengthening consumer protection systems and financial literacy through the establishment of a new agency and a new regulatory framework.
Indicator 2011 2014 Variation (p.p.)
Population, adults age 15+ (millions) 20.9 22.0 N/A
Account Holders (% of adults)
All adults 66.2 80.7 14.5
Women 63.1 78.1 15.0
Men 69.2 83.0 13.8
Young adults (15-24) 57.1 76.2 19.1
Older adults (older than 24) 70.5 82.0 11.5
TABLE 6Malaysia’s Selected Financial Inclusion Indicators
Source: Global Findex database
54 MALAYSIA ECONOMIC MONITOR | DECEMBER 201754 MALAYSIA ECONOMIC MONITOR | DECEMBER 2017
PART TWO - Turmoil to Transformation: 20 Years after the Asian Financial Crisis
Diversifying the capital market after the crisisTo generate a more resilient capital market, the Government introduced major reforms. The Capital Market Masterplan (CMP1) and the Capital Market Masterplan 2 (CMP2) introduced in 2001-2010 and 2011-2020 provided direction and strategy to develop and position the financial market in the global sphere. Through these strategies, the capital markets have been recognized and positioned clearly to be an important complement to the banking sector in Malaysia to support the nation’s financing needs and to diversify financial assets holding in the financial system.
Malaysia’s bond market expanded significantly after the AFC to become an important financing source for corporates. Corporate bonds have been issued to support a wide range of sectors, with the financial sector being the largest issuer, followed by infrastructure, construction and housing finance. Large institutional investors, such as pension funds, government-linked special purpose funds, and banks and insurance companies, have been the major investors in bonds in Malaysia.
The development of the bond market in Malaysia was driven by national economic development strategy and capital market development plans. Once again, Malaysia’s development of the bond market was predicated on the basis of a strong national economic development strategy and capital market development plan. A high-level National Bond Market Committee chaired by the Secretary General of Treasury and consisting of senior officials from Bank Negara Malaysia, the Registrar of Companies (now the Companies Commission of Malaysia), Foreign Investment Committee, Ministry of Finance, Kuala Lumpur Stock Exchange (now Bursa Malaysia) and the Securities Commission Malaysia coordinated the implementation of this strategy.
In 2000, the Securities Commission Malaysia became the lead regulator for the corporate bond market, when a full disclosure-based regulatory approach was adopted to streamline and simplify the corporate bonds issuance. This greatly accelerated the development of Malaysia’s corporate bond market. A series of regulations and guidelines were subsequently issued to further consolidate and
streamline the issuance procedures for corporate bonds, including conventional and Islamic products (see Box 6).
Malaysia has become a global leader in Islamic finance, which operates in parallel and is complementary to the conventional financial system. Data from the Islamic Financial Services Board shows that by the end of 2016, Malaysia holds 9.3 percent of the global Islamic banking assets, 50.6 percent of global sukuk (bond) issuances, and 29.0 percent of Islamic fund assets.22
With the robust growth of Islamic finance, Malaysia has proven that both Islamic and conventional finance can run in parallel and as complements to each other. The evolution of Islamic finance in Malaysia started with the establishment of Pilgrimage Fund (Tabung Haji) in 1963 as the first Islamic savings institution. The Islamic Banking Act 1983 paved the way for Malaysia’s first Islamic bank (Bank Islam Malaysia Berhad). The Government Funding Act 1983 was introduced to facilitate the issuance of Government papers based on Islamic principles, enabling better liquidity management by the Islamic banks. In 1984, Syarikat Takaful Malaysia was established in accordance with the Takaful Act 1984. Since then, more initiatives have been taken by the BNM and Securities Commission Malaysia to provide a conducive business environment for Islamic finance. Shell issued the country‘s first Islamic bond in 1990, the Interest-free Banking Scheme (Islamic windows) in 1993; Malaysia‘s first full-fledged Islamic stock broking company (BIMB Securities) was formed in 1994; the Shariah Advisory Council of the Securities Commission Malaysia was established in 1996; the first shari’ah-compliant securities were issued at Bursa Malaysia in June 1997; and the Kuala Lumpur Shariah Index was established in 1999, to name a few.
A robust regulatory framework, together with market-oriented incentives to promote innovations in products and services and a strong emphasis on professional skills development in Islamic finance, are some of the key success factors in developing a full-fledged Islamic finance market in Malaysia. BNM and Securities Commission Malaysia have led reforms to develop Islamic finance markets over the last two decades. A series of regulations and guidelines to establish a comprehensive shari’ah framework have been gradually introduced to ensure the soundness and stability of the Islamic financial industry. Bursa Malaysia and Labuan International Business and Financial Centre (IBFC) have also contributed to the development of Islamic finance by providing a comprehensive range of Islamic finance products and services. Services
22 Islamic Finance Services Board, Islamic Financial Services Industry Stability Report 2017
55MALAYSIA ECONOMIC MONITOR | DECEMBER 2017
PART TWO - Turmoil to Transformation: 20 Years after the Asian Financial Crisis
provided by Bursa through the Bursa Suq Al-Sila’ (BSAS), Bursa Malaysia-i, Shariah Compliant Exchange Traded Funds (i-ETFs), Islamic Real Estate Investment Trusts (i-REITs) and sukuk listings. IBFC offers a wide range of business and investment structures facilitating cross-border transactions, business dealings and wealth management needs. These unique qualities offer sound options for regional businesses going global or global businesses aiming to penetrate Asia’s burgeoning markets. Supportive incentives, including both fiscal incentives and tax neutrality policy, have been introduced under the Capital Market Development Master Plans. Liberalization measures included allowing the participation of foreign corporations, multinational corporations and multilateral agencies in the form of new licenses, increase in foreign equity limits and operational flexibilities have been introduced. The facilitative tax framework, such as tax neutrality and tax
incentives for Islamic financial services and products, have a positive impact in motivating the industry to tap Islamic finance as a preferred instrument. Malaysia has always put strong emphasis on human capital development in Islamic finance, with several educational and technical training institutions being established to develop Islamic finance professionals to meet the need for Islamic finance experts, locally and globally.
With the well-established Islamic capital markets and regulatory frameworks, as well as the relevant incentives to motivate market participants, Malaysia has been able to support financial innovation in Islamic finance. One of the latest innovations is the issuance of the world’s first green sukuk in 2017, to fund a renewable energy project in Malaysia (see Box 7).
The Securities Commission Malaysia undertook several key steps to facilitate the development of Malaysia’s corporate bond market. These steps have been invaluable towards achieving the diversification of financing for private sector activity outside the banking sector since the advent of the AFC. They include the following:
Rationalizing the issuance process: The modernization of the fund-raising regime through the introduction of a new regulatory framework for the issuance of corporate bonds generated: (a) a rationalization of the fragmented regulatory structure; (b) an agile approval process for corporate bond issuances with introduction of the Lodge and Launch Framework for the wholesale segment; (c) the imposition of more stringent disclosure requirements; (d) an enhancement of the legal protection framework granted to bond investors; (e) an encouragement to issuers to tap the bond market; (f) greater opportunities for secondary market liquidity.
Establishing a reliable and efficient benchmark yield curve: The Government constructed a benchmark yield curve out of large and liquid, sovereign-credit bond issuances, with a transparent auction calendar to provide ease and accuracy in the pricing of corporate bonds.
Widening the issuer and investor base: A virtual platform was established to connect issuers with investors, generating more competition to bring down the cost of financing.
Improving liquidity in the secondary market: This included efforts to enhance market infrastructure, trading and operational procedures for the creation of an organized and active bond market that efficiently and effectively promotes and attracts both active and secondary market transactions.
Facilitating the introduction of risk management instruments: These instruments were developed to provide an avenue for issuers and investors to hedge their respective exposures to the bond market in a most effective and timely manner.
Malaysia’s framework for developing the bond market
BOX 6
Source: Securities Commission Malaysia (2010)
56 MALAYSIA ECONOMIC MONITOR | DECEMBER 2017
PART TWO - Turmoil to Transformation: 20 Years after the Asian Financial Crisis
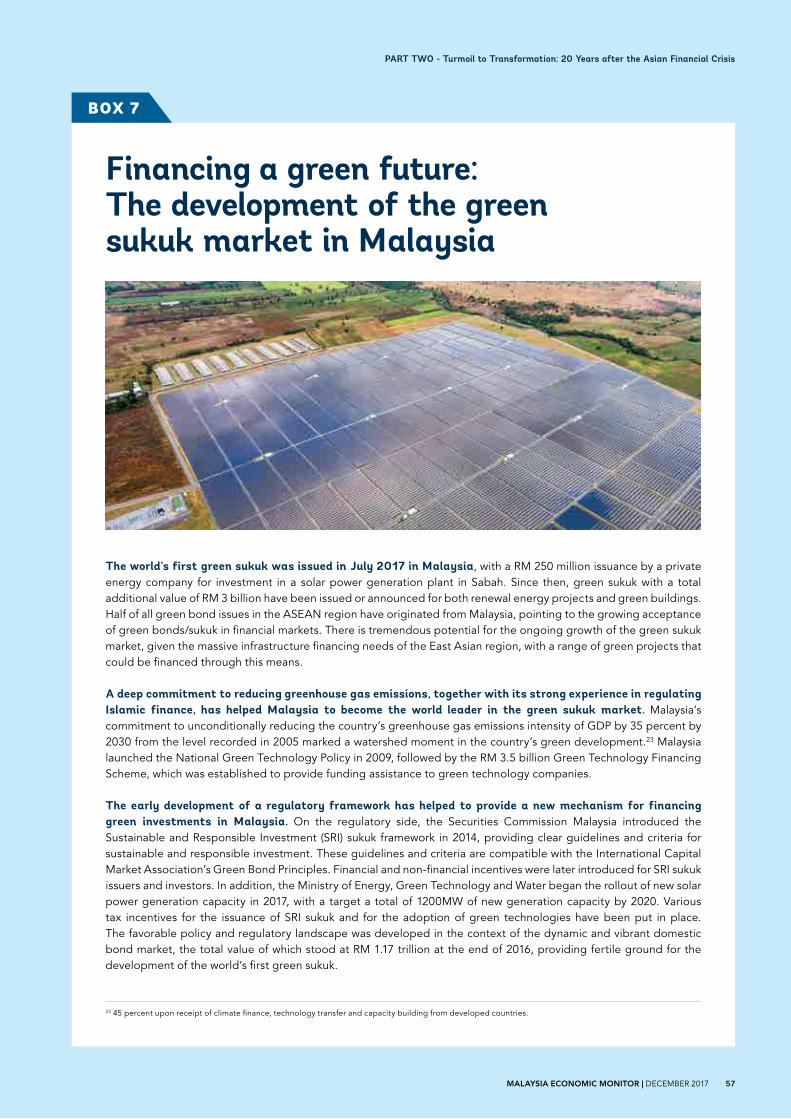
BOX 7
The world’s first green sukuk was issued in July 2017 in Malaysia, with a RM 250 million issuance by a private energy company for investment in a solar power generation plant in Sabah. Since then, green sukuk with a total additional value of RM 3 billion have been issued or announced for both renewal energy projects and green buildings. Half of all green bond issues in the ASEAN region have originated from Malaysia, pointing to the growing acceptance of green bonds/sukuk in financial markets. There is tremendous potential for the ongoing growth of the green sukuk market, given the massive infrastructure financing needs of the East Asian region, with a range of green projects that could be financed through this means.
A deep commitment to reducing greenhouse gas emissions, together with its strong experience in regulating Islamic finance, has helped Malaysia to become the world leader in the green sukuk market. Malaysia’s commitment to unconditionally reducing the country’s greenhouse gas emissions intensity of GDP by 35 percent by 2030 from the level recorded in 2005 marked a watershed moment in the country’s green development.23 Malaysia launched the National Green Technology Policy in 2009, followed by the RM 3.5 billion Green Technology Financing Scheme, which was established to provide funding assistance to green technology companies.
The early development of a regulatory framework has helped to provide a new mechanism for financing green investments in Malaysia. On the regulatory side, the Securities Commission Malaysia introduced the Sustainable and Responsible Investment (SRI) sukuk framework in 2014, providing clear guidelines and criteria for sustainable and responsible investment. These guidelines and criteria are compatible with the International Capital Market Association’s Green Bond Principles. Financial and non-financial incentives were later introduced for SRI sukuk issuers and investors. In addition, the Ministry of Energy, Green Technology and Water began the rollout of new solar power generation capacity in 2017, with a target a total of 1200MW of new generation capacity by 2020. Various tax incentives for the issuance of SRI sukuk and for the adoption of green technologies have been put in place. The favorable policy and regulatory landscape was developed in the context of the dynamic and vibrant domestic bond market, the total value of which stood at RM 1.17 trillion at the end of 2016, providing fertile ground for the development of the world’s first green sukuk.
Financing a green future: The development of the green sukuk market in Malaysia
23 45 percent upon receipt of climate finance, technology transfer and capacity building from developed countries.
57MALAYSIA ECONOMIC MONITOR | DECEMBER 2017
PART TWO - Turmoil to Transformation: 20 Years after the Asian Financial Crisis
Improving standards of corporate governance
Poor corporate governance was cited as one of the factors leading to the AFC, with one criticism being that “crony capitalism” contributed to vulnerability across East Asia. In order to establish higher corporate governance standards, after the crisis, the Government implemented a number of measures to raise standards. As a first step, a high-level Finance Committee on Corporate Governance was established in 1998. One of its earliest recommendations was to establish the Malaysian Institute of Corporate Governance to promote and encourage the development of corporate governance in the country. Subsequently, in 1999, the Committee published a report which a pathway to strengthen the corporate governance agenda in Malaysia.
In 2000, the Securities Commission Malaysia issued the Malaysian Code on Corporate Governance. This Code provided guidance on best practices to strengthen Malaysia’s corporate culture to achieve compliance with international standards. The Code has been reviewed and updated on several occasions, including in 2007, 2012 and 2016, to ensure that it kept up with the continuing demands for improved corporate governance in the country. The most recent update, published in April 2017, emphasizes the strengthening of corporate governance in non-listed firms and SMEs, and encourages licensed intermediaries to adopt the Malaysia Code on Corporate Governance.
Implementation of the Code was accelerated under a 5-year Corporate Governance Blueprint adopted by the Securities Commission Malaysia in 2011. The Blueprint emphasized self and market discipline and promoted the greater internalization of a good corporate governance culture. This was achieved by moving away from a rule-based approach to a more principle-based approach and by deepening the trust between companies and its stakeholders. The blueprint focused on six key areas: shareholder rights; the role of institutional investors; the role of boards; disclosure and transparency; gatekeepers and influencers; and enforcement.
In addition, in 2014, a non-binding protocol, the Malaysian Code for Institutional Investors, was introduced with the particular intention of strengthening minority shareholder rights. The code defines general principles of effective stewardship by institutional investors. These include issues such as the disclosure of stewardship policies, monitoring of and engagement with investee companies, managing conflict of interests, amongst others. In 2010, an Audit Oversight Board was also established to strengthen oversight over external auditors of public listed entities.
Further, Malaysia has also tightened regulatory measures to strengthen corporate governance standards. For instance, the Securities Commission Malaysia has incorporated corporate governance provisions into listing requirements, with these provisions establishing the criteria for directors and governing related party transactions concerning listed entities. It has also amended the relevant securities laws to instill relevant statutory powers for actions to be taken against not just the listed entity, but also against directors and/or individuals in cases of dishonest conduct and contravention of the listing rules.
Since the AFC, Malaysia has come a long way towards improving corporate governance practices. Although there is still room for further improvements, the detailed initiatives undertaken to date have helped to improve transparency and standards in business oversight.
58 MALAYSIA ECONOMIC MONITOR | DECEMBER 2017
PART TWO - Turmoil to Transformation: 20 Years after the Asian Financial Crisis
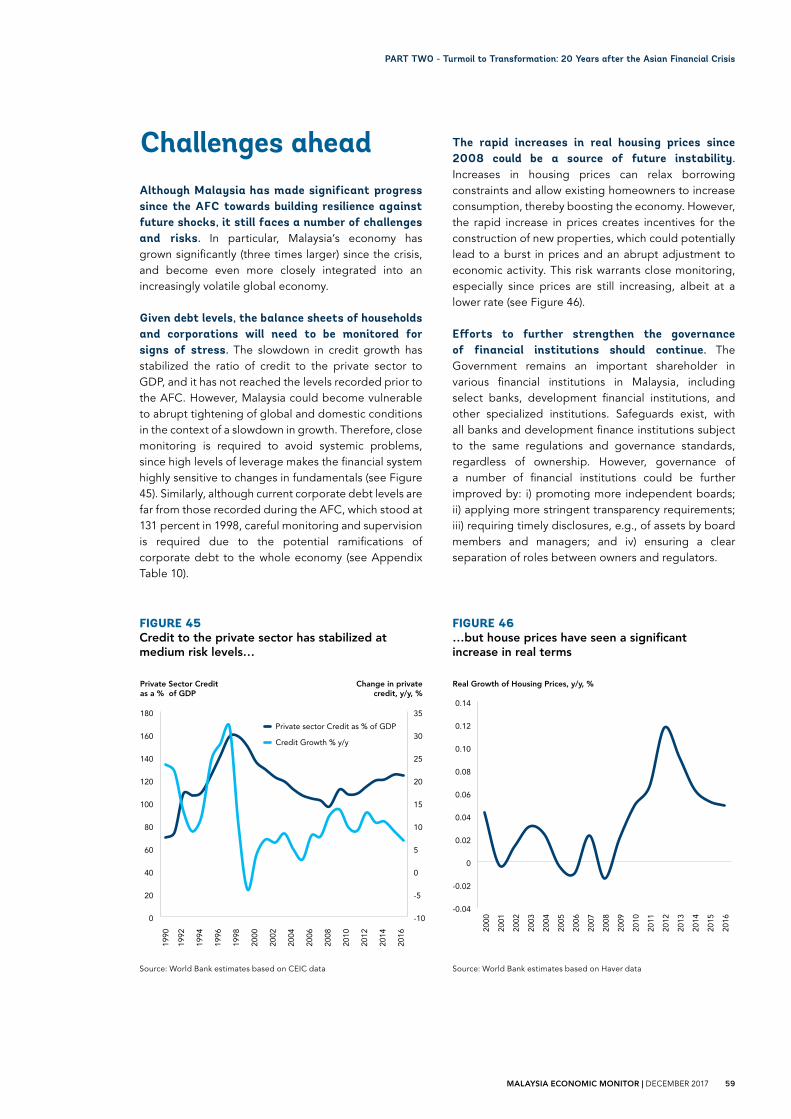
Challenges aheadAlthough Malaysia has made significant progress since the AFC towards building resilience against future shocks, it still faces a number of challenges and risks. In particular, Malaysia’s economy has grown significantly (three times larger) since the crisis, and become even more closely integrated into an increasingly volatile global economy.
Given debt levels, the balance sheets of households and corporations will need to be monitored for signs of stress. The slowdown in credit growth has stabilized the ratio of credit to the private sector to GDP, and it has not reached the levels recorded prior to the AFC. However, Malaysia could become vulnerable to abrupt tightening of global and domestic conditions in the context of a slowdown in growth. Therefore, close monitoring is required to avoid systemic problems, since high levels of leverage makes the financial system highly sensitive to changes in fundamentals (see Figure 45). Similarly, although current corporate debt levels are far from those recorded during the AFC, which stood at 131 percent in 1998, careful monitoring and supervision is required due to the potential ramifications of corporate debt to the whole economy (see Appendix Table 10).
The rapid increases in real housing prices since 2008 could be a source of future instability. Increases in housing prices can relax borrowing constraints and allow existing homeowners to increase consumption, thereby boosting the economy. However, the rapid increase in prices creates incentives for the construction of new properties, which could potentially lead to a burst in prices and an abrupt adjustment to economic activity. This risk warrants close monitoring, especially since prices are still increasing, albeit at a lower rate (see Figure 46).
Efforts to further strengthen the governance of financial institutions should continue. The Government remains an important shareholder in various financial institutions in Malaysia, including select banks, development financial institutions, and other specialized institutions. Safeguards exist, with all banks and development finance institutions subject to the same regulations and governance standards, regardless of ownership. However, governance of a number of financial institutions could be further improved by: i) promoting more independent boards; ii) applying more stringent transparency requirements; iii) requiring timely disclosures, e.g., of assets by board members and managers; and iv) ensuring a clear separation of roles between owners and regulators.
FIGURE 45Credit to the private sector has stabilized at medium risk levels…
FIGURE 46…but house prices have seen a significant increase in real terms
Source: World Bank estimates based on CEIC data Source: World Bank estimates based on Haver data
Private Sector Creditas a % of GDP
Change in privatecredit, y/y, %
-10
-5
0
5
10
15
20
25
30
35
0
20
40
60
80
100
120
140
160
180
1990
1992
1994
1996
1998
2000
2002
2004
2006
2008
2010
2012
2014
2016
Private sector Credit as % of GDP
Credit Growth % y/y
Real Growth of Housing Prices, y/y, %
2000
2001
2002
2003
2004
2005
2006
2007
2008
2009
2010
2011
2012
2013
2014
2015
2016
-0.04
-0.02
0
0.02
0.04
0.06
0.08
0.10
0.12
0.14
59MALAYSIA ECONOMIC MONITOR | DECEMBER 2017
PART TWO - Turmoil to Transformation: 20 Years after the Asian Financial Crisis
Overall, the post-crisis reforms significantly strengthened Malaysia’s financial system. However, sustained monitoring and new measures are needed to address emerging risks from the continued financial sector transformation. Banking sector assets are concentrated in a few banking groups, making a number of these financial conglomerates systemically too-important-to-fail. Malaysia may choose to expedite the finalization of its framework for domestic systemically important banks. The BNM is currently working on developing a recovery planning framework while the primary resolution authority, PIDM, is developing a resolution planning framework. A pilot exercise with selected banks is currently underway to test the recovery planning framework.
The transition to a digital economy introduces new cyber-security risks from technology-enabled innovation in financial services. These risks are compounded by the greater interconnectedness of all parts of the financial system. Identity theft, hacking of data systems, and fraud, to name a few, are no longer mere IT risks. A comprehensive framework and stronger regulations will be important to safeguard the conduct of transactions through digital channels. This is necessary to preserve confidence in the financial sector and to advance the modernization of the financial sector.
Responsible financial access should also be a key theme going forward, with financial inclusion and consumer protection being two very important and interrelated elements. As competition and innovation delivers financial services to a wider group of customers, effective market conduct and consumer protection regulations are needed to protect these customers from excessive risk. Financial literacy programs will need to reflect the changing landscape and to manage the potential risks of financial exclusion as risk profiling and risk management tools become more sophisticated.
Efforts to strengthen fiscal space should continue in order to ensure flexibility for the management of future contractionary shocks. While the Government has made significant progress towards fiscal consolidation since the GFC, the overall public debt stock has remained relatively elevated due to the continued accumulation of fiscal deficits and increased public infrastructure spending. Further fiscal adjustments would necessitate deeper reforms to ensure more efficient and effective public finance management. Another key source of fiscal risks relates to the steady expansion of the Government’s contingent
liabilities since 2009, reflecting largely the increased issuances of sovereign guarantees to facilitate the implementation of major development projects by NFPCs. These government liability exposures are likely to expand over the coming years with the incoming flows of large-scale infrastructure commitments such as the East Coast Rail Link and the Kuala Lumpur-Singapore High Speed Rail. Managing the associated fiscal risks would call for the continuous monitoring and transparent disclosure of contingent liabilities, along with a comprehensive, orderly, medium-term resolution to gradually unwind guarantees going forward.
In the longer term, the diversification of Malaysia’s cross-border export and investment structure would be an important way to enhance external sector resilience. Since the AFC, the market composition for Malaysia’s trade has increasingly shifted away from the advanced economies to East Asia. Nevertheless, Malaysia’s trade is still largely concentrated in its top five trade partners, with China being the largest, accounting for 16 percent of Malaysia’s total trade. Similar patterns are apparent for inward investment.24 As China rebalances its growth model from an investment- and credit-driven model towards a model that focuses on services and consumer demand, external demand from China is likely to moderate. Moreover, global growth is increasingly contributed by the developing economies amid potential inward policies in the advanced economies. Given Malaysia’s high degree of trade openness with the advanced economies and with China, these major developments are likely to weigh on Malaysia’s exports and growth prospects.
As such, Malaysia should look towards continuing economic integration with the region and enhancing its export base. In that regard, Malaysia should leverage existing and new initiatives such as the ASEAN Economic Community, bilateral and multilateral trade agreements, the proposed Regional
24 China, Singapore, EU, US, and Japan collectively account for ~50 percent of Malaysia’s total trade.
While the policies adopted by Malaysia in response to the AFC were seen as radical at the time, they have now come to be seen as rather more mainstream
60 MALAYSIA ECONOMIC MONITOR | DECEMBER 2017
PART TWO - Turmoil to Transformation: 20 Years after the Asian Financial Crisis
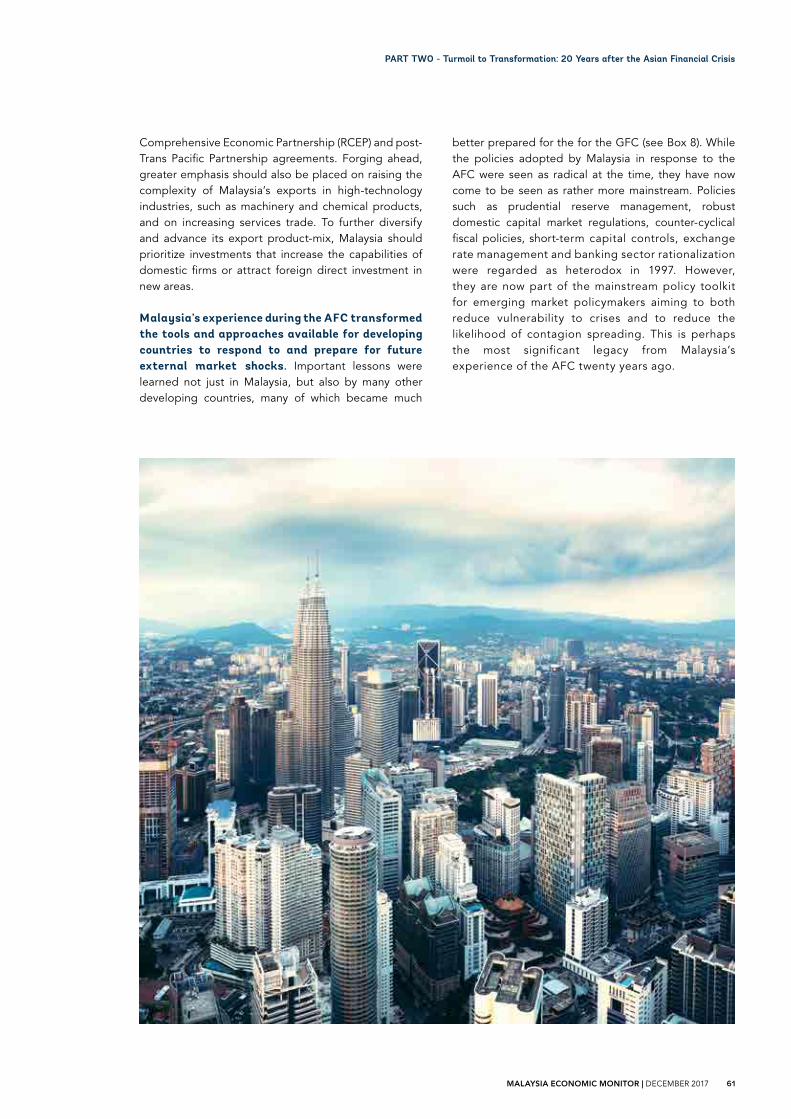
Comprehensive Economic Partnership (RCEP) and post-Trans Pacific Partnership agreements. Forging ahead, greater emphasis should also be placed on raising the complexity of Malaysia’s exports in high-technology industries, such as machinery and chemical products, and on increasing services trade. To further diversify and advance its export product-mix, Malaysia should prioritize investments that increase the capabilities of domestic firms or attract foreign direct investment in new areas.
Malaysia’s experience during the AFC transformed the tools and approaches available for developing countries to respond to and prepare for future external market shocks. Important lessons were learned not just in Malaysia, but also by many other developing countries, many of which became much
better prepared for the for the GFC (see Box 8). While the policies adopted by Malaysia in response to the AFC were seen as radical at the time, they have now come to be seen as rather more mainstream. Policies such as prudential reserve management, robust domestic capital market regulations, counter-cyclical fiscal policies, short-term capital controls, exchange rate management and banking sector rationalization were regarded as heterodox in 1997. However, they are now part of the mainstream policy toolkit for emerging market policymakers aiming to both reduce vulnerability to crises and to reduce the likelihood of contagion spreading. This is perhaps the most significant legacy from Malaysia’s experience of the AFC twenty years ago.
61MALAYSIA ECONOMIC MONITOR | DECEMBER 2017
PART TWO - Turmoil to Transformation: 20 Years after the Asian Financial Crisis
The global financial system can be characterized by its propensity for crisis. In the period from 1970 to 2011, there have been 147 banking crises in 116 countries, with large economic costs. The average cumulative loss of output during the first three years of crises was, in average, about 30 percent of GDP.
While the recent global economic downturn did not spare developing countries, they were more resilient to the 2008 global crisis than to previous crises. The East Asian countries, including Malaysia, managed systemic risk especially well, but the performance of several countries in Central Europe, Latin America, and Sub-Saharan Africa has also been remarkable. This box examines the experiences of three of them, from different regions and levels of development, with these three being the Czech Republic, Peru, and Kenya.
The Czech Republic started building stronger foundations for aggregate risk management following major lessons learned from the 1997–98 banking crisis. In 1997, the Czech Republic abandoned its fixed exchange rate regime in favor of a monetary policy framework based on inflation targeting. Credible monetary policy and price stability translated into low interest rates that, along with improved fiscal discipline, enabled the country to maintain a strong external position.
Unlike the Czech Republic, until 2008, Peru had not experienced major economic turmoil for almost two decades. However, until the late 1980s, Peru had experienced hyperinflation, severe macroeconomic imbalances, and massive capital outflows. In the 1990s, Peru put in place key reforms to stabilize the economy. It brought hyperinflation under control, with the Central Bank adopting an inflation-targeting regime and a flexible exchange rate. The tax system and the financial sector were reformed, as a result of which banks built up adequate levels of capitalization and sufficient levels of liquidity. Peru liberalized foreign trade in the early 1990s, drastically reducing tariff rates and eliminating non-tariff barriers. This increased openness enables Peru to benefit from a more favorable economic environment. Increasing demand for the country’s commodities (mineral ores and metals) from emerging markets in East Asia produced a large positive income shock. Peru saved part of these revenues, thus building large international reserves and fiscal primary surpluses.
As in the case of Peru, Kenya’s economy was in deep trouble during the 1980s and early 1990s, with GDP growth stagnating, agricultural production sharply contracting, and hyperinflation flaring. The Government decided to implement economic reforms to stabilize the financial sector and to restore sustainable growth. The banking system was strengthened, notably through the substantial capitalization of the banks, and access to finance was expanded. Kenya also managed to decrease its public debt stock and to accumulate a high level of international reserves by adopting prudent fiscal policies and by maintaining a healthy external position, with strong surpluses in the service balance (mainly tourism and information technology) and massive inflows of foreign capital that compensated for the trade deficit.
The resilience of these three countries to the global crisis in 2008 was the result of an arduous process undertaken over the period of a decade or more prior to the shock. Although political leaders may have been tempted to adopt pro-cyclical measures during good economic times, they understood the necessity of strengthening their financial and macroeconomic systems to prepare for serious economic turmoil.
BOX 8
Lessons from other countries in building resilience to global economic shocks
62 MALAYSIA ECONOMIC MONITOR | DECEMBER 201762 MALAYSIA ECONOMIC MONITOR | DECEMBER 2017
PART TWO - Turmoil to Transformation: 20 Years after the Asian Financial Crisis
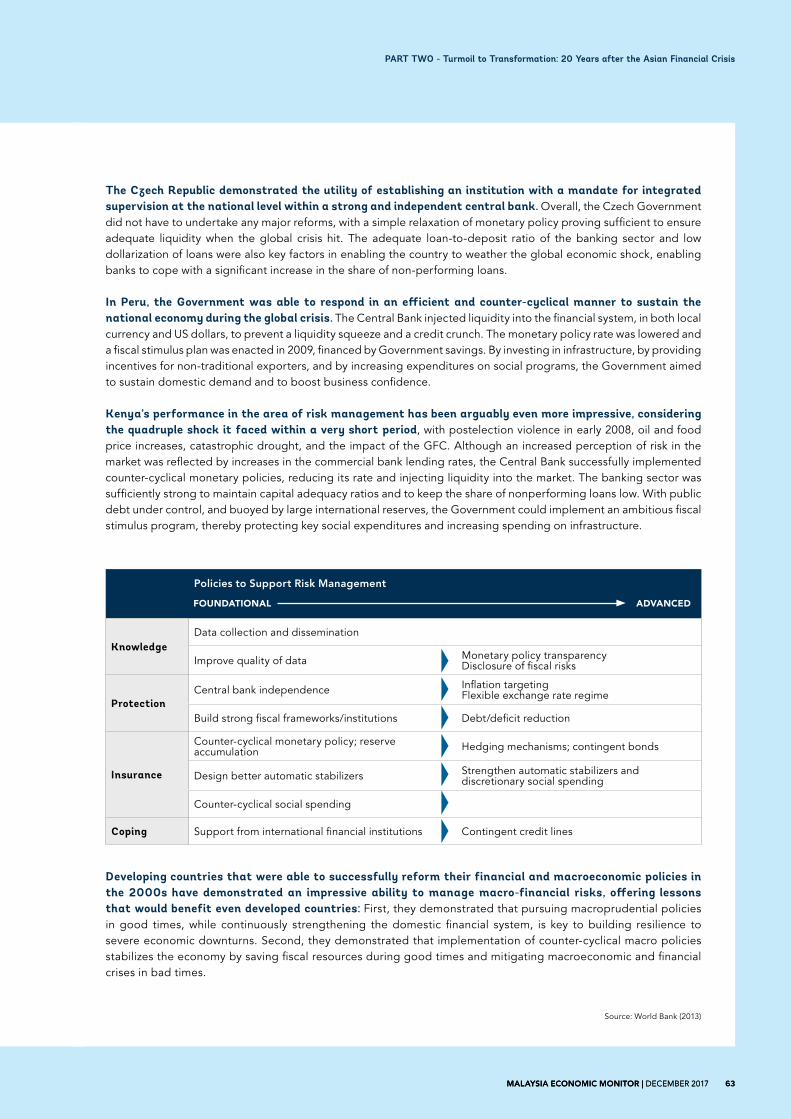
Source: World Bank (2013)
The Czech Republic demonstrated the utility of establishing an institution with a mandate for integrated supervision at the national level within a strong and independent central bank. Overall, the Czech Government did not have to undertake any major reforms, with a simple relaxation of monetary policy proving sufficient to ensure adequate liquidity when the global crisis hit. The adequate loan-to-deposit ratio of the banking sector and low dollarization of loans were also key factors in enabling the country to weather the global economic shock, enabling banks to cope with a significant increase in the share of non-performing loans.
In Peru, the Government was able to respond in an efficient and counter-cyclical manner to sustain the national economy during the global crisis. The Central Bank injected liquidity into the financial system, in both local currency and US dollars, to prevent a liquidity squeeze and a credit crunch. The monetary policy rate was lowered and a fiscal stimulus plan was enacted in 2009, financed by Government savings. By investing in infrastructure, by providing incentives for non-traditional exporters, and by increasing expenditures on social programs, the Government aimed to sustain domestic demand and to boost business confidence.
Kenya’s performance in the area of risk management has been arguably even more impressive, considering the quadruple shock it faced within a very short period, with postelection violence in early 2008, oil and food price increases, catastrophic drought, and the impact of the GFC. Although an increased perception of risk in the market was reflected by increases in the commercial bank lending rates, the Central Bank successfully implemented counter-cyclical monetary policies, reducing its rate and injecting liquidity into the market. The banking sector was sufficiently strong to maintain capital adequacy ratios and to keep the share of nonperforming loans low. With public debt under control, and buoyed by large international reserves, the Government could implement an ambitious fiscal stimulus program, thereby protecting key social expenditures and increasing spending on infrastructure.
Policies to Support Risk Management
KnowledgeData collection and dissemination
Improve quality of data Monetary policy transparencyDisclosure of fiscal risks
ProtectionCentral bank independence Inflation targeting
Flexible exchange rate regime
Build strong fiscal frameworks/institutions Debt/deficit reduction
Insurance
Counter-cyclical monetary policy; reserve accumulation Hedging mechanisms; contingent bonds
Design better automatic stabilizers Strengthen automatic stabilizers and discretionary social spending
Counter-cyclical social spending
Coping Support from international financial institutions Contingent credit lines
Developing countries that were able to successfully reform their financial and macroeconomic policies in the 2000s have demonstrated an impressive ability to manage macro-financial risks, offering lessons that would benefit even developed countries: First, they demonstrated that pursuing macroprudential policies in good times, while continuously strengthening the domestic financial system, is key to building resilience to severe economic downturns. Second, they demonstrated that implementation of counter-cyclical macro policies stabilizes the economy by saving fiscal resources during good times and mitigating macroeconomic and financial crises in bad times.
FOUNDATIONAL ADVANCED
63MALAYSIA ECONOMIC MONITOR | DECEMBER 2017 63MALAYSIA ECONOMIC MONITOR | DECEMBER 2017
PART TWO - Turmoil to Transformation: 20 Years after the Asian Financial Crisis
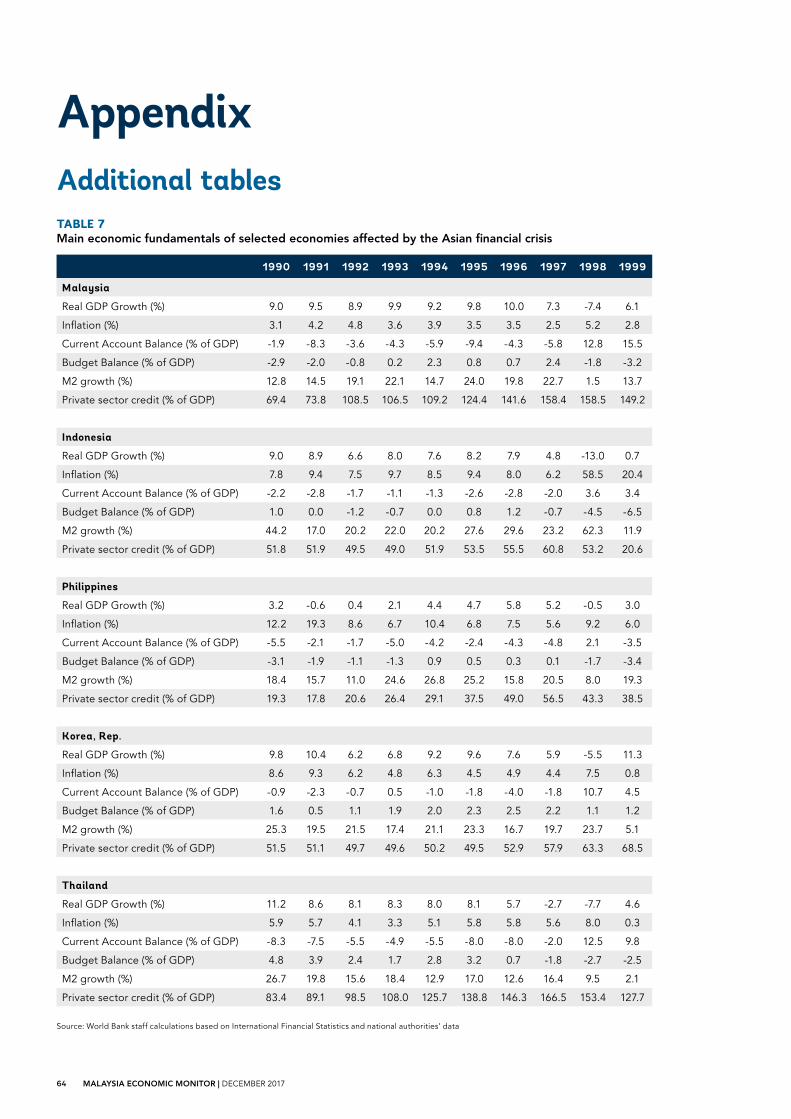
TABLE 7Main economic fundamentals of selected economies affected by the Asian financial crisis
Source: World Bank staff calculations based on International Financial Statistics and national authorities’ data
1990 1991 1992 1993 1994 1995 1996 1997 1998 1999
Malaysia
Real GDP Growth (%) 9.0 9.5 8.9 9.9 9.2 9.8 10.0 7.3 -7.4 6.1
Inflation (%) 3.1 4.2 4.8 3.6 3.9 3.5 3.5 2.5 5.2 2.8
Current Account Balance (% of GDP) -1.9 -8.3 -3.6 -4.3 -5.9 -9.4 -4.3 -5.8 12.8 15.5
Budget Balance (% of GDP) -2.9 -2.0 -0.8 0.2 2.3 0.8 0.7 2.4 -1.8 -3.2
M2 growth (%) 12.8 14.5 19.1 22.1 14.7 24.0 19.8 22.7 1.5 13.7
Private sector credit (% of GDP) 69.4 73.8 108.5 106.5 109.2 124.4 141.6 158.4 158.5 149.2
Indonesia
Real GDP Growth (%) 9.0 8.9 6.6 8.0 7.6 8.2 7.9 4.8 -13.0 0.7
Inflation (%) 7.8 9.4 7.5 9.7 8.5 9.4 8.0 6.2 58.5 20.4
Current Account Balance (% of GDP) -2.2 -2.8 -1.7 -1.1 -1.3 -2.6 -2.8 -2.0 3.6 3.4
Budget Balance (% of GDP) 1.0 0.0 -1.2 -0.7 0.0 0.8 1.2 -0.7 -4.5 -6.5
M2 growth (%) 44.2 17.0 20.2 22.0 20.2 27.6 29.6 23.2 62.3 11.9
Private sector credit (% of GDP) 51.8 51.9 49.5 49.0 51.9 53.5 55.5 60.8 53.2 20.6
Philippines
Real GDP Growth (%) 3.2 -0.6 0.4 2.1 4.4 4.7 5.8 5.2 -0.5 3.0
Inflation (%) 12.2 19.3 8.6 6.7 10.4 6.8 7.5 5.6 9.2 6.0
Current Account Balance (% of GDP) -5.5 -2.1 -1.7 -5.0 -4.2 -2.4 -4.3 -4.8 2.1 -3.5
Budget Balance (% of GDP) -3.1 -1.9 -1.1 -1.3 0.9 0.5 0.3 0.1 -1.7 -3.4
M2 growth (%) 18.4 15.7 11.0 24.6 26.8 25.2 15.8 20.5 8.0 19.3
Private sector credit (% of GDP) 19.3 17.8 20.6 26.4 29.1 37.5 49.0 56.5 43.3 38.5
Korea, Rep.
Real GDP Growth (%) 9.8 10.4 6.2 6.8 9.2 9.6 7.6 5.9 -5.5 11.3
Inflation (%) 8.6 9.3 6.2 4.8 6.3 4.5 4.9 4.4 7.5 0.8
Current Account Balance (% of GDP) -0.9 -2.3 -0.7 0.5 -1.0 -1.8 -4.0 -1.8 10.7 4.5
Budget Balance (% of GDP) 1.6 0.5 1.1 1.9 2.0 2.3 2.5 2.2 1.1 1.2
M2 growth (%) 25.3 19.5 21.5 17.4 21.1 23.3 16.7 19.7 23.7 5.1
Private sector credit (% of GDP) 51.5 51.1 49.7 49.6 50.2 49.5 52.9 57.9 63.3 68.5
Thailand
Real GDP Growth (%) 11.2 8.6 8.1 8.3 8.0 8.1 5.7 -2.7 -7.7 4.6
Inflation (%) 5.9 5.7 4.1 3.3 5.1 5.8 5.8 5.6 8.0 0.3
Current Account Balance (% of GDP) -8.3 -7.5 -5.5 -4.9 -5.5 -8.0 -8.0 -2.0 12.5 9.8
Budget Balance (% of GDP) 4.8 3.9 2.4 1.7 2.8 3.2 0.7 -1.8 -2.7 -2.5
M2 growth (%) 26.7 19.8 15.6 18.4 12.9 17.0 12.6 16.4 9.5 2.1
Private sector credit (% of GDP) 83.4 89.1 98.5 108.0 125.7 138.8 146.3 166.5 153.4 127.7
AppendixAdditional tables
64 MALAYSIA ECONOMIC MONITOR | DECEMBER 2017
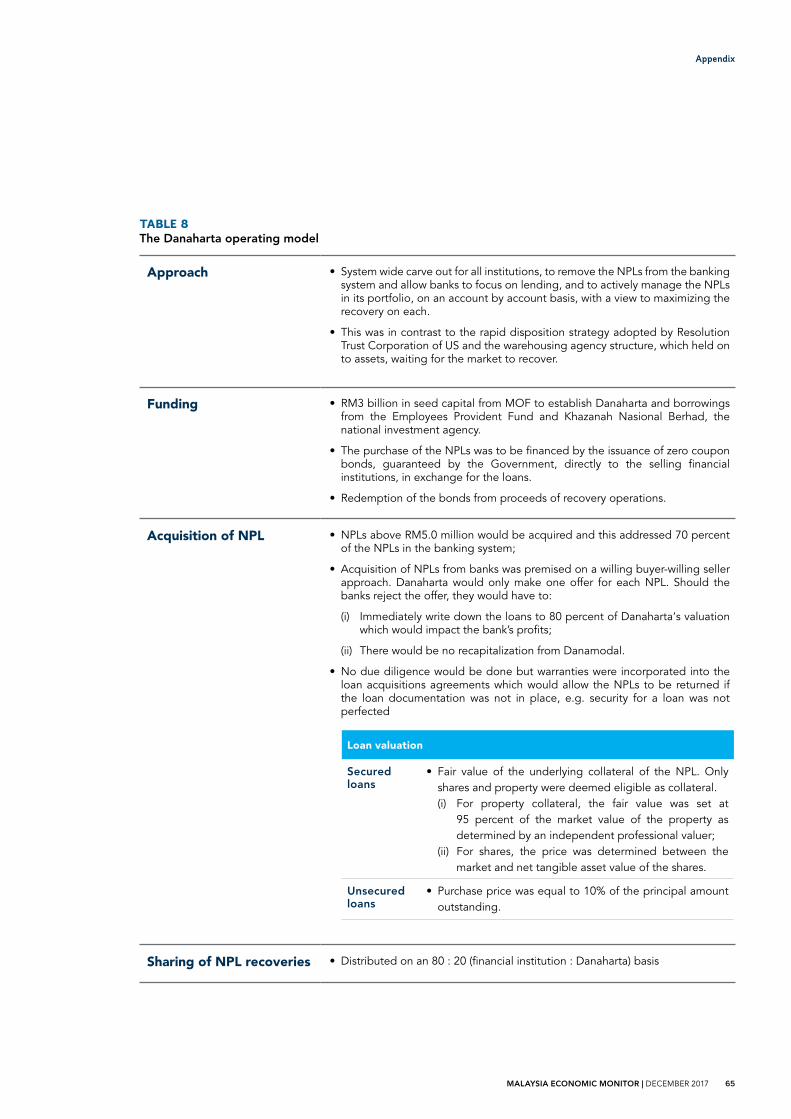
TABLE 8The Danaharta operating model
Approach • System wide carve out for all institutions, to remove the NPLs from the banking system and allow banks to focus on lending, and to actively manage the NPLs in its portfolio, on an account by account basis, with a view to maximizing the recovery on each.
• This was in contrast to the rapid disposition strategy adopted by Resolution Trust Corporation of US and the warehousing agency structure, which held on to assets, waiting for the market to recover.
Funding • RM3 billion in seed capital from MOF to establish Danaharta and borrowings from the Employees Provident Fund and Khazanah Nasional Berhad, the national investment agency.
• The purchase of the NPLs was to be financed by the issuance of zero coupon bonds, guaranteed by the Government, directly to the selling financial institutions, in exchange for the loans.
• Redemption of the bonds from proceeds of recovery operations.
Acquisition of NPL • NPLs above RM5.0 million would be acquired and this addressed 70 percent of the NPLs in the banking system;
• Acquisition of NPLs from banks was premised on a willing buyer-willing seller approach. Danaharta would only make one offer for each NPL. Should the banks reject the offer, they would have to:
(i) Immediately write down the loans to 80 percent of Danaharta‘s valuation which would impact the bank’s profits;
(ii) There would be no recapitalization from Danamodal.
• No due diligence would be done but warranties were incorporated into the loan acquisitions agreements which would allow the NPLs to be returned if the loan documentation was not in place, e.g. security for a loan was not perfected
Sharing of NPL recoveries • Distributed on an 80 : 20 (financial institution : Danaharta) basis
Loan valuation
Secured loans
• Fair value of the underlying collateral of the NPL. Only shares and property were deemed eligible as collateral.(i) For property collateral, the fair value was set at
95 percent of the market value of the property as determined by an independent professional valuer;
(ii) For shares, the price was determined between the market and net tangible asset value of the shares.
Unsecured loans
• Purchase price was equal to 10% of the principal amount outstanding.
65MALAYSIA ECONOMIC MONITOR | DECEMBER 2017
Appendix
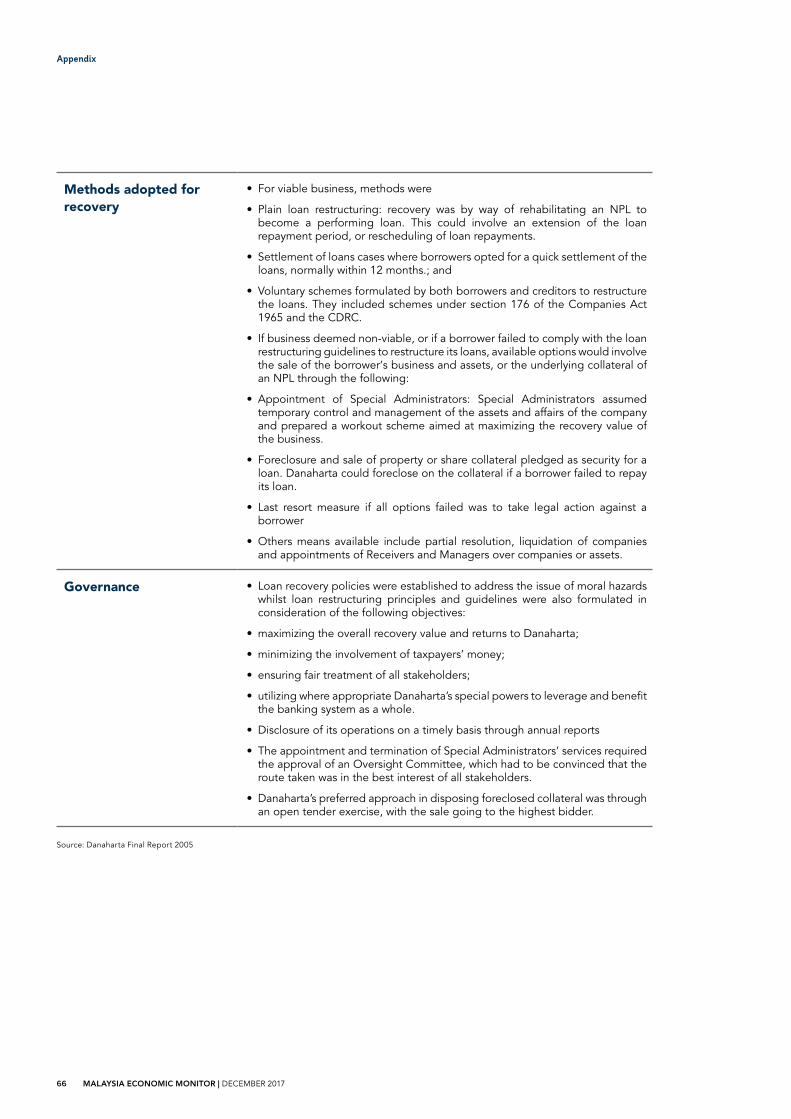
Source: Danaharta Final Report 2005
Methods adopted for recovery
• For viable business, methods were
• Plain loan restructuring: recovery was by way of rehabilitating an NPL to become a performing loan. This could involve an extension of the loan repayment period, or rescheduling of loan repayments.
• Settlement of loans cases where borrowers opted for a quick settlement of the loans, normally within 12 months.; and
• Voluntary schemes formulated by both borrowers and creditors to restructure the loans. They included schemes under section 176 of the Companies Act 1965 and the CDRC.
• If business deemed non-viable, or if a borrower failed to comply with the loan restructuring guidelines to restructure its loans, available options would involve the sale of the borrower‘s business and assets, or the underlying collateral of an NPL through the following:
• Appointment of Special Administrators: Special Administrators assumed temporary control and management of the assets and affairs of the company and prepared a workout scheme aimed at maximizing the recovery value of the business.
• Foreclosure and sale of property or share collateral pledged as security for a loan. Danaharta could foreclose on the collateral if a borrower failed to repay its loan.
• Last resort measure if all options failed was to take legal action against a borrower
• Others means available include partial resolution, liquidation of companies and appointments of Receivers and Managers over companies or assets.
Governance • Loan recovery policies were established to address the issue of moral hazards whilst loan restructuring principles and guidelines were also formulated in consideration of the following objectives:
• maximizing the overall recovery value and returns to Danaharta;
• minimizing the involvement of taxpayers’ money;
• ensuring fair treatment of all stakeholders;
• utilizing where appropriate Danaharta’s special powers to leverage and benefit the banking system as a whole.
• Disclosure of its operations on a timely basis through annual reports
• The appointment and termination of Special Administrators’ services required the approval of an Oversight Committee, which had to be convinced that the route taken was in the best interest of all stakeholders.
• Danaharta’s preferred approach in disposing foreclosed collateral was through an open tender exercise, with the sale going to the highest bidder.
66 MALAYSIA ECONOMIC MONITOR | DECEMBER 2017
Appendix
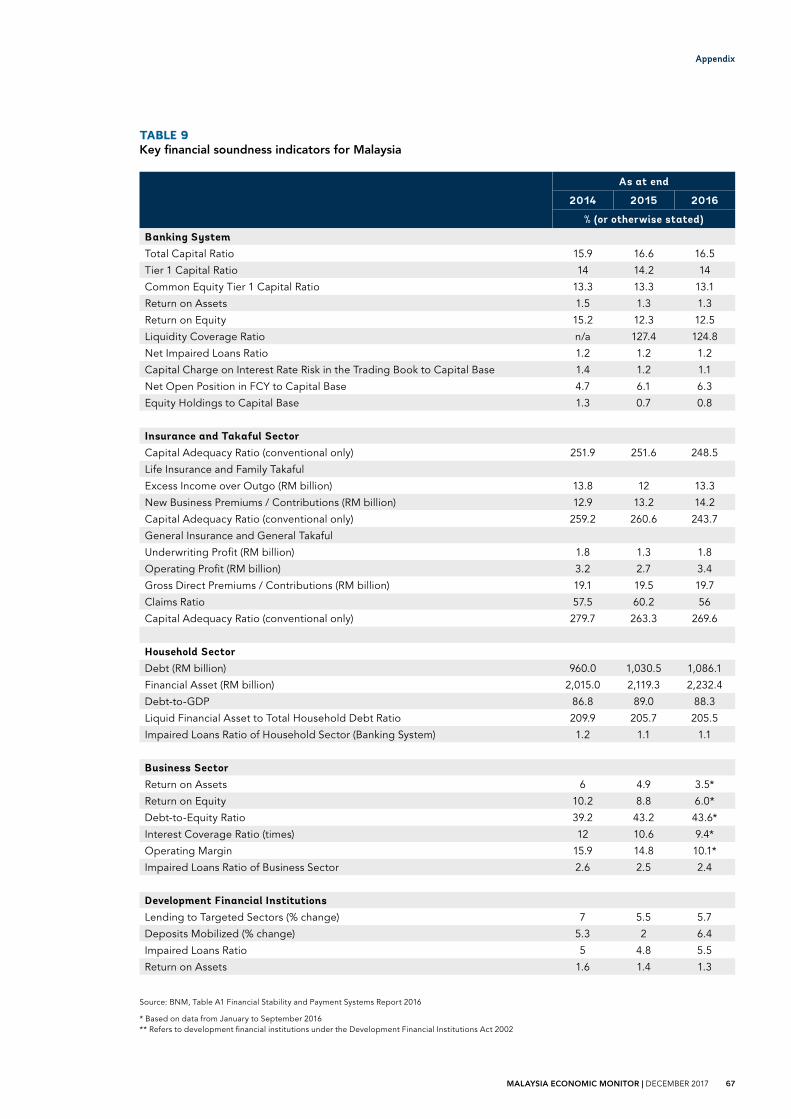
TABLE 9Key financial soundness indicators for Malaysia
As at end
2014 2015 2016
% (or otherwise stated)
Banking System Total Capital Ratio 15.9 16.6 16.5
Tier 1 Capital Ratio 14 14.2 14
Common Equity Tier 1 Capital Ratio 13.3 13.3 13.1
Return on Assets 1.5 1.3 1.3
Return on Equity 15.2 12.3 12.5
Liquidity Coverage Ratio n/a 127.4 124.8
Net Impaired Loans Ratio 1.2 1.2 1.2
Capital Charge on Interest Rate Risk in the Trading Book to Capital Base 1.4 1.2 1.1
Net Open Position in FCY to Capital Base 4.7 6.1 6.3
Equity Holdings to Capital Base 1.3 0.7 0.8
Insurance and Takaful SectorCapital Adequacy Ratio (conventional only) 251.9 251.6 248.5
Life Insurance and Family Takaful
Excess Income over Outgo (RM billion) 13.8 12 13.3
New Business Premiums / Contributions (RM billion) 12.9 13.2 14.2
Capital Adequacy Ratio (conventional only) 259.2 260.6 243.7
General Insurance and General Takaful
Underwriting Profit (RM billion) 1.8 1.3 1.8
Operating Profit (RM billion) 3.2 2.7 3.4
Gross Direct Premiums / Contributions (RM billion) 19.1 19.5 19.7
Claims Ratio 57.5 60.2 56
Capital Adequacy Ratio (conventional only) 279.7 263.3 269.6
Household Sector Debt (RM billion) 960.0 1,030.5 1,086.1
Financial Asset (RM billion) 2,015.0 2,119.3 2,232.4
Debt-to-GDP 86.8 89.0 88.3
Liquid Financial Asset to Total Household Debt Ratio 209.9 205.7 205.5
Impaired Loans Ratio of Household Sector (Banking System) 1.2 1.1 1.1
Business Sector Return on Assets 6 4.9 3.5*
Return on Equity 10.2 8.8 6.0*
Debt-to-Equity Ratio 39.2 43.2 43.6*
Interest Coverage Ratio (times) 12 10.6 9.4*
Operating Margin 15.9 14.8 10.1*
Impaired Loans Ratio of Business Sector 2.6 2.5 2.4
Development Financial Institutions Lending to Targeted Sectors (% change) 7 5.5 5.7
Deposits Mobilized (% change) 5.3 2 6.4
Impaired Loans Ratio 5 4.8 5.5
Return on Assets 1.6 1.4 1.3
Source: BNM, Table A1 Financial Stability and Payment Systems Report 2016
* Based on data from January to September 2016** Refers to development financial institutions under the Development Financial Institutions Act 2002
67MALAYSIA ECONOMIC MONITOR | DECEMBER 2017
Appendix
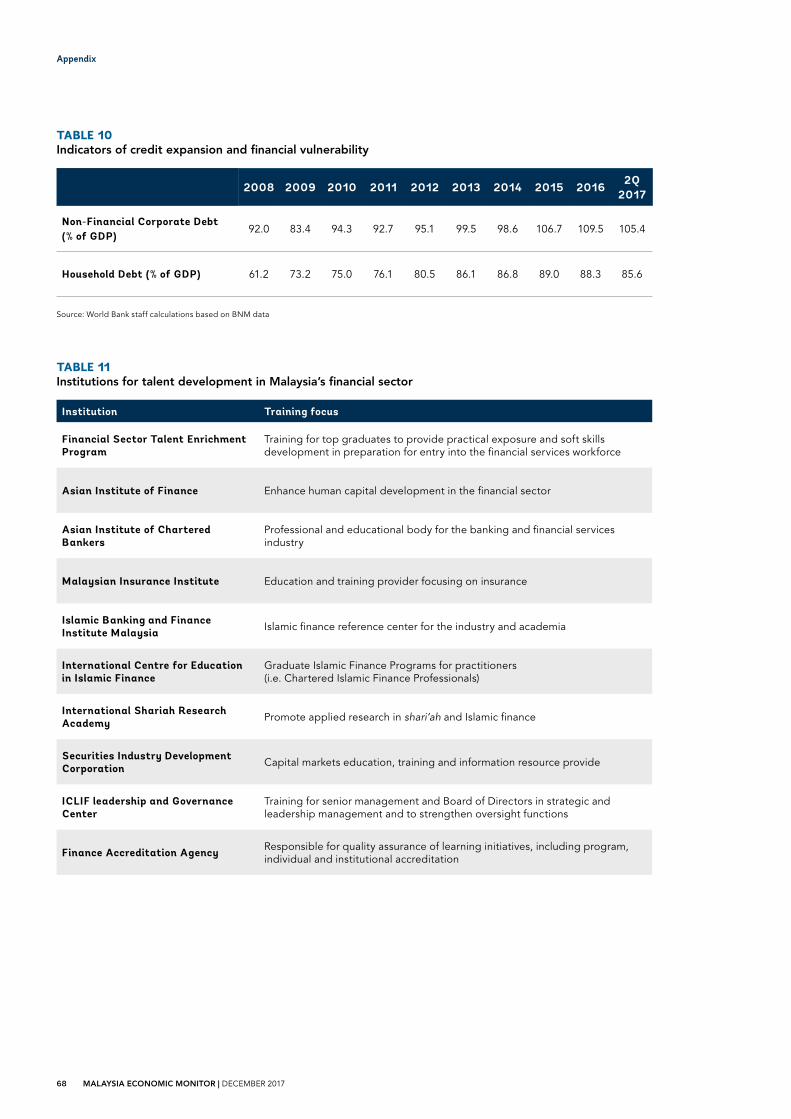
TABLE 10Indicators of credit expansion and financial vulnerability
Source: World Bank staff calculations based on BNM data
TABLE 11Institutions for talent development in Malaysia’s financial sector
Institution Training focus
Financial Sector Talent Enrichment Program
Training for top graduates to provide practical exposure and soft skills development in preparation for entry into the financial services workforce
Asian Institute of Finance Enhance human capital development in the financial sector
Asian Institute of Chartered Bankers
Professional and educational body for the banking and financial services industry
Malaysian Insurance Institute Education and training provider focusing on insurance
Islamic Banking and Finance Institute Malaysia Islamic finance reference center for the industry and academia
International Centre for Education in Islamic Finance
Graduate Islamic Finance Programs for practitioners(i.e. Chartered Islamic Finance Professionals)
International Shariah Research Academy Promote applied research in shari’ah and Islamic finance
Securities Industry Development Corporation Capital markets education, training and information resource provide
ICLIF leadership and Governance Center
Training for senior management and Board of Directors in strategic and leadership management and to strengthen oversight functions
Finance Accreditation Agency Responsible for quality assurance of learning initiatives, including program, individual and institutional accreditation
2008 2009 2010 2011 2012 2013 2014 2015 2016 2Q 2017
Non-Financial Corporate Debt (% of GDP)
92.0 83.4 94.3 92.7 95.1 99.5 98.6 106.7 109.5 105.4
Household Debt (% of GDP) 61.2 73.2 75.0 76.1 80.5 86.1 86.8 89.0 88.3 85.6
68 MALAYSIA ECONOMIC MONITOR | DECEMBER 2017
Appendix
An index for measuring exchange rate flexibility and monetary independence
To measure the Monetary independence in a country and how flexible is the exchange rate regime we rely on the methodology developed by Aizenman et al. (2008) that measure the degree to which each of the two policy choices is implemented by a country at a point in time.
Monetary independence index
The monetary independence index (MI) is measured as the reciprocal of the annual correlation between the monthly interest rate of a country with the base country’s interest rate (in general this is the US fed fund rate). The index is defined as:
Where i refers to the country we are analyzing and j is the base country (here it is the US). By definition, the maximum value of the index is 1 and the minimum is 0. When monetary policy depends completely on the base country (e.g. in a currency board) the correlation is 1 and therefore the index is 0. The interest rate used to construct the index is the money market, and the data comes from the International Financial Statistics.
Exchange rate stability indexThe index is based on an invert of exchange rate volatility, that is, standard deviations of the monthly rate of depreciation for the exchange rate between a country and the base economies (in this case the US).
By construction the index is between 0 and 1.
MALAYSIA ECONOMIC MONITOR – DECEMBER 2017 68
An index for measuring exchange rate flexibility and monetary independence To measure the Monetary independence in a country and how flexible is the exchange rate regime we rely on the methodology developed by Aizenman et al. (2008) that measure the degree to which each of the two policy choices is implemented by a country at a point in time. Monetary independence index The monetary independence index (MI) is measured as the reciprocal of the annual correlation between the monthly interest rate of a country with the base country’s interest rate (in general this is the US fed fund rate). The index is defined as:
𝑀𝑀𝑀𝑀 = 1 −𝑐𝑐𝑐𝑐𝑐𝑐𝑐𝑐 𝑖𝑖! , 𝑖𝑖! − (−1)
1 − (−1)
Where 𝑖𝑖 refers to the country we are analyzing and 𝑗𝑗 is the base country (here it is the US). By definition, the maximum value of the index is 1 and the minimum is 0. When monetary policy depends completely on the base country (e.g. in a currency board) the correlation is 1 and therefore the index is 0. The interest rate used to construct the index is the money market, and the data comes from the International Financial Statistics.
Exchange rate stability index
The index is based on an invert of exchange rate volatility, that is, standard deviations of the monthly rate of depreciation for the exchange rate between a country and the base economies (in this case the US).
𝐸𝐸𝐸𝐸𝐸𝐸 =0.01
0.01 + 𝑠𝑠𝑠𝑠𝑠𝑠𝑠𝑠𝑠𝑠(Δ(log (𝑒𝑒𝑒𝑒𝑒𝑒ℎ_𝑟𝑟𝑟𝑟𝑟𝑟𝑟𝑟))
By construction the index is between 0 and 1.
69MALAYSIA ECONOMIC MONITOR | DECEMBER 2017
Appendix
References
Abdelal, Rawi and Laura Alfaro (2003) ‘Malaysia: Capital and Control’, Harvard Business School Case Study No. 9-702-040, Cambridge, Mass: Harvard Business School.
Aizenman, Joshua, Menzie Chinn and Hiro Ito (2008) ‘Assessing the Emerging Global Financial Architecture: Measuring the Trilemma’s Configurations over Time’, NBER Working Paper No. 14533.
AMRO (2017) ‘ASEAN+3 Regional Economic Outlook – 20 Years after the Asian financial crisis’, Singapore: ASEAN+3 Macroeconomic Research Office.
BNM (1997–2005) Annual Report, selected years, Kuala Lumpur: Bank Negara Malaysia.
BNM (2006–2016) Financial Stability and Payment Systems Report, selected years, Kuala Lumpur: Bank Negara Malaysia.
BNM (2017) Quarterly Bulletin, Kuala Lumpur: Bank Negara Malaysia.
Lindgren, Carl-Johan, Tomás Baliño, Charles Enoch, Anne-Marie Gulde, Marc Quintyn, and Leslie Teo (1999) ‘Financial Sector Crisis and Restructuring: Lessons from Asia’, Occasional Paper 188, Washington, DC: International Monetary Fund.
Chamon, Marcos, Mahvesh Qureshi, Jonathan Ostry and Atish Ghosh (2011) ‘Managing Capital Inflows: The Role of Capital Controls and Prudential Policies‘, NBER Working Paper No. 17363.
Danaharta (2005) Final Report, Kuala Lumpur: Pengurusan Danaharta Nasional Berhad.
Eichengreen, Barry (2017) ‘The East-West Debate over the Asian financial crisis’, Federal Reserve Bank of San Francisco Pacific Exchanges Podcast.
EPU (1998) National Economic Recovery Plan, National Economic Action Council, Prime Minister’s Department, Kuala Lumpur: Economic Planning Unit.
EPU (2017) ‘The 1997/98 Asian financial crisis and Malaysia’s Response’, Presentation, Putrajaya: Economic Planning Unit.
Farhi, Emmanuel and Ivan Werning (2014) ‘Dilemma Not Trilemma? Capital Controls and Exchange Rates with Volatile Capital Flows‘, IMF Economic Review, 62: 569-605.
Islamic Financial Services Board (2017) Islamic Financial Services Industry Stability Report, Kuala Lumpur.
Jeasakul, Phakawa, Cheng Hoon Lim and Erik Lundback (2014) ‘Why was Asia Resilient? Lessons from the Past and for the Future’, IMF Working Paper 14/38, Washington, DC: International Monetary Fund.
Kaplan, Ethan and Dani Rodrik (2001) ‘Did the Malaysian Capital Controls work? ‘, NBER Working Paper No. 8142.
Khor, Martin (2005) ‘The Malaysian Experience in Financial-Economic Crisis Management: An Alternative to the IMF-Style Approach’, Third World Network.
Korinek, Anton and Damiano Sandri (2016) ‘Capital Controls or Macro Prudential Regulation?‘, Journal of International Economics, 99(1):27-42.
Laldin, Mohamad Akram, ‘Islamic Financial System: the Malaysian Experience and the Way Forward’. (2008) "Islamic financial system: the Malaysian experience and the way forward", Humanomics, Vol. 24 Issue: 3, pp.217-238,
Lee, Eddy (2001) ‘The Debate on the Causes of the Asian Crisis: Crony Capitalism versus International System Failure’, IPG 2/99.
Lorenzoni, Guido (2014) ‘International Financial Crises‘, Handbook of International Economics 4:689-740, Elsevier.
IMF/World Bank (2013) ‘Malaysia: Financial Sector Assessment’, Report No. 75956, Washington, DC: International Monetary Fund and the World Bank.
70 MALAYSIA ECONOMIC MONITOR | DECEMBER 2017
IMF (2017) ‘Malaysia: Article IV Consultation’, Staff Report, IMF Country Report No. 17/101, Washington, DC: International Monetary Fund.
Mahani, Zainal-Abidin (2000) ‘Malaysian Economic Recovery Measures: A Response to Crisis Management and for Long-term Economic Sustainability’, Working Paper, Faculty of Economics and Administration, University of Malaya.
Mahani Zainal Abidin (2002), Malaysia’s Past and Present Economic Priorities, FEA Working Paper No. 2002-8.
Mohamad, Mahathir (2000) ‘The Malaysian Currency Crisis: How and Why it Happened’, Kuala Lumpur: Pelanduk Publications.
Securities Commission Malaysia (2001), Malaysia Capital Markets Master Plan 2001-2010, Kuala Lumpur: Securities Commission Malaysia.
Securities Commission Malaysia (2011), Malaysia Capital Markets Master Plan 2011-2020, Kuala Lumpur: Securities Commission Malaysia.
Stiglitz, Joseph (2002) ‘The East Asia Crisis – How IMF Policies Brought the World to the Verge of a Global Meltdown’, in Globalization and its Discontents, New York: Norton.
World Bank (1999a) ‘Country Assistance Strategy for Malaysia’, Report No. 18812-MA, Washington, DC: The World Bank.
World Bank (1999b) ‘Implementation Completion Report for an Economic Recovery and Social Sector Loan’, Report No. 19826-MA, Washington, DC: The World Bank.
World Bank (2013) World Development Report 2014: Risk and Opportunity – Managing Risk for Development, Washington, DC: The World Bank.
World Bank (2017a) ‘Financial Inclusion in Malaysia: Distilling Lessons for Other Countries’, Knowledge and Research Series, Kuala Lumpur: The World Bank.
World Bank (2017b) East Asian and Pacific Economic Update, October 2017: Balancing Act, Washington, DC: The World Bank.
World Bank (2017c) Global Economic Prospects, June 2017: A Fragile Recovery, Washington, DC: The World Bank.
71MALAYSIA ECONOMIC MONITOR | DECEMBER 2017
References

CONNECT WITH US
wbg.org/Malaysia
@WorldBankMalaysia
@WB_AsiaPacific
blogs.worldbank.org/category/countries/malaysia