Embed Size (px)
Citation preview
ed-CK / sa- WMT, PY
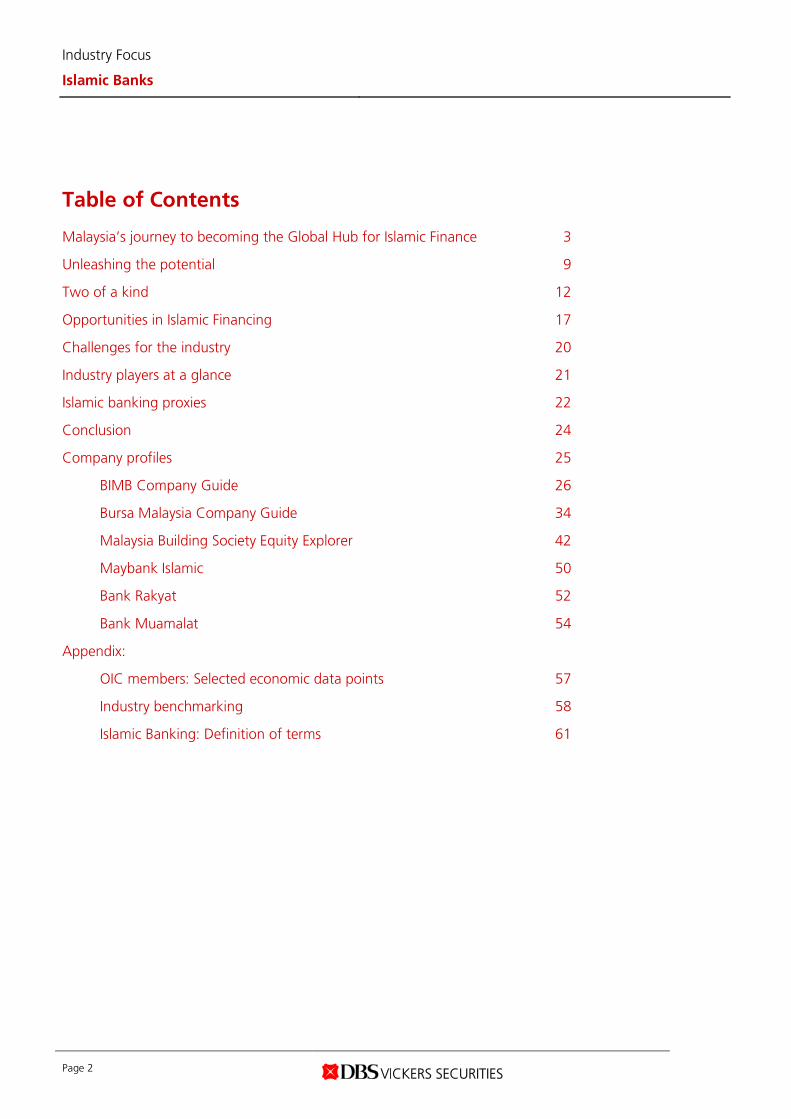
The unconventional banking aspect • Domestic Islamic financing growth expected to
continue outpacing conventional loan growth, driven by regulatory push for internationalization of Islamic finance
• Hopes for further growth pinned on increase in financial inclusion through product innovation
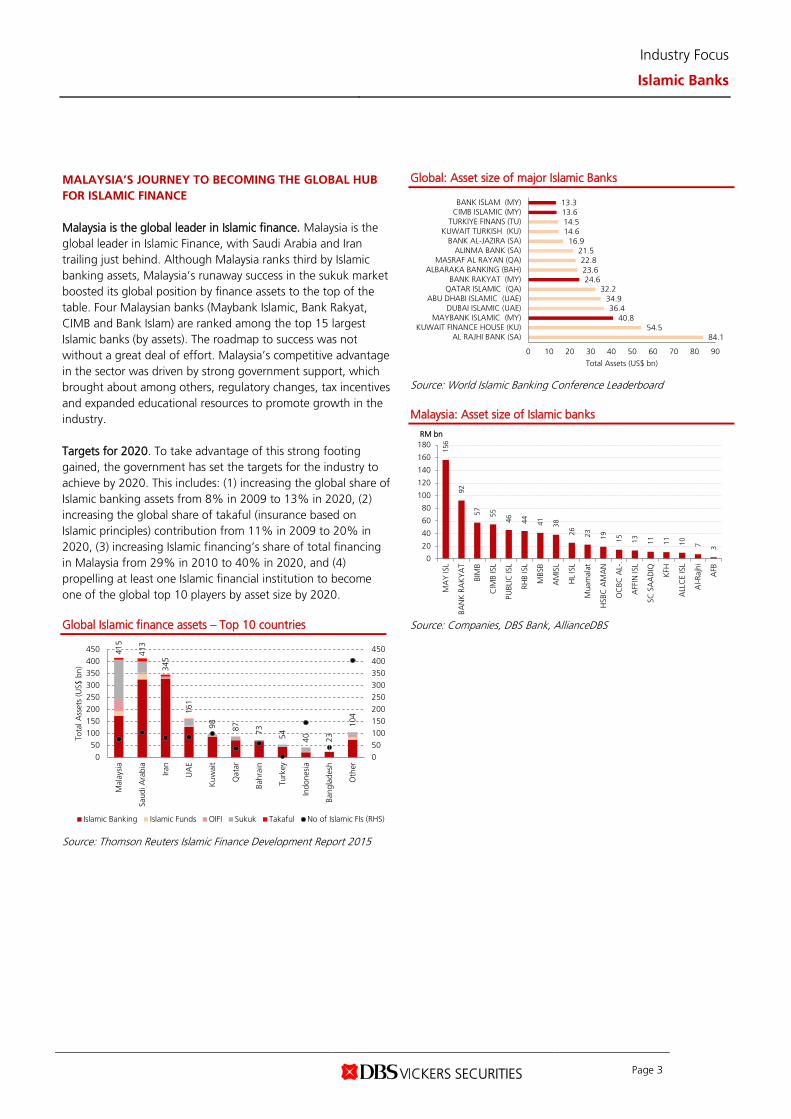
• Main Islamic banking proxy – BIMB – as the largest Bursa-listed Shariah compliant financial institution with strong potential to lead product innovation
• Traction on BURSA’s commodity trading platform makes it an indirect proxy; MBSB is a potential M&A play
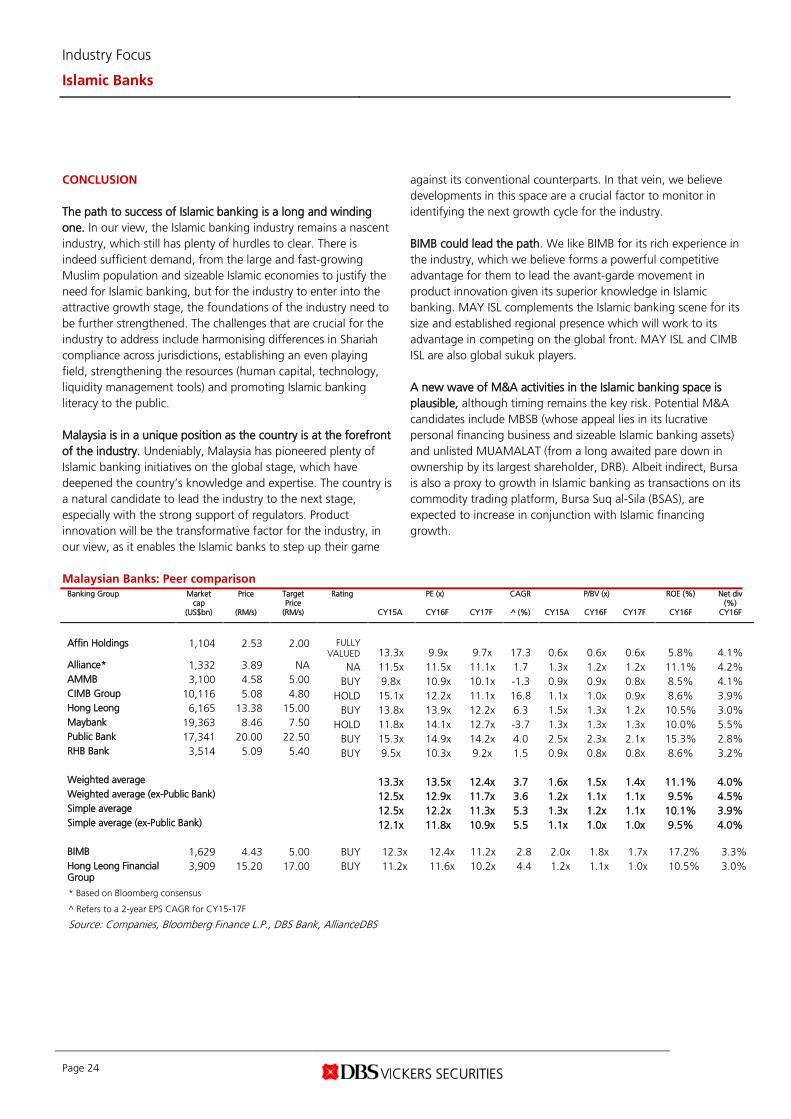
Profit-sharing principle of banking. Islamic banking is based on Islamic principle transactions of which profit (and loss) sharing is a major feature ensuring justice and equity in an economy. The financial relationships established are deemed to be participatory in nature. Islamic banking technically bans the receipt and payment of interest in any of its operations. In the most basic way, this sets Islamic banking apart from conventional banking. To realize the full potential of demand for Islamic banking from sizeable Muslim population and other Muslim-dominant countries, issues to overcome include non-uniformity in Shariah views, establishing an even playing field, and strengthening resources and awareness are among the key issues for this segment. Product innovation to be the game-changer for industry. Given the knowledge and expertise acquired through actively pioneering initiatives and delivering solutions in the Islamic banking industry, Malaysia is indisputably making inroads to becoming the global hub for Islamic finance. We expect domestic Islamic financing growth to continue outpacing conventional loan growth with a 4-year CAGR of 12% over FY15-20F, as opposed to 2% for conventional loans. This is mainly underpinned by a growing push by the banks to fulfil BNM’s target of 40% proportion of Islamic financing to total system loans. Further upside to this could come from improvement in financial inclusion and regionalisation of Islamic finance. In order to achieve this, we believe Islamic banks should differentiate itself from their conventional peers through product innovation. BIMB, the main Islamic banking proxy in Malaysia. We like BIMB (holding company of Bank Islam) for its deep-rooted expertise in the industry, which we believe forms a strong competitive advantage as it positions them as a likely leader in product innovation. Maybank Islamic complements the Islamic banking scene for its size and established regional presence which will work to its advantage in competing on the global front. A new wave of M&A activities in the Islamic banking space is plausible although the timing remains the key risk. Potential M&A candidates include MBSB (whose appeal lies in its lucrative personal financing business and sizeable Islamic banking asset; featured as an Equity Explorer in this report) and unlisted MUAMALAT (from a long-awaited pare-down in stake by its largest shareholder, DRB). Albeit more indirectly, Bursa Malaysia is an indirect proxy as transactions on its commodity trading platform are expected to increase in conjunction with Islamic financing growth.
KLCI : 1,707.68
Analyst Lynette CHENG +60 32604 3907 Sue Lin LIM +65 8332 6843 [email protected] [email protected]
STOCKS
Source: DBS Bank, Bloomberg Finance L.P. Closing price as of 17 Feb 2017 Financing growth for Islamic banking to outpace conventional banking in Malaysia
Source: BNM, DBS Bank, AllianceDBS Maybank Islamic and BIMB among the biggest global Islamic banks
Source: World Islamic Banking Conference Leaderboard, DBS Bank, AllianceDBS
0
5
10
15
20
25
30
-
500
1,000
1,500
2,000
2009
2010
2011
2012
2013
2014
2015
2016
2017
F
2018
F
2019
F
2020
F
%RM bn
Islamic banking Conventional bankingConventional banking growth Islamic banking growthTotal banking system growth
84.154.5
40.836.4
34.932.2
24.623.622.8
21.516.9
14.614.513.613.3
0 10 20 30 40 50 60 70 80 90
AL RAJHI BANK (SA)KUWAIT FINANCE HOUSE (KU)
MAYBANK ISLAMIC (MY)DUBAI ISLAMIC (UAE)
ABU DHABI ISLAMIC (UAE)QATAR ISLAMIC (QA)BANK RAKYAT (MY)
ALBARAKA BANKING (BAH)MASRAF AL RAYAN (QA)
ALINMA BANK (SA)BANK AL-JAZIRA (SA)
KUWAIT TURKISH (KU)TURKIYE FINANS (TU)
CIMB ISLAMIC (MY)BANK ISLAM (MY)
Total Assets (US$ bn)
DBS Group Research . Equity
20 Feb 2017
Malaysia Industry Focus
Islamic Banks
Refer to important disclosures at the end of this report
Price Mkt Cap Target Price Performance (%)
RM US$m RM 3 mth 12 mth Rating
Maybank 8.46 19,363 7.50 10.2 (1.2) HOLD BIMB Holdings
4.43 1,629 5.00 4.5 25.5 BUY
Bursa Malaysia 8.81 1,061 10.00 3.0 5.3 BUY Malaysia Building Society Berhad
1.15 1,497 NA 27.8 (14.5) NOT RATED
Industry Focus
Islamic Banks
Page 2
Table of Contents Malaysia’s journey to becoming the Global Hub for Islamic Finance 3
Unleashing the potential 9
Two of a kind 12
Opportunities in Islamic Financing 17
Challenges for the industry 20
Industry players at a glance 21
Islamic banking proxies 22
Conclusion 24
Company profiles 25
BIMB Company Guide 26
Bursa Malaysia Company Guide 34
Malaysia Building Society Equity Explorer 42
Maybank Islamic 50
Bank Rakyat 52
Bank Muamalat 54
Appendix:
OIC members: Selected economic data points 57
Industry benchmarking 58
Islamic Banking: Definition of terms 61
Industry Focus
Islamic Banks
Page 3
MALAYSIA’S JOURNEY TO BECOMING THE GLOBAL HUB FOR ISLAMIC FINANCE Malaysia is the global leader in Islamic finance. Malaysia is the global leader in Islamic Finance, with Saudi Arabia and Iran trailing just behind. Although Malaysia ranks third by Islamic banking assets, Malaysia’s runaway success in the sukuk market boosted its global position by finance assets to the top of the table. Four Malaysian banks (Maybank Islamic, Bank Rakyat, CIMB and Bank Islam) are ranked among the top 15 largest Islamic banks (by assets). The roadmap to success was not without a great deal of effort. Malaysia’s competitive advantage in the sector was driven by strong government support, which brought about among others, regulatory changes, tax incentives and expanded educational resources to promote growth in the industry. Targets for 2020. To take advantage of this strong footing gained, the government has set the targets for the industry to achieve by 2020. This includes: (1) increasing the global share of Islamic banking assets from 8% in 2009 to 13% in 2020, (2) increasing the global share of takaful (insurance based on Islamic principles) contribution from 11% in 2009 to 20% in 2020, (3) increasing Islamic financing’s share of total financing in Malaysia from 29% in 2010 to 40% in 2020, and (4) propelling at least one Islamic financial institution to become one of the global top 10 players by asset size by 2020. Global Islamic finance assets – Top 10 countries
Source: Thomson Reuters Islamic Finance Development Report 2015
Global: Asset size of major Islamic Banks
Source: World Islamic Banking Conference Leaderboard Malaysia: Asset size of Islamic banks
Source: Companies, DBS Bank, AllianceDBS
415
413
345
161
98 87 73 54 40 23
104
0
50
100
150
200
250
300
350
400
450
0
50
100
150
200
250
300
350
400
450
Mal
aysi
a
Saud
i Ara
bia
Iran
UA
E
Kuw
ait
Qat
ar
Bahr
ain
Turk
ey
Indo
nesi
a
Bang
lade
sh
Oth
er
Tota
l Ass
ets
(US$
bn)
Islamic Banking Islamic Funds OIFI Sukuk Takaful No of Islamic FIs (RHS)
84.154.5
40.836.4
34.932.2
24.623.622.8
21.516.9
14.614.513.613.3
0 10 20 30 40 50 60 70 80 90
AL RAJHI BANK (SA)KUWAIT FINANCE HOUSE (KU)
MAYBANK ISLAMIC (MY)DUBAI ISLAMIC (UAE)
ABU DHABI ISLAMIC (UAE)QATAR ISLAMIC (QA)BANK RAKYAT (MY)
ALBARAKA BANKING (BAH)MASRAF AL RAYAN (QA)
ALINMA BANK (SA)BANK AL-JAZIRA (SA)
KUWAIT TURKISH (KU)TURKIYE FINANS (TU)
CIMB ISLAMIC (MY)BANK ISLAM (MY)
Total Assets (US$ bn)
156
92
57
55
46
44
41
38
26
23
19
15
13
11
11
10
7 3
0
20
40
60
80
100
120
140
160
180M
AY
ISL
BAN
K R
AK
YA
T
BIM
B
CIM
B IS
L
PUBL
IC IS
L
RHB
ISL
MBS
B
AM
ISL
HL
ISL
Mua
mal
at
HSB
C A
MA
N
OC
BC A
L-…
AFF
IN IS
L
SC S
AA
DIQ
KFH
ALL
CE
ISL
Al-R
ajhi
AFB
RM bn
Industry Focus
Islamic Banks
Page 4
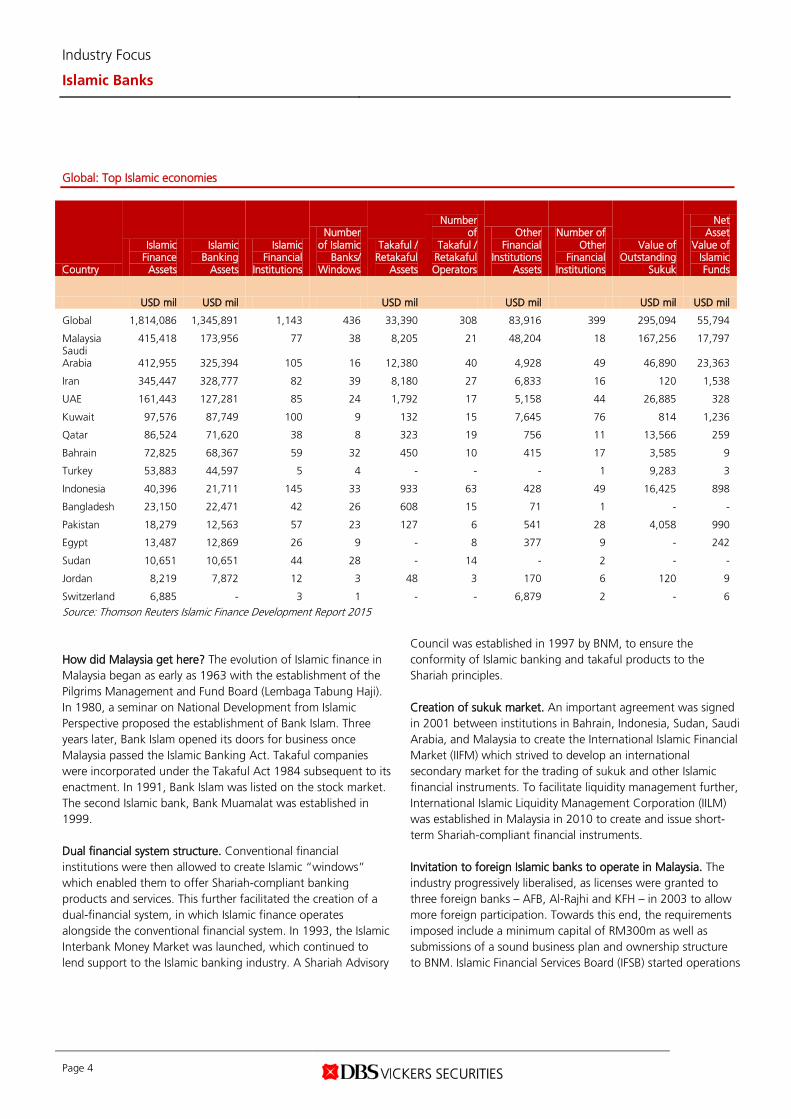
Global: Top Islamic economies
Country
Islamic Finance
Assets
Islamic Banking
Assets
Islamic Financial
Institutions
Number of Islamic
Banks/ Windows
Takaful / Retakaful
Assets
Number of
Takaful / Retakaful Operators
Other Financial
Institutions Assets
Number of Other
Financial Institutions
Value of Outstanding
Sukuk
Net Asset
Value of Islamic Funds
USD mil USD mil USD mil USD mil USD mil USD mil
Global 1,814,086 1,345,891 1,143 436 33,390 308 83,916 399 295,094 55,794
Malaysia 415,418 173,956 77 38 8,205 21 48,204 18 167,256 17,797 Saudi Arabia 412,955 325,394 105 16 12,380 40 4,928 49 46,890 23,363
Iran 345,447 328,777 82 39 8,180 27 6,833 16 120 1,538
UAE 161,443 127,281 85 24 1,792 17 5,158 44 26,885 328
Kuwait 97,576 87,749 100 9 132 15 7,645 76 814 1,236
Qatar 86,524 71,620 38 8 323 19 756 11 13,566 259
Bahrain 72,825 68,367 59 32 450 10 415 17 3,585 9
Turkey 53,883 44,597 5 4 - - - 1 9,283 3
Indonesia 40,396 21,711 145 33 933 63 428 49 16,425 898
Bangladesh 23,150 22,471 42 26 608 15 71 1 - -
Pakistan 18,279 12,563 57 23 127 6 541 28 4,058 990
Egypt 13,487 12,869 26 9 - 8 377 9 - 242
Sudan 10,651 10,651 44 28 - 14 - 2 - -
Jordan 8,219 7,872 12 3 48 3 170 6 120 9
Switzerland 6,885 - 3 1 - - 6,879 2 - 6 Source: Thomson Reuters Islamic Finance Development Report 2015 How did Malaysia get here? The evolution of Islamic finance in Malaysia began as early as 1963 with the establishment of the Pilgrims Management and Fund Board (Lembaga Tabung Haji). In 1980, a seminar on National Development from Islamic Perspective proposed the establishment of Bank Islam. Three years later, Bank Islam opened its doors for business once Malaysia passed the Islamic Banking Act. Takaful companies were incorporated under the Takaful Act 1984 subsequent to its enactment. In 1991, Bank Islam was listed on the stock market. The second Islamic bank, Bank Muamalat was established in 1999. Dual financial system structure. Conventional financial institutions were then allowed to create Islamic “windows” which enabled them to offer Shariah-compliant banking products and services. This further facilitated the creation of a dual-financial system, in which Islamic finance operates alongside the conventional financial system. In 1993, the Islamic Interbank Money Market was launched, which continued to lend support to the Islamic banking industry. A Shariah Advisory
Council was established in 1997 by BNM, to ensure the conformity of Islamic banking and takaful products to the Shariah principles. Creation of sukuk market. An important agreement was signed in 2001 between institutions in Bahrain, Indonesia, Sudan, Saudi Arabia, and Malaysia to create the International Islamic Financial Market (IIFM) which strived to develop an international secondary market for the trading of sukuk and other Islamic financial instruments. To facilitate liquidity management further, International Islamic Liquidity Management Corporation (IILM) was established in Malaysia in 2010 to create and issue short-term Shariah-compliant financial instruments. Invitation to foreign Islamic banks to operate in Malaysia. The industry progressively liberalised, as licenses were granted to three foreign banks – AFB, Al-Rajhi and KFH – in 2003 to allow more foreign participation. Towards this end, the requirements imposed include a minimum capital of RM300m as well as submissions of a sound business plan and ownership structure to BNM. Islamic Financial Services Board (IFSB) started operations
Industry Focus
Islamic Banks
Page 5
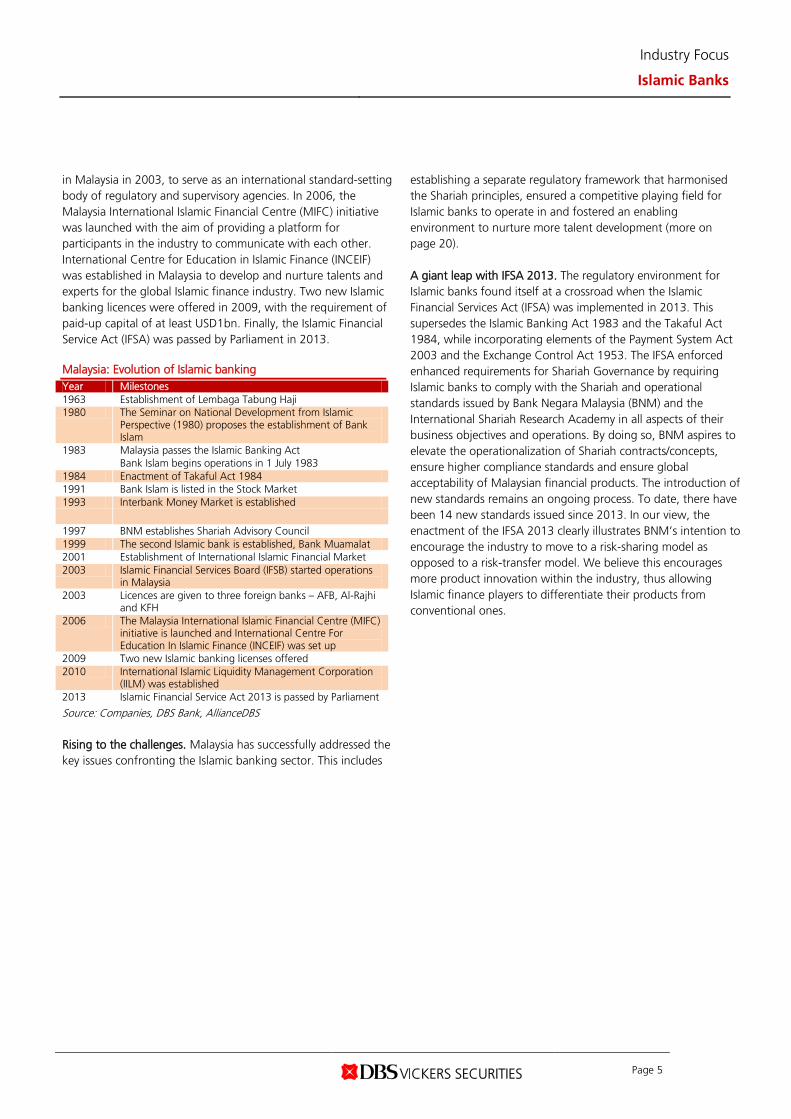
in Malaysia in 2003, to serve as an international standard-setting body of regulatory and supervisory agencies. In 2006, the Malaysia International Islamic Financial Centre (MIFC) initiative was launched with the aim of providing a platform for participants in the industry to communicate with each other. International Centre for Education in Islamic Finance (INCEIF) was established in Malaysia to develop and nurture talents and experts for the global Islamic finance industry. Two new Islamic banking licences were offered in 2009, with the requirement of paid-up capital of at least USD1bn. Finally, the Islamic Financial Service Act (IFSA) was passed by Parliament in 2013. Malaysia: Evolution of Islamic banking Year Milestones 1963 Establishment of Lembaga Tabung Haji 1980 The Seminar on National Development from Islamic
Perspective (1980) proposes the establishment of Bank Islam
1983 Malaysia passes the Islamic Banking Act Bank Islam begins operations in 1 July 1983
1984 Enactment of Takaful Act 1984 1991 Bank Islam is listed in the Stock Market 1993 Interbank Money Market is established
1997 BNM establishes Shariah Advisory Council 1999 The second Islamic bank is established, Bank Muamalat 2001 Establishment of International Islamic Financial Market 2003 Islamic Financial Services Board (IFSB) started operations
in Malaysia 2003 Licences are given to three foreign banks – AFB, Al-Rajhi
and KFH 2006 The Malaysia International Islamic Financial Centre (MIFC)
initiative is launched and International Centre For Education In Islamic Finance (INCEIF) was set up
2009 Two new Islamic banking licenses offered 2010 International Islamic Liquidity Management Corporation
(IILM) was established 2013 Islamic Financial Service Act 2013 is passed by Parliament
Source: Companies, DBS Bank, AllianceDBS Rising to the challenges. Malaysia has successfully addressed the key issues confronting the Islamic banking sector. This includes
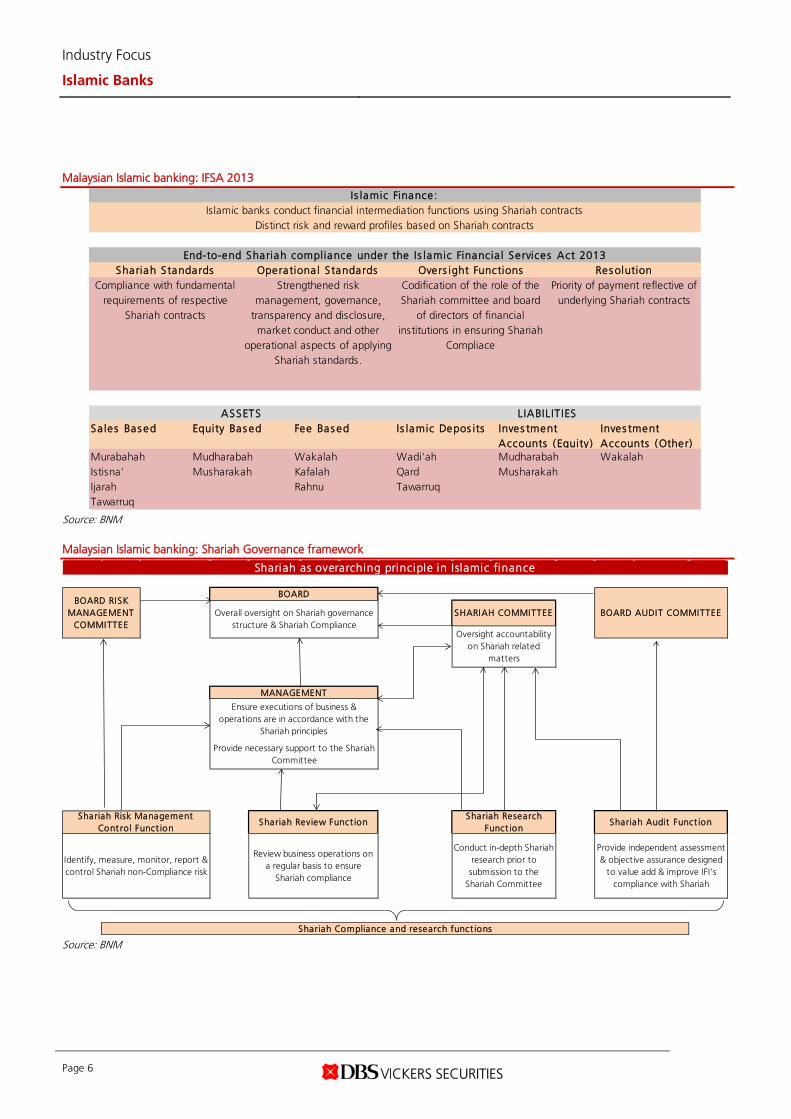
establishing a separate regulatory framework that harmonised the Shariah principles, ensured a competitive playing field for Islamic banks to operate in and fostered an enabling environment to nurture more talent development (more on page 20). A giant leap with IFSA 2013. The regulatory environment for Islamic banks found itself at a crossroad when the Islamic Financial Services Act (IFSA) was implemented in 2013. This supersedes the Islamic Banking Act 1983 and the Takaful Act 1984, while incorporating elements of the Payment System Act 2003 and the Exchange Control Act 1953. The IFSA enforced enhanced requirements for Shariah Governance by requiring Islamic banks to comply with the Shariah and operational standards issued by Bank Negara Malaysia (BNM) and the International Shariah Research Academy in all aspects of their business objectives and operations. By doing so, BNM aspires to elevate the operationalization of Shariah contracts/concepts, ensure higher compliance standards and ensure global acceptability of Malaysian financial products. The introduction of new standards remains an ongoing process. To date, there have been 14 new standards issued since 2013. In our view, the enactment of the IFSA 2013 clearly illustrates BNM’s intention to encourage the industry to move to a risk-sharing model as opposed to a risk-transfer model. We believe this encourages more product innovation within the industry, thus allowing Islamic finance players to differentiate their products from conventional ones.
Industry Focus
Islamic Banks
Page 6
Malaysian Islamic banking: IFSA 2013
Source: BNM Malaysian Islamic banking: Shariah Governance framework
Source: BNM
End-to-end Shariah compliance under the Is lamic Financia l Services Act 2013
Is lamic Finance:Islamic banks conduct financial intermediation functions using Shariah contracts
Distinct risk and reward profiles based on Shariah contracts
ASSETS LIABILIT IES
Shariah StandardsCompliance with fundamental
requirements of respective Shariah contracts
Operationa l S tandardsStrengthened risk
management, governance, transparency and disclosure, market conduct and other
operational aspects of applying Shariah standards.
Overs ight FunctionsCodification of the role of the Shariah committee and board
of directors of financial institutions in ensuring Shariah
Compliace
Res olutionPriority of payment reflective of
underlying Shariah contracts
Inves tment Accounts (Other)Wakalah
Equity Bas ed
MudharabahMusharakah
Tawarruq
Fee Bas ed
WakalahKafalahRahnu
Is lamic Depos its
Wadi'ahQardTawarruq
MudharabahMusharakah
Inves tment Accounts (Equity)
Sa les Bas ed
MurabahahIstisna'Ijarah
BOARD RISK MANAGEMENT
COMMITTEEOverall oversight on Shariah governance
structure & Shariah ComplianceOversight accountability
on Shariah related matters
BOARD AUDIT COMMITTEE
Shariah as overarching principle in Islamic finance
SHARIAH COMMITTEE
BOARD
Provide independent assessment & objective assurance designed
to value add & improve IFI's compliance with Shariah
Shariah Audit Funct ionShariah Research
Funct ion
Conduct in-depth Shariah research prior to submission to the
Shariah Committee
Shariah Compliance and research funct ions
Shariah Review Funct ion
Review business operations on a regular basis to ensure
Shariah compliance
MANAGEMENT
Ensure executions of business & operations are in accordance with the
Shariah principles
Shariah Risk Management Cont ro l Funct ion
Identify, measure, monitor, report & control Shariah non-Compliance risk
Provide necessary support to the Shariah Committee
Industry Focus
Islamic Banks
Page 7
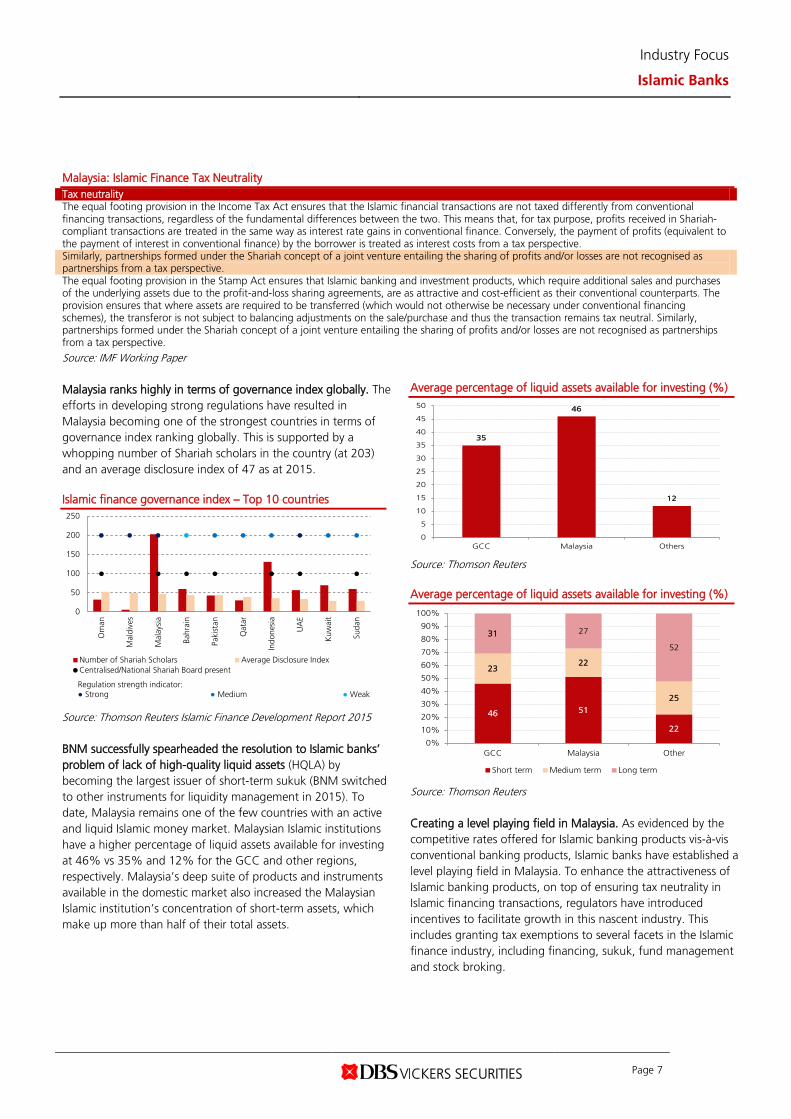
Malaysia: Islamic Finance Tax Neutrality Tax neutrality The equal footing provision in the Income Tax Act ensures that the Islamic financial transactions are not taxed differently from conventional financing transactions, regardless of the fundamental differences between the two. This means that, for tax purpose, profits received in Shariah-compliant transactions are treated in the same way as interest rate gains in conventional finance. Conversely, the payment of profits (equivalent to the payment of interest in conventional finance) by the borrower is treated as interest costs from a tax perspective. Similarly, partnerships formed under the Shariah concept of a joint venture entailing the sharing of profits and/or losses are not recognised as partnerships from a tax perspective. The equal footing provision in the Stamp Act ensures that Islamic banking and investment products, which require additional sales and purchases of the underlying assets due to the profit-and-loss sharing agreements, are as attractive and cost-efficient as their conventional counterparts. The provision ensures that where assets are required to be transferred (which would not otherwise be necessary under conventional financing schemes), the transferor is not subject to balancing adjustments on the sale/purchase and thus the transaction remains tax neutral. Similarly, partnerships formed under the Shariah concept of a joint venture entailing the sharing of profits and/or losses are not recognised as partnerships from a tax perspective. Source: IMF Working Paper Malaysia ranks highly in terms of governance index globally. The efforts in developing strong regulations have resulted in Malaysia becoming one of the strongest countries in terms of governance index ranking globally. This is supported by a whopping number of Shariah scholars in the country (at 203) and an average disclosure index of 47 as at 2015. Islamic finance governance index – Top 10 countries
Source: Thomson Reuters Islamic Finance Development Report 2015 BNM successfully spearheaded the resolution to Islamic banks’ problem of lack of high-quality liquid assets (HQLA) by becoming the largest issuer of short-term sukuk (BNM switched to other instruments for liquidity management in 2015). To date, Malaysia remains one of the few countries with an active and liquid Islamic money market. Malaysian Islamic institutions have a higher percentage of liquid assets available for investing at 46% vs 35% and 12% for the GCC and other regions, respectively. Malaysia’s deep suite of products and instruments available in the domestic market also increased the Malaysian Islamic institution’s concentration of short-term assets, which make up more than half of their total assets.
Average percentage of liquid assets available for investing (%)
Source: Thomson Reuters Average percentage of liquid assets available for investing (%)
Source: Thomson Reuters Creating a level playing field in Malaysia. As evidenced by the competitive rates offered for Islamic banking products vis-à-vis conventional banking products, Islamic banks have established a level playing field in Malaysia. To enhance the attractiveness of Islamic banking products, on top of ensuring tax neutrality in Islamic financing transactions, regulators have introduced incentives to facilitate growth in this nascent industry. This includes granting tax exemptions to several facets in the Islamic finance industry, including financing, sukuk, fund management and stock broking.
0
50
100
150
200
250
0
50
100
150
200
250
Om
an
Mal
dive
s
Mal
aysi
a
Bahr
ain
Paki
stan
Qat
ar
Indo
nesi
a
UA
E
Kuw
ait
Suda
n
Number of Shariah Scholars Average Disclosure IndexCentralised/National Shariah Board present
Regulation strength indicator:● Strong ● Medium ● Weak
35
46
12
0
5
10
15
20
25
30
35
40
45
50
GCC Malaysia Others
46 51
22
2322
25
31 27
52
0%
10%
20%
30%
40%
50%
60%
70%
80%
90%
100%
GCC Malaysia Other
Short term Medium term Long term
Industry Focus
Islamic Banks
Page 8
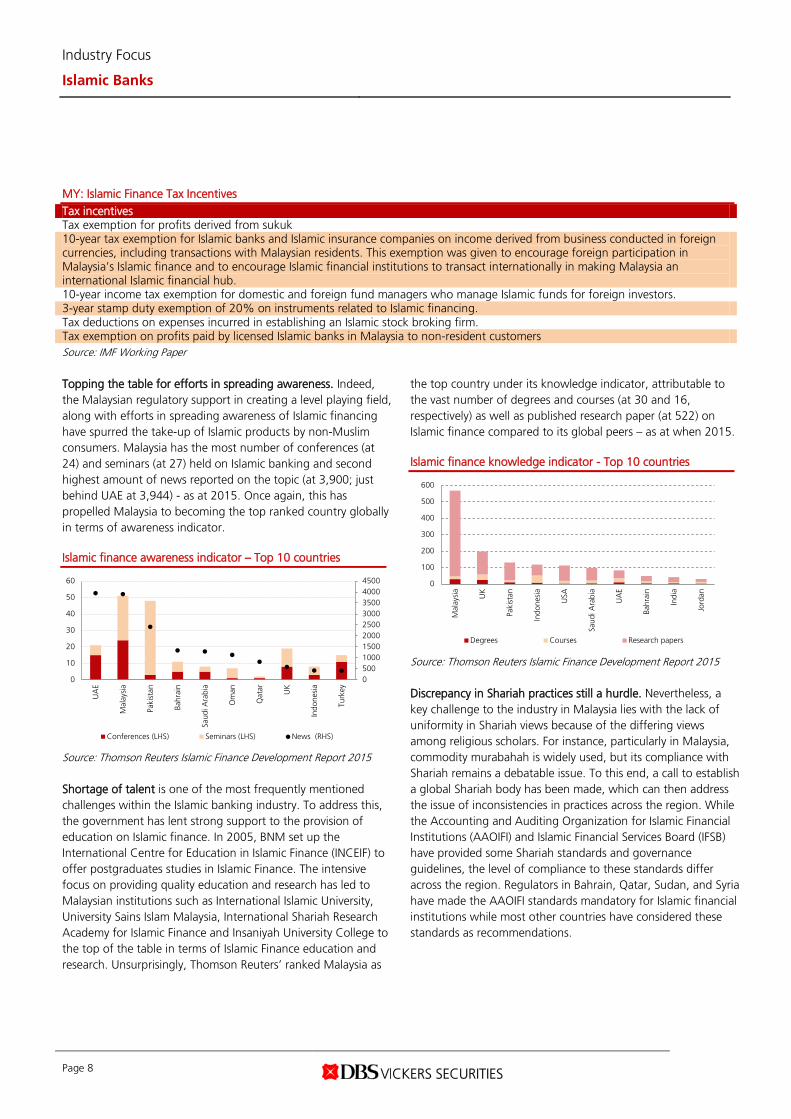
MY: Islamic Finance Tax Incentives Tax incentives Tax exemption for profits derived from sukuk 10-year tax exemption for Islamic banks and Islamic insurance companies on income derived from business conducted in foreign currencies, including transactions with Malaysian residents. This exemption was given to encourage foreign participation in Malaysia’s Islamic finance and to encourage Islamic financial institutions to transact internationally in making Malaysia an international Islamic financial hub. 10-year income tax exemption for domestic and foreign fund managers who manage Islamic funds for foreign investors. 3-year stamp duty exemption of 20% on instruments related to Islamic financing. Tax deductions on expenses incurred in establishing an Islamic stock broking firm. Tax exemption on profits paid by licensed Islamic banks in Malaysia to non-resident customers Source: IMF Working Paper Topping the table for efforts in spreading awareness. Indeed, the Malaysian regulatory support in creating a level playing field, along with efforts in spreading awareness of Islamic financing have spurred the take-up of Islamic products by non-Muslim consumers. Malaysia has the most number of conferences (at 24) and seminars (at 27) held on Islamic banking and second highest amount of news reported on the topic (at 3,900; just behind UAE at 3,944) - as at 2015. Once again, this has propelled Malaysia to becoming the top ranked country globally in terms of awareness indicator. Islamic finance awareness indicator – Top 10 countries
Source: Thomson Reuters Islamic Finance Development Report 2015 Shortage of talent is one of the most frequently mentioned challenges within the Islamic banking industry. To address this, the government has lent strong support to the provision of education on Islamic finance. In 2005, BNM set up the International Centre for Education in Islamic Finance (INCEIF) to offer postgraduates studies in Islamic Finance. The intensive focus on providing quality education and research has led to Malaysian institutions such as International Islamic University, University Sains Islam Malaysia, International Shariah Research Academy for Islamic Finance and Insaniyah University College to the top of the table in terms of Islamic Finance education and research. Unsurprisingly, Thomson Reuters’ ranked Malaysia as
the top country under its knowledge indicator, attributable to the vast number of degrees and courses (at 30 and 16, respectively) as well as published research paper (at 522) on Islamic finance compared to its global peers – as at when 2015. Islamic finance knowledge indicator - Top 10 countries
Source: Thomson Reuters Islamic Finance Development Report 2015 Discrepancy in Shariah practices still a hurdle. Nevertheless, a key challenge to the industry in Malaysia lies with the lack of uniformity in Shariah views because of the differing views among religious scholars. For instance, particularly in Malaysia, commodity murabahah is widely used, but its compliance with Shariah remains a debatable issue. To this end, a call to establish a global Shariah body has been made, which can then address the issue of inconsistencies in practices across the region. While the Accounting and Auditing Organization for Islamic Financial Institutions (AAOIFI) and Islamic Financial Services Board (IFSB) have provided some Shariah standards and governance guidelines, the level of compliance to these standards differ across the region. Regulators in Bahrain, Qatar, Sudan, and Syria have made the AAOIFI standards mandatory for Islamic financial institutions while most other countries have considered these standards as recommendations.
050010001500200025003000350040004500
0
10
20
30
40
50
60
UA
E
Mal
aysi
a
Paki
stan
Bahr
ain
Saud
i Ara
bia
Om
an
Qat
ar UK
Indo
nesi
a
Turk
ey
Conferences (LHS) Seminars (LHS) News (RHS)
0
100
200
300
400
500
600
Mal
aysi
a
UK
Paki
stan
Indo
nesi
a
USA
Saud
i Ara
bia
UA
E
Bahr
ain
Indi
a
Jord
an
Degrees Courses Research papers
Industry Focus
Islamic Banks
Page 9
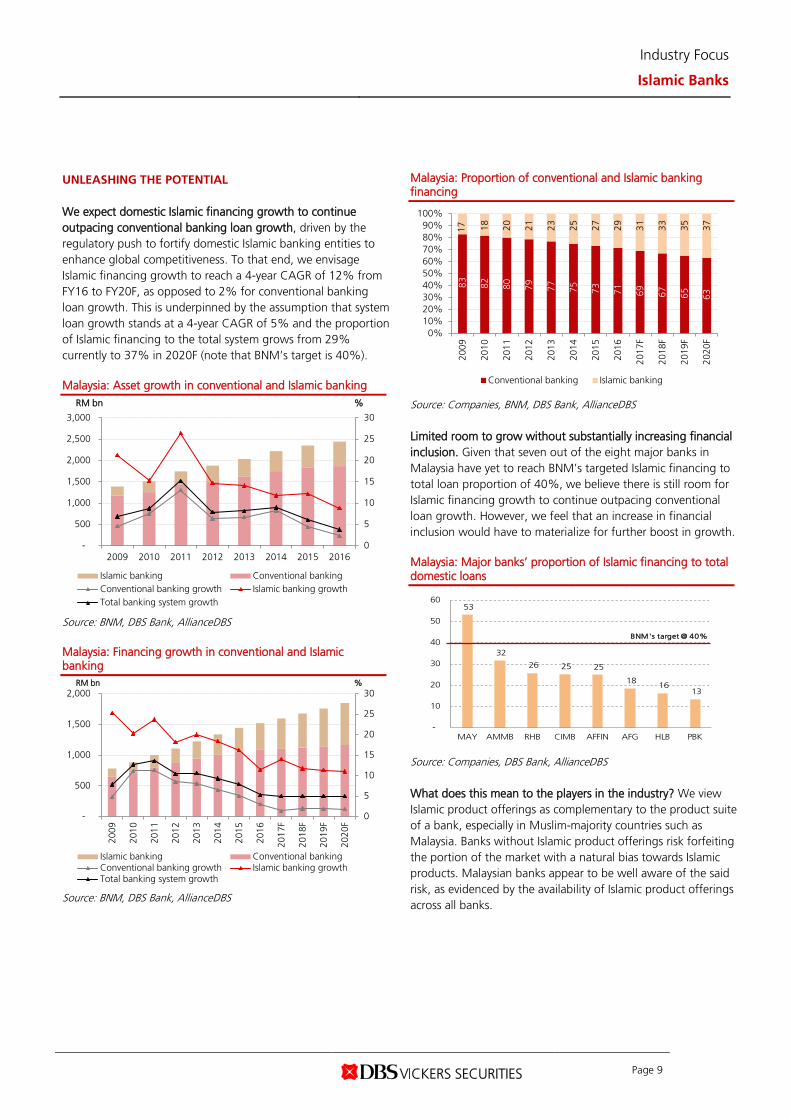
UNLEASHING THE POTENTIAL We expect domestic Islamic financing growth to continue outpacing conventional banking loan growth, driven by the regulatory push to fortify domestic Islamic banking entities to enhance global competitiveness. To that end, we envisage Islamic financing growth to reach a 4-year CAGR of 12% from FY16 to FY20F, as opposed to 2% for conventional banking loan growth. This is underpinned by the assumption that system loan growth stands at a 4-year CAGR of 5% and the proportion of Islamic financing to the total system grows from 29% currently to 37% in 2020F (note that BNM’s target is 40%). Malaysia: Asset growth in conventional and Islamic banking
Source: BNM, DBS Bank, AllianceDBS Malaysia: Financing growth in conventional and Islamic banking
Source: BNM, DBS Bank, AllianceDBS
Malaysia: Proportion of conventional and Islamic banking financing
Source: Companies, BNM, DBS Bank, AllianceDBS Limited room to grow without substantially increasing financial inclusion. Given that seven out of the eight major banks in Malaysia have yet to reach BNM’s targeted Islamic financing to total loan proportion of 40%, we believe there is still room for Islamic financing growth to continue outpacing conventional loan growth. However, we feel that an increase in financial inclusion would have to materialize for further boost in growth. Malaysia: Major banks’ proportion of Islamic financing to total domestic loans
Source: Companies, DBS Bank, AllianceDBS What does this mean to the players in the industry? We view Islamic product offerings as complementary to the product suite of a bank, especially in Muslim-majority countries such as Malaysia. Banks without Islamic product offerings risk forfeiting the portion of the market with a natural bias towards Islamic products. Malaysian banks appear to be well aware of the said risk, as evidenced by the availability of Islamic product offerings across all banks.
0
5
10
15
20
25
30
-
500
1,000
1,500
2,000
2,500
3,000
2009 2010 2011 2012 2013 2014 2015 2016
%RM bn
Islamic banking Conventional bankingConventional banking growth Islamic banking growthTotal banking system growth
0
5
10
15
20
25
30
-
500
1,000
1,500
2,000
2009
2010
2011
2012
2013
2014
2015
2016
2017
F
2018
F
2019
F
2020
F
%RM bn
Islamic banking Conventional bankingConventional banking growth Islamic banking growthTotal banking system growth
83
82
80
79
77
75
73
71
69
67
65
63
17
18
20
21
23
25
27
29
31
33
35
37
0%10%20%30%40%50%60%70%80%90%
100%
2009
2010
2011
2012
2013
2014
2015
2016
2017
F
2018
F
2019
F
2020
F
Conventional banking Islamic banking
53
32
26 25 25
18 16 13
-
10
20
30
40
50
60
MAY AMMB RHB CIMB AFFIN AFG HLB PBK
BNM's target @ 40%
Industry Focus
Islamic Banks
Page 10
Challenging to improve financial inclusion with current product offering. According to the Global Findex by World Bank, while the percentage of Malaysian population that owns an account in financial institutions stands at 81%, the percentage of Malaysian population that has borrowed from a financial institution is only at 20% in 2014. We believe further improvement in access to borrowing is challenging, as the current product offering has limited suitability for the remaining portion of the unserved population. However, product innovation could act as the game changer in this aspect as new offerings could increasingly meet the different risk and return requirements of this dissimilar segment of consumers. Product innovation will be the game changer for the Islamic banking industry... Currently, Islamic products largely mirror their conventional equivalents, rendering minimal product differentiation between the two models. However, since the implementation of IFSA 2013 which encouraged a move towards a risk-sharing model (from risk-transfer model), we have seen some developments on the product innovation aspect. For example, a new guideline on distinguishing Islamic deposits and investment accounts was introduced in early 2013, with the aim of improving the alignment of the salient features of Shariah contracts to its legal recognition. Consequently, Islamic banks now offer investment accounts as an additional alternative on top of the typical current account, savings account and term deposit products. ..especially with sufficient consumer education. Insufficient education on these products could result in customers finding difficulty in accepting the differences of the new product offerings. In the case of investment accounts, despite higher returns to compensate for the higher risk assigned, differences such as the absence of principal guarantee, loss of insurance deposit coverage and the additional disclosure requirements and terminologies pose a risk of a customer exodus back to more familiar conventional products. Nonetheless, in our view, it is crucial for Islamic banks to take this risk in order to enable differentiation from banks operating under the conventional model. Hence, the ability of Islamic banks in executing this is the critical success factor of the industry. We expect the industry’s ability to offer a wider range of products to meet risk and return requirements of consumers, to serve as a stepping-stone in producing “real growth” (as opposed to displacement of conventional loan growth) in Islamic financing. Hence, we advise investors to keep a lookout for developments in this space. Digital disruption or enabler? Digital disruption has indeed intensified in the past few years, with services such as crowdfunding and peer-to-peer lending gradually creeping into the banking industry. Notably, these alternatives are based on a
risk-sharing model, which overlaps with the premise of Islamic banking. In peer-to-peer lending and crowdfunding, lenders are matched directly to the borrowers. To that end, we opine that these new digital innovations have opened up more alternatives for the Islamic banks, in particular to embark on more product innovation and align its products and services more towards the true spirit of Islamic banking. Case in point: Investment account platform. We have seen Islamic banks riding the digital wave through the launch of the Investment Account Platform (IAP; more on page 13). The IAP works in the same vein as a crowdfunding platform where investors can participate in the funding of ventures or projects by making monetary contributions to the projects listed on the platform. The key factor distinguishing IAP from other technology-based fund raising platforms lies in the intermediation roles played by the Islamic banks (for e.g., due-diligence, performance monitoring, suitability assessment and investment management). While other fund raising platforms largely feature ventures by SMEs and start-ups, the IAP also includes ventures by listed companies and multinational companies. Independent ratings are also provided to facilitate the users’ investment decisions. IAP yet to gain traction. There are four sponsoring banks (MAY ISL, AFFIN ISL, Bank Islam, Bank Muamalat) involved in the IAP, but to date, only three projects have been listed on the IAP (since its launch in Feb 2016). Nevertheless, we expect this platform to gain traction in the near future as participating banks have expressed keen interest in improving the flow of project listing. Regionalising Islamic banking products and services is the other engine to fire up. Another growth lever for Islamic finance lies in the ability of Islamic banking players to leverage on the strong regulatory support from domestic authorities, to extend their presence regionally to countries whose Islamic finance industry remains under-developed and banking penetration remains low. Consistently, we still expect the successful aforementioned product innovation to be the key success factor in fuelling substantial growth traction within the region. Case in point: Indonesia. The closest market for the Malaysian Islamic bank players to explore is the Indonesian market. With 13% of the world’s Muslim population, Indonesia is the world’s most populous Muslim nation (209.1m Muslim population as at 2010). Banking penetration in terms of both conventional and Islamic is low (13% of population have borrowed from a financial institution, 5% of total banking assets are Islamic), thus implying ample room for growth.
Industry Focus
Islamic Banks
Page 11
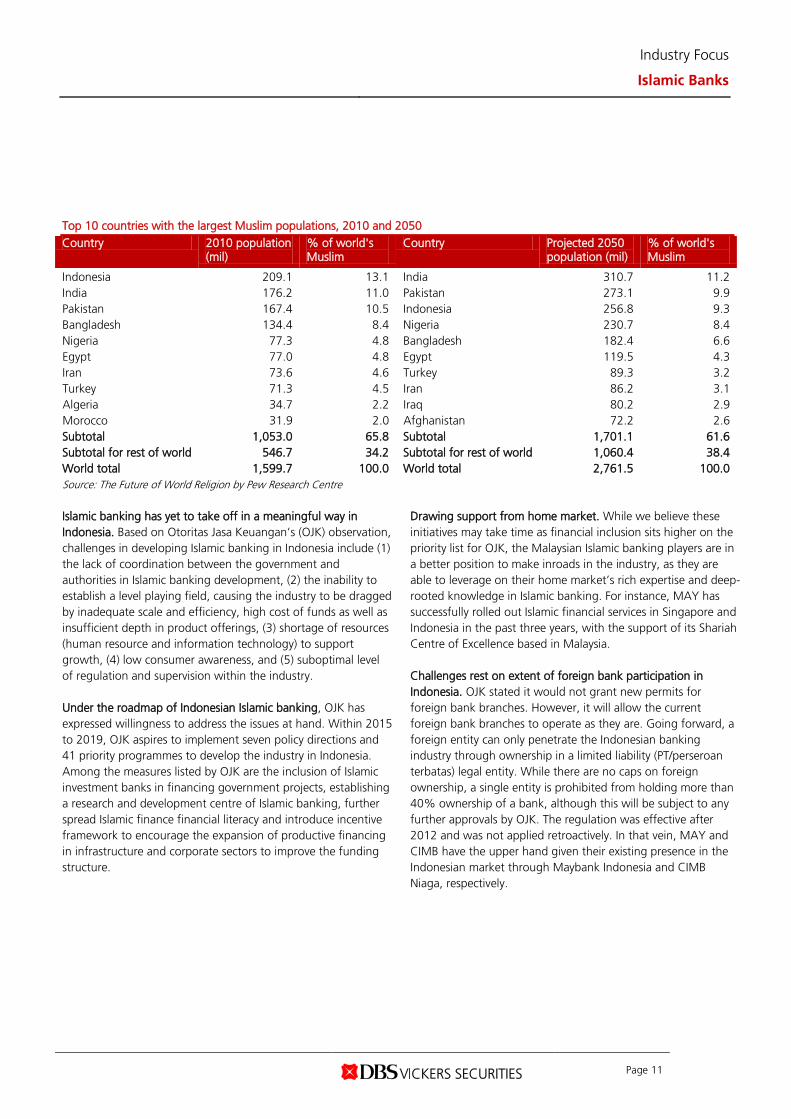
Top 10 countries with the largest Muslim populations, 2010 and 2050 Country 2010 population
(mil) % of world's Muslim
Country Projected 2050 population (mil)
% of world's Muslim
Indonesia 209.1 13.1 India 310.7 11.2 India 176.2 11.0 Pakistan 273.1 9.9 Pakistan 167.4 10.5 Indonesia 256.8 9.3 Bangladesh 134.4 8.4 Nigeria 230.7 8.4 Nigeria 77.3 4.8 Bangladesh 182.4 6.6 Egypt 77.0 4.8 Egypt 119.5 4.3 Iran 73.6 4.6 Turkey 89.3 3.2 Turkey 71.3 4.5 Iran 86.2 3.1 Algeria 34.7 2.2 Iraq 80.2 2.9 Morocco 31.9 2.0 Afghanistan 72.2 2.6 Subtotal 1,053.0 65.8 Subtotal 1,701.1 61.6 Subtotal for rest of world 546.7 34.2 Subtotal for rest of world 1,060.4 38.4 World total 1,599.7 100.0 World total 2,761.5 100.0 Source: The Future of World Religion by Pew Research Centre Islamic banking has yet to take off in a meaningful way in Indonesia. Based on Otoritas Jasa Keuangan’s (OJK) observation, challenges in developing Islamic banking in Indonesia include (1) the lack of coordination between the government and authorities in Islamic banking development, (2) the inability to establish a level playing field, causing the industry to be dragged by inadequate scale and efficiency, high cost of funds as well as insufficient depth in product offerings, (3) shortage of resources (human resource and information technology) to support growth, (4) low consumer awareness, and (5) suboptimal level of regulation and supervision within the industry. Under the roadmap of Indonesian Islamic banking, OJK has expressed willingness to address the issues at hand. Within 2015 to 2019, OJK aspires to implement seven policy directions and 41 priority programmes to develop the industry in Indonesia. Among the measures listed by OJK are the inclusion of Islamic investment banks in financing government projects, establishing a research and development centre of Islamic banking, further spread Islamic finance financial literacy and introduce incentive framework to encourage the expansion of productive financing in infrastructure and corporate sectors to improve the funding structure.
Drawing support from home market. While we believe these initiatives may take time as financial inclusion sits higher on the priority list for OJK, the Malaysian Islamic banking players are in a better position to make inroads in the industry, as they are able to leverage on their home market’s rich expertise and deep-rooted knowledge in Islamic banking. For instance, MAY has successfully rolled out Islamic financial services in Singapore and Indonesia in the past three years, with the support of its Shariah Centre of Excellence based in Malaysia. Challenges rest on extent of foreign bank participation in Indonesia. OJK stated it would not grant new permits for foreign bank branches. However, it will allow the current foreign bank branches to operate as they are. Going forward, a foreign entity can only penetrate the Indonesian banking industry through ownership in a limited liability (PT/perseroan terbatas) legal entity. While there are no caps on foreign ownership, a single entity is prohibited from holding more than 40% ownership of a bank, although this will be subject to any further approvals by OJK. The regulation was effective after 2012 and was not applied retroactively. In that vein, MAY and CIMB have the upper hand given their existing presence in the Indonesian market through Maybank Indonesia and CIMB Niaga, respectively.
Industry Focus
Islamic Banks
Page 12
TWO OF A KIND What makes Islamic banking different? Islamic finance refers to the provision of financial services according to Islamic jurisprudence (Shariah). Islamic finance differs from the conventional banking model due to the prohibition of: (1) Interest or Riba • As it represents an increase in wealth that is not related
to engaging in any productive activity (2) Excessive uncertainty or Gharar • To honour principles of fair treatment and the sanctity of
contracts by reducing information asymmetry (for e.g., contract ambiguity or elusiveness of payoff)
(3) Short-selling • Based on the principle of ownership where it is believed
that one should not “sell what one does not own” (4) Financing activities considered harmful to the society (for
e.g., gambling)
How does the banking model fit in Shariah? To ensure a link between financing activities and real activities, return on capital is legitimised by risk-taking. Return is then determined ex post based on asset performance or project productivity. Asset-based financing establishes the link between financing activities and real activities, hence overcoming the issue of prohibition of short-selling. How is this executed? Islamic finance products are contract-based and can be classified into three broad categories: (1) Profit-and-loss-sharing (PLS) financing • PLS financing is based on the core principles of equity
and participation, deeming it the closest to the spirit of
Islamic finance. Examples of PLS financing include musharakah (equity-like financing of project and with pure profit-and-loss sharing) and mudarabah (profits shared, but losses borne by financier)
(2) Debt-like financing • Refers to contracts of exchange. The four debt-like
financing instrument include: o Murabahah: Cost-plus agreement with buyers
making deferred payments o Salam: Forward agreement where the Islamic
financial institution act as the buyer of goods on behalf of the customer, with deferred delivery of the products
o Istisna: Forward agreement where the Islamic financial institution act as the buyer of a project on behalf of the customer, with the completion and delivery of the project on a later date
o Ijarah: Lease contract with the sale of the right to use an asset for a period of time
(3) Fee-based products • Refers to contracts of safety and security, such as Wadiah
(safe-keeping contracts) and Wakalah (agency contracts) Neutral treatment for conventional and Islamic financing ensures similar returns. The underlying principles of banking between the two models are vastly different, and deliberately so. However, consumers should not confuse the seemingly higher level of intricacy in Islamic financing transactions to higher costs, as regulatory support in Malaysia has ensured neutrality in treatment for conventional and Islamic products. This is further supported by the similar returns offered for conventional and Islamic products in Malaysia.
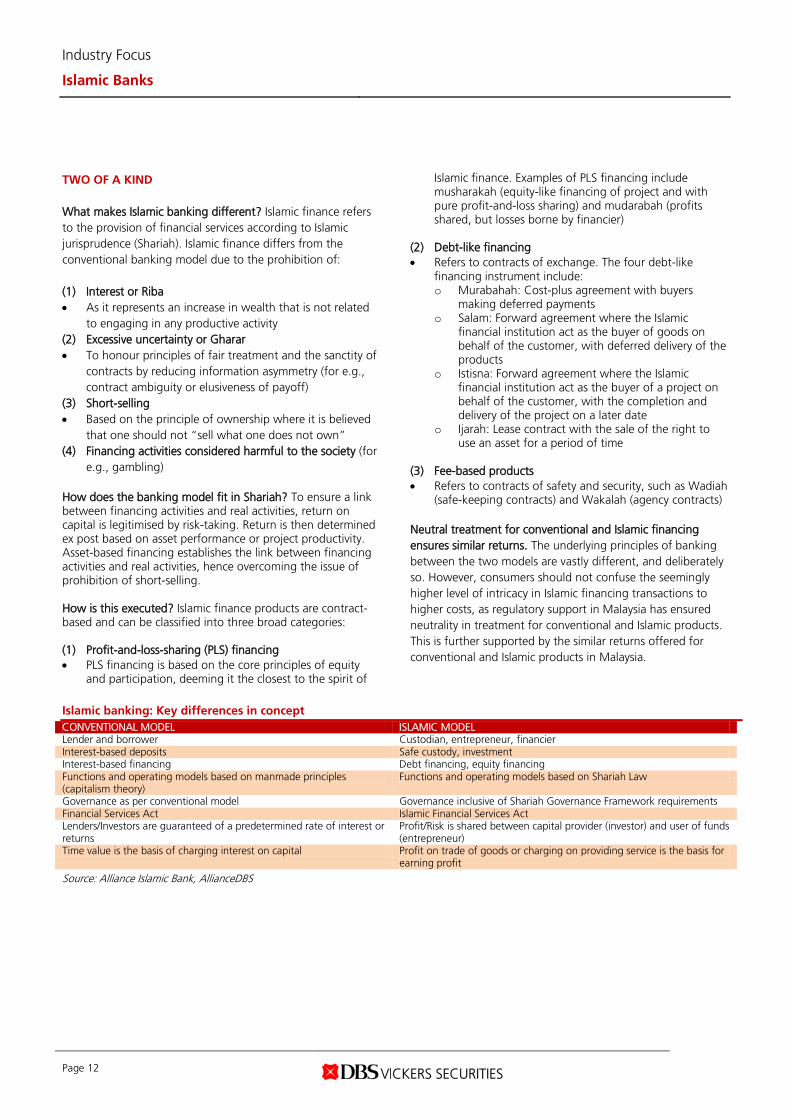
Islamic banking: Key differences in concept CONVENTIONAL MODEL ISLAMIC MODEL Lender and borrower Custodian, entrepreneur, financier Interest-based deposits Safe custody, investment Interest-based financing Debt financing, equity financing Functions and operating models based on manmade principles (capitalism theory)
Functions and operating models based on Shariah Law
Governance as per conventional model Governance inclusive of Shariah Governance Framework requirements Financial Services Act Islamic Financial Services Act Lenders/Investors are guaranteed of a predetermined rate of interest or returns
Profit/Risk is shared between capital provider (investor) and user of funds (entrepreneur)
Time value is the basis of charging interest on capital Profit on trade of goods or charging on providing service is the basis for earning profit
Source: Alliance Islamic Bank, AllianceDBS
Industry Focus
Islamic Banks
Page 13
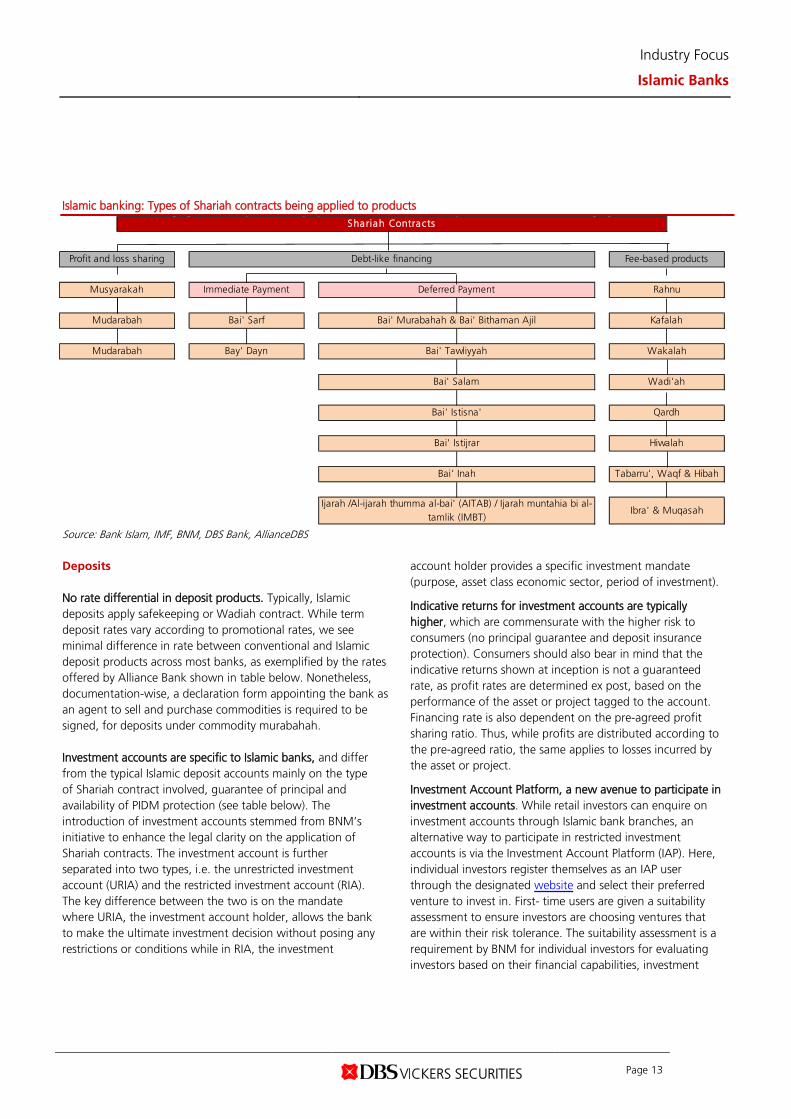
Islamic banking: Types of Shariah contracts being applied to products
Source: Bank Islam, IMF, BNM, DBS Bank, AllianceDBS Deposits No rate differential in deposit products. Typically, Islamic deposits apply safekeeping or Wadiah contract. While term deposit rates vary according to promotional rates, we see minimal difference in rate between conventional and Islamic deposit products across most banks, as exemplified by the rates offered by Alliance Bank shown in table below. Nonetheless, documentation-wise, a declaration form appointing the bank as an agent to sell and purchase commodities is required to be signed, for deposits under commodity murabahah. Investment accounts are specific to Islamic banks, and differ from the typical Islamic deposit accounts mainly on the type of Shariah contract involved, guarantee of principal and availability of PIDM protection (see table below). The introduction of investment accounts stemmed from BNM’s initiative to enhance the legal clarity on the application of Shariah contracts. The investment account is further separated into two types, i.e. the unrestricted investment account (URIA) and the restricted investment account (RIA). The key difference between the two is on the mandate where URIA, the investment account holder, allows the bank to make the ultimate investment decision without posing any restrictions or conditions while in RIA, the investment
account holder provides a specific investment mandate (purpose, asset class economic sector, period of investment).
Indicative returns for investment accounts are typically higher, which are commensurate with the higher risk to consumers (no principal guarantee and deposit insurance protection). Consumers should also bear in mind that the indicative returns shown at inception is not a guaranteed rate, as profit rates are determined ex post, based on the performance of the asset or project tagged to the account. Financing rate is also dependent on the pre-agreed profit sharing ratio. Thus, while profits are distributed according to the pre-agreed ratio, the same applies to losses incurred by the asset or project.
Investment Account Platform, a new avenue to participate in investment accounts. While retail investors can enquire on investment accounts through Islamic bank branches, an alternative way to participate in restricted investment accounts is via the Investment Account Platform (IAP). Here, individual investors register themselves as an IAP user through the designated website and select their preferred venture to invest in. First- time users are given a suitability assessment to ensure investors are choosing ventures that are within their risk tolerance. The suitability assessment is a requirement by BNM for individual investors for evaluating investors based on their financial capabilities, investment
Shariah Contracts
Wadi'ah
Qardh
Hiwalah
Mudarabah
Mudarabah
Fee-based productsProfit and loss sharing
Deferred PaymentImmediate PaymentMusyarakah Rahnu
Debt-like financing
Bai' Sarf
Bay' Dayn
Ibra' & Muqasah
Bai' Murabahah & Bai' Bithaman Ajil
Bai' Tawliyyah
Bai' Salam
Bai' Istisna'
Bai' Istijrar
Kafalah
Wakalah
Ijarah /Al-ijarah thumma al-bai' (AITAB) / Ijarah muntahia bi al-tamlik (IMBT)
Tabarru', Waqf & HibahBai' Inah
Industry Focus
Islamic Banks
Page 14
needs and appetite, and investment knowledge and experience. Institutional investors are not required to take the suitability assessment as they are deemed to have sufficient resources to make an informed investment decision. Upon completion of the suitability assessment, the results are compared against the chosen venture. Investors who have chosen ventures beyond their risk tolerance will be alerted and asked to seek additional consultation at dedicated branches of participating Islamic banks before proceeding with the chosen venture. Once the investor declares an understanding of the risk involved and agrees to proceed with the investment, the Islamic bank creates the
investment account for the investor and sends periodical reports on the venture.
Impact to the banks. Although banks provide better returns to the customers under the investment accounts, the benefits to the bank comes in the form of (1) savings from non-payment of Malaysia Deposit Insurance Corporation (PIDM) premium, (2) more effective capital management as tagged assets are excluded from capital adequacy ratio calculation, and (3) reduced regulatory cost as investment accounts are excluded from Eligible Liabilities base for the purposes of statutory reserve requirement computations.
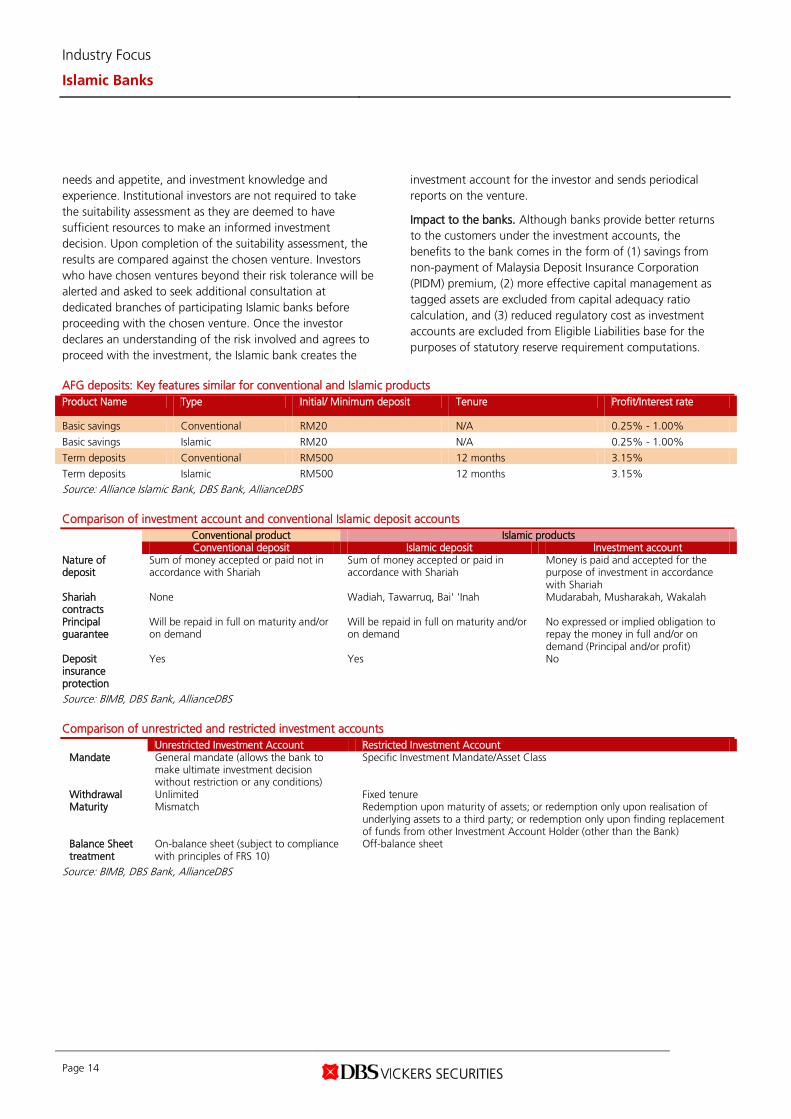
AFG deposits: Key features similar for conventional and Islamic products Product Name Type Initial/ Minimum deposit Tenure Profit/Interest rate
Basic savings Conventional RM20 N/A 0.25% - 1.00%
Basic savings Islamic RM20 N/A 0.25% - 1.00%
Term deposits Conventional RM500 12 months 3.15%
Term deposits Islamic RM500 12 months 3.15% Source: Alliance Islamic Bank, DBS Bank, AllianceDBS Comparison of investment account and conventional Islamic deposit accounts
Conventional product Islamic products
Conventional deposit Islamic deposit Investment account
Nature of deposit
Sum of money accepted or paid not in accordance with Shariah
Sum of money accepted or paid in accordance with Shariah
Money is paid and accepted for the purpose of investment in accordance with Shariah
Shariah contracts
None Wadiah, Tawarruq, Bai' 'Inah Mudarabah, Musharakah, Wakalah
Principal guarantee
Will be repaid in full on maturity and/or on demand
Will be repaid in full on maturity and/or on demand
No expressed or implied obligation to repay the money in full and/or on demand (Principal and/or profit)
Deposit insurance protection
Yes Yes No
Source: BIMB, DBS Bank, AllianceDBS Comparison of unrestricted and restricted investment accounts
Unrestricted Investment Account Restricted Investment Account
Mandate General mandate (allows the bank to make ultimate investment decision without restriction or any conditions)
Specific Investment Mandate/Asset Class
Withdrawal Unlimited Fixed tenure Maturity Mismatch Redemption upon maturity of assets; or redemption only upon realisation of
underlying assets to a third party; or redemption only upon finding replacement of funds from other Investment Account Holder (other than the Bank)
Balance Sheet treatment
On-balance sheet (subject to compliance with principles of FRS 10)
Off-balance sheet
Source: BIMB, DBS Bank, AllianceDBS
Industry Focus
Islamic Banks
Page 15
Financing
Similar reference rate used. Islamic banks use the Base Rate (BR) and Base Financing Rate (BFR; conventional banks equivalent to Base Lending Rate or BLR) as the reference rates in pricing their financing products. Typically, banks with both conventional and Islamic arms use the same rate for BR and BLR/BFR. Unique features of Islamic financing. In principle, Islamic financing offers a rebate (also known as Ibra) on early settlement, termination or maturity of an account. Islamic financing also places a ceiling on financing rate, protecting consumers from paying high interest rates in the event of a steep increase in the Base Rate. In accordance with BNM’s guideline, Islamic banks can impose late payment charges, but the amount recognised as income is limited to the administrative cost incurred to manage the late payment. The remaining portion must be channelled to charitable organizations. Mortgage loans under Islamic financing offer additional incentives. Mortgage under Islamic principles similarly offer
rates that are competitive relative to those of conventional loans. On top of the salient features mentioned above, additional incentives for mortgages under Islamic principles come in the form of the discounts on stamp duty charges. There is a 20% discount for consumers taking a new or top- up loan, as well as a full discount for refinancing a conventional loan to Islamic financing. To enjoy these benefits, customers are merely required to complete two additional documents (vs conventional loans) for mortgage financing based on Bai’ Bithaman Ajil (BBA or sale contract based on deferred payment at certain price), i.e. Asset Purchase Agreement (APA) and Asset Sale Agreement (ASA) in the solicitor’s office. For mortgage loans under Tawarruq (or commodity murabahah) contract, the process is similar to a conventional mortgage loan application, except that the document would contain an additional agency agreement (appointing the bank as an agent to sell and purchase commodities). Meanwhile, the application for car financing requires customers to submit two agreements - Al-Ijarah Contract (hiring agreement) and Al-Bai’ Contract (purchasing agreement) - as opposed to just one HP agreement under conventional loans.
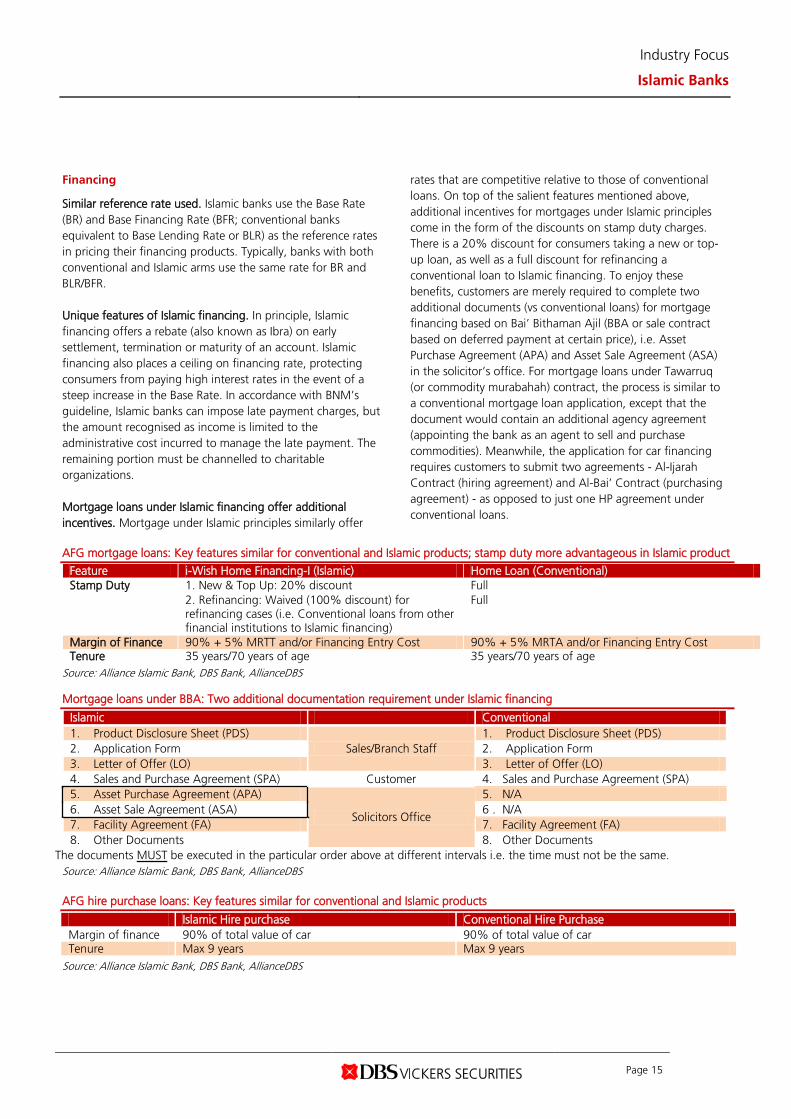
AFG mortgage loans: Key features similar for conventional and Islamic products; stamp duty more advantageous in Islamic product
Feature i-Wish Home Financing-I (Islamic) Home Loan (Conventional) Stamp Duty 1. New & Top Up: 20% discount Full
2. Refinancing: Waived (100% discount) for refinancing cases (i.e. Conventional loans from other financial institutions to Islamic financing)
Full
Margin of Finance 90% + 5% MRTT and/or Financing Entry Cost 90% + 5% MRTA and/or Financing Entry Cost Tenure 35 years/70 years of age 35 years/70 years of age
Source: Alliance Islamic Bank, DBS Bank, AllianceDBS
Mortgage loans under BBA: Two additional documentation requirement under Islamic financing
The documents MUST be executed in the particular order above at different intervals i.e. the time must not be the same.
Islamic Conventional 1. Product Disclosure Sheet (PDS)
Sales/Branch Staff 1. Product Disclosure Sheet (PDS)
2. Application Form 2. Application Form 3. Letter of Offer (LO) 3. Letter of Offer (LO) 4. Sales and Purchase Agreement (SPA) Customer 4. Sales and Purchase Agreement (SPA) 5. Asset Purchase Agreement (APA)
Solicitors Office
5. N/A 6. Asset Sale Agreement (ASA) 6 . N/A 7. Facility Agreement (FA) 7. Facility Agreement (FA) 8. Other Documents 8. Other Documents
Source: Alliance Islamic Bank, DBS Bank, AllianceDBS AFG hire purchase loans: Key features similar for conventional and Islamic products
Islamic Hire purchase Conventional Hire Purchase Margin of finance 90% of total value of car 90% of total value of car Tenure Max 9 years Max 9 years
Source: Alliance Islamic Bank, DBS Bank, AllianceDBS
Industry Focus
Islamic Banks
Page 16
Islamic financing provided to listed companies aiming to attain Shariah-compliant status. While the terms of business loans are negotiated on a case-by-case basis between the bank and customer, we understand that banks generally do not practice price discrimination whether the loans are under conventional or Islamic. However, listed companies seeking to attain Shariah-compliant status should apply for lines under Islamic banks. Shariah-compliant status are granted to listed companies provided that (1) contribution of Shariah non-compliant activities to the overall revenue and profit before tax is below the 5% benchmark (20% for activities such as hotels and resorts, stock broking and share trading), (2) the company’s ratio of cash (placed in conventional accounts and instruments) over total assets does not exceed 33%, and (3) the company’s ratio of debt (under conventional financing) over total assets does not exceed 33%. Listed companies are generally inclined to seek Shariah-compliant status in order to attract a larger pool of investors. Other incentives offered include waiver of commitment fees for the unutilised portion of the facility limit and full exemption of stamp duty for refinancing of conventional financing facility to Islamic facility.
Industry Focus
Islamic Banks
Page 17
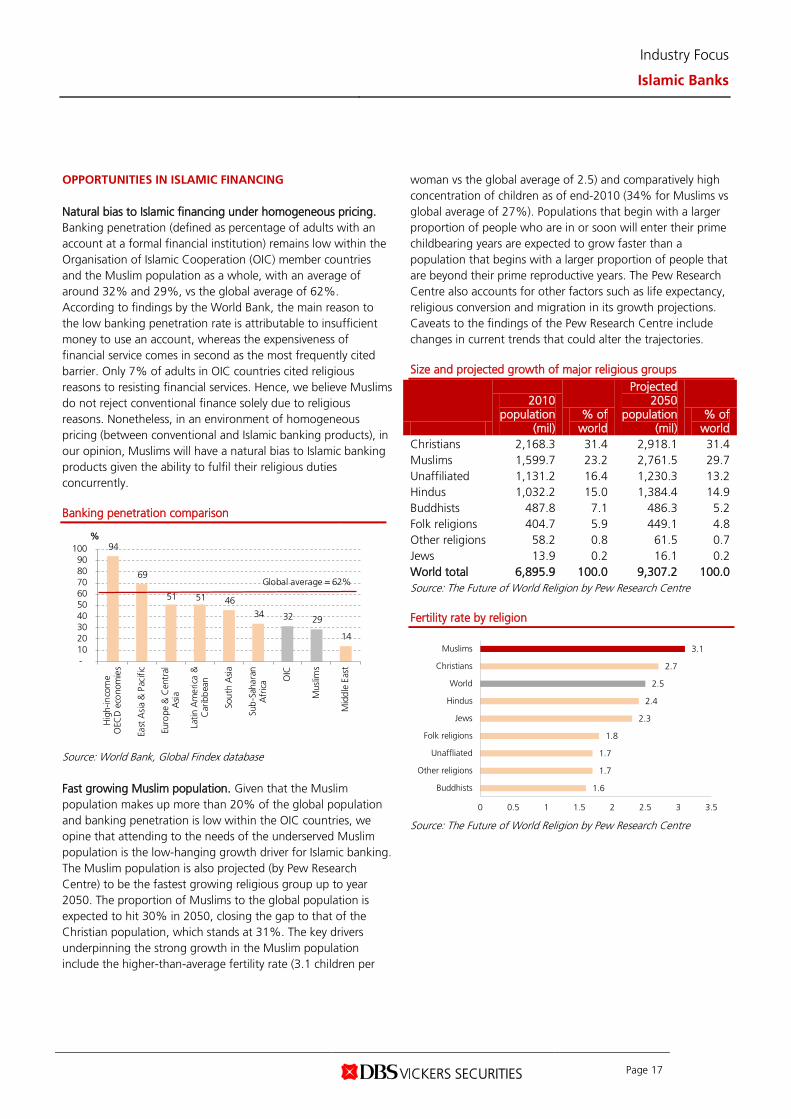
OPPORTUNITIES IN ISLAMIC FINANCING Natural bias to Islamic financing under homogeneous pricing. Banking penetration (defined as percentage of adults with an account at a formal financial institution) remains low within the Organisation of Islamic Cooperation (OIC) member countries and the Muslim population as a whole, with an average of around 32% and 29%, vs the global average of 62%. According to findings by the World Bank, the main reason to the low banking penetration rate is attributable to insufficient money to use an account, whereas the expensiveness of financial service comes in second as the most frequently cited barrier. Only 7% of adults in OIC countries cited religious reasons to resisting financial services. Hence, we believe Muslims do not reject conventional finance solely due to religious reasons. Nonetheless, in an environment of homogeneous pricing (between conventional and Islamic banking products), in our opinion, Muslims will have a natural bias to Islamic banking products given the ability to fulfil their religious duties concurrently. Banking penetration comparison
Source: World Bank, Global Findex database Fast growing Muslim population. Given that the Muslim population makes up more than 20% of the global population and banking penetration is low within the OIC countries, we opine that attending to the needs of the underserved Muslim population is the low-hanging growth driver for Islamic banking. The Muslim population is also projected (by Pew Research Centre) to be the fastest growing religious group up to year 2050. The proportion of Muslims to the global population is expected to hit 30% in 2050, closing the gap to that of the Christian population, which stands at 31%. The key drivers underpinning the strong growth in the Muslim population include the higher-than-average fertility rate (3.1 children per
woman vs the global average of 2.5) and comparatively high concentration of children as of end-2010 (34% for Muslims vs global average of 27%). Populations that begin with a larger proportion of people who are in or soon will enter their prime childbearing years are expected to grow faster than a population that begins with a larger proportion of people that are beyond their prime reproductive years. The Pew Research Centre also accounts for other factors such as life expectancy, religious conversion and migration in its growth projections. Caveats to the findings of the Pew Research Centre include changes in current trends that could alter the trajectories. Size and projected growth of major religious groups
2010 population
(mil) % of
world
Projected 2050
population (mil)
% of world
Christians 2,168.3 31.4 2,918.1 31.4 Muslims 1,599.7 23.2 2,761.5 29.7 Unaffiliated 1,131.2 16.4 1,230.3 13.2 Hindus 1,032.2 15.0 1,384.4 14.9 Buddhists 487.8 7.1 486.3 5.2 Folk religions 404.7 5.9 449.1 4.8 Other religions 58.2 0.8 61.5 0.7 Jews 13.9 0.2 16.1 0.2 World total 6,895.9 100.0 9,307.2 100.0 Source: The Future of World Religion by Pew Research Centre Fertility rate by religion
Source: The Future of World Religion by Pew Research Centre
94
69
51 51 46 34 32 29
14
- 10 20 30 40 50 60 70 80 90
100
Hig
h-in
com
eO
ECD
eco
nom
ies
East
Asi
a &
Pac
ific
Euro
pe &
Cen
tral
Asi
a
Latin
Am
eric
a &
Car
ibb
ean
Sou
th A
sia
Sub
-Sah
aran
Afr
ica O
IC
Mus
lims
Mid
dle
Eas
t
%
Global average = 62%
1.6
1.7
1.7
1.8
2.3
2.4
2.5
2.7
3.1
0 0.5 1 1.5 2 2.5 3 3.5
Buddhists
Other religions
Unaffliated
Folk religions
Jews
Hindus
World
Christians
Muslims
Industry Focus
Islamic Banks
Page 18
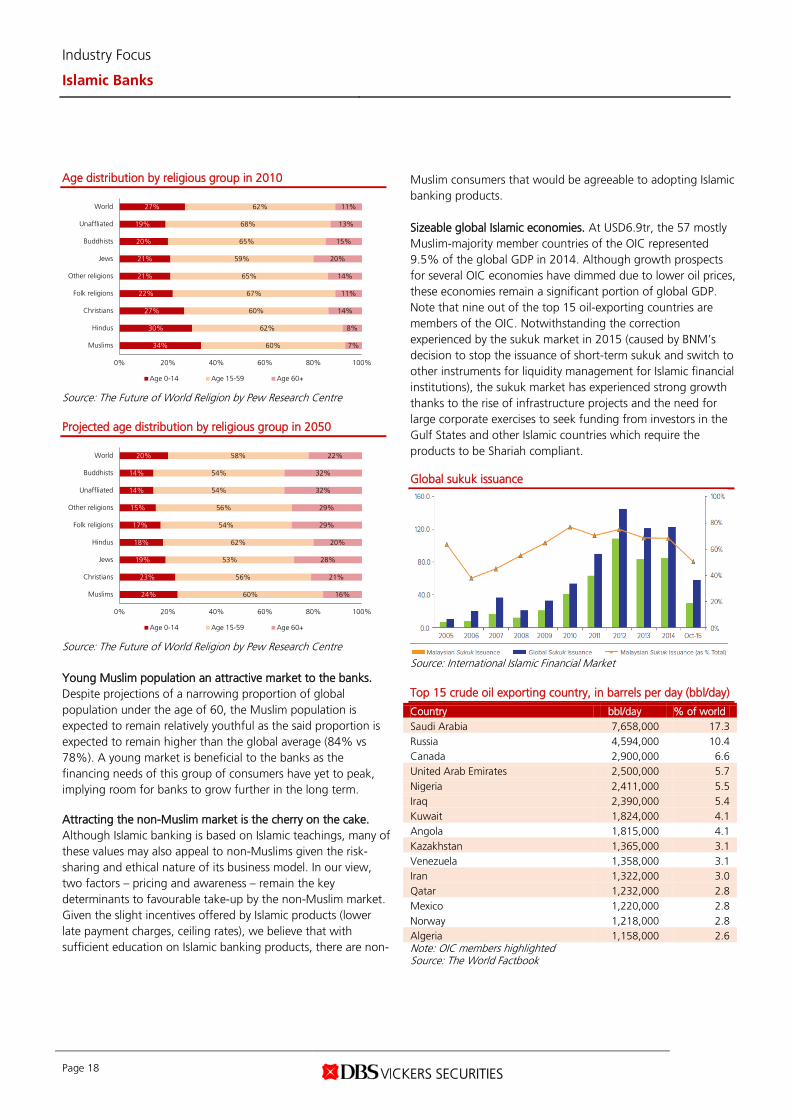
Age distribution by religious group in 2010
Source: The Future of World Religion by Pew Research Centre Projected age distribution by religious group in 2050
Source: The Future of World Religion by Pew Research Centre Young Muslim population an attractive market to the banks. Despite projections of a narrowing proportion of global population under the age of 60, the Muslim population is expected to remain relatively youthful as the said proportion is expected to remain higher than the global average (84% vs 78%). A young market is beneficial to the banks as the financing needs of this group of consumers have yet to peak, implying room for banks to grow further in the long term. Attracting the non-Muslim market is the cherry on the cake. Although Islamic banking is based on Islamic teachings, many of these values may also appeal to non-Muslims given the risk-sharing and ethical nature of its business model. In our view, two factors – pricing and awareness – remain the key determinants to favourable take-up by the non-Muslim market. Given the slight incentives offered by Islamic products (lower late payment charges, ceiling rates), we believe that with sufficient education on Islamic banking products, there are non-
Muslim consumers that would be agreeable to adopting Islamic banking products. Sizeable global Islamic economies. At USD6.9tr, the 57 mostly Muslim-majority member countries of the OIC represented 9.5% of the global GDP in 2014. Although growth prospects for several OIC economies have dimmed due to lower oil prices, these economies remain a significant portion of global GDP. Note that nine out of the top 15 oil-exporting countries are members of the OIC. Notwithstanding the correction experienced by the sukuk market in 2015 (caused by BNM’s decision to stop the issuance of short-term sukuk and switch to other instruments for liquidity management for Islamic financial institutions), the sukuk market has experienced strong growth thanks to the rise of infrastructure projects and the need for large corporate exercises to seek funding from investors in the Gulf States and other Islamic countries which require the products to be Shariah compliant. Global sukuk issuance
Source: International Islamic Financial Market Top 15 crude oil exporting country, in barrels per day (bbl/day)
Country bbl/day % of world Saudi Arabia 7,658,000 17.3 Russia 4,594,000 10.4 Canada 2,900,000 6.6 United Arab Emirates 2,500,000 5.7 Nigeria 2,411,000 5.5 Iraq 2,390,000 5.4 Kuwait 1,824,000 4.1 Angola 1,815,000 4.1 Kazakhstan 1,365,000 3.1 Venezuela 1,358,000 3.1 Iran 1,322,000 3.0 Qatar 1,232,000 2.8 Mexico 1,220,000 2.8 Norway 1,218,000 2.8 Algeria 1,158,000 2.6 Note: OIC members highlighted Source: The World Factbook
34%
30%
27%
22%
21%
21%
20%
19%
27%
60%
62%
60%
67%
65%
59%
65%
68%
62%
7%
8%
14%
11%
14%
20%
15%
13%
11%
0% 20% 40% 60% 80% 100%
Muslims
Hindus
Christians
Folk religions
Other religions
Jews
Buddhists
Unaffliated
World
Age 0-14 Age 15-59 Age 60+
24%
23%
19%
18%
17%
15%
14%
14%
20%
60%
56%
53%
62%
54%
56%
54%
54%
58%
16%
21%
28%
20%
29%
29%
32%
32%
22%
0% 20% 40% 60% 80% 100%
Muslims
Christians
Jews
Hindus
Folk religions
Other religions
Unaffliated
Buddhists
World
Age 0-14 Age 15-59 Age 60+
Industry Focus
Islamic Banks
Page 19
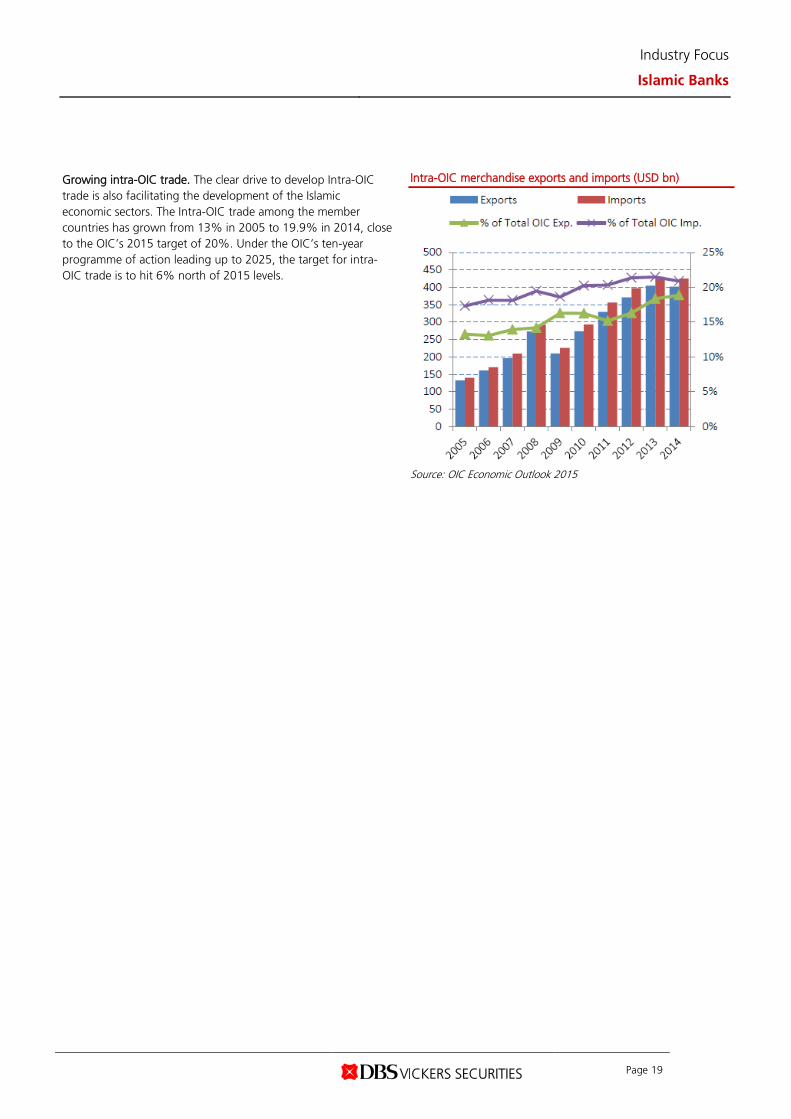
Growing intra-OIC trade. The clear drive to develop Intra-OIC trade is also facilitating the development of the Islamic economic sectors. The Intra-OIC trade among the member countries has grown from 13% in 2005 to 19.9% in 2014, close to the OIC’s 2015 target of 20%. Under the OIC’s ten-year programme of action leading up to 2025, the target for intra-OIC trade is to hit 6% north of 2015 levels.
Intra-OIC merchandise exports and imports (USD bn)
Source: OIC Economic Outlook 2015
Industry Focus
Islamic Banks
Page 20
CHALLENGES Regulatory gap. Existing legal and regulatory frameworks should take into consideration the value propositions promulgated by Shariah. For instance, the legal definition of banking and financial services in certain jurisdictions does not recognise Islamic financial transactions, which leads to potential conflict and adverse legal effects. The government should also be supportive in granting neutral tax treatments for Islamic financial transactions to ensure that Islamic banking products are cost efficient. Establishing an even playing field. To avoid an exodus back to conventional finance, at the very least, there is a need for Islamic products to be on par with conventional products in terms of diversity, cost effectiveness, ability to meet the risk and return requirement of investors as well as the service level, while remaining Shariah compliant. On the other hand, to get one up on conventional banking, these Islamic products are expected to be superior to their conventional peers in these aspects. Liquidity management. Liquidity problems exist in the Islamic capital market due to the lack of derivatives and an organised secondary market for dealing with Islamic instruments. An early exit may be difficult or costly for an investor without an effective secondary market where financial instruments are easily tradable. In addition, most central banks have not been very active in issuing short-term sukuk, limiting the availability of high-quality liquid assets (HQLA) in Islamic finance. Lack of awareness. Despite the strong presence of Islamic finance in the Gulf Cooperation Council (five out of the six member countries are among the top 10 Islamic economies), findings by PWC show that residents in this region lack familiarity with Islamic banking. 56% of the Muslim respondents believe that they are familiar with Islamic banking while 64% of non-Muslims cited insufficient knowledge of Islamic financial products as the reason for not using Islamic financial services.
Talent shortage. Islamic financial industry requires a specific set of competencies and skills, such as Shariah understanding and market insight. The shortage of talents, especially on the expert level such as Shariah scholars, may impede the growth of Islamic finance, as the views of these scholars are highly valuable in product development and innovation. On an extreme case, scarcity in talent may also cause inflated salaries and lead to a drag on the cost structure of the Islamic banks. Hence, the abundance of educational institutions focusing on Islamic banking is crucial for the development of the industry. Lack of uniformity between Shariah’s views. Different interpretations of the Shariah lead to different practice and use of concepts across jurisdiction. Certain products may be accepted in some jurisdictions but not in others, thus this may impede the growth and internationalisation of Islamic finance. Differences in opinion among religious scholars regarding the Shariah compliance of specific financial arrangements can expose Islamic banks to the risk of non-compliance with Shariah principles, which may have serious implications on the industry. Harmonising differences in the Shariah compliance of different instruments would reduce uncertainty and foster industry growth. It also ensures that Islamic banks are able to capture opportunities from the entire Muslim market, instead of being sidelined by a portion who perceive Islamic banks are not true to Shariah values. By the same token, the Accounting and Auditing Organization for Islamic Financial Institutions (AAOIFI) and Islamic Financial Services Board (IFSB) have provided some Shariah standards and governance guidelines.
Industry Focus
Islamic Banks
Page 21
INDUSTRY PLAYERS AT A GLANCE 23 key players in the Islamic banking industry. The key players in the industry can be segregated to three broad categories, i.e. full Islamic banks, Islamic bank subsidiaries and development banks or financial institutions that offer Shariah-compliant products (see table below for banks under the respective categories). Comparison of the financials of the key players in the industry can be found in the Appendix. We used the latest published financial year numbers for all key players. Apart from BIMB that we have used financial holding company numbers, the numbers of the other entities reflect the Islamic banking unit individually. In our analysis, we included only one development bank, Bank Rakyat which boasts a sizeable market share. MY: Key players in the industry Type Bank Full Islamic banks Bank Islam
Bank Muamalat Asian Finance Bank Al Rajhi Bank Kuwait Finance House
Islamic bank subsidiaries Maybank Islamic AmIslamic AffinIslamic Alliance Islamic Bank CIMB Islamic Public Islamic Hong Leong Islamic Standard Chartered Saadiq HSBC Amanah RHB Islamic OCBC Al-Amin
Development banks/financial institutions that offer Shariah-Compliant Products
Bank Rakyat Agro Bank Bank Simpanan Nasional SME Bank EXIM Bank Bank Pembangunan Malaysia Malaysia Building Society
Source: BNM, DBS Bank, AllianceDBS MY: Asset size of Islamic banks
Source: Companies, DBS Bank, AllianceDBS
MAY ISL stands head and shoulders above peers. Similar to its positioning in conventional banking space, MAY ISL takes the lead in terms of asset size. In fact, MAY ISL, Bank Rakyat and Bank Islam are among the top global Islamic banks by asset size. While MAY ISL and Bank Rakyat remain at the top of the table when ranked by loans and deposits, CIMB ISL trumps BIMB’s position as the third largest in these aspects. Meanwhile, foreign Islamic banks, which are imposed operational restrictions such as branch openings and ATM installations, are typically on the other end of the spectrum. Paltry earnings by Middle Eastern Islamic banks. Due to the relatively small balance sheet and operational restrictions, Middle Eastern Islamic banks struggle in building scale which reflects its growth (lower-than-average loan growth) and profitability (higher-than-average cost-to-income). BIMB has the highest ROE in the industry, thanks to its higher yielding loans and strong CASA. Similarly, MBSB and Bank Rakyat enjoy high NIMs as their portfolios are skewed towards personal financing. However, the CASA ratios of MBSB and Bank Rakyat are lower than the industry as exempt finance companies are restricted from accepting demand deposits (current accounts). Banks that are heavier on mortgage financing (e.g. MAY ISL, HL ISL) tend to have NIMs below 2%. Financing-to-deposit ratio is highest at SC Saadiq (more than 200%) as it is able to tap interbank funding by its parent through its profit-sharing investment accounts (PSIA). Inclusive of the PSIA placements, the ratio would be lower. Weak asset quality at KFH and MBSB. Banks with strong credit culture (PBK, HLB) congruently have low NPL ratios for their Islamic banking arm. MBSB's impaired financing ratio increased due to its impairment programme. KFH's asset quality is impacted by high impaired financing in the manufacturing sector. KFH and MBSB booked high credit cost, in line with its high impaired financing ratios. All Islamic banks are sufficiently capitalised, with the Middle Eastern Islamic banks registering higher capital ratios compared to peers.
156
92
57
55
46
44
41
38
26
23
19
15
13
11
11
10
7 3
0
20
40
60
80
100
120
140
160
180
MA
Y IS
L
BAN
K R
AK
YA
T
BIM
B
CIM
B IS
L
PUBL
IC IS
L
RHB
ISL
MBS
B
AM
ISL
HL
ISL
Mua
mal
at
HSB
C A
MA
N
OC
BC A
L-…
AFF
IN IS
L
SC S
AA
DIQ
KFH
ALL
CE
ISL
Al-R
ajhi
AFB
RM bn
Industry Focus
Islamic Banks
Page 22
ISLAMIC BANKING PROXIES BIMB, the Islamic banking champ. As the nation’s longest standing Islamic bank, BIMB’s (the holding company of Bank Islam and Syarikat Takaful) expertise in the industry is undisputable. With its experience and expertise in Islamic Finance, BIMB would be able to step in to meet the growing demand of Islamic finance (domestic and/or abroad). This could be through strategic partnerships or technical collaborations. A strategic partnership could involve taking a strategic stake in the host country bank or a merger or acquisition. For example, Bank Islam assisted in setting up the first Islamic bank in Sri Lanka (Amana Bank Ltd) and acquired a strategic interest in the bank in Feb 2011. Such initiatives strengthens Bank Islam’s size and market share and drives growth further. While Bank Islam’s attempt to pursue a controlling stake in PT Bank Muamalat in Indonesia was to no avail, we would not discount possibilities of another pursuit in the longer term given that Indonesia continue to pack vast potential for Islamic financing growth as the world’s most populous Muslim nation. MAY ISL is well-positioned to lead in the internationalisation of Islamic finance as it is the nation’s biggest bank (both Islamic and conventional) with the most extensive regional reach. In 2011, MAY ISL rolled out the “Islamic First” strategy in Malaysia, where customers were offered Islamic banking products as the first choice. Their efforts came to fruition as MAY ISL’s proportion of financing to the group surpassed the 50% mark in FY15 (from 39% in FY13). MAY ISL emulated the “Islamic First” strategy in Indonesia in 2014. This, along with initiatives such as increasing the awareness of Shariah products and services, a revamp of the Shariah offerings and expansion of distribution network (through conversion of conventional-only branches to dual branches offering both conventional and Shariah products), improved Bank Maybank Indonesia Unit Usaha Shariah industry ranking from 12th in FY13 to 5th in FY15, in terms of asset size. Over in Singapore, MAY ISL pioneered several products in the market such as a special savings account for the Hajj pilgrimage, Islamic Auto Finance, Malaysia Residential Property Financing and Malaysia Commercial & Industrial Property Financing in 2013, and Islamic Business Term Financing and Islamic trade facilities and foreign currency deposits in 2014.
MAY ISL: Proportion to MAY’s domestic financing
Source: Company, DBS Bank, AllianceDBS Global Sukuk League table
2015 2016
Bank Amount (USD m)
Market share (%)
Amount (USD m)
Market share (%)
CIMB 5,234.7 15.0 5,329.5 12.8 Maybank 2,959.8 8.5 4,602.4 11.0 Standard Chartered Bank 2,255.0 6.5 3,878.4 9.3 RHB 3,300.1 9.5 3,037.5 7.3 HSBC 4,453.0 12.8 2,905.4 7.0 Dubai Islamic Bank 1,302.6 3.7 2,636.2 6.3 AmInvestment Bank Bhd 1,914.3 5.5 2,633.9 6.3 JP Morgan 1,483.0 4.3 1,464.8 3.5 National Bank of Abu Dhabi 1,181.9 3.4 1,463.7 3.5 Emirates NBD PJSC 664.8 1.9 1,389.8 3.3
Source: Bloomberg L.P Finance Potential M&A candidates, MBSB and Bank Muamalat. Banks to watch in the M&A space include Malaysia Building Society (MBSB MK Equity) and Bank Muamalat (subsidiary of DRB MK Equity). In our view, MBSB remains an attractive M&A target, thanks to its lucrative personal financing business and sizeable Islamic banking assets. Furthermore, MBSB’s commitment towards “closing the gap” between it and the banks would further elevate its attractiveness, as it lowers the hurdle to integration. Based on current fundamentals, we believe current valuation is rich for the stock given its weak ROE traction of sub-5% in the near term (FY16- FY17). Nonetheless, in the event of an M&A (which in our view, will be increasingly imminent in FY18), we believe MBSB can fetch a higher valuation of 1.1x BV (refer to MBSB Equity Explorer).
38,7
10
52,3
69
61,9
98
86,8
79
108,
540
131,
123
25.6 29.1 30.8
38.7 44.5
50.7
0
10
20
30
40
50
60
-
20,000
40,000
60,000
80,000
100,000
120,000
140,000
2010
2011
2012
2013
2014
2015
%RM m
Financing (LHS) % to domestic financing (RHS)
Industry Focus
Islamic Banks
Page 23
MUAMALAT, a long awaited M&A play. While MUAMALAT is a relatively small entity, M&A talks have surfaced several times as its largest shareholder, DRB-HICOM (which has a 70% stake in MUAMALAT), had been required by BNM to pare down its significant stake to 40%. Alternatively, the pare down in shareholding could take the route of an initial public offering (IPO). In such a case, we expect the bank to fetch a valuation that is comparable to Affin (closest comparable to its ROE profile). At a conservative valuation of 0.5x BV, Bank Muamalat could be listed at a market capitalisation of close to RM1bn. BIMB (2011), Affin (2013) and MBSB (2016) had made an attempt to acquire MUAMALAT, but no firm developments have materialised to date
Quest for the next mega Islamic bank. Talks of a mega Islamic bank surfaced as early as 2010 when the Central Bank was said to be issuing two mega Islamic bank licences to foreign players with the condition of having a minimum RM1bn in paid-up capital. M&A spin-offs in the Islamic banking space are plausible, in our view, potentially creating a new wave of M&A activities in the Islamic banking space. In 2014, MBSB was involved in talks to merge with CIMB and RHB. Together, the merged entity was expected to displace MAY from its #1 ranking in Malaysia by asset size. More interestingly, MBSB was slated to remain listed and to act as a vehicle for any proposed mega Islamic Bank, i.e. the banking operations of CIMB Islamic and RHB Islamic would be injected into MBSB if the three-way merger were to succeed.
Industry Focus
Islamic Banks
Page 24
CONCLUSION The path to success of Islamic banking is a long and winding one. In our view, the Islamic banking industry remains a nascent industry, which still has plenty of hurdles to clear. There is indeed sufficient demand, from the large and fast-growing Muslim population and sizeable Islamic economies to justify the need for Islamic banking, but for the industry to enter into the attractive growth stage, the foundations of the industry need to be further strengthened. The challenges that are crucial for the industry to address include harmonising differences in Shariah compliance across jurisdictions, establishing an even playing field, strengthening the resources (human capital, technology, liquidity management tools) and promoting Islamic banking literacy to the public. Malaysia is in a unique position as the country is at the forefront of the industry. Undeniably, Malaysia has pioneered plenty of Islamic banking initiatives on the global stage, which have deepened the country’s knowledge and expertise. The country is a natural candidate to lead the industry to the next stage, especially with the strong support of regulators. Product innovation will be the transformative factor for the industry, in our view, as it enables the Islamic banks to step up their game
against its conventional counterparts. In that vein, we believe developments in this space are a crucial factor to monitor in identifying the next growth cycle for the industry. BIMB could lead the path. We like BIMB for its rich experience in the industry, which we believe forms a powerful competitive advantage for them to lead the avant-garde movement in product innovation given its superior knowledge in Islamic banking. MAY ISL complements the Islamic banking scene for its size and established regional presence which will work to its advantage in competing on the global front. MAY ISL and CIMB ISL are also global sukuk players. A new wave of M&A activities in the Islamic banking space is plausible, although timing remains the key risk. Potential M&A candidates include MBSB (whose appeal lies in its lucrative personal financing business and sizeable Islamic banking assets) and unlisted MUAMALAT (from a long awaited pare down in ownership by its largest shareholder, DRB). Albeit indirect, Bursa is also a proxy to growth in Islamic banking as transactions on its commodity trading platform, Bursa Suq al-Sila (BSAS), are expected to increase in conjunction with Islamic financing growth.
Malaysian Banks: Peer comparison
Banking Group Market cap
Price Target Price
Rating PE (x) CAGR P/BV (x) ROE (%) Net div (%)
(US$bn) (RM/s) (RM/s) CY15A CY16F CY17F ^ (%) CY15A CY16F CY17F CY16F CY16F
Affin Holdings 1,104 2.53 2.00 FULLY
VALUED 13.3x 9.9x 9.7x 17.3 0.6x 0.6x 0.6x 5.8% 4.1% Alliance* 1,332 3.89 NA NA 11.5x 11.5x 11.1x 1.7 1.3x 1.2x 1.2x 11.1% 4.2% AMMB 3,100 4.58 5.00 BUY 9.8x 10.9x 10.1x -1.3 0.9x 0.9x 0.8x 8.5% 4.1% CIMB Group 10,116 5.08 4.80 HOLD 15.1x 12.2x 11.1x 16.8 1.1x 1.0x 0.9x 8.6% 3.9% Hong Leong 6,165 13.38 15.00 BUY 13.8x 13.9x 12.2x 6.3 1.5x 1.3x 1.2x 10.5% 3.0% Maybank 19,363 8.46 7.50 HOLD 11.8x 14.1x 12.7x -3.7 1.3x 1.3x 1.3x 10.0% 5.5% Public Bank 17,341 20.00 22.50 BUY 15.3x 14.9x 14.2x 4.0 2.5x 2.3x 2.1x 15.3% 2.8% RHB Bank 3,514 5.09 5.40 BUY 9.5x 10.3x 9.2x 1.5 0.9x 0.8x 0.8x 8.6% 3.2%
Weighted average 13.3x 13.5x 12.4x 3.7 1.6x 1.5x 1.4x 11.1% 4.0% Weighted average (ex-Public Bank) 12.5x 12.9x 11.7x 3.6 1.2x 1.1x 1.1x 9.5% 4.5% Simple average 12.5x 12.2x 11.3x 5.3 1.3x 1.2x 1.1x 10.1% 3.9% Simple average (ex-Public Bank) 12.1x 11.8x 10.9x 5.5 1.1x 1.0x 1.0x 9.5% 4.0% BIMB 1,629 4.43 5.00 BUY 12.3x 12.4x 11.2x 2.8 2.0x 1.8x 1.7x 17.2% 3.3% Hong Leong Financial Group
3,909 15.20 17.00 BUY 11.2x 11.6x 10.2x 4.4 1.2x 1.1x 1.0x 10.5% 3.0%
* Based on Bloomberg consensus
^ Refers to a 2-year EPS CAGR for CY15-17F
Source: Companies, Bloomberg Finance L.P., DBS Bank, AllianceDBS
Industry Focus
Islamic Banks
Page 25
Company ProfilesCompany ProfilesCompany ProfilesCompany Profiles
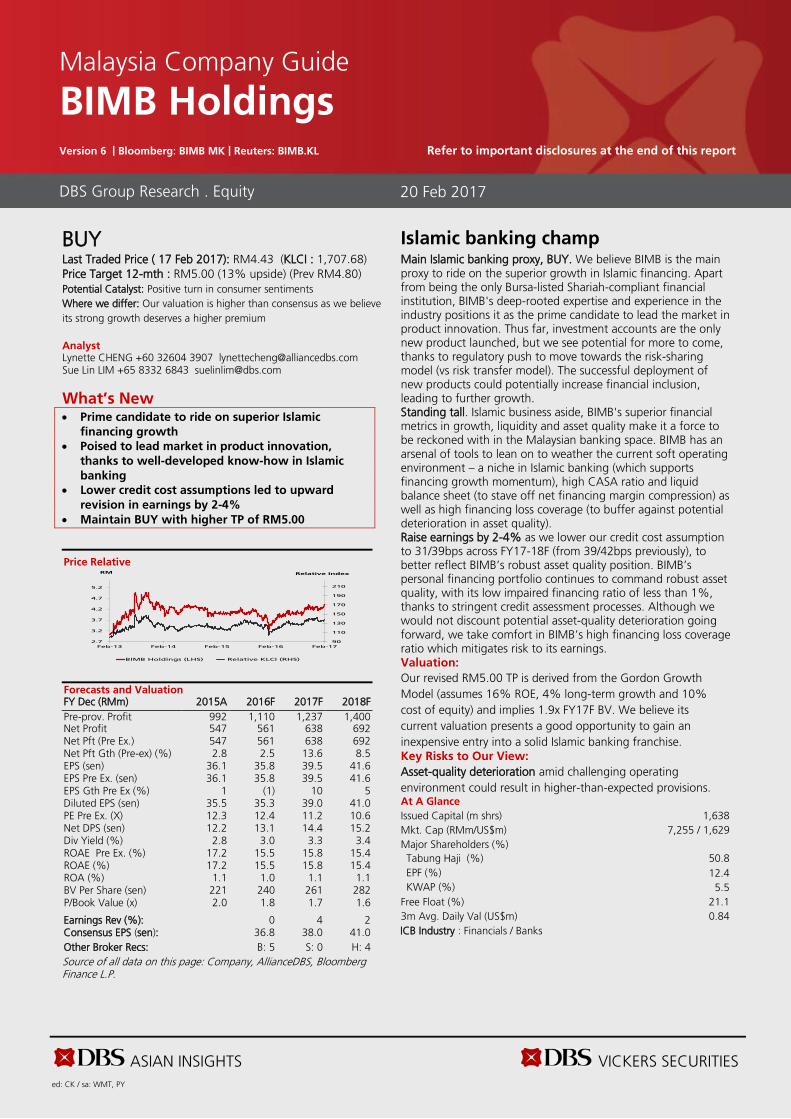
ASIAN INSIGHTS VICKERS SECURITIES ed: CK / sa: WMT, PY
BUY Last Traded Price ( 17 Feb 2017): RM4.43 (KLCI : 1,707.68) Price Target 12-mth : RM5.00 (13% upside) (Prev RM4.80) Potential Catalyst: Positive turn in consumer sentiments Where we differ: Our valuation is higher than consensus as we believe its strong growth deserves a higher premium Analyst Lynette CHENG +60 32604 3907 [email protected] Sue Lin LIM +65 8332 6843 [email protected]
What’s New • Prime candidate to ride on superior Islamic
financing growth • Poised to lead market in product innovation,
thanks to well-developed know-how in Islamic banking
• Lower credit cost assumptions led to upward revision in earnings by 2-4%
• Maintain BUY with higher TP of RM5.00
Price Relative
Forecasts and Valuation FY Dec (RMm) 2015A 2016F 2017F 2018F Pre-prov. Profit 992 1,110 1,237 1,400 Net Profit 547 561 638 692 Net Pft (Pre Ex.) 547 561 638 692 Net Pft Gth (Pre-ex) (%) 2.8 2.5 13.6 8.5 EPS (sen) 36.1 35.8 39.5 41.6 EPS Pre Ex. (sen) 36.1 35.8 39.5 41.6 EPS Gth Pre Ex (%) 1 (1) 10 5 Diluted EPS (sen) 35.5 35.3 39.0 41.0 PE Pre Ex. (X) 12.3 12.4 11.2 10.6 Net DPS (sen) 12.2 13.1 14.4 15.2 Div Yield (%) 2.8 3.0 3.3 3.4 ROAE Pre Ex. (%) 17.2 15.5 15.8 15.4 ROAE (%) 17.2 15.5 15.8 15.4 ROA (%) 1.1 1.0 1.1 1.1 BV Per Share (sen) 221 240 261 282 P/Book Value (x) 2.0 1.8 1.7 1.6 Earnings Rev (%): 0 4 2 Consensus EPS (sen): 36.8 38.0 41.0 Other Broker Recs: B: 5 S: 0 H: 4 Source of all data on this page: Company, AllianceDBS, Bloomberg Finance L.P.
Islamic banking champ Main Islamic banking proxy, BUY. We believe BIMB is the main proxy to ride on the superior growth in Islamic financing. Apart from being the only Bursa-listed Shariah-compliant financial institution, BIMB's deep-rooted expertise and experience in the industry positions it as the prime candidate to lead the market in product innovation. Thus far, investment accounts are the only new product launched, but we see potential for more to come, thanks to regulatory push to move towards the risk-sharing model (vs risk transfer model). The successful deployment of new products could potentially increase financial inclusion, leading to further growth. Standing tall. Islamic business aside, BIMB's superior financial metrics in growth, liquidity and asset quality make it a force to be reckoned with in the Malaysian banking space. BIMB has an arsenal of tools to lean on to weather the current soft operating environment – a niche in Islamic banking (which supports financing growth momentum), high CASA ratio and liquid balance sheet (to stave off net financing margin compression) as well as high financing loss coverage (to buffer against potential deterioration in asset quality). Raise earnings by 2-4% as we lower our credit cost assumption to 31/39bps across FY17-18F (from 39/42bps previously), to better reflect BIMB’s robust asset quality position. BIMB’s personal financing portfolio continues to command robust asset quality, with its low impaired financing ratio of less than 1%, thanks to stringent credit assessment processes. Although we would not discount potential asset-quality deterioration going forward, we take comfort in BIMB’s high financing loss coverage ratio which mitigates risk to its earnings. Valuation: Our revised RM5.00 TP is derived from the Gordon Growth Model (assumes 16% ROE, 4% long-term growth and 10% cost of equity) and implies 1.9x FY17F BV. We believe its current valuation presents a good opportunity to gain an inexpensive entry into a solid Islamic banking franchise. Key Risks to Our View: Asset-quality deterioration amid challenging operating environment could result in higher-than-expected provisions. At A Glance Issued Capital (m shrs) 1,638 Mkt. Cap (RMm/US$m) 7,255 / 1,629 Major Shareholders (%) Tabung Haji (%) 50.8 EPF (%) 12.4 KWAP (%) 5.5
Free Float (%) 21.1 3m Avg. Daily Val (US$m) 0.84 ICB Industry : Financials / Banks
DBS Group Research . Equity
20 Feb 2017
Malaysia Company Guide
BIMB Holdings Version 6 | Bloomberg: BIMB MK | Reuters: BIMB.KL Refer to important disclosures at the end of this report
90
110
130
150
170
190
210
2.7
3.2
3.7
4.2
4.7
5.2
Feb-13 Feb-14 Feb-15 Feb-16 Feb-17
Relative IndexRM
BIMB Holdings (LHS) Relative KLCI (RHS)
ASIAN INSIGHTS VICKERS SECURITIES Page 27
Company Guide
BIMB Holdings
WHAT’S NEW
At the forefront of Islamic banking Islamic banking champ
Undisputed proxy to ride on the growth in Islamic banking. Due to strong regulatory push for the Islamic banking agenda, we believe financing and deposit growth will continue to outpace its conventional peers. As the oldest Islamic bank in Malaysia, we believe BIMB is the prime candidate to ride on this exciting growth. Indeed, BIMB’s financing growth outpaced the system’s financing growth since 2012 and grew relatively similar to the Islamic financing growth (see Chart 1). Furthermore, with its deep-rooted expertise and rich experience in the sector, we believe BIMB is poised to be the market leader in product innovation of Islamic banking offerings. This was evident when the Investment Account was first introduced, as BIMB took the lead in providing consumer education on the product. Further aiding this is the support from government-linked companies (GLCs), whose personnel serve as an avenue for BIMB to roll out salary deduction schemes for personal financing.
Further re-rating catalyst could come from spreading its wings regionally. Although this agenda may be placed in the back burner in the near term due to the challenging operating environment, we believe this remains a potential growth lever for BIMB in the long term. This could be through strategic partnerships or technical collaborations. A strategic partnership could involve taking a strategic stake in the host country bank or a merger or acquisition. For example, Bank Islam assisted in setting up the first Islamic bank in Sri Lanka (Amana Bank Ltd) and acquired a strategic interest in the bank in Feb 2011. Such initiatives can strengthen Bank Islam’s size and market share, and can help accelerate its growth. While Bank Islam’s attempt to pursue a controlling stake in PT Bank Muamalat in Indonesia was to no avail, we would not discount the possibility of another pursuit in the longer term given that Indonesia continues to hold vast potential for Islamic financing growth as the world’s most populous Muslim nation (refer to Chart 3).
Impaired financing ratio of personal financing portfolio remains low at less than 1%. While challenges are abound on the retail segment (amid rising cost of living and weak consumer sentiments), BIMB’s retail portfolio have thus far remained resilient. 90% of its personal financing portfolio (which makes up 30% of its financing book) is structured under packaged financing scheme, where customers repay their financing either through a salary-deduction or salary-transfer mechanism. Under the salary-deduction mode, salaries of customers are paid into Bank Islam accounts, and the Bank directly debits repayment once their salaries have
been credited. Under the salary-transfer mechanism, employers deduct repayments from the salaries of their employees and subsequently remit payments to Bank Islam. While the risk attached to this lies in the change in employment of the customer (thus, turning into a non-packaged customer), we understand that BIMB’s experience with non-packaged financing customers have still been encouraging so far. The low impaired financing ratio of less than 1% is testament to the resiliency of BIMB’s personal financing portfolio.
Asset quality indicators remain supportive of strong growth potential. Personal financing aside, BIMB has also been growing mortgage financing with a discipline of avoiding speculative spaces. Hence, the typical mortgage customers for BIMB are first time home buyers. 75% of its mortgage portfolio is extended for landed properties. Meanwhile, oil and gas exposure to BIMB stands at 10%, inclusive of its retail portfolio. Its banking peers reported less than 5% exposure to oil and gas, but does not include its respective retail exposure. While oil and gas remains a keenly watched segment for BIMB, the portfolio has held up thus far, with no alarming trends noted by management. We understand that BIMB exposure is largely for contract financing and does not have any exposure to the upstream space.
Raise earnings by 2-4% as we lower our credit cost assumption to 31/39bps across FY17-18F (from 39/42bps previously), to better reflect BIMB’s robust asset quality position. Although we would not discount potential asset-quality deterioration going forward, we take comfort in BIMB’s high financing loss coverage ratio which mitigates risk to its earnings (refer to Chart 2). BIMB’s financing loss coverage ratio is able to stay within 100%, even if impaired financing increases by a whopping 70%.
Valuation and recommendation
Maintain BUY with higher TP of RM5.00 post earnings adjustment. Our TP implies 1.9x BV, which we believe is fair for a franchise delivering ROEs of more than 15% and better-than-industry metrics. A restructuring exercise to collapse the financial holding structure of BIMB could be in the cards to remove double leverage ratio concerns. In our previous report, we expressed preference towards keeping STMB under Bank Islam as it provides better potential gain. For the full analysis, please refer to the report dated 22 Dec 2016 in this link.
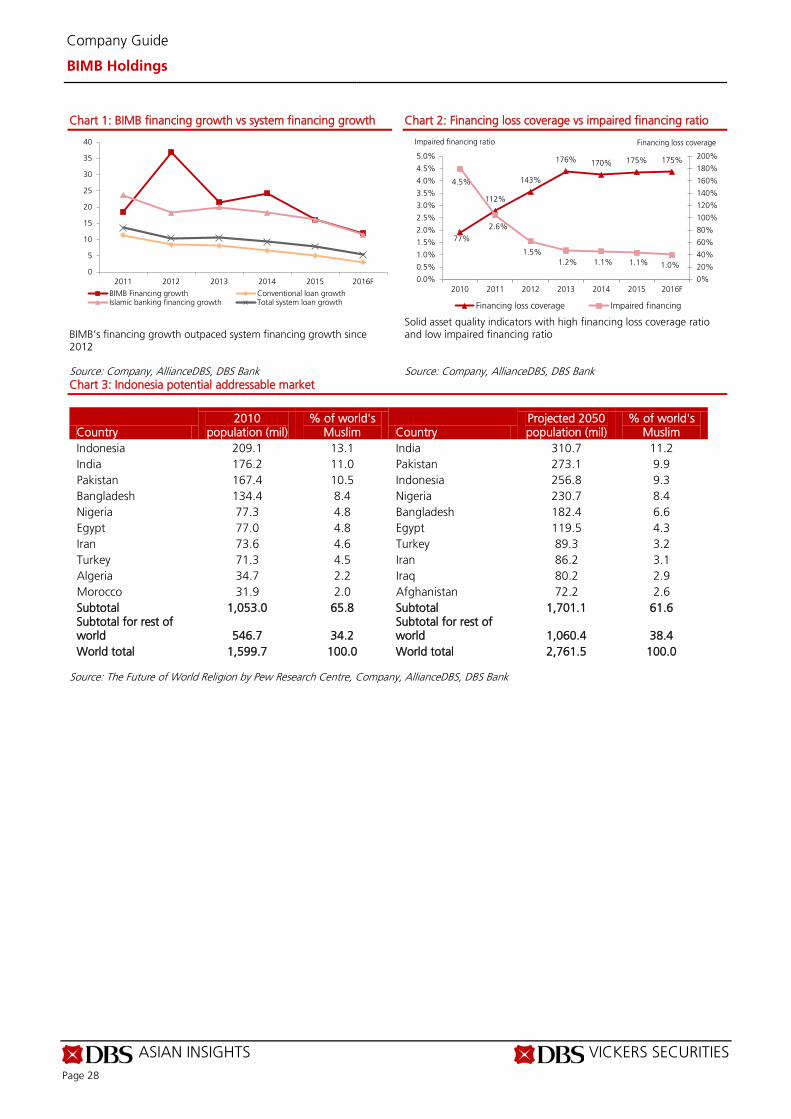
ASIAN INSIGHTS VICKERS SECURITIES Page 28
Company Guide
BIMB Holdings
Chart 1: BIMB financing growth vs system financing growth
BIMB’s financing growth outpaced system financing growth since 2012 Source: Company, AllianceDBS, DBS Bank
Chart 2: Financing loss coverage vs impaired financing ratio
Solid asset quality indicators with high financing loss coverage ratio and low impaired financing ratio Source: Company, AllianceDBS, DBS Bank
Chart 3: Indonesia potential addressable market
Country 2010
population (mil) % of world's
Muslim Country Projected 2050 population (mil)
% of world's Muslim
Indonesia 209.1 13.1 India 310.7 11.2 India 176.2 11.0 Pakistan 273.1 9.9 Pakistan 167.4 10.5 Indonesia 256.8 9.3 Bangladesh 134.4 8.4 Nigeria 230.7 8.4 Nigeria 77.3 4.8 Bangladesh 182.4 6.6 Egypt 77.0 4.8 Egypt 119.5 4.3 Iran 73.6 4.6 Turkey 89.3 3.2 Turkey 71.3 4.5 Iran 86.2 3.1 Algeria 34.7 2.2 Iraq 80.2 2.9 Morocco 31.9 2.0 Afghanistan 72.2 2.6 Subtotal 1,053.0 65.8 Subtotal 1,701.1 61.6 Subtotal for rest of world 546.7 34.2
Subtotal for rest of world 1,060.4 38.4
World total 1,599.7 100.0 World total 2,761.5 100.0 Source: The Future of World Religion by Pew Research Centre, Company, AllianceDBS, DBS Bank
0
5
10
15
20
25
30
35
40
2011 2012 2013 2014 2015 2016F
BIMB Financing growth Conventional loan growthIslamic banking financing growth Total system loan growth
77%
112%
143%
176% 170% 175% 175%
4.5%
2.6%
1.5%1.2% 1.1% 1.1% 1.0%
0.0%
0.5%
1.0%
1.5%
2.0%
2.5%
3.0%
3.5%
4.0%
4.5%
5.0%
0%
20%
40%
60%
80%
100%
120%
140%
160%
180%
200%
2010 2011 2012 2013 2014 2015 2016F
Financing loss coverage Impaired financing
Impaired financing ratio Financing loss coverage
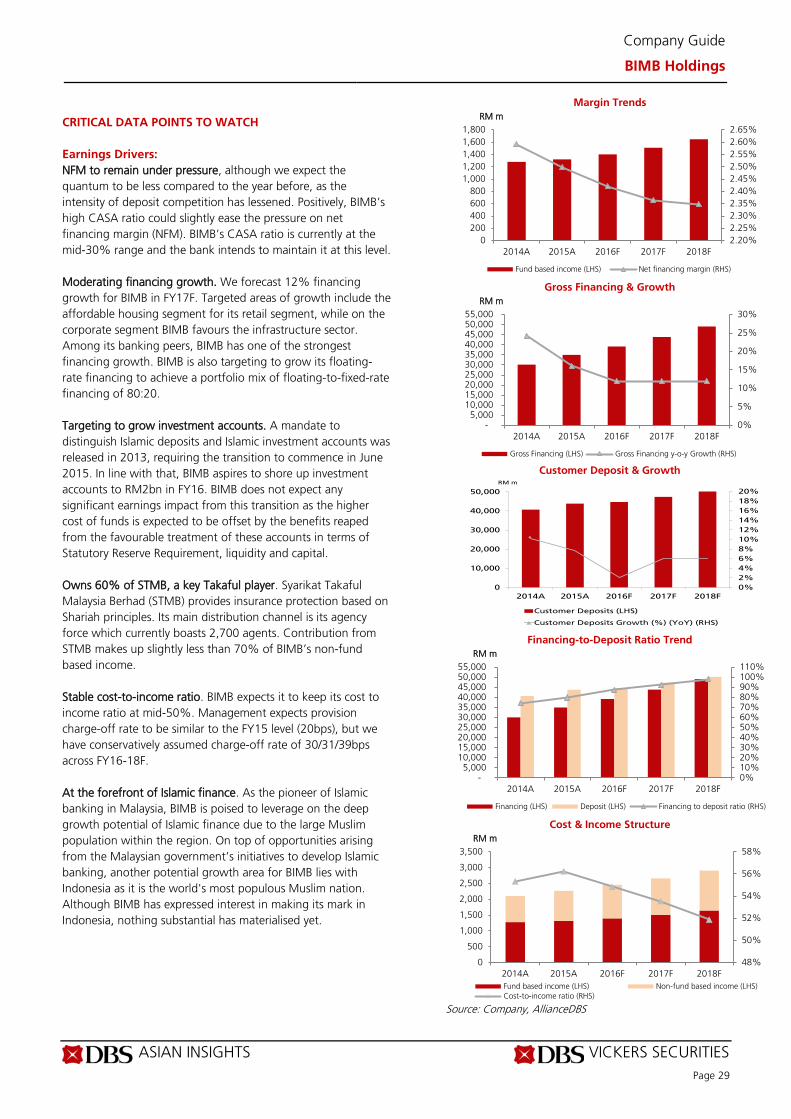
ASIAN INSIGHTS VICKERS SECURITIES Page 29
Company Guide
BIMB Holdings
CRITICAL DATA POINTS TO WATCH Earnings Drivers: NFM to remain under pressure, although we expect the quantum to be less compared to the year before, as the intensity of deposit competition has lessened. Positively, BIMB’s high CASA ratio could slightly ease the pressure on net financing margin (NFM). BIMB’s CASA ratio is currently at the mid-30% range and the bank intends to maintain it at this level. Moderating financing growth. We forecast 12% financing growth for BIMB in FY17F. Targeted areas of growth include the affordable housing segment for its retail segment, while on the corporate segment BIMB favours the infrastructure sector. Among its banking peers, BIMB has one of the strongest financing growth. BIMB is also targeting to grow its floating-rate financing to achieve a portfolio mix of floating-to-fixed-rate financing of 80:20. Targeting to grow investment accounts. A mandate to distinguish Islamic deposits and Islamic investment accounts was released in 2013, requiring the transition to commence in June 2015. In line with that, BIMB aspires to shore up investment accounts to RM2bn in FY16. BIMB does not expect any significant earnings impact from this transition as the higher cost of funds is expected to be offset by the benefits reaped from the favourable treatment of these accounts in terms of Statutory Reserve Requirement, liquidity and capital. Owns 60% of STMB, a key Takaful player. Syarikat Takaful Malaysia Berhad (STMB) provides insurance protection based on Shariah principles. Its main distribution channel is its agency force which currently boasts 2,700 agents. Contribution from STMB makes up slightly less than 70% of BIMB’s non-fund based income. Stable cost-to-income ratio. BIMB expects it to keep its cost to income ratio at mid-50%. Management expects provision charge-off rate to be similar to the FY15 level (20bps), but we have conservatively assumed charge-off rate of 30/31/39bps across FY16-18F. At the forefront of Islamic finance. As the pioneer of Islamic banking in Malaysia, BIMB is poised to leverage on the deep growth potential of Islamic finance due to the large Muslim population within the region. On top of opportunities arising from the Malaysian government’s initiatives to develop Islamic banking, another potential growth area for BIMB lies with Indonesia as it is the world's most populous Muslim nation. Although BIMB has expressed interest in making its mark in Indonesia, nothing substantial has materialised yet.
Margin Trends
Gross Financing & Growth
Customer Deposit & Growth
Financing-to-Deposit Ratio Trend
Cost & Income Structure
Source: Company, AllianceDBS
2.20%2.25%2.30%2.35%2.40%2.45%2.50%2.55%2.60%2.65%
0200400600800
1,0001,2001,4001,6001,800
2014A 2015A 2016F 2017F 2018F
RM m
Fund based income (LHS) Net financing margin (RHS)
0%
5%
10%
15%
20%
25%
30%
- 5,000
10,000 15,000 20,000 25,000 30,000 35,000 40,000 45,000 50,000 55,000
2014A 2015A 2016F 2017F 2018F
RM m
Gross Financing (LHS) Gross Financing y-o-y Growth (RHS)
0%2%4%6%8%10%12%14%16%18%20%
0
10,000
20,000
30,000
40,000
50,000
2014A 2015A 2016F 2017F 2018F
RM m
Customer Deposits (LHS)
Customer Deposits Growth (%) (YoY) (RHS)
0%10%20%30%40%50%60%70%80%90%100%110%
- 5,000
10,000 15,000 20,000 25,000 30,000 35,000 40,000 45,000 50,000 55,000
2014A 2015A 2016F 2017F 2018F
RM m
Financing (LHS) Deposit (LHS) Financing to deposit ratio (RHS)
48%
50%
52%
54%
56%
58%
0
500
1,000
1,500
2,000
2,500
3,000
3,500
2014A 2015A 2016F 2017F 2018F
RM m
Fund based income (LHS) Non-fund based income (LHS)Cost-to-income ratio (RHS)
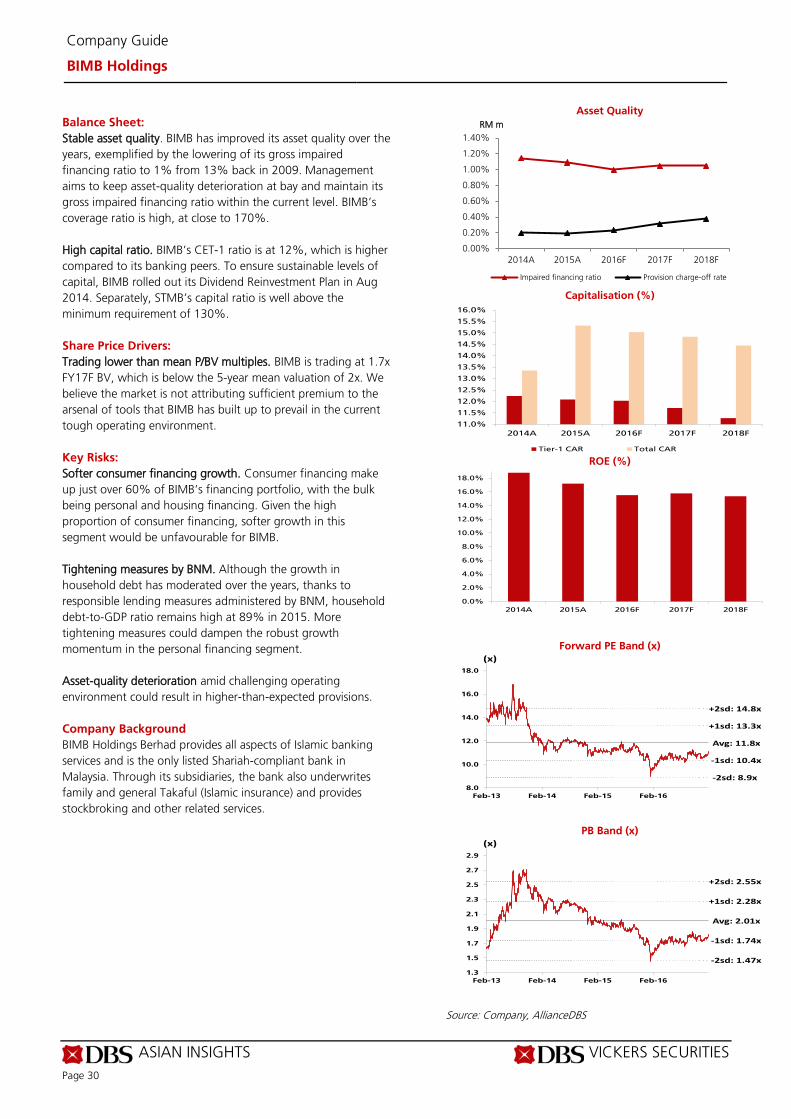
ASIAN INSIGHTS VICKERS SECURITIES Page 30
Company Guide
BIMB Holdings
Balance Sheet: Stable asset quality. BIMB has improved its asset quality over the years, exemplified by the lowering of its gross impaired financing ratio to 1% from 13% back in 2009. Management aims to keep asset-quality deterioration at bay and maintain its gross impaired financing ratio within the current level. BIMB’s coverage ratio is high, at close to 170%. High capital ratio. BIMB’s CET-1 ratio is at 12%, which is higher compared to its banking peers. To ensure sustainable levels of capital, BIMB rolled out its Dividend Reinvestment Plan in Aug 2014. Separately, STMB’s capital ratio is well above the minimum requirement of 130%. Share Price Drivers: Trading lower than mean P/BV multiples. BIMB is trading at 1.7x FY17F BV, which is below the 5-year mean valuation of 2x. We believe the market is not attributing sufficient premium to the arsenal of tools that BIMB has built up to prevail in the current tough operating environment. Key Risks: Softer consumer financing growth. Consumer financing make up just over 60% of BIMB’s financing portfolio, with the bulk being personal and housing financing. Given the high proportion of consumer financing, softer growth in this segment would be unfavourable for BIMB. Tightening measures by BNM. Although the growth in household debt has moderated over the years, thanks to responsible lending measures administered by BNM, household debt-to-GDP ratio remains high at 89% in 2015. More tightening measures could dampen the robust growth momentum in the personal financing segment. Asset-quality deterioration amid challenging operating environment could result in higher-than-expected provisions. Company Background BIMB Holdings Berhad provides all aspects of Islamic banking services and is the only listed Shariah-compliant bank in Malaysia. Through its subsidiaries, the bank also underwrites family and general Takaful (Islamic insurance) and provides stockbroking and other related services.
Asset Quality
Capitalisation (%)
ROE (%)
Forward PE Band (x)
PB Band (x)
Source: Company, AllianceDBS
0.00%
0.20%
0.40%
0.60%
0.80%
1.00%
1.20%
1.40%
2014A 2015A 2016F 2017F 2018F
RM m
Impaired financing ratio Provision charge-off rate
11.0%
11.5%
12.0%
12.5%
13.0%
13.5%
14.0%
14.5%
15.0%
15.5%
16.0%
2014A 2015A 2016F 2017F 2018F
Tier-1 CAR Total CAR
0.0%
2.0%
4.0%
6.0%
8.0%
10.0%
12.0%
14.0%
16.0%
18.0%
2014A 2015A 2016F 2017F 2018F
Avg: 11.8x
+1sd: 13.3x
+2sd: 14.8x
-1sd: 10.4x
-2sd: 8.9x8.0
10.0
12.0
14.0
16.0
18.0
Feb-13 Feb-14 Feb-15 Feb-16
(x)
Avg: 2.01x
+1sd: 2.28x
+2sd: 2.55x
-1sd: 1.74x
-2sd: 1.47x1.3
1.5
1.7
1.9
2.1
2.3
2.5
2.7
2.9
Feb-13 Feb-14 Feb-15 Feb-16
(x)
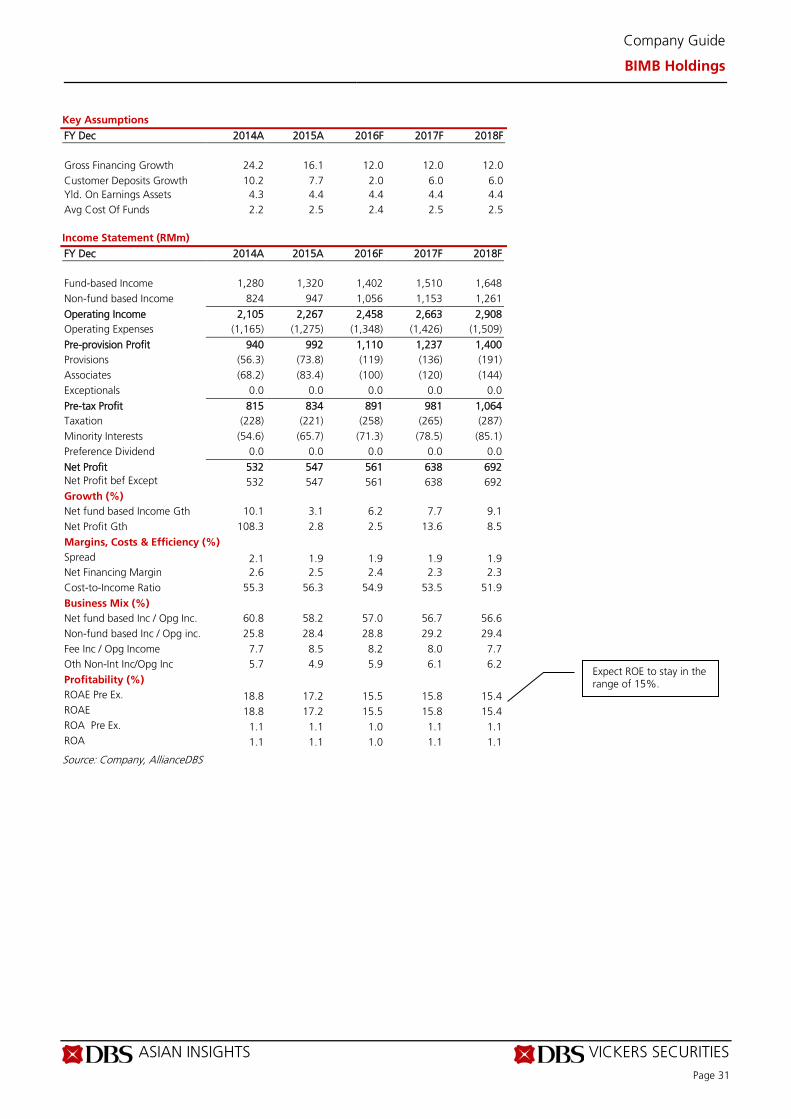
ASIAN INSIGHTS VICKERS SECURITIES Page 31
Company Guide
BIMB Holdings
Key Assumptions
FY Dec 2014A 2015A 2016F 2017F 2018F
Gross Financing Growth 24.2 16.1 12.0 12.0 12.0 Customer Deposits Growth 10.2 7.7 2.0 6.0 6.0 Yld. On Earnings Assets 4.3 4.4 4.4 4.4 4.4 Avg Cost Of Funds 2.2 2.5 2.4 2.5 2.5 Income Statement (RMm)
FY Dec 2014A 2015A 2016F 2017F 2018F Fund-based Income 1,280 1,320 1,402 1,510 1,648 Non-fund based Income 824 947 1,056 1,153 1,261
Operating Income 2,105 2,267 2,458 2,663 2,908 Operating Expenses (1,165) (1,275) (1,348) (1,426) (1,509)
Pre-provision Profit 940 992 1,110 1,237 1,400 Provisions (56.3) (73.8) (119) (136) (191) Associates (68.2) (83.4) (100) (120) (144) Exceptionals 0.0 0.0 0.0 0.0 0.0
Pre-tax Profit 815 834 891 981 1,064 Taxation (228) (221) (258) (265) (287) Minority Interests (54.6) (65.7) (71.3) (78.5) (85.1) Preference Dividend 0.0 0.0 0.0 0.0 0.0
Net Profit 532 547 561 638 692 Net Profit bef Except 532 547 561 638 692 Growth (%) Net fund based Income Gth 10.1 3.1 6.2 7.7 9.1 Net Profit Gth 108.3 2.8 2.5 13.6 8.5
Margins, Costs & Efficiency (%) Spread 2.1 1.9 1.9 1.9 1.9 Net Financing Margin 2.6 2.5 2.4 2.3 2.3 Cost-to-Income Ratio 55.3 56.3 54.9 53.5 51.9
Business Mix (%) Net fund based Inc / Opg Inc. 60.8 58.2 57.0 56.7 56.6 Non-fund based Inc / Opg inc. 25.8 28.4 28.8 29.2 29.4 Fee Inc / Opg Income 7.7 8.5 8.2 8.0 7.7 Oth Non-Int Inc/Opg Inc 5.7 4.9 5.9 6.1 6.2
Profitability (%) ROAE Pre Ex. 18.8 17.2 15.5 15.8 15.4 ROAE 18.8 17.2 15.5 15.8 15.4 ROA Pre Ex. 1.1 1.1 1.0 1.1 1.1 ROA 1.1 1.1 1.0 1.1 1.1
Source: Company, AllianceDBS
Expect ROE to stay in the range of 15%.
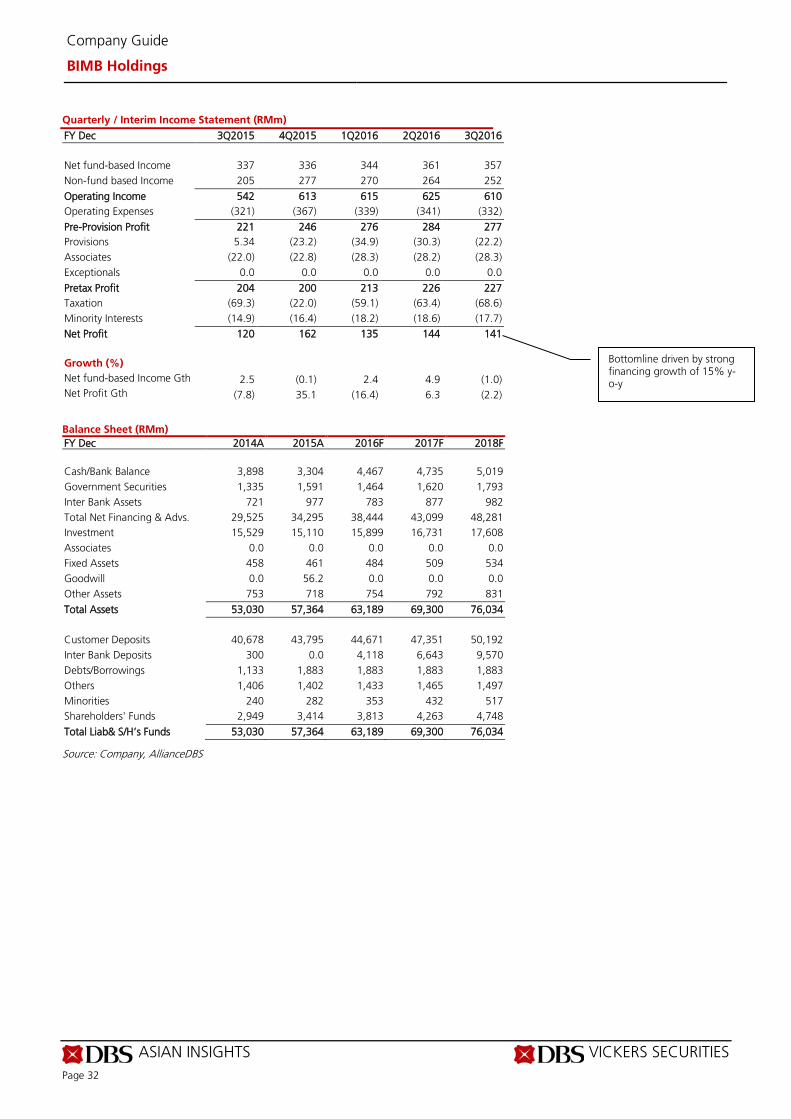
ASIAN INSIGHTS VICKERS SECURITIES Page 32
Company Guide
BIMB Holdings
Quarterly / Interim Income Statement (RMm)
FY Dec 3Q2015 4Q2015 1Q2016 2Q2016 3Q2016 Net fund-based Income 337 336 344 361 357 Non-fund based Income 205 277 270 264 252
Operating Income 542 613 615 625 610 Operating Expenses (321) (367) (339) (341) (332)
Pre-Provision Profit 221 246 276 284 277 Provisions 5.34 (23.2) (34.9) (30.3) (22.2) Associates (22.0) (22.8) (28.3) (28.2) (28.3) Exceptionals 0.0 0.0 0.0 0.0 0.0
Pretax Profit 204 200 213 226 227 Taxation (69.3) (22.0) (59.1) (63.4) (68.6) Minority Interests (14.9) (16.4) (18.2) (18.6) (17.7) Net Profit 120 162 135 144 141 Growth (%) Net fund-based Income Gth 2.5 (0.1) 2.4 4.9 (1.0) Net Profit Gth (7.8) 35.1 (16.4) 6.3 (2.2)
Balance Sheet (RMm) FY Dec 2014A 2015A 2016F 2017F 2018F Cash/Bank Balance 3,898 3,304 4,467 4,735 5,019 Government Securities 1,335 1,591 1,464 1,620 1,793 Inter Bank Assets 721 977 783 877 982 Total Net Financing & Advs. 29,525 34,295 38,444 43,099 48,281 Investment 15,529 15,110 15,899 16,731 17,608 Associates 0.0 0.0 0.0 0.0 0.0 Fixed Assets 458 461 484 509 534 Goodwill 0.0 56.2 0.0 0.0 0.0 Other Assets 753 718 754 792 831
Total Assets 53,030 57,364 63,189 69,300 76,034 Customer Deposits 40,678 43,795 44,671 47,351 50,192 Inter Bank Deposits 300 0.0 4,118 6,643 9,570 Debts/Borrowings 1,133 1,883 1,883 1,883 1,883 Others 1,406 1,402 1,433 1,465 1,497 Minorities 240 282 353 432 517 Shareholders' Funds 2,949 3,414 3,813 4,263 4,748
Total Liab& S/H’s Funds 53,030 57,364 63,189 69,300 76,034
Source: Company, AllianceDBS
Bottomline driven by strong financing growth of 15% y-o-y
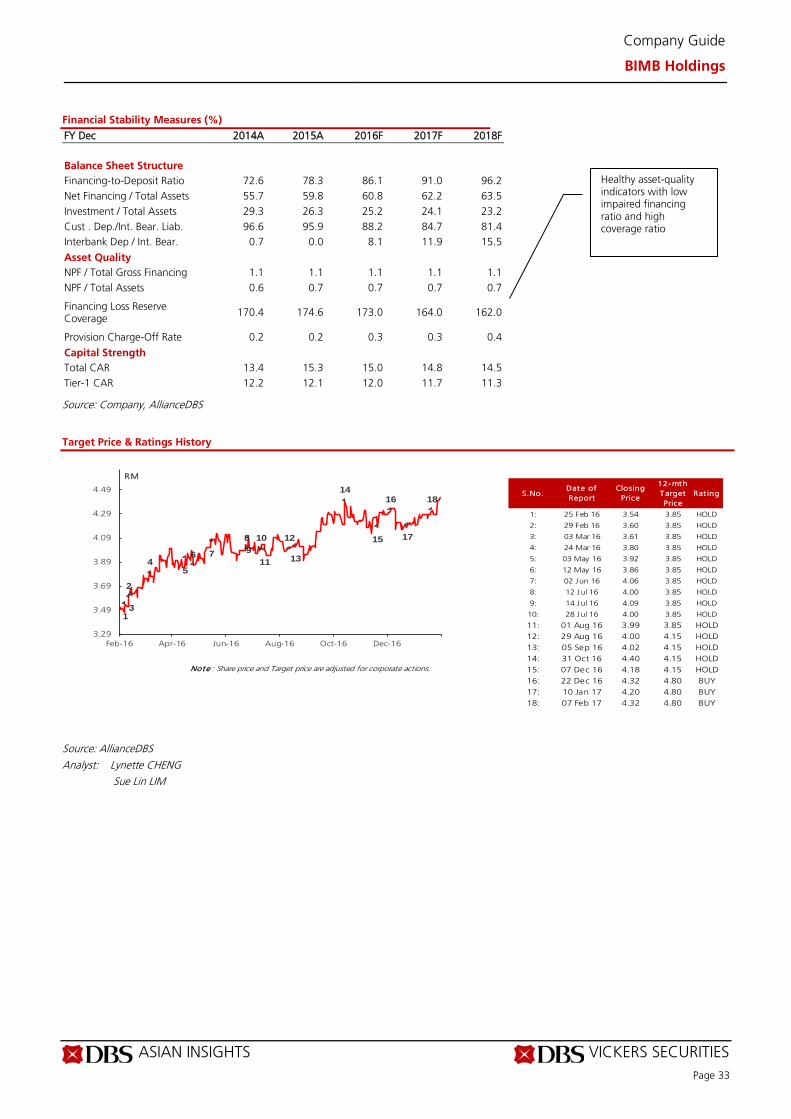
ASIAN INSIGHTS VICKERS SECURITIES Page 33
Company Guide
BIMB Holdings
Financial Stability Measures (%)
FY Dec 2014A 2015A 2016F 2017F 2018F Balance Sheet Structure
Financing-to-Deposit Ratio 72.6 78.3 86.1 91.0 96.2 Net Financing / Total Assets 55.7 59.8 60.8 62.2 63.5 Investment / Total Assets 29.3 26.3 25.2 24.1 23.2 Cust . Dep./Int. Bear. Liab. 96.6 95.9 88.2 84.7 81.4 Interbank Dep / Int. Bear. 0.7 0.0 8.1 11.9 15.5
Asset Quality NPF / Total Gross Financing 1.1 1.1 1.1 1.1 1.1 NPF / Total Assets 0.6 0.7 0.7 0.7 0.7
Financing Loss Reserve Coverage
170.4 174.6 173.0 164.0 162.0
Provision Charge-Off Rate 0.2 0.2 0.3 0.3 0.4
Capital Strength Total CAR 13.4 15.3 15.0 14.8 14.5 Tier-1 CAR 12.2 12.1 12.0 11.7 11.3
Source: Company, AllianceDBS
Target Price & Ratings History
Source: AllianceDBS
Analyst: Lynette CHENG Sue Lin LIM
S.No.Date of Report
Closing Price
12-mth Target Price
Rat ing
1: 25 Feb 16 3.54 3.85 HOLD
2: 29 Feb 16 3.60 3.85 HOLD
3: 03 Mar 16 3.61 3.85 HOLD
4: 24 Mar 16 3.80 3.85 HOLD
5: 03 May 16 3.92 3.85 HOLD
6: 12 May 16 3.86 3.85 HOLD
7: 02 Jun 16 4.06 3.85 HOLD
8: 12 Jul 16 4.00 3.85 HOLD
9: 14 Jul 16 4.09 3.85 HOLD
10: 28 Jul 16 4.00 3.85 HOLD
11: 01 Aug 16 3.99 3.85 HOLD12: 29 Aug 16 4.00 4.15 HOLD13: 05 Sep 16 4.02 4.15 HOLD14: 31 Oct 16 4.40 4.15 HOLD
Note : Share price and Target price are adjusted for corporate actions. 15: 07 Dec 16 4.18 4.15 HOLD16: 22 Dec 16 4.32 4.80 BUY17: 10 Jan 17 4.20 4.80 BUY18: 07 Feb 17 4.32 4.80 BUY
1
2
3
45
6 7
89
10
11
12
13
14
15
16
17
18
3.29
3.49
3.69
3.89
4.09
4.29
4.49
Feb-16 Apr-16 Jun-16 Aug-16 Oct-16 Dec-16
RM
Healthy asset-quality indicators with low impaired financing ratio and high coverage ratio
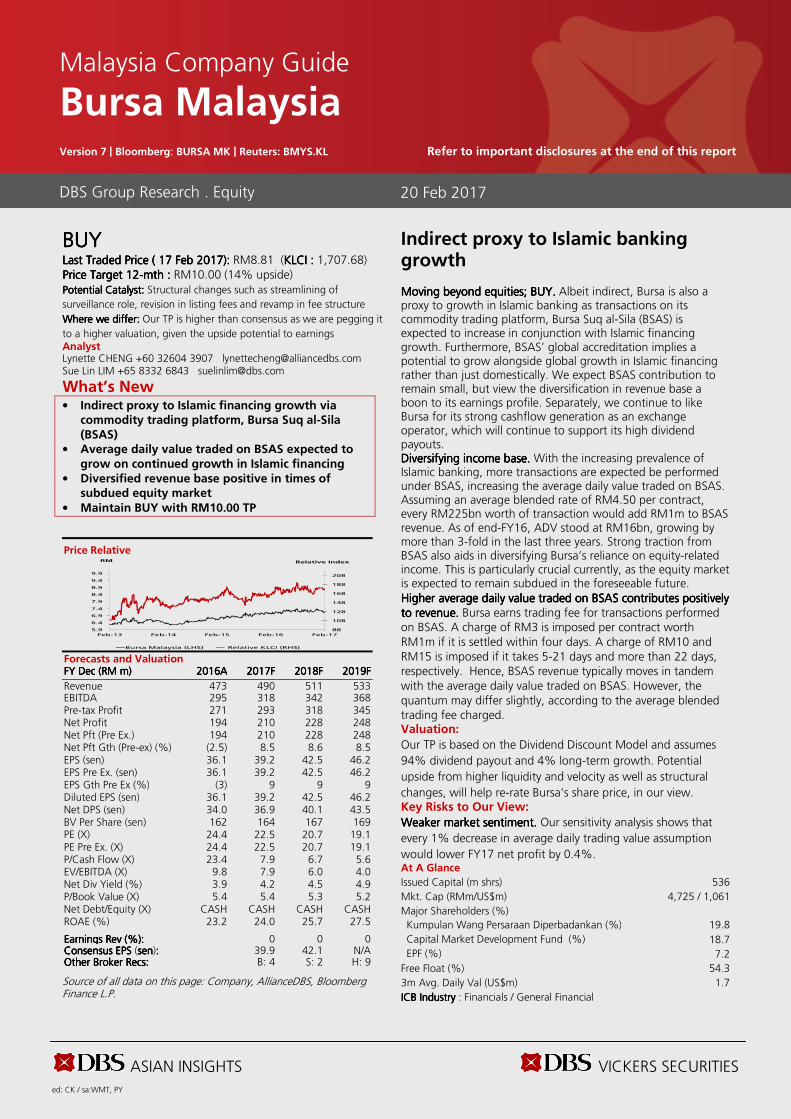
ASIAN INSIGHTS VICKERS SECURITIES ed: CK / sa:WMT, PY
BUYBUYBUYBUY Last Traded PriceLast Traded PriceLast Traded PriceLast Traded Price (((( 17 Feb 201717 Feb 201717 Feb 201717 Feb 2017)))): : : : RM8.81 (KLCIKLCIKLCIKLCI : : : : 1,707.68) Price Target Price Target Price Target Price Target 12121212----mthmthmthmth :::: RM10.00 (14% upside) Potential Catalyst: Potential Catalyst: Potential Catalyst: Potential Catalyst: Structural changes such as streamlining of
surveillance role, revision in listing fees and revamp in fee structure
Where we differWhere we differWhere we differWhere we differ:::: Our TP is higher than consensus as we are pegging it
to a higher valuation, given the upside potential to earnings Analyst Lynette CHENG +60 32604 3907 [email protected] Sue Lin LIM +65 8332 6843 [email protected]
What’s New • Indirect proxy to Islamic financing growth via
commodity trading platform, Bursa Suq al-Sila (BSAS)
• Average daily value traded on BSAS expected to grow on continued growth in Islamic financing
• Diversified revenue base positive in times of subdued equity market
• Maintain BUY with RM10.00 TP
Price Relative
Forecasts and Valuation FY FY FY FY DecDecDecDec ((((RMRMRMRM m) m) m) m) 2016201620162016AAAA 2017201720172017FFFF 2018201820182018FFFF 2019201920192019FFFF
Revenue 473 490 511 533 EBITDA 295 318 342 368 Pre-tax Profit 271 293 318 345 Net Profit 194 210 228 248 Net Pft (Pre Ex.) 194 210 228 248 Net Pft Gth (Pre-ex) (%) (2.5) 8.5 8.6 8.5 EPS (sen) 36.1 39.2 42.5 46.2 EPS Pre Ex. (sen) 36.1 39.2 42.5 46.2 EPS Gth Pre Ex (%) (3) 9 9 9 Diluted EPS (sen) 36.1 39.2 42.5 46.2 Net DPS (sen) 34.0 36.9 40.1 43.5 BV Per Share (sen) 162 164 167 169 PE (X) 24.4 22.5 20.7 19.1 PE Pre Ex. (X) 24.4 22.5 20.7 19.1 P/Cash Flow (X) 23.4 7.9 6.7 5.6 EV/EBITDA (X) 9.8 7.9 6.0 4.0 Net Div Yield (%) 3.9 4.2 4.5 4.9 P/Book Value (X) 5.4 5.4 5.3 5.2 Net Debt/Equity (X) CASH CASH CASH CASH ROAE (%) 23.2 24.0 25.7 27.5 Earnings Rev (%):Earnings Rev (%):Earnings Rev (%):Earnings Rev (%): 0 0 0 Consensus EPS Consensus EPS Consensus EPS Consensus EPS (sensensensen):::: 39.9 42.1 N/A Other Broker Recs:Other Broker Recs:Other Broker Recs:Other Broker Recs: B: 4 S: 2 H: 9
Source of all data on this page: Company, AllianceDBS, Bloomberg Finance L.P.
Indirect proxy to Islamic banking growth Moving beyond equities; BUY.Moving beyond equities; BUY.Moving beyond equities; BUY.Moving beyond equities; BUY. Albeit indirect, Bursa is also a proxy to growth in Islamic banking as transactions on its commodity trading platform, Bursa Suq al-Sila (BSAS) is expected to increase in conjunction with Islamic financing growth. Furthermore, BSAS’ global accreditation implies a potential to grow alongside global growth in Islamic financing rather than just domestically. We expect BSAS contribution to remain small, but view the diversification in revenue base a boon to its earnings profile. Separately, we continue to like Bursa for its strong cashflow generation as an exchange operator, which will continue to support its high dividend payouts. Diversifying income base.Diversifying income base.Diversifying income base.Diversifying income base. With the increasing prevalence of Islamic banking, more transactions are expected be performed under BSAS, increasing the average daily value traded on BSAS. Assuming an average blended rate of RM4.50 per contract, every RM225bn worth of transaction would add RM1m to BSAS revenue. As of end-FY16, ADV stood at RM16bn, growing by more than 3-fold in the last three years. Strong traction from BSAS also aids in diversifying Bursa’s reliance on equity-related income. This is particularly crucial currently, as the equity market is expected to remain subdued in the foreseeable future. Higher average daily value traded on BSAS contributes positively Higher average daily value traded on BSAS contributes positively Higher average daily value traded on BSAS contributes positively Higher average daily value traded on BSAS contributes positively to revenue.to revenue.to revenue.to revenue. Bursa earns trading fee for transactions performed on BSAS. A charge of RM3 is imposed per contract worth RM1m if it is settled within four days. A charge of RM10 and RM15 is imposed if it takes 5-21 days and more than 22 days, respectively. Hence, BSAS revenue typically moves in tandem with the average daily value traded on BSAS. However, the quantum may differ slightly, according to the average blended trading fee charged. Valuation:
Our TP is based on the Dividend Discount Model and assumes
94% dividend payout and 4% long-term growth. Potential
upside from higher liquidity and velocity as well as structural
changes, will help re-rate Bursa's share price, in our view. Key Risks to Our View:
Weaker market sentiment.Weaker market sentiment.Weaker market sentiment.Weaker market sentiment. Our sensitivity analysis shows that
every 1% decrease in average daily trading value assumption
would lower FY17 net profit by 0.4%. At A Glance Issued Capital (m shrs) 536
Mkt. Cap (RMm/US$m) 4,725 / 1,061
Major Shareholders (%)
Kumpulan Wang Persaraan Diperbadankan (%) 19.8
Capital Market Development Fund (%) 18.7
EPF (%) 7.2
Free Float (%) 54.3
3m Avg. Daily Val (US$m) 1.7
ICB IndustryICB IndustryICB IndustryICB Industry : Financials / General Financial
DBS Group Research . Equity
20 Feb 2017
Malaysia Company Guide
Bursa Malaysia Version 7 | Bloomberg: BURSA MK | Reuters: BMYS.KL Refer to important disclosures at the end of this report
88
108
128
148
168
188
208
5.9
6.4
6.9
7.4
7.9
8.4
8.9
9.4
9.9
Feb-13 Feb-14 Feb-15 Feb-16 Feb-17
Relative IndexRM
Bursa Malaysia (LHS) Relative KLCI (RHS)
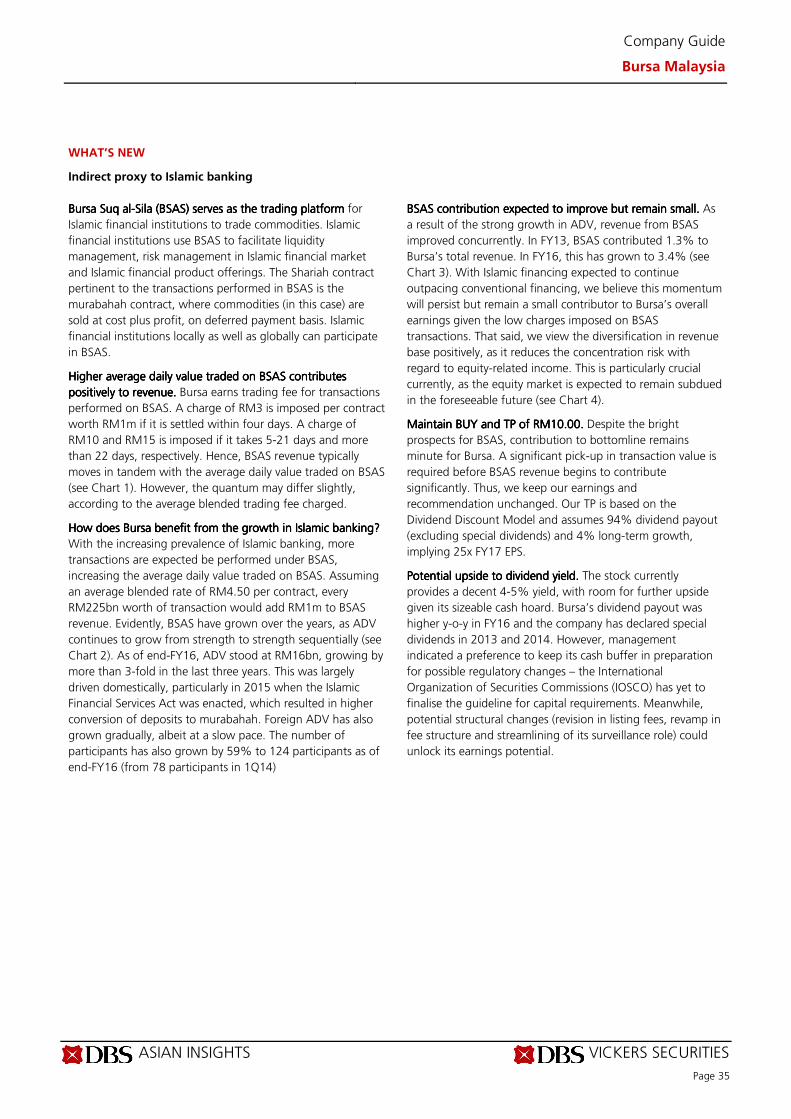
ASIAN INSIGHTS VICKERS SECURITIES
Page 35
Company Guide
Bursa Malaysia
WHAT’S NEW
Indirect proxy to Islamic banking
Bursa Suq alBursa Suq alBursa Suq alBursa Suq al----Sila (BSAS) serves as the trading platformSila (BSAS) serves as the trading platformSila (BSAS) serves as the trading platformSila (BSAS) serves as the trading platform for
Islamic financial institutions to trade commodities. Islamic
financial institutions use BSAS to facilitate liquidity
management, risk management in Islamic financial market
and Islamic financial product offerings. The Shariah contract
pertinent to the transactions performed in BSAS is the
murabahah contract, where commodities (in this case) are
sold at cost plus profit, on deferred payment basis. Islamic
financial institutions locally as well as globally can participate
in BSAS.
Higher average daily value traded on BSAS contributes Higher average daily value traded on BSAS contributes Higher average daily value traded on BSAS contributes Higher average daily value traded on BSAS contributes
positively to revenue.positively to revenue.positively to revenue.positively to revenue. Bursa earns trading fee for transactions
performed on BSAS. A charge of RM3 is imposed per contract
worth RM1m if it is settled within four days. A charge of
RM10 and RM15 is imposed if it takes 5-21 days and more
than 22 days, respectively. Hence, BSAS revenue typically
moves in tandem with the average daily value traded on BSAS
(see Chart 1). However, the quantum may differ slightly,
according to the average blended trading fee charged.
How does Bursa benefit from the growth in Islamic banking?How does Bursa benefit from the growth in Islamic banking?How does Bursa benefit from the growth in Islamic banking?How does Bursa benefit from the growth in Islamic banking?
With the increasing prevalence of Islamic banking, more
transactions are expected be performed under BSAS,
increasing the average daily value traded on BSAS. Assuming
an average blended rate of RM4.50 per contract, every
RM225bn worth of transaction would add RM1m to BSAS
revenue. Evidently, BSAS have grown over the years, as ADV
continues to grow from strength to strength sequentially (see
Chart 2). As of end-FY16, ADV stood at RM16bn, growing by
more than 3-fold in the last three years. This was largely
driven domestically, particularly in 2015 when the Islamic
Financial Services Act was enacted, which resulted in higher
conversion of deposits to murabahah. Foreign ADV has also
grown gradually, albeit at a slow pace. The number of
participants has also grown by 59% to 124 participants as of
end-FY16 (from 78 participants in 1Q14)
BSAS conBSAS conBSAS conBSAS contribution expected to improve but remain small.tribution expected to improve but remain small.tribution expected to improve but remain small.tribution expected to improve but remain small. As
a result of the strong growth in ADV, revenue from BSAS
improved concurrently. In FY13, BSAS contributed 1.3% to
Bursa’s total revenue. In FY16, this has grown to 3.4% (see
Chart 3). With Islamic financing expected to continue
outpacing conventional financing, we believe this momentum
will persist but remain a small contributor to Bursa’s overall
earnings given the low charges imposed on BSAS
transactions. That said, we view the diversification in revenue
base positively, as it reduces the concentration risk with
regard to equity-related income. This is particularly crucial
currently, as the equity market is expected to remain subdued
in the foreseeable future (see Chart 4).
Maintain BUY and TP of RM10.00. Maintain BUY and TP of RM10.00. Maintain BUY and TP of RM10.00. Maintain BUY and TP of RM10.00. Despite the bright
prospects for BSAS, contribution to bottomline remains
minute for Bursa. A significant pick-up in transaction value is
required before BSAS revenue begins to contribute
significantly. Thus, we keep our earnings and
recommendation unchanged. Our TP is based on the
Dividend Discount Model and assumes 94% dividend payout
(excluding special dividends) and 4% long-term growth,
implying 25x FY17 EPS.
Potential upside to dividend yield.Potential upside to dividend yield.Potential upside to dividend yield.Potential upside to dividend yield. The stock currently
provides a decent 4-5% yield, with room for further upside
given its sizeable cash hoard. Bursa’s dividend payout was
higher y-o-y in FY16 and the company has declared special
dividends in 2013 and 2014. However, management
indicated a preference to keep its cash buffer in preparation
for possible regulatory changes – the International
Organization of Securities Commissions (IOSCO) has yet to
finalise the guideline for capital requirements. Meanwhile,
potential structural changes (revision in listing fees, revamp in
fee structure and streamlining of its surveillance role) could
unlock its earnings potential.
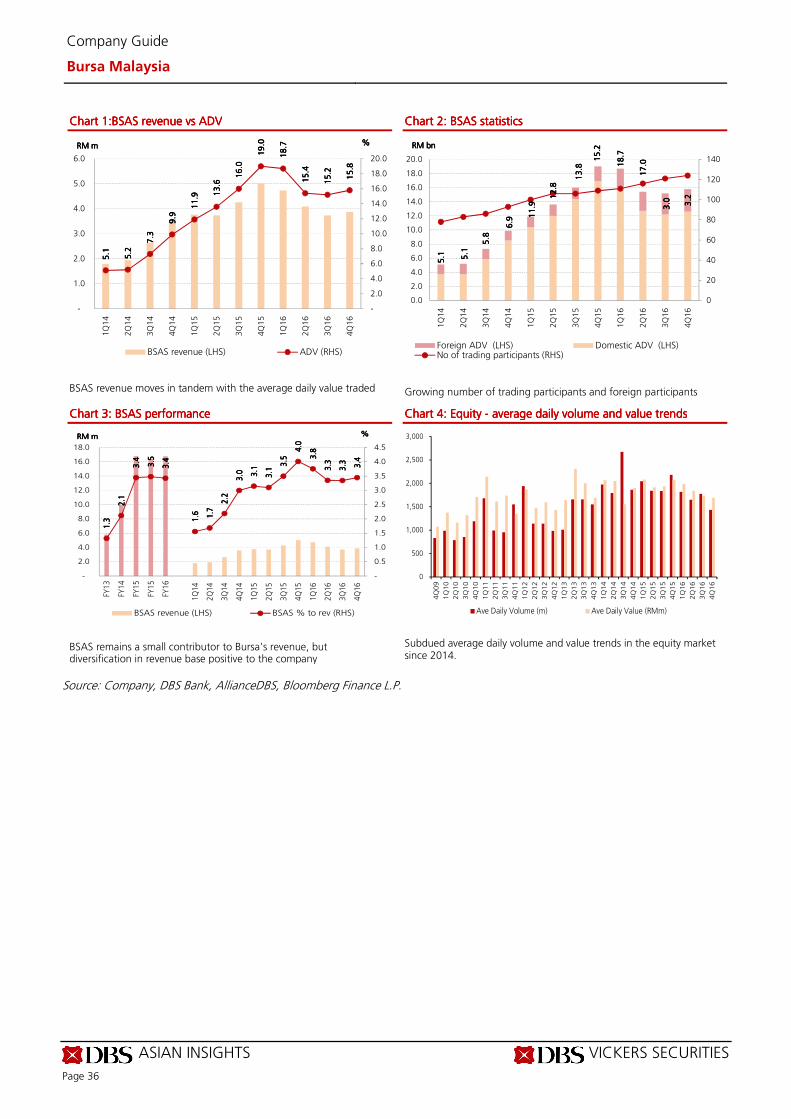
ASIAN INSIGHTS VICKERS SECURITIES
Page 36
Company Guide
Bursa Malaysia
Chart 1:BSAS revenue vs ADVChart 1:BSAS revenue vs ADVChart 1:BSAS revenue vs ADVChart 1:BSAS revenue vs ADV
BSAS revenue moves in tandem with the average daily value traded
Chart 2: BSAS statistics Chart 2: BSAS statistics Chart 2: BSAS statistics Chart 2: BSAS statistics
Growing number of trading participants and foreign participants
Chart 3: BSAS performanceChart 3: BSAS performanceChart 3: BSAS performanceChart 3: BSAS performance
BSAS remains a small contributor to Bursa’s revenue, but diversification in revenue base positive to the company
Chart 4: Equity Chart 4: Equity Chart 4: Equity Chart 4: Equity ---- average daily volume and value trendsaverage daily volume and value trendsaverage daily volume and value trendsaverage daily volume and value trends
Subdued average daily volume and value trends in the equity market since 2014.
Source: Company, DBS Bank, AllianceDBS, Bloomberg Finance L.P.
5.1
5
.1
5.1
5
.1
5.2
5.2
5.2
5.2
7.3
7
.3
7.3
7
.3
9.9
9.9
9.9
9.9
11
.9
11
.9
11
.9
11
.9 13.6
1
3.6
1
3.6
1
3.6
16
.0
16
.0
16
.0
16
.0
19
.0
19
.0
19
.0
19
.0
18
.7
18
.7
18
.7
18
.7
15
.4
15
.4
15
.4
15
.4
15
.2
15
.2
15
.2
15
.2
15
.8
15
.8
15
.8
15
.8
-
2.0
4.0
6.0
8.0
10.0
12.0
14.0
16.0
18.0
20.0
-
1.0
2.0
3.0
4.0
5.0
6.0
1Q
14
2Q
14
3Q
14
4Q
14
1Q
15
2Q
15
3Q
15
4Q
15
1Q
16
2Q
16
3Q
16
4Q
16
%%%%RM mRM mRM mRM m
BSAS revenue (LHS) ADV (RHS)
5.1
5
.1
5.1
5
.1
5.1
5
.1
5.1
5
.1 5
.8
5.8
5
.8
5.8
6.9
6
.9
6.9
6
.9 11
.9
11
.9
11
.9
11
.9 1
2.8
1
2.8
1
2.8
1
2.8
13.8
1
3.8
1
3.8
1
3.8
15
.2
15
.2
15
.2
15
.2
18
.7
18
.7
18
.7
18
.7
17
.0
17
.0
17
.0
17
.0
3.0
3.0
3.0
3.0 3.2
3.2
3.2
3.2
0
20
40
60
80
100
120
140
0.0
2.0
4.0
6.0
8.0
10.0
12.0
14.0
16.0
18.0
20.0
1Q
14
2Q
14
3Q
14
4Q
14
1Q
15
2Q
15
3Q
15
4Q
15
1Q
16
2Q
16
3Q
16
4Q
16
RM bnRM bnRM bnRM bn
Foreign ADV (LHS) Domestic ADV (LHS)No of trading participants (RHS)
1.3
1
.3
1.3
1
.3
2.1
2
.1
2.1
2
.1
3.4
3
.4
3.4
3
.4
3.5
3
.5
3.5
3
.5
3.4
3
.4
3.4
3
.4
1.6
1
.6
1.6
1
.6
1.7
1
.7
1.7
1
.7 2
.2
2.2
2
.2
2.2
3.0
3
.0
3.0
3
.0
3.1
3
.1
3.1
3
.1
3.1
3
.1
3.1
3
.1 3
.5
3.5
3
.5
3.5
4.0
4
.0
4.0
4
.0
3.8
3
.8
3.8
3
.8
3.3
3
.3
3.3
3
.3
3.3
3
.3
3.3
3
.3
3.4
3
.4
3.4
3
.4
-
0.5
1.0
1.5
2.0
2.5
3.0
3.5
4.0
4.5
-
2.0
4.0
6.0
8.0
10.0
12.0
14.0
16.0
18.0
FY1
3
FY1
4
FY1
5
FY1
5
FY1
6
1Q
14
2Q
14
3Q
14
4Q
14
1Q
15
2Q
15
3Q
15
4Q
15
1Q
16
2Q
16
3Q
16
4Q
16
%%%%RM mRM mRM mRM m
BSAS revenue (LHS) BSAS % to rev (RHS)
0
500
1,000
1,500
2,000
2,500
3,0004Q
09
1Q
10
2Q
10
3Q
10
4Q
10
1Q
11
2Q
11
3Q
11
4Q
11
1Q
12
2Q
12
3Q
12
4Q
12
1Q
13
2Q
13
3Q
13
4Q
13
1Q
14
2Q
14
3Q
14
4Q
14
1Q
15
2Q
15
3Q
15
4Q
15
1Q
16
2Q
16
3Q
16
4Q
16
Ave Daily Volume (m) Ave Daily Value (RMm)
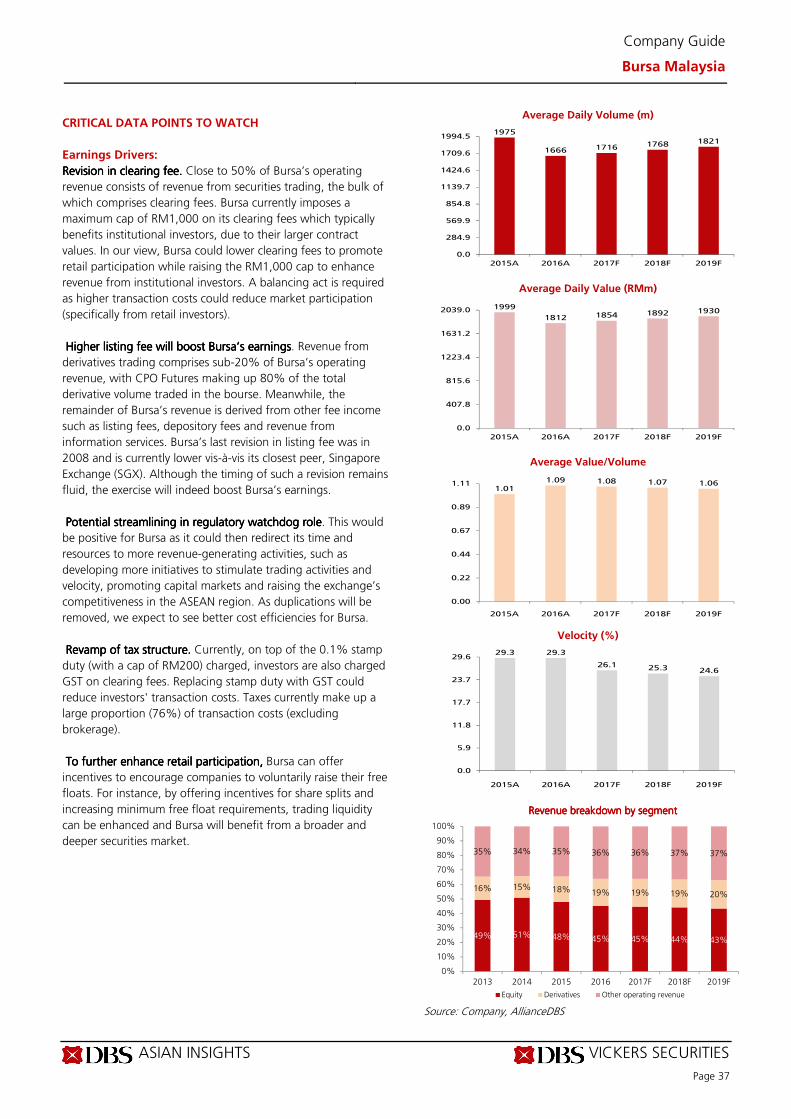
ASIAN INSIGHTS VICKERS SECURITIES
Page 37
Company Guide
Bursa Malaysia
CRITICAL DATA POINTS TO WATCH
Earnings Drivers:
Revision in clearing fee.Revision in clearing fee.Revision in clearing fee.Revision in clearing fee. Close to 50% of Bursa’s operating
revenue consists of revenue from securities trading, the bulk of
which comprises clearing fees. Bursa currently imposes a
maximum cap of RM1,000 on its clearing fees which typically
benefits institutional investors, due to their larger contract
values. In our view, Bursa could lower clearing fees to promote
retail participation while raising the RM1,000 cap to enhance
revenue from institutional investors. A balancing act is required
as higher transaction costs could reduce market participation
(specifically from retail investors).
Higher listing fee will boost Bursa’s earningsHigher listing fee will boost Bursa’s earningsHigher listing fee will boost Bursa’s earningsHigher listing fee will boost Bursa’s earnings. Revenue from
derivatives trading comprises sub-20% of Bursa’s operating
revenue, with CPO Futures making up 80% of the total
derivative volume traded in the bourse. Meanwhile, the
remainder of Bursa’s revenue is derived from other fee income
such as listing fees, depository fees and revenue from
information services. Bursa’s last revision in listing fee was in
2008 and is currently lower vis-à-vis its closest peer, Singapore
Exchange (SGX). Although the timing of such a revision remains
fluid, the exercise will indeed boost Bursa’s earnings.
Potential streamlining in regulatory watchdog rolePotential streamlining in regulatory watchdog rolePotential streamlining in regulatory watchdog rolePotential streamlining in regulatory watchdog role. This would
be positive for Bursa as it could then redirect its time and
resources to more revenue-generating activities, such as
developing more initiatives to stimulate trading activities and
velocity, promoting capital markets and raising the exchange’s
competitiveness in the ASEAN region. As duplications will be
removed, we expect to see better cost efficiencies for Bursa.
Revamp of tax structure.Revamp of tax structure.Revamp of tax structure.Revamp of tax structure. Currently, on top of the 0.1% stamp
duty (with a cap of RM200) charged, investors are also charged
GST on clearing fees. Replacing stamp duty with GST could
reduce investors' transaction costs. Taxes currently make up a
large proportion (76%) of transaction costs (excluding
brokerage).
To further enhance retail participation,To further enhance retail participation,To further enhance retail participation,To further enhance retail participation, Bursa can offer
incentives to encourage companies to voluntarily raise their free
floats. For instance, by offering incentives for share splits and
increasing minimum free float requirements, trading liquidity
can be enhanced and Bursa will benefit from a broader and
deeper securities market.
Average Daily Volume (m)
Average Daily Value (RMm)
Average Value/Volume
Velocity (%)
Revenue breakdown by segmentRevenue breakdown by segmentRevenue breakdown by segmentRevenue breakdown by segment
Source: Company, AllianceDBS
1975
1666 1716 1768 1821
0.0
284.9
569.9
854.8
1139.7
1424.6
1709.6
1994.5
2015A 2016A 2017F 2018F 2019F
1999
1812 1854 1892 1930
0.0
407.8
815.6
1223.4
1631.2
2039.0
2015A 2016A 2017F 2018F 2019F
1.011.09 1.08 1.07 1.06
0.00
0.22
0.44
0.67
0.89
1.11
2015A 2016A 2017F 2018F 2019F
29.3 29.3
26.1 25.3 24.6
0.0
5.9
11.8
17.7
23.7
29.6
2015A 2016A 2017F 2018F 2019F
49% 51% 48% 45% 45% 44% 43%
16% 15% 18% 19% 19% 19% 20%
35% 34% 35% 36% 36% 37% 37%
0%
10%
20%
30%
40%
50%
60%
70%
80%
90%
100%
2013 2014 2015 2016 2017F 2018F 2019F
Equity Derivatives Other operating revenue
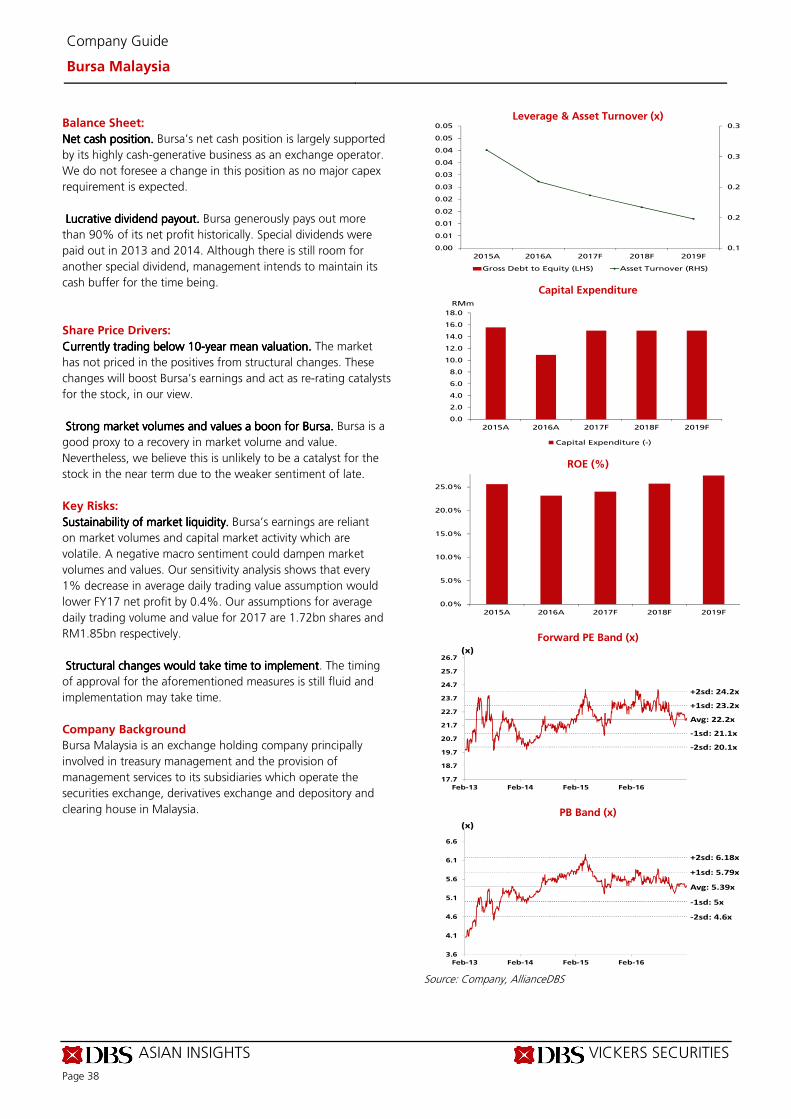
ASIAN INSIGHTS VICKERS SECURITIES
Page 38
Company Guide
Bursa Malaysia
Balance Sheet:
Net cash position. Net cash position. Net cash position. Net cash position. Bursa’s net cash position is largely supported
by its highly cash-generative business as an exchange operator.
We do not foresee a change in this position as no major capex
requirement is expected.
Lucrative dividend Lucrative dividend Lucrative dividend Lucrative dividend payout. payout. payout. payout. Bursa generously pays out more
than 90% of its net profit historically. Special dividends were
paid out in 2013 and 2014. Although there is still room for
another special dividend, management intends to maintain its
cash buffer for the time being.
Share Price Drivers:
Currently trading below 10Currently trading below 10Currently trading below 10Currently trading below 10----year mean valuation.year mean valuation.year mean valuation.year mean valuation. The market
has not priced in the positives from structural changes. These
changes will boost Bursa’s earnings and act as re-rating catalysts
for the stock, in our view.
Strong market volumes and values a boon for Bursa.Strong market volumes and values a boon for Bursa.Strong market volumes and values a boon for Bursa.Strong market volumes and values a boon for Bursa. Bursa is a
good proxy to a recovery in market volume and value.
Nevertheless, we believe this is unlikely to be a catalyst for the
stock in the near term due to the weaker sentiment of late.
Key Risks:
Sustainability of market liquidity.Sustainability of market liquidity.Sustainability of market liquidity.Sustainability of market liquidity. Bursa’s earnings are reliant
on market volumes and capital market activity which are
volatile. A negative macro sentiment could dampen market
volumes and values. Our sensitivity analysis shows that every
1% decrease in average daily trading value assumption would
lower FY17 net profit by 0.4%. Our assumptions for average
daily trading volume and value for 2017 are 1.72bn shares and
RM1.85bn respectively.
Structural changes would take time to implementStructural changes would take time to implementStructural changes would take time to implementStructural changes would take time to implement. The timing
of approval for the aforementioned measures is still fluid and
implementation may take time.
Company Background
Bursa Malaysia is an exchange holding company principally
involved in treasury management and the provision of
management services to its subsidiaries which operate the
securities exchange, derivatives exchange and depository and
clearing house in Malaysia.
Leverage & Asset Turnover (x)
Capital Expenditure
ROE (%)
Forward PE Band (x)
PB Band (x)
Source: Company, AllianceDBS
0.1
0.2
0.2
0.3
0.3
0.00
0.01
0.01
0.02
0.02
0.03
0.03
0.04
0.04
0.05
0.05
2015A 2016A 2017F 2018F 2019F
Gross Debt to Equity (LHS) Asset Turnover (RHS)
0.0
2.0
4.0
6.0
8.0
10.0
12.0
14.0
16.0
18.0
2015A 2016A 2017F 2018F 2019F
Capital Expenditure (-)
RMm
0.0%
5.0%
10.0%
15.0%
20.0%
25.0%
2015A 2016A 2017F 2018F 2019F
Avg: 22.2x
+1sd: 23.2x
+2sd: 24.2x
-1sd: 21.1x
-2sd: 20.1x
17.7
18.7
19.7
20.7
21.7
22.7
23.7
24.7
25.7
26.7
Feb-13 Feb-14 Feb-15 Feb-16
(x)
Avg: 5.39x
+1sd: 5.79x
+2sd: 6.18x
-1sd: 5x
-2sd: 4.6x
3.6
4.1
4.6
5.1
5.6
6.1
6.6
Feb-13 Feb-14 Feb-15 Feb-16
(x)
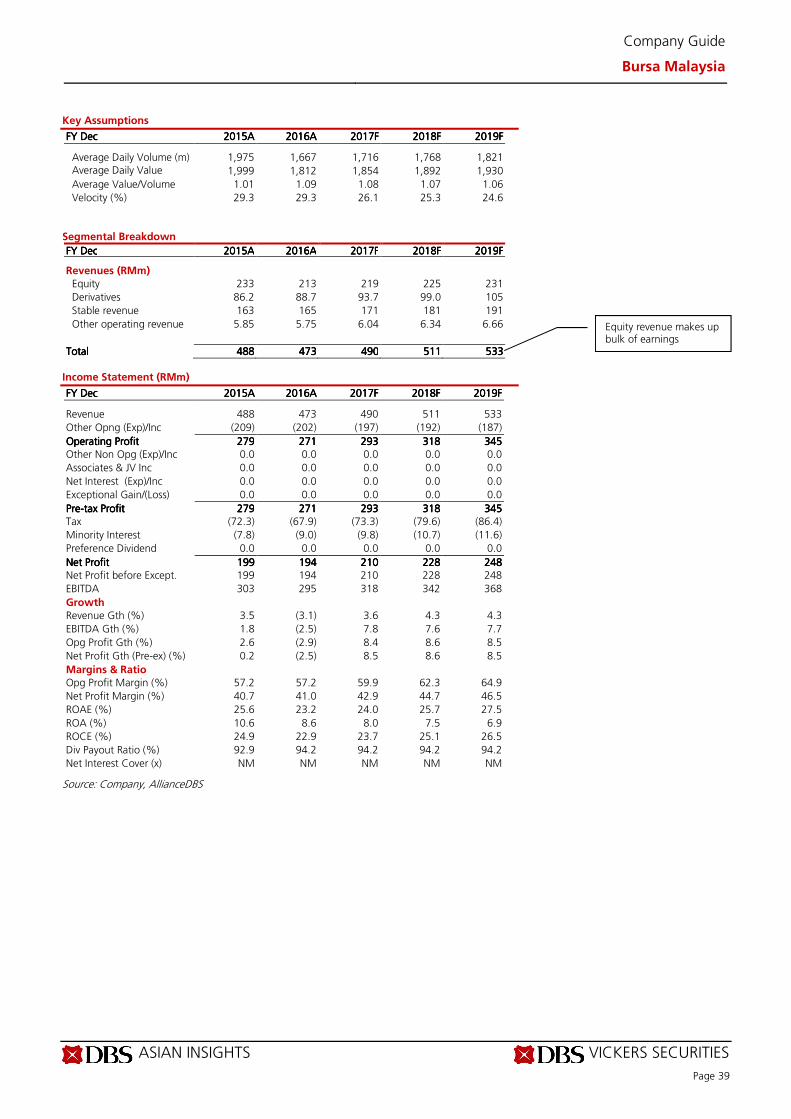
ASIAN INSIGHTS VICKERS SECURITIES
Page 39
Company Guide
Bursa Malaysia
Key Assumptions
FY FY FY FY DecDecDecDec 2015201520152015AAAA 2016201620162016AAAA 2017201720172017FFFF 2018201820182018FFFF 2019201920192019FFFF
Average Daily Volume (m) 1,975 1,667 1,716 1,768 1,821 Average Daily Value (RMm)
1,999 1,812 1,854 1,892 1,930
Average Value/Volume 1.01 1.09 1.08 1.07 1.06
Velocity (%) 29.3 29.3 26.1 25.3 24.6
Segmental Breakdown
FY FY FY FY DecDecDecDec 2015201520152015AAAA 2016201620162016AAAA 2017201720172017FFFF 2018201820182018FFFF 2019201920192019FFFF Revenues (RMm)
Equity 233 213 219 225 231
Derivatives 86.2 88.7 93.7 99.0 105
Stable revenue 163 165 171 181 191
Other operating revenue 5.85 5.75 6.04 6.34 6.66
TotalTotalTotalTotal 488488488488 473473473473 490490490490 511511511511 533533533533
Income Statement (RMm)
FY FY FY FY DecDecDecDec 2015201520152015AAAA 2016201620162016AAAA 2017201720172017FFFF 2018201820182018FFFF 2019201920192019FFFF Revenue 488 473 490 511 533
Other Opng (Exp)/Inc (209) (202) (197) (192) (187)
Operating ProfitOperating ProfitOperating ProfitOperating Profit 279279279279 271271271271 293293293293 318318318318 345345345345 Other Non Opg (Exp)/Inc 0.0 0.0 0.0 0.0 0.0
Associates & JV Inc 0.0 0.0 0.0 0.0 0.0
Net Interest (Exp)/Inc 0.0 0.0 0.0 0.0 0.0
Exceptional Gain/(Loss) 0.0 0.0 0.0 0.0 0.0
PrePrePrePre----tax Profittax Profittax Profittax Profit 279279279279 271271271271 293293293293 318318318318 345345345345 Tax (72.3) (67.9) (73.3) (79.6) (86.4)
Minority Interest (7.8) (9.0) (9.8) (10.7) (11.6)
Preference Dividend 0.0 0.0 0.0 0.0 0.0
Net ProfitNet ProfitNet ProfitNet Profit 199199199199 194194194194 210210210210 228228228228 248248248248 Net Profit before Except. 199 194 210 228 248
EBITDA 303 295 318 342 368
Growth
Revenue Gth (%) 3.5 (3.1) 3.6 4.3 4.3
EBITDA Gth (%) 1.8 (2.5) 7.8 7.6 7.7
Opg Profit Gth (%) 2.6 (2.9) 8.4 8.6 8.5
Net Profit Gth (Pre-ex) (%) 0.2 (2.5) 8.5 8.6 8.5
Margins & Ratio
Opg Profit Margin (%) 57.2 57.2 59.9 62.3 64.9
Net Profit Margin (%) 40.7 41.0 42.9 44.7 46.5
ROAE (%) 25.6 23.2 24.0 25.7 27.5
ROA (%) 10.6 8.6 8.0 7.5 6.9
ROCE (%) 24.9 22.9 23.7 25.1 26.5
Div Payout Ratio (%) 92.9 94.2 94.2 94.2 94.2
Net Interest Cover (x) NM NM NM NM NM
Source: Company, AllianceDBS
Equity revenue makes up bulk of earnings
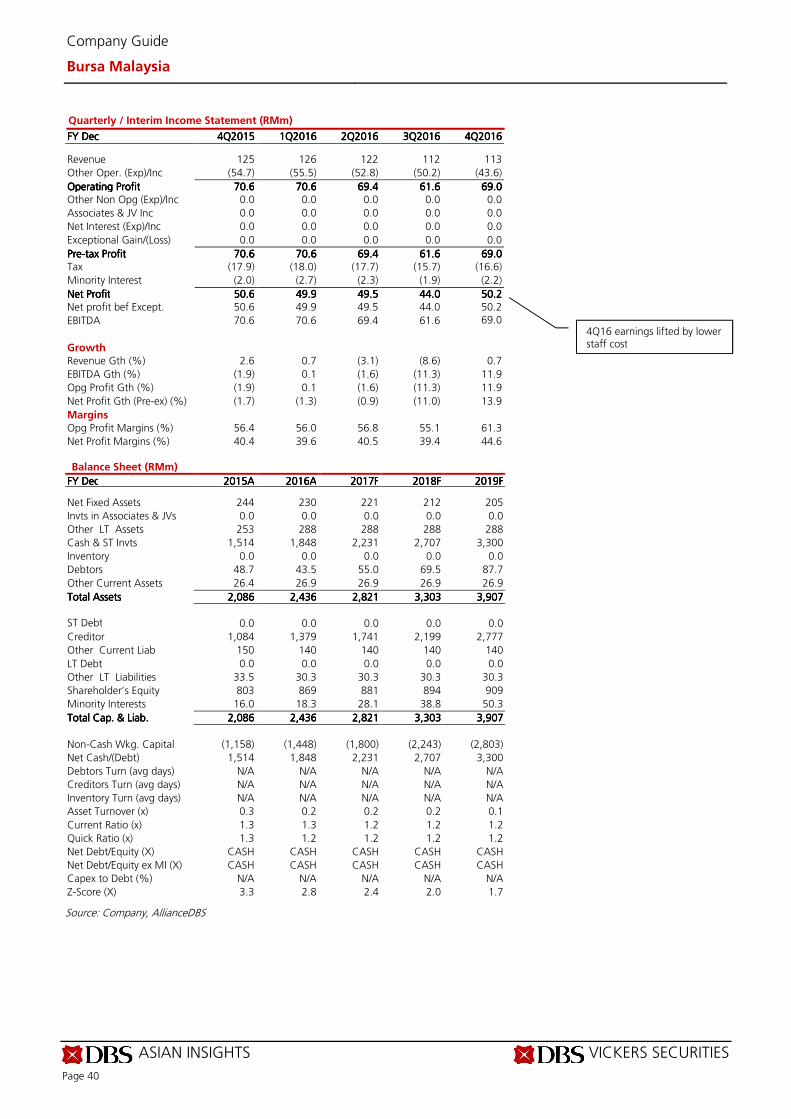
ASIAN INSIGHTS VICKERS SECURITIES
Page 40
Company Guide
Bursa Malaysia
Quarterly / Interim Income Statement (RMm)
FY FY FY FY DecDecDecDec 4Q4Q4Q4Q2015201520152015 1Q1Q1Q1Q2016201620162016 2Q2Q2Q2Q2016201620162016 3Q3Q3Q3Q2016201620162016 4Q4Q4Q4Q2016201620162016 Revenue 125 126 122 112 113
Other Oper. (Exp)/Inc (54.7) (55.5) (52.8) (50.2) (43.6)
OpeOpeOpeOperating Profitrating Profitrating Profitrating Profit 70.670.670.670.6 70.670.670.670.6 69.469.469.469.4 61.661.661.661.6 69.069.069.069.0 Other Non Opg (Exp)/Inc 0.0 0.0 0.0 0.0 0.0
Associates & JV Inc 0.0 0.0 0.0 0.0 0.0
Net Interest (Exp)/Inc 0.0 0.0 0.0 0.0 0.0
Exceptional Gain/(Loss) 0.0 0.0 0.0 0.0 0.0
PrePrePrePre----tax Profittax Profittax Profittax Profit 70.670.670.670.6 70.670.670.670.6 69.469.469.469.4 61.661.661.661.6 69.069.069.069.0 Tax (17.9) (18.0) (17.7) (15.7) (16.6)
Minority Interest (2.0) (2.7) (2.3) (1.9) (2.2)
Net ProfitNet ProfitNet ProfitNet Profit 50.650.650.650.6 49.949.949.949.9 49.549.549.549.5 44.044.044.044.0 50.250.250.250.2 Net profit bef Except. 50.6 49.9 49.5 44.0 50.2
EBITDA 70.6 70.6 69.4 61.6 69.0
Growth
Revenue Gth (%) 2.6 0.7 (3.1) (8.6) 0.7
EBITDA Gth (%) (1.9) 0.1 (1.6) (11.3) 11.9
Opg Profit Gth (%) (1.9) 0.1 (1.6) (11.3) 11.9
Net Profit Gth (Pre-ex) (%) (1.7) (1.3) (0.9) (11.0) 13.9
Margins
Opg Profit Margins (%) 56.4 56.0 56.8 55.1 61.3
Net Profit Margins (%) 40.4 39.6 40.5 39.4 44.6
Balance Sheet (RMm)
FY FY FY FY DecDecDecDec 2015201520152015AAAA 2016201620162016AAAA 2017201720172017FFFF 2018201820182018FFFF 2019201920192019FFFF Net Fixed Assets 244 230 221 212 205
Invts in Associates & JVs 0.0 0.0 0.0 0.0 0.0
Other LT Assets 253 288 288 288 288
Cash & ST Invts 1,514 1,848 2,231 2,707 3,300
Inventory 0.0 0.0 0.0 0.0 0.0
Debtors 48.7 43.5 55.0 69.5 87.7
Other Current Assets 26.4 26.9 26.9 26.9 26.9
Total AssetsTotal AssetsTotal AssetsTotal Assets 2,0862,0862,0862,086 2,4362,4362,4362,436 2,822,822,822,821111 3,3033,3033,3033,303 3,9073,9073,9073,907
ST Debt
0.0 0.0 0.0 0.0 0.0
Creditor 1,084 1,379 1,741 2,199 2,777
Other Current Liab 150 140 140 140 140
LT Debt 0.0 0.0 0.0 0.0 0.0
Other LT Liabilities 33.5 30.3 30.3 30.3 30.3
Shareholder’s Equity 803 869 881 894 909
Minority Interests 16.0 18.3 28.1 38.8 50.3
Total Cap. & Liab.Total Cap. & Liab.Total Cap. & Liab.Total Cap. & Liab. 2,0862,0862,0862,086 2,4362,4362,4362,436 2,8212,8212,8212,821 3,3033,3033,3033,303 3,9073,9073,9073,907
Non-Cash Wkg. Capital (1,158) (1,448) (1,800) (2,243) (2,803)
Net Cash/(Debt) 1,514 1,848 2,231 2,707 3,300
Debtors Turn (avg days) N/A N/A N/A N/A N/A
Creditors Turn (avg days) N/A N/A N/A N/A N/A
Inventory Turn (avg days) N/A N/A N/A N/A N/A
Asset Turnover (x) 0.3 0.2 0.2 0.2 0.1
Current Ratio (x) 1.3 1.3 1.2 1.2 1.2
Quick Ratio (x) 1.3 1.2 1.2 1.2 1.2
Net Debt/Equity (X) CASH CASH CASH CASH CASH
Net Debt/Equity ex MI (X) CASH CASH CASH CASH CASH
Capex to Debt (%) N/A N/A N/A N/A N/A
Z-Score (X) 3.3 2.8 2.4 2.0 1.7
Source: Company, AllianceDBS
4Q16 earnings lifted by lower staff cost
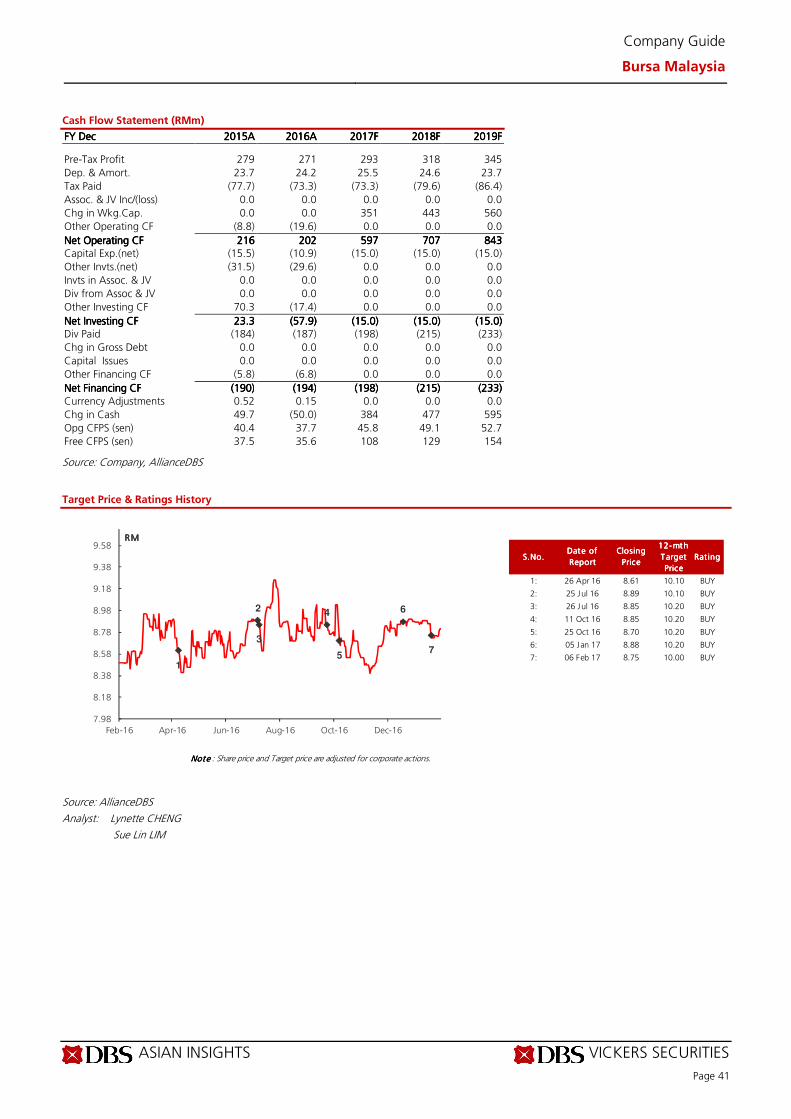
ASIAN INSIGHTS VICKERS SECURITIES
Page 41
Company Guide
Bursa Malaysia
Cash Flow Statement (RMm)
FY FY FY FY DecDecDecDec 2015201520152015AAAA 2016201620162016AAAA 2017201720172017FFFF 2222018018018018FFFF 2019201920192019FFFF Pre-Tax Profit 279 271 293 318 345
Dep. & Amort. 23.7 24.2 25.5 24.6 23.7
Tax Paid (77.7) (73.3) (73.3) (79.6) (86.4)
Assoc. & JV Inc/(loss) 0.0 0.0 0.0 0.0 0.0
Chg in Wkg.Cap. 0.0 0.0 351 443 560
Other Operating CF (8.8) (19.6) 0.0 0.0 0.0
Net Operating CFNet Operating CFNet Operating CFNet Operating CF 216216216216 202202202202 597597597597 707707707707 843843843843 Capital Exp.(net) (15.5) (10.9) (15.0) (15.0) (15.0)
Other Invts.(net) (31.5) (29.6) 0.0 0.0 0.0
Invts in Assoc. & JV 0.0 0.0 0.0 0.0 0.0
Div from Assoc & JV 0.0 0.0 0.0 0.0 0.0
Other Investing CF 70.3 (17.4) 0.0 0.0 0.0
Net Investing CFNet Investing CFNet Investing CFNet Investing CF 23.323.323.323.3 (57.9)(57.9)(57.9)(57.9) (15.0)(15.0)(15.0)(15.0) (15.0)(15.0)(15.0)(15.0) (15.0)(15.0)(15.0)(15.0) Div Paid (184) (187) (198) (215) (233)
Chg in Gross Debt 0.0 0.0 0.0 0.0 0.0
Capital Issues 0.0 0.0 0.0 0.0 0.0
Other Financing CF (5.8) (6.8) 0.0 0.0 0.0
Net Financing CFNet Financing CFNet Financing CFNet Financing CF (190)(190)(190)(190) (194)(194)(194)(194) (19(19(19(198)8)8)8) (215)(215)(215)(215) (233)(233)(233)(233)
Currency Adjustments 0.52 0.15 0.0 0.0 0.0
Chg in Cash 49.7 (50.0) 384 477 595
Opg CFPS (sen) 40.4 37.7 45.8 49.1 52.7
Free CFPS (sen) 37.5 35.6 108 129 154
Source: Company, AllianceDBS
Target Price & Ratings History
Source: AllianceDBS
Analyst: Lynette CHENG
Sue Lin LIM
S.No.S.No.S.No.S.No.Date of Date of Date of Date of
ReportReportReportReport
Closing Closing Closing Closing
PricePricePricePrice
12-mth 12-mth 12-mth 12-mth
Target Target Target Target
PricePricePricePrice
Rat ing Rat ing Rat ing Rat ing
1: 26 Apr 16 8.61 10.10 BUY
2: 25 Jul 16 8.89 10.10 BUY
3: 26 Jul 16 8.85 10.20 BUY
4: 11 Oct 16 8.85 10.20 BUY
5: 25 Oct 16 8.70 10.20 BUY
6: 05 Jan 17 8.88 10.20 BUY
7: 06 Feb 17 8.75 10.00 BUY
Note Note Note Note : Share price and Target price are adjusted for corporate actions.
1
2
3
4
5
6
7
7.98
8.18
8.38
8.58
8.78
8.98
9.18
9.38
9.58
Feb-16 Apr-16 Jun-16 Aug-16 Oct-16 Dec-16
RMRMRMRM
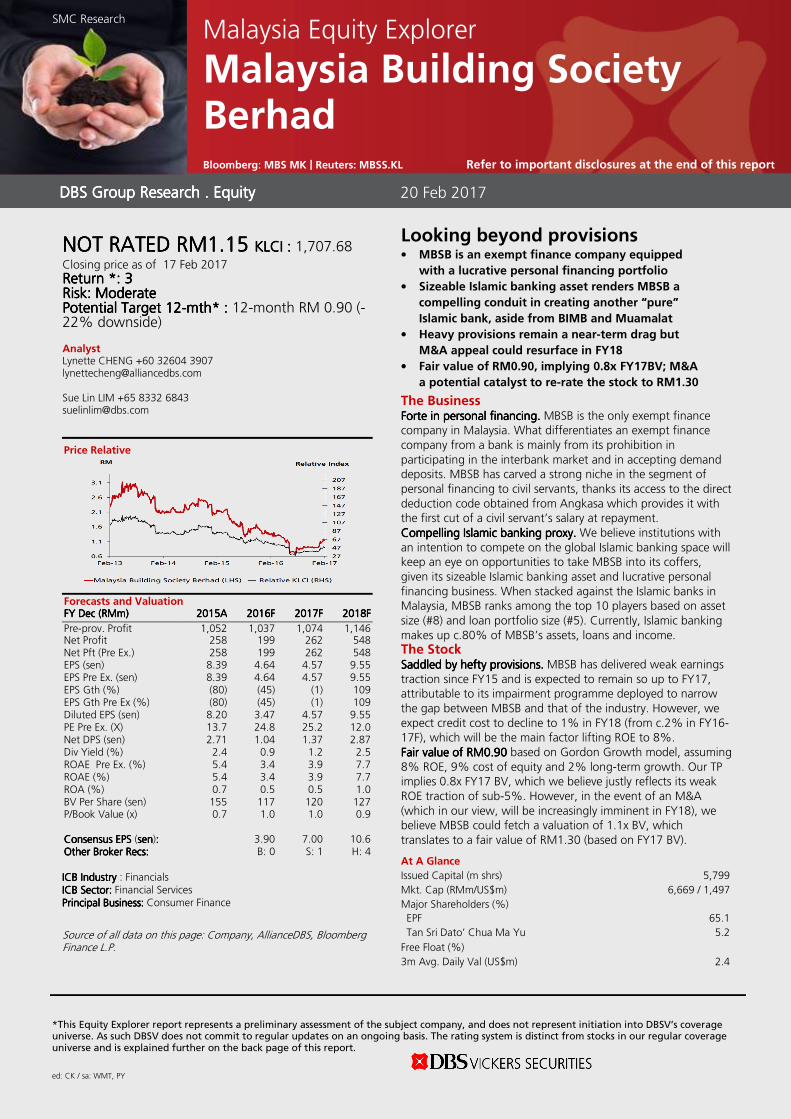
*This Equity Explorer report represents a preliminary assessment of the subject company, and does not represent initiation into DBSV’s coverage universe. As such DBSV does not commit to regular updates on an ongoing basis. The rating system is distinct from stocks in our regular coverage universe and is explained further on the back page of this report.
ed: CK / sa: WMT, PY
NOT RATEDNOT RATEDNOT RATEDNOT RATED RMRMRMRM1.151.151.151.15 KLCIKLCIKLCIKLCI : : : : 1,707.68 Closing price as of 17 Feb 2017 Return *: 3Return *: 3Return *: 3Return *: 3 Risk: ModerateRisk: ModerateRisk: ModerateRisk: Moderate Potential Target Potential Target Potential Target Potential Target 12121212----mthmthmthmth* :* :* :* : 12-month RM 0.90 (-22% downside) Analyst Lynette CHENG +60 32604 3907 [email protected] Sue Lin LIM +65 8332 6843 [email protected]
Price Relative
Forecasts and Valuation FY FY FY FY DecDecDecDec ((((RMRMRMRMmmmm) ) ) ) 2015201520152015AAAA 2016201620162016FFFF 2017201720172017FFFF 2018201820182018FFFF
Pre-prov. Profit 1,052 1,037 1,074 1,146 Net Profit 258 199 262 548 Net Pft (Pre Ex.) 258 199 262 548 EPS (sen) 8.39 4.64 4.57 9.55 EPS Pre Ex. (sen) 8.39 4.64 4.57 9.55 EPS Gth (%) (80) (45) (1) 109 EPS Gth Pre Ex (%) (80) (45) (1) 109 Diluted EPS (sen) 8.20 3.47 4.57 9.55 PE Pre Ex. (X) 13.7 24.8 25.2 12.0 Net DPS (sen) 2.71 1.04 1.37 2.87 Div Yield (%) 2.4 0.9 1.2 2.5 ROAE Pre Ex. (%) 5.4 3.4 3.9 7.7 ROAE (%) 5.4 3.4 3.9 7.7 ROA (%) 0.7 0.5 0.5 1.0 BV Per Share (sen) 155 117 120 127 P/Book Value (x) 0.7 1.0 1.0 0.9 Consensus EPS Consensus EPS Consensus EPS Consensus EPS (sensensensen):::: 3.90 7.00 10.6 Other Broker Recs:Other Broker Recs:Other Broker Recs:Other Broker Recs: B: 0 S: 1 H: 4 ICB IndustryICB IndustryICB IndustryICB Industry : Financials ICB Sector: ICB Sector: ICB Sector: ICB Sector: Financial Services Principal Business:Principal Business:Principal Business:Principal Business: Consumer Finance
Source of all data on this page: Company, AllianceDBS, Bloomberg Finance L.P.
Looking beyond provisions • MBSB is an exempt finance company equipped
with a lucrative personal financing portfolio
• Sizeable Islamic banking asset renders MBSB a
compelling conduit in creating another “pure”
Islamic bank, aside from BIMB and Muamalat
• Heavy provisions remain a near-term drag but
M&A appeal could resurface in FY18
• Fair value of RM0.90, implying 0.8x FY17BV; M&A
a potential catalyst to re-rate the stock to RM1.30
The Business ForteForteForteForte in personal financing.in personal financing.in personal financing.in personal financing. MBSB is the only exempt finance company in Malaysia. What differentiates an exempt finance company from a bank is mainly from its prohibition in participating in the interbank market and in accepting demand deposits. MBSB has carved a strong niche in the segment of personal financing to civil servants, thanks its access to the direct deduction code obtained from Angkasa which provides it with the first cut of a civil servant’s salary at repayment. Compelling Islamic banking proxy. Compelling Islamic banking proxy. Compelling Islamic banking proxy. Compelling Islamic banking proxy. We believe institutions with an intention to compete on the global Islamic banking space will keep an eye on opportunities to take MBSB into its coffers, given its sizeable Islamic banking asset and lucrative personal financing business. When stacked against the Islamic banks in Malaysia, MBSB ranks among the top 10 players based on asset size (#8) and loan portfolio size (#5). Currently, Islamic banking makes up c.80% of MBSB’s assets, loans and income. The Stock Saddled by hefty provisions.Saddled by hefty provisions.Saddled by hefty provisions.Saddled by hefty provisions. MBSB has delivered weak earnings traction since FY15 and is expected to remain so up to FY17, attributable to its impairment programme deployed to narrow the gap between MBSB and that of the industry. However, we expect credit cost to decline to 1% in FY18 (from c.2% in FY16-17F), which will be the main factor lifting ROE to 8%. Fair value of RM0.90Fair value of RM0.90Fair value of RM0.90Fair value of RM0.90 based on Gordon Growth model, assuming 8% ROE, 9% cost of equity and 2% long-term growth. Our TP implies 0.8x FY17 BV, which we believe justly reflects its weak ROE traction of sub-5%. However, in the event of an M&A (which in our view, will be increasingly imminent in FY18), we believe MBSB could fetch a valuation of 1.1x BV, which translates to a fair value of RM1.30 (based on FY17 BV).
At A Glance Issued Capital (m shrs) 5,799
Mkt. Cap (RMm/US$m) 6,669 / 1,497
Major Shareholders (%)
EPF 65.1
Tan Sri Dato’ Chua Ma Yu 5.2
Free Float (%)
3m Avg. Daily Val (US$m) 2.4
DBS Group Research . Equity DBS Group Research . Equity DBS Group Research . Equity DBS Group Research . Equity
20 Feb 2017
Malaysia Equity Explorer
Malaysia Building Society Berhad Bloomberg: MBS MK | Reuters: MBSS.KL Refer to important disclosures at the end of this report
SMC Research
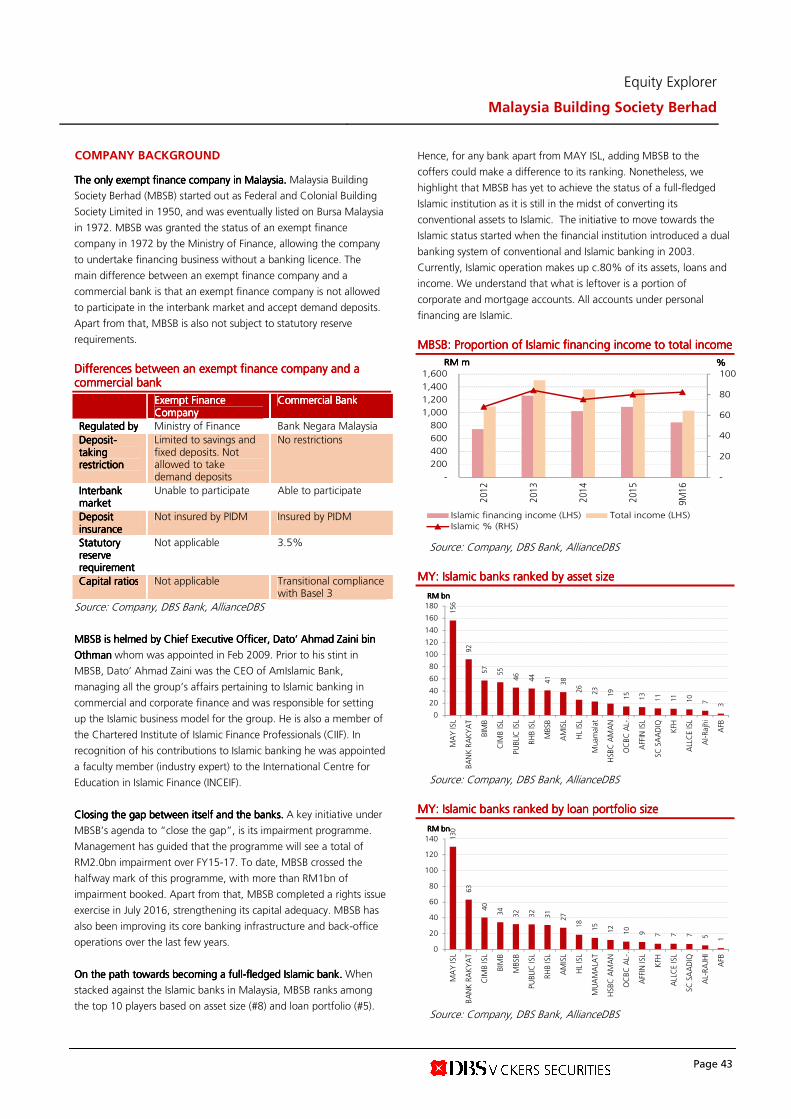
Equity Explorer
Malaysia Building Society Berhad
Page 43
COMPANY BACKGROUND
The only exempt finance company in Malaysia. The only exempt finance company in Malaysia. The only exempt finance company in Malaysia. The only exempt finance company in Malaysia. Malaysia Building
Society Berhad (MBSB) started out as Federal and Colonial Building
Society Limited in 1950, and was eventually listed on Bursa Malaysia
in 1972. MBSB was granted the status of an exempt finance
company in 1972 by the Ministry of Finance, allowing the company
to undertake financing business without a banking licence. The
main difference between an exempt finance company and a
commercial bank is that an exempt finance company is not allowed
to participate in the interbank market and accept demand deposits.
Apart from that, MBSB is also not subject to statutory reserve
requirements.
Differences between an exempt finance company and a Differences between an exempt finance company and a Differences between an exempt finance company and a Differences between an exempt finance company and a commercial bank commercial bank commercial bank commercial bank
Exempt Finance Exempt Finance Exempt Finance Exempt Finance CompanyCompanyCompanyCompany
Commercial BankCommercial BankCommercial BankCommercial Bank
Regulated byRegulated byRegulated byRegulated by Ministry of Finance Bank Negara Malaysia
DepositDepositDepositDeposit----taking taking taking taking restrictionrestrictionrestrictionrestriction
Limited to savings and fixed deposits. Not allowed to take demand deposits
No restrictions
Interbank Interbank Interbank Interbank marketmarketmarketmarket
Unable to participate Able to participate
Deposit Deposit Deposit Deposit insuranceinsuranceinsuranceinsurance
Not insured by PIDM Insured by PIDM
Statutory Statutory Statutory Statutory reserve reserve reserve reserve requirementrequirementrequirementrequirement
Not applicable 3.5%
Capital ratiosCapital ratiosCapital ratiosCapital ratios Not applicable Transitional compliance with Basel 3
Source: Company, DBS Bank, AllianceDBS
MBSB is helmed by Chief Executive Officer, Dato’ Ahmad Zaini bin MBSB is helmed by Chief Executive Officer, Dato’ Ahmad Zaini bin MBSB is helmed by Chief Executive Officer, Dato’ Ahmad Zaini bin MBSB is helmed by Chief Executive Officer, Dato’ Ahmad Zaini bin
Othman Othman Othman Othman whom was appointed in Feb 2009. Prior to his stint in
MBSB, Dato’ Ahmad Zaini was the CEO of AmIslamic Bank,
managing all the group’s affairs pertaining to Islamic banking in
commercial and corporate finance and was responsible for setting
up the Islamic business model for the group. He is also a member of
the Chartered Institute of Islamic Finance Professionals (CIIF). In
recognition of his contributions to Islamic banking he was appointed
a faculty member (industry expert) to the International Centre for
Education in Islamic Finance (INCEIF).
Closing the gap between itself and the banks.Closing the gap between itself and the banks.Closing the gap between itself and the banks.Closing the gap between itself and the banks. A key initiative under
MBSB’s agenda to “close the gap”, is its impairment programme.
Management has guided that the programme will see a total of
RM2.0bn impairment over FY15-17. To date, MBSB crossed the
halfway mark of this programme, with more than RM1bn of
impairment booked. Apart from that, MBSB completed a rights issue
exercise in July 2016, strengthening its capital adequacy. MBSB has
also been improving its core banking infrastructure and back-office
operations over the last few years.
On On On On thethethethe path towards becoming a fullpath towards becoming a fullpath towards becoming a fullpath towards becoming a full----fledged Islamic bank.fledged Islamic bank.fledged Islamic bank.fledged Islamic bank. When
stacked against the Islamic banks in Malaysia, MBSB ranks among
the top 10 players based on asset size (#8) and loan portfolio (#5).
Hence, for any bank apart from MAY ISL, adding MBSB to the
coffers could make a difference to its ranking. Nonetheless, we
highlight that MBSB has yet to achieve the status of a full-fledged
Islamic institution as it is still in the midst of converting its
conventional assets to Islamic. The initiative to move towards the
Islamic status started when the financial institution introduced a dual
banking system of conventional and Islamic banking in 2003.
Currently, Islamic operation makes up c.80% of its assets, loans and
income. We understand that what is leftover is a portion of
corporate and mortgage accounts. All accounts under personal
financing are Islamic.
MBSB: Proportion of Islamic financing income to total incomeMBSB: Proportion of Islamic financing income to total incomeMBSB: Proportion of Islamic financing income to total incomeMBSB: Proportion of Islamic financing income to total income
Source: Company, DBS Bank, AllianceDBS
MY: Islamic banks ranked by asset sizeMY: Islamic banks ranked by asset sizeMY: Islamic banks ranked by asset sizeMY: Islamic banks ranked by asset size
Source: Company, DBS Bank, AllianceDBS
MY: Islamic banks ranked by MY: Islamic banks ranked by MY: Islamic banks ranked by MY: Islamic banks ranked by loan portfolio sizeloan portfolio sizeloan portfolio sizeloan portfolio size
Source: Company, DBS Bank, AllianceDBS
-
20
40
60
80
100
-
200
400
600
800
1,000
1,200
1,400
1,600
2012
2013
2014
2015
9M16
%%%%RM mRM mRM mRM m
Islamic financing income (LHS) Total income (LHS)Islamic % (RHS)
156
92
57
55
46
44
41
38
26
23
19
15
13
11
11
10
7
3
0
20
40
60
80
100
120
140
160
180
MAY ISL
BANK RAKYAT
BIMB
CIMB ISL
PUBLIC ISL
RHB ISL
MBSB
AMISL
HL ISL
Muam
alat
HSBC AMAN
OCBC AL-…
AFFIN ISL
SC SAADIQ
KFH
ALLCE ISL
Al-Rajhi
AFB
RM bnRM bnRM bnRM bn
130
63
40
34
32
32
31
27
18
15
12
10
9
7
7
7
5
1
0
20
40
60
80
100
120
140
MAY ISL
BANK RAKYAT
CIM
B ISL
BIM
B
MBSB
PUBLIC ISL
RHB ISL
AMISL
HL ISL
MUAMALA
T
HSBC AMAN
OCBC AL-…
AFFIN ISL
KFH
ALLCE ISL
SC SAADIQ
AL-RAJHI
AFB
RM bnRM bnRM bnRM bn
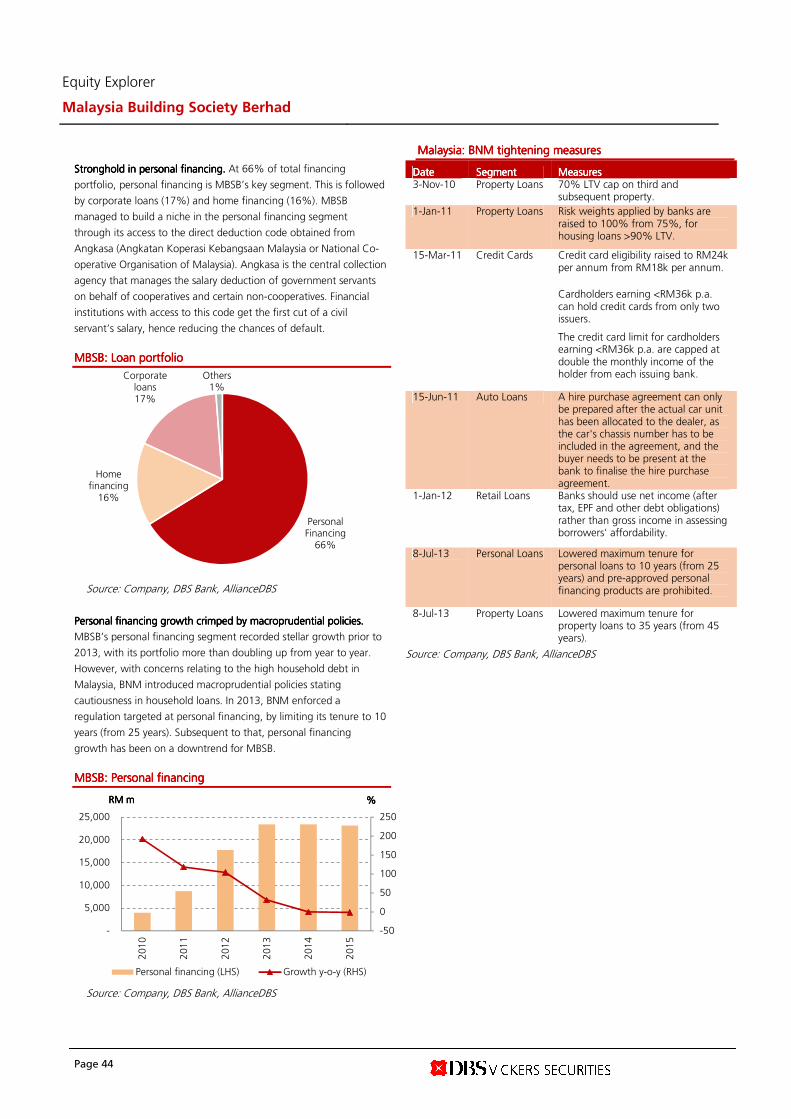
Equity Explorer
Malaysia Building Society Berhad
Page 44
Stronghold in personal financing. Stronghold in personal financing. Stronghold in personal financing. Stronghold in personal financing. At 66% of total financing
portfolio, personal financing is MBSB’s key segment. This is followed
by corporate loans (17%) and home financing (16%). MBSB
managed to build a niche in the personal financing segment
through its access to the direct deduction code obtained from
Angkasa (Angkatan Koperasi Kebangsaan Malaysia or National Co-
operative Organisation of Malaysia). Angkasa is the central collection
agency that manages the salary deduction of government servants
on behalf of cooperatives and certain non-cooperatives. Financial
institutions with access to this code get the first cut of a civil
servant’s salary, hence reducing the chances of default.
MBSB: Loan MBSB: Loan MBSB: Loan MBSB: Loan portfolioportfolioportfolioportfolio
Source: Company, DBS Bank, AllianceDBS
Personal financing growth crimped by macroprudential policies. Personal financing growth crimped by macroprudential policies. Personal financing growth crimped by macroprudential policies. Personal financing growth crimped by macroprudential policies.
MBSB’s personal financing segment recorded stellar growth prior to
2013, with its portfolio more than doubling up from year to year.
However, with concerns relating to the high household debt in
Malaysia, BNM introduced macroprudential policies stating
cautiousness in household loans. In 2013, BNM enforced a
regulation targeted at personal financing, by limiting its tenure to 10
years (from 25 years). Subsequent to that, personal financing
growth has been on a downtrend for MBSB.
MBSB: Personal financingMBSB: Personal financingMBSB: Personal financingMBSB: Personal financing
Source: Company, DBS Bank, AllianceDBS
Malaysia: BNM tightening measuresMalaysia: BNM tightening measuresMalaysia: BNM tightening measuresMalaysia: BNM tightening measures
DateDateDateDate SegmentSegmentSegmentSegment MeasuresMeasuresMeasuresMeasures 3-Nov-10 Property Loans 70% LTV cap on third and
subsequent property.
1-Jan-11 Property Loans Risk weights applied by banks are raised to 100% from 75%, for housing loans >90% LTV.
15-Mar-11 Credit Cards Credit card eligibility raised to RM24k per annum from RM18k per annum.
Cardholders earning <RM36k p.a. can hold credit cards from only two issuers.
The credit card limit for cardholders earning <RM36k p.a. are capped at double the monthly income of the holder from each issuing bank.
15-Jun-11 Auto Loans A hire purchase agreement can only be prepared after the actual car unit has been allocated to the dealer, as the car's chassis number has to be included in the agreement, and the buyer needs to be present at the bank to finalise the hire purchase agreement.
1-Jan-12 Retail Loans Banks should use net income (after tax, EPF and other debt obligations) rather than gross income in assessing borrowers' affordability.
8-Jul-13 Personal Loans Lowered maximum tenure for personal loans to 10 years (from 25 years) and pre-approved personal financing products are prohibited.
8-Jul-13 Property Loans Lowered maximum tenure for property loans to 35 years (from 45 years).
Source: Company, DBS Bank, AllianceDBS
Personal Financing66%
Home financing16%
Corporate loans17%
Others1%
-50
0
50
100
150
200
250
-
5,000
10,000
15,000
20,000
25,000
2010
2011
2012
2013
2014
2015
%%%%RM mRM mRM mRM m
Personal financing (LHS) Growth y-o-y (RHS)
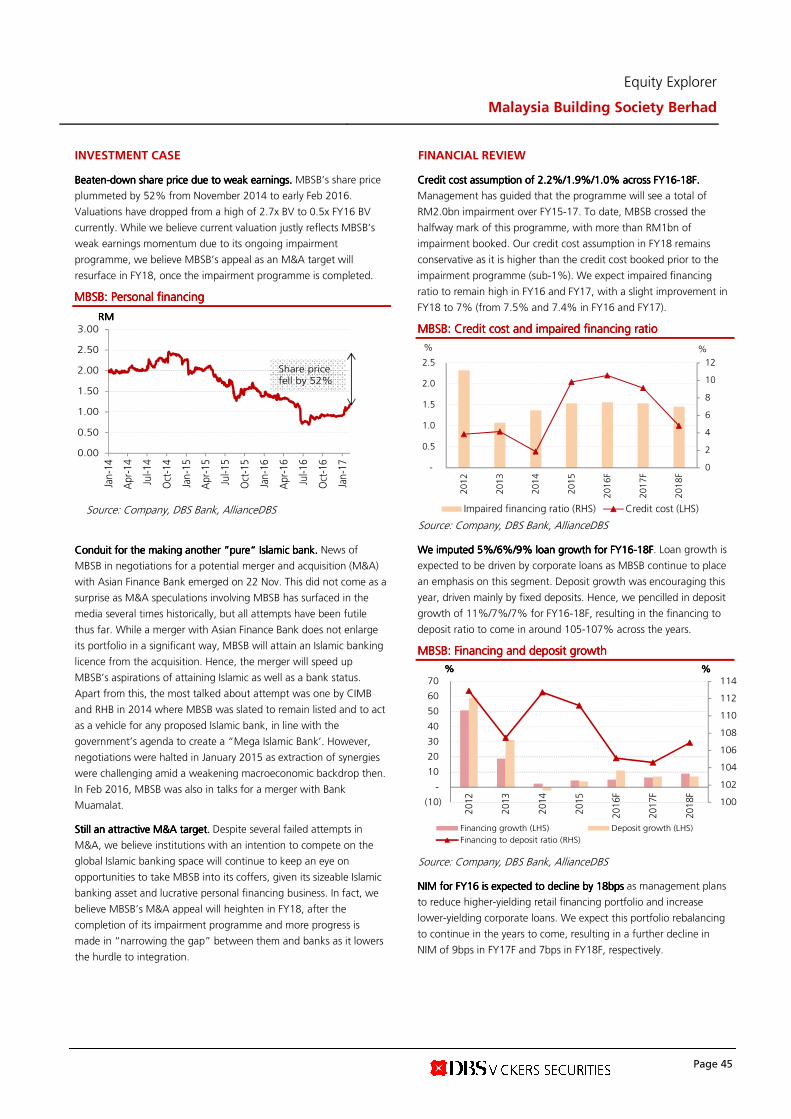
Equity Explorer
Malaysia Building Society Berhad
Page 45
INVESTMENT CASE
BeatenBeatenBeatenBeaten----down share price due to weak earnings. down share price due to weak earnings. down share price due to weak earnings. down share price due to weak earnings. MBSB’s share price
plummeted by 52% from November 2014 to early Feb 2016.
Valuations have dropped from a high of 2.7x BV to 0.5x FY16 BV
currently. While we believe current valuation justly reflects MBSB’s
weak earnings momentum due to its ongoing impairment
programme, we believe MBSB’s appeal as an M&A target will
resurface in FY18, once the impairment programme is completed.
MBSB: Personal financingMBSB: Personal financingMBSB: Personal financingMBSB: Personal financing
Source: Company, DBS Bank, AllianceDBS
Conduit for the making another “pure” Islamic Conduit for the making another “pure” Islamic Conduit for the making another “pure” Islamic Conduit for the making another “pure” Islamic bbbbank. ank. ank. ank. News of
MBSB in negotiations for a potential merger and acquisition (M&A)
with Asian Finance Bank emerged on 22 Nov. This did not come as a
surprise as M&A speculations involving MBSB has surfaced in the
media several times historically, but all attempts have been futile
thus far. While a merger with Asian Finance Bank does not enlarge
its portfolio in a significant way, MBSB will attain an Islamic banking
licence from the acquisition. Hence, the merger will speed up
MBSB’s aspirations of attaining Islamic as well as a bank status.
Apart from this, the most talked about attempt was one by CIMB
and RHB in 2014 where MBSB was slated to remain listed and to act
as a vehicle for any proposed Islamic bank, in line with the
government’s agenda to create a “Mega Islamic Bank’. However,
negotiations were halted in January 2015 as extraction of synergies
were challenging amid a weakening macroeconomic backdrop then.
In Feb 2016, MBSB was also in talks for a merger with Bank
Muamalat.
Still an attractive M&A target.Still an attractive M&A target.Still an attractive M&A target.Still an attractive M&A target. Despite several failed attempts in
M&A, we believe institutions with an intention to compete on the
global Islamic banking space will continue to keep an eye on
opportunities to take MBSB into its coffers, given its sizeable Islamic
banking asset and lucrative personal financing business. In fact, we
believe MBSB’s M&A appeal will heighten in FY18, after the
completion of its impairment programme and more progress is
made in “narrowing the gap” between them and banks as it lowers
the hurdle to integration.
FINANCIAL REVIEW
Credit cost assumption of 2.2%/1.9%/1.0% across FY16Credit cost assumption of 2.2%/1.9%/1.0% across FY16Credit cost assumption of 2.2%/1.9%/1.0% across FY16Credit cost assumption of 2.2%/1.9%/1.0% across FY16----18F. 18F. 18F. 18F.
Management has guided that the programme will see a total of
RM2.0bn impairment over FY15-17. To date, MBSB crossed the
halfway mark of this programme, with more than RM1bn of
impairment booked. Our credit cost assumption in FY18 remains
conservative as it is higher than the credit cost booked prior to the
impairment programme (sub-1%). We expect impaired financing
ratio to remain high in FY16 and FY17, with a slight improvement in
FY18 to 7% (from 7.5% and 7.4% in FY16 and FY17).
MBSB: Credit cost and impaired financing ratioMBSB: Credit cost and impaired financing ratioMBSB: Credit cost and impaired financing ratioMBSB: Credit cost and impaired financing ratio
Source: Company, DBS Bank, AllianceDBS
We imputed 5%/6%/9% loan growth for FY16We imputed 5%/6%/9% loan growth for FY16We imputed 5%/6%/9% loan growth for FY16We imputed 5%/6%/9% loan growth for FY16----18F18F18F18F. Loan growth is
expected to be driven by corporate loans as MBSB continue to place
an emphasis on this segment. Deposit growth was encouraging this
year, driven mainly by fixed deposits. Hence, we pencilled in deposit
growth of 11%/7%/7% for FY16-18F, resulting in the financing to
deposit ratio to come in around 105-107% across the years.
MBSB: Financing and deposit growthMBSB: Financing and deposit growthMBSB: Financing and deposit growthMBSB: Financing and deposit growth
Source: Company, DBS Bank, AllianceDBS
NIM for FY16 is expected to decline by 18bpsNIM for FY16 is expected to decline by 18bpsNIM for FY16 is expected to decline by 18bpsNIM for FY16 is expected to decline by 18bps as management plans
to reduce higher-yielding retail financing portfolio and increase
lower-yielding corporate loans. We expect this portfolio rebalancing
to continue in the years to come, resulting in a further decline in
NIM of 9bps in FY17F and 7bps in FY18F, respectively.
0.00
0.50
1.00
1.50
2.00
2.50
3.00
Jan-14
Apr-14
Jul-14
Oct-14
Jan-15
Apr-15
Jul-15
Oct-15
Jan-16
Apr-16
Jul-16
Oct-16
Jan-17
RMRMRMRM
Share price fell by 52%
0
2
4
6
8
10
12
-
0.5
1.0
1.5
2.0
2.5
2012
2013
2014
2015
2016F
2017F
2018F
%%
Impaired financing ratio (RHS) Credit cost (LHS)
100
102
104
106
108
110
112
114
(10)
-
10
20
30
40
50
60
70
2012
2013
2014
2015
2016F
2017F
2018F
%%%%%%%%
Financing growth (LHS) Deposit growth (LHS)
Financing to deposit ratio (RHS)
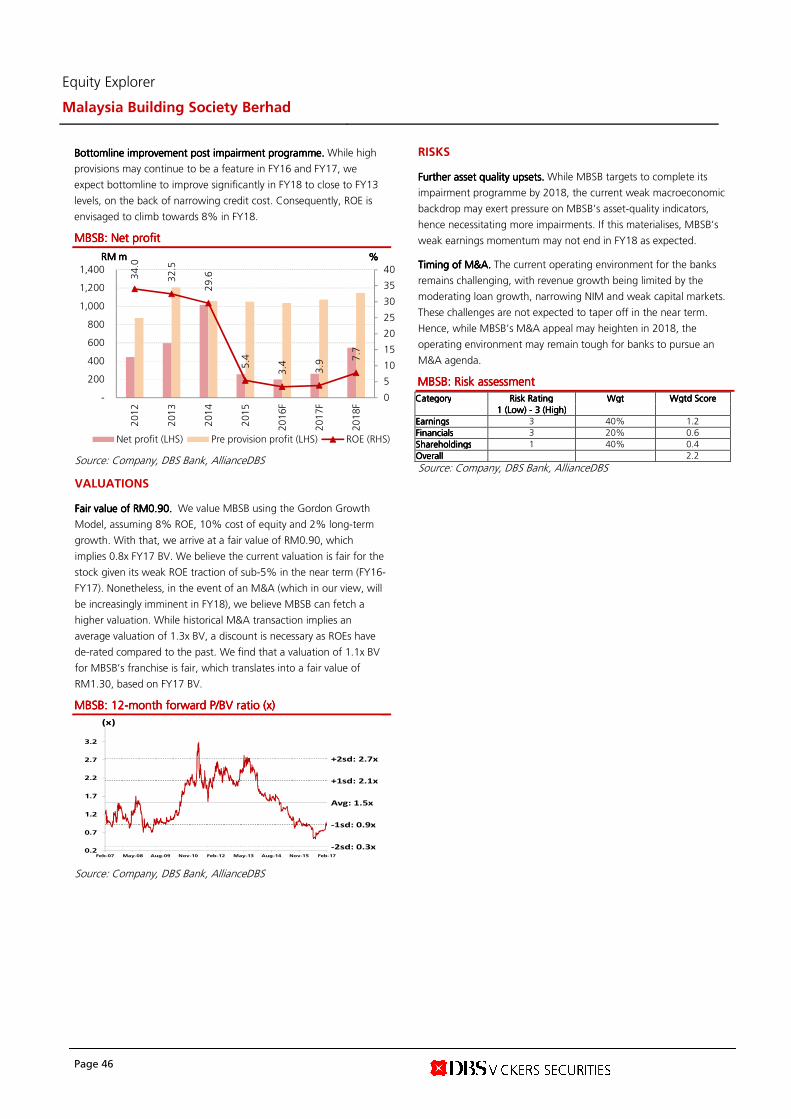
Equity Explorer
Malaysia Building Society Berhad
Page 46
Bottomline improvement post impairment programme.Bottomline improvement post impairment programme.Bottomline improvement post impairment programme.Bottomline improvement post impairment programme. While high
provisions may continue to be a feature in FY16 and FY17, we
expect bottomline to improve significantly in FY18 to close to FY13
levels, on the back of narrowing credit cost. Consequently, ROE is
envisaged to climb towards 8% in FY18.
MBSB: NetMBSB: NetMBSB: NetMBSB: Net profitprofitprofitprofit
Source: Company, DBS Bank, AllianceDBS
VALUATIONS
Fair value of RM0.90.Fair value of RM0.90.Fair value of RM0.90.Fair value of RM0.90. We value MBSB using the Gordon Growth
Model, assuming 8% ROE, 10% cost of equity and 2% long-term
growth. With that, we arrive at a fair value of RM0.90, which
implies 0.8x FY17 BV. We believe the current valuation is fair for the
stock given its weak ROE traction of sub-5% in the near term (FY16-
FY17). Nonetheless, in the event of an M&A (which in our view, will
be increasingly imminent in FY18), we believe MBSB can fetch a
higher valuation. While historical M&A transaction implies an
average valuation of 1.3x BV, a discount is necessary as ROEs have
de-rated compared to the past. We find that a valuation of 1.1x BV
for MBSB’s franchise is fair, which translates into a fair value of
RM1.30, based on FY17 BV.
MBSB: 12MBSB: 12MBSB: 12MBSB: 12----month forward Pmonth forward Pmonth forward Pmonth forward P////BBBBVVVV ratio (x)ratio (x)ratio (x)ratio (x)
Source: Company, DBS Bank, AllianceDBS
RISKS
Further asset quality upsets.Further asset quality upsets.Further asset quality upsets.Further asset quality upsets. While MBSB targets to complete its
impairment programme by 2018, the current weak macroeconomic
backdrop may exert pressure on MBSB’s asset-quality indicators,
hence necessitating more impairments. If this materialises, MBSB’s
weak earnings momentum may not end in FY18 as expected.
Timing of M&A. Timing of M&A. Timing of M&A. Timing of M&A. The current operating environment for the banks
remains challenging, with revenue growth being limited by the
moderating loan growth, narrowing NIM and weak capital markets.
These challenges are not expected to taper off in the near term.
Hence, while MBSB’s M&A appeal may heighten in 2018, the
operating environment may remain tough for banks to pursue an
M&A agenda.
MBSB: Risk assessmentMBSB: Risk assessmentMBSB: Risk assessmentMBSB: Risk assessment
CategoryCategoryCategoryCategory Risk RatingRisk RatingRisk RatingRisk Rating WgtWgtWgtWgt Wgtd ScoreWgtd ScoreWgtd ScoreWgtd Score
1 (Low) 1 (Low) 1 (Low) 1 (Low) ---- 3 (High)3 (High)3 (High)3 (High)
EarningsEarningsEarningsEarnings 3 40% 1.2
FinancialsFinancialsFinancialsFinancials 3 20% 0.6
ShareholdingsShareholdingsShareholdingsShareholdings 1 40% 0.4
OverallOverallOverallOverall 2.2
Source: Company, DBS Bank, AllianceDBS
34.0
32.5
29.6
5.4
3.4
3.9 7.7
0
5
10
15
20
25
30
35
40
-
200
400
600
800
1,000
1,200
1,400
2012
2013
2014
2015
2016F
2017F
2018F
%%%%RM mRM mRM mRM m
Net profit (LHS) Pre provision profit (LHS) ROE (RHS)
Avg: 1.5x
+1sd: 2.1x
+2sd: 2.7x
-1sd: 0.9x
-2sd: 0.3x0.2
0.7
1.2
1.7
2.2
2.7
3.2
Feb-07 May-08 Aug-09 Nov-10 Feb-12 May-13 Aug-14 Nov-15 Feb-17
(x)
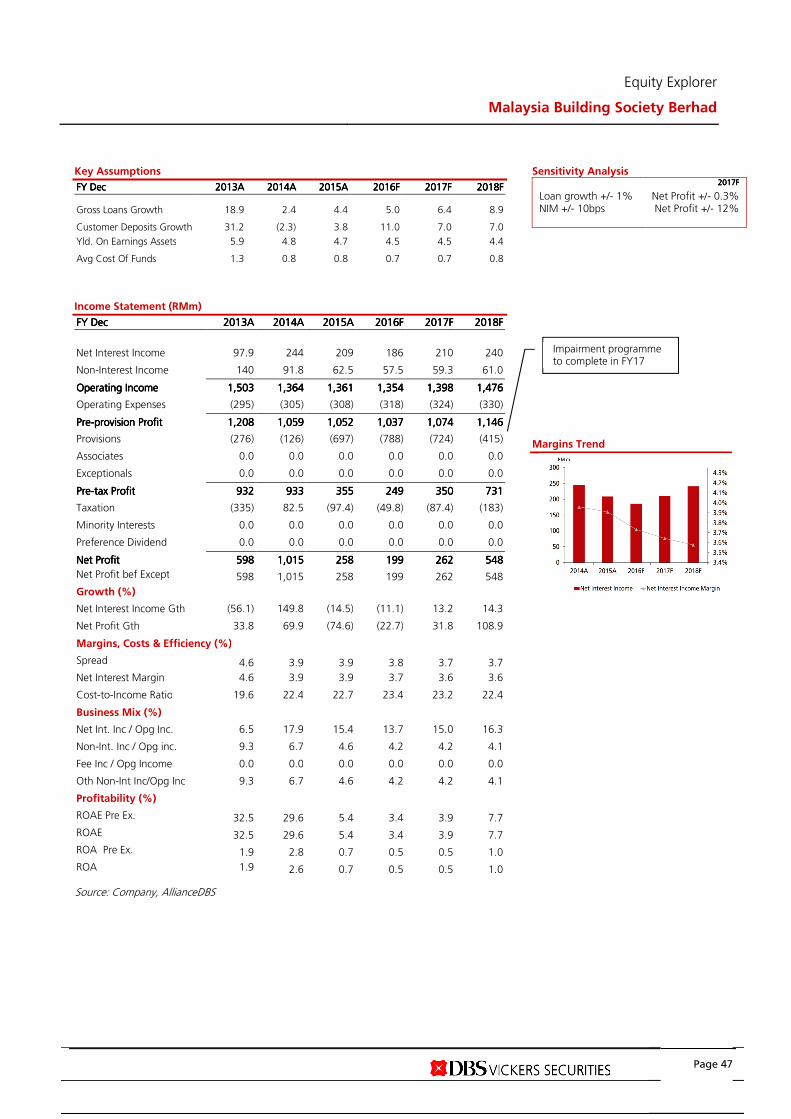
Equity Explorer
Malaysia Building Society Berhad
Page 47
Key Assumptions
FY FY FY FY DecDecDecDec 2013201320132013AAAA 2014201420142014AAAA 2015201520152015AAAA 2016201620162016FFFF 2017201720172017FFFF 2018201820182018FFFF
Gross Loans Growth 18.9 2.4 4.4 5.0 6.4 8.9
Customer Deposits Growth 31.2 (2.3) 3.8 11.0 7.0 7.0
Yld. On Earnings Assets 5.9 4.8 4.7 4.5 4.5 4.4
Avg Cost Of Funds 1.3 0.8 0.8 0.7 0.7 0.8
Income Statement (RMm)
FY FY FY FY DecDecDecDec 2013201320132013AAAA 2014201420142014AAAA 2015201520152015AAAA 2016201620162016FFFF 2017201720172017FFFF 2018201820182018FFFF
Net Interest Income 97.9 244 209 186 210 240
Non-Interest Income 140 91.8 62.5 57.5 59.3 61.0
Operating IncomeOperating IncomeOperating IncomeOperating Income 1,5031,5031,5031,503 1,3641,3641,3641,364 1,3611,3611,3611,361 1,3541,3541,3541,354 1,3981,3981,3981,398 1,4761,4761,4761,476
Operating Expenses (295) (305) (308) (318) (324) (330)
PrePrePrePre----provision Profitprovision Profitprovision Profitprovision Profit 1,2081,2081,2081,208 1,0591,0591,0591,059 1,0521,0521,0521,052 1,0371,0371,0371,037 1,0741,0741,0741,074 1,1461,1461,1461,146
Provisions (276) (126) (697) (788) (724) (415)
Associates 0.0 0.0 0.0 0.0 0.0 0.0
Exceptionals 0.0 0.0 0.0 0.0 0.0 0.0
PrePrePrePre----tax Profittax Profittax Profittax Profit 932932932932 933933933933 355355355355 249249249249 350350350350 731731731731
Taxation (335) 82.5 (97.4) (49.8) (87.4) (183)
Minority Interests 0.0 0.0 0.0 0.0 0.0 0.0
Preference Dividend 0.0 0.0 0.0 0.0 0.0 0.0
Net ProfitNet ProfitNet ProfitNet Profit 598598598598 1,0151,0151,0151,015 258258258258 199199199199 262262262262 548548548548
Net Profit bef Except 598 1,015 258 199 262 548
Growth (%)
Net Interest Income Gth (56.1) 149.8 (14.5) (11.1) 13.2 14.3
Net Profit Gth 33.8 69.9 (74.6) (22.7) 31.8 108.9
Margins, Costs & Efficiency (%)
Spread 4.6 3.9 3.9 3.8 3.7 3.7
Net Interest Margin 4.6 3.9 3.9 3.7 3.6 3.6
Cost-to-Income Ratio 19.6 22.4 22.7 23.4 23.2 22.4
Business Mix (%)
Net Int. Inc / Opg Inc. 6.5 17.9 15.4 13.7 15.0 16.3
Non-Int. Inc / Opg inc. 9.3 6.7 4.6 4.2 4.2 4.1
Fee Inc / Opg Income 0.0 0.0 0.0 0.0 0.0 0.0
Oth Non-Int Inc/Opg Inc 9.3 6.7 4.6 4.2 4.2 4.1
Profitability (%)
ROAE Pre Ex. 32.5 29.6 5.4 3.4 3.9 7.7
ROAE 32.5 29.6 5.4 3.4 3.9 7.7
ROA Pre Ex. 1.9 2.8 0.7 0.5 0.5 1.0
ROA 1.9 2.6 0.7 0.5 0.5 1.0
Source: Company, AllianceDBS
Sensitivity Analysis 2012012012017F7F7F7F
Loan growth +/- 1% Net Profit +/- 0.3% NIM +/- 10bps Net Profit +/- 12%
Margins Trend
Impairment programme to complete in FY17
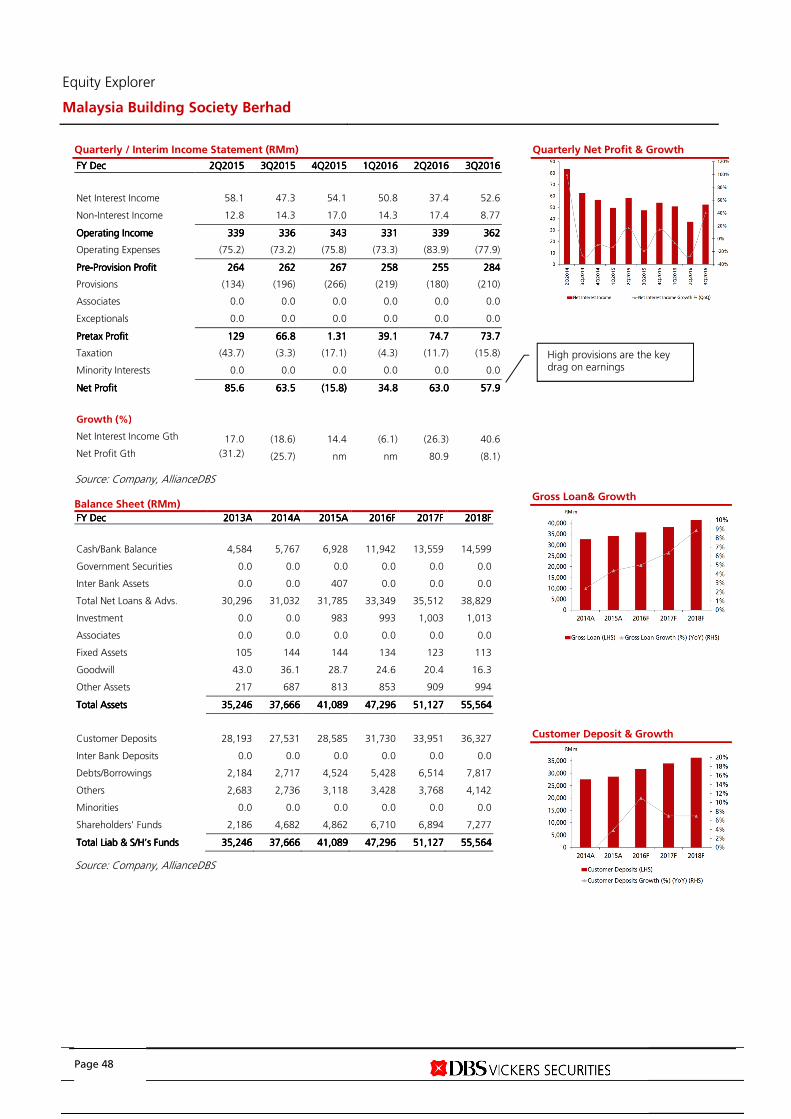
Equity Explorer
Malaysia Building Society Berhad
Page 48
Quarterly / Interim Income Statement (RMm)
FY FY FY FY DecDecDecDec 2Q2Q2Q2Q2015201520152015 3Q3Q3Q3Q2015201520152015 4Q4Q4Q4Q2015201520152015 1Q1Q1Q1Q2016201620162016 2Q2Q2Q2Q2016201620162016 3Q3Q3Q3Q2016201620162016
Net Interest Income 58.1 47.3 54.1 50.8 37.4 52.6
Non-Interest Income 12.8 14.3 17.0 14.3 17.4 8.77
Operating IncomeOperating IncomeOperating IncomeOperating Income 339339339339 336336336336 343343343343 331331331331 339339339339 362362362362
Operating Expenses (75.2) (73.2) (75.8) (73.3) (83.9) (77.9)
PrePrePrePre----Provision ProfitProvision ProfitProvision ProfitProvision Profit 264264264264 262262262262 267267267267 258258258258 255255255255 284284284284
Provisions (134) (196) (266) (219) (180) (210)
Associates 0.0 0.0 0.0 0.0 0.0 0.0
Exceptionals 0.0 0.0 0.0 0.0 0.0 0.0
Pretax ProfitPretax ProfitPretax ProfitPretax Profit 129129129129 66.866.866.866.8 1.311.311.311.31 39.139.139.139.1 74.774.774.774.7 73.773.773.773.7
Taxation (43.7) (3.3) (17.1) (4.3) (11.7) (15.8)
Minority Interests 0.0 0.0 0.0 0.0 0.0 0.0
Net ProfitNet ProfitNet ProfitNet Profit 85.685.685.685.6 63.563.563.563.5 (15.8)(15.8)(15.8)(15.8) 34.834.834.834.8 63.063.063.063.0 57.957.957.957.9
Growth (%)
Net Interest Income Gth 17.0 (18.6) 14.4 (6.1) (26.3) 40.6
Net Profit Gth (31.2) (25.7) nm nm 80.9 (8.1)
Source: Company, AllianceDBS Balance Sheet (RMm)
FY FY FY FY DecDecDecDec 2013201320132013AAAA 2014201420142014AAAA 2015201520152015AAAA 2016201620162016FFFF 2017201720172017FFFF 2018201820182018FFFF
Cash/Bank Balance 4,584 5,767 6,928 11,942 13,559 14,599
Government Securities 0.0 0.0 0.0 0.0 0.0 0.0
Inter Bank Assets 0.0 0.0 407 0.0 0.0 0.0
Total Net Loans & Advs. 30,296 31,032 31,785 33,349 35,512 38,829
Investment 0.0 0.0 983 993 1,003 1,013
Associates 0.0 0.0 0.0 0.0 0.0 0.0
Fixed Assets 105 144 144 134 123 113
Goodwill 43.0 36.1 28.7 24.6 20.4 16.3
Other Assets 217 687 813 853 909 994
Total AssetsTotal AssetsTotal AssetsTotal Assets 35,24635,24635,24635,246 37,66637,66637,66637,666 41,08941,08941,08941,089 47,29647,29647,29647,296 51,12751,12751,12751,127 55,56455,56455,56455,564
Customer Deposits 28,193 27,531 28,585 31,730 33,951 36,327
Inter Bank Deposits 0.0 0.0 0.0 0.0 0.0 0.0
Debts/Borrowings 2,184 2,717 4,524 5,428 6,514 7,817
Others 2,683 2,736 3,118 3,428 3,768 4,142
Minorities 0.0 0.0 0.0 0.0 0.0 0.0
Shareholders' Funds 2,186 4,682 4,862 6,710 6,894 7,277
Total LiabTotal LiabTotal LiabTotal Liab & S/H’s Funds& S/H’s Funds& S/H’s Funds& S/H’s Funds 35,24635,24635,24635,246 37,66637,66637,66637,666 41,08941,08941,08941,089 47,29647,29647,29647,296 51,12751,12751,12751,127 55,56455,56455,56455,564
Source: Company, AllianceDBS
Quarterly Net Profit & Growth
Gross Loan& Growth
Customer Deposit & Growth
High provisions are the key drag on earnings
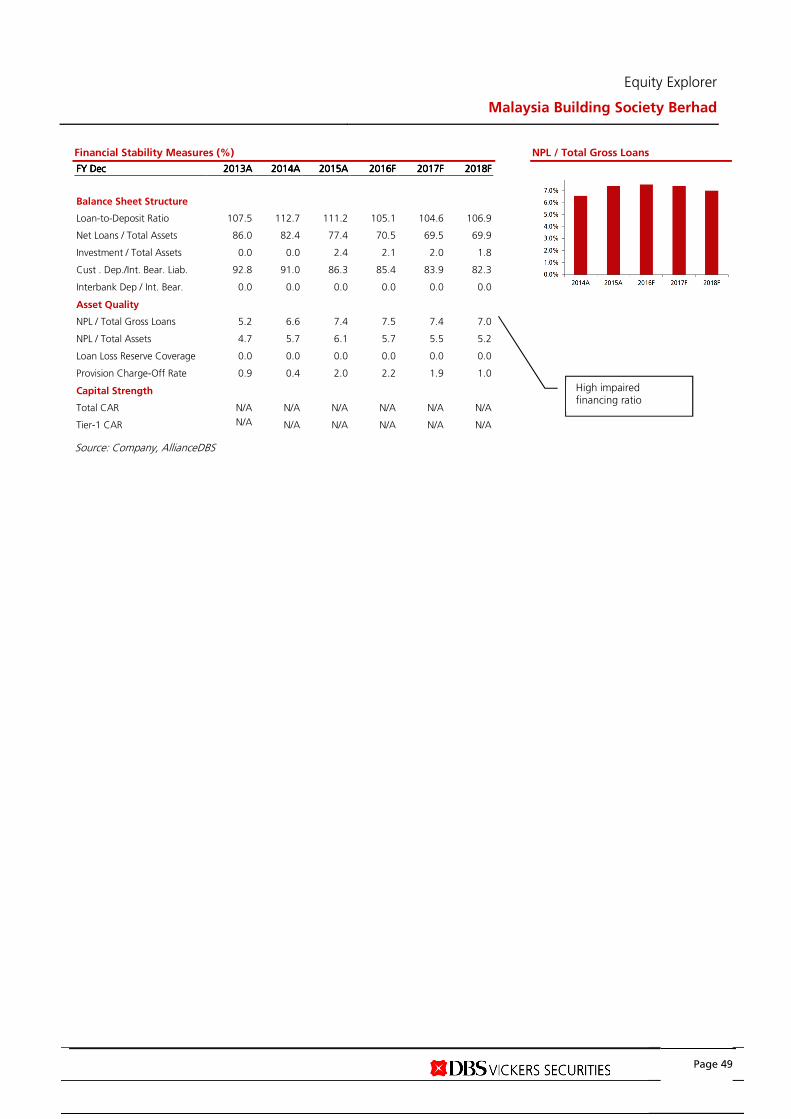
Equity Explorer
Malaysia Building Society Berhad
Page 49
Financial Stability Measures (%)
FY FY FY FY DecDecDecDec 2013201320132013AAAA 2014201420142014AAAA 2015201520152015AAAA 2016201620162016FFFF 2017201720172017FFFF 2018201820182018FFFF
Balance Sheet Structure
Loan-to-Deposit Ratio 107.5 112.7 111.2 105.1 104.6 106.9
Net Loans / Total Assets 86.0 82.4 77.4 70.5 69.5 69.9
Investment / Total Assets 0.0 0.0 2.4 2.1 2.0 1.8
Cust . Dep./Int. Bear. Liab. 92.8 91.0 86.3 85.4 83.9 82.3
Interbank Dep / Int. Bear. 0.0 0.0 0.0 0.0 0.0 0.0
Asset Quality
NPL / Total Gross Loans 5.2 6.6 7.4 7.5 7.4 7.0
NPL / Total Assets 4.7 5.7 6.1 5.7 5.5 5.2
Loan Loss Reserve Coverage 0.0 0.0 0.0 0.0 0.0 0.0
Provision Charge-Off Rate 0.9 0.4 2.0 2.2 1.9 1.0
Capital Strength
Total CAR N/A N/A N/A N/A N/A N/A
Tier-1 CAR N/A N/A N/A N/A N/A N/A
Source: Company, AllianceDBS
NPL / Total Gross Loans
High impaired financing ratio
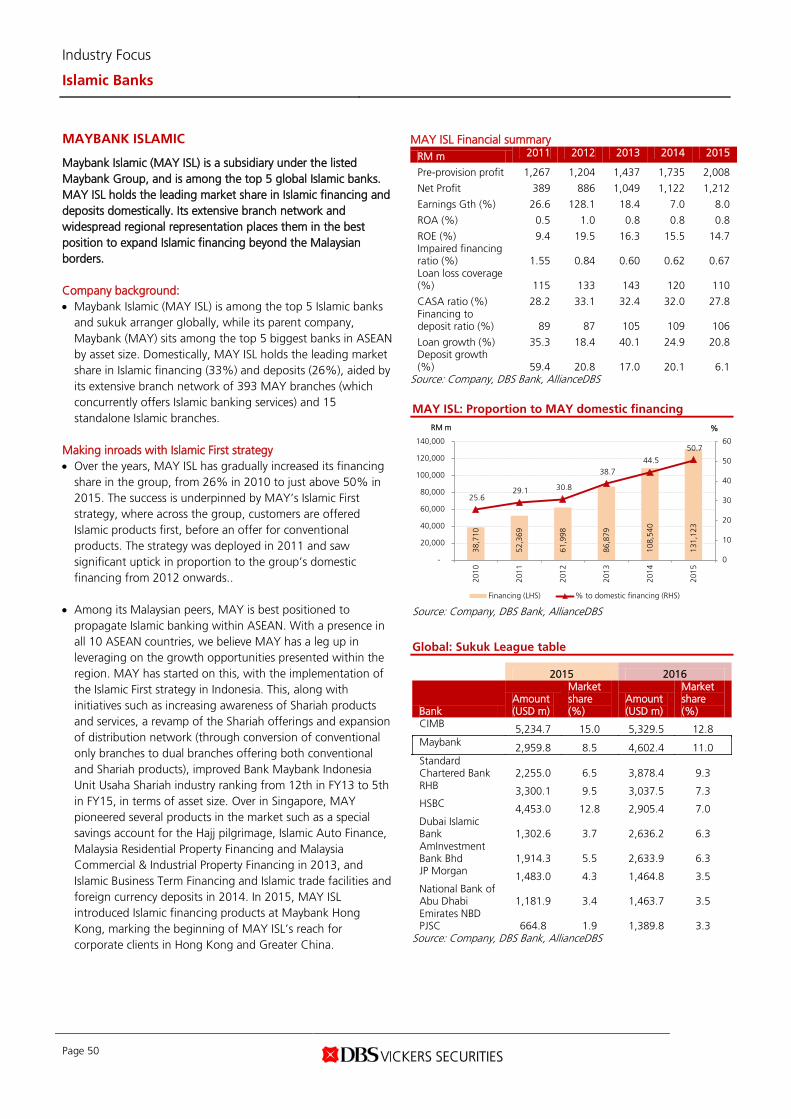
Industry Focus
Islamic Banks
Page 50
MAYBANK ISLAMIC
Maybank Islamic (MAY ISL) is a subsidiary under the listed Maybank Group, and is among the top 5 global Islamic banks. MAY ISL holds the leading market share in Islamic financing and deposits domestically. Its extensive branch network and widespread regional representation places them in the best position to expand Islamic financing beyond the Malaysian borders.
Company background: • Maybank Islamic (MAY ISL) is among the top 5 Islamic banks
and sukuk arranger globally, while its parent company, Maybank (MAY) sits among the top 5 biggest banks in ASEAN by asset size. Domestically, MAY ISL holds the leading market share in Islamic financing (33%) and deposits (26%), aided by its extensive branch network of 393 MAY branches (which concurrently offers Islamic banking services) and 15 standalone Islamic branches.
Making inroads with Islamic First strategy • Over the years, MAY ISL has gradually increased its financing
share in the group, from 26% in 2010 to just above 50% in 2015. The success is underpinned by MAY’s Islamic First strategy, where across the group, customers are offered Islamic products first, before an offer for conventional products. The strategy was deployed in 2011 and saw significant uptick in proportion to the group’s domestic financing from 2012 onwards..
• Among its Malaysian peers, MAY is best positioned to propagate Islamic banking within ASEAN. With a presence in all 10 ASEAN countries, we believe MAY has a leg up in leveraging on the growth opportunities presented within the region. MAY has started on this, with the implementation of the Islamic First strategy in Indonesia. This, along with initiatives such as increasing awareness of Shariah products and services, a revamp of the Shariah offerings and expansion of distribution network (through conversion of conventional only branches to dual branches offering both conventional and Shariah products), improved Bank Maybank Indonesia Unit Usaha Shariah industry ranking from 12th in FY13 to 5th in FY15, in terms of asset size. Over in Singapore, MAY pioneered several products in the market such as a special savings account for the Hajj pilgrimage, Islamic Auto Finance, Malaysia Residential Property Financing and Malaysia Commercial & Industrial Property Financing in 2013, and Islamic Business Term Financing and Islamic trade facilities and foreign currency deposits in 2014. In 2015, MAY ISL introduced Islamic financing products at Maybank Hong Kong, marking the beginning of MAY ISL’s reach for corporate clients in Hong Kong and Greater China.
MAY ISL Financial summary RM m 2011 2012 2013 2014 2015
Pre-provision profit 1,267 1,204 1,437 1,735 2,008
Net Profit 389 886 1,049 1,122 1,212
Earnings Gth (%) 26.6 128.1 18.4 7.0 8.0
ROA (%) 0.5 1.0 0.8 0.8 0.8
ROE (%) 9.4 19.5 16.3 15.5 14.7 Impaired financing ratio (%) 1.55 0.84 0.60 0.62 0.67 Loan loss coverage (%) 115 133 143 120 110
CASA ratio (%) 28.2 33.1 32.4 32.0 27.8 Financing to deposit ratio (%) 89 87 105 109 106
Loan growth (%) 35.3 18.4 40.1 24.9 20.8 Deposit growth (%) 59.4 20.8 17.0 20.1 6.1
Source: Company, DBS Bank, AllianceDBS
MAY ISL: Proportion to MAY domestic financing
Source: Company, DBS Bank, AllianceDBS
Global: Sukuk League table
2015 2016
Bank Amount (USD m)
Market share (%)
Amount (USD m)
Market share (%)
CIMB 5,234.7 15.0 5,329.5 12.8 Maybank 2,959.8 8.5 4,602.4 11.0 Standard Chartered Bank 2,255.0 6.5 3,878.4 9.3 RHB 3,300.1 9.5 3,037.5 7.3 HSBC 4,453.0 12.8 2,905.4 7.0 Dubai Islamic Bank 1,302.6 3.7 2,636.2 6.3 AmInvestment Bank Bhd 1,914.3 5.5 2,633.9 6.3 JP Morgan 1,483.0 4.3 1,464.8 3.5 National Bank of Abu Dhabi 1,181.9 3.4 1,463.7 3.5 Emirates NBD PJSC 664.8 1.9 1,389.8 3.3
Source: Company, DBS Bank, AllianceDBS
38,7
10
52,3
69
61,9
98
86,8
79
108,
540
131,
123
25.6 29.1 30.8
38.7 44.5
50.7
0
10
20
30
40
50
60
-
20,000
40,000
60,000
80,000
100,000
120,000
140,000
2010
2011
2012
2013
2014
2015
%RM m
Financing (LHS) % to domestic financing (RHS)
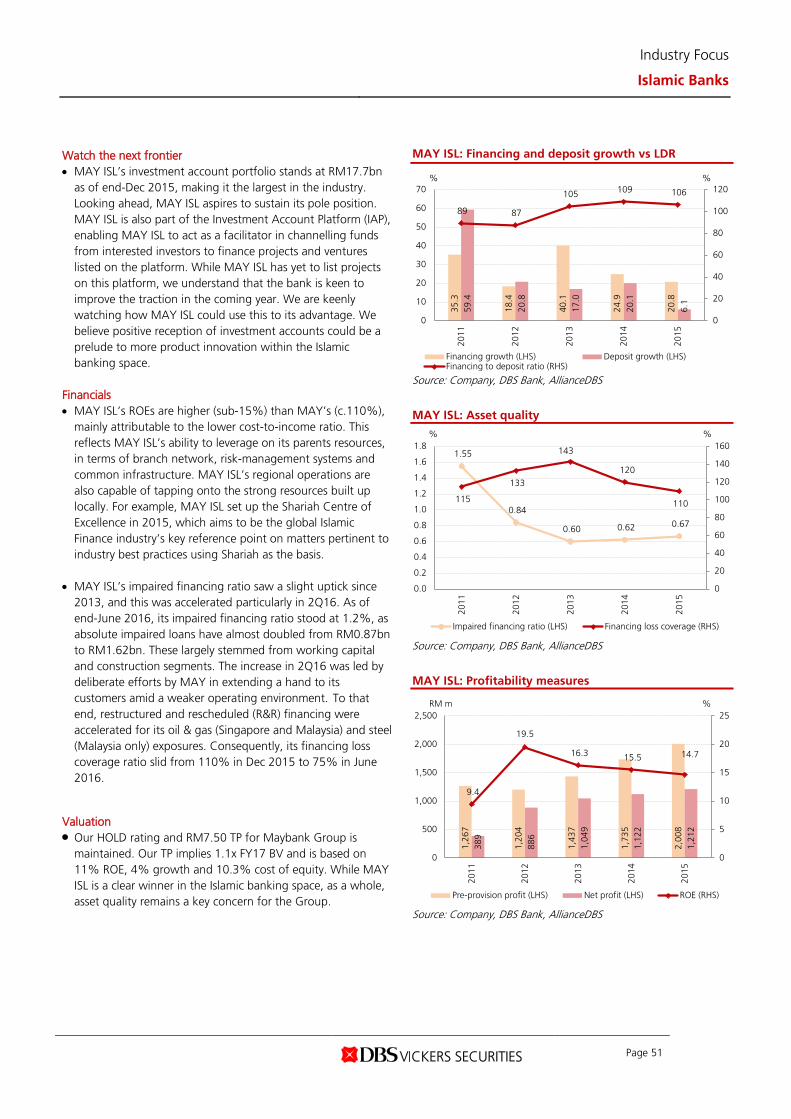
Industry Focus
Islamic Banks
Page 51
Watch the next frontier • MAY ISL’s investment account portfolio stands at RM17.7bn
as of end-Dec 2015, making it the largest in the industry. Looking ahead, MAY ISL aspires to sustain its pole position. MAY ISL is also part of the Investment Account Platform (IAP), enabling MAY ISL to act as a facilitator in channelling funds from interested investors to finance projects and ventures listed on the platform. While MAY ISL has yet to list projects on this platform, we understand that the bank is keen to improve the traction in the coming year. We are keenly watching how MAY ISL could use this to its advantage. We believe positive reception of investment accounts could be a prelude to more product innovation within the Islamic banking space.
Financials • MAY ISL’s ROEs are higher (sub-15%) than MAY’s (c.110%),
mainly attributable to the lower cost-to-income ratio. This reflects MAY ISL’s ability to leverage on its parents resources, in terms of branch network, risk-management systems and common infrastructure. MAY ISL’s regional operations are also capable of tapping onto the strong resources built up locally. For example, MAY ISL set up the Shariah Centre of Excellence in 2015, which aims to be the global Islamic Finance industry’s key reference point on matters pertinent to industry best practices using Shariah as the basis.
• MAY ISL’s impaired financing ratio saw a slight uptick since 2013, and this was accelerated particularly in 2Q16. As of end-June 2016, its impaired financing ratio stood at 1.2%, as absolute impaired loans have almost doubled from RM0.87bn to RM1.62bn. These largely stemmed from working capital and construction segments. The increase in 2Q16 was led by deliberate efforts by MAY in extending a hand to its customers amid a weaker operating environment. To that end, restructured and rescheduled (R&R) financing were accelerated for its oil & gas (Singapore and Malaysia) and steel (Malaysia only) exposures. Consequently, its financing loss coverage ratio slid from 110% in Dec 2015 to 75% in June 2016.
Valuation • Our HOLD rating and RM7.50 TP for Maybank Group is
maintained. Our TP implies 1.1x FY17 BV and is based on 11% ROE, 4% growth and 10.3% cost of equity. While MAY ISL is a clear winner in the Islamic banking space, as a whole, asset quality remains a key concern for the Group.
MAY ISL: Financing and deposit growth vs LDR
Source: Company, DBS Bank, AllianceDBS
MAY ISL: Asset quality
Source: Company, DBS Bank, AllianceDBS
MAY ISL: Profitability measures
Source: Company, DBS Bank, AllianceDBS
35.3
18.4
40.1
24.9
20.8
59.4
20.8
17.0
20.1
6.1
89 87
105 109 106
0
20
40
60
80
100
120
0
10
20
30
40
50
60
70
2011
2012
2013
2014
2015
%%
Financing growth (LHS) Deposit growth (LHS)Financing to deposit ratio (RHS)
1.55
0.84
0.60 0.62 0.67
115
133
143
120
110
0
20
40
60
80
100
120
140
160
0.0
0.2
0.4
0.6
0.8
1.0
1.2
1.4
1.6
1.8
2011
2012
2013
2014
2015
%%
Impaired financing ratio (LHS) Financing loss coverage (RHS)
1,26
7
1,20
4
1,43
7
1,73
5
2,00
8
389
886
1,04
9
1,12
2
1,21
2
9.4
19.5
16.3 15.5 14.7
0
5
10
15
20
25
0
500
1,000
1,500
2,000
2,500
2011
2012
2013
2014
2015
%RM m
Pre-provision profit (LHS) Net profit (LHS) ROE (RHS)
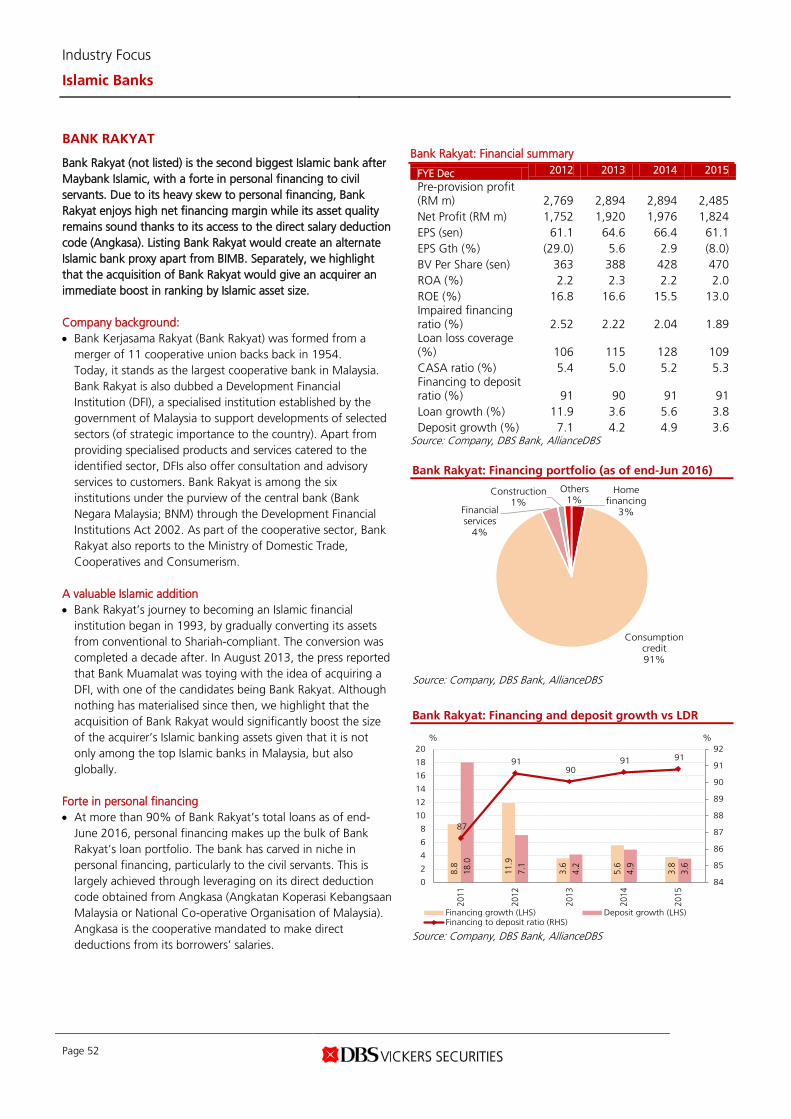
Industry Focus
Islamic Banks
Page 52
BANK RAKYAT
Bank Rakyat (not listed) is the second biggest Islamic bank after Maybank Islamic, with a forte in personal financing to civil servants. Due to its heavy skew to personal financing, Bank Rakyat enjoys high net financing margin while its asset quality remains sound thanks to its access to the direct salary deduction code (Angkasa). Listing Bank Rakyat would create an alternate Islamic bank proxy apart from BIMB. Separately, we highlight that the acquisition of Bank Rakyat would give an acquirer an immediate boost in ranking by Islamic asset size.
Company background: • Bank Kerjasama Rakyat (Bank Rakyat) was formed from a
merger of 11 cooperative union backs back in 1954. Today, it stands as the largest cooperative bank in Malaysia. Bank Rakyat is also dubbed a Development Financial Institution (DFI), a specialised institution established by the government of Malaysia to support developments of selected sectors (of strategic importance to the country). Apart from providing specialised products and services catered to the identified sector, DFIs also offer consultation and advisory services to customers. Bank Rakyat is among the six institutions under the purview of the central bank (Bank Negara Malaysia; BNM) through the Development Financial Institutions Act 2002. As part of the cooperative sector, Bank Rakyat also reports to the Ministry of Domestic Trade, Cooperatives and Consumerism.
A valuable Islamic addition • Bank Rakyat’s journey to becoming an Islamic financial
institution began in 1993, by gradually converting its assets from conventional to Shariah-compliant. The conversion was completed a decade after. In August 2013, the press reported that Bank Muamalat was toying with the idea of acquiring a DFI, with one of the candidates being Bank Rakyat. Although nothing has materialised since then, we highlight that the acquisition of Bank Rakyat would significantly boost the size of the acquirer’s Islamic banking assets given that it is not only among the top Islamic banks in Malaysia, but also globally.
Forte in personal financing • At more than 90% of Bank Rakyat’s total loans as of end-
June 2016, personal financing makes up the bulk of Bank Rakyat’s loan portfolio. The bank has carved in niche in personal financing, particularly to the civil servants. This is largely achieved through leveraging on its direct deduction code obtained from Angkasa (Angkatan Koperasi Kebangsaan Malaysia or National Co-operative Organisation of Malaysia). Angkasa is the cooperative mandated to make direct deductions from its borrowers’ salaries.
Bank Rakyat: Financial summary
FYE Dec 2012 2013 2014 2015
Pre-provision profit (RM m) 2,769 2,894 2,894 2,485 Net Profit (RM m) 1,752 1,920 1,976 1,824 EPS (sen) 61.1 64.6 66.4 61.1 EPS Gth (%) (29.0) 5.6 2.9 (8.0) BV Per Share (sen) 363 388 428 470 ROA (%) 2.2 2.3 2.2 2.0 ROE (%) 16.8 16.6 15.5 13.0 Impaired financing ratio (%) 2.52 2.22 2.04 1.89 Loan loss coverage (%) 106 115 128 109 CASA ratio (%) 5.4 5.0 5.2 5.3 Financing to deposit ratio (%) 91 90 91 91 Loan growth (%) 11.9 3.6 5.6 3.8 Deposit growth (%) 7.1 4.2 4.9 3.6
Source: Company, DBS Bank, AllianceDBS
Bank Rakyat: Financing portfolio (as of end-Jun 2016)
Source: Company, DBS Bank, AllianceDBS
Bank Rakyat: Financing and deposit growth vs LDR
Source: Company, DBS Bank, AllianceDBS
Home financing
3%
Consumption credit91%
Financial services
4%
Construction1%
Others1%
8.8
11.9
3.6
5.6
3.8
18.0
7.1
4.2
4.9
3.6
87
91 90
91 91
84
85
86
87
88
89
90
91
92
0
2
4
6
8
10
12
14
16
18
20
2011
2012
2013
2014
2015
%%
Financing growth (LHS) Deposit growth (LHS)Financing to deposit ratio (RHS)
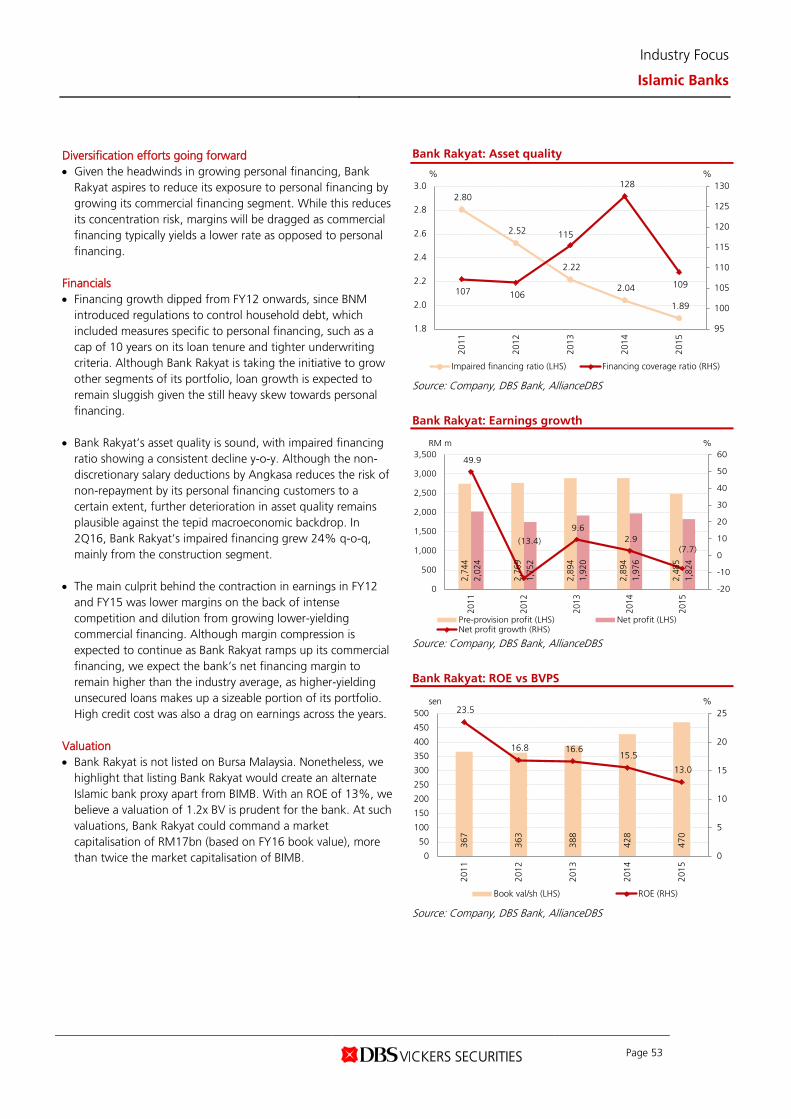
Industry Focus
Islamic Banks
Page 53
Diversification efforts going forward • Given the headwinds in growing personal financing, Bank
Rakyat aspires to reduce its exposure to personal financing by growing its commercial financing segment. While this reduces its concentration risk, margins will be dragged as commercial financing typically yields a lower rate as opposed to personal financing.
Financials • Financing growth dipped from FY12 onwards, since BNM
introduced regulations to control household debt, which included measures specific to personal financing, such as a cap of 10 years on its loan tenure and tighter underwriting criteria. Although Bank Rakyat is taking the initiative to grow other segments of its portfolio, loan growth is expected to remain sluggish given the still heavy skew towards personal financing.
• Bank Rakyat’s asset quality is sound, with impaired financing ratio showing a consistent decline y-o-y. Although the non-discretionary salary deductions by Angkasa reduces the risk of non-repayment by its personal financing customers to a certain extent, further deterioration in asset quality remains plausible against the tepid macroeconomic backdrop. In 2Q16, Bank Rakyat’s impaired financing grew 24% q-o-q, mainly from the construction segment.
• The main culprit behind the contraction in earnings in FY12
and FY15 was lower margins on the back of intense competition and dilution from growing lower-yielding commercial financing. Although margin compression is expected to continue as Bank Rakyat ramps up its commercial financing, we expect the bank’s net financing margin to remain higher than the industry average, as higher-yielding unsecured loans makes up a sizeable portion of its portfolio. High credit cost was also a drag on earnings across the years.
Valuation • Bank Rakyat is not listed on Bursa Malaysia. Nonetheless, we
highlight that listing Bank Rakyat would create an alternate Islamic bank proxy apart from BIMB. With an ROE of 13%, we believe a valuation of 1.2x BV is prudent for the bank. At such valuations, Bank Rakyat could command a market capitalisation of RM17bn (based on FY16 book value), more than twice the market capitalisation of BIMB.
Bank Rakyat: Asset quality
Source: Company, DBS Bank, AllianceDBS
Bank Rakyat: Earnings growth
Source: Company, DBS Bank, AllianceDBS
Bank Rakyat: ROE vs BVPS
Source: Company, DBS Bank, AllianceDBS
2.80
2.52
2.22
2.04
1.89
107 106
115
128
109
95
100
105
110
115
120
125
130
1.8
2.0
2.2
2.4
2.6
2.8
3.0
2011
2012
2013
2014
2015
%%
Impaired financing ratio (LHS) Financing coverage ratio (RHS)
2,74
4
2,76
9
2,89
4
2,89
4
2,48
5
2,02
4
1,75
2
1,92
0
1,97
6
1,82
4
49.9
(13.4)
9.6 2.9
(7.7)
-20
-10
0
10
20
30
40
50
60
0
500
1,000
1,500
2,000
2,500
3,000
3,500
2011
2012
2013
2014
2015
%RM m
Pre-provision profit (LHS) Net profit (LHS)Net profit growth (RHS)
367
363
388
428
470
23.5
16.8 16.6 15.5
13.0
0
5
10
15
20
25
0
50
100
150
200
250
300
350
400
450
500
2011
2012
2013
2014
2015
%sen
Book val/sh (LHS) ROE (RHS)
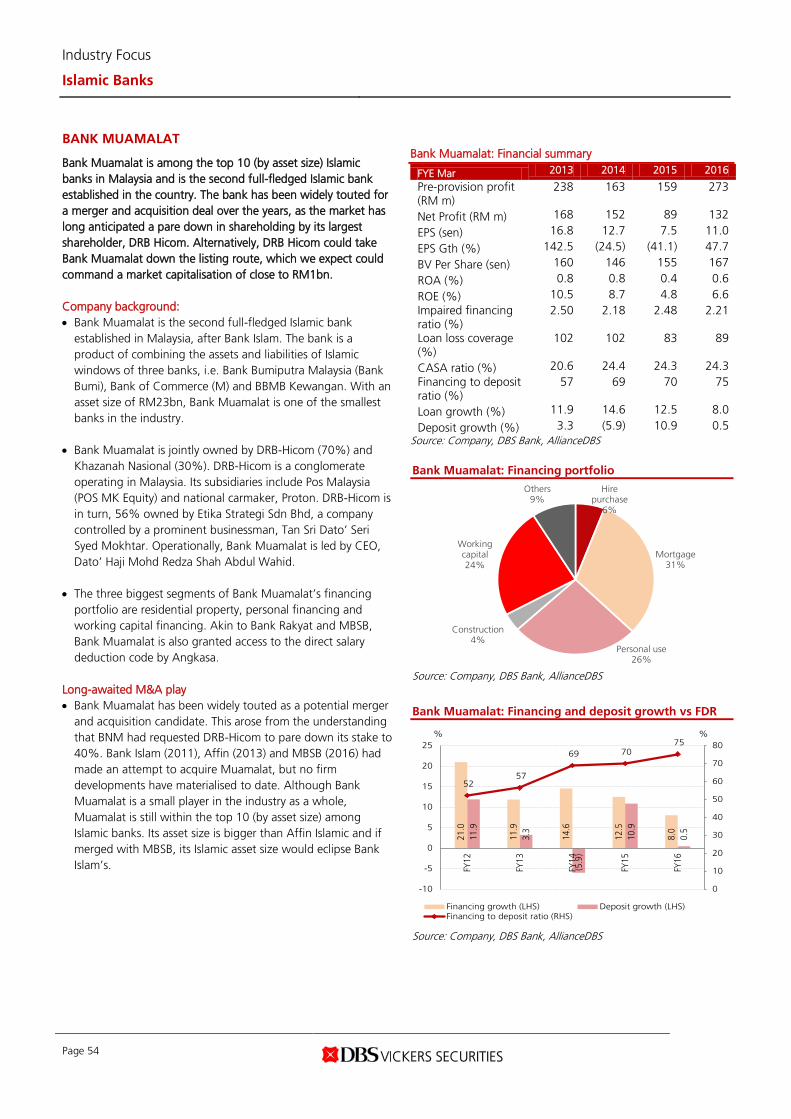
Industry Focus
Islamic Banks
Page 54
BANK MUAMALAT
Bank Muamalat is among the top 10 (by asset size) Islamic banks in Malaysia and is the second full-fledged Islamic bank established in the country. The bank has been widely touted for a merger and acquisition deal over the years, as the market has long anticipated a pare down in shareholding by its largest shareholder, DRB Hicom. Alternatively, DRB Hicom could take Bank Muamalat down the listing route, which we expect could command a market capitalisation of close to RM1bn.
Company background: • Bank Muamalat is the second full-fledged Islamic bank
established in Malaysia, after Bank Islam. The bank is a product of combining the assets and liabilities of Islamic windows of three banks, i.e. Bank Bumiputra Malaysia (Bank Bumi), Bank of Commerce (M) and BBMB Kewangan. With an asset size of RM23bn, Bank Muamalat is one of the smallest banks in the industry.
• Bank Muamalat is jointly owned by DRB-Hicom (70%) and Khazanah Nasional (30%). DRB-Hicom is a conglomerate operating in Malaysia. Its subsidiaries include Pos Malaysia (POS MK Equity) and national carmaker, Proton. DRB-Hicom is in turn, 56% owned by Etika Strategi Sdn Bhd, a company controlled by a prominent businessman, Tan Sri Dato’ Seri Syed Mokhtar. Operationally, Bank Muamalat is led by CEO, Dato’ Haji Mohd Redza Shah Abdul Wahid.
• The three biggest segments of Bank Muamalat’s financing
portfolio are residential property, personal financing and working capital financing. Akin to Bank Rakyat and MBSB, Bank Muamalat is also granted access to the direct salary deduction code by Angkasa.
Long-awaited M&A play • Bank Muamalat has been widely touted as a potential merger
and acquisition candidate. This arose from the understanding that BNM had requested DRB-Hicom to pare down its stake to 40%. Bank Islam (2011), Affin (2013) and MBSB (2016) had made an attempt to acquire Muamalat, but no firm developments have materialised to date. Although Bank Muamalat is a small player in the industry as a whole, Muamalat is still within the top 10 (by asset size) among Islamic banks. Its asset size is bigger than Affin Islamic and if merged with MBSB, its Islamic asset size would eclipse Bank Islam’s.
Bank Muamalat: Financial summary
FYE Mar 2013 2014 2015 2016
Pre-provision profit (RM m)
238 163 159 273
Net Profit (RM m) 168 152 89 132
EPS (sen) 16.8 12.7 7.5 11.0
EPS Gth (%) 142.5 (24.5) (41.1) 47.7
BV Per Share (sen) 160 146 155 167
ROA (%) 0.8 0.8 0.4 0.6
ROE (%) 10.5 8.7 4.8 6.6 Impaired financing ratio (%)
2.50 2.18 2.48 2.21
Loan loss coverage (%)
102 102 83 89
CASA ratio (%) 20.6 24.4 24.3 24.3 Financing to deposit ratio (%)
57 69 70 75
Loan growth (%) 11.9 14.6 12.5 8.0
Deposit growth (%) 3.3 (5.9) 10.9 0.5 Source: Company, DBS Bank, AllianceDBS
Bank Muamalat: Financing portfolio
Source: Company, DBS Bank, AllianceDBS
Bank Muamalat: Financing and deposit growth vs FDR
Source: Company, DBS Bank, AllianceDBS
Hire purchase
6%
Mortgage31%
Personal use26%
Construction4%
Working capital24%
Others9%
21.0
11.9
14.6
12.5
8.0
11.9
3.3
(5.9
)
10.9
0.5
52 57
69 70 75
0
10
20
30
40
50
60
70
80
-10
-5
0
5
10
15
20
25
FY12
FY13
FY14
FY15
FY16
%%
Financing growth (LHS) Deposit growth (LHS)Financing to deposit ratio (RHS)
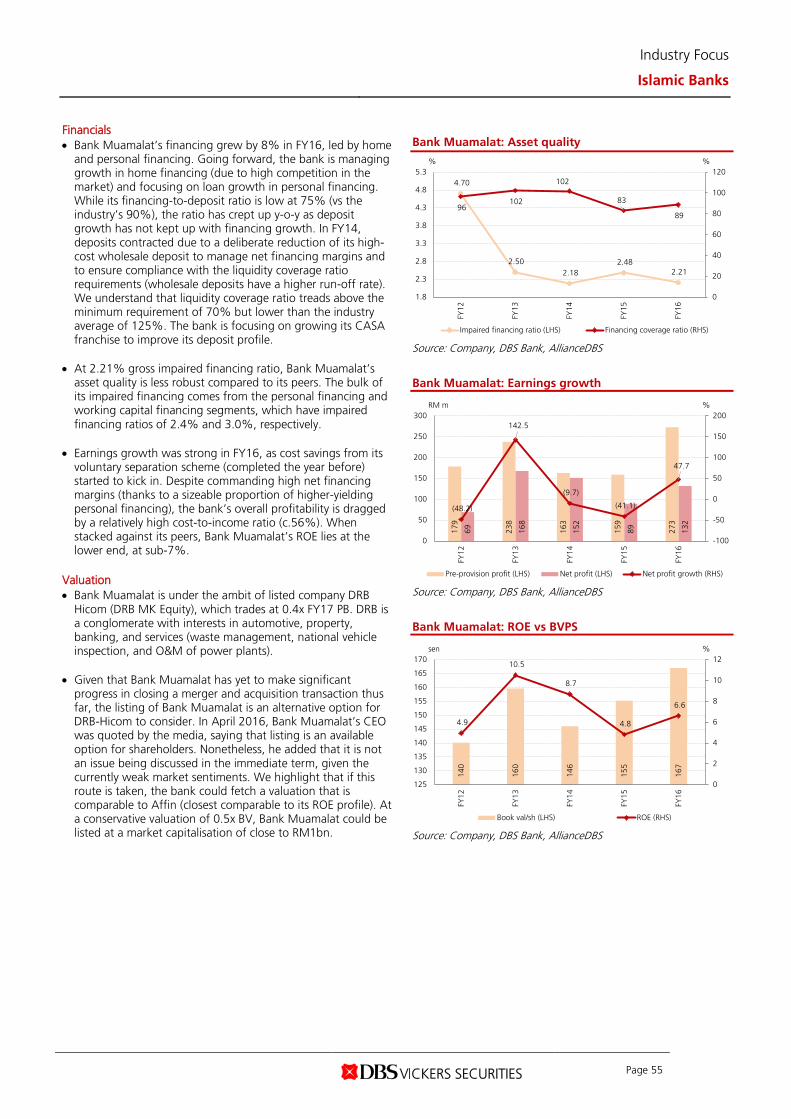
Industry Focus
Islamic Banks
Page 55
Financials • Bank Muamalat’s financing grew by 8% in FY16, led by home
and personal financing. Going forward, the bank is managing growth in home financing (due to high competition in the market) and focusing on loan growth in personal financing. While its financing-to-deposit ratio is low at 75% (vs the industry’s 90%), the ratio has crept up y-o-y as deposit growth has not kept up with financing growth. In FY14, deposits contracted due to a deliberate reduction of its high- cost wholesale deposit to manage net financing margins and to ensure compliance with the liquidity coverage ratio requirements (wholesale deposits have a higher run-off rate). We understand that liquidity coverage ratio treads above the minimum requirement of 70% but lower than the industry average of 125%. The bank is focusing on growing its CASA franchise to improve its deposit profile.
• At 2.21% gross impaired financing ratio, Bank Muamalat’s asset quality is less robust compared to its peers. The bulk of its impaired financing comes from the personal financing and working capital financing segments, which have impaired financing ratios of 2.4% and 3.0%, respectively.
• Earnings growth was strong in FY16, as cost savings from its
voluntary separation scheme (completed the year before) started to kick in. Despite commanding high net financing margins (thanks to a sizeable proportion of higher-yielding personal financing), the bank’s overall profitability is dragged by a relatively high cost-to-income ratio (c.56%). When stacked against its peers, Bank Muamalat’s ROE lies at the lower end, at sub-7%.
Valuation • Bank Muamalat is under the ambit of listed company DRB
Hicom (DRB MK Equity), which trades at 0.4x FY17 PB. DRB is a conglomerate with interests in automotive, property, banking, and services (waste management, national vehicle inspection, and O&M of power plants).
• Given that Bank Muamalat has yet to make significant progress in closing a merger and acquisition transaction thus far, the listing of Bank Muamalat is an alternative option for DRB-Hicom to consider. In April 2016, Bank Muamalat’s CEO was quoted by the media, saying that listing is an available option for shareholders. Nonetheless, he added that it is not an issue being discussed in the immediate term, given the currently weak market sentiments. We highlight that if this route is taken, the bank could fetch a valuation that is comparable to Affin (closest comparable to its ROE profile). At a conservative valuation of 0.5x BV, Bank Muamalat could be listed at a market capitalisation of close to RM1bn.
Bank Muamalat: Asset quality
Source: Company, DBS Bank, AllianceDBS
Bank Muamalat: Earnings growth
Source: Company, DBS Bank, AllianceDBS
Bank Muamalat: ROE vs BVPS
Source: Company, DBS Bank, AllianceDBS
4.70
2.50 2.18
2.48 2.21
96 102
102
83
89
0
20
40
60
80
100
120
1.8
2.3
2.8
3.3
3.8
4.3
4.8
5.3
FY12
FY13
FY14
FY15
FY16
%%
Impaired financing ratio (LHS) Financing coverage ratio (RHS)
179
238
163
159
273
69
168
152
89
132
(48.2)
142.5
(9.7)
(41.1)
47.7
-100
-50
0
50
100
150
200
0
50
100
150
200
250
300
FY12
FY13
FY14
FY15
FY16
%RM m
Pre-provision profit (LHS) Net profit (LHS) Net profit growth (RHS)
140
160
146
155
167
4.9
10.5
8.7
4.8
6.6
0
2
4
6
8
10
12
125
130
135
140
145
150
155
160
165
170
FY12
FY13
FY14
FY15
FY16
%sen
Book val/sh (LHS) ROE (RHS)
Industry Focus
Islamic Banks
Page 56
Appendix
Industry Focus
Islamic Banks
Page 57
OIC members: Selected economic data points (latest available data)
Country GDP Banking
penetration Population
Density Total
population Ages 0-14 Ages 15-
64 Ages 65+
Account at fin inst
Borrowed from fin inst
Unit USD per
capita % per sq km mil % of Total % of Total
% of Total
% of Total
% of Total
Afghanistan 668 10.0 50 32.5 44.0 53.5 2.5 10.0 3.6 Albania 4,634 38.0 105 2.9 18.6 69.1 12.4 38.0 10.2 Algeria 5,484 50.5 17 39.7 28.5 65.5 5.9 50.5 2.2 Azerbaijan 7,884 29.2 117 9.7 21.9 72.5 5.6 29.2 18.9 Bahrain 24,854 81.9 1,940 1.4 21.5 76.1 2.4 81.9 21.3 Bangladesh 1,088 29.1 1,237 161.0 29.5 65.6 5.0 29.1 9.9 Benin 903 16.0 98 10.9 42.2 55.0 2.9 16.0 7.6 Brunei 40,979 N/A 80 0.4 23.1 72.5 4.4 N/A N/A Burkina Faso 725 13.4 66 18.1 45.6 52.0 2.4 13.4 5.0 Cameroon 1,407 11.4 49 23.3 42.5 54.3 3.2 11.4 1.9 Chad 941 7.7 11 14.0 47.7 49.8 2.5 7.7 2.4 Comoros 841 21.7 424 0.8 40.3 56.9 2.8 21.7 7.2 Cote d'Ivoire 1,546 15.1 71 22.7 42.5 54.5 3.0 N/A 2.3 Djibouti 1,814 N/A 38 0.9 32.7 63.1 4.2 12.3 4.5 Egypt 3,151 N/A 92 91.5 33.2 61.6 5.2 13.7 6.3 Gabon 10,317 30.2 7 1.7 37.1 57.8 5.1 30.2 4.3 Gambia 441 N/A 199 2.0 46.2 51.5 2.3 N/A N/A Guinea 536 6.2 51 12.6 42.5 54.4 3.1 6.2 2.0 Guinea-Bissau 672 N/A 66 1.8 40.8 56.0 3.2 N/A N/A Guyana 4,040 N/A 4 0.8 28.8 66.2 5.0 N/A N/A Indonesia 3,492 35.9 142 257.6 27.7 67.1 5.2 35.9 13.1 Iran 5,443 N/A 49 79.1 23.6 71.3 5.1 92.2 31.6 Iraq 6,475 11.0 83 36.4 41.0 56.0 3.1 11.0 4.2 Jordan 5,423 24.6 86 7.6 35.5 60.7 3.8 24.6 13.6 Kazakhstan 12,496 53.9 7 17.5 26.7 66.6 6.7 53.9 16.5 Kuwait 43,600 72.9 218 3.9 22.3 75.7 2.0 72.9 14.1 Kyrgyzstan 1,269 N/A 31 6.0 31.4 64.4 4.2 18.5 13.5 Lebanon 10,916 46.9 572 5.9 24.0 67.9 8.1 46.9 15.6 Libya 6,602 N/A 4 6.3 29.8 65.6 4.5 N/A N/A Malaysia 10,934 80.7 92 30.3 25.0 69.1 5.9 80.7 19.5 Maldives 8,484 N/A 1,364 0.4 27.5 67.8 4.7 N/A N/A Mali 701 13.3 14 17.6 47.5 50.0 2.5 13.3 2.7 Mauritania 1,283 20.4 4 4.1 40.0 56.8 3.2 20.4 7.7 Morocco 3,243 39.1 48 34.4 27.2 66.6 6.2 39.1 4.3 Mozambique 628 N/A 36 28.0 45.3 51.4 3.4 N/A N/A Niger 427 3.5 16 19.9 50.5 47.0 2.6 3.5 1.4 Nigeria 3,203 44.2 200 182.2 44.0 53.3 2.7 44.2 5.3 Oman 19,310 73.6 15 4.5 20.5 76.9 2.6 73.6 9.2 Pakistan 1,358 8.7 245 188.9 35.0 60.5 4.5 8.7 1.5 Palestine 2,972 N/A 735 4.4 40.2 56.8 3.0 N/A N/A Qatar 97,519 65.9 193 2.2 15.5 83.3 1.2 65.9 12.6 Saudi Arabia 24,362 69.4 15 31.5 28.6 68.6 2.9 69.4 12.2 Senegal 1,067 11.9 79 15.1 43.8 53.3 2.9 11.9 3.5 Sierra Leone 775 14.1 90 6.5 42.4 55.0 2.7 14.1 4.0 Somalia 131 7.9 17 10.8 46.7 50.5 2.8 7.9 2.0 Sudan 2,081 15.3 17 40.2 40.5 56.2 3.3 15.3 4.2 Suriname 9,680 N/A 3 0.5 26.8 66.3 6.9 N/A N/A Syria 9,680 N/A 101 18.5 37.1 58.8 4.1 23.3 13.1 Tajikistan 1,114 11.5 61 8.5 34.8 62.2 3.0 11.5 3.8 Togo 643 17.6 134 7.3 42.2 55.0 2.8 17.6 3.7 Tunisia 4,313 27.3 72 11.1 23.4 69.1 7.6 27.3 8.0 Turkey 10,515 56.5 102 78.7 25.7 66.8 7.5 56.5 20.0 Turkmenistan 9,032 1.8 11 5.4 28.2 67.6 4.2 1.8 2.2 Uganda 727 27.8 198 39.0 48.1 49.4 2.5 27.8 15.7 United Arab Emirates 43,963 83.2 110 9.2 13.9 84.9 1.1 83.2 15.4 Uzbekistan 2,049 40.7 74 31.3 28.5 66.8 4.7 40.7 1.3 Yemen 1,418 N/A 51 26.8 40.3 57.0 2.8 6.4 0.4 OIC 4,012 31.9 10,009 1,726.3 34.0 61.9 4.0 31.7 8.4 Note: Percentage of adults with account in financial institution is used as a proxy to banking penetration Source: OIC, Global Findex 2014
Industry Focus
Islamic Banks
Page 58
Islamic banking: Industry benchmarking
Total assets
Gross financing
Total deposits
Net profit
Return on equity (ROE)
Return on assets (ROA)
Source: Companies, DBS Bank, AllianceDBS
156
92
57
55
46
44
41
38
26
23
19
15
13
11
11
10
7 3 0
20
40
60
80
100
120
140
160
180
MA
Y IS
L
BAN
K R
AK
YA
T
BIM
B
CIM
B IS
L
PUBL
IC IS
L
RHB
ISL
MBS
B
AM
ISL
HL
ISL
Mua
mal
at
HSB
C A
MA
N
OC
BC A
L-…
AFF
IN IS
L
SC S
AA
DIQ
KFH
ALL
CE
ISL
Al-R
ajhi
AFB
RM bn
130
63
40
34
32
32
31
27
18
15
12
10
9 7 7 7 5 1
0
20
40
60
80
100
120
140
MA
Y IS
L
BAN
K R
AK
YA
T
CIM
B IS
L
BIM
B
MBS
B
PUBL
IC IS
L
RHB
ISL
AM
ISL
HL
ISL
MU
AM
ALA
T
HSB
C A
MA
N
OC
BC A
L-…
AFF
IN IS
L
KFH
ALL
CE
ISL
SC S
AA
DIQ
AL-
RAJH
I
AFB
RM bn
145
73
48
44
41
40
31
30
23
20
14
13
12
10
9 8 6 2
0
20
40
60
80
100
120
140
160
MA
Y IS
L
BAN
K R
AK
YA
T
CIM
B IS
L
BIM
B
PUBL
IC IS
L
RHB
ISL
AM
ISL
MBS
B
HL
ISL
MU
AM
ALA
T
HSB
C A
MA
N
OC
BC A
L-…
AFF
IN IS
L
SC S
AA
DIQ
ALL
CE
ISL
KFH
AL-
RAJH
I
AFB
RM bn
1,82
4.1
1,21
2.5
547.
3
404.
0
340.
4
257.
6
254.
9
233.
0
197.
0
137.
6
131.
9
122.
1
84.8
52.4
14.5
11.8
0.5
-37.
2
-500
0
500
1,000
1,500
2,000
BAN
K R
AK
YA
T
MA
Y IS
L
BIM
B
CIM
B IS
L
PUBL
IC IS
L
MBS
B
RHB
ISL
AM
ISL
HL
ISL
OC
BC A
L-A
MIN
MU
AM
ALA
T
HSB
C A
MA
N
AFF
IN IS
L
ALL
CE
ISL
SC S
AA
DIQ
AL-
RAJH
I
AFB
KFH
RM m
16.0
14.7
14.0
13.0
11.5
11.2
10.9
10.2
8.8
8.4
6.6
6.4
5.3
5.1
2.5
1.6
0.1
(2.2
)
-5
0
5
10
15
20
BIM
B
MA
Y IS
L
OC
BC A
L-A
MIN
BAN
K R
AK
YA
T
PUBL
IC IS
L
CIM
B IS
L
HL
ISL
RHB
ISL
AM
ISL
HSB
C A
MA
N
MU
AM
ALA
T
ALL
CE
ISL
MBS
B
AFF
IN IS
L
SC S
AA
DIQ
AL-
RAJH
I
AFB
KFH
%
2.0
1.0
0.9
0.8
0.8
0.8
0.7
0.7
0.6
0.6
0.6
0.6
0.6
0.5
0.2
0.1
0.0
(0.3
)
-0.5
0.0
0.5
1.0
1.5
2.0
2.5
BAN
K R
AK
YA
T
BIM
B
OC
BC A
L-A
MIN
AFF
IN IS
L
MA
Y IS
L
HL
ISL
PUBL
IC IS
L
CIM
B IS
L
HSB
C A
MA
N
MBS
B
AM
ISL
MU
AM
ALA
T
RHB
ISL
ALL
CE
ISL
AL-
RAJH
I
SC S
AA
DIQ
AFB
KFH
%
Industry Focus
Islamic Banks
Page 59
Islamic banking: Industry benchmarking
Financing growth (y-o-y)
Deposit growth (y-o-y)
Net profit growth (y-o-y)
Pre-provision profit growth (y-o-y)
CASA ratio
Financing-to-deposit ratio
Source: Companies, DBS Bank, AllianceDBS
28
24
22
21
16
15
14
11
8 8 7
4 4 4 4
(1)
(5)
(15)
-20-15-10
-505
101520253035
AFF
IN IS
L
PUBL
IC IS
L
RHB
ISL
MA
Y IS
L
BIM
B
HL
ISL
HSB
C A
MA
N
CIM
B IS
L
OC
BC A
L-A
MIN
MU
AM
ALA
T
ALL
CE
ISL
MBS
B
KFH
BAN
K R
AK
YA
T
AL-
RAJH
I
AM
ISL
SC S
AA
DIQ
AFB
%
27
18
15
9
7 6 6 4 4 2 1 1 (5)
(7)
(10)
(13)
(14)
(21)
-30
-20
-10
0
10
20
30
PUBL
IC IS
L
HL
ISL
RHB
ISL
ALL
CE
ISL
CIM
B IS
L
MA
Y IS
L
BIM
B
MBS
B
BAN
K R
AK
YA
T
OC
BC A
L-A
MIN
AFF
IN IS
L
MU
AM
ALA
T
AM
ISL
AL-
RAJH
I
KFH AFB
HSB
C A
MA
N
SC S
AA
DIQ
%
145
95
48
42
27
14
8 3 3 (2)
(2)
(4) (8
)
(13)
(14)
(75)
(96)
(140
)
-200
-150
-100
-50
0
50
100
150
200
AL-
RAJH
I
OC
BC A
L-A
MIN
MU
AM
ALA
T
SC S
AA
DIQ
AFF
IN IS
L
RHB
ISL
MA
Y IS
L
CIM
B IS
L
BIM
B
HL
ISL
AM
ISL
PUBL
IC IS
L
BAN
K R
AK
YA
T
ALL
CE
ISL
HSB
C A
MA
N
MBS
B
AFB
KFH
%
71
31
24
21
19
16
15
14
9 6
2
(1)
(6)
(7)
(13)
(14)
(23)
(59)
-80
-60
-40
-20
0
20
40
60
80
MU
AM
ALA
T
AFF
IN IS
L
RHB
ISL
OC
BC A
L-A
MIN
KFH
MA
Y IS
L
HL
ISL
ALL
CE
ISL
AL-
RAJH
I
BIM
B
CIM
B IS
L
MBS
B
HSB
C A
MA
N
PUBL
IC IS
L
AM
ISL
BAN
K R
AK
YA
T
AFB
SC S
AA
DIQ
%
37
35
32
32
28
28
28
27
25
24
23
21
21
20
18
16
5
0
0
5
10
15
20
25
30
35
40
HSB
C A
MA
N
BIM
B
SC S
AA
DIQ
OC
BC A
L-…
AFF
IN IS
L
MA
Y IS
L
ALL
CE
ISL
CIM
B IS
L
HL
ISL
MU
AM
ALA
T
PUBL
IC IS
L
AM
ISL
AL-
RAJH
I
KFH AFB
RHB
ISL
BAN
K R
AK
YA
T
MBS
B
%
74
80
80
81
84
89
91
92
97
97
98 11
1
111 12
3
128 14
1
192
244
0
50
100
150
200
250
300
MU
AM
ALA
T
BIM
B
ALL
CE
ISL
PUBL
IC IS
L
HL
ISL
BAN
K R
AK
YA
T
CIM
B IS
L
AFF
IN IS
L
AM
ISL
OC
BC A
L-…
AL-
RAJH
I
RHB
ISL
MBS
B
MA
Y IS
L
HSB
C A
MA
N
AFB
KFH
SC S
AA
DIQ
%
Industry Focus
Islamic Banks
Page 60
Islamic banking: Industry benchmarking
Net financing margin
Cost-to-income ratio
Net credit cost
Gross impaired financing ratio
Financing loss coverage ratio
Capital ratios
Source: Companies, DBS Bank, AllianceDBS
3.2
3.0
3.0
2.4
2.4
2.3
2.1
2.1
2.1
1.9
1.8
1.7
1.7
1.7
1.6
1.6
1.2
1.2
0.0
0.5
1.0
1.5
2.0
2.5
3.0
3.5
MBS
B
OC
BC A
L-A
MIN
BAN
K R
AK
YA
T
BIM
B
MU
AM
ALA
T
HSB
C A
MA
N
AM
ISL
KFH
ALL
CE
ISL
CIM
B IS
L
MA
Y IS
L
PUBL
IC IS
L
HL
ISL
SC S
AA
DIQ
AFB
AFF
IN IS
L
RHB
ISL
AL-
RAJH
I
%
23 29
36
36
37
39
41 44
47
48
48
51 56
56 63
66
79 86
0102030405060708090
100
MBS
B
BAN
K R
AK
YA
T
RHB
ISL
MA
Y IS
L
PUBL
IC IS
L
OC
BC A
L-…
HL
ISL
CIM
B IS
L
ALL
CE
ISL
AFF
IN IS
L
AM
ISL
HSB
C A
MA
N
MU
AM
ALA
T
BIM
B
KFH AFB
SC S
AA
DIQ
AL-
RAJH
I
%
(3)
5
7 9 18
20
21
21
23
23
57
62
68
73
112 12
6 150
204
-50
0
50
100
150
200
250
AM
ISL
HL
ISL
AL-
RAJH
I
AFF
IN IS
L
RHB
ISL
MA
Y IS
L
BIM
B
PUBL
IC IS
L
CIM
B IS
L
SC S
AA
DIQ
MU
AM
ALA
T
ALL
CE
ISL
HSB
C A
MA
N
BAN
K R
AK
YA
T
AFB
OC
BC A
L-A
MIN
KFH
MBS
B
%
0.5
0.6
0.7
0.7 0.9
0.9 1.0
1.1
1.1
1.2 1.
5 1.9
1.9 2.2
2.2 2.
8
7.4
7.4
0
1
2
3
4
5
6
7
8
SC S
AA
DIQ
AL-
RAJH
I
PUBL
IC IS
L
MA
Y IS
L
HL
ISL
AFB
CIM
B IS
L
BIM
B
ALL
CE
ISL
RHB
ISL
AFF
IN IS
L
BAN
K R
AK
YA
T
HSB
C A
MA
N
AM
ISL
MU
AM
ALA
T
OC
BC A
L-…
MBS
B
KFH
%
331
307
294
175
149
110
109
97
96
92
89
89
89
85
75
65
61
53
0
50
100
150
200
250
300
350
SC S
AA
DIQ
AL-
RAJH
I
AFB
BIM
B
PUBL
IC IS
L
MA
Y IS
L
BAN
K R
AK
YA
T
ALL
CE
ISL
OC
BC A
L-…
MBS
B
HL
ISL
HSB
C A
MA
N
MU
AM
ALA
T
CIM
B IS
L
KFH
AM
ISL
RHB
ISL
AFF
IN IS
L
%
24
19 19
15 14 14 13 13 13 13 13 12 12 12 11 11 10 10
25
20
25
22
16 16
14
16
14 15 15
16 15
18
15 13 14
15
0
5
10
15
20
25
30
AFB
BAN
K R
AK
YA
T
KFH
AL-
RAJH
I
MU
AM
ALA
T
CIM
B IS
L
AFF
IN IS
L
SC S
AA
DIQ
ALL
CE
ISL
MBS
B
OC
BC A
L-A
MIN
MA
Y IS
L
BIM
B
HSB
C A
MA
N
RHB
ISL
PUBL
IC IS
L
HL
ISL
AM
ISL
%
Tier 1 Total Capital
Industry Focus
Islamic Banks
Page 61
Islamic Banking: Definition of terms
Terms Definitions or equivalent terms in conventional model Al-ijarah thumma al-bai (AITAB) Lease contract followed by ownership of asset through a sale contract Bai' bithaman ajil (BBA) Sale contract based on deferred payment at a certain price Bai' dayn Sale of debt Bai' 'inah Sale contract followed by repurchase by the seller at a different price Bai' salam Sale contract based on order of certain asset with certain specifications. Full payment is made in
cash at the time of conclusion of the contract whereas the delivery of the asset is deferred to a specific time
Bai' sarf Sale of currency Financing Loans Financing loss coverage Loan loss coverage Financing-to-deposit ratio Loans-to-deposit ratio Fund-based Income Interest income Ibra' Rebate/waiver of partial or total claim against certain right or debt Ijarah Lease or service contract that involves benefit/usufruct of certain asset or work for an agreed
payment or commission within an agreed period Impaired financing ratio Impaired loan ratio Istisna Sale contract by way of order for certain product with certain specifications and certain mode of
delivery and payment (either in cash or deferred) Kafalah Guarantee Mudarabah Profit-sharing contract Muqasah Offsetting Murabahah Sale contract with a disclosure of the asset cost price and profit margin to the buyer Musawamah Sale contract without the disclosure of the asset cost price and profit margin to the buyer Musyarakah Profit and loss sharing Net financing margin (NFM) Net interest margin Non Fund-based Income (Fee-based)
Non-interest income
Profit attributable to depositors Interest expense Profit rate Interest rates Qard Loan contract Rahn Pledge/charge Sukuk Bonds Tabarru' Voluntary donation/contribution Tawarruq/commodity murabahah Purchasing an asset with deferred price, either on the basis of musawamah or murabahah, then
selling it to a third party to obtain cash Wadi'ah Safe keeping a contract in which a party entrusted his property to another party for safe keeping
and to be returned upon request Wakaf A form of endowment by an owner of a property for public benefit and wellbeing which is allowed
by Shariah Wakalah Agency contract Zakat Almsgiving
Source: BNM, AllianceDBS
Industry Focus
Islamic Banks
Page 62
DBS Bank recommendations are based an Absolute Total Return* Rating system, defined as follows:
STRONG BUY (>20% total return over the next 3 months, with identifiable share price catalysts within this time frame)
BUY (>15% total return over the next 12 months for small caps, >10% for large caps)
HOLD (-10% to +15% total return over the next 12 months for small caps, -10% to +10% for large caps)
FULLY VALUED (negative total return i.e. > -10% over the next 12 months)
SELL (negative total return of > -20% over the next 3 months, with identifiable catalysts within this time frame)
Share price appreciation + dividends Completed Date: 18 Feb 2017 16:26:09 (MYT) Dissemination Date: 20 Feb 2017 08:53:38 (MYT)
GENERAL DISCLOSURE/DISCLAIMER
This report is prepared by DBS Bank Ltd. This report is solely intended for the clients of DBS Bank Ltd, DBS Vickers Securities (Singapore) Pte Ltd,
its respective connected and associated corporations and affiliates only and no part of this document may be (i) copied, photocopied or duplicated
in any form or by any means or (ii) redistributed without the prior written consent of DBS Bank Ltd.
The research set out in this report is based on information obtained from sources believed to be reliable, but we (which collectively refers to DBS
Bank Ltd, its respective connected and associated corporations, affiliates and their respective directors, officers, employees and agents (collectively,
the “DBS Group”)) do not make any representation or warranty as to its accuracy, completeness or correctness. Opinions expressed are subject to
change without notice. This document is prepared for general circulation. Any recommendation contained in this document does not have regard
to the specific investment objectives, financial situation and the particular needs of any specific addressee. This document is for the information of
addressees only and is not to be taken in substitution for the exercise of judgement by addressees, who should obtain separate independent legal
or financial advice. The DBS Group accepts no liability whatsoever for any direct, indirect and/or consequential loss (including any claims for loss of
profit) arising from any use of and/or reliance upon this document and/or further communication given in relation to this document. This
document is not to be construed as an offer or a solicitation of an offer to buy or sell any securities. The DBS Group, along with its affiliates and/or
persons associated with any of them may from time to time have interests in the securities mentioned in this document. The DBS Group may have
positions in, and may effect transactions in securities mentioned herein and may also perform or seek to perform broking, investment banking and
other banking services for these companies.
Any valuations, opinions, estimates, forecasts, ratings or risk assessments herein constitutes a judgment as of the date of this report, and there can be no assurance that future results or events will be consistent with any such valuations, opinions, estimates, forecasts, ratings or risk assessments. The information in this document is subject to change without notice, its accuracy is not guaranteed, it may be incomplete or condensed and it may not contain all material information concerning the company (or companies) referred to in this report and the DBS Group is under no obligation to update the information in this report. This publication has not been reviewed or authorized by any regulatory authority in Singapore, Hong Kong or elsewhere. There is no planned schedule or frequency for updating research publication relating to any issuer.
The valuations, opinions, estimates, forecasts, ratings or risk assessments described in this report were based upon a number of estimates and
assumptions and are inherently subject to significant uncertainties and contingencies. It can be expected that one or more of the estimates on
which the valuations, opinions, estimates, forecasts, ratings or risk assessments were based will not materialize or will vary significantly from actual
results. Therefore, the inclusion of the valuations, opinions, estimates, forecasts, ratings or risk assessments described herein IS NOT TO BE RELIED
UPON as a representation and/or warranty by the DBS Group (and/or any persons associated with the aforesaid entities), that:
(a) such valuations, opinions, estimates, forecasts, ratings or risk assessments or their underlying assumptions will be achieved, and
(b) there is any assurance that future results or events will be consistent with any such valuations, opinions, estimates, forecasts, ratings or risk
assessments stated therein.
Please contact the primary analyst for valuation methodologies and assumptions associated with the covered companies or price targets. Any assumptions made in this report that refers to commodities, are for the purposes of making forecasts for the company (or companies)
mentioned herein. They are not to be construed as recommendations to trade in the physical commodity or in the futures contract relating to the
commodity referred to in this report.
DBS Vickers Securities (USA) Inc ("DBSVUSA")"), a U.S.-registered broker-dealer, does not have its own investment banking or research
department, has not participated in any public offering of securities as a manager or co-manager or in any other investment banking transaction
in the past twelve months and does not engage in market-making.
Industry Focus
Islamic Banks
Page 63
ANANANANALYST CERTIFICATIONALYST CERTIFICATIONALYST CERTIFICATIONALYST CERTIFICATION
The research analyst(s) primarily responsible for the content of this research report, in part or in whole, certifies that the views about the
companies and their securities expressed in this report accurately reflect his/her personal views. The analyst(s) also certifies that no part of his/her
compensation was, is, or will be, directly, or indirectly, related to specific recommendations or views expressed in the report. The DBS Group has
procedures in place to eliminate, avoid and manage any potential conflicts of interests that may arise in connection with the production of
research reports. As of 20 Feb 2017, the analyst(s) and his/her spouse and/or relatives who are financially dependent on the analyst(s), do not hold
interests in the securities recommended in this report (“interest” includes direct or indirect ownership of securities). The research analyst(s)
responsible for this report operates as part of a separate and independent team to the investment banking function of the DBS Group and
procedures are in place to ensure that confidential information held by either the research or investment banking function is handled
appropriately.
COMPANYCOMPANYCOMPANYCOMPANY----SPECIFIC / REGULATORY DISCLOSURES SPECIFIC / REGULATORY DISCLOSURES SPECIFIC / REGULATORY DISCLOSURES SPECIFIC / REGULATORY DISCLOSURES
1. DBS Bank Ltd, DBS Vickers Securities (Singapore) Pte Ltd (''DBSVS''), their subsidiaries and/or other affiliates do not have a proprietary
position in the securities recommended in this report as of 31 Jan 2017.
2. DBS Bank Ltd does not market make in equity securities of the issuer(s) or company(ies) mentioned in this Research Report.
Compensation foCompensation foCompensation foCompensation for investment banking services: r investment banking services: r investment banking services: r investment banking services:
3. DBS Bank Ltd, DBSVS, their subsidiaries and/or other affiliates of DBSVUSA, within the next 3 months, will receive or intend to seek
compensation for investment banking services from Maybank as of 1 Jan 2017.
4. DBSVUSA does not have its own investment banking or research department, nor has it participated in any public offering of securities as a
manager or co-manager or in any other investment banking transaction in the past twelve months. Any US persons wishing to obtain further
information, including any clarification on disclosures in this disclaimer, or to effect a transaction in any security discussed in this document
should contact DBSVUSA exclusively.
Disclosure of previous investment recommendation produced:Disclosure of previous investment recommendation produced:Disclosure of previous investment recommendation produced:Disclosure of previous investment recommendation produced:
5. DBS Bank Ltd, DBS Vickers Securities (Singapore) Pte Ltd (''DBSVS''), their subsidiaries and/or other affiliates may have published other
investment recommendations in respect of the same securities / instruments recommended in this research report during the preceding 12
months. Please contact the primary analyst listed in the first page of this report to view previous investment recommendations published by
DBS Bank Ltd, DBS Vickers Securities (Singapore) Pte Ltd (''DBSVS''), their subsidiaries and/or other affiliates in the preceding 12 months.
RESTRICTIONS ON DISTRIBUTION RESTRICTIONS ON DISTRIBUTION RESTRICTIONS ON DISTRIBUTION RESTRICTIONS ON DISTRIBUTION
GeneralGeneralGeneralGeneral This report is not directed to, or intended for distribution to or use by, any person or entity who is a citizen or resident of or located in any locality, state, country or other jurisdiction where such distribution, publication, availability or use would be contrary to law or regulation.
AustraliaAustraliaAustraliaAustralia This report is being distributed in Australia by DBS Bank Ltd. (“DBS”) or DBS Vickers Securities (Singapore) Pte Ltd (“DBSVS”), both of which are exempted from the requirement to hold an Australian Financial Services Licence under the Corporation Act 2001 (“CA”) in respect of financial services provided to the recipients. Both DBS and DBSVS are regulated by the Monetary Authority of Singapore under the laws of Singapore, which differ from Australian laws. Distribution of this report is intended only for “wholesale investors” within the meaning of the CA.
Hong KongHong KongHong KongHong Kong This report is being distributed in Hong Kong by or on behalf of, and is attributable to DBS Vickers (Hong Kong) Limited which is licensed and regulated by the Hong Kong Securities and Futures Commission and/or by DBS Bank (Hong Kong) Limited which is regulated by the Hong Kong Monetary Authority and the Securities and Futures Commission. Where this publication relates to a research report, unless otherwise stated in the research report(s), DBS Bank (Hong Kong) Limited is not the issuer of the research report(s). This publication including any research report(s) is/are distributed on the express understanding that, whilst the information contained within is believed to be reliable, the information has not been independently verified by DBS Bank (Hong Kong) Limited. This report is intended for distribution in Hong Kong only to professional investors (as defined in the Securities and Futures Ordinance (Chapter 571 of the Laws of Hong Kong) and any rules promulgated thereunder.) For any query regarding the materials herein, please contact Paul Yong (CE. No. ASE988) at [email protected].
IndonesiaIndonesiaIndonesiaIndonesia This report is being distributed in Indonesia by PT DBS Vickers Sekuritas Indonesia.
MalaysiaMalaysiaMalaysiaMalaysia This report is distributed in Malaysia by AllianceDBS Research Sdn Bhd ("ADBSR"). Recipients of this report, received from ADBSR are to contact the undersigned at 603-2604 3333 in respect of any matters arising from or in connection with this report. In addition to the General Disclosure/Disclaimer found at the preceding page, recipients of this report are advised that ADBSR (the preparer of this report), its holding company Alliance Investment Bank Berhad, their respective connected and associated corporations, affiliates, their directors, officers, employees, agents and parties related or associated with any of them may have positions in, and may effect transactions in the securities mentioned herein and may also perform or seek to perform broking, investment banking/corporate advisory and other services for the subject companies. They may also have received compensation and/or seek to obtain compensation for broking, investment banking/corporate advisory and other services from the subject companies.
Wong Ming Tek, Executive Director, ADBSR
Industry Focus
Islamic Banks
Page 64
Singapore This report is distributed in Singapore by DBS Bank Ltd (Company Regn. No. 196800306E) or DBSVS (Company Regn No. 198600294G), both of which are Exempt Financial Advisers as defined in the Financial Advisers Act and regulated by the Monetary Authority of Singapore. DBS Bank Ltd and/or DBSVS, may distribute reports produced by its respective foreign entities, affiliates or other foreign research houses pursuant to an arrangement under Regulation 32C of the Financial Advisers Regulations. Where the report is distributed in Singapore to a person who is not an Accredited Investor, Expert Investor or an Institutional Investor, DBS Bank Ltd accepts legal responsibility for the contents of the report to such persons only to the extent required by law. Singapore recipients should contact DBS Bank Ltd at 6327 2288 for matters arising from, or in connection with the report.
Thailand This report is being distributed in Thailand by DBS Vickers Securities (Thailand) Co Ltd. Research reports distributed are only intended for institutional clients only and no other person may act upon it.
United Kingdom This report is produced by DBS Bank Ltd which is regulated by the Monetary Authority of Singapore. This report is disseminated in the United Kingdom by DBS Vickers Securities (UK) Ltd, ("DBSVUK"). DBSVUK is authorised and regulated by the Financial Conduct Authority in the United Kingdom. In respect of the United Kingdom, this report is solely intended for the clients of DBSVUK, its respective connected and associated corporations and affiliates only and no part of this document may be (i) copied, photocopied or duplicated in any form or by any means or (ii) redistributed without the prior written consent of DBSVUK. This communication is directed at persons having professional experience in matters relating to investments. Any investment activity following from this communication will only be engaged in with such persons. Persons who do not have professional experience in matters relating to investments should not rely on this communication.
Dubai
This research report is being distributed in The Dubai International Financial Centre (“DIFC”) by DBS Bank Ltd., (DIFC Branch) having its office at PO Box 506538, 3rd Floor, Building 3, East Wing, Gate Precinct, Dubai International Financial Centre (DIFC), Dubai, United Arab Emirates. DBS Bank Ltd., (DIFC Branch) is regulated by The Dubai Financial Services Authority. This research report is intended only for professional clients (as defined in the DFSA rulebook) and no other person may act upon it.
United States This report was prepared by DBS Bank Ltd. DBSVUSA did not participate in its preparation. The research analyst(s) named on this report are not registered as research analysts with FINRA and are not associated persons of DBSVUSA. The research analyst(s) are not subject to FINRA Rule 2241 restrictions on analyst compensation, communications with a subject company, public appearances and trading securities held by a research analyst. This report is being distributed in the United States by DBSVUSA, which accepts responsibility for its contents. This report may only be distributed to Major U.S. Institutional Investors (as defined in SEC Rule 15a-6) and to such other institutional investors and qualified persons as DBSVUSA may authorize. Any U.S. person receiving this report who wishes to effect transactions in any securities referred to herein should contact DBSVUSA directly and not its affiliate.
Other jurisdictions In any other jurisdictions, except if otherwise restricted by laws or regulations, this report is intended only for qualified, professional, institutional or sophisticated investors as defined in the laws and regulations of such jurisdictions.
DBS Bank Ltd
12 Marina Boulevard, Marina Bay Financial Centre Tower 3 Singapore 018982 Tel. 65-6878 8888
e-mail: [email protected] Company Regn. No. 196800306E