Embed Size (px)
Citation preview

MALAYSIA NATIONAL HEALTH ACCOUNTS
MINISTRY OF HEALTH (MOH) SUB-ACCOUNT
(1997 – 2009)

Published byMalaysia National Health Accounts (MNHA) UnitPlanning & Development DivisionMinistry of HealthLevel 6-9, Block E6, Parcel E,Precint 1, Federal GovernmentAdministrative Center,62590 Putrajaya, MalaysiaWebsite: www.moh.gov.my
ISSN 1985-711
© MOH 2011. All rights reserved.First published 2011
Enquiries concerning reproduction or interpretation of the contents of this publication should be directed to the Malaysia National Health Accounts Unit, Planning & Development Division, Ministry of Health Malaysia.
Printed in Malaysia

iiiMINISTRY OF HEALTH(MOH) SUB-ACCOUNT (1997-2009)
This Ministry of Health (MOH) sub-account is a new sub-set of Malaysia National Health Accounts (MNHA) data that is produced for the first time. It contains the MOH expenditure and revenue data over a time period from 1997 to 2009. The aim of this sub-account is to provide financial data beyond the MNHA framework for health policy and planning especially to government agency stakeholders. In addition to the outputs using the MNHA framework, a MOH sub-account framework was designed to produce a set of expected data under this sub-account.
The total MOH expenditure which is a composite of the operational and development expenditure is compared to total public sector expenditure and gross domestic product (GDP). The expenditure is then tabled as spending at various facilities and expenditure under multiple programmes and sub-activities. Furthermore the MOH sub-account provides the state expenditure disaggregation. The expenditures in some areas of special interest are also tabled separately. This includes expenditure at hospitals and various sub-activities under the public health services. For hospital expenditure, the results of the hospital cost accounting study conducted in 2002 were applied to produce the hospital functional disaggregation of curative care. It is hoped that in future the MNHA Unit will be able to repeat this specific study to provide better updates. Similarly the public health expenditure is disaggregated into the various activities related to maternal and child health, school health, communicable and non-communicable diseases and others. Expenditures for wages and pharmaceuticals under the MOH are also identified.
The total MOH revenue is the summation of collection from patients and other sources. This includes collection for both MOH inpatient and outpatient services. The revenue is usually sent back to the Treasury as part of the national consolidated fund. This is usually a very minimal amount compared to the actual expenditure under the ministry. There have been discussions to retain this revenue as an incentive to improve revenue collection and the data in this document becomes an important reference base for future changes.
The financial aid and technical expertise in support towards all the activities under the MOH sub-account have led to the production of this document. World Health Organization (WHO) kindly funded the consultancy under Dr. Ravindra P Rannan-Eliya from Institute of Health Policy in Sri Lanka who has been instrumental in the institutionalization of NHA in this country. The MNHA Unit wishes to express our extended gratitude to the financier, consultant and all those who assisted to materialize the MOH Sub-account.
Dr. Jameela ZainuddinHead of MNHA Unit,Planning & Development,Ministry of Health, Malaysia.
PREFACE

iv MALAYSIA NATIONAL HEALTH ACCOUNTS

vMINISTRY OF HEALTH(MOH) SUB-ACCOUNT (1997-2009)
CONTENTS
Preface
Contents
List of Figures
List of Tables
List of Abbreviations
iii
v
vi
v
ix
1 Background 1
2 Methodology 3
3 MOH Sub-Account Framework 4
4 Total MOH Expenditure 5
5 Expenditure At Facilities / Agencies 8
6 Expenditure By Activities Assigned To Programmes 15
7 MOH State Expenditure 19
8 MOH Expenditures By Providers And Functions 22
9 Interest Area ExpendituresMOH Wage ExpenditurePharmaceutical & Supplies ExpenditureHospital ExpendituresPublic Health Expenditures
25
10 Development Expenditure 44
11 Total MOH Revenue 46
Appendix 1 References 47
Appendix 2 Mapping of Cost Responsibility Centre Code To MNHA Code
48
Appendix 3 List of MOH Hospitals, 2009 49
Appendix 4 List of MOH Facilities 52
List of Committees and Members 55
vi MALAYSIA NATIONAL HEALTH ACCOUNTS
F 1.1 Total Health Expenditure as Per centage of GDP, 1997-2009 1
F 1.2 Public Private Share of Total Health Expenditure, 1997-2009 2
F 1.3 MOH Share of Total and Public Sector Expenditure, 1997-2009 2
F 4.1 Total MOH and MOH Expenditure as Per cent GDP, 1997-2009 6
F 4.2 Operational and Development Expenditure as Share of Total MOH Spending, 1997-2009
7
F 5.1 Total MOH Expenditure at Facilities / Agencies, 1997-2009 10
F 5.2 MOH Operational Expenditure at Facilities / Agencies, 1997-2009 10
F 5.3 Total MOH Expenditure at Facilities / Agencies, 2009 11
F 5.4 MOH Operational Expenditure at Facilities / Agencies, 2009 11
F 6.1 MOH Operational Expenditure by Activities Assigned to Programmes, 1997-2009 16
F 6.2 MOH Operational Expenditure by Activities Assigned to Programmes, 2009 16
F 7.1 Total MOH Expenditure by States, 2009 20
F 7.2 State Population and Per Capita Health Spending by MOH, 2009 21
F 8.1 Total MOH Expenditure by Providers of Health Care Services & Products, 2009 23
F 8.2 Total MOH Expenditure by Functions of Health Care Services & Products, 2009 23
F 9.1 Total Wage and MOH Operational Expenditure, 1997-2009 (RM Million) 26
F 9.2 Wage Expenditure by Programmes, 2009 (Per cent) 27
F 9.3 Pharmaceuticals & Supplies Vs Operating Expenditure, 1997-2009 (RM Million) 29
F 9.4 Medical Supplies Expenditure By Programmes, 1997-2009 (RM Million) 30
F 9.5 MOH Hospital Category By Services & Specialists 32
F 9.6 Category 1 Hospital Expenditure By Curative Care Services, 2009 33
F 9.7 Category 2 Median Hospital Expenditure By Curative Care Services, 2009 34
F 9.8 Category 3 Median Hospital Expenditure By Curative Care Services, 2009# 35
F 9.9 Category 4 Median Hospital Expenditure By Curative Care Services, 2009 36
F 9.10 Category 5 Median Hospital Expenditure By Curative Care Services, 2009 37
F 9.11 Category 6 Median Hospital Expenditure By Curative Care Services, 2009 38
F 9.12 Expenditure For Public Health Services & Promotion, 1997-2009 40
F 9.13 Expenditure For Various components of Public Health Services & Promotion, 2009 40
F 9.14 Expenditure For Various components of Communicable Disease, 2009 42
F 9.15 Expenditure For Food Safety and Drinking water Quality, 1997-2009 43
F 10.1 Expenditure of Various Projects under Development Expenditure, 2009 44
F 11.1 Total MOH Revenue, 2009 46
FIGURES
viiMINISTRY OF HEALTH(MOH) SUB-ACCOUNT (1997-2009)
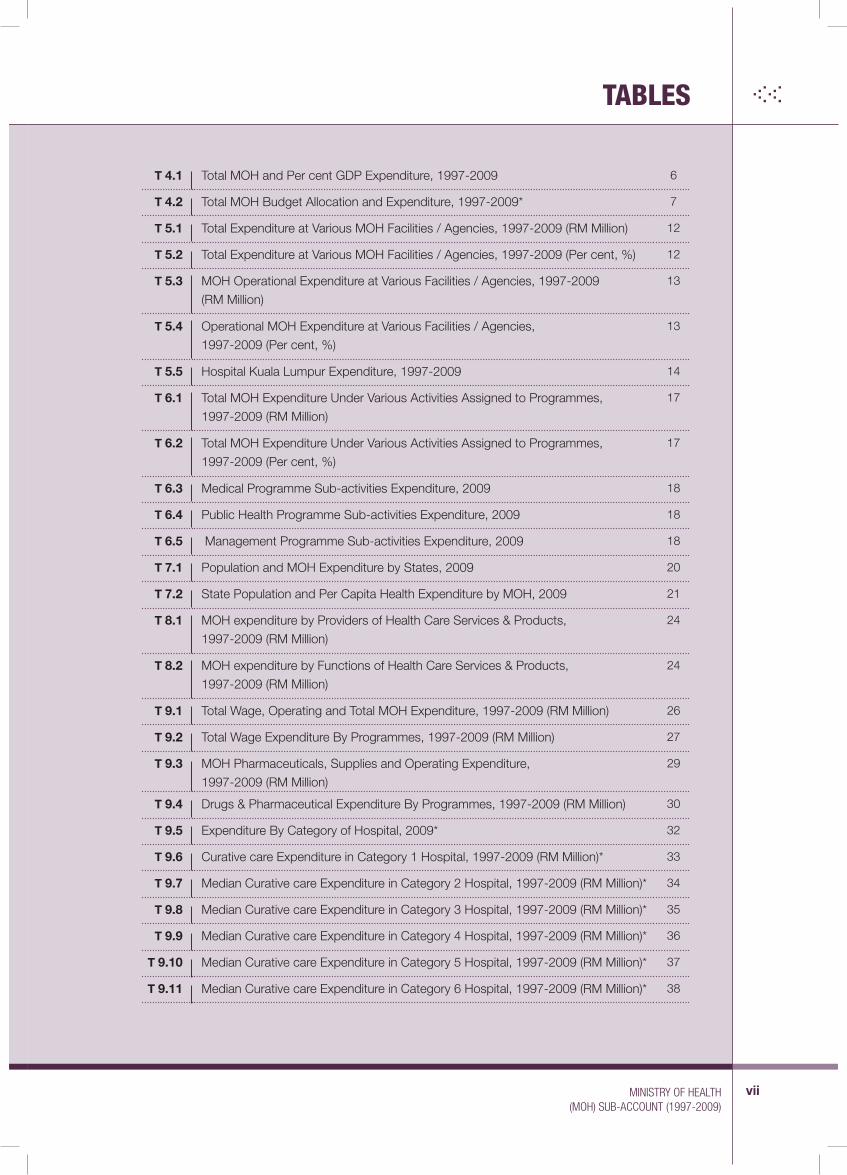
T 4.1 Total MOH and Per cent GDP Expenditure, 1997-2009 6
T 4.2 Total MOH Budget Allocation and Expenditure, 1997-2009* 7
T 5.1 Total Expenditure at Various MOH Facilities / Agencies, 1997-2009 (RM Million) 12
T 5.2 Total Expenditure at Various MOH Facilities / Agencies, 1997-2009 (Per cent, %) 12
T 5.3 MOH Operational Expenditure at Various Facilities / Agencies, 1997-2009(RM Million)
13
T 5.4 Operational MOH Expenditure at Various Facilities / Agencies,1997-2009 (Per cent, %)
13
T 5.5 Hospital Kuala Lumpur Expenditure, 1997-2009 14
T 6.1 Total MOH Expenditure Under Various Activities Assigned to Programmes,1997-2009 (RM Million)
17
T 6.2 Total MOH Expenditure Under Various Activities Assigned to Programmes,1997-2009 (Per cent, %)
17
T 6.3 Medical Programme Sub-activities Expenditure, 2009 18
T 6.4 Public Health Programme Sub-activities Expenditure, 2009 18
T 6.5 Management Programme Sub-activities Expenditure, 2009 18
T 7.1 Population and MOH Expenditure by States, 2009 20
T 7.2 State Population and Per Capita Health Expenditure by MOH, 2009 21
T 8.1 MOH expenditure by Providers of Health Care Services & Products,1997-2009 (RM Million)
24
T 8.2 MOH expenditure by Functions of Health Care Services & Products,1997-2009 (RM Million)
24
T 9.1 Total Wage, Operating and Total MOH Expenditure, 1997-2009 (RM Million) 26
T 9.2 Total Wage Expenditure By Programmes, 1997-2009 (RM Million) 27
T 9.3 MOH Pharmaceuticals, Supplies and Operating Expenditure,1997-2009 (RM Million)
29
T 9.4 Drugs & Pharmaceutical Expenditure By Programmes, 1997-2009 (RM Million) 30
T 9.5 Expenditure By Category of Hospital, 2009* 32
T 9.6 Curative care Expenditure in Category 1 Hospital, 1997-2009 (RM Million)* 33
T 9.7 Median Curative care Expenditure in Category 2 Hospital, 1997-2009 (RM Million)* 34
T 9.8 Median Curative care Expenditure in Category 3 Hospital, 1997-2009 (RM Million)* 35
T 9.9 Median Curative care Expenditure in Category 4 Hospital, 1997-2009 (RM Million)* 36
T 9.10 Median Curative care Expenditure in Category 5 Hospital, 1997-2009 (RM Million)* 37
T 9.11 Median Curative care Expenditure in Category 6 Hospital, 1997-2009 (RM Million)* 38
TABLES

viii MALAYSIA NATIONAL HEALTH ACCOUNTS
T 9.12 Expenditures for Public Health Services, 1997-2009 (RM Million) 41
T 9.13 Expenditures for Public Health Services, 1997-2009 (Per cent, %) 41
T 9.14 Expenditure for Components of Communicable Diseases, 1997-2009 (RM Million) 42
T 9.15 Expenditure for Other Components of Public Health Services, 1997-2009(RM Million)
43
T 10.1 Expenditure for Projects under Development Expenditure, 1997-2009 (RM Million) 45
T 11.1 MOH Patient and Non-patient Revenue, 1997-2009 46
ixMINISTRY OF HEALTH(MOH) SUB-ACCOUNT (1997-2009)
AG Accountant-General
CD Communicable Diseases
CRCC Cost Responsibility Centre Code
DOS Department of Statistics
GDP Gross Domestic Product
GOM Government of Malaysia
HIC Health Informatics Center
HIV/AIDS Human Immunodeficiency Virus/Acquired Immune Deficiency Syndrome
HKL Kuala Lumpur Hospital
HQ Headquarters
HR Human Resources
ICT Information and Communication Technology
JKN Jabatan Kesihatan Negeri (State Health Office)
MCH Maternal and Child Health
MF MNHA Code for Functions of Health Services
MNHA Malaysia National Health Accounts
MOH Ministry of Health
MOHE Ministry of Higher Education
NCD Non-Communicable Diseases
NHA National Health Accounts
NIH National Institutes of Health
NRI National Respiratory Institute
P&D Planning and Development
PH Public Health
PTJ code Kod Pusat Tanggung Jawab (Cost Responsibility Centre Code)
R&D Research & Development
RM Ringgit Malaysia (Malaysia Currency)
SODO code Specific Object and Detailed Object code
TCM Traditional Complementary Medicines
Vs Versus
W.P Wilayah Persekutuan (Federal Territories)
WHO World Health Organisation
ABBREVIATIONS

1 MALAYSIA NATIONAL HEALTH ACCOUNTS
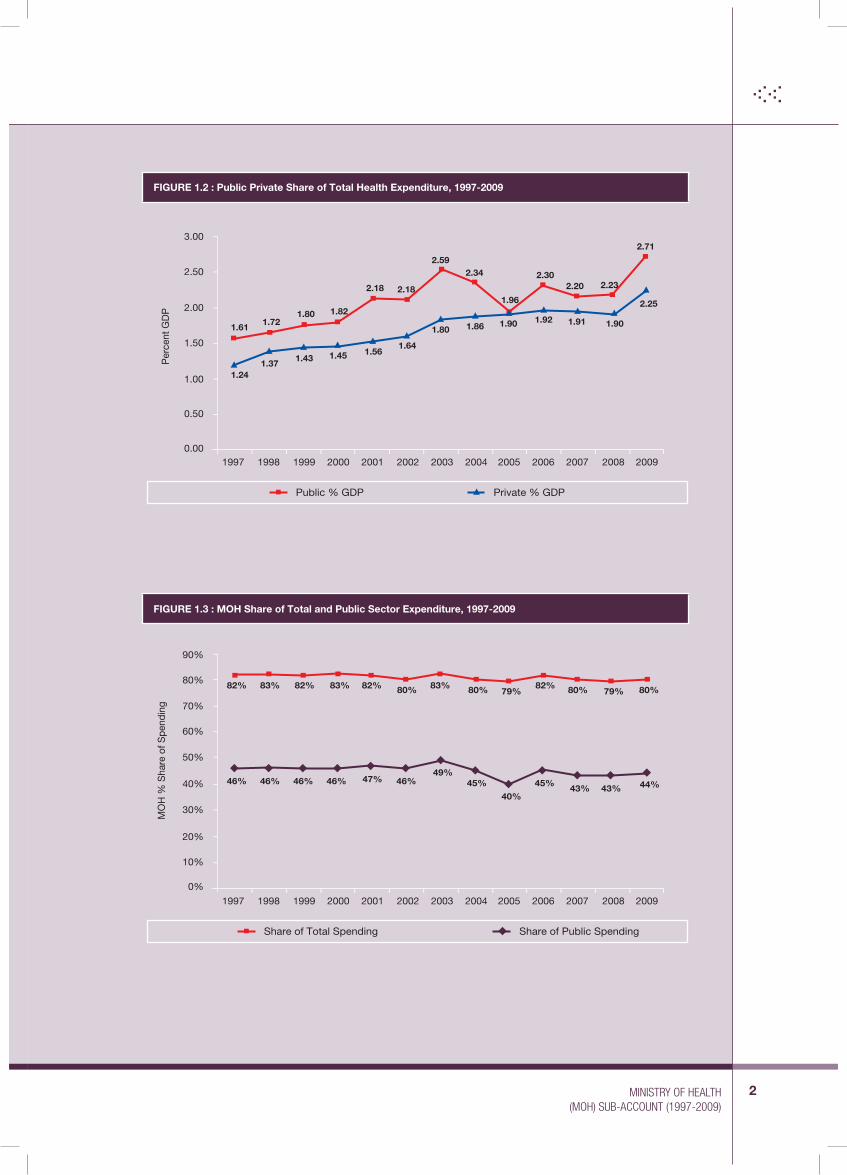
Currently the Malaysia National Health Accounts (MNHA) has a database of national health expenditure for a thirteen year period spanning from 1997 to 2009. This data shows that the total health expenditure has increased from RM8,045 million or 2.85% GDP in 1997 to RM33,691 million or 4.96% GDP in 2009 (Figure 1.1). In 2009 the public share was 2.71% GDP whereas the private share was 2.25% GDP (Figure 1.2). Throughout 1997 to 2009, although both the public and private sector expenditures have been on the upward trend, the public share has remained higher than the private share of expenditure.
The public share of expenditure is a composite of expenditures by several sources of financing for health care services and products ranging from the Ministry of Health (MOH), Ministry of Higher Education (MOHE), government statutory bodies and other government agencies. The MNHA 1997 - 2009 time series data shows that the MOH remains the largest single funder throughout this period contributing to about 40-50% of the total health expenditure or around 80% of public sector expenditure (Figure 1.3). As a result policy makers and other stakeholders often require further disaggregated data beyond the MNHA framework. This MOH Sub-account document is produced to meet this need.
Background
CHAPTER 1
Public
FIGURE 1.1 : Total Health Expenditure as Percentage of GDP, 1997-2009
RM
(Mill
ion)
% G
DP
1997 1998 1999 2000 2001 2002 2003 2004 2005 2006 2007 2008 2009
2,000
0
4,000
6,000
8,000
10,000
12,000
14,000
16,000
18,000
20,000
1.00
0.00
2.00
3.00
5.00
6.00
2.853.09
3.23 3.26
3.74 3.81
4.394.20
3.854.22 4.11
4.124.96
Private TEH % GDP
2MINISTRY OF HEALTH(MOH) SUB-ACCOUNT (1997-2009)
Public % GDP Private % GDP
FIGURE 1.2 : Public Private Share of Total Health Expenditure, 1997-2009
Per
cent
GD
P
1.61
1.241.37
1.43 1.45 1.561.64
1.80 1.86 1.90 1.901.92 1.91
2.25
1.721.80
2.18
2.592.34
1.96
2.302.20 2.23
2.71
1997 1998 1999 2000 2001 2002 2003 2004 2005 2006 2007 2008 2009
1.82
2.18
0.50
0.00
1.00
1.50
2.00
2.50
3.00
FIGURE 1.3 : MOH Share of Total and Public Sector Expenditure, 1997-2009
MO
H %
Sha
re o
f Spe
ndin
g
1997 1998 1999 2000 2001 2002 2003 2004 2005 2006 2007 2008 2009
10%
0%
20%
30%
40%
50%
60%
70%
80%
90%
Share of Total Spending Share of Public Spending
82%
46% 46% 46% 46% 46%49%
45% 45%43% 43% 44%
40%
47%
82% 82% 82%79% 79%80% 80% 80% 80%83% 83% 83%
3 MALAYSIA NATIONAL HEALTH ACCOUNTS
Methodology
The Accountant-General (AG) raw database for the MOH is the primary source of data in this MOH Sub-account. An analysis framework was designed specifically based on this database to extract the necessary data. This analysis framework was based on two pathways of data retrieval from the raw AG database, one using the MNHA framework and the other using the existing accounting system in the MOH. In addition, several related references including the Annual MOH budget allocation document were also used (Appendix 1). Multiple dummy tables were finally populated to produce the various tables and figures of potential policy importance.
The MNHA framework is adapted from the System of Health Accounts framework whereby all health expenditure is captured in a tri-axial coding system under the dimensions of sources of funding, providers and functions of health services and products. The existing accounting system in the MOH uses the coding system designed for the MOH and other general codes produced by the Treasury for all government agencies. This existing coding system includes the Cost Responsibility Centre Codes or Kod Pusat Tanggung Jawab (CRCC or PTJ code) and the programme and activities codes specific to the MOH. Furthermore, the Specific Object and Detailed Object (SODO) codes produced by the Treasury allow some detailed disaggregation of the expenditures.
Universal sampling of all data from 1997 till 2009 ensured there was comprehensive tracking and reporting of total health expenditures and revenues under the MOH. The raw data from AG were submitted in several formats which had to be merged into one dataset for the years 1997 to 2009. This master dataset then had to be cleaned before analysis. A MOH sub-account framework was designed based on potential policy implications. Several dummy tables were designed to retrieve the data according to the expected outputs of the sub-account framework.
Since the MOH raw database is large, the analysis was mainly carried out using the software Stata with some minimal use of Microsoft Excel. Multiple Stata programmes were written to extract the necessary data. No extrapolation or interpolation methods of National Health Account (NHA) were used for any data gaps so as to reflect the real expenditure. Clarifications regarding fund flows and the actual expenditures were made with several individuals, various divisions and multiple units of the MOH as problems and issues sprouted during the analysis period.
CHAPTER 2

4MINISTRY OF HEALTH(MOH) SUB-ACCOUNT (1997-2009)
MOH Sub-Account Framework
The MOH sub-account framework is a format to report the time series MOH expenditure and revenue data. The aim of this reporting format is to provide information on spending and collection trends within the MOH. Such information is important for financial related policy decisions, budget planning and also future projections for health financial reforms.
The total MOH expenditure is the summation of the operating and development expenditures. The government accounting system records the MOH operating or recurrent expenditure under the code B42 (previously B34) and the MOH development expenditure as P42 code (previously B42).
The total MOH expenditure can be reported by expenditures at various facilities or agencies, or expenditures by Programmes and Activities. The expenditures at the facilities can be disaggregated to operational and development expenditure. The MOH sub-account framework further provides MOH disaggregation of expenditure by state level, MOH expenditure under the MNHA framework, namely by the dimensions of provider and function of healthcare services and products, and lastly some expenditures on areas of interest.
It is important to note that the expenditures reported under the various formats in this sub-account may have some limitations due to the complex accounting system in a large ministry with multiple types and levels of activities. This MOH sub-account is based on expenditures as recorded under particular codes and may not reflect the exact situation. However, the sub-account provides a rather accurate financial trend of the spending. As an example, expenditure at a certain facility can be channelled to another facility based on priority needs. Similarly the movement of activities under one programmes to another can also affect the expenditure patterns. There are some facilities which in the past years may have had their financial resources recorded as part of another facility. Examples of these situations can be seen in expenditures reported under the facilities such as District Dental Office or expenditures reported under Oral Health Programme. These limitations must be considered when reference is made to the data in this document.
In addition to the expenditure data, the MOH sub-account framework also produce the total revenue collected at the various facilities. These revenue are usually chanelled back to the Treasury as part of the Government Consolidated Funds.
All the data on expenditure and revenue are from the period 1997 till 2009 and is reported in nominal ringgit value. Various tables and figures are used to display the MOH sub-account data. Some of the figures on proportions have been adjusted to total up to 100 per cent. Components on tables may not add to total of 100 per cent due to rounding up. Also, the sub-account database is a large database of the MOH disaggregated expenditure and only some examples are produced in this document.
CHAPTER 3

5 MALAYSIA NATIONAL HEALTH ACCOUNTS
Total MOH Expenditure
The total MOH expenditure over the 1997 to 2009 time period shows an upward trend with expenditure increase from RM3,707 million in 1997 to RM14,713 million in 2009 (Figure 4.1 and Table 4.1). This is equivalent rise of 1.32% GDP in 1997 to 2.16% GDP in 2009. This total expenditure consists of both operational and development expenditure. The share of development to total expenditure fluctuates over the time period with a minimum of RM1,467 million in 2008 or 11% of total to a maximum of RM2,690 million in 2003 or 30% of total MOH expenditure (Figure 4.2 and Table 4.2). Also in general the expenditure data when compared to the budget allocation shows some variation with operational expenditure slightly exceeding the allocation and development expenditure slightly under the allocation.
CHAPTER 4

6MINISTRY OF HEALTH(MOH) SUB-ACCOUNT (1997-2009)
TABLE 4.1 : Total MOH and Per cent GDP Expenditure, 1997-2009
Year Total Health Expenditure (RM Million) % GDP Total GDP (RM Million)*
1997 3,707 1.32 281,795
1998 4,033 1.42 283,243
1999 4,450 1.48 300,764
2000 5,367 1.51 356,401
2001 6,251 1.77 352,579
2002 6,670 1.74 383,213
2003 9,013 2.15 418,769
2004 8,917 1.88 474,048
2005 8,060 1.54 522,445
2006 10,838 1.89 574,441
2007 11,243 1.75 642,049
2008 13,036 1.76 742,470
2009 14,713 2.16 679,938
Source: *Department of Statistics Malaysia
FIGURE 4.1 : Total MOH and MOH Expenditure as Per cent GDP, 1997-2009
RM
Mill
ion
1997 1998 1999 2000 2001 2002 2003 2004 2005 2006 2007 2008 2009
2,000
0
4,000
6,000
8,000
10,000
12,000
14,000
16,000
0.00
0.50
1.00
1.50
2.00
2.50
Total MOH (RM Million) GDP
% G
DP1.32 1.42 1.48 1.51
1.77 1.74
2.15
1.88 1.891.75
1.76
2.16
1.54

7 MALAYSIA NATIONAL HEALTH ACCOUNTS
TABLE 4.2 : Total MOH Budget Allocation and Expenditure, 1997-2009*
YearOperational Development
Allocation (RM Million)
Expenditure (RM Million)
Allocation (RM Million)
Expenditure (RM Million)
1997 3,236 3,258 579 449
1998 3,359 3,316 733 716
1999 3,612 3,615 900 835
2000 4,214 4,091 1,290 1,276
2001 4,631 4,680 1,500 1,570
2002 5,139 5,157 1,715 1,514
2003 5,786 6,322 1,990 2,690
2004 7,026 6,686 2,643 2,231
2005 7,302 6,866 1,197 1,194
2006 8,206 9,538 1,297 1,300
2007 9,572 9,772 1,629 1,471
2008 10,880 11,569 2,222 1,467
2009 11,863 12,173 2,567 2,540
Note: *This expenditure data is extracted from the MNHA Framework and is based on AG database
Operating Expenditure
FIGURE 4.2 : Operational and Development Expenditure as Share of Total MOH Spending, 1997-2009 %
Sha
re o
f Tot
al M
OH
1997 1998 1999 2000 2001 2002 2003 2004 2005 2006 2007 2008 2009
10%
0%
20%
30%
40%
50%
60%
70%
80%
90%
100%
Development Expenditure
12% 18% 19% 24% 25% 23% 30% 25% 15% 12% 13% 11% 17%

8MINISTRY OF HEALTH(MOH) SUB-ACCOUNT (1997-2009)
Expenditure At Facilties / Agencies
The MOH expenditure can be disaggregated to the spending at various facilities or agencies based on the RCC or PTJ codes. The existing code system allows the breakdown of expenditures at 11 facilities or agencies (Appendix 4). The functions of these facilities are explained briefly.
1. Headquarters (Ibu Pejabat) This is the federal level which comprises of all the various divisions under the MOH. The
offices are mostly situated at Putrajaya and they carry out the macro level administrative functions of the ministry such as policy settings, programme developments, budget allocations, service and facility planning and other activities.
2. State Health Offices (Jabatan Kesihatan Negeri) Every state has a state health office that is responsible for the implementation of all federal
policies and programmes in their respective states. These offices also convey the state special needs to the federal level for support and resource allocations.
3. District Health Offices (Pejabat Kesihatan Negeri) Every state health office has several district health offices that tend to all the medical health
needs especially the public health or community health services of the population under their district. These health services are rendered to the population through several clinics such as health clinics, maternal and child health clinics, and 1Malaysia clinics.
4. District Dental Offices (Pejabat Pegawai Pergigian Daerah) These are newly established facilities in some states that tend to all the dental health needs
of the population under their district. There are states with dental clinics as a part of the medical clinics.
5. Division of Vector Borne Diseases (Cawangan Kawalan Penyakit Bawaan Vektor) This division with offices at the federal level and some states are responsible for all the vector
borne diseases which includes dengue, malaria, leptospirosis, chikungunya, filariasis, and others. In some states this function is under the Public Health Services of the State Health Office.
6. Hospitals The State Health Office oversees to all the hospital needs under their respective states and
they are under the administrative control of the Medical Division of the MOH at the federal level.
7. Public Health Laboratories (Makmal Kesihatan Awam) These laboratories provide services to both the MOH hospitals and clinics and are
regionalized for cost efficiency.
CHAPTER 5

9 MALAYSIA NATIONAL HEALTH ACCOUNTS
8. Research Institutions There are 6 institutes under the National Institutes of Health (NIH) that specializes in
providing training and are involved in Research and Development (R&D) for healthcare services in the country.
9. National Blood Bank The main objective in the establishment of the National Blood Bank is the provision of
blood supplies to all public hospitals and registered private hospitals in the Klang Valley.
10. Petaling Jaya (PJ) Pharmacy Division & Sarawak Pharmaceutical Laboratory These are the 2 specific divisions that cater for pharmaceutical services in the country.
11. Nursing & Allied Health Colleges Most of the public sector training for these categories of healthcare providers is conducted
by these colleges.
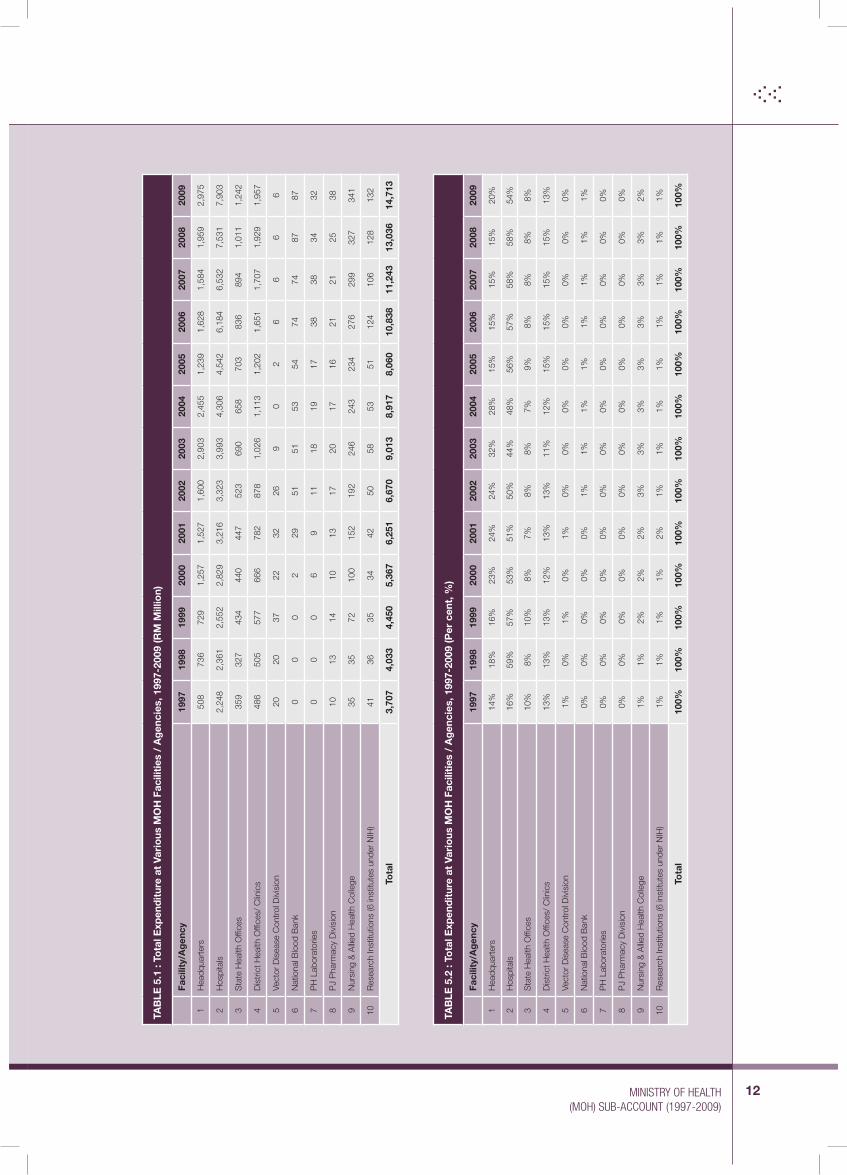
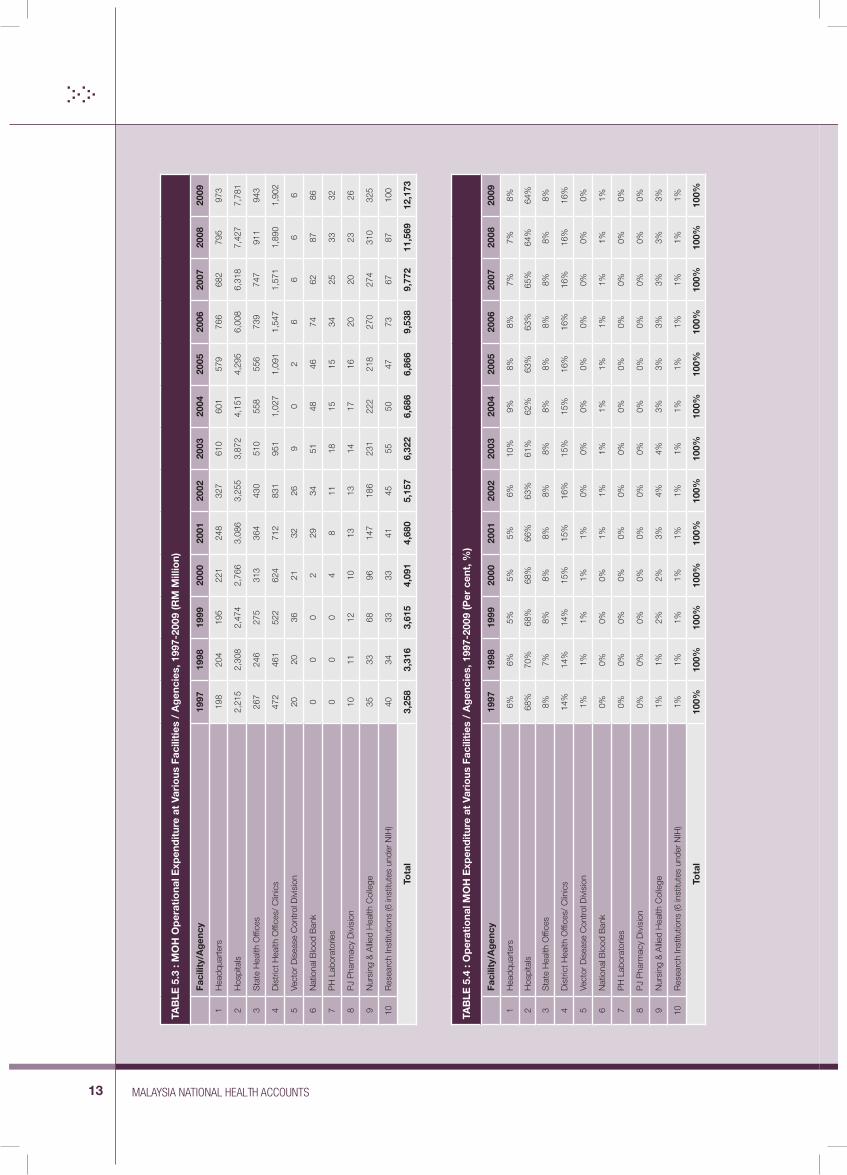
The 1997-2009 time series MOH sub-account shows that all facility expenditure has been on the upward trend. Hospitals had the highest share of spending in the total MOH expenditure with a steeper increase than any other facility especially over the last five years (Figure 5.1 and Table 5.1). The next highest is expenditures at headquarters with fluctuating expenditure pattern which is mostly affected by the development expenditure. If the development expenditure is excluded, the expenditure at district health offices or clinics exceeds that at headquarters (Figure 5.2). As an example, in 2009, the total hospital expenditure was RM7,903 million or 54% of MOH expenditure followed by headquarters expenditure at RM2,975 million or 20% (Figure 5.3). The exclusion of development expenditure drops the hospital expenditure to RM7,781 million or 64% share of operational expenditure and the headquarters expenditure to RM973 million or 8% (Figure 5.4).
However, although the hospital expenditure in absolute ringgit value is on the upward trend, as a share of total or operational expenditure it shows a downward trend (Table 5.2). Hospital expenditure share of the total MOH expenditure decreased from 61% in 1997 to 54% in 2009. Similarly hospital share of the MOH operational expenditure decreased from 68% in 1997 to 64% in 2009 (Table 5.3 & Table 5.4). All the other facilities spent less than RM1,000 million each throughout the time period.
Besides the 11 groups of facility expenditure disaggregation to operational and development expenditure, the MOH sub-account is able to produce the operational and expenditure trends of each component of the 11 groups of facilities and several comparable expenditure data can be produced for stakeholders. A comprehensive list of the facilities is provided in Appendix 1 - 4. As an example, there are a total of 137 MOH hospitals. The operational and development expenditure at Kuala Lumpur Hospital is given as an example of the possible data that can be produced (Table 5.5).

10MINISTRY OF HEALTH(MOH) SUB-ACCOUNT (1997-2009)
HospitalsHeadquarters State Health Of�ces
FIGURE 5.1 : Total MOH Expenditure at Facilities / Agencies, 1997-2009
RM
Mill
ion
1997 1998 1999 2000 2001 2002 2003 2004 2005 2006 2007 2008 2009
1,000
0
2,000
3,000
4,000
5,000
6,000
7,000
8,000
9,000
District Health Of�ces/Clinics All other Facilities
Hospitals State Health Of�ces
RM
Mill
ion
1997 1998 1999 2000 2001 2002 2003 2004 2005 2006 2007 2008 2009
1,000
0
2,000
3,000
4,000
5,000
6,000
7,000
8,000
9,000
Headquarters
District Health Of�ces/Clinics All other Facilities
FIGURE 5.2 : MOH Operational Expenditure at Facilities / Agencies, 1997-2009

11 MALAYSIA NATIONAL HEALTH ACCOUNTS
FIGURE 5.3 : Total MOH Expenditure at Facilities / Agencies, 2009
Hospitals
District Health Of�ces/Clinics
State Health Of�ces
All Other FacilitiesHeadquarters
54%
13%
8%5%
20%
TotalMOH Expenditure(RM14,713 million)
Hospitals
District Health Of�ces/Clinics
State Health Of�ces
All Other FacilitiesHeadquarters
64%
8%
8%4%
16%
FIGURE 5.4 : MOH Operational Expenditure at Facilities / Agencies, 2009
MOH OperationalExpenditure
(RM12,173 million)
12MINISTRY OF HEALTH(MOH) SUB-ACCOUNT (1997-2009)
TAB
LE 5
.1 :
Tota
l Exp
end
itur
e at
Var
ious
MO
H F
acili
ties
/ A
gen
cies
, 199
7-20
09 (R
M M
illio
n)
Faci
lity/
Ag
ency
19
9719
9819
9920
0020
0120
0220
0320
0420
0520
0620
0720
0820
09
1H
eadq
uart
ers
508
736
729
1,25
7 1,
527
1,60
0 2,
903
2,45
5 1,
239
1,62
8 1,
584
1,95
9 2,
975
2H
ospi
tals
2,24
8 2,
361
2,55
2 2,
829
3,21
6 3,
323
3,99
3 4,
306
4,54
2 6,
184
6,53
2 7,
531
7,90
3
3S
tate
Hea
lth O
ffice
s35
932
7 43
4 44
0 44
752
369
065
8 70
383
6 89
41,
011
1,24
2
4D
istr
ict H
ealth
Offi
ces/
Clin
ics
486
505
577
666
782
878
1,02
6 1,
113
1,20
2 1,
651
1,70
7 1,
929
1,95
7
5Ve
ctor
Dis
ease
Con
trol
Div
isio
n20
2037
2232
269
02
6 6
66
6N
atio
nal B
lood
Ban
k0
00
229
5151
5354
7474
8787
7P
H L
abor
ator
ies
00
06
911
1819
1738
3834
32
8P
J P
harm
acy
Div
isio
n10
1314
1013
1720
1716
2121
2538
9N
ursi
ng &
Allie
d H
ealth
Col
lege
3535
7210
015
219
224
624
323
427
629
932
734
1
10R
esea
rch
Inst
itutio
ns (6
inst
itute
s un
der
NIH
)41
3635
3442
5058
5351
124
106
128
132
Tota
l3,
707
4,03
3 4,
450
5,36
7 6,
251
6,67
0 9,
013
8,91
7 8,
060
10,8
38
11,2
43
13,0
36
14,7
13
TAB
LE 5
.2 :
Tota
l Exp
end
itur
e at
Var
ious
MO
H F
acili
ties
/ A
gen
cies
, 199
7-20
09 (P
er c
ent,
%)
Faci
lity/
Ag
ency
19
9719
9819
9920
0020
0120
0220
0320
0420
0520
0620
0720
0820
09
1H
eadq
uart
ers
14%
18%
16%
23
%
24%
24
%
32%
28
%
15%
15
%
15%
15
%
20%
2H
ospi
tals
16%
59%
57%
53
%
51%
50
%
44%
48
%
56%
57
%
58%
58
%
54%
3S
tate
Hea
lth O
ffice
s10
%8%
10%
8%
7%
8%
8%
7%
9%
8%
8%
8%
8%
4D
istr
ict H
ealth
Offi
ces/
Clin
ics
13%
13%
13%
12
%
13%
13
%
11%
12
%
15%
15
%
15%
15
%
13%
5Ve
ctor
Dis
ease
Con
trol
Div
isio
n1%
0%1%
0%
1%
0%
0%
0%
0%
0%
0%
0%
0%
6N
atio
nal B
lood
Ban
k0%
0%0%
0%0%
1%
1%
1%
1%
1%
1%
1%
1%
7P
H L
abor
ator
ies
0%0%
0%0%
0%0%
0%0%
0%0%
0%0%
0%
8P
J P
harm
acy
Div
isio
n0%
0%0%
0%0%
0%0%
0%0%
0%0%
0%0%
9N
ursi
ng &
Allie
d H
ealth
Col
lege
1%1%
2%
2%2%
3%
3%3%
3%3%
3%3%
2%
10R
esea
rch
Inst
itutio
ns (6
inst
itute
s un
der
NIH
)1%
1%1%
1%
2%
1%
1%
1%1%
1%1%
1%1%
Tota
l10
0%10
0%10
0%10
0%10
0%10
0%10
0%10
0%10
0%10
0%10
0%10
0%10
0%
13 MALAYSIA NATIONAL HEALTH ACCOUNTS
TAB
LE 5
.3 :
MO
H O
per
atio
nal E
xpen
dit
ure
at V
ario
us F
acili
ties
/ A
gen
cies
, 199
7-20
09 (R
M M
illio
n)
Faci
lity/
Ag
ency
19
9719
9819
9920
0020
0120
0220
0320
0420
0520
0620
0720
0820
09
1H
eadq
uart
ers
198
204
195
221
248
327
610
601
579
766
682
795
973
2H
ospi
tals
2,21
52,
308
2,47
42,
766
3,08
63,
255
3,87
24,
151
4,29
56,
008
6,31
8 7,
427
7,78
1
3S
tate
Hea
lth O
ffice
s26
724
627
531
336
443
051
055
855
673
974
791
194
3
4D
istr
ict H
ealth
Offi
ces/
Clin
ics
472
461
522
624
712
831
951
1,02
71,
091
1,54
71,
571
1,89
01,
902
5Ve
ctor
Dis
ease
Con
trol
Div
isio
n20
2036
2132
269
02
6 6
66
6N
atio
nal B
lood
Ban
k0
00
229
3451
4846
7462
8786
7P
H L
abor
ator
ies
00
04
811
1815
1534
2533
32
8P
J P
harm
acy
Div
isio
n10
1112
1013
1314
1716
2020
2326
9N
ursi
ng &
Allie
d H
ealth
Col
lege
3533
6896
147
186
231
222
218
270
274
310
325
10R
esea
rch
Inst
itutio
ns (6
inst
itute
s un
der
NIH
)40
3433
3341
4555
5047
7367
8710
0
Tota
l3,
258
3,31
63,
615
4,09
14,
680
5,15
76,
322
6,68
66,
866
9,53
89,
772
11,5
69
12,1
73
TAB
LE 5
.4 :
Op
erat
iona
l MO
H E
xpen
dit
ure
at V
ario
us F
acili
ties
/ A
gen
cies
, 199
7-20
09 (P
er c
ent,
%)
Faci
lity/
Ag
ency
19
9719
9819
9920
0020
0120
0220
0320
0420
0520
0620
0720
0820
09
1H
eadq
uart
ers
6%6%
5%
5%
5%
6%
10%
9%
8%
8%
7%
7%
8%
2H
ospi
tals
68%
70%
68%
68
%
66%
63
%
61%
62
%
63%
63
%
65%
64
%
64%
3S
tate
Hea
lth O
ffice
s8%
7%8%
8%
8%
8%
8%
8%
8%
8%
8%
8%
8%
4D
istr
ict H
ealth
Offi
ces/
Clin
ics
14%
14%
14%
15
%
15%
16
%
15%
15
%
16%
16
%
16%
16
%
16%
5Ve
ctor
Dis
ease
Con
trol
Div
isio
n1%
1%1%
1%
1%
0%
0%
0%
0%
0%
0%
0%
0%
6N
atio
nal B
lood
Ban
k0%
0%0%
0%1%
1%
1%
1%
1%
1%
1%
1%
1%
7P
H L
abor
ator
ies
0%0%
0%0%
0%0%
0%0%
0%0%
0%0%
0%
8P
J P
harm
acy
Div
isio
n0%
0%0%
0%0%
0%0%
0%0%
0%0%
0%0%
9N
ursi
ng &
Allie
d H
ealth
Col
lege
1%1%
2%
2%3%
4%
4%3%
3%3%
3%3%
3%
10R
esea
rch
Inst
itutio
ns (6
inst
itute
s un
der
NIH
)1%
1%1%
1%
1%
1%
1%
1%1%
1%1%
1%1%
Tota
l10
0%10
0%10
0%10
0%10
0%10
0%10
0%10
0%10
0%10
0%10
0%10
0%10
0%

14MINISTRY OF HEALTH(MOH) SUB-ACCOUNT (1997-2009)
TABLE 5.5 : Hospital Kuala Lumpur Expenditure, 1997-2009
Year
RM Million Per cent
Operational Expenditure
Development Expenditure
Total HKLExpenditure
All Hospital Operational Expenditure
HKL Share of All Hospital Operational
Expenditure
1997 315 4 319 2,215 14%
1998 335 9 344 2,308 15%
1999 335 9 343 2,474 14%
2000 345 6 351 2,766 13%
2001 379 31 410 3,086 13%
2002 377 25 402 3,255 12%
2003 431 10 441 3,872 11%
2004 473 21 494 4,151 12%
2005 484 20 504 4,295 12%
2006 635 17 652 6,008 11%
2007 575 14 589 6,318 9%
2008 633 8 641 7,427 9%
2009 690 11 702 7,781 9%

15 MALAYSIA NATIONAL HEALTH ACCOUNTS
Expenditure By Activities AssignedTo Programmes
The aim of the reporting under this section is to provide the expenditure trend of major activities under the MOH. The MOH operating expenditure is used to disaggregate the spending for various activities under the current six main programmes. The expenditure assignment is done under the heading of the programmes for the time series even if it did not exist in the particular year. An example is the oral health programme and pharmacy programme which prior to 2008 was functional as separate unit or division under the MOH and the operational budget flow for these activities came through the Public Health Programme and the Research and Technical Programme respectively.
However, in almost every programme there is often a “New Policy” or Dasar Baru expenditure which is a special additional expenditure beyond the annual estimated budget. This is the financial provision for new or unscheduled activities and policies for the year. Often this expenditure which is usually a very small proportion of the total expenditure becomes part and parcel of the subsequent year operational budget allocation. The tables produced under this section are exclusive of this additional expenditure.
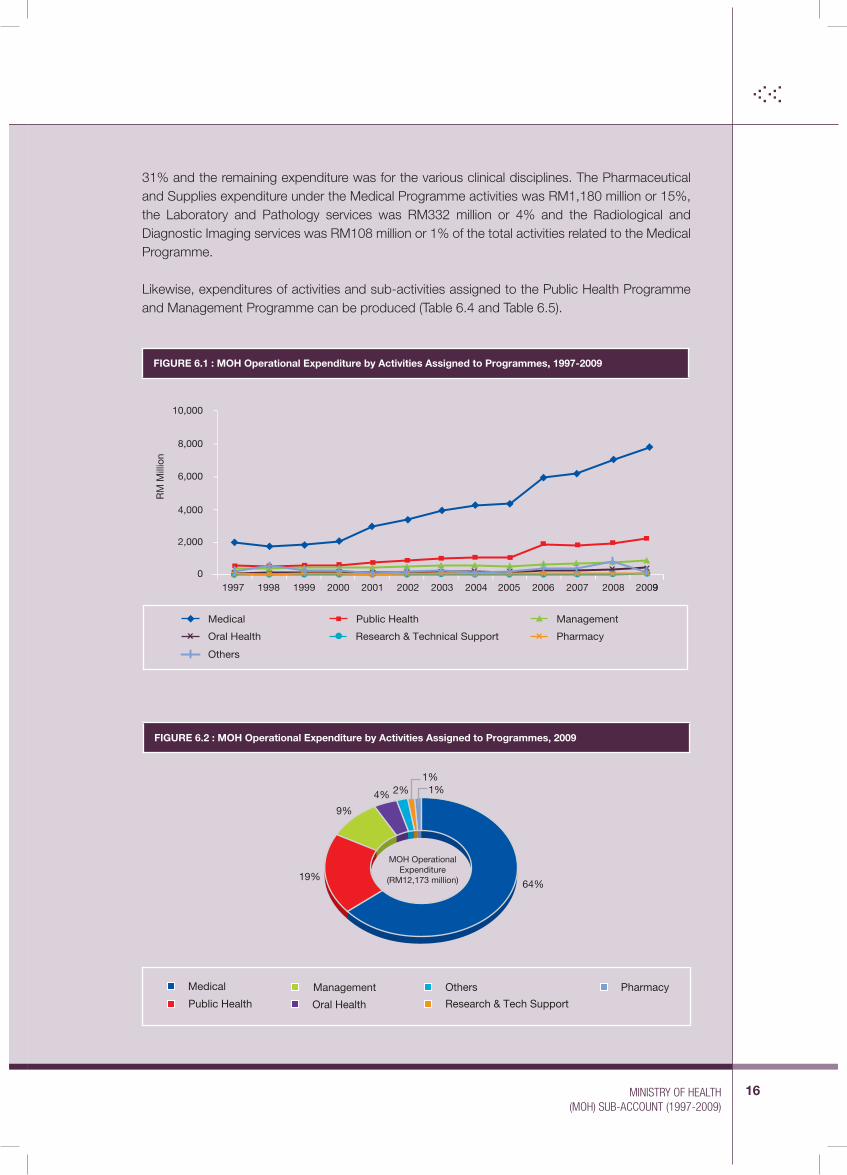
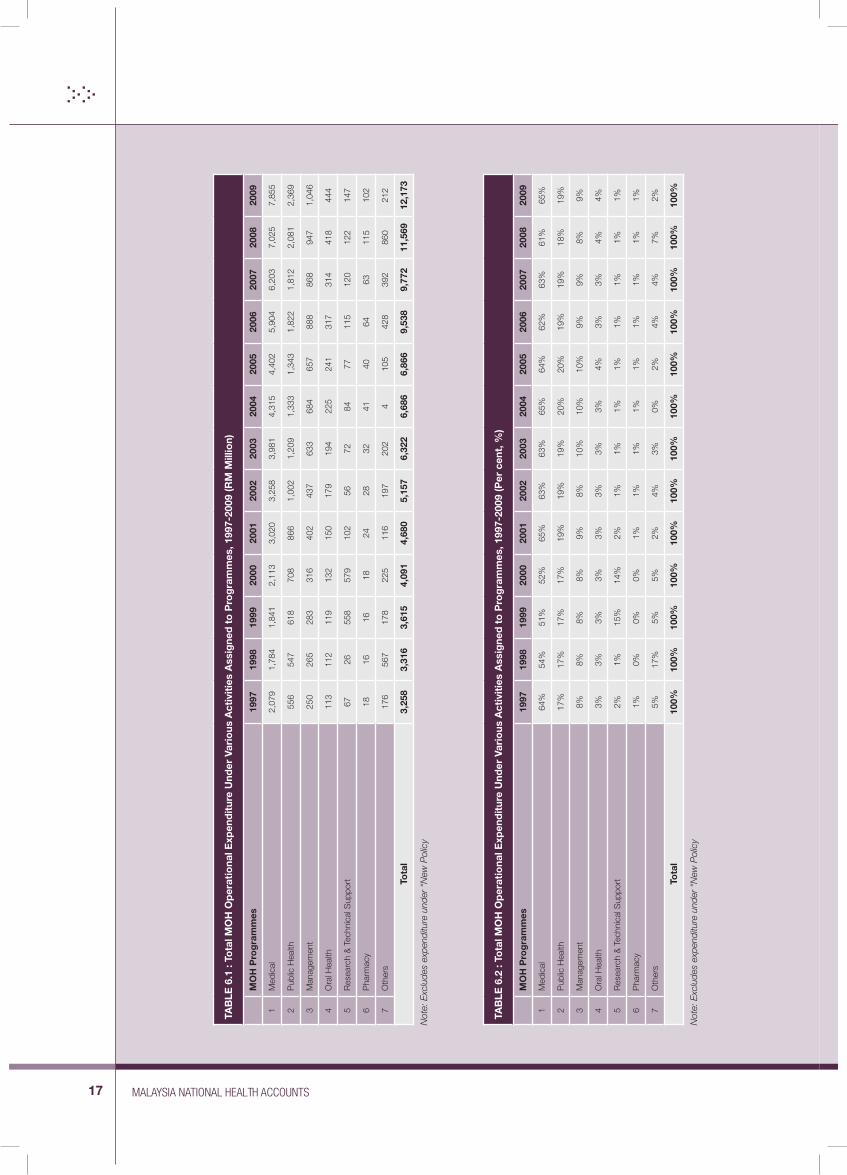
During the 1997 to 2009 time period, the MOH sub-account assigns the various activities under a total of 6+1 programmes, namely, Management Programme, Public Health Programme, Medical Programme, Pharmacy Programme, Oral Health Programme, Research and Technical Support Programme and an additional group of miscellaneous activities which includes health promotion board, the one-off and other expenditures. Of these 6+1 programmes, activities related to the Medical Programme had the highest expenditure followed by those under Public Health Programme (Figure 6.1 and Table 6.1).
In 2009, the expenditure for activities under the Medical Programme was RM7,855 million or 64% of the total MOH operating expenditure and for the Public Health Programme expenditure was RM2,369 or 19% of the total MOH operating expenditure (Figure 6.2). The shares of activities under these two programmes have also remained about the same throughout 1997 to 2009 time period (Table 6.2).
The MOH sub-account is able to produce the expenditure trends for the time period of the various sub-activities under each main activity. The expenditure of the sub-activities of the programmes with the three highest expenditures, the Medical Programme, the Public Health Programmes, and the Management Programme are used as examples to explain the tables that can be produced under the MOH sub-account.
In 2009, there were a total of 37 sub-activities under the Medical Programme (Table 6.3). These include administration at various levels such as headquarters, state and hospitals, and 35 clinical discipline services. The administrative expenditure for the same year was RM2,439 million or
CHAPTER 6
16MINISTRY OF HEALTH(MOH) SUB-ACCOUNT (1997-2009)
31% and the remaining expenditure was for the various clinical disciplines. The Pharmaceutical and Supplies expenditure under the Medical Programme activities was RM1,180 million or 15%, the Laboratory and Pathology services was RM332 million or 4% and the Radiological and Diagnostic Imaging services was RM108 million or 1% of the total activities related to the Medical Programme.
Likewise, expenditures of activities and sub-activities assigned to the Public Health Programme and Management Programme can be produced (Table 6.4 and Table 6.5).
Public HealthMedical Management
Pharmacy
RM
Mill
ion
1997 1998 1999 2000 2001 2002 2003 2004 2005 2006 2007 2008 2009
2,000
0
4,000
6,000
8,000
10,000
Oral Health Research & Technical Support
Others
FIGURE 6.1 : MOH Operational Expenditure by Activities Assigned to Programmes, 1997-2009
9
Medical Management
Oral Health
Others Pharmacy
Research & Tech SupportPublic Health
64%
9%
4% 2% 1%1%
19%
FIGURE 6.2 : MOH Operational Expenditure by Activities Assigned to Programmes, 2009
MOH OperationalExpenditure
(RM12,173 million)
17 MALAYSIA NATIONAL HEALTH ACCOUNTS
TAB
LE 6
.1 :
Tota
l MO
H O
per
atio
nal E
xpen
dit
ure
Und
er V
ario
us A
ctiv
itie
s A
ssig
ned
to
Pro
gra
mm
es, 1
997-
2009
(RM
Mill
ion)
MO
H P
rog
ram
mes
1997
1998
1999
2000
2001
2002
2003
2004
2005
2006
2007
2008
2009
1M
edic
al
2,07
91,
784
1,84
12,
113
3,02
03,
258
3,98
14,
315
4,40
25,
904
6,20
37,
025
7,85
5
2P
ublic
Hea
lth
556
547
618
708
866
1,00
21,
209
1,33
31,
343
1,82
21,
812
2,08
12,
369
3M
anag
emen
t 25
026
528
331
640
243
763
368
465
788
886
894
71,
046
4O
ral H
ealth
11
311
211
913
215
017
919
422
524
131
731
441
844
4
5R
esea
rch
& T
echn
ical
Sup
port
67
2655
857
910
256
7284
7711
512
012
214
7
6P
harm
acy
1816
1618
2428
3241
4064
6311
510
2
7O
ther
s17
656
717
822
511
619
720
24
105
428
392
860
212
Tota
l3,
258
3,31
63,
615
4,09
14,
680
5,15
76,
322
6,68
66,
866
9,53
89,
772
11,5
6912
,173
Not
e: E
xclu
des
expe
nditu
re u
nder
“N
ew P
olic
y
TAB
LE 6
.2 :
Tota
l MO
H O
per
atio
nal E
xpen
dit
ure
Und
er V
ario
us A
ctiv
itie
s A
ssig
ned
to
Pro
gra
mm
es, 1
997-
2009
(Per
cen
t, %
)
MO
H P
rog
ram
mes
1997
1998
1999
2000
2001
2002
2003
2004
2005
2006
2007
2008
2009
1M
edic
al
64%
54%
51%
52%
65%
63%
63%
65%
64%
62%
63%
61%
65%
2P
ublic
Hea
lth
17%
17%
17%
17%
19%
19%
19%
20%
20%
19%
19%
18%
19%
3M
anag
emen
t 8%
8%8%
8%9%
8%10
%10
%10
%9%
9%8%
9%
4O
ral H
ealth
3%
3%3%
3%3%
3%3%
3%4%
3%3%
4%4%
5R
esea
rch
& T
echn
ical
Sup
port
2%
1%15
%14
%2%
1%1%
1%1%
1%1%
1%1%
6P
harm
acy
1%0%
0%0%
1%1%
1%1%
1%1%
1%1%
1%
7O
ther
s5%
17%
5%5%
2%4%
3%0%
2%4%
4%7%
2%
Tota
l10
0%10
0%10
0%10
0%10
0%10
0%10
0%10
0%10
0%10
0%10
0%10
0%10
0%
Not
e: E
xclu
des
expe
nditu
re u
nder
“N
ew P
olic
y

18MINISTRY OF HEALTH(MOH) SUB-ACCOUNT (1997-2009)
TABLE 6.3 : Medical Programme Sub-activities Expenditure, 2009
Medical Programme RM Million Per cent
1 HQ & State Administration 1,196 15.23%
2 Hospital Administration 1,243 15.82%
3 Pharmacy & Supplies 1,180 15.02%
4 Lab/Pathology 332 4.23%
5 Radiology/Diagnostic Imaging 108 1.37%
6 Other Clinical Disciplines (32) 3,796 48.33%
Total 7,855 100%
TABLE 6.4 : Public Health Programme Sub-activities Expenditure, 2009
Public Health Programme RM Million Per cent
1 HQ & State Administration 203 9%
2 Family Health Development 1,539 65%
3 Vector Disease Control 505 21%
4 Food Safety & Quality 48 2%
5 Health Education 74 3%
Total 2,369 100%
Note: The Oral health activity is excluded under this grouping of Public Health Programme
TABLE 6.5 : Management Programme Sub-activities Expenditure, 2009
Management Programme RM Million Per cent
1 HQ & State Administration 223 21%
2 HR Planning & Training 362 35%
3 Finance 285 27%
4 Human resource 86 8%
5 ICT 84 8%
6 Competency Development 5 1%
Total 1,046 100%

19 MALAYSIA NATIONAL HEALTH ACCOUNTS
MOH State Expenditure
The total MOH expenditure can be disaggregated by expenditures at various states in the country. There are a total of thirteen states and three additional Federal Territories, namely Kuala Lumpur, Labuan and Putrajaya. The expenditure for Putrajaya is included under the state of Selangor to follow the state population census as reported under the Department of Statistics Malaysia. The state expenditure in the figures and tables under this section are arranged according to the population of the state commencing with the largest populated state.
In 2009, a total of RM11,520 million or 78% of the total MOH expenditure was disaggregated into state expenditure. The remaining RM3,193 million or 22% of total MOH expenditure was spending at the Federal level by offices at the headquarters, National Institute of Health with six research institutes, National Blood Bank and Vector Control Division of the MOH.
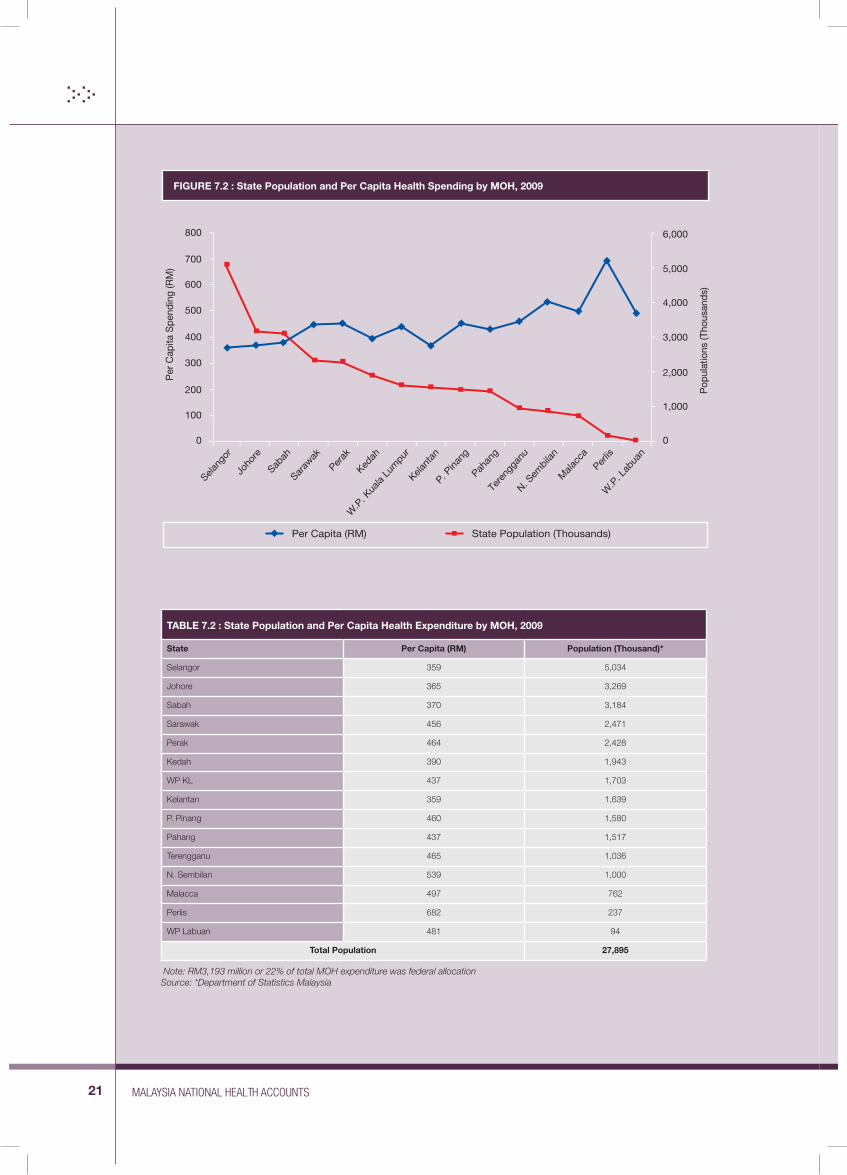
The most populated state of Selangor had the highest expenditure at RM1,721 million or 12% of the disaggregated expenditure (Figure 7.1 and Table 7.1). In general, the states with the higher population also had the higher MOH spending. The median per capita MOH spending amongst all states for the year 2009 was RM456 with a range of RM359 to RM682 (Figure 7.2 and Table7.2). The MOH sub-account is able to produce health expenditure by states and per capita expenditure by states for all the remaining years from 1997 to 2008.
CHAPTER 7

20MINISTRY OF HEALTH(MOH) SUB-ACCOUNT (1997-2009)
RM
Mill
ion
Selang
or
Joho
re
Sabah
Saraw
ak
Perak
Kedah
W.P
. Kua
la Lu
mpur
W.P
. Lab
uan
Kelant
an
P. Pina
ng
Pahan
g
Tere
ngga
nu
N. Sem
bilan
Mala
cca
Perlis
200
0
400
600
800
1,000
1,200
1,400
1,600
1,800
2,000
12%
8% 8% 8% 8%
5%
6%
5% 5%
3% 3%
1% 1%
4% 4%
FIGURE 7.1 : Total MOH Expenditure by States, 2009
TABLE 7.1 : Population and MOH Expenditure by States, 2009
State Population (Thousand*) Expenditure (RM Million)
Selangor 5,034 1,721
Johore 3,269 1,194
Sabah 3,184 1,178
Sarawak 2,471 1,127
Perak 2,428 1,127
Kedah 1,943 757
WP KL 1,703 831
Kelantan 1,639 589
P. Pinang 1,580 727
Pahang 1,517 663
Terengganu 1,036 482
N. Sembilan 1,000 539
Malacca 762 378
Perlis 237 162
WP Labuan 94 45
Federal Allocation 3,193
Total 27,895 14,713
Source: *Department of Statistics Malaysia
21 MALAYSIA NATIONAL HEALTH ACCOUNTS
TABLE 7.2 : State Population and Per Capita Health Expenditure by MOH, 2009
State Per Capita (RM) Population (Thousand)*
Selangor 359 5,034
Johore 365 3,269
Sabah 370 3,184
Sarawak 456 2,471
Perak 464 2,428
Kedah 390 1,943
WP KL 437 1,703
Kelantan 359 1,639
P. Pinang 460 1,580
Pahang 437 1,517
Terengganu 465 1,036
N. Sembilan 539 1,000
Malacca 497 762
Perlis 682 237
WP Labuan 481 94
Total Population 27,895
Note: RM3,193 million or 22% of total MOH expenditure was federal allocationSource: *Department of Statistics Malaysia
FIGURE 7.2 : State Population and Per Capita Health Spending by MOH, 2009
State Population (Thousands)Per Capita (RM)
Per
Cap
ita S
pend
ing
(RM
)
Pop
ulat
ions
(Tho
usan
ds)
100
0
1,000
2,000
3,000
4,000
5,000
6,000
0
200
300
400
500
600
700
800
Selang
or
Joho
re
Sabah
Saraw
ak
Perak
Kedah
W.P
. Kua
la Lu
mpu
r
W.P
. Lab
uan
Kelant
an
P. Pinan
g
Pahan
g
Tere
ngga
nu
N. Sem
bilan
Mala
cca
Perlis
22MINISTRY OF HEALTH(MOH) SUB-ACCOUNT (1997-2009)
MOH Expenditures By Providers And Functions
This section provides total MOH expenditure disaggregation using MNHA framework to provide expenditures under the dimension of providers and functions. The dimension of providers indicates the various groups of health care providers through whom the MOH provides the necessary health care services and products for the population. The dimension of function indicates the type of services that are purchased by the MOH.
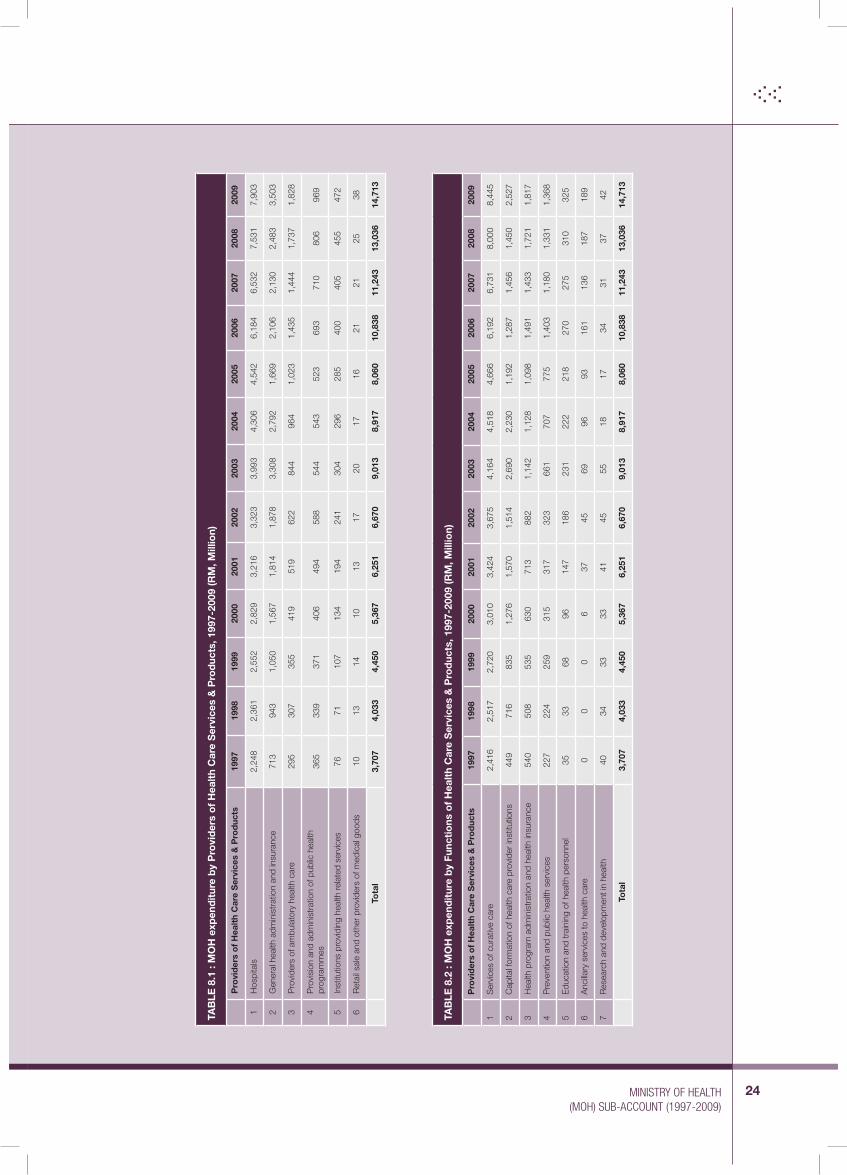
In 2009, under the dimension of providers, hospitals consumed RM7,903 million or 54% followed by general health administration expenditure mainly at the federal and state health offices at RM3,503 million or 24% of the total MOH expenditure (Figure 8.1 and Table 8.1). In the same year, under the dimension of function, curative care consumed RM8,445 million or 58% followed by capital formation at RM2,572 million or 17% of the total MOH expenditure (Figure 8.2 and Table 8.2).
CHAPTER 8

23 MALAYSIA NATIONAL HEALTH ACCOUNTS
Curative Care
Health Program Admin
Prevention Public Health Services
OthersCapital Formation
58%
12%
9%4%
17%
FIGURE 8.2 : Total MOH Expenditure by Functions of Health Care Services & Products, 2009
TotalMOH Expenditure(RM14,713 million)
Hospitals
Ambulatory Health Care
Provision & Admin ofPublic Health Programmes
Others
General Health Admin
54%
12%
7% 3%
24%
FIGURE 8.1 : Total MOH Expenditure by Providers of Health Care Services & Products, 2009
TotalMOH Expenditure(RM14,713 million)
24MINISTRY OF HEALTH(MOH) SUB-ACCOUNT (1997-2009)
TAB
LE 8
.1 :
MO
H e
xpen
dit
ure
by
Pro
vid
ers
of
Hea
lth
Car
e S
ervi
ces
& P
rod
ucts
, 199
7-20
09 (R
M, M
illio
n)
P
rovi
der
s o
f H
ealt
h C
are
Ser
vice
s &
Pro
duc
ts19
9719
9819
9920
0020
0120
0220
0320
0420
0520
0620
0720
0820
09
1H
ospi
tals
2,24
82,
361
2,55
22,
829
3,21
63,
323
3,99
34,
306
4,54
26,
184
6,53
27,
531
7,90
3
2G
ener
al h
ealth
adm
inis
trat
ion
and
insu
ranc
e71
394
31,
050
1,56
71,
814
1,87
83,
308
2,79
21,
669
2,10
62,
130
2,48
33,
503
3P
rovi
ders
of a
mbu
lato
ry h
ealth
car
e29
530
735
541
951
962
284
496
41,
023
1,43
51,
444
1,73
71,
828
4P
rovi
sion
and
adm
inis
trat
ion
of p
ublic
hea
lth
prog
ram
mes
365
339
371
406
494
588
544
543
523
693
710
806
969
5In
stitu
tions
pro
vidi
ng h
ealth
rela
ted
serv
ices
7671
107
134
194
241
304
296
285
400
405
455
472
6R
etai
l sal
e an
d ot
her
prov
ider
s of
med
ical
goo
ds10
1314
1013
1720
1716
2121
2538
To
tal
3,70
74,
033
4,45
05,
367
6,25
16,
670
9,01
38,
917
8,06
010
,838
11,2
4313
,036
14,7
13
TAB
LE 8
.2 :
MO
H e
xpen
dit
ure
by
Func
tio
ns o
f H
ealt
h C
are
Ser
vice
s &
Pro
duc
ts, 1
997-
2009
(RM
, Mill
ion)
P
rovi
der
s o
f H
ealt
h C
are
Ser
vice
s &
Pro
duc
ts19
9719
9819
9920
0020
0120
0220
0320
0420
0520
0620
0720
0820
09
1S
ervi
ces
of c
urat
ive
care
2,41
62,
517
2,72
03,
010
3,42
43,
675
4,16
44,
518
4,66
66,
192
6,73
18,
000
8,44
5
2C
apita
l for
mat
ion
of h
ealth
car
e pr
ovid
er in
stitu
tions
449
716
835
1,27
61,
570
1,51
42,
690
2,23
01,
192
1,28
71,
456
1,45
02,
527
3H
ealth
pro
gram
adm
inis
trat
ion
and
heal
th in
sura
nce
540
508
535
630
713
882
1,14
21,
128
1,09
81,
491
1,43
31,
721
1,81
7
4P
reve
ntio
n an
d pu
blic
hea
lth s
ervi
ces
227
224
259
315
317
323
661
707
775
1,40
31,
180
1,33
11,
368
5E
duca
tion
and
trai
ning
of h
ealth
per
sonn
el35
3368
9614
718
623
122
221
827
027
531
032
5
6A
ncilla
ry s
ervi
ces
to h
ealth
car
e0
00
637
4569
9693
161
136
187
189
7R
esea
rch
and
deve
lopm
ent i
n he
alth
4034
3333
4145
5518
1734
3137
42
To
tal
3,70
74,
033
4,45
05,
367
6,25
16,
670
9,01
38,
917
8,06
010
,838
11,2
4313
,036
14,7
13
25 MALAYSIA NATIONAL HEALTH ACCOUNTS
Interest Area Expenditures
The data in this section on MOH expenditures in specific areas of interest are further examples of data that can be extracted from the MOH sub-account database to provide meaningful information of importance to policy makers.
MOH WAGE EXPENDITURE
The term “wage” in this document refers to all monetary payouts to employees of MOH inclusive of permanent, temporary and contract employees. It includes their emolument, allowances and all claims. The SODO codes 10000, 21000 and 29300 were used to extract the data from the raw AG database. The wage expenditure is then disaggregated into spending under various Programmes of the MOH. Under this section the term Programmes refers to the actual programme code and not the assigned programme as stated in the earlier section.
Throughout the 1997-2009 time period the median total wages paid to employees of MOH was 51% of total MOH or 42% of operating expenditure with the wages increasing almost parallel to the operating expenditure (Figure 9.1 and Table 9.1). In 2009, the Medical Programme had the highest wage payouts amounting to RM4,181 million or 64% of all wages. This was followed by wage payouts of RM1,501 million or 23% under the Public Health Programme. The Oral Health Programme spent RM366 million and the Management Programme spent RM325 million both of which was equal to 6% of total MOH wages (Figure 9.2 and Table 9.2). The wages paid out under all other programmes were less than 5% each of all wage expenditure.
As mentioned earlier in this document, it is important to note that some programmes became standalone only much later in the year and this can affect the time series expenditure trends of the programme. As an example, prior to 2008 the Public Health Programme included activities related to oral health which later became the standalone Oral Health Programme. Similarly prior to 2008 the Research and Technical Support Programme included the Pharmacy Programme.
CHAPTER 9

26MINISTRY OF HEALTH(MOH) SUB-ACCOUNT (1997-2009)
Operating Expenditure
RM
Mill
ion
1997 1998 1999 2000 2001 2002 2003 2004 2005 2006 2007 2008 2009
2,000
0
4,000
6,000
8,000
10,000
12,000
14,000
FIGURE 9.1 : Total Wage and MOH Operational Expenditure, 1997-2009 (RM Million)
Total Wage
TABLE 9.1 : Total Wage, Operating and Total MOH Expenditure, 1997-2009 (RM Million)
Year Total Wage Operating Expenditure Total MOH Expenditure
1997 1,634 3,258 3,707
1998 1,709 3,316 4,033
1999 1,848 3,615 4,450
2000 2,085 4,091 5,367
2001 2,342 4,680 6,251
2002 2,808 5,157 6,670
2003 3,067 6,322 9,013
2004 3,341 6,686 8,917
2005 3,622 6,866 8,060
2006 4,782 9,538 10,838
2007 4,864 9,772 11,243
2008 6,133 11,569 13,036
2009 6,511 12,173 14,713

27 MALAYSIA NATIONAL HEALTH ACCOUNTS
Medical
Oral Health
Management
Pharmacy
Research & Tech Support
Public Health
64%
6%5%
1%
23%
FIGURE 9.2 : Wage Expenditure by Programmes, 2009 (Per cent)
Total Wage(RM6,511 million)
1%
TABLE 9.2 : Total Wage Expenditure By Programmes, 1997-2009 (RM Million)
Expenditure By Programmes
Year Medical Public Health
Oral Health Management Pharmacy Research
& Technical Support
Others Total
1997 1,017 495 0 91 0 29 2 1,634
1998 1,065 516 0 90 0 31 6 1,709
1999 1,129 573 0 99 0 45 1 1,848
2000 1,290 650 0 104 0 39 2 2,085
2001 1,460 729 0 112 0 39 2 2,342
2002 1,751 877 0 132 0 48 1 2,808
2003 1,901 959 0 149 0 54 4 3,067
2004 2,069 1,034 0 168 0 66 4 3,341
2005 2,245 1,114 0 189 0 70 4 3,622
2006 2,977 1,438 0 270 0 90 7 4,782
2007 3,079 1,423 0 257 0 91 13 4,864
2008 3,900 1,431 348 318 55 61 19 6,133
2009 4,181 1,501 366 325 65 69 4 6,511
Note: Some programmes were non-existent in earlier year
28MINISTRY OF HEALTH(MOH) SUB-ACCOUNT (1997-2009)
PHARMACEUTICAL & SUPPLIES EXPENDITURE
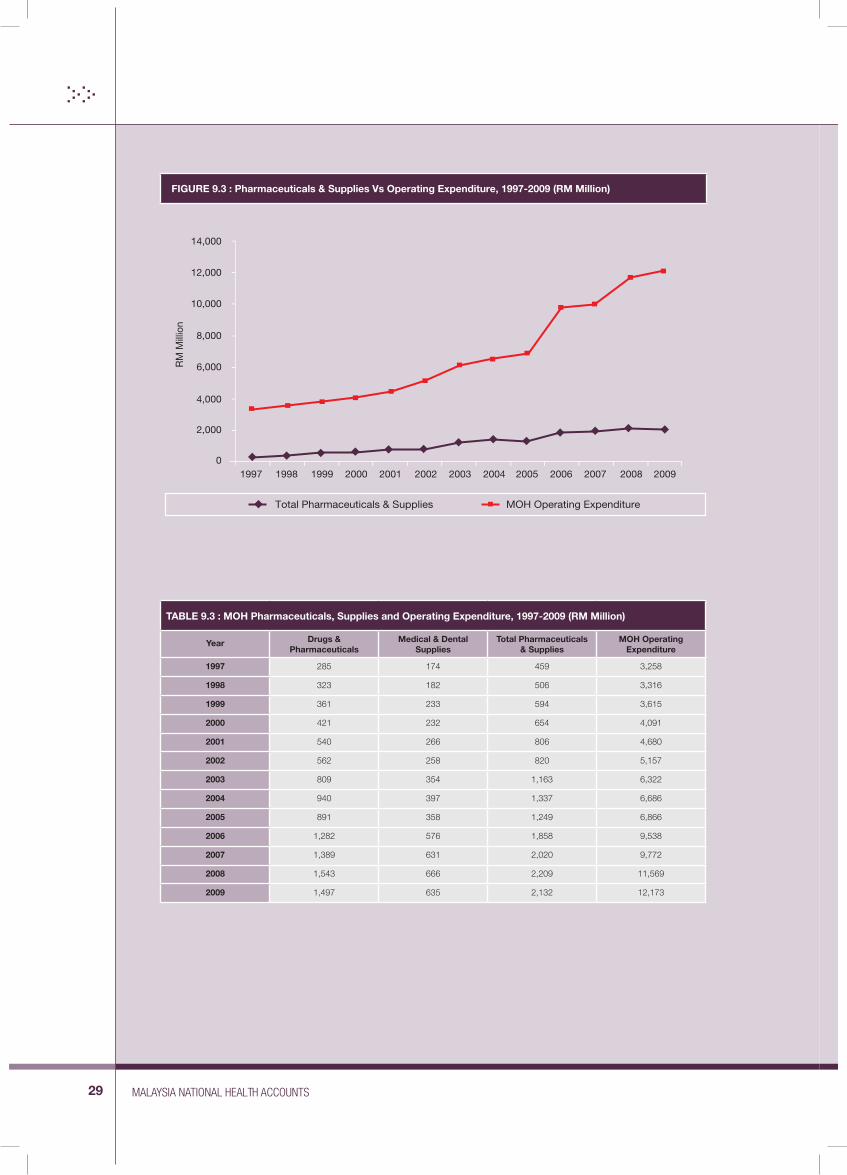
This expenditure captures the expenditure for purchases of drugs & pharmaceuticals and medical & dental supplies under the SODO codes 27401 and 27499. It is different from the expenditure under the Pharmacy Programme which captures mainly the pharmacy administrative and management expenditure.
The Pharmaceuticals & Supplies expenditure has increased much faster than the MOH operating expenditure rising from RM459 million in 1997 to RM2,132 million in 2009 (Figure 9.3 and Table 9.3). This increase is largest in expenditures of drugs & pharmaceuticals with a 5-fold increase over the time period.
The expenditure can be disaggregated by expenditures under various Programmes of MOH. Oral Health Programme has the highest expenditures for supplies followed by Public Health Programme (Figure 9.4). However, the Medical Programme has the highest expenditure for drugs & pharmaceuticals followed by Public Health Programme (Table 9.4).
29 MALAYSIA NATIONAL HEALTH ACCOUNTS
TABLE 9.3 : MOH Pharmaceuticals, Supplies and Operating Expenditure, 1997-2009 (RM Million)
Year Drugs & Pharmaceuticals
Medical & Dental Supplies
Total Pharmaceuticals & Supplies
MOH Operating Expenditure
1997 285 174 459 3,258
1998 323 182 506 3,316
1999 361 233 594 3,615
2000 421 232 654 4,091
2001 540 266 806 4,680
2002 562 258 820 5,157
2003 809 354 1,163 6,322
2004 940 397 1,337 6,686
2005 891 358 1,249 6,866
2006 1,282 576 1,858 9,538
2007 1,389 631 2,020 9,772
2008 1,543 666 2,209 11,569
2009 1,497 635 2,132 12,173
Total Pharmaceuticals & Supplies MOH Operating Expenditure
RM
Mill
ion
1997 1998 1999 2000 2001 2002 2003 2004 2005 2006 2007 2008 2009
2,000
0
4,000
6,000
8,000
10,000
12,000
14,000
FIGURE 9.3 : Pharmaceuticals & Supplies Vs Operating Expenditure, 1997-2009 (RM Million)

30MINISTRY OF HEALTH(MOH) SUB-ACCOUNT (1997-2009)
Public Health Programme All others
RM
Mill
ion
1997 1998 1999 2000 2001 2002 2003 2004 2005 2006 2007 2008 2009
100
0
200
300
400
500
600
Medical Programme
FIGURE 9.4 : Medical Supplies Expenditure By Programmes, 1997-2009 (RM Million)
131 128167 180
215 205
289326
447492 466
524
290
TABLE 9.4 : Drugs & Pharmaceutical Expenditure By Programmes, 1997-2009 (RM Million)
Year Medical Programme Public Health Programme All Other* Total
1997 245 34 7 285
1998 220 28 75 323
1999 296 42 23 361
2000 353 50 18 421
2001 460 62 18 540
2002 452 73 37 562
2003 644 130 35 809
2004 769 166 5 940
2005 725 144 21 891
2006 984 234 64 1,282
2007 1,078 219 92 1,389
2008 1,062 222 259 1,543
2009 1,161 319 17 1,497
Note: Includes the “New Policy” expenditure for drugs & pharmaceuticals
31 MALAYSIA NATIONAL HEALTH ACCOUNTS
HOSPITAL EXPENDITURES
The chapter under expenditures by facilities or agencies provides the expenditure at all MOH hospitals throughout the 1997-2009 time series. However, these expenditures can also be disaggregated as expenditures by various categories of hospitals. The MNHA framework categorizes the MOH hospitals into six groups based on the type of services and the specialists available at the hospitals (Figure 9.5 and Appendix 3).
The MOH sub-account is able to produce the expenditure of these different categories of hospitals over the 1997-2009 time periods. A summary of the expenditure for 2009 is provided to explain the expenditure disaggregation. There are a total 6 categories of hospitals. The expenditure of the national referral hospital, Hospital Kuala Lumpur has been mentioned earlier in the document. The average, median, minimum and maximum expenditure is dependent on the category of the hospital. The 2009 distribution of these expenditures are shown as an example of these differences (Table 9.5). Category 3 hospitals are split into a sub-set whereby the hospitals that function as “Centers of Excellence” or Regional Referral Centers for specific illnesses or conditions have higher expenditures.
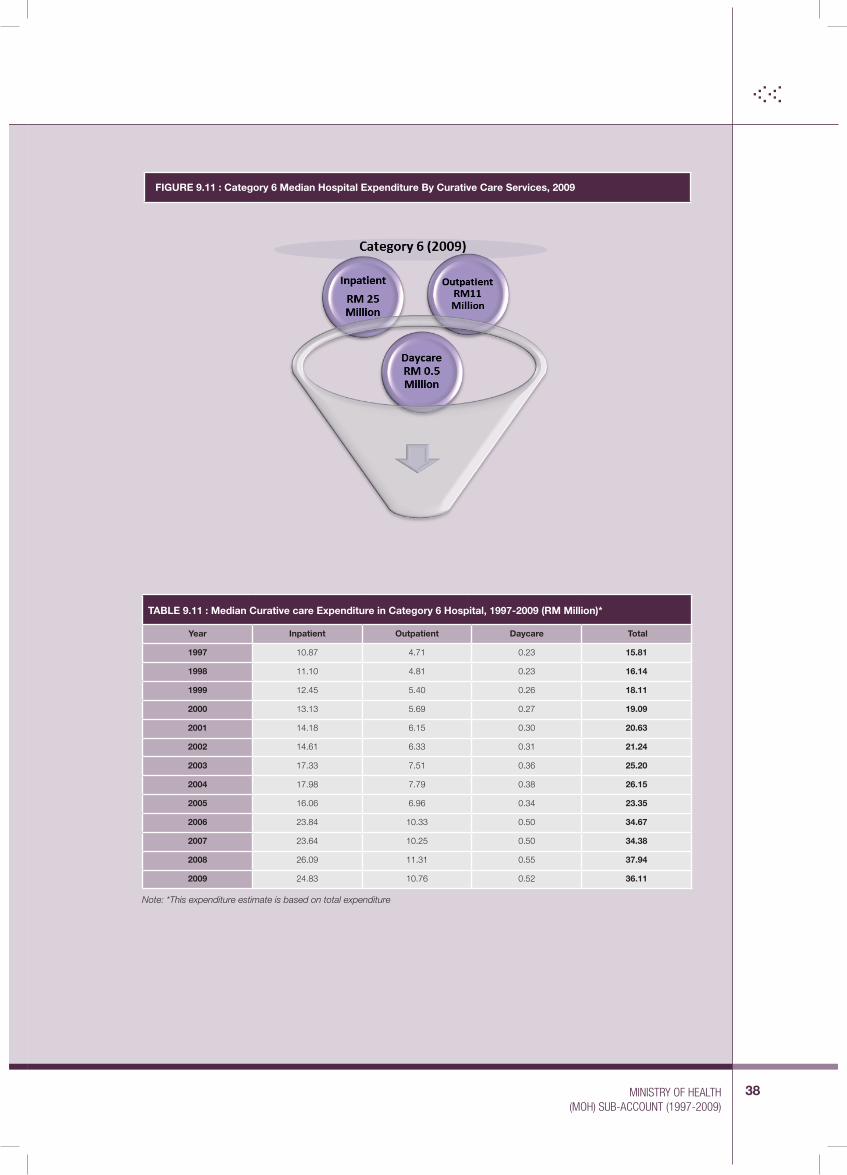
The expenditures of the various categories of hospitals can be also disaggregated by the functional dimension of inpatient, outpatient and day care services as described under the MNHA framework. This uses the hospital cost accounting methodology to assign the total hospital expenditure into the three functional curative care services. The expenditures of inpatient, outpatient and daycare services in the six categories of hospitals shows that in general the higher level of hospital has higher expenditures (Figure 9.6-Figure 9.11 and Table 9.6-Table 9.11). The expenditure for curative care services in psychiatric hospital shows a pattern similar to category 4 hospitals.

32MINISTRY OF HEALTH(MOH) SUB-ACCOUNT (1997-2009)
Per capita spending
FIGURE 9.5 : Pharmaceuticals & Supplies Vs Operating Expenditure, 1997-2009 (RM Million)
RM
370 392424
495446
590
727769 760
903
971
1,111
1,208
1997 1998 1999 2000 2001 2002 2003 2004 2005 2006 2007 2008 2009
200
400
600
800
1000
1200
1200
TABLE 9.5 : Expenditure By Category of Hospital, 2009*
Hospital CategoryNumber of Hospitals
RM Million
Average Median Minimum Maximum
Category 1 1 690
Category 2 13 224 217 103 325
Category 3s** 5 172 162 110 258
Category 3# 13 (+NRI) 93 88 56 126
Category 4 17 38 36 9 92
Category 5 83 14 14 1 31
Category 6 4 48 36 19 102
Note: *This expenditure estimate is based on total expenditure ** This sub-set of hospitals include Ampang, Serdang, Selayang, Putrajaya & Sungai Buloh# This expenditure estimates exclude sub-set hospitals and National Respiratory Institute (NRI)
• National Referal Hospital (H. Kuala Lumpur)
• District Hospital with 9-12 specialists• Centers of Excellence
• District Hospitals without specialists
• State Capital Hospital
• District Hospitals with 1-8 specialists
• Psychiatric Hospitals
1
3
5
2
4
6

33 MALAYSIA NATIONAL HEALTH ACCOUNTS
FIGURE 9.6 : Category 1 Hospital Expenditure By Curative Care Services, 2009
TABLE 9.6 : Curative care Expenditure in Category 1 Hospital, 1997-2009 (RM Million)*
Year Inpatient Outpatient Daycare Total
1997 229.46 73.22 12.31 314.98
1998 244.38 77.98 13.11 335.46
1999 243.95 77.84 13.08 334.87
2000 251.68 80.31 13.50 345.49
2001 276.15 88.12 14.81 379.08
2002 274.54 87.60 14.72 376.87
2003 313.86 100.15 16.83 430.84
2004 344.84 110.03 18.49 473.36
2005 352.57 112.50 18.91 483.98
2006 462.46 147.56 24.80 634.83
2007 419.23 133.77 22.48 575.49
2008 461.36 147.21 24.74 633.32
2009 503.01 160.50 26.98 690.49
Note: *This expenditure estimate is based on total expenditure

34MINISTRY OF HEALTH(MOH) SUB-ACCOUNT (1997-2009)
FIGURE 9.7 : Category 2 Median Hospital Expenditure By Curative Care Services, 2009
TABLE 9.7 : Median Curative care Expenditure in Category 2 Hospital, 1997-2009 (RM Million)*
Year Inpatient Outpatient Daycare Total
1997 44.48 22.14 1.68 68.30
1998 45.29 22.54 1.71 69.55
1999 47.98 23.88 1.81 73.68
2000 53.45 26.61 2.02 82.08
2001 63.22 31.47 2.39 97.08
2002 64.15 31.93 2.43 98.51
2003 78.41 39.03 2.96 120.40
2004 84.87 42.24 3.21 130.32
2005 85.66 42.64 3.24 131.54
2006 114.85 57.17 4.34 176.36
2007 119.34 59.40 4.51 183.25
2008 136.96 68.17 5.18 210.31
2009 141.01 70.19 5.33 216.53
Note: *This expenditure estimate is based on total expenditure

35 MALAYSIA NATIONAL HEALTH ACCOUNTS
FIGURE 9.8 : Category 3 Median Hospital Expenditure By Curative Care Services, 2009#
61 25
1.6
TABLE 9.8 : Median Curative care Expenditure in Category 3 Hospital, 1997-2009 (RM Million)*#
Year Inpatient Outpatient Daycare Total
1997 16.19 6.54 0.41 23.14
1998 16.70 6.74 0.43 23.87
1999 18.68 7.54 0.48 26.70
2000 21.52 8.68 0.55 30.75
2001 23.49 9.48 0.60 33.56
2002 23.85 9.63 0.61 34.09
2003 31.40 12.67 0.80 44.87
2004 32.26 13.02 0.82 46.10
2005 34.82 14.05 0.89 49.75
2006 46.26 18.67 1.18 66.11
2007 50.15 20.24 1.28 71.66
2008 60.05 24.23 1.53 85.82
2009 61.25 24.72 1.56 87.53
Note: *This expenditure estimate is based on total expenditureNote: # This excludes 5 hospitals of centers of excellence & National Respiratory Institute

36MINISTRY OF HEALTH(MOH) SUB-ACCOUNT (1997-2009)
FIGURE 9.9 : Category 4 Median Hospital Expenditure By Curative Care Services, 2009
TABLE 9.9 : Median Curative care Expenditure in Category 4 Hospital, 1997-2009 (RM Million)*
Year Inpatient Outpatient Daycare Total
1997 5.18 2.83 0.11 8.12
1998 5.43 2.97 0.12 8.52
1999 6.08 3.33 0.13 9.54
2000 7.08 3.87 0.15 11.10
2001 7.62 4.17 0.16 11.95
2002 8.05 4.40 0.17 12.63
2003 9.68 5.30 0.21 15.19
2004 10.39 5.68 0.22 16.28
2005 12.54 6.86 0.27 19.66
2006 18.68 10.21 0.40 29.28
2007 17.91 9.79 0.38 28.09
2008 20.10 10.99 0.43 31.52
2009 22.88 12.51 0.49 35.88
Note: *This expenditure estimate is based on total expenditure

37 MALAYSIA NATIONAL HEALTH ACCOUNTS
FIGURE 9.10 : Category 5 Median Hospital Expenditure By Curative Care Services, 2009
TABLE 9.10 : Median Curative care Expenditure in Category 5 Hospital, 1997-2009 (RM Million)*
Year Inpatient Outpatient Daycare Total
1997 3.10 1.91 0.02 5.03
1998 3.14 1.94 0.02 5.10
1999 3.36 2.08 0.03 5.46
2000 3.67 2.27 0.03 5.96
2001 4.01 2.48 0.03 6.52
2002 4.23 2.61 0.03 6.87
2003 4.97 3.07 0.04 8.08
2004 5.12 3.17 0.04 8.33
2005 5.36 3.31 0.04 8.71
2006 7.16 4.42 0.05 11.63
2007 7.23 4.47 0.05 11.75
2008 8.23 5.08 0.06 13.37
2009 8.43 5.21 0.06 13.71
Note: *This expenditure estimate is based on total expenditure
38MINISTRY OF HEALTH(MOH) SUB-ACCOUNT (1997-2009)
FIGURE 9.11 : Category 6 Median Hospital Expenditure By Curative Care Services, 2009
TABLE 9.11 : Median Curative care Expenditure in Category 6 Hospital, 1997-2009 (RM Million)*
Year Inpatient Outpatient Daycare Total
1997 10.87 4.71 0.23 15.81
1998 11.10 4.81 0.23 16.14
1999 12.45 5.40 0.26 18.11
2000 13.13 5.69 0.27 19.09
2001 14.18 6.15 0.30 20.63
2002 14.61 6.33 0.31 21.24
2003 17.33 7.51 0.36 25.20
2004 17.98 7.79 0.38 26.15
2005 16.06 6.96 0.34 23.35
2006 23.84 10.33 0.50 34.67
2007 23.64 10.25 0.50 34.38
2008 26.09 11.31 0.55 37.94
2009 24.83 10.76 0.52 36.11
Note: *This expenditure estimate is based on total expenditure
39 MALAYSIA NATIONAL HEALTH ACCOUNTS
PUBLIC HEALTH EXPENDITURE
This expenditure captures the MOH expenditure for public health services including prevention and health promotion under the MNHA framework coded as MF6 (Public Health services, including prevention and health promotion). It is different from the expenditure under the Public Health Programme which captures mainly the public health administrative and management expenditure.
There are a total of six groups of expenditure which includes maternal and child health (MCH), school health services, prevention of communicable diseases (CD), prevention of non-communicable diseases (NCD), health promotion and health education, and food safety and drinking water quality control. Of these groups, the expenditure for MCH has been increasing at a much faster rate than any other public health function with a 9-fold increase in the absolute ringgit value from 1997 to 2009 (Figure 9.12 and Table 9.12). In 2009, out of the total public health expenditure of RM1,368 million, the MCH expenditure was RM784 million or 57% of the public health expenditure (Figure 9.13 and Table 9.13).
Similarly the expenditure for CD and NCD has also been increasing from RM85 million to RM244 million and from RM37 million to RM59 million over the same time period. However, the CD and NCD share of public health expenditure has decreased at 38% to 18% for CD and 16% to 4% for NCD mainly due to the higher share for MCH.
Expenditure for CD is disaggregated into that for HIV/AIDS, Vector Borne Diseases and other CD. Expenditure for Vector Borne Diseases has increased from RM46 million in 1997 to RM120 million in 2009 contributing to 49% of CD expenditure in 2009 (Figure 9.14 and Table 9.14). This expenditure is exclusive of that for health promotion and education in CD and NCD.
The expenditure for the other components of public health functions can also be tracked separately with all showing a steady increase over the time period (Figure 9.15 and Table 9.15)

40MINISTRY OF HEALTH(MOH) SUB-ACCOUNT (1997-2009)
School HealthMCH CD
Food & Water Safety
RM
Mill
ion
1997 1998 1999 2000 2001 2002 2003 2004 2005 2006 2007 2008 2009
200
0
400
600
800
1,000
NCD Health Promotion
9
FIGURE 9.12 : Expenditure For Public Health Services & Promotion, 1997-2009
MCH
Communicable Diseases
Non-Communicable Diseases
Food Safety & Drinking Water
Health Promotion
Medical & Dental School Health Services
57%
18%
4% 2% 1%
18%
FIGURE 9.13 : Expenditure For Various components of Public Health Services & Promotion, 2009
Public Health Services& Promotion
(RM1,368 million)

41 MALAYSIA NATIONAL HEALTH ACCOUNTS
TAB
LE 9
.12
: Exp
end
itur
es f
or
Pub
lic H
ealt
h S
ervi
ces,
199
7-20
09 (R
M M
illio
n)
Pub
lic H
ealt
h Fu
ncti
on
1997
1998
1999
2000
2001
2002
2003
2004
2005
2006
2007
2008
2009
MC
H86
90
10
4 14
4 13
5 13
9 37
4 38
8 43
5 94
2 72
1 77
0 78
4
Med
ical
& D
enta
l Sch
ool H
ealth
Ser
vice
s8
8 5
23
7 1
98
129
139
191
187
241
250
Com
mun
icab
le D
isea
ses
85
83
105
100
122
125
124
126
139
181
191
228
244
Non
-Com
mun
icab
le D
isea
ses
37
34
36
37
40
43
47
47
43
58
55
63
59
Food
Saf
ety
& D
rinki
ng w
ater
9
10
8 9
11
12
14
14
15
22
22
22
24
Hea
lth P
rom
otio
n2
1 1
2 2
2 3
2 4
9 5
7 7
Tota
l 22
7 22
4 25
9 31
5 31
7 32
3 66
1 70
7 77
5 1,
403
1,18
0 1,
331
1,36
8
TAB
LE 9
.13
: Exp
end
itur
es f
or
Pub
lic H
ealt
h S
ervi
ces,
199
7-20
09 (P
er c
ent,
%)
Pub
lic H
ealt
h Fu
ncti
on
1997
1998
1999
2000
2001
2002
2003
2004
2005
2006
2007
2008
2009
MC
H38
%40
%40
%46
%43
%43
%57
%55
%56
%67
%61
%58
%57
%
Med
ical
& D
enta
l Sch
ool H
ealth
Ser
vice
s3%
3%2%
7%2%
0%15
%18
%18
%14
%16
%18
%18
%
Com
mun
icab
le D
isea
ses
38%
37%
41%
32%
38%
39%
19%
18%
18%
13%
16%
17%
18%
Non
-Com
mun
icab
le D
isea
ses
16%
15%
14%
12%
13%
13%
7%7%
6%4%
5%5%
4%
Food
Saf
ety
& D
rinki
ng w
ater
4%
4%3%
3%3%
4%2%
2%2%
2%2%
2%2%
Hea
lth P
rom
otio
n1%
0%0%
1%1%
1%0%
0%1%
1%0%
1%0%
Tota
l 10
0%10
0%10
0%10
0%10
0%10
0%10
0%10
0%10
0%10
0%10
0%10
0%10
0%

42MINISTRY OF HEALTH(MOH) SUB-ACCOUNT (1997-2009)
HIV / AIDS
Other CD
Vector Borne Disease
49%
8%
43%
FIGURE 9.14 : Expenditure For Various components of Communicable Disease, 2009
CommunicableDisease Expenditure
(RM244 million)
TABLE 9.14 : Expenditure for Components of Communicable Diseases, 1997-2009 (RM Million)
Year HIV/AIDS Vector Borne Diseases Other Diseases Total
1997 36 46 3 85
1998 35 45 3 83
1999 38 64 3 105
2000 45 52 3 100
2001 37 77 8 122
2002 22 52 51 125
2003 21 93 9 124
2004 21 84 21 126
2005 20 84 35 139
2006 17 103 62 181
2007 16 94 81 191
2008 19 112 97 228
2009 20 120 104 244

43 MALAYSIA NATIONAL HEALTH ACCOUNTS
RM
Mill
ion
1997 1998 1999 2000 2001 2002 2003 2004 2005 2006 2007 2008 2009
5
0
10
15
20
25
30
FIGURE 9.15 : Expenditure For Food Safety and Drinking water Quality, 1997-2009
9 91011
1214 14 15
22 22 22
24
8
TABLE 9.15 : Expenditure for Other Components of Public Health Services, 1997-2009 (RM Million)
YearHealth Promotion & Education School Health Services
Food & Water Safety TotalCD NCD Medical Dental
1997 1.08 0.72 3.24 4.42 9.09 18.55
1998 0.40 0.27 3.38 4.21 9.83 18.09
1999 0.44 0.30 0.00 4.65 8.39 13.78
2000 1.14 0.76 17.55 5.24 9.48 34.17
2001 1.44 0.96 0.85 6.00 11.06 20.30
2002 1.40 0.94 0.78 0.00 12.27 15.40
2003 1.77 1.18 0.45 97.94 14.13 115.48
2004 1.48 0.99 1.32 127.75 14.14 145.68
2005 2.53 1.69 1.40 137.42 15.45 158.49
2006 5.12 3.41 0.76 190.32 21.78 221.39
2007 2.88 1.92 0.99 186.18 21.77 213.73
2008 4.44 2.96 0.78 240.53 22.36 271.06
2009 3.97 2.65 2.53 247.34 24.37 280.85

44MINISTRY OF HEALTH(MOH) SUB-ACCOUNT (1997-2009)
Development Expenditure
Although the share of the development to the total health expenditure varies between 11% to 30% sometime policy makers require further detailed data on this expenditure (Figure 4.2).The MOH sub-account is able to produce this data based on the accounting code system of 11 categories of activities or development projects. There are no definite trends in the expenditure of these categories as it is dependent on policy decisions or urgent needs. So in some years there are no expenditures under one category and in other years the expenditures may be high. In 2009, several projects related to hospital facilities and new hospitals consumed a total of RM1,085 million or 43% of the development expenditure (Figure 10.1 and Table 10.1).
RM
Mill
ion
HospitalFacilities
PublicHealth
NewHospitals
Training Transport &Equipment
All OtherProjects
100
0
200
300
400
500
600
700
800
741
606
344
282 272296
FIGURE 10.1 : Expenditure of Various Projects under Development Expenditure, 2009
CHAPTER 10
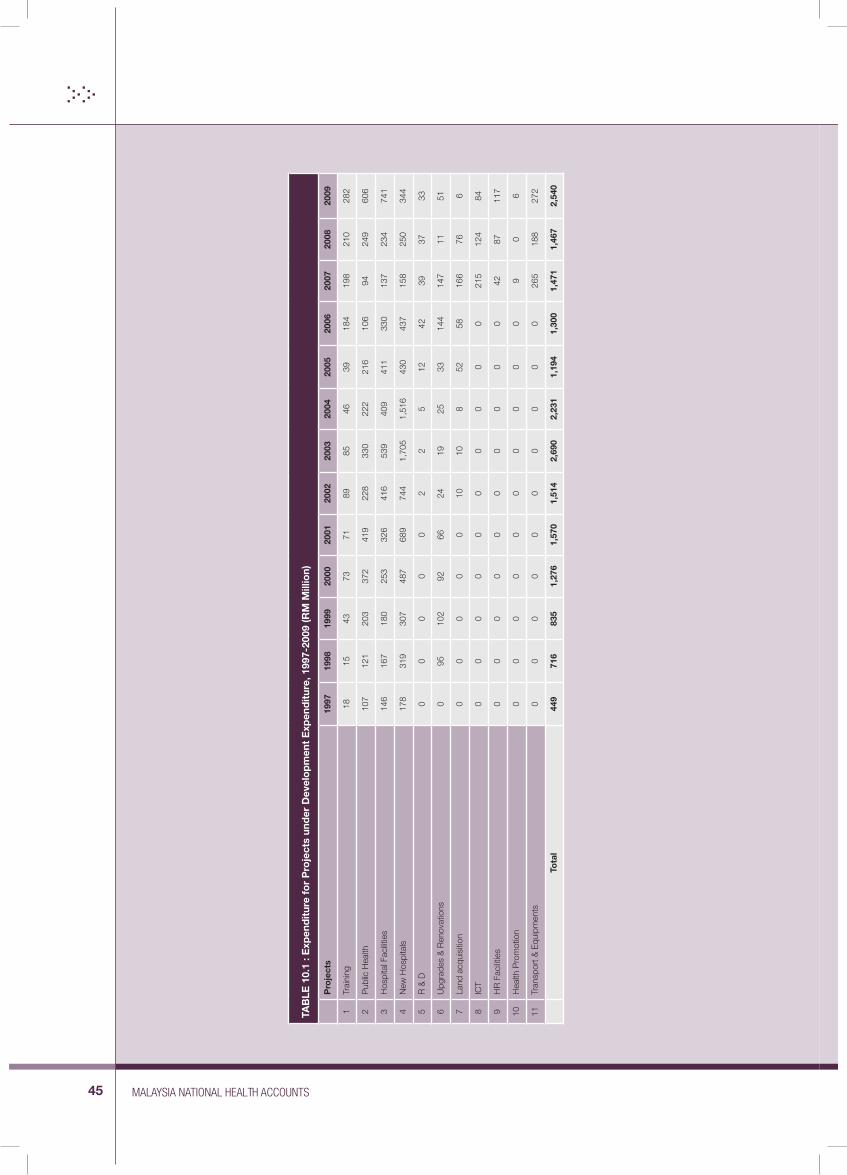
45 MALAYSIA NATIONAL HEALTH ACCOUNTS
TAB
LE 1
0.1
: Exp
end
itur
e fo
r P
roje
cts
und
er D
evel
op
men
t E
xpen
dit
ure,
199
7-20
09 (R
M M
illio
n)
P
roje
cts
1997
1998
1999
2000
2001
2002
2003
2004
2005
2006
2007
2008
2009
1Tr
aini
ng18
1543
7371
8985
4639
184
198
210
282
2P
ublic
Hea
lth10
712
120
337
241
922
833
022
221
610
694
249
606
3H
ospi
tal F
acilit
ies
146
167
180
253
326
416
539
409
411
330
137
234
741
4N
ew H
ospi
tals
178
319
307
487
689
744
1,70
51,
516
430
437
158
250
344
5R
& D
00
00
02
25
1242
3937
33
6U
pgra
des
& R
enov
atio
ns0
9510
292
6624
1925
3314
414
711
51
7La
nd a
cqui
sitio
n0
00
00
1010
852
5816
676
6
8IC
T0
00
00
00
00
021
512
484
9H
R F
acilit
ies
00
00
00
00
00
4287
117
10H
ealth
Pro
mot
ion
00
00
00
00
00
90
6
11Tr
ansp
ort &
Equ
ipm
ents
00
00
00
00
00
265
188
272
Tota
l44
971
683
51,
276
1,57
01,
514
2,69
02,
231
1,19
41,
300
1,47
11,
467
2,54
0
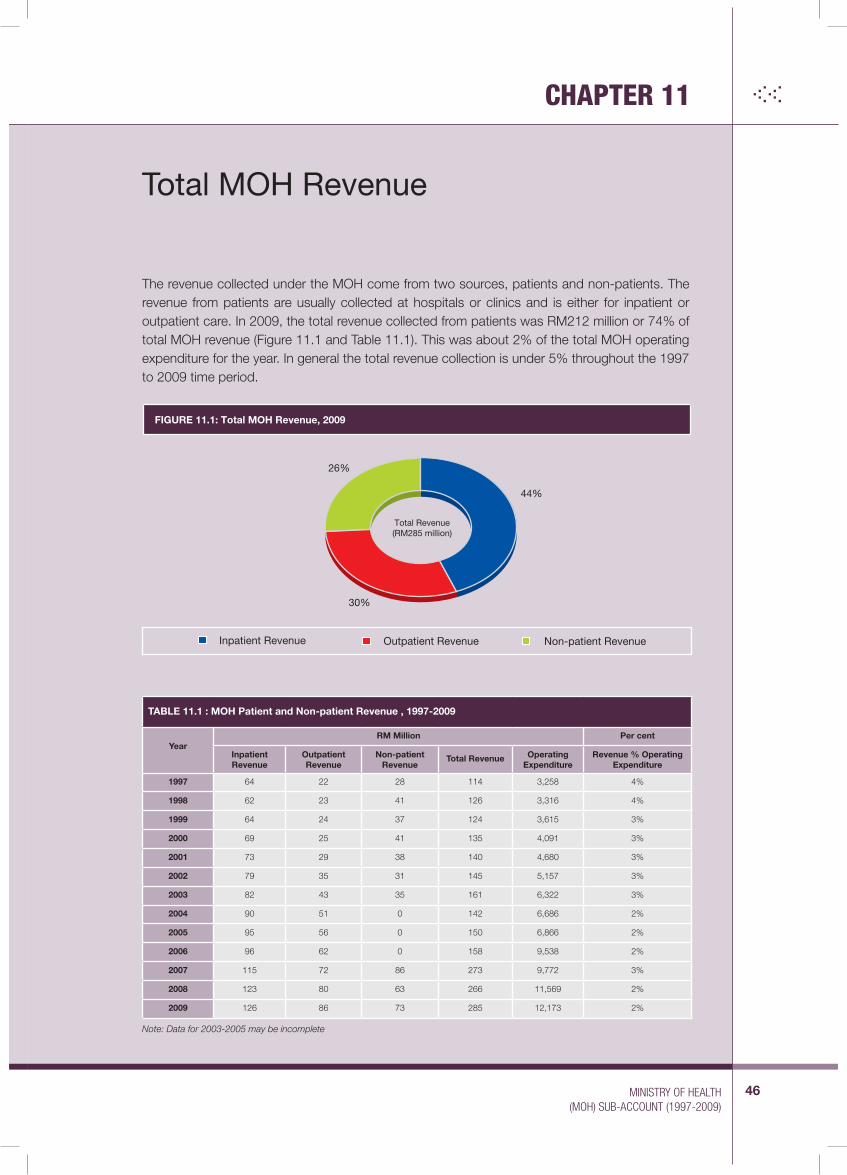
46MINISTRY OF HEALTH(MOH) SUB-ACCOUNT (1997-2009)
Total MOH Revenue
The revenue collected under the MOH come from two sources, patients and non-patients. The revenue from patients are usually collected at hospitals or clinics and is either for inpatient or outpatient care. In 2009, the total revenue collected from patients was RM212 million or 74% of total MOH revenue (Figure 11.1 and Table 11.1). This was about 2% of the total MOH operating expenditure for the year. In general the total revenue collection is under 5% throughout the 1997 to 2009 time period.
Inpatient Revenue Non-patient RevenueOutpatient Revenue
44%
26%
30%
FIGURE 11.1: Total MOH Revenue, 2009
Total Revenue(RM285 million)
CHAPTER 11
TABLE 11.1 : MOH Patient and Non-patient Revenue , 1997-2009
YearRM Million Per cent
Inpatient Revenue
Outpatient Revenue
Non-patient Revenue
Total Revenue Operating Expenditure
Revenue % Operating Expenditure
1997 64 22 28 114 3,258 4%
1998 62 23 41 126 3,316 4%
1999 64 24 37 124 3,615 3%
2000 69 25 41 135 4,091 3%
2001 73 29 38 140 4,680 3%
2002 79 35 31 145 5,157 3%
2003 82 43 35 161 6,322 3%
2004 90 51 0 142 6,686 2%
2005 95 56 0 150 6,866 2%
2006 96 62 0 158 9,538 2%
2007 115 72 86 273 9,772 3%
2008 123 80 63 266 11,569 2%
2009 126 86 73 285 12,173 2%
Note: Data for 2003-2005 may be incomplete
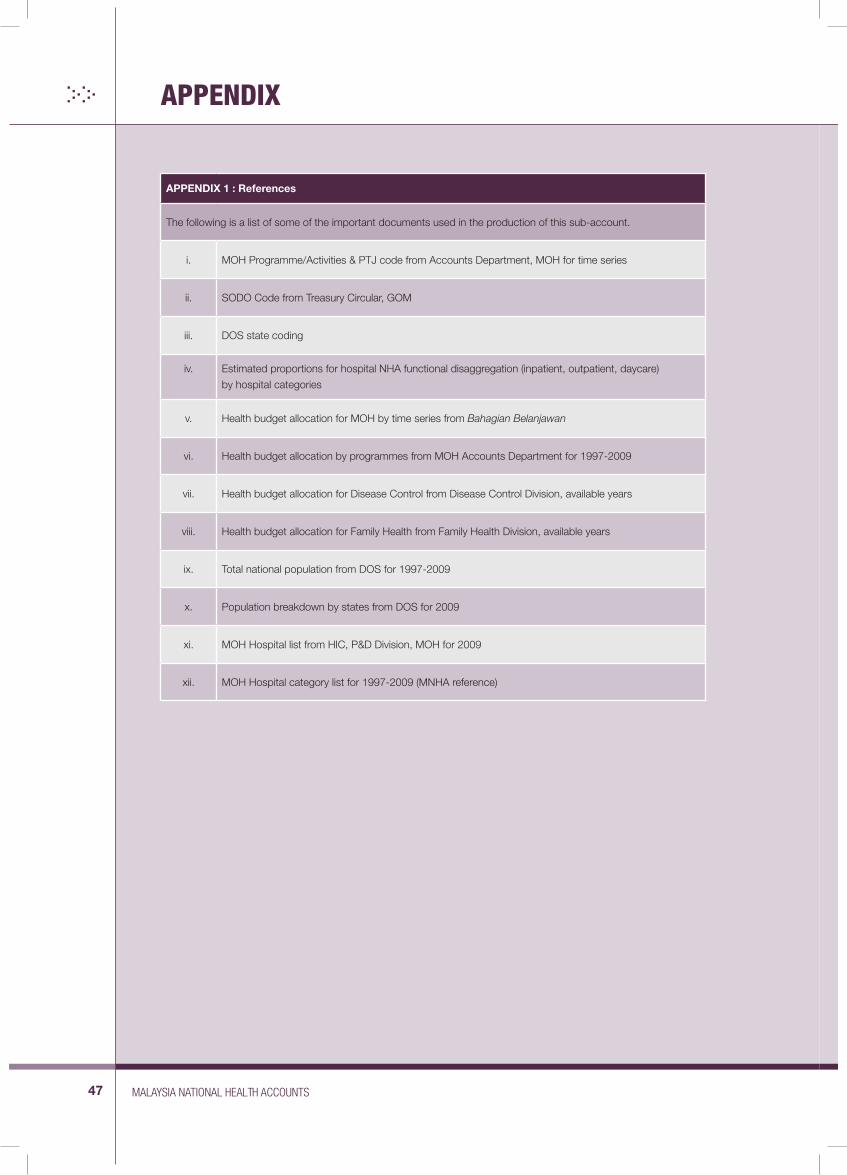
47 MALAYSIA NATIONAL HEALTH ACCOUNTS
APPENDIX 1 : References
The following is a list of some of the important documents used in the production of this sub-account.
i. MOH Programme/Activities & PTJ code from Accounts Department, MOH for time series
ii. SODO Code from Treasury Circular, GOM
iii. DOS state coding
iv. Estimated proportions for hospital NHA functional disaggregation (inpatient, outpatient, daycare)
by hospital categories
v. Health budget allocation for MOH by time series from Bahagian Belanjawan
vi. Health budget allocation by programmes from MOH Accounts Department for 1997-2009
vii. Health budget allocation for Disease Control from Disease Control Division, available years
viii. Health budget allocation for Family Health from Family Health Division, available years
ix. Total national population from DOS for 1997-2009
x. Population breakdown by states from DOS for 2009
xi. MOH Hospital list from HIC, P&D Division, MOH for 2009
xii. MOH Hospital category list for 1997-2009 (MNHA reference)
APPENDIX

48MINISTRY OF HEALTH(MOH) SUB-ACCOUNT (1997-2009)
State (include JKN WPKL) Deputy General Office:
Management State Health Offices
Farmasi State Health Offices
Pergigian (admin & training unit) State Health Offices
Vector Disease Control Division Vector Disease Control Division
District Dental Health Office District Dental Health Office
District Health Office District Health Office
Hospitals by State Hospitals
Kuala Lumpur Hospital Kuala Lumpur Hospital Hospitals
PH Laboratories PH Laboratories PH Laboratories
PJ Pharmacy Division PJ Pharmacy Division PJ Pharmacy Division
Blood Bank Blood Bank Blood Bank
Institutions Research Institutions (6 institutes under NIH) Institutions
Note: CRCC has total of 6 digits with first 2 digits for CRCC 1, next 4 digits for CRCC 2 which are mapped to MNHA code with 6 digits
APPENDIX 2 : Mapping of Cost Responsibility Centre Code to MNHA Code
CRCC 1 CRCC 2 MNHA Code
State / Responsibility centre(xx Digit)
Department/Agencies (xxxx Digit)
Agencies by MNHA Code(xxxxxx Digit)
Head Quarters (14 Departments under CRCC 2)
Management Services Division Head Quarters
Human Resources Division Head Quarters
Finance Division Head Quarters
Planning & Development Division Head Quarters
Pharmaceutical Services Division Head Quarters
Medical Development Division Head Quarters
Public Health Division Head Quarters
Engineering Services Division Head Quarters
Oral Health Division Head Quarters
Information Management Division Head Quarters
Traditional & complementary Medicine Division (TCM)
Head Quarters
Competency Development Division Head Quarters
Nursing Division Head Quarters
Training Management Division: Head Quarters
General Administration Unit Head Quarters
Training Unit Head Quarters
Examination Unit Head Quarters
Nursing & Allied Health College Nursing & Allied Health College
Kolej Latihan Pergigian Malaysia Pulau Pinang
Kolej Latihan Pergigian Malaysia Pulau Pinang Nursing & Allied Health College

49 MALAYSIA NATIONAL HEALTH ACCOUNTS
APPENDIX 3 : List of MOH Hospitals, 2009
Category MOH Hospitals
Category 1 Hospital Kuala Lumpur
Category 2 Hospital Alor Setar
Hospital Melaka
Hospital Pakar Kuala Terengganu
Hospital Pulau Pinang
Hospital Queen Elizabeth , Sabah
Hospital Raja Perempuan Zainab II
Hospital Raja Permaisuri Bainun, Ipoh
Hospital Sultanah Aminah, Johor
Hospital Tg Ampuan Afzan Kuantan
Hospital Tg Ampuan Rahimah Klang
Hospital Tuanku Fauziah, Perlis
Hospital Tuanku Jaafar
Hospital Umum Sarawak
Category 3 Hospital Ampang
Hospital Batu Pahat
Hospital Duchess Of Kent, Sandakan
Hospital Kajang
Hospital Kuala Pilah
Hospital Miri
Hospital Pakar Sultanah Fatimah
Hospital Putrajaya
Hospital Seberang Jaya
Hospital Selayang
Hospital Serdang
Hospital Sibu
Hospital Sultan Abd.Halim
Hospital Sultan Hj.Ahmad Shah / Mentakab / Temerloh
Hospital Sultan Ismail/Pandan
Hospital Sungai Buloh
Hospital Taiping
Hospital Teluk Intan
Institut Perubatan Respiratori
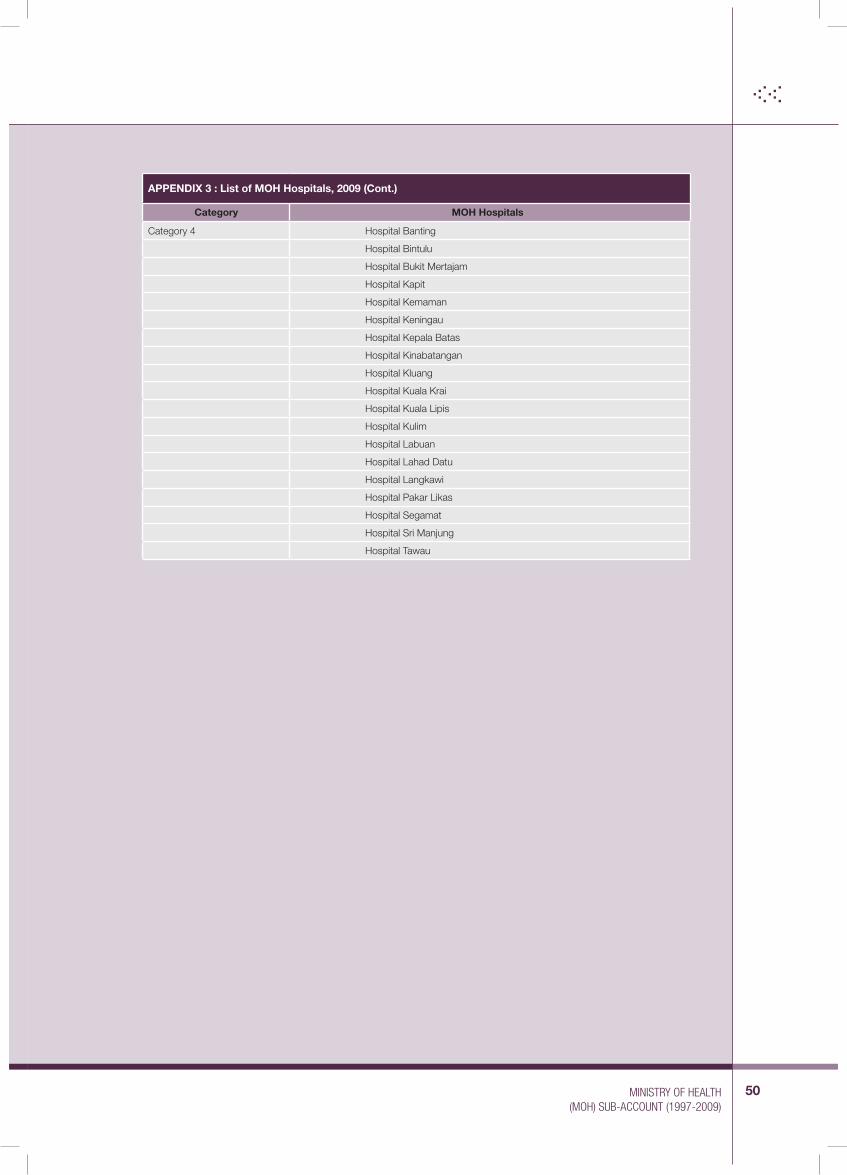
50MINISTRY OF HEALTH(MOH) SUB-ACCOUNT (1997-2009)
Category 4 Hospital Banting
Hospital Bintulu
Hospital Bukit Mertajam
Hospital Kapit
Hospital Kemaman
Hospital Keningau
Hospital Kepala Batas
Hospital Kinabatangan
Hospital Kluang
Hospital Kuala Krai
Hospital Kuala Lipis
Hospital Kulim
Hospital Labuan
Hospital Lahad Datu
Hospital Langkawi
Hospital Pakar Likas
Hospital Segamat
Hospital Sri Manjung
Hospital Tawau
APPENDIX 3 : List of MOH Hospitals, 2009 (Cont.)
Category MOH Hospitals
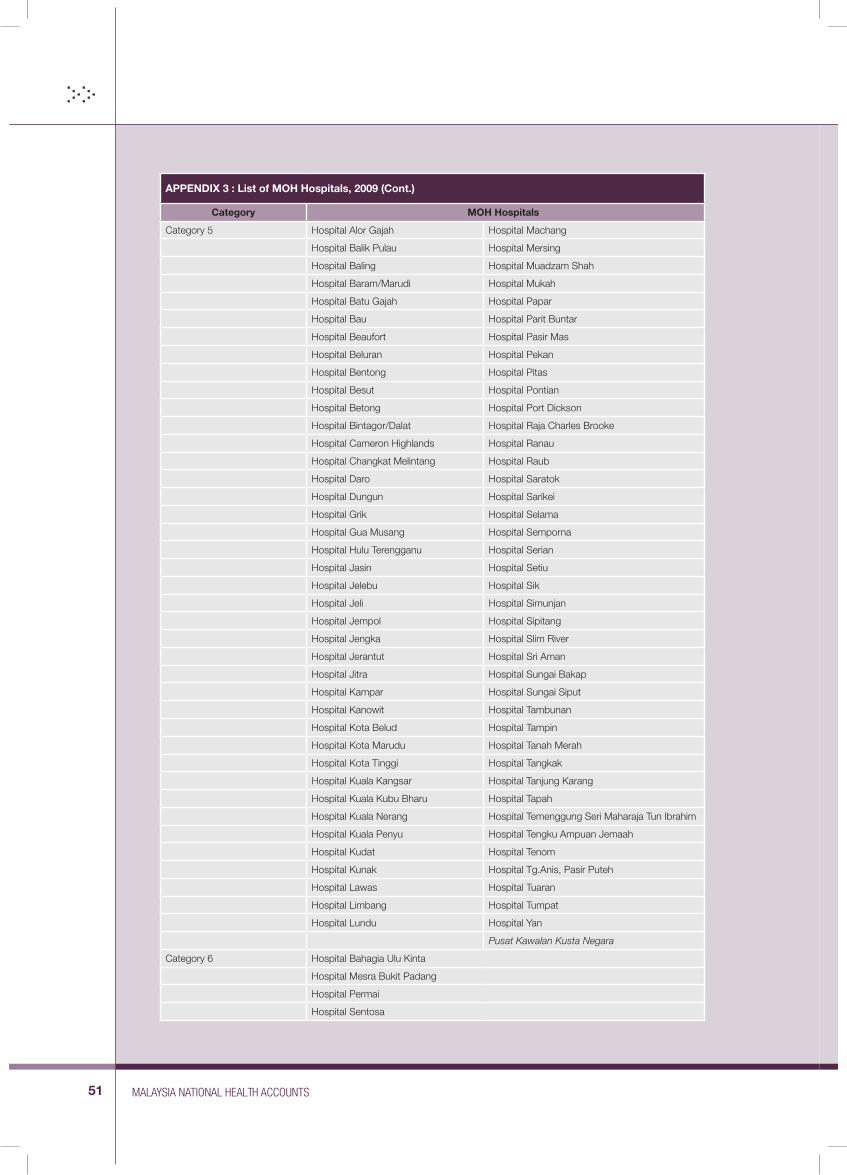
51 MALAYSIA NATIONAL HEALTH ACCOUNTS
Category 5 Hospital Alor Gajah Hospital Machang
Hospital Balik Pulau Hospital Mersing
Hospital Baling Hospital Muadzam Shah
Hospital Baram/Marudi Hospital Mukah
Hospital Batu Gajah Hospital Papar
Hospital Bau Hospital Parit Buntar
Hospital Beaufort Hospital Pasir Mas
Hospital Beluran Hospital Pekan
Hospital Bentong Hospital Pitas
Hospital Besut Hospital Pontian
Hospital Betong Hospital Port Dickson
Hospital Bintagor/Dalat Hospital Raja Charles Brooke
Hospital Cameron Highlands Hospital Ranau
Hospital Changkat Melintang Hospital Raub
Hospital Daro Hospital Saratok
Hospital Dungun Hospital Sarikei
Hospital Grik Hospital Selama
Hospital Gua Musang Hospital Semporna
Hospital Hulu Terengganu Hospital Serian
Hospital Jasin Hospital Setiu
Hospital Jelebu Hospital Sik
Hospital Jeli Hospital Simunjan
Hospital Jempol Hospital Sipitang
Hospital Jengka Hospital Slim River
Hospital Jerantut Hospital Sri Aman
Hospital Jitra Hospital Sungai Bakap
Hospital Kampar Hospital Sungai Siput
Hospital Kanowit Hospital Tambunan
Hospital Kota Belud Hospital Tampin
Hospital Kota Marudu Hospital Tanah Merah
Hospital Kota Tinggi Hospital Tangkak
Hospital Kuala Kangsar Hospital Tanjung Karang
Hospital Kuala Kubu Bharu Hospital Tapah
Hospital Kuala Nerang Hospital Temenggung Seri Maharaja Tun Ibrahim
Hospital Kuala Penyu Hospital Tengku Ampuan Jemaah
Hospital Kudat Hospital Tenom
Hospital Kunak Hospital Tg.Anis, Pasir Puteh
Hospital Lawas Hospital Tuaran
Hospital Limbang Hospital Tumpat
Hospital Lundu Hospital Yan
Pusat Kawalan Kusta Negara
Category 6 Hospital Bahagia Ulu Kinta
Hospital Mesra Bukit Padang
Hospital Permai
Hospital Sentosa
APPENDIX 3 : List of MOH Hospitals, 2009 (Cont.)
Category MOH Hospitals
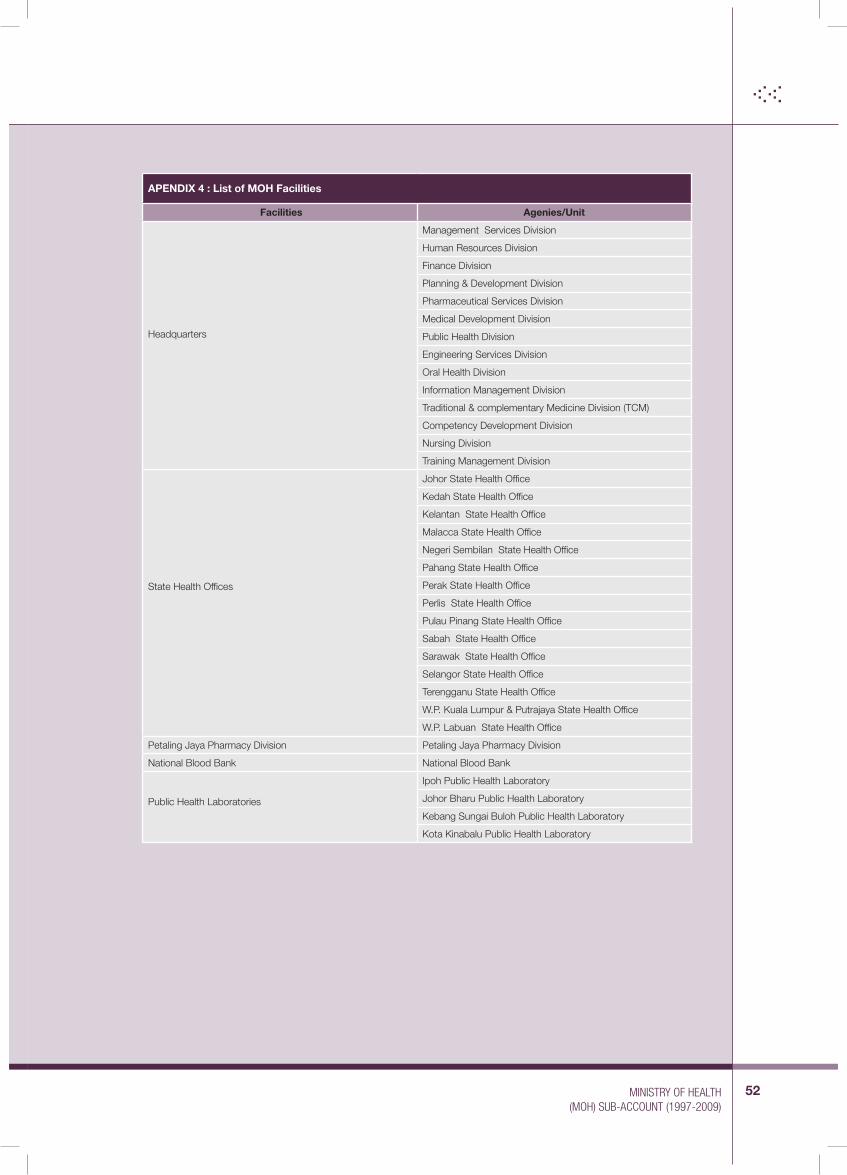
52MINISTRY OF HEALTH(MOH) SUB-ACCOUNT (1997-2009)
APENDIX 4 : List of MOH Facilities
Facilities Agenies/Unit
Headquarters
Management Services Division
Human Resources Division
Finance Division
Planning & Development Division
Pharmaceutical Services Division
Medical Development Division
Public Health Division
Engineering Services Division
Oral Health Division
Information Management Division
Traditional & complementary Medicine Division (TCM)
Competency Development Division
Nursing Division
Training Management Division
State Health Offices
Johor State Health Office
Kedah State Health Office
Kelantan State Health Office
Malacca State Health Office
Negeri Sembilan State Health Office
Pahang State Health Office
Perak State Health Office
Perlis State Health Office
Pulau Pinang State Health Office
Sabah State Health Office
Sarawak State Health Office
Selangor State Health Office
Terengganu State Health Office
W.P. Kuala Lumpur & Putrajaya State Health Office
W.P. Labuan State Health Office
Petaling Jaya Pharmacy Division Petaling Jaya Pharmacy Division
National Blood Bank National Blood Bank
Public Health Laboratories
Ipoh Public Health Laboratory
Johor Bharu Public Health Laboratory
Kebang Sungai Buloh Public Health Laboratory
Kota Kinabalu Public Health Laboratory

53 MALAYSIA NATIONAL HEALTH ACCOUNTS
Research Institutions
Clinical Research Centres
Institute for Health Systems Research
Institute for Public Health
Institute for Health Behavioural Research
Institute for Medical Research
Institute for Health Management
Vector Disease Control Division
Kelantan Vector Disease Control Division
Negeri Sembilan Vector Disease Control Division
Perak Vector Disease Control Division
Perlis Vector Disease Control Division
Sarawak Vector Disease Control Division
Terengganu Vector Disease Control Division
District Health Offices/ Clinics
Johore All District Health Office in Johore
Kedah All District Health Office in Kedah
Kelantan All District Health Office in Kelantan
Malacca All District Health Office in Malacca
Pahang All District Health Office in Pahang
Negeri Sembilan All District Health Office in Negeri Sembilan
Perak All District Health Office in Perak
Perlis All District Health Office in Perlis
Pulau Pinang All District Health Office in Pulau Pinang
Selangor All District Health Office in Selangor
Terengganu All District Health Office in Terengganu
Sabah All District Health Office in Sabah
Sarawak All District Health Office in Sarawak
W.P. Putrajaya All District Health Office in Putrajaya
W.P. Labuan All District Health Office in Labuan
APPENDIX 4 : List of MOH Facilities (Cont.)
Facilities Agenies/Unit

54MINISTRY OF HEALTH(MOH) SUB-ACCOUNT (1997-2009)
APPENDIX 4 : List of MOH Facilities (Cont.)
Facilities Agenies/Unit
Nursing & Allied Health College
Johor
Johor Bahru Nursing College
Johor Bahru Radiography & Radiotherapy College
Muar Nursing College
Batu Pahat Community Nursing College
Kluang Community Nursing College
Segamat Community Nursing College
Kedah
Sungai Petani Nursing College
Alor Setar Nursing College
Alor Setar Medical Assistant College
Kulim Community Nursing College
KelantanPasir Mas Community Nursing College
Kubang Kerian Nursing College
Melaka Melaka Nursing College
Negeri Sembilan
Seremban Nursing College
Port Dickson Community Nursing College
Seremban Medical Assistant College
PahangKuantan Nursing College
Jerantut Community Nursing College
Pulau Pinang
Pulau Pinang Nursing College
Bukit Mertajam Nursing College
Dental Training College of Malaysia, Pulau Pinang
Perak
Ipoh Nursing College
Taiping Nursing College
Ulu Kinta Medical Assistant College
SelangorCollege of Allied Health Sciences Sungai Buloh
Klang Nursing College
TerengganuKuala Terengganu Nursing College
Public Health College,Batu Rakit Terengganu
Sabah
Tawau Community Nursing College
Sandakan Nursing College
College of Allied Health Sciences Kota Kinabalu
Sarawak
Sibu Nursing College
College of Allied Health Sciences Kuching
Public Health College,Kuching
Serian Community Nursing College
W.P. Kuala Lumpur College of Medical Laboratory Technology
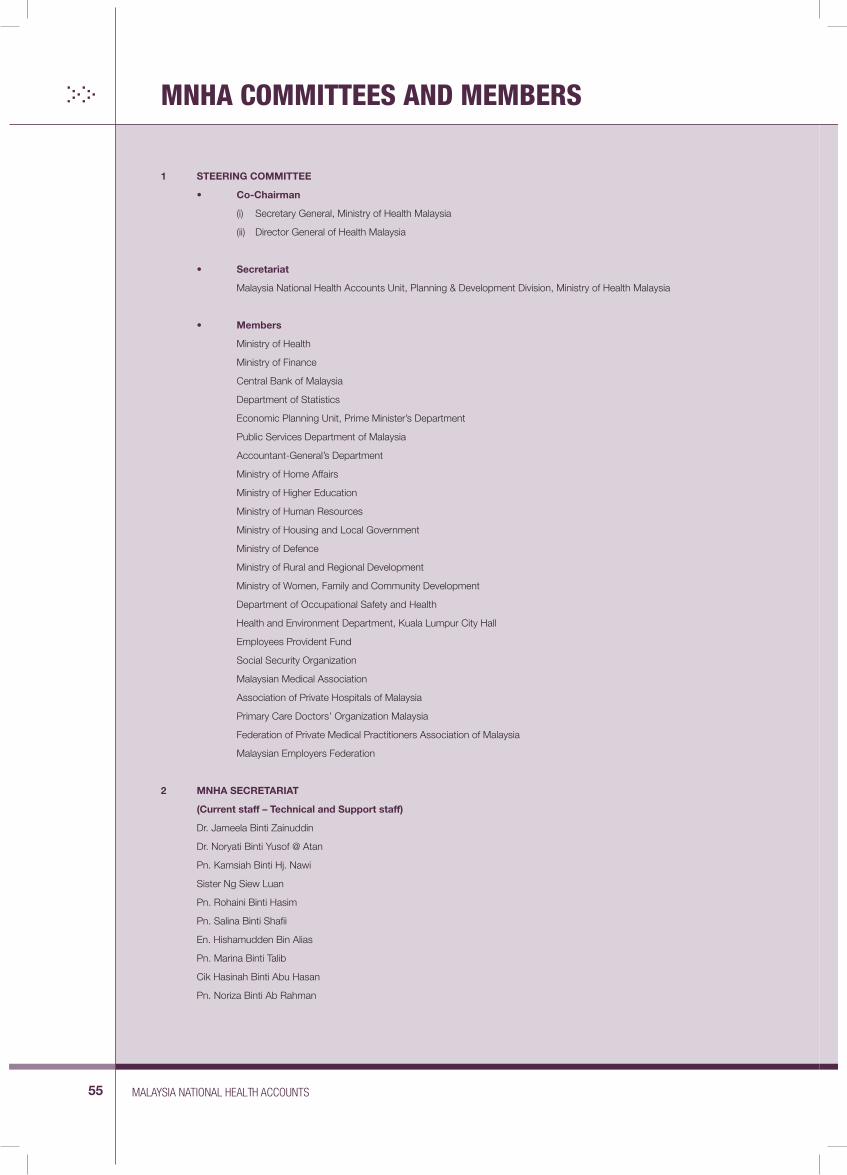
55 MALAYSIA NATIONAL HEALTH ACCOUNTS
MNHA COMMITTEES AND MEMBERS
1 STEERING COMMITTEE
• Co-Chairman
(i) Secretary General, Ministry of Health Malaysia
(ii) Director General of Health Malaysia
• Secretariat
Malaysia National Health Accounts Unit, Planning & Development Division, Ministry of Health Malaysia
• Members
Ministry of Health
Ministry of Finance
Central Bank of Malaysia
Department of Statistics
Economic Planning Unit, Prime Minister’s Department
Public Services Department of Malaysia
Accountant-General’s Department
Ministry of Home Affairs
Ministry of Higher Education
Ministry of Human Resources
Ministry of Housing and Local Government
Ministry of Defence
Ministry of Rural and Regional Development
Ministry of Women, Family and Community Development
Department of Occupational Safety and Health
Health and Environment Department, Kuala Lumpur City Hall
Employees Provident Fund
Social Security Organization
Malaysian Medical Association
Association of Private Hospitals of Malaysia
Primary Care Doctors’ Organization Malaysia
Federation of Private Medical Practitioners Association of Malaysia
Malaysian Employers Federation
2 MNHA SECRETARIAT
(Current staff – Technical and Support staff)
Dr. Jameela Binti Zainuddin
Dr. Noryati Binti Yusof @ Atan
Pn. Kamsiah Binti Hj. Nawi
Sister Ng Siew Luan
Pn. Rohaini Binti Hasim
Pn. Salina Binti Shafii
En. Hishamudden Bin Alias
Pn. Marina Binti Talib
Cik Hasinah Binti Abu Hasan
Pn. Noriza Binti Ab Rahman

56MINISTRY OF HEALTH(MOH) SUB-ACCOUNT (1997-2009)
Cik Wahidah Binti Wahab
Cik Dolly Adam
Pn. Nor Aslinda Waty Binti Rozikin
(Previous MNHA staff)
Dr. Siti Aishah Binti Abdullah
Pn. Rosmaria Binti Salleh
Cik Nurliyana Binti Mohamad
Cik Nur Shazana Binti Azhar
Cik Nur Aisyah Binti Abu Bakar
Cik Nor Amirah Binti Hamid
Cik Nazatul Afirah Binti Sazali
Pn. Za’ebah Binti Ismail
Cik Siti Mezatu Ekma Binti Mohd Noor
Pn. Siti Fatimah Binti Azahari
En. Zaifulnizam Bin Abd Karim
3 REPORT EDITORIAL COMMITTEE
Publication Editor:
Dr. Jameela Binti Zainuddin
Editorial Board Members:
Dr. Noryati Binti Yusof @ Atan
Pn. Salina Binti Shafii
En. Hishamudden Bin Alias
Sister Ng Siew Luan
Pn. Rohaini Binti Hasim
Pn. Kamsiah Binti Hj. Nawi
Secretariat:
Pn. Marina Binti Talib
Cik Hasinah Binti Abu Hasan