Embed Size (px)
Citation preview

ASEAN - German Technical Cooperation | Energy Efficiency and Climate Change Mitigation in the Land Transport Sector
Malaysia Stocktaking Report on
Sustainable Transport and Climate Change
Data, Policy, and Monitoring


Disclaimer
Findings, interpretations, and conclusions
expressed in this document are based on
information gathered by GIZ and its
consultants, partners, and contributors.
GIZ does not, however, guarantee the accuracy
or completeness of information in this
document, and cannot be held responsible for
any errors, omissions or losses which emerge
from its use.
Copyright
This publication may be reproduced in whole or
in part in any form for educational or non-profit
purposes without special permission from the
copyright holder, whenever provided
acknowledgement of the source is made. The
GIZ would appreciate receiving a copy of any
publication that uses this GIZ publication as a
source. No use of this publication may be made
for resale or for any other commercial purpose
whatsoever.
Acknowledgements
The authors and Transport and Climate Change
project (TCC) would like to express our
appreciation to those who have contributed to
this report including: Ministry of Transport
(MOT), the Economic Planning Unit (EPU),
Land Public Transport Commission (SPAD),
Ministry of Finance (MOF), Ministry of Urban
Wellbeing, Housing and Local Government
(KPKT), Ministry of Energy, Green Technology
and Water (KeTTHA), Ministry of Natural
Resources and Environment (NRE), Ministry of
International Trade and Industry (MITI), Road
Transport Department (JPJ), Malaysian Green
Technology Corporation (MGTC), Malaysia
Productivity Corporation (MPC), Technology
Depository Agency (TDA), Sustainable Energy
Development Authority Malaysia (SEDA), as
well as the hard working staff of both GIZ and
Focus Applied Technologies.

Malaysia Stocktaking Report on Sustainable
Transport and Climate Change Data, Policy, and Monitoring
November 2016
Dr Horizon Gitano Briggs, University of Kuala Lumpur – Malaysian Spanish Institute
Leong Hau Kian, Focus Applied Technologies
The project context
The GIZ Programme on Cities, Environment
and Transport (CET) in ASEAN seeks to
reduce emissions from transport and industry by
providing co-benefits for local and global
environmental protection. The CET Project
‘Energy Efficiency and Climate Change
Mitigation in the Land Transport Sector in the
ASEAN region’ (Transport and Climate Change
(TCC) www.TransportandClimateChange.org)
aims in turn to develop strategies and action
plans for more sustainable transport.
The project is funded by the German Federal
Ministry for Economic Cooperation and
Development and implemented by GIZ in
cooperation with the ASEAN secretariat.
As presented to the ASEAN Land Transport
Working group, TCC’s regional activities are in
the area of fuel efficiency, green freight and
logistics, as well as data, indicators, and MRV.
At the national level the project supports
relevant transport and environment government
bodies in Indonesia, Malaysia, the Philippines,
Thailand, and Vietnam for the development of
national action plans on sustainable transport.
TCC also offers capacity building through
different training courses.


i
Table of contents
List of tables ................................................................................................................. iv
List of figures ................................................................................................................. v
List of abbreviations and acronyms ............................................................................ vii
Executive summary ....................................................................................................... 1
1. Introduction ............................................................................................................... 5
2. Transport climate data .............................................................................................. 6
2.1. General country information ............................................................................................... 7
2.2. Transportation........................................................................................................................ 8
2.3. Rail ........................................................................................................................................... 9
2.4. Freight ................................................................................................................................... 11
2.5. Energy consumption and GHG emissions from the transportation sector ............... 11
2.6. Emissions reduction potential from the Malaysia transport sector (road) .................. 18
2.6.1. Modal shift .................................................................................................................. 19
2.6.2. Fleet purge .................................................................................................................. 21
2.6.3. Fuel switch .................................................................................................................. 22
2.6.4. Propulsion switch: Hybrid electric vehicles ........................................................... 24
2.6.5. Propulsion switch: Electric vehicles ....................................................................... 24
2.6.6. Avoid ........................................................................................................................... 26
2.6.7. Summary ..................................................................................................................... 27
2.7. Emissions reduction potential from the Malaysia land freight sector ......................... 28
2.7.1. Freight- shift ............................................................................................................... 28
2.7.2. Freight- improve ........................................................................................................ 29
2.7.3. Freight- fuel switch .................................................................................................... 29
2.7.4. Freight- avoid ............................................................................................................. 29
2.7.5. Freight- summary....................................................................................................... 30
3. Policies and institutions .......................................................................................... 32
3.1. Recent climate change prioritisation ................................................................................. 32
3.2. Stakeholders .......................................................................................................................... 32
3.3. Institutional structure and climate change policies ......................................................... 33
3.3.1. Malaysia national policy on climate change ........................................................... 35

ii
3.3.2. National green technology policy (renewable energy and efficiency for the
transport sector) ................................................................................................................... 37
3.3.3. National Physical Plan (NPP) .................................................................................. 37
3.4. Existing policies on transportation ................................................................................... 38
3.4.1. Policy summary .......................................................................................................... 43
3.5. Environmental policy financing ........................................................................................ 43
3.6. Monitoring ............................................................................................................................ 44
3.7. Future emissions projections ............................................................................................. 45
4. Barriers to sustainable transportation in Malaysia ................................................. 48
4.1. Policy development barriers ............................................................................................... 48
Complex interagency relations ........................................................................................... 48
Absence of lead agency for sustainable transportation .................................................. 48
Lack of carbon emissions emphasis in transport policy ................................................. 49
Lack of resources for implementation and monitoring .................................................. 49
Low awareness of sustainable transport ........................................................................... 49
4.2. Physical and infrastructural barriers to sustainable transport policy ............................ 50
Absence of central technical lab supporting vehicle type approval testing ................. 50
Upgrading PUSPAKOM inspection and testing facilities ............................................. 50
Integrated database system for sustainable transport management.............................. 50
Integrated land use/urban area transport planning ........................................................ 50
Insufficient transport hub interconnectivity .................................................................... 51
Underutilisation of inland port rail, port congestion and multi-modality.................... 51
Light commuter rail expansion .......................................................................................... 52
Alternative fuels .................................................................................................................... 52
Insufficient parking .............................................................................................................. 52
Non-motorised transport: Nascent ................................................................................... 52
4.3. Behavioural and informational barriers to sustainable transport policy ...................... 52
Certification of corporate CO2 emissions ........................................................................ 52
Green technology encouragement via taxation/subsidies ............................................. 53
Energy efficiency labelling (all classes) .............................................................................. 53
Road use (congestion) pricing ............................................................................................ 53
Bus route optimisation ........................................................................................................ 53
Integrated ticketing .............................................................................................................. 53
iii
Intelligent transport information systems ........................................................................ 53
Cars/truck restriction times/zones ................................................................................... 54
Car share ................................................................................................................................ 54
Freight “load share” ............................................................................................................. 54
Inspection, maintenance and vehicle End of Life (EOL) .............................................. 54
5. Recommendations for action .................................................................................. 55
5.1. Strengthening institutions and capacity building............................................................. 55
5.2. Avoidance strategies ............................................................................................................ 57
5.3. Modal shift strategies .......................................................................................................... 58
5.4. Improvement strategies ...................................................................................................... 60
6. Conclusion ................................................................................................................ 61
References ................................................................................................................... 62
Appendix 1: List of policies related to transportation in Malaysia ............................. 65
Appendix 2: New vehicle registration data for year 2014 (Source: MOT) .................. 69
Appendix 3: Functions of ministries and agencies related to transport and climate
change ......................................................................................................................... 72
Appendix 4: Laws and regulations related to transportation in Malaysia .................. 78
Appendix 5: Existing policies and measures on transport ......................................... 83

iv
List of tables
Table 1: Fuel type and emissions factors (Source: US Energy Information Administration, 2015). .. 6
Table 2: Final energy demand by sector (ktoe) (Source: Energy Hand Book Malaysia, 2015). ............ 12
Table 3: Emissions intensity and emissions figures for various transportation modes (Source:
Australian Greenhouse Office, 2006). ............................................................................................................ 18
Table 4: Energy intensity of various transport options adapted for typical Malaysia passenger load
factors from US data (Source: US Transportation Energy Book, 2010). ................................................. 20
Table 5: CO2 reduction by modal shift, by percentage (Source: Author, 2015). ..................................... 20
Table 6: Mt CO2 reduction by modal shift from a baseline of 50 Mt total from the transport sector
(Source: Author, 2015). ..................................................................................................................................... 20
Table 7: CO2 emissions of various fuels (Source: US Energy Information Administration, 2015). .... 22
Table 8: Years to breakeven of various CNG conversion cost (Source: Author, 2015). ....................... 23
Table 9: Potential annual CO2 emissions reduction from a baseline of 50 Mt of CO2 total from
transport sector (Source: Author, 2015). ....................................................................................................... 27
Table 10: Fuel consumption of water, rail and truck freight (Source: Transportation Energy Data
Book (US), 2011). .............................................................................................................................................. 28
Table 11: CO2 Emissions reduction from overland freight from a baseline of 11.5 Mt of CO2 from
the land freight sector (Source: Author, 2016). ............................................................................................. 31
Table 12: Passenger transport policies and measures: Current status (Source: Author, 2015). ............ 41
Table 13: Freight transport policies and measures: current status (Source: Author, 2015). .................. 43
Table 14: Monitoring system and data availability for each transport sector in Malaysia (Source:
Author, 2015). .................................................................................................................................................... 45
v
List of figures
Figure 1: Actual Malaysian CO2 emission per GDP with trend (dotted line) required to meet the 40%
reduction commitment (see box page 1) by 2020 (Source: World Data Bank, 2012). ............................. 4
Figure 2: Malaysia’s population by year (Source: World Data Bank, 2015). .............................................. 7
Figure 3: Malaysia estimated population density; scale is 0 to 4500 people per square kilometre.
(Source: Socioeconomic Data Application Centre (SEDAC), 2010). ......................................................... 8
Figure 4: Number of car registrations by year (Source: Ministry of Transport Malaysia (MOT), 2015).
................................................................................................................................................................................ 9
Figure 5: The rail line in Peninsular (left) and Sabah Malaysia (right). (Note the difference in scale)
(Source: KTMB, 2013). ..................................................................................................................................... 10
Figure 6: Rail passenger kilometre by year, Malaysia (Source: World Data Bank, 2014). ...................... 10
Figure 7: Trends in CO2 emission by different sectors of Malaysia during 1971-2010 (Source:
Shamsuddin, Anil, and Othman, 2014). ......................................................................................................... 12
Figure 8: Trends in transportation CO2 emission in Malaysia during 1971-2010 (Source: Shamsuddin,
Anil, and Othman, 2014). ................................................................................................................................. 13
Figure 9: Share of different transport modes to total CO2 emissions, year 2012 (Source: Hosseini et
al., 2013). ............................................................................................................................................................. 13
Figure 10: Contributions of different road vehicles to transportation CO2 emissions for 2012
(Source: Hosseini et al., 2013). ......................................................................................................................... 14
Figure 11: New registered motor vehicles Malaysia (Source: Ministry of Transport, 2014). ................ 14
Figure 12: New registered motor vehicles by type of fuel usage, Malaysia (Source: Ministry of
Transport, 2014). ............................................................................................................................................... 15
Figure 13: Fuel economy ratio for passenger cars in Malaysia (Source: Aizura, Mahlia, Masjuki, 2010)
. ............................................................................................................................................................................. 15
Figure 14: Energy consumption by transportation (Source: Energy Hand Book, 2014). ...................... 16
Figure 15: Age break down of cars in Malaysia (Dec 2012) (Source: Malaysia Automotive Institute,
Automotive Roadmap Highlight, 2013). ........................................................................................................ 17
Figure 16: This motorcycle has been converted to operate on CNG and can travel 200km for RM4
(about 1 USD) of fuel (Source: Authors, 2016). ........................................................................................... 23
Figure 17: Electrical power generation in Malaysia (Source: Energy Hand Book, 2015). ..................... 25
Figure 18: Electric “motorcycles” like this one are very popular in Malaysia, however their usage
raises many safety concerns, such as underage drivers (Source: Author, 2014). ..................................... 25
Figure 19: Freight exchange service offered by Transport4U (Source: Transport4U, 2015). ............... 30
Figure 20: Overview of responsibility for transportation policy, adapted from institutional
cooperation for sustainable transport in Malaysia workshop report, GIZ (Source: Author, 2016). .... 35
Figure 21: Overall framework on national policy of climate change (Source: UKM, 2008). ................ 36
Figure 22: Projection of GDP and population growth of Malaysia to year 2040 (Source: Adapted
from World Bank Data, 2013). ........................................................................................................................ 46

vi
Figure 23: Projected CO2 emissions at various rates of remediation adoption (Source: Author, 2015)
. ............................................................................................................................................................................. 46
Figure 24: CO2 emissions per GDP (triangles are World Bank data, small circles are CAIT data) with
Business As Usual trend and 100% transportation remediation adaption (Source: Author, 2015). .... 47
Figure 25: Explanation of intermodal container transportation (Source: Nasir, 2014). ......................... 51

vii
List of abbreviations and acronyms
ADB Asian Development Bank
ASEAN Association of Southeast Asian Nations
ASIF Activity-Structure-Intensity-Fuel
BAU Business As Usual (assumes no major changes in current trend)
BRT Bus Rapid Transit
CAIT Climate Data Explorer from World Resources Institute
CDM Clean Development Mechanism
CET GIZ Programme on Cities, Environment and Transport
CNG Compressed Natural Gas
CO Carbon Monoxide
CO2 Carbon Dioxide
COMOS Cohesive Mobility Solution
DDF Diesel Dual Fuel system
DfT Department for Transportation (UK)
DOE Department of Environment
DNA Designated National Authority
EIA Energy Information Administration (a service of the US government)
EOL End Of Life
EPA Environmental Protection Agency
EPU Economy Planning Unit
EQA Environmental Quality Act
EST Environmentally Sustainable Transport
ETS Electric Train Service
EV Electric Vehicle
GDP Gross Domestic Product
GIZ Deutsche Gesellschaft für Internationale Zusammenarbeit (GIZ) GmbH
GHG Green House Gas
GTFS Green Technology Financing Scheme
HC Hydrocarbon
HDV Heavy Duty Vehicle
HEV Hybrid Electric Vehicle
ICE Internal Combustion Engine
IM Inspection and Maintenance
INDC Intended Nationally Determined Contribution
ITS Intelligent Transportation System
JKR Jabatan Kerja Raya
JPJ Jabatan Pengangkutan Jalan or Road Transport Department
KeTTHA Kementerian Tenaga, Teknologi Hijau dan Air or Ministry of Energy, Green
Technology and Water
KL Kuala Lumpur, also greater Kuala Lumpur/ Klang Valley
KLIA Kuala Lumpur International Airport
KPKT Ministry of Urban Wellbeing, Housing and Local Government
km Kilometre
KWP Ministry of the Federal Territories

viii
LDV Light Duty Vehicle
LNG Liquid Natural Gas
LPG Liquefied Petroleum Gas
M Million
MAI Malaysian Automotive Institute
MC Motorcycle
MIGHT Malaysian Industry-Government Group for High Technology
MIROS Malaysia Institute of Road Safety Research
MITI Ministry of Trade and Industry
MGTC Malaysian Green Technology Corporation
Mt Million Metric Tonnes
MNRE Ministry of Natural Resources and Environment
MOF Ministry of Finance
MOT Ministry of Transport
MOW Ministry of Works (KJR)
MPV Multi-purpose Vehicle
MRT Mass Rapid Transit
MRV Measuring, Recording and Verification
NAMA Nationally Appropriate Mitigation Actions
NGO Non-government Organisation
NOX Nitrogen Oxide
NRE Ministry of National Resources and Environment
NPP National Physical Plan
NPPC National Physical Council
NRE Ministry of Natural Resources and Environment
PKT Passenger-kilometre Travelled
PM Particulate Matter
PMD Prime Minister's Department
PTM Centre for the Restructuring of Malaysia
PUSPAKOM Pusat Pemeriksaan Kenderaan Berkomputer or Malaysian National Automobile
Inspection Center
RFID Radio Frequency Identification
RMG Recommended Malaysian Air Quality Guideline
SEDAC Socioeconomic Data Application Centre
SPAD Suruhanjaya Pengangkutan Awam Darat or Land Public Transport Commission
SUV Sports Utility Vehicle
TCC Transport and Climate Change
TKT Ton-kilometre Travelled
TNB Tenaga Nasional Berhad
TOD Transportation Oriented Development
VKT Vehicle-kilometre Travelled
VTA Vehicle Type Approval
Toe Ton of Oil Equivalent
UK United Kingdom
UKM Universiti Kebangsaan Malaysia
UNFCCC United Nations Framework Convention on Climate Change
USD United States Dollar VTA Vehicle Type Approval WRI World Resources Institute
1
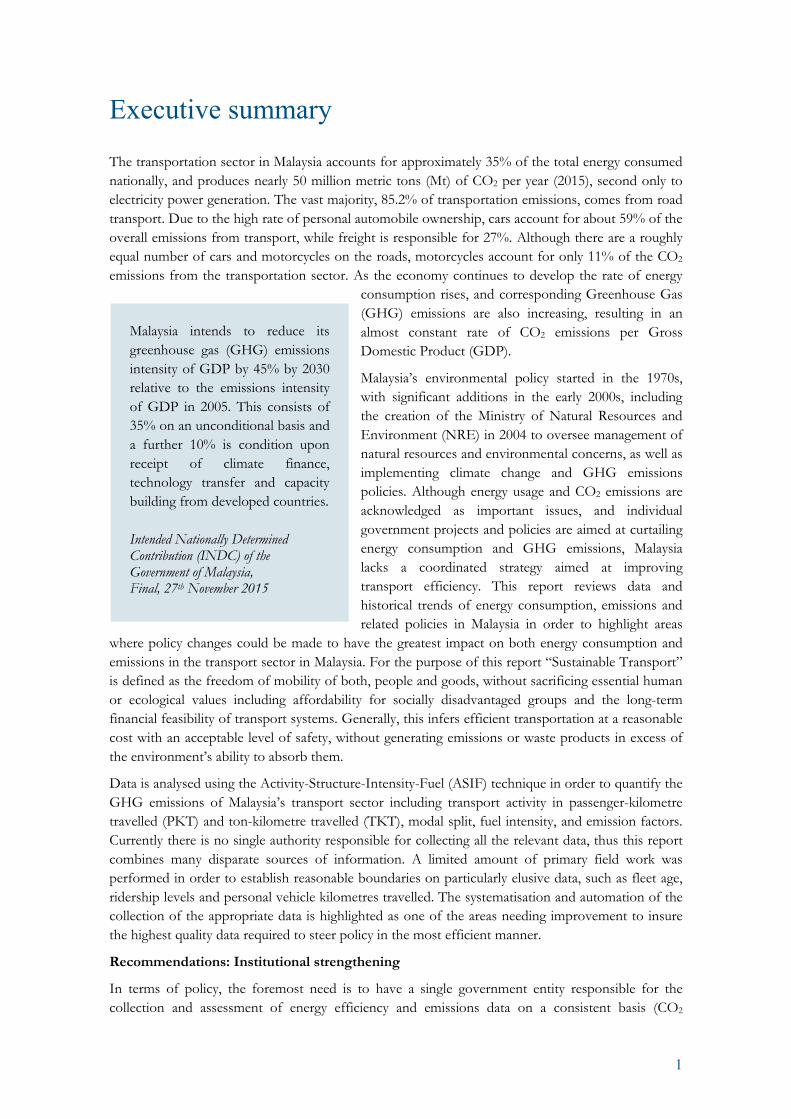
Executive summary
The transportation sector in Malaysia accounts for approximately 35% of the total energy consumed
nationally, and produces nearly 50 million metric tons (Mt) of CO2 per year (2015), second only to
electricity power generation. The vast majority, 85.2% of transportation emissions, comes from road
transport. Due to the high rate of personal automobile ownership, cars account for about 59% of the
overall emissions from transport, while freight is responsible for 27%. Although there are a roughly
equal number of cars and motorcycles on the roads, motorcycles account for only 11% of the CO2
emissions from the transportation sector. As the economy continues to develop the rate of energy
consumption rises, and corresponding Greenhouse Gas
(GHG) emissions are also increasing, resulting in an
almost constant rate of CO2 emissions per Gross
Domestic Product (GDP).
Malaysia’s environmental policy started in the 1970s,
with significant additions in the early 2000s, including
the creation of the Ministry of Natural Resources and
Environment (NRE) in 2004 to oversee management of
natural resources and environmental concerns, as well as
implementing climate change and GHG emissions
policies. Although energy usage and CO2 emissions are
acknowledged as important issues, and individual
government projects and policies are aimed at curtailing
energy consumption and GHG emissions, Malaysia
lacks a coordinated strategy aimed at improving
transport efficiency. This report reviews data and
historical trends of energy consumption, emissions and
related policies in Malaysia in order to highlight areas
where policy changes could be made to have the greatest impact on both energy consumption and
emissions in the transport sector in Malaysia. For the purpose of this report “Sustainable Transport”
is defined as the freedom of mobility of both, people and goods, without sacrificing essential human
or ecological values including affordability for socially disadvantaged groups and the long-term
financial feasibility of transport systems. Generally, this infers efficient transportation at a reasonable
cost with an acceptable level of safety, without generating emissions or waste products in excess of
the environment’s ability to absorb them.
Data is analysed using the Activity-Structure-Intensity-Fuel (ASIF) technique in order to quantify the
GHG emissions of Malaysia’s transport sector including transport activity in passenger-kilometre
travelled (PKT) and ton-kilometre travelled (TKT), modal split, fuel intensity, and emission factors.
Currently there is no single authority responsible for collecting all the relevant data, thus this report
combines many disparate sources of information. A limited amount of primary field work was
performed in order to establish reasonable boundaries on particularly elusive data, such as fleet age,
ridership levels and personal vehicle kilometres travelled. The systematisation and automation of the
collection of the appropriate data is highlighted as one of the areas needing improvement to insure
the highest quality data required to steer policy in the most efficient manner.
Recommendations: Institutional strengthening
In terms of policy, the foremost need is to have a single government entity responsible for the
collection and assessment of energy efficiency and emissions data on a consistent basis (CO2
Malaysia intends to reduce its
greenhouse gas (GHG) emissions
intensity of GDP by 45% by 2030
relative to the emissions intensity
of GDP in 2005. This consists of
35% on an unconditional basis and
a further 10% is condition upon
receipt of climate finance,
technology transfer and capacity
building from developed countries.
Intended Nationally Determined Contribution (INDC) of the Government of Malaysia, Final, 27th November 2015

2
emissions per passenger kilometre or per ton kilometre of freight), as well as the responsibility for
informing and educating others involved in the policy development process. Historically, policy has
been oriented towards economic development, and environmental considerations are sometimes
viewed as secondary priorities. Supporting and educating policy makers and those involved in policy
implementation of the positive long-term economic effects of sustainable transportation
development will help improve the rate of adoption of new policies. The policy makers require the
appropriate information to allow them to make data driven policies. Additionally, policy promulgated
at the federal level often requires enforcement by local authorities who may not have the resources
required or understand the importance of enforcement, thereby reducing compliance and
effectiveness of environmental policies. Thus, public education will be required for the success of
this endeavour.
Transportation avoidance and shift strategies
Due to the large number, personal automobiles in Malaysia are responsible for approximately half of
all transportation related CO2 emissions. The single most significant reduction of transportation
related emissions would be to reduce private car usage by shifting to more efficient modes such as
electric trains or buses. Various measures can be taken to restrict personal automobile usage,
including congestion road use pricing, increased road fees, and proliferation of multi occupant
vehicle lanes. However, these needs to be coupled with the provision of alternative transportation
options. In areas where other transportation options are not available, these need to be developed in
the long term, but in the short-term policy can encourage increased ridership per vehicle, or less
polluting fuels such as LPG or CNG, or alternatively a shift to electrification of personal vehicles.
Two-wheeled vehicles are significantly more efficient than four-wheeled vehicles, and encouraging
use of clean and efficient motorcycles could reduce transportation emissions by up to 17%, however
motorcycle safety is an important concern which simultaneously requires addressing.
Rail infrastructure for freight already exists, however it is greatly underutilised, with as much as 95%
of all domestic freight movement is by road. As road transportation of freight consumes more than
ten times the energy of rail transportation, this single modal shift alone could reduce freight CO2
emissions by 43%. Similarly, reduction of “empty back hauling” could reduce freight emissions by
around 42%.
In the longer term, large gains can be made by appropriate urban planning and integrated
infrastructure development. Malaysia has shown excellent integrated urban planning in the greater
Kuala Lumpur/Klang Valley (KL/KV) area, and many of the lessons learned there urgently need to
be applied country-wide to have the greatest impact.
Incremental transportation improvements
Along with shifting to the most efficient transportation mode available, significant gains can be made
by improving the existing transportation situation. Bottlenecks and lack of alternatives are a major
hindrance to efficient movement of both passengers and freight through the various transportation
hubs. Many public transport hubs such as airports, train stations, and even bus stations, have
insufficient public transport links to other hubs, thereby requiring the use of taxis (the highest CO2
emitting transport mode of all) or personal automobiles (the second highest CO2 emitter).
It has been shown that a significant proportion (close to 10%) of on-the-road vehicles are
significantly mistuned, generally due to wear or breakage of some minor component, and
subsequently consume more fuel and emit more CO2 than properly tuned vehicles. Although an
Inspection and Maintenance (IM) program exists for commercial trucks and public vehicles, it does
not include loaded emissions testing necessary to detect polluting vehicles (vehicles are tested
without loading the engines, i.e. at idle or revving the engine in neutral). This programme needs to be

3
enhanced to provide loaded testing, and extended to older automobiles as well in order to eliminate
the extreme polluters. By singling out the small number of exceptionally dirty vehicles, owners can
be made aware of the problems, potentially saving them money otherwise spent on fuel by rectifying
the problems with their vehicle.
Comparison with other ASEAN countries
Common issues faced by Malaysia and other ASEAN member states include:
Data collection for transportation is often sporadic and insufficient for the needs of policy
development.
Land use planning is a fundamental need for efficient transportation, however to date it has
been largely overlooked as many cities have grown “organically” over time without master
planning.
Policy implementation is often left to local authorities who sometimes lack the required
resources (financial, equipment, human or training) to properly fulfil the requirements of the
policy.
Freight exchange is by nature a “super company” responsibility in that individual freight
companies generally do not have enough volume to take full advantage of fleet vehicles
during back-hauls. There is a clear need for national, or even international, coordination of
freight shipping to achieve maximum possible efficiencies.
Additionally, by comparison with other countries in the region, it can be seen that Malaysia has some
distinct advantages and innovative transportation measures already in place:
Kuala Lumpur (greater KL/ KV) area has benefited from integrated transportation and land
use planning for several years, with noticeable results in terms of ease of transport compared
with other cities of a similar size.
The light rail system here is mature, reaching to the Thai border, and undergoing significant
expansion.
Malaysia leads the world in motorcycle-only infrastructure, increasing the ease and safety of
commuting on two wheeled vehicles.
The truck ban during major festive seasons. When millions of people return to their home
towns for public holidays, trucks are banned from the roads for certain hours of certain
days. The freight control tremendously eases the traffic situation, as the passenger vehicles
already crowd the roads.
Going forwards there is a lot to be learned from each other, and there is a need for greater regional
cooperation, especially in the area of transportation sustainability. Many of the lessons gleaned from
other countries of the region can be applied here in Malaysia, and Malaysia undoubtedly has a lot to
offer in return. The recently published Kuala Lumpur Strategic Transportation Plan, an ASEAN wide
transportation development plan, is a good example of just such cooperative planning.
Potential impact of sustainable transport
With the implementation of a few of the most basic recommendations, it is calculated that Malaysia
can reduce transport related emissions by up to 71Mt of CO2 per year (representing a 50% reduction
of transportation related emissions) by 2030. While this represents a significant improvement in the
state of transportation sustainability, it will not be sufficient to achieve the stated goal of a 40%
reduction in CO2 emissions per GDP by 2020 without other measures taken simultaneously.

4
Figure 1: Actual Malaysian CO2 emissions per GDP with trend (dotted line) required to meet the 40%
reduction commitment (see box page 1) by 2020 (Source: World Data Bank, 2012).
Malaysia is well positioned to be an important local hub of environmental activity. Many of the
requisite factors, such as mature infrastructure development, centralised policy, and standards
development are already in place. Notably Malaysia has recently decided to develop rigorous
standards for all classes of electric two-wheeled vehicles, taking a leading role in the dissemination of
this highly efficient technology. By implementing the suggestions contained in this report, Malaysia
can significantly reduce CO2 emissions while maintaining a reasonable rate of economic
development and standard of living. Along with the trend of increasing regional integration, this may
allow Malaysia to take on a greater role in transportation systems planning and implementation
within ASEAN.

5
1. Introduction
Malaysia has been one of the fastest growing ASEAN (Association of South East Asian Nations)
countries since its independence. This is due to several factors including the relatively open market
encouraging foreign investment, good macro-economic controls, and excellent infrastructure (Hill,
2003). Additionally, large-scale government and semi-government controlled companies such as
PETRONAS (the national petroleum company, founded in 1974) and Proton (the first national car
company, founded in 1983) have encouraged natural resource exploitation and increased personal car
ownership. Other major (non-transportation) areas of development have focused on export oriented
manufacturing sector, notably including semiconductor components and electrical goods. The
government has had a stable and well-coordinated plan of development, sustained over several
decades with the intention of converting the economy from a largely natural resource base to a more
diversified, globally oriented mixed economy. To encourage external investment, political stability
and infrastructure development have been key objectives of the Malaysian government. As a result,
today Malaysia has one of the largest and best highway networks in the world, and is the home to
many other major infrastructure works such as the Kuala Lumpur International Airport (KLIA), the
PETRONAS Twin Towers and the government administrative centre of Putrajaya.
The focus on automobile manufacturing and petroleum resources development together with
significant growth in prosperity has helped to increase the rate of car ownership in Malaysia, ranking
now as 3rd globally (Nielsen, 2014)1. In terms of environmental impact, the economic advancement
in Malaysia is a distinctly mixed blessing.
This report provides an up-to-date (2016) picture of the transport sector and transport-related
greenhouse gas emissions and mitigation policies in Malaysia, and includes identification of “gaps”
where policies and practices can be changed in order to improve overall transportation efficiency and
sustainability. The focus of this report is primarily on land transport including both passenger and
freight transport. Initially, background transportation and trend analysis is presented (Chapter 2),
followed by a presentation and analysis of policies related to sustainable transport based on the ASIF
approach (Chapter 3), barriers towards low-carbon transport (Chapter 4), and finally
recommendations for further action on policy development and capacity-building (Chapter 5). The
report is based on existing literature and policy documents, interviews with policymakers and experts
and a limited amount of primary field work.
1 Taken from The Star Online: http://www.thestar.com.my/business/business-news/2014/04/16/car-ownership-in-msia-third-highest-in-the-world/

6
2. Transport climate data
This chapter gives an overview of the key transportation trends and environmental related issues in
Malaysia. It includes vehicle sales and annual registrations, transport demand statistics, average
occupancy and load factors, modal distribution for passengers and freight, average vehicle-kilometre
travelled (VKT), vehicle population by vehicle and fuel type, emissions factors of the various
transportation modes, fuel characteristics. Additional demographic information is also included such
as gross domestic product (GDP), total population, population growth rate and overall economic
activity.
Good policy decisions are difficult to make without the appropriate data. Improved transportation
and emissions data collection are crucially needed to track the progress of policies aimed at
improving the energy efficiency and reducing overall GHG emissions of the transportation sector.
This need is becoming more acute with increasing emphasis on international climate negotiations
and communications for Measuring, Reporting and Verification (MRV), the standard emissions
measurement and reporting protocol used internationally to assess emissions pledges and/or
obligations.
Different exhaust emissions components have different global warming effects, for example N2O, an
eventual product of combustion NOx emissions, has about 300 times the effect of CO2 on global
warming. To simplify this, we use the following fuel specific CO2 emissions factors (kg CO2/MJ) for
the various fuel sources used for transportation in Malaysia:
Type of fuel Emission factor (kg CO2/MJ)
Coal 0.092
Diesel 0.069
Petrol 0.068
Propane 0.060
Natural Gas 0.050
Table 1: Fuel type and emissions factors (Source: US Energy Information Administration, 2015).
While the exact emissions of any given combustion system may vary, it is clear from the data in
Table 1 that coal is by far the dirtiest fossil fuel, and natural gas is the cleanest. As these emissions
factors are largely based on chemistry, they will hold true everywhere, with some variation in the
emissions of coal, which is based on its exact composition. This can have significant impacts on the
equivalent emissions of Electric Vehicles (EVs), as will be shown later. EVs charged from a
predominantly coal powered grid are likely to contribute far more CO2 emissions than EVs charged
from a natural gas powered grid.

7
2.1. General country information
Malaysia is home to over 30 M people, with about 50% Malays, 23% Chinese, 12% natives of Sabah
and Sarawak (the two eastern provinces on the island of Borneo), 7% Indians and 8% non-
Malaysians (typically foreign guest workers). The current population growth rate is approximately
1.8% per year. The climate is tropical, with average temperatures around 28°C and rainfall of
2500mm anually. Malaysia is comprised of 2 major separate land masses: Peninsular West Malaysia,
located just south of Thailand, and East Malaysia (Sabah and Sarawak), along the North and West
coasts of Borneo, the rest of the island being the Indonesian state of Kalimantan. In both land
masses, there are central highlands of mountains and ridges rising to over 2000m in West Malaysia,
and over 4000 in East Malaysia (Aziz, 2015). These central highlands descend to relatively flat costal
planes stretching to the sea. Originally covered by thick rain forests, overland travel was historically
difficult and navigation and transportation of goods was predominantly via the many rivers. Most
population centres developed along the river mouths near the sea, with a few located along the rivers
further inland. Small scale agriculture, fishing, hunting and collecting of forest products persisted as
the main economic activities for many centuries. The West coast of peninsular Malaysia developed
larger cities, most notably Melaka, involved in international trade, while the East coast of peninsular
Malaysia and the whole of East Malaysia remained relatively less developed.
As the economy shifted from a more agricultural base to manufacturing and services, the population
has begun migrating into ever growing cities and towns. It is estimated that over 75% of the
population now lives in urban settings (World Data Bank, 2014).
Along with the shift to higher value-add jobs, the GDP (313 billion USD in 2013) has had a long
upward trend since the 1960s. This climb towards greater prosperity has only suffered a few
setbacks, notably the Asian financial crisis of 1998-1999, and the global financial crisis in 2008. After
each crisis, the Malaysian economy has been able to recover and continue the upward trend within a
year or two.
Figure 1: Malaysia’s population by year (Source: World Data Bank, 2015).

8
Figure 2: Malaysia estimated population density; scale is 0 to 4500 people per square kilometre (Source:
Socioeconomic Data Application Centre (SEDAC), 2010).
2.2. Transportation
With increasing financial resources, the population has preferentially opted to purchase larger
vehicles, moving from 50-cc and 70-cc motorcycles in the 1970’s to 90-cc and 100-cc machines, then
progressing to small passenger cars in the 1990s, and most recently Multi Passenger Vehicles (MPVs)
and Sport Utility Vehicles (SUVs). During the Asian Financial Crisis of 1998-1999 the GDP per
capita dropped nearly 20%. This strongly affected consumer’s disposable income, which in turn
reduced the new car purchases during the same period. The 20% reduction in GDP resulted in a
greater than 50% reduction in new car purchases as consumers either put off buying a new car, or
opted for buying a new motorcycle instead. As soon as the economy recuperated, new car purchases
once again picked up. Today about half of the personal vehicles in Malaysia are motorcycles and half
are cars.
Statistics on passenger car kilometres driven is available from PUSPAKOM (Pusat Pemeriksaan
Kenderaan Berkomputer or Malaysian National Automobile Inspection Center), the organisation
responsible for vehicle inspections, as well as the Malaysian Institute of Road Safety Research
(MIROS). PUSPAKOM records the odometer mileage during periodic inspections and MIROS
collects the data from vehicles involved in accidents. Their work indicates that passenger cars are
driven about 24,000 kilometres per year during their first year of ownership. Ridership is not known,
but estimated to be between 1.2 and 1.6 passengers per car, varying greatly by geographic region,
with significantly lower numbers in urban rush hour traffic. This yields around 36,000 passenger km
per year per car, and with a fleet of 11.7 M cars this works out to 420 billion car passenger kilometres
annually for Malaysia (MIROS, 2013).
Goods vehicles, predominantly diesels, are measured by the same source to travel 70,000 km
annually on average. They are used to distribute goods to retail outlets, move raw materials and
finished goods to processing plants and shipping centres. There is a significant amount of container
traffic to and from the various ports as well as running from Thailand to Singapore through
peninsular Malaysia.

9
Figure 3: Number of car registrations by year (Source: Ministry of Transport Malaysia (MOT), 2015).
2.3. Rail
Since the British colonial era, there have been rail lines in West Malaysia, the West Coast Line runs
from the Thai border to Singapore along the west coast of Peninsular Malaysia. The East Coast Line
runs between Gemas south of KL to Kota Bharu on the north-east coast. It hauled freight, mostly
bulk commodities such as cement and sugar, and some passengers with antiquated diesel electric
engines.
Modern rail transport consists of heavy rail (KTM Komuter), light rapid transit (LRT), monorail and
an airport rail link. The biggest change has been the addition of an electric light rail system, and to a
lesser extent a monorail system, centred on Kuala Lumpur. These light rail systems have only come
on line in the last two decades. Rail passenger kilometres took a large jump in 2011-2012 with the
completion of Rawang – Ipoh electrified double track rail and addition of a KL – Ipoh Electric Train
Service (KTM ETS). In 2014, the operation was extended to Padang Besar2.
It is expected that the commuter rail system will continue to expand, and take over an increasing
share of the passenger kilometres travelled.
2 Ipoh – Padang Besar Electrified double track project was completed on October 2014, which provides ease of access to the Thai border.

10
Figure 4: The rail line in Peninsular (left) and Sabah Malaysia (right). (Note the difference in scale)
(Source: KTMB, 2013).
Figure 5: Rail passenger kilometre by year, Malaysia (Source: World Data Bank, 2014).
11
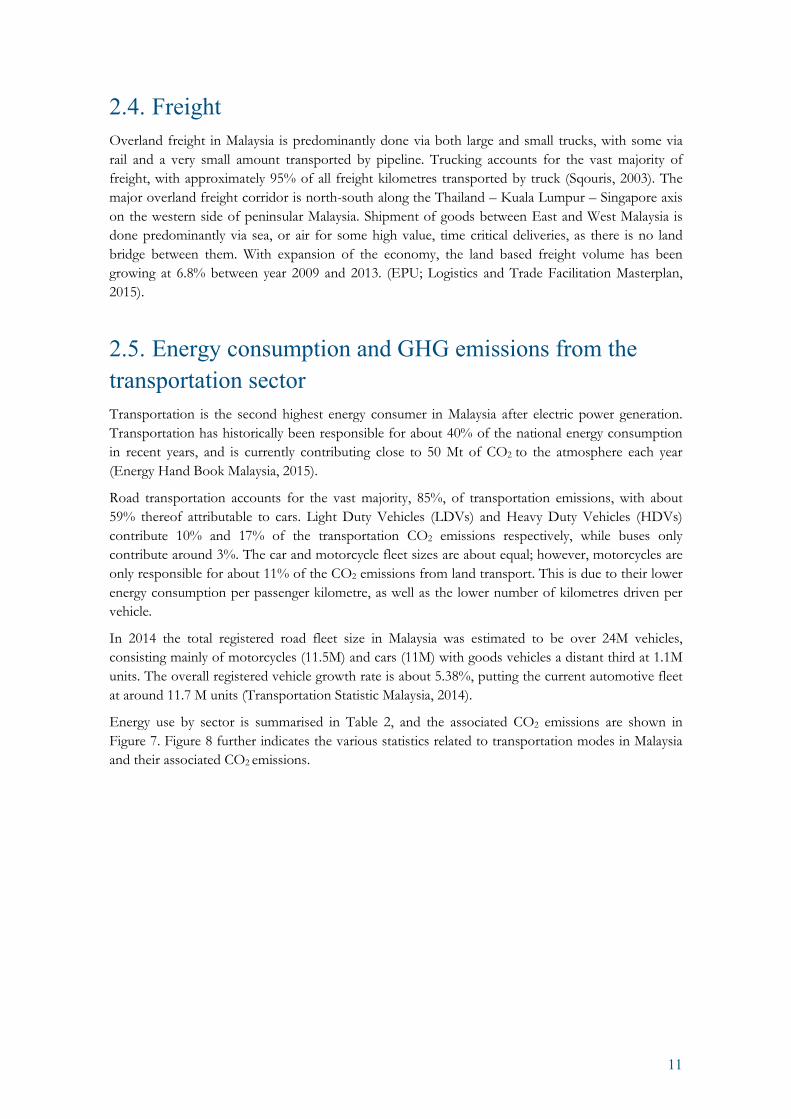
2.4. Freight
Overland freight in Malaysia is predominantly done via both large and small trucks, with some via
rail and a very small amount transported by pipeline. Trucking accounts for the vast majority of
freight, with approximately 95% of all freight kilometres transported by truck (Sqouris, 2003). The
major overland freight corridor is north-south along the Thailand – Kuala Lumpur – Singapore axis
on the western side of peninsular Malaysia. Shipment of goods between East and West Malaysia is
done predominantly via sea, or air for some high value, time critical deliveries, as there is no land
bridge between them. With expansion of the economy, the land based freight volume has been
growing at 6.8% between year 2009 and 2013. (EPU; Logistics and Trade Facilitation Masterplan,
2015).
2.5. Energy consumption and GHG emissions from the
transportation sector
Transportation is the second highest energy consumer in Malaysia after electric power generation.
Transportation has historically been responsible for about 40% of the national energy consumption
in recent years, and is currently contributing close to 50 Mt of CO2 to the atmosphere each year
(Energy Hand Book Malaysia, 2015).
Road transportation accounts for the vast majority, 85%, of transportation emissions, with about
59% thereof attributable to cars. Light Duty Vehicles (LDVs) and Heavy Duty Vehicles (HDVs)
contribute 10% and 17% of the transportation CO2 emissions respectively, while buses only
contribute around 3%. The car and motorcycle fleet sizes are about equal; however, motorcycles are
only responsible for about 11% of the CO2 emissions from land transport. This is due to their lower
energy consumption per passenger kilometre, as well as the lower number of kilometres driven per
vehicle.
In 2014 the total registered road fleet size in Malaysia was estimated to be over 24M vehicles,
consisting mainly of motorcycles (11.5M) and cars (11M) with goods vehicles a distant third at 1.1M
units. The overall registered vehicle growth rate is about 5.38%, putting the current automotive fleet
at around 11.7 M units (Transportation Statistic Malaysia, 2014).
Energy use by sector is summarised in Table 2, and the associated CO2 emissions are shown in
Figure 7. Figure 8 further indicates the various statistics related to transportation modes in Malaysia
and their associated CO2 emissions.

12
Sector demand (ktoe) 2008 2009 2010 2011 2012 2013
Agriculture 287 211 1074 916 1053 1051
Non-energy 2876 3868 3696 6377 7497 7277
Residential & commercial 6205 6336 6951 6993 7065 7403
Transport 16395 16119 16828 17070 19757 22357
Industrial 16205 14312 12928 12100 13919 13496
Total 41968 40846 41477 43456 49291 51584
Percentage of transport 39.07% 39.46% 40.57% 39.28% 40.08% 43.34%
Table 2: Final energy demand by sector (ktoe) (Source: Energy Hand Book Malaysia, 2015).
Figure 6: Trends in CO2 emission by different sectors of Malaysia during 1971-2010 (Source: Shamsuddin,
Anil, and Othman, 2014).

13
Figure 7: Trends in transportation CO2 emission in Malaysia during 1971-2010 (Source: Shamsuddin, Anil,
and Othman, 2014).
Transportation CO2 emissions are broken out by mode in Figure 9, and Figure 10 gives the
percentage contribution of CO2 emissions from various road vehicles. The majority of transportation
emissions come from road use, about 59% thereof are due to car usage. Trucking, both LDVs and
HDVs, account for about 17% of road emissions.
Figure 8: Share of different transport modes to total CO2 emissions, year 2012 (Source: Hosseini et al.,
2013).

14
Figure 9: Contributions of different road vehicles to transportation CO2 emissions for 2012 (Source:
Hosseini et al., 2013).
Total vehicle registrations are broken out in Figure 11, indicating that 47% of registered vehicles are
two-wheelers, and 44% are cars. Fuel type, given in Figure 12, indicates that most vehicles use petrol
as all motorcycles and almost all passenger cars in Malaysia run on petrol.
Figure 10: New registered motor vehicles in Malaysia (Source: Ministry of Transport, 2014).

15
Figure 11: New registered motor vehicles by type of fuel usage in Malaysia (Source: Ministry of Transport,
2014).
Figure 12: Fuel economy ratio for passenger cars in Malaysia (Source: Aizura, Mahlia, Masjuki, 2010).
Fuel consumption of various passenger cars was measured as a function of date of manufacture by
the University of Malaya. It shows a general improvement in fleet efficiency starting in year 2000,
from a former level of about 7 km/litre to nearly 9.5 km/litre by 2009 (Aizura, Mahlia, and Masjuki,
2010). This likely corresponds to the popularity of the relatively low-tech carburetted domestically
produced Proton cars prior to 2000, and a preference for fuel injection cars after that, especially once
the economy had rebounded from the economic depression of the Asian Financial Crisis of 1998-99.
Assuming the 2013 car fleet was 10.5M units, being driven 24k km per year with an average fuel
economy of 9.5 km/litre (based on the work of Aizura et. al. 2012) we can calculate a total fuel
consumption of about 2,500 litres of petrol per car, or about 1.8 toe per car. The total passenger car
Passenger car fuel economy by year
6.0
6.5
7.0
7.5
8.0
8.5
9.0
9.5
10.0
1985 1990 1995 2000 2005 2010
Year
Fue
l Eco
no
my
(km
/lit
er)

16
fleet thus consumes about 20.2 Mtoe of petrol per year. This is significantly higher (64%) than the
estimates coming from the Energy Commission, indicating an annual petrol consumption of 12.3
Mtoe of petrol (Shamsuddin, Anil, and Othman, 2014).
The most likely causes of the discrepancy are inaccuracies in the assumptions, specifically the vehicle
kilometres travelled per year. The numbers recorded by PUSPAKOM are based largely on newer and
public vehicles which undergo frequent inspections. These newer, safer, more reliable and efficient
vehicles are generally driven more than older vehicles, thus accumulating higher mileage in their first
few years, while the 10+ year old vehicles, (which comprise around 50% of the fleet) are generally
driven much less.
Using the fuel CO2 emissions factors stated earlier, and taking petrol, diesel and natural gas to be
attributed to land transportation, we get total CO2 emissions of 42Mt for land transport for 2014.
This is higher than the 37Mt of Hosseini, Wahid and Aghili in 2012 (Hosseini et al., 2013).
Based on field work conducted in January 2016 including surveys of drivers, vehicle age, and
odometer checks, typical annual passenger car mileage of around 15k km/year was established. Using
this annual mileage gives 12.6 Mt of CO2 emissions for the car fleet in 2013, very close to the
number published by the Energy Commission of Malaysia in the Energy Hand Book 2013.
Looking at the passenger kilometres travelled by mode, we can analyse the relative importance of the
various transport modes. As mentioned, in 2013 the total annual passenger km for passenger cars
was approximately 420 billion. The corresponding motorcycle fleet of 11M units travelling 5,000km
per year with a ridership of 1.5 would yield a total of 84 billion passenger km. The reported train
passenger kilometres are 2.4 billion for the same year. Neglecting other passenger transport options,
the ratio of rail passenger kilometres to total passenger kilometres is 0.5%. This is likely an over
estimate of the relative importance of rail transport, however it is largely in line with the 0.4% of the
CO2 emissions attributable to rail (all transportation other than air, maritime or road) especially
considering the emissions factor for rail travel will generally be significantly less than that of other
modes.
Given the large private car fleet size in Malaysia, and the inherent inefficiency of automobile
transport compared with most other forms, there is a lot of room for improvement.
Transportation energy consumed by fuel type
0
5000
10000
15000
20000
25000
19
95
19
96
19
97
19
98
19
99
20
00
20
01
20
02
20
03
20
04
20
05
20
06
20
07
20
08
20
09
20
10
20
11
20
12
20
13
Ene
rgy
(kto
e)
Electricity
Natural Gas
Fuel oil
ATF and AV gas
Diesel
Petrol
Figure 13: Energy consumption by transportation (Source: Energy Hand Book, 2014).

17
Figure 14: Age break down of cars in Malaysia (Dec 2012) (Source: Malaysia Automotive Institute,
Automotive Roadmap Highlight, 2013).

18
2.6. Emissions reduction potential from the Malaysia
transport sector (road)
Transportation emissions and fuel consumption reduction can be prioritised based on current
estimates of CO2 emissions. Road transport is responsible for the vast majority of transport
emissions (85.2%) while rail accounts for no more than 1.4%. Privately owned passenger cars are the
largest contributor to road based emissions (59%), followed by heavy duty trucks and buses (17%),
motorcycles (11%) and light duty vehicles (10%) (Hosseini et al., 2013).
While many possibilities exist for emissions reductions, a few of the more tangible ones investigated here include: ■ Modal Shift – Transfer people and goods by a more efficient transportation mode
■ Aged Fleet Purging – Remove inefficient vehicles from fleet
■ New Vehicle Efficiency – Encourage the market towards adopting improved efficiencies
■ Vehicle Fuel/Propulsion Switch – Move to fuels that emit less CO2 (see table 3)
■ Avoidance – Reduce the need for unnecessary travel
Transport mode Energy use (MJ per passenger-km)
Emissions (g CO2 per passenger-km)
Petrol car 3.7 286
LPG car 3.7 256
Ethanol (E10) car 3.7 253
Electric tram 0.15 52
Diesel bus 0.28 22
Ethanol (E10) bus 0.28 19
Natural gas bus 0.28 18
Diesel train (V/Line) 0.2 16
Electric train 0.04 14
250cc motorcycle 1.6 124
Table 3: Emissions intensity and emissions figures for various transportation modes (Source: Australian
Greenhouse Office, 2006).

19
2.6.1. Modal shift
To analyse the possible improvements attainable via modal shift we must measure the actual
efficiency of each possible transportation mode. In the absence of such data on a country specific
level, we can use some of the data gathered from the various non-Malaysian sources and adapt it to
locally known data.
As passenger cars are responsible for 59% of the CO2 emissions from the transport sector, they are
the obvious place to start looking for improvements. Multiple sources indicate taxis as the worst
polluters per passenger kilometre. While most taxis in Malaysia now operate on CNG, which
marginally reduces the vehicle’s CO2 emissions per kilometre (about 8.5%), they still emit significantly
more CO2 per passenger kilometre than passenger cars. This is because taxi passenger kilometres only
count when transporting a passenger. When a taxi is en route to/from a depot or pickup location, or
returning from a passenger run “empty” (i.e. without a paying passenger) it is accruing emissions but
not passenger kilometres. Taxis are also the most expensive way to travel, but are still heavily utilised
due to their flexibility: They can pick up and drop off passengers almost anywhere at any time. Taxis
emit more than four times the CO2 of passenger cars on a passenger kilometre travelled basis.
Personal trucks, which are increasingly used as passenger vehicles in Malaysia, are less efficient than
normal passenger cars due to their larger size and weight, however they comprise only a small,
though rapidly growing segment of the current fleet. Passenger cars are estimated to consume
2.32MJ of energy per passenger kilometre, compared to just over 1MJ to 1.23MJ for passenger rail
systems. This indicates a potential energy consumption reduction of 50% if passenger car occupants
were shifted to rail. Passenger cars are responsible for 59% of the road CO2 emissions, and road
transport comprises 85.2% of the transport emissions, estimated to be around 50 Mt per year
currently, thus passenger cars are accountable for approximately 25Mt of CO2 emissions in Malaysia
per year. A shift from individual passenger cars to rail travel would reduce transport emissions by
53%, thus possibly reducing total annual CO2 emissions by approximately 13.3 Mt of CO2.
By comparing general rail, bus, motorcycle (MC) and car relative efficiencies listed in Table 4, we can
derive a modal shift efficiency improvement schedule as shown in Table 5. As mentioned shifting from cars
to rail will save about 53%, going from a car to a bus saves 40% and a shift from a car to a
motorcycle saves about 33%. This is likely an underestimate of the improvement gained by shifting
to motorcycles, as the efficiency numbers are taken from the US where significantly larger
motorcycles are used. However, the trend in Malaysia is toward larger capacity motorcycles, so we
will use this figure in the following analysis. Shifting from motorcycles to rail saves around 30% of
the energy, but shifting from a motorcycle to a bus saves only about 11%. Finally, shifting from a
bus to a train may save around 21%.
If we assume the CO2 emissions are reduced proportionally to energy reduction, and use the by-
mode CO2 emissions for Malaysia, we can then determine the CO2 emissions reduction of various
modal shift possibilities as shown in Table 6.
These numbers represent the maximum possible improvements based on the designated modal
shifts. It assumes that 100% of the passenger kilometres travelled are transferred from the less
efficient to the more efficient transportation mode, which is obviously an unlikely scenario. Actual
adoption rates will depend on a number of factors, and we believe an adoption rate of 50% is an
exceedingly optimistic assumption, with perhaps 20% more realistic in the near future.
Regardless of the probable adoption rates, this makes it very clear that a shift from passenger car
trips to virtually any other mode will have the biggest effect, with rail being the preferred mode.
Motorcycle emissions can only be significantly reduced by moving the riders into trains.

20
Mode Passenger/ vehicle MJ/ passenger kilometre
Taxi 1.55 10.26
Personal truck 1.84 2.40
Car 1.55 2.32
Aircraft 99.3 1.85
Motorcycle 1.2 1.56
Bus 18.4 1.39
Rail commuter 49.05 1.23
Rail transit 36.75 1.09
Rail- intercity 31.35 1.05
Table 4: Energy intensity of various transport options adapted for typical Malaysia passenger load factors
from US data (Source: US Transportation Energy Book, 2010).
Percentage energy reduction moving from:
To: Car Motorcycle Bus Rail
Rail 53% 30% 21% 0%
Bus 40% 11% 0%
Motorcycle 33% 0%
Car 0%
Table 5: CO2 reduction by modal shift, by percentage (Source: Author, 2015).
CO2 reduction moving from:
To: Car Motorcycle Bus Rail
Rail 13.3 1.4 0.3 0.0
Bus 10.1 0.5 0.0
Motorcycle 8.3 0.0
Car 0.0
Table 6: Mt CO2 reduction by modal shift from a baseline of 50 Mt total from the transport sector (Source:
Author, 2015).

21
2.6.2. Fleet purge
Increasing prosperity promotes a shift towards larger engine capacities and indeed larger vehicles
over time. While the engines of newer vehicles are often more efficient than older ones, the vehicle
may actually consume more fuel per passenger kilometre as their size and power grow. This has been
shown to be the case with motorcycles in Malaysia (Lee et. al, 2010), where 15+ year old vehicles
achieved 60km/litre, whereas relatively new motorcycles of less than 5 years of age achieved
45km/litre on the same test due to the prevalence of larger engine sizes. The major improvement in
efficiency for both conventional cars and motorcycles has come from the application of
electronically controlled fuel injection. Fuel injection is generally expected to improve a vehicle’s fuel
consumption by around 10%. It has also been shown that a small percentage (7%) of on the road
vehicles are grossly mistuned, and running significantly less efficient (up to 35% higher fuel
consumption) than similar properly tuned vehicles (Liang, 2010). Purging the existing fleet of these
“clunkers”, or repairing them to operate near their originally intended efficiency could help reduce
both fuel consumption and emissions.
Cars over 15 years old were shown to consume 27% more fuel than newer cars. If this still holds true
and 32% of the fleet is still over 15 years old, then purging these older, less efficient cars could
potentially save 2.2 Mt of CO2 per year. This is likely to be an overestimate, as the older cars are
generally driven less than newer cars. Purging of older motorcycles would be less likely to decrease
the CO2 emissions as newer motorcycles tend to be significantly larger than older ones, thus newer
bikes tend to produce more CO2, albeit with lower emissions of CO, hydrocarbons and NOx, than
older ones.
If the data from the improperly tuned motorcycles holds true for cars, then inspecting and correcting
poorly tuned cars could possibly reduce CO2 emissions by 35% on the 7% of the fleet, or about 0.65
Mt of CO2 per year. For motorcycles the same effort would only save about 0.12 Mt of CO2 per
year. Additionally, the elimination of these poorly running vehicles will greatly reduce the emissions
of other hazardous pollutants such as carbon monoxide (CO) and various hydrocarbon (HC)
compounds. Removing two-stroke motorcycles from the roads would have about the same effect as
the motorcycle fix-up programme, resulting in 0.13 Mt of CO2 reductions per year.
Because of their low fuel consumption motorcycle manufacturers and customers alike have not
historically been overly concerned with fuel efficiency. Motorcycles are simply considered “efficient”
by comparison with cars. Most motorcycles sold in Malaysia to date are still carburetted and thus are
significantly less efficient than equivalent fuel injected motorcycles. Malaysia intends to implement
Euro-III emissions standards for motorcycles starting in 2017, which will require them to have fuel
injection in order to pass. It has been shown that a typical small motorcycle’s fuel consumption is
reduced by 11% by converting to fuel injection (Teoh et. al, 2009).
This alone would save 0.52 Mt per year. If motorcycle manufacturers are pushed by new vehicle fuel
efficiency standards to produce more efficient vehicles, there are many technologies available (roller
follower rocker arms, compact combustion chamber design, dual spark, over expanded cycle, etc.)
which are commonly used on cars and hybrids. Efficiency improvements of 10 to 20% are possible
with these common technologies. Combining fuel injection with a few well-chosen efficiency
enhancements could reasonably be expected to deliver a 20% improvement in motorcycle efficiency.
These “fuel efficient” motorcycles could very conservatively account for a reduction of 1.03 Mt per
year.
Adoption rates of 100% are unrealistic unless mandated, however as there is more of an immediate
economic incentive to the vehicle owners to improve the efficiency of their vehicle, or “trade up” to

22
a newer more efficient vehicle a 50% adoption rate may not be as overly optimistic as the modal shift
options.
2.6.3. Fuel switch
Each fossil fuel produces a different amount of CO2 per unit of energy produced. This is because of
the relative amounts of hydrogen and carbon in the fuel. Both carbon-carbon bonds and hydrogen-
carbon bonds represent chemical energy storage in a fuel. Carbon partaking in combustion generally
winds up as CO2 whereas hydrogen produces H2O, i.e. water. When a high-carbon fuel such as coal
is burned, larger amounts of CO2 are produced (per energy unit) than when a relatively hydrogen rich
fuel like methane is burned. Thus, in order to reduce the CO2 emissions from transport, one
approach is to shift from CO2 intensive fuels (such as diesel and petrol) towards lighter hydrocarbon
fuels, like LPG and natural gas. Additionally, biofuels, such as biodiesel or bioethanol, are nearly
“carbon neutral” as the CO2 created during combustion came from atmospheric CO2 in the creation
of the fuel.
Fuel CO2 emissions pound/Btu CO2 emissions kg/MJ
Coal (anthracite) 228.6 0.098
Coal (bituminous) 205.7 0.089
Coal (lignite) 215.4 0.093
Coal (subbituminous) 214.3 0.092
Diesel fuel and heating oil 161.3 0.069
Petrol 157.2 0.068
Propane 139.0 0.060
Natural gas 117 0.050
Table 7: CO2 emissions of various fuels (Source: US Energy Information Administration, 2015).
Currently (2016) the Malaysian government intends to mandate B10 biodiesel (a 10% blend of
biodiesel and petro diesel) as the standard diesel fuel for all of Malaysia later this year. As most
passenger vehicles are currently gasoline based it is not likely to have a major impact on automobile
CO2 emissions, but will affect the freight sector significantly. Other biofuels such as bioethanol and
even biogas (i.e. Methane) are currently under investigation, but could become significant in the
distant future.
Since 1991 the Malaysian government has had a programme (the Natural Gas for Vehicles Program)
to encourage conversion of petrol vehicles to Compressed Natural Gas (CNG) as the countries
reserves of gas significantly outweigh the liquid petroleum reserves (14.7 billion barrel equivalent of
natural gas compared to four billion barrel of oil) (Conglin Xu, 2014). This programme has met with
high adoption rates among taxis and secondarily buses. A large number of passenger cars have also
been converted, but it currently represents a very small fraction of the passenger automobile fleet.
Almost all of the cars are “bi-fuel” vehicles, meaning that they can be operated on either CNG or
petrol, while the buses are generally CNG only vehicles.

23
Figure 15: This motorcycle has been converted to operate on CNG and can travel 200km for RM4 (about 1
USD) of fuel (Source: Author, 2016).
The cost of an automotive conversion kit ranges from about 1,000 USD to about 2,000 USD, and is
considered a significant barrier. Utilisation of CNG generally saves the owner about 50% on the fuel
costs, resulting in an ROI of three to six years for a passenger car owner, and perhaps six months to
just over two years for a heavy or frequent user.
Cost (USD) 10 15 20 30 50 100
1000 km/year
1000 5.7 3.8 2.8 1.9 1.1 0.6
2000 11.3 7.5 5.7 3.8 2.3 1.1
Table 8: Years to breakeven of various CNG conversion cost (Source: Author, 2015).
Switching a car from petrol to CNG operation reduces CO2 emissions by approximately 6 to 11%
according to the Argonne National Laboratory in the US. Taking the average reduction to be 8.5%,
and applying it to all passenger cars, a fleet switch to CNG could reduce Malaysia’s fleet emissions by
a maximum of 2.1 Mt of CO2 per year. As Malaysia’s natural gas reserves exceed its liquid petroleum
reserves by a factor of around three, this would also greatly reduce the country’s need for petrol,
giving it a distinct economic advantage (EIA, 2014).

24
The life cycle emissions of an
EV depend on the sources of
electricity used to charge it,
which vary by region. In
geographic areas that use
relatively low-polluting energy
sources for electricity
production, plug-in vehicles
typically have a life cycle
emissions advantage over
similar conventional vehicles
running on petrol or diesel. In
regions that currently depend
heavily on conventional fossil
fuels for electricity generation,
EVs may not currently
demonstrate a strong life cycle
emissions benefit.
2.6.4. Propulsion switch: Hybrid electric vehicles
Due to their higher cost Hybrid Electric Vehicles (HEVs) are not yet popular in Malaysia despite
their efficiency improvements. As a category taxis are the most likely group to realise an economic
incentive from the utilisation of HEV technology.
For taxis operating in urban areas a major improvement in efficiency could be gained from
hybridisation. The US Environmental Protection Agency (EPA) has measured the fuel efficiency of
hybrid cars to be 17.7 km/litre compared to 11.5 km/litre for petrol vehicles (US EPA Light-Duty
Automotive Technology CO2 Emissions and Fuel Economy Trends: 1975 through 2015, 2015). If
the taxi fleet were switched to hybrid CNG vehicles emissions might be reduced from 635,000 tons
to about 414,000 tons, for a modest savings of around 0.222 t of CO2.
Switching the passenger car fleet from standard gasoline engines to hybrid electric power trains could
similarly reduce emissions from this sector by 8.8 Mt of CO2.
2.6.5. Propulsion switch: Electric vehicles
Electric propulsion is another popular option. This is
less likely as a retrofit, but is a possibility for new
vehicles, both cars and motorcycles. However, while
EVs have zero tail pipe emissions the upstream
power generation emissions must be taken into
account.
Data from the US electric production shows CO2
production rate of about 0.61 kg/kWh, while
Malaysia’s electric grid is more dependent on fossil
fuels producing about 0.63 kg of CO2 per kWh3.
Extrapolating from the calculated CO2 emissions of
3,480 kg of CO2 per EV per year in the USA, in
Malaysia this would be 3,603 kg of CO2 per vehicle
based on the local power mix (figure 17 and side bar).
A petrol vehicle tested under the same circumstances
produces 6,734 kg of CO2, for a net CO2 reduction of
46% for EVs compared to petrol passenger cars in
Malaysia. Thus if all the petrol cars in Malaysia were
to be replaced with electric cars, it would result in a
reduction of 11.7 Mt of CO2 per year, somewhat
better than the 8.8 Mt of CO2 per year saved from
hybridization.
Carbon Dioxide Emissions from the Generation of Electric Power in the United States, 2000, available http://www.eia.doe.gov/cneaf/electricity/page/co2_report/co2report.html

25
Figure 16: Electrical power generation in Malaysia (Source: Energy Hand Book, 2015).
Shifting motorcycles to electric propulsion will probably have a bigger effect on CO2 emissions in
relative terms, as the majority of motorcycles on the market are currently carburetted, and therefore
emit significantly more CO2 than fuel injected vehicles. Malaysia is scheduled to implement Euro-III
emissions requirements for motorcycles starting in 2017, thus this additional advantage for electric
motorcycles will not persist. Assuming a similar proportional reduction in CO2 emissions for
complete motorcycle replacement with electric motorcycles, 2.2 Mt of CO2 per year would be
avoided, along with a significant reduction in locally emitted pollutants, such as CO and HCs, and
noise.
Figure 17: Electric “motorcycles” like this one are very popular in Malaysia, however their usage raises
many safety concerns, such as underage drivers (Source: Author, 2014).

26
2.6.6. Avoid
Travel avoidance is probably the most effective, and also perhaps hardest to implement, mean of
reducing CO2 emissions. Many trips are considered mandatory, i.e. commuting to and from work or
to school, and procuring provisions necessary for a family. Some travel can be considered “optional”
such as travel for entertainment. The distances necessary to commute is effected by many factors,
such as home site location, particulars of the job or company, and the interconnection transportation
infrastructure.
In the short term, perhaps the best “avoidance” option would be to combine multiple mandatory
trips, or at least combine optional trips with mandatory ones. For example, a parent commuting to
work in the morning could potentially drop off children at school, assuming it is along the way,
rather than having to make two separate trips. Shopping trips can be combined with commuting
relatively easily. The problem with implementing this type of arrangement is that it depends on the
volition of the individuals involved, and requires planning ahead of time, as well as a local alternative
transport environment. Car-pooling has similar benefits and issues: The individuals involved must
sacrifice convenience in order, generally, to save money. Obviously one thing that could be done to
enhance the attractiveness of avoiding travel would be to make it relatively more expensive by
including so-called ‘externalities’ of car ownership into its total cost, by for example raising the cost
of automobile ownership (e.g. high permit fees such as in Singapore) or operation (e.g. fuel taxation).
While both of these methods are likely to have some positive effect on CO2 emissions, they will
undoubtedly be unpopular as they increase cost and decrease convenience for the public.
In the long term, avoidance is likely to yield the largest CO2 reductions by careful land use and
transportation planning, especially that of urban settings. If residential areas can be designed so that
schools are within easy biking distance, safe pedestrian/bicycle paths connect residences, schools,
and rail transport hubs with offices, factories, and commercial centres, then the need for personal
vehicle ownership can be largely reduced.
The upper limit of this is difficult to estimate; however, we need only look back a few years into the
past to see Malaysia as a country that got by with much fewer cars per capita. With careful planning,
efficient mass transit could potentially reduce the necessity of cars and motorcycles back down to the
levels of year 2000, which would roughly cut the number of privately held vehicles in half.
An interesting local custom along these lines is the “pasar malam” or night market which brings
various vendors of food, dry goods, fruit, vegetables and meat, clothing and etc. together in small
villages or towns once a week on a designated day. Bringing in 50 vendors with their goods to the
common distribution point is more efficient than the hundreds of villagers making several trips each
to procure the various items purchased. Similarly, there has been success with “mobile libraries”
which help connect people in rural areas with access to a wide range of knowledge stored in books.
It is likely that this model could be expanded to include many other services such as postal and other
governmental services (i.e. national identification registration and certificates, taxes and billing of
utilities etc.).
Estimating the potential CO2 emissions reduction of trip avoidance techniques is particularly dubious
as it depends on too many uncontrollable factors, and a long-term evolutionary development of both
infrastructure and society.
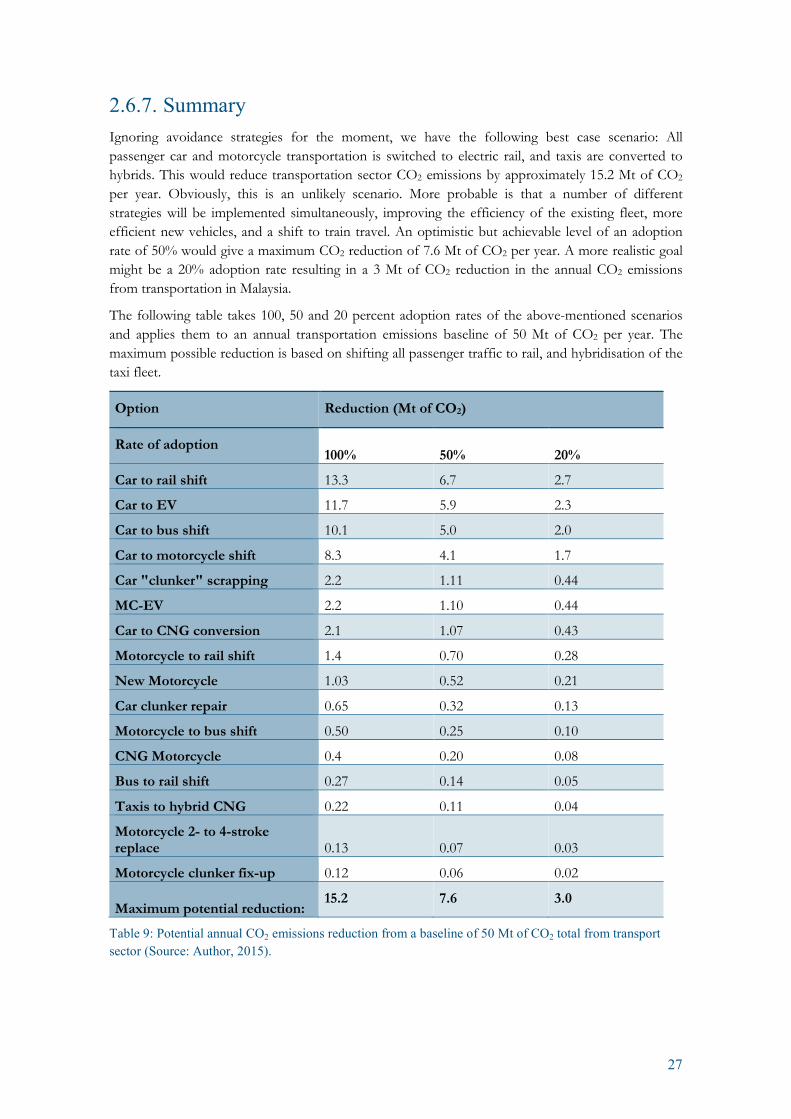
27
2.6.7. Summary
Ignoring avoidance strategies for the moment, we have the following best case scenario: All
passenger car and motorcycle transportation is switched to electric rail, and taxis are converted to
hybrids. This would reduce transportation sector CO2 emissions by approximately 15.2 Mt of CO2
per year. Obviously, this is an unlikely scenario. More probable is that a number of different
strategies will be implemented simultaneously, improving the efficiency of the existing fleet, more
efficient new vehicles, and a shift to train travel. An optimistic but achievable level of an adoption
rate of 50% would give a maximum CO2 reduction of 7.6 Mt of CO2 per year. A more realistic goal
might be a 20% adoption rate resulting in a 3 Mt of CO2 reduction in the annual CO2 emissions
from transportation in Malaysia.
The following table takes 100, 50 and 20 percent adoption rates of the above-mentioned scenarios
and applies them to an annual transportation emissions baseline of 50 Mt of CO2 per year. The
maximum possible reduction is based on shifting all passenger traffic to rail, and hybridisation of the
taxi fleet.
Option Reduction (Mt of CO2)
Rate of adoption 100% 50% 20%
Car to rail shift 13.3 6.7 2.7
Car to EV 11.7 5.9 2.3
Car to bus shift 10.1 5.0 2.0
Car to motorcycle shift 8.3 4.1 1.7
Car "clunker" scrapping 2.2 1.11 0.44
MC-EV 2.2 1.10 0.44
Car to CNG conversion 2.1 1.07 0.43
Motorcycle to rail shift 1.4 0.70 0.28
New Motorcycle 1.03 0.52 0.21
Car clunker repair 0.65 0.32 0.13
Motorcycle to bus shift 0.50 0.25 0.10
CNG Motorcycle 0.4 0.20 0.08
Bus to rail shift 0.27 0.14 0.05
Taxis to hybrid CNG 0.22 0.11 0.04
Motorcycle 2- to 4-stroke replace 0.13 0.07 0.03
Motorcycle clunker fix-up 0.12 0.06 0.02
Maximum potential reduction: 15.2 7.6 3.0
Table 9: Potential annual CO2 emissions reduction from a baseline of 50 Mt of CO2 total from transport
sector (Source: Author, 2015).

28
Looking ahead these remediation measures could result in a reduction of CO2 emissions from the
transportation sector in Malaysia of about 30%, 15%, and 6% respectively for 100%, 50%, and 20%
adoption rates.
2.7. Emissions reduction potential from the Malaysia land
freight sector
Figures 9 and 10 show that land freight sector, mostly light and heavy duty trucks, contributes
approximately 23% of the CO2 emissions from the transportation sector (estimated to be 50 Mt of
CO2 in 2014), thus freight is responsible for approximately 11.5 Mt of CO2 emissions per year. The
freight infrastructure in Malaysia is quite mature, Malaysia having one of the largest sea ports in
South East (SE) Asia, Port Klang ranking 17th in the world and second in SE Asia (American
Association of Port Autorities, 2013). Additionally, Malaysia has several inland “dry” ports serving as
hubs for freight haulage. Ipoh Cargo Terminal, Padang Besar Inland Container Depot and Nilai
Inland Port are the major inland terminals which serve 95% of the cargo volume in Malaysia. Most
of the seaports and inland ports in Malaysia are readily connected by both rail and highway. Even
though some of the sea ports and inland ports have rail connectivity, the hinterland container
transport movements are dominated by road (95%) with rail currently handling most of the
remaining 5% (Sqouris, 2003).
Some of the options for improving the sustainability and reducing emissions from freight are similar
to the options discussed above, with key possibilities enumerated in the following sections.
2.7.1. Freight- shift
By far the most effective way to improve the energy efficiency of land freight is the modal switch
from trucks to rail and shipping as can be seen in table 10. Although rail freight consumes less than
10% of the energy required by trucking, a complete shift to rail is not possible as the dispersal of
products over the first/last kilometre requires trucking to reach the closest rail hub.
Transport mode
Fuel consumption
BTU per short ton mile kJ per tonne kilometre
Domestic waterborne 217 160
Class 1 railroads 289 209
Heavy trucks 3,357 2,426
Table 10: Fuel consumption of water, rail and truck freight (Source: Transportation Energy Data Book
(US), 2011).
The rail accounts for approximately 5% of land freight movement, while trucks carry most of the
rest, and a smaller amount of liquids is transported via pipelines (Sgouridis, 2003). Assuming CO2
emissions proportional to energy consumption and taking the values from the above table, an
increase in the modal share of rail from 5% to 40% could potentially reduce CO2 emissions by as

29
much as 4.3 Mt of CO2 annually. While this may represent an unachievable high level of rail
transport, it represents an upper limit of the expected CO2 savings from a modal shift to rail.
2.7.2. Freight- improve
Internationally a lot of attention is paid to the efficiency of freight hauling trucks as vehicle efficiency
is a serious concern for most fleet owners. Newer trucks, for example, come with electronic systems
advising drivers how best to optimise fuel consumption based on the terrain, including a cruise
control system that automatically speeds up in anticipation of a hill climb, or reduces throttle in
preparation for a decent, improving fuel economy by as much as 10%. While newer vehicles have
very efficient engines, the existing fleet can still benefit from a number of common improvements
such as usage of aerodynamic fairings and fuel efficient tyres. Together these simple improvements
can potentially improve the efficiency of an existing vehicle of 5% to 10% (Oregon, 2015). In
addition to improvements in driving technique, or so-called “eco driving” this could deliver a total of
20% decrease in fuel consumption from the trucking fleet.
2.7.3. Freight- fuel switch
Large diesel trucks can be converted to operate on CNG, or Liquid Natural Gas (LNG) for larger
vehicles, and Diesel Dual Fuel (DDF) system, as it combusts both CNG and diesel at the same time.
This is generally done to reduce the operating fuel cost. While the engine emissions of CO2 is
somewhat reduced, there is an increase in methane emissions, which is known to have even more
GHG potential than CO2 and therefore negate the CO2 reductions (Marc et. al, 2016). This
technology, consequently, is not currently favoured as a means of reducing the GHG emissions of
freight.
While the CO2 benefits of different bio fuels can vary widely, a fuel switch to biodiesel can have a
significant effect on the CO2 emissions from freight, as the CO2 released from the bio fuel is largely
being recycled via photosynthesis of the biological feed stock. While the current mandate (Aug 2016)
in Malaysia is to establish 10% biodiesel (i.e. B10) as the standard diesel fuel, it is likely that B20 (i.e.
20% biodiesel, 80% petro diesel) is the upper limit of what can easily be implemented, more from
supply side constraints than engine technology constraints. Assuming that all diesels are switched to
B20, this would give a reduction of about 2.6 Mt of CO2 reductions from a transportation baseline
emission of 50 Mt of CO2 annually.
2.7.4. Freight- avoid
As shipping of goods is crucial for economic development, the concept of avoidance of shipping
freight is difficult to apply. What is easier to understand is that resource utilisation should be
maximised by avoiding “empty back hauls” on a delivery vehicle. Freight forwarders are already
economically motivated to reduce empty back hauls, as this is detrimental to their bottom line.
Larger operators tend to be very sophisticated with fleet management systems in place, however
smaller operators might be able to benefit from an industry wide “load share” system, similar to the
cellular communications operators (by which one carriers overload is routed via a competitor as
opposed to dropping the traffic, by mutual agreement). At least one service “Transport4U.com”
exists specifically for this purpose in Malaysia and claims that up to 77% of trucks make return trips
empty (Joseph, 2014). Another study in Europe concludes that 24% of all transport vehicle
kilometres are performed empty (Demir, Bektaş, Laporte, 2014) but most reports give it as 40-60%

30
While an empty truck consumes less fuel and emits less CO2 than a fully loaded truck, doubling the
load on a truck does not necessarily double the fuel consumption, or CO2 emissions, as the
aerodynamic component and mass contribution from the vehicle remain constant. In general
emissions of an empty truck are assumed to be 10 to 20% less than a half-loaded truck, and 36 to
40% less than a fully loaded truck (UK DfT, 2008). Thus, if we assume that 50% of all truck
kilometres are performed empty, and the rest are full and that a full truck produces 38% more CO2
than an empty truck, we get 42% as the upper bound on the potential CO2 savings from reducing
empty back hauling4.
Figure 18: Freight exchange service offered by Transport4U (Source: Transport4U, 2015).
Other significant improvements for freight involve the location of hubs and improved inter-modal
connectivity at ports and freight hubs. It has been estimated that poor traffic management around
ports and other freight hubs can increase shipping distances by as much as 60%. Reducing queuing
times, and thus engine idling times, can also help reduce CO2. A conservative estimate for potential
improvements in this area might be put at 30% maximum CO2 reduction (Sani, 2012).
2.7.5. Freight- summary
Taking the contribution to emissions from land based freight to be 11 Mt of CO2 per year, and using
the above-mentioned factors, we can calculate the potential emissions reduction based on various
levels of mitigation adoption. Here we assume that the maximum potential gain (i.e. 100% adoption)
of shifting truck freight to rails (i.e. a 40% share for rail as a maximum) would result in a 31%
reduction of CO2, while freight port and hub location and intermodal efficiencies could improve
CO2 emissions by 30%, and elimination of empty back hauling could reduce CO2 emissions from
land freight by 42%. Use of B20 will reduce the emissions of the trucking fleet by 20%, and
individual vehicle and driver improvements amount to a maximum of 20% reduction of CO2
emissions as well. In these calculations, the intermodal efficiency improvements and reduction of
empty back hauling, biodiesel and vehicle efficiency improvements are only applied to the trucking
component of the resulting emissions.
4 Full Load Emissions = 138% (of empty truck) per km. 50% empty back haul Emissions = 0.5 x 138%+ 0.5 x 100% for ½ km traveled, or 238% (of empty truck) emissions per km freight traveled. So moving from 50% empty trucks to full loads gives a CO2 reduction of:100% - 138/238 = 42%

31
At the highest possible rate of adoption, freight emissions could be reduced by as much as 80%, for
a total reduction of around 9.2 Mt of CO2 per year. This is an unrealistic number, but it does
represent an “ideal” scenario. More realistic is a 50% adoption rate scenario resulting in a reduction
of 53% of emissions from the land freight sector, or a reduction of about 6.1 Mt of CO2 annually.
Even in the more pessimistic scenario of a 20% adoption rate emissions can still be reduced by 23%,
or approximately 2.6 Mt of CO2 per year. It can be noticed that with greater levels of adoption the
emissions overall from trucking drop, while the emissions from rail increase. This is expected as
greater adoption infers more rail traffic, and less truck traffic.
Option Reduction (Mt of CO2)
Rate of adoption 100% 50% 20%
Reduction from truck to rail shift 4.27 1.86 0.41
Reduction from hub – intermodal improvements 2.17 1.45 0.67
Reduction of empty back-haul 2.13 1.72 0.88
Reduction from vehicle and driver improvements 0.59 0.65 0.38
Reduction from B20 fuel 0.47 0.58 0.37
Total emissions from rail 0.42 0.21 0.08
Total emissions from trucks 2.29 5.24 8.80
Total combined emissions 2.29 5.45 8.80
Maximum potential reduction: 80% 53% 23%
Table 11: CO2 Emissions reduction from overland freight from a baseline of 11.5 Mt of CO2 from the land
freight sector (Source: Author, 2016).

32
3. Policies and institutions
3.1. Recent climate change prioritisation
In 2010, parallel to the preparation of the Second National Communication on Climate Change for
UNFCCC that was published January 2011 (MNRE, 2011), the National Steering Committee on
Climate Change and National Green Technology Advisory Council (steered by Ministry of Energy,
Green Technology and Water (KeTTHA)) were combined into a single Council, the National Green
Technology Council, which is chaired by the current Prime Minister of Malaysia, Najib Razak. The
short-term goal of the Council was to see how Malaysia could voluntarily reduce GHG emissions by
40%, as announced by the Prime Minister at the UN Conference on Climate Change at Copenhagen,
2009. The target was reiterated in 2015 as a 45% reduction in CO2 intensity per GDP output by 2030
(INDC, 2015). Pursuant to this, an inter-ministerial Transportation Taskforce/Working Group was
recently established with the following objectives:
■ To identify the development needs of the transport sector from the perspective of green
technology and climate change
■ To identify the strategic issues in green technology and climate change in developing the
transport sector
■ To identify, coordinate, and monitor projects and programmes in the transport sector at a
national level from green technology and climate change perspectives
■ To identify and recommend a framework for legal, regulation, and policies to increase the usage
of green transport technologies
■ To identify, monitor and evaluate the target area and setting the measurement, target limit and
time frame for the usage of green technology and to reduce climate change impact of the
transport sector
■ To identify environmental friendly alternative energies to be introduced in transport sector
■ To identify the mechanisms which include an incentive to minimise the climate change impact in
transport sector by using green technology
The announcement by the Prime Minister Najib Razak, regarding a commitment “up to 40%”
reductions of CO2 per GDP by 2020 in Copenhagen 2009, and the recently submitted Intended
Nationally Determined Contribution (INDC) in Paris to reduce GHG emissions intensity per GDP
by 45% by 2030 relative to the emissions intensity of GDP in 2005 indicates the level of national
commitment towards reducing its carbon footprint. Much “green” legislation to date has been
focused on select niche technologies such as electric vehicles, in order to grow these industries.
3.2. Stakeholders
Malaysia has a highly centralised government; however, there are many different departments with
responsibilities in the energy, environment and transport areas. For transportation systems in
Malaysia, the authority of strategic planning resides with the Economic Planning Unit (EPU). The
Ministry of Transport (MOT) is the primary ministry responsible for planning, formulating and
implementing transport policies. The Road Transport Department (JPJ) acts as approval authority

33
agency under MOT and together with the Department of Environment (DOE) under the Ministry
of Natural Resources and Environment (NRE). It has the sole responsibility for setting emissions
limits. JPJ also regulates motor vehicles and road traffic safety as well as inspection of land public
and commercial transportation with the support from MOT’s concession agency, Malaysia National
Automobile Inspection Centre (PUSPAKOM) via their road vehicle testing centres. The Land Public
Transport Commission (SPAD) plans, regulates, and enforces all matters relating to land public
transport and has jurisdiction over Peninsular Malaysia. The division of Environmental Management
and Climate Change (BPASPI) under NRE is responsible for the policies relating to environmental
and climate changes for and KeTTHA champions Green Transport initiatives.
In Malaysia, currently there are several different governmental bodies which have authority in the
transportation and energy sectors. The main departments include the Ministry of Transport, the
Road Transport Department, the Department of Environment, Land Public Transport Commission,
Ministry of International Trade and Industry (MITI), Ministry of Energy, Green Technology and
Water (KeTTHA), with support from other organisations including the Ministry of Finance (MOF),
Ministry of Natural Resources and Environment (NRE), Prime Minister’s Department (PMD),
Ministry of Works (MOW), Economic Planning Unit (EPU), Ministry of Urban Wellbeing, Housing
and Local Government (KPKT), CMS Consortium, Ministry of the Federal Territories (KWP),
Ministry of Rural Development Malaysia (MRDev), Malaysia Automotive Institute (MAI), Malaysian
Industry-Government Group for High Technology (MIGHT), Malaysia Palm Oil Board (MPOB),
Malaysian Green Technology Corporation (MGTC) and Malaysian Investment Development
Authority (MIDA). The roles and functions of each body are listed in Appendix 3.
3.3. Institutional structure and climate change policies
In the 1990s Malaysia committed itself, under the UNFCCC, to formulate, implement, publish, and
regularly update national and regional programmes containing measures to mitigate climate change.
To guide Malaysia’s initial national communication to the UNFCCC, a National Steering Committee
on Climate Change (NSCCC) was set up in 1994. This inter-ministerial body, presently chaired by
NRE, is tasked to formulate and implement climate change policies including mitigation of GHG
emissions and adaptation to climate change. The NRE was formed in 2004 as part of a
comprehensive reform to tackle policy fragmentation by combining the separate environmental
portfolios under a single authority. Aside from overseeing NSCCC, the ministry has been appointed
as the Designated National Authority (DNA) for evaluating Clean Development Mechanism (CDM)
projects and as the liaison to UNFCCC. Within the NRE is the Environmental Management and
Climate Change Division which is tasked with establishing a holistic policy framework to ensure a
healthy, clean, safe, and productive environment for sustainable development. This division is also
responsible to ensure that the country's interests in global and regional environmental issues are
protected.
The DOE under the NRE is mandated to prevent, control and abate pollution by enforcing the
Environmental Quality Act (EQA) of 1974. The DOE also formulated the Recommended Malaysian
Air Quality Guidelines (RMG) and manages the air quality monitoring network.
The MOT is the primary agency responsible for planning, formulating, and implementing policies on
road, rail, maritime, and aviation transport and ports. It undertakes service provider licenses and
concessionaires (for commercial and public vehicles), for domestic shipping lines. It also undertakes
the issuance of drivers’ licenses, vehicle registration and road tax administration, vehicle type
approval, and formulation of vehicle regulations through the JPJ, the primary road vehicle authority
under MOT.

34
Back in 2000, the Ministry of Science and Technology and Environment on behalf of the National
Committee submitted the country’s first national communication to UNFCCC which set the national
inventory of GHGs and the assessment of the possible impacts of climate change. The report made
suggestions for possible initiatives to address climate change.
Since the Government’s Third Malaysia Plan (1976-1980), environmental concerns have been
progressively emphasised in the various development plans. Although the policies are generally
treated within the bounds of particular sectors they also address, to some extent, the impacts of
climate change. Similarly, the Ninth Malaysia Plan (2006-2010) and the Tenth Malaysia Plan (2010-2015)
contained programmes that directly address or indirectly contribute to managing issues of climate
change adaptation and mitigation. These programmes include furthering of policies on development
of renewable energy sources, fuel pricing, enhancement of the role of public transportation systems
and furthering sustainable development.
Due to the recognised challenges presented by climate change and the need for a comprehensive
approach, in the 2005 the NRE, in collaboration with the Institute for Environment and
Development (LESTARI) and the Universiti Kebangsaan Malaysia (UKM), initiated a Policy Study
on Climate Change. The resultant draft 2009 National Policy on Climate Change consists of several key
elements that include objectives, principles, strategic thrusts, and key actions aimed at ensuring
climate-resilient development and low carbon economy (NRE 2009).
In parallel, the KeTTHA pursued relevant policies including support for alternative fuels and green
technology and the formulation of a National Policy on Green Technology, including green vehicles.
Among the documents on which environmental policy is based on are: The 1974 Petroleum Development
Act, the 1975 National Petroleum Policy, the 1980 National Depletion Policy, the 1990 Electricity Supply Act, the
1993 Gas Supply Acts, the 1994 Electricity Regulations, the 1997 Gas Supply Regulation, and the 2001 Energy
Commission Act. The Department of Electricity and Gas Supply acts as the overall regulator of both
electricity and gas supply. There are several other players in the energy sector including energy supply
and service companies, and research and development institutions as well as the end consumers.
Government-linked companies Petronas and Tenaga Nasional Berhad are major players in Malaysia's
energy sector.

35
Figure 19: Overview of responsibility for transportation policy, adapted from institutional cooperation for
sustainable transport in Malaysia workshop report, GIZ (Source: Author, 2016).
3.3.1. Malaysia national policy on climate change
In November 2009, the cabinet of Malaysia endorsed the Malaysia National Policy on Climate
Change. The fundamental policy statement was that Malaysia is committed to “ensure climate
resilient development to fulfil national aspirations for sustainability”5.
Objective & principles of the national policy on climate change
The government of Malaysia has underlined three major objectives and five major principles with
regard to this climate change policy.
Objectives:
Mitigating climate change through wise management of resources and enhanced
environmental conservation resulting in strengthened economic competitiveness and
improved quality of life.
Integration of response into national policies, plans, and programmes to strengthen the
resilience of development from arising and potential impacts of climate change.
Strengthening of institutional and implementation capacity to better harness opportunities to
reduce negative impacts of climate change.
Principles, Strategic Trusts (ST) & key actions:
Development of a sustainable path – Integrate climate change response into national
development plans to fulfil the country’s aspiration for sustainable development.
ST1: Facilitate harmonisation of existing policies & institutions
ST2: Implement measures on low carbon economy 5 Sustainable Consumption and Production in Malaysia, EPU 2013

36
ST3: Support climate-resilient investment
Conservation of environmental and natural resources – Strengthen implementation of
climate change actions that contribute to environment conservation and sustainable use of
natural resources.
ST4: Strengthen environmental & resources conservation
ST5: Consolidate the energy policy
Coordinated implementation – Incorporate climate change consideration into
implementation of climate change responses.
ST6: Integrate cross-cutting issues
ST7: Support knowledge-based decision making
Effective participation – Improve participation of stakeholder and major groups for
effective implementation of climate change responses.
ST8: Improve collaboration
ST9: Increase awareness & community participation
Common but differential responsibilities and respective capabilities – International
involvement on climate change will be based on the principle of common but differentiated
responsibilities and respective capabilities.
ST10: Strengthen involvement in international programmes
Climate Change
Adaptation Mitigation
Development
Vulnerability
Development
Resilience
Resources Economy Social
Land
Water
Foresty
Biodiversity
Mineral
Agriculture
Industry
Biotechnology
Food Security
Water Sufficiency
irrigation
Livelihood
Safety&Security
Social Welfare
Climate Resilient
Development
Climate Proof
Development
Development
Vulnerability
Development
Resilience
Resources Economy Social
Development
Vulnerability
Development
Resilience
Resources Finance Social
Economy
Vulnerability
Economy
Resilience
Industry Trade
Emission Reduction / Sink Enhancement
Carbon Offset Schemes
Climate Friendly Technology
Financing & Investment
Insurance Schemes
Climate Resilient
Economy
Low Carbon
Economy
Figure 20: Overall framework on national policy of climate change (Source: UKM, 2008).

37
3.3.2. National green technology policy (renewable energy and
efficiency for the transport sector)
Policy statement: Green technologies shall be a driver to accelerate the national economy and
promote sustainable development.
Objectives:
■ To minimise growth of energy consumption while enhancing economic development
■ To facilitate the growth of green technologies industry & enhance its contribution to national
economy
■ To increase national capability and capacity for innovation in green technologies development &
enhance Malaysia’s competitiveness in the global arena
■ To ensure sustainable development & conserve environment for future generations
■ To enhance public education & awareness on green technologies and encourage its widespread
use
Four Pillars
i) Energy – Seek to attain energy independence & promote efficient utilisation
ii) Environment – Conserve & minimise impact on environment
iii) Economy – Enhance national economic development through use of Green
Technology
iv) Social – Improve the quality of life for all
Five Strategic Trusts
1. Strengthen the institutional frameworks
2. Provide conductive environment for green technologies development
3. Intensify human capital development in green technologies
4. Intensify green technologies research and innovations
5. Promotion and public awareness
Achievements to date:
■ Restructure of Malaysia Energy Centre (PTM) as to Malaysian Green Technology Cooperation
(MGTC)
■ Development of the Green Technology Financing Scheme (GTFS)
■ Develop Putrajaya & Cyberjaya as green technology cities
3.3.3. National Physical Plan (NPP)
The National Physical Plan is a written statement that summarises the strategic policies for direction
of physical development and conservation for all Peninsular Malaysia. The NPP was approved by the
National Physical Council (NPPC) in 2005. This plan has several formulated and proposed strategies,
policies, direction and implementation mechanisms related to spatial planning, including aspects of
integrated transportation planning and development.
38
The objective of this policy is to establish an efficient, equitable and sustainable national spatial
framework to guide the overall development of the country towards achieving developed and high-
income national status by 2020:
i) To rationalise and consolidate the national spatial planning framework supported by key
strategic infrastructure for economic efficiency and global competitiveness
ii) To optimise utilisation of land and natural resources for sustainable development and
biodiversity conservation
iii) To promote more balanced regional development for national economic integration and
social unity
iv) To enhance spatial and environmental quality diversity and safety for quality of life
Themes and Policies:
Theme 1: Setting a national spatial framework
Theme 2: Enhancing economic competitiveness
Theme 3: Conserving agriculture resources & rural development
Theme 4: Sustainable tourism development
Theme 5: Managing changing human settlements
Theme 6: Conserving natural resources, biodiversity & the environment
Theme 7: Integrating national & urban transportation network
Theme 8: Providing appropriate infrastructure
Under theme 7, integrating national & urban transportation network, there are six policies involved:
1. Integrated transport network
2. Rail network
3. Road network
4. Airports & seaports
5. Transit oriented development (TOD)
6. Urban & public transport
3.4. Existing policies on transportation
Table 12 provides an overview of the key polices and measures in passenger transport and their
status as of 2016. The major points of the Malaysian logistics policy are summarised in table 13.
These tables are extracted from the comprehensive policy table in Appendix 5, which also includes
the information sources. Status is assessed according to these categories:
■ Implemented: The policy is implemented and enforced, or the transport plan (e.g. metro) is
completed and functioning. However, it does not imply there can be no further implementation,
e.g. if a certain fuel economy standard is implemented, a future, more stringent, standard can still
be developed, or new standards be developed for other types of vehicles.
■ Partially implemented: Some parts of the policy or transport plan have been implemented
■ On-going: Implementation has started but not yet completed
■ Pilot: May refer to a policy that is being implemented, but not yet on a large scale
■ Planned: Clear policy signals, particularly published official documents, that a policy will begin
implementation in a certain year in the future

39
■ Intended: Evidence of policy discussions have been found (public information or personal
communication)
■ Not in discussion: No information on policy discussion has been found
The policies have been categorised according to Avoid, Shift, Improve or general policies: “Avoid”
policies refer to those that reduce the need to travel or the length of travel; “Shift” policies refer to
those that encourage a shift to more efficient modes of transport or those that promote a high share
of such modes, and: “Improve” policies refer to those that increase energy and carbon efficiency of
vehicles, their operation and fuels used in the different modes.
Policies Measures
Implementation Status
Remarks
Avoid TOD/ land-use planning
On-going TOD was introduced in Greater KL/KV which is densely populated. Compact development and mixed-used planning are among main thrusts of the government as stated in the 10th Malaysia Plan, National Physical Plan and National Urbanisation Policy.
Road pricing Implemented Toll Road Pricing based on vehicle type and size is a means of financing road infrastructure projects, but not for congestion charging.
Restrictions on car use
Not in discussion Pilot programme in the 1970’s was suspended due to lack of alternative transport means at that time.
Shift – incentives regulation and information
PT management reform
Implemented A 20-year National Public Transport Master Plan 2012 stated the need of state-level master plans to be developed. The Greater KL/KV Land Public Transport Master Plan is supported by six subsidiary plans: Urban Rail Development Plan, Bus Transformation Plan, Taxi Transformation Plan, Interchange & Integration Plan, Land Use Plan, and Travel Demand Management Plan.
Subsidy for PT options
Implemented in some areas
Penang, Selangor and Johor Baru have free limited route down-town shuttle buses.
Cycling campaigns
Pilot in Penang and KL
Only at local levels (e.g. Penang State, George Town area and selected recreational sites in KL).
Integrated ticketing for PT
On-going Touch n Go ticketing system on RapidKL systems, KL Monorail, ERL/ KLIA Express and KTM Komuter. Although public transport in Malaysia is run by different operators, SPAD is working toward single cashless ticketing system.
Real-time public transport info
On-going A fleet tracking system monitors RapidKL Buses using GPS. Displays show information including estimated time of arrivals for next ride.
Shift – infrastructure
Improvement of intra-urban rail
On-going The system is currently undergoing major expansions in the KL area.
BRT Implemented6 BRT Sunway Line has been operating since June
6 The existing BRT system at Bandar Sunway is exceptionally expensive (elevated, isolated electric bus highway), and may not be effective or competitive with other transport options in the long-term. The proposed BRT system for Johor Bahru is expected to be a more conventional one with associated cost savings.

40
2015. Its 5.4 km elevated bus rapid transit system operated by 15 electric buses. BRT Federal Line was proposed by Prasarana and planned to be operational by 2018. An additional line is planned in Johor Bahru.
Sidewalks On-going In some high-pedestrian travel areas sidewalks are expanded and maintained properly.
Cycling lanes Piloted in Penang Penang Bicycle Lane Masterplan, launched in 2012, is an initiative of the state to become more bikes friendly. The masterplan includes a total of 200 km of bicycle lanes for both mainland and island. The state government of Penang mandated that new housing projects will be equipped with bike lanes.
Bike-sharing Piloted in Penang A contract to design, install, operate, and maintain a bike-sharing system in George Town, Penang, has been awarded in 2014. It will be in operation in May 2015 and the whole system will be fully completed by 2017.
Park-and-ride
Implemented P&R system was first implemented in KL Sentral area in 2001 and is ongoing in the rest of the KL area, but is yet to achieve wide implementation outside of KL.
Improve – efficiency
Incentives for efficient vehicles
On-going 100% import duty exemption for EVs
Incentives for alternative fuels
On-going NGVs are given a reduction of road tax, 50% road tax reduction for mono-gas vehicle, and 25% for bi-fuel vehicle (petrol and natural gas).
CO2-based taxation for new vehicles
Not implemented
Car labelling Not implemented Fuel economy standards
Not implemented
Improve – operation
Intelligent transport systems
On-going ITS was completed in 2005 to monitor traffic flow. It is operated by Kuala Lumpur City Hall (DBKL).
Speed limits Implemented National Speed Limit Order 1989 indicates that the default speed limit is 110km/h on intercity highways, 90km/h on federal and state roads, and differs for different categories of vehicles.
Inspection and maintenance
Implemented Only covers new car purchase and transfer of ownership. Commercial and public vehicles are inspected routinely by PUSPAKOM.
Improve – fuel
Incentives for low-carbon fuels
Implemented As in year 2014, government of Malaysia subsidised 0.13 USD per litre equivalent for CNG, which reduced the retail price to 0.28 USD per litre equivalent.
CNG/LPG for taxis and buses
On going CNG vehicles are predominantly confined to taxis in Klang Valley and Penang. There were 3000 CNG bi-fuel taxis registered in 2013.

41
EEV (energy-efficient vehicle. hybrid) incentives (2W/3W/car)
On going Ministry of International trade and Industry (MITI) offers 100% import duty exemption for electrical or hybrid cars below 2200cc. This is granted by National Automotive policy 2014.
General Fuel price reform
Implemented In December 2014, subsidies were removed for RON95 petrol and diesel. Retail prices are fixed according to a managed flow mechanism.
Ride calling applications
Implemented Services like Grab and Uber are allowed to operate in Malaysia
For more detailed information on existing transportation related policies, please refer to the complete table in Appendix 5
Table 12: Passenger transport policies and measures: Current status (Source: Author, 2015).
Policies/Measures
Implementation Status
Remarks
Avoid Empty hauling reduction
Piloted Transport4u, a private company has
taken initiative on providing online
‘freight exchange’ and load matching
service to reduce empty hauling.
Improve logistic centres and their location, inland ports
On-going Third Industrial Master Plan 2006-2020 recognises the need for strategic logistics centres at the border area as well as in areas around Ipoh in Perak, Northern Johor-Melaka and East Coast of Peninsular Malaysia. It emphasises development of rail and freight distribution centres and distribution parks near major seaports and airports or in inland industrial location.
Pipeline Implemented Peninsular Gas Utilisation is the longest (1,700km) pipeline in Malaysia connecting Kerteh refinery in Terengganu to other areas of Peninsula Malaysia.
Shift – regulation
Lorry restrictions Partially implemented
Vehicles weighing 10,000kg and above are banned from North-South expressway between 6.30am and 9.30am on weekdays since 15 May 2010 (to reduce rush hour congestion) on major urban highways in KL and Penang bridge.
Shift - infrastructure
Master planning for rail and water
On-going Rail Freight transport was identified as a key sector in Third Industrial Master Plan 2006-2020 and the Eleventh Malaysia Master Plan.
Multimodal facilities/dry ports
On-going Infrastructure development was recognised as an important thrust in the Logistics and Trade Facilitation

42
Masterplan (2015-2020), improving last mile connectivity to Port Klang, addressing bottlenecks at Padang Besar Terminal and creating integrated hub and spoke models are among the key action items.
Improve – efficiency
Import restriction for inefficient vehicles
Implemented As stated in National Automotive Policy, import of used commercial and public vehicles will be prohibited, effective from 1 January 2016.
Fuel economy/CO2 emission standard
Planned NRE is working with MAI to formulate appropriate policy measures and standards.
Improve – operation
Vehicle scrapping/fleet replacement
Planned Currently, there are no restrictions on older commercial and public vehicles as long as they pass JPJ/PUSPAKOM inspection. MAI is investigating the possibility of implementing a mandatory program.
Speed limits Implemented Special speed limits exist for heavy vehicle on expressways: 80-90km/h, and Federal and State roads: 70-80km/h
Eco driving On-going Human Capital was identified as important in the Logistics and Trade Facilitation Masterplan (2015-2020), training will be provided to increase capabilities of goods vehicles drivers.
Tyre standards Implemented
Malaysia follows Malaysian and UN standards for tyres.
Aerodynamic standards
Not intended in near future
Based on manufacturer design.
Human capital development
Planned Adoption of technology to reduce exchange of manual documentation and optimise transport movements is planned along with enhancement of human resources by attracting, and training people in the logistics industry.
Integrated infrastructure Planning
On-going Improve last mile connectivity to Port Klang and enhance road freight productivity, creating an integrated hub and spoke development model, with freight hubs at strategic locations, and establish Public Private Partnership for rail operations and infrastructure.
Transport hub de-bottlenecking
On-going Address bottlenecks in Padang Besar, establish national freight data program, promote efficient urban logistics
Improve – fuel
Low carbon fuel (1st/2nd gen Biofuel, CNG, LPG) incentive
Implemented Malaysia implemented B7 (7% biodiesel) in 2014, and will mandate B10 by late 2016. The government has been funding infrastructure improvements required for higher levels of biofuels. NGV and mixed fuel

43
vehicle are entitled to road tax reductions.
General Inspection and maintenance
Implemented Commercial and public vehicle undergo mandatory inspection by PUSPAKOM routinely, in order to certify compliance to the Road Transport Act 1987.
For more detailed information on existing transportation related policies, please refer to the complete table in Appendix 5
Table 13: Freight transport policies and measures: current status (Source: Author, 2015).
3.4.1. Policy summary
While Malaysia has a very mature and professional policy development mechanism, the gradually
growing awareness of environmental issues has led to a proliferation of organisations with somewhat
inconsistent goals and directions. Often well intentioned environmental measures are oriented
towards manufacturers, rather than addressing the market demand directly. Policy measures relating
to transportation are often focused only on the greater KL/KV area as it is the most heavily
populated and congested area, essentially neglecting other areas. Finally, there are some very
progressive policies being developed, but often these are on a project-by-project or technology
specific basis, as opposed to being based on a more universal metric such as CO2 emissions per
passenger kilometre or per freight ton kilometre.
3.5. Environmental policy financing
Environmental policy related expenditures are financed similarly to all government programmes in
Malaysia. Each year a federal budget is developed by the standing federal government, projecting
government revenues and spending as well as forecasting the expected economic conditions for the
coming year, and outlines the fiscal policy as promulgated by the EPU for the near future. Each
year’s budget contains estimates of incoming revenues and expenditures pursuant to the policies in
effect during that year. Generally, the federal budgets are announced in October and the state
budgets, which are dependent on the federal disbursements, are released shortly thereafter. Upon
acceptance of the proposed budget, it is signed into law. The five major strategies focused on in the
budget are: Strengthening economic resilience, ensuring inclusiveness, empowering human capital,
enhancing productivity, innovation and green technology, and safeguarding the well-being of the
population. Additionally, five zones have been identified for special economic development: Johor
(Iskandar), the Northern Corridor (Perak, Penang, Kedah and Perlis), the East Coast Economic
Region (Kelantan, Pahang, Terengganu and the district of Mersing in Johor), the Sarawak Corridor
Renewable Energy located within the central region of Sarawak, and the Sabah Development
Corridor.
The budget is developed initially based on estimates of expenditures of each of the departments,
linked to the specific programmes and priorities set out by the current ruling coalition. The Treasury
Board then compiles all these into an initial proposed budget. The Cabinet and Prime Minister’s
Department then adjust the budget based on economic, social and political factors.
The final budget must be passed by the House of Representatives (Dewan Rakyat) which contains
opposition party as well as ruling coalition members. Failure to pass could result in the dissolution of

44
the ruling coalition, and re-formation of the government. Partially because of this any member of the
ruling coalition who votes against the budget is generally dismissed from the party immediately.
Total federal revenue is projected to be almost 58 billion USD for 2016, with about 0.017% of this
allocated to the KeTTHA for implementation of three Green Technology projects.
Environmental related funds are spent on administration of the DOE, NRE and KeTTHA, as well
as educational campaigns, special projects, and various energy related centres around the country.
(KeTTHA, National Energy Efficiency Action Plan, 2014). Industries are encouraged to improve
energy efficiency via tax incentives for qualifying projects.
3.6. Monitoring
The DOE is responsible for environmental air quality measurements and maintains several ambient
air quality measuring stations around the country. PUSPAKOM is responsible for measuring the
emissions of road vehicles at their various test centres around the country. The DOE and JPJ can
also enforce vehicular emission laws by ticketing obvious polluters, or requiring them to be re-
measured by PUSPAKOM.
Commercial and public vehicles are regularly inspected and tested for emissions, however these tests
are performed “static” with the vehicles engines at idle, or reviving but with no load applied to the
vehicles. This fails to catch many of the polluting trucks as they only tend to emit smoke when
significantly loaded on the road or on a dynamometer test bed. Exhaust and noise emission from
petrol driven vehicles and motorcycles are controlled and inspected by DOE at occasional curb site
inspection and operation throughout the country (DOE, Annual Report, 2014).
Current approach Data availability
Energy efficiency (passenger)
Vehicle Kilometre Travel (VKT) and Passenger Kilometre Travelled (PKT) data are taken by MIROS from vehicles involved in accidents
Number of vehicle registered is published by MOT in Yearly Transport Statistic Malaysia.
Fuel consumption and emission data of all vehicle models in Malaysia are collected by JPJ during Vehicle Type Approval (VTA). VTA conducted by National Committee for Type Approval chaired by JPJ.
VKT and PKT data are update annually by MIROS, however only certain years are available from the online publications and the data does not match with survey results performed by the authors.
Number of new vehicles, by type, by fuel type, number of actively in use vehicles, and traffic composition of selected roads are available in Transport Statistic Malaysia published by MOT annually.
Although fuel consumption and emission data of all vehicle models are recorded in VTA process, the data is not published and generally comes from the manufacturers declaration based on certified test reports.
Energy efficiency (freight)
Ton kilometre travel of rail, flight and marine are published through freight operator annually.
SPAD is responsible for monitoring road and rail freight transport. There is no official monitoring of energy
Ton kilometre travel of railway is updated by Malayan Railways Limited (KTMB) annually through Transport Statistic Malaysia.
Total cargo handled by airport is available in Transport Statistic Malaysia as well.

45
efficiency of road freight transport.
Urban transport including public transport, NMT, land-use policies, etc.
Urban transport including public transport is the responsibility of SPAD which cooperates with private public transport service providers. Land-use policy, Transit Oriented Development, and Urban Transport infrastructure are monitored by SPAD, in cooperation with the MoW and KPKT.
Public transport statistics such as passenger kilometre or passenger per hour statistics are monitored and provided by public transport services. The statistics are available in the annual Transport Statistic report.
Modal shift in freight
Rail freight is monitored by Malayan Railways Limited (KTMB), the only rail freight service provider.
Sea freight is monitored by Marine Department and port operator.
Although road freight is monitored by SPAD, road freight data is not recorded systematically. A national freight data program was identified as a key action item in the Logistics and Trade Facilitation Master Plan (2015-2020).
Annual freight statistics of rail, air and marine are provided by service provider and are available in annual Transport Statistic report.
Some road freight statistics are available through academic studies (Nasir, 2014).
Fiscal policies including fuel /vehicle taxes
MOF is responsible for taxes, incentive, subsidies related to transport and automotive sector.
The relevant information regarding vehicle taxes and incentives are available via the official portal of MOF.
Table 14: Monitoring system and data availability for each transport sector in Malaysia (Source: Author,
2015).
3.7. Future emissions projections
Population is steadily growing and projected to hit close to 40M by 20307. Meanwhile GDP has been
growing at a faster rate, indicating an improvement in the per capita GDP as the Malaysian economy
matures. In the projection shown below, the GDP is trending towards 400 M USD by 2030, for a
per capita GDP of around 10,000 USD. In this figure, the data points represent actual World Bank
data, while the solid lines are trend lines.
7 Official government estimate from www.statistics.gov.my estimated the population at 36M in 2030, however this likely omits up to several million undocumented people living in Malaysia
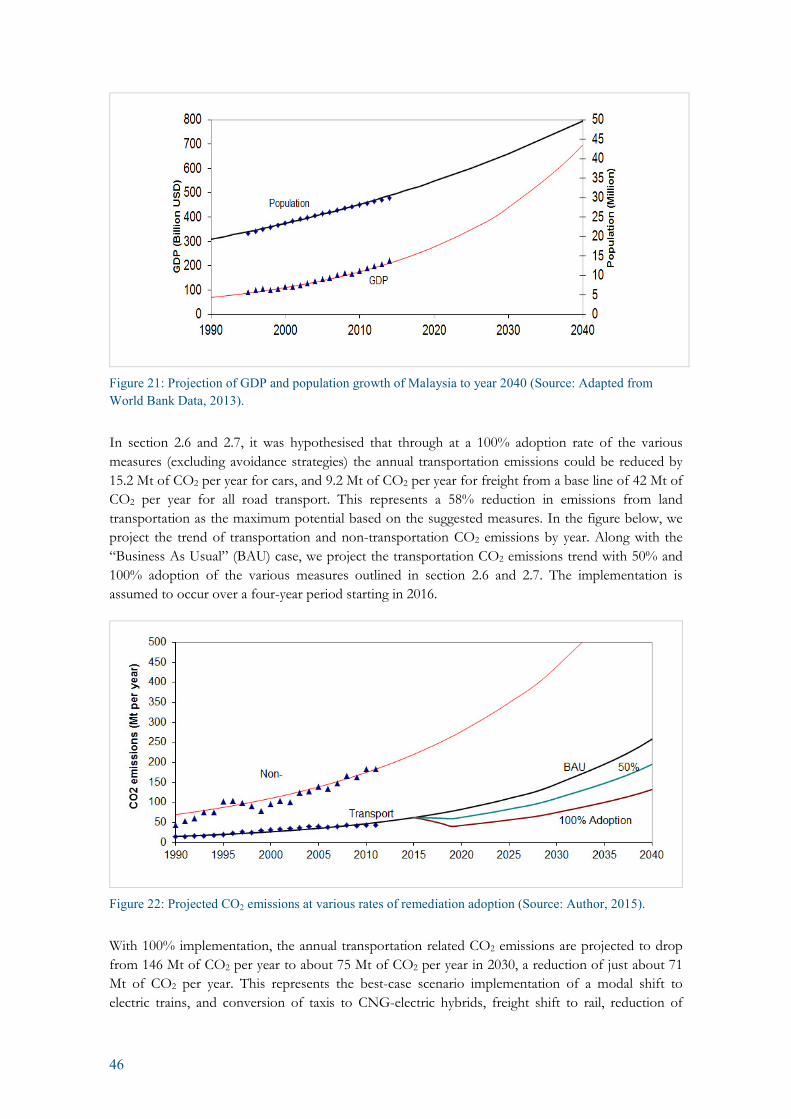
46
Figure 21: Projection of GDP and population growth of Malaysia to year 2040 (Source: Adapted from
World Bank Data, 2013).
In section 2.6 and 2.7, it was hypothesised that through at a 100% adoption rate of the various
measures (excluding avoidance strategies) the annual transportation emissions could be reduced by
15.2 Mt of CO2 per year for cars, and 9.2 Mt of CO2 per year for freight from a base line of 42 Mt of
CO2 per year for all road transport. This represents a 58% reduction in emissions from land
transportation as the maximum potential based on the suggested measures. In the figure below, we
project the trend of transportation and non-transportation CO2 emissions by year. Along with the
“Business As Usual” (BAU) case, we project the transportation CO2 emissions trend with 50% and
100% adoption of the various measures outlined in section 2.6 and 2.7. The implementation is
assumed to occur over a four-year period starting in 2016.
Figure 22: Projected CO2 emissions at various rates of remediation adoption (Source: Author, 2015).
With 100% implementation, the annual transportation related CO2 emissions are projected to drop
from 146 Mt of CO2 per year to about 75 Mt of CO2 per year in 2030, a reduction of just about 71
Mt of CO2 per year. This represents the best-case scenario implementation of a modal shift to
electric trains, and conversion of taxis to CNG-electric hybrids, freight shift to rail, reduction of

47
empty back-hauling, intermodal freight improvements, use of B20 biodiesel, and truck efficiency
improvements. A more realistic adoption rate of 50% results in a reduction of about 36 Mt of CO2
per year emissions in 2030. Essentially this represents about a 24% reduction in transportation
related emissions. By contrast, complete elimination of all car traffic via avoidance (a very unrealistic
scenario) would result in a about a 50% reduction in transportation CO2 emissions.
In terms of CO2 emissions per GDP, even with the optimistic scenario of 100% adoption of the
modal shift to electric trains and hybrid CNG-electric taxis and freight improvements, the projected
CO2 emissions intensity remains about the same in 2030 as it is today. Both World Bank data and the
World Resources Institute climate data (CAIT) give similar numbers for total CO2 emissions per
GDP, while the WRI data has a slightly more optimistic trend in the last few years.
0.0
0.2
0.4
0.6
0.8
1.0
1.2
1.4
1.6
1.8
2.0
1990 1995 2000 2005 2010 2015 2020 2025 2030 2035 2040
Year
CO
2 E
mis
sio
ns
(k
g/$
GD
P)
BAU
100% Adoption
2020 Target
Figure 23: CO2 emissions per GDP (triangles are World Bank data, small circles are CAIT data) with
Business As Usual trend and 100% transportation remediation adaption (Source: Author, 2015).
The remediation actions discussed above are not the only measures possible and 100% adoption of
the aforementioned transportation remediation measures is probably not a realistic scenario.
However, it does highlight the fact that improvements in the sustainability of transportation could
have a major impact on CO2 emissions in the near future. While there are a lot of unknown factors
which will influence the actual CO2 emission intensity, it does indicate that the changes in
transportation emissions analysed here are likely to fall far short of achieving the stated goal of a
40% reduction in CO2 emissions on a per GDP basis by 2020 (without commensurate
improvements in electric power generation, residential, commercial and industrial CO2 emissions) as
indicated by the solitary point in the graph above.

48
4. Barriers to sustainable transportation in
Malaysia
Several different techniques were used to analyse transportation sustainability in Malaysia. Initial
work was performed via interviews with various stakeholders, while later work focused on
comparing and contrasting the situation in Malaysia with other countries in the ASEAN region.
Results of these investigations are presented in the following sections. The various barriers have been
broken into the following categories for analysis purposes:
Policy development barriers
This category includes problems associated with the development of effective policies.
Physical and infrastructural barriers
This category includes issues which require significant changes in infrastructure.
Behavioural and informational barriers
This includes barriers related to information exchange, and behavioural practices.
4.1. Policy development barriers
The findings presented here were gathered through interviews with respondents from various
sectors, directly or indirectly involved in transport policy formulation and implementation, and
independent analysis of existing legislation as well as contrasting domestic policy with other ASEAN
countries. A complete list of transportation policies is given in Appendix 2.
Complex interagency relations
There are many different organisations responsible for various, often overlapping, aspects of
transportation. Communication of related policies to the appropriate authorities is sometimes
insufficient. The lack of unified authority creates frictions between potentially competing interests of
the various departments. Specifically, at regional and local levels there is some degree of confusion
over the jurisdiction related to enforcement of certain legislation.
Absence of lead agency for sustainable transportation
There is a need for a strong federal agency which can lead sustainable transportation policy
development and drive implementation down to the local level, analogous to the US Environmental
Protection Agency. Currently policy development, standard limits, and implementation are left up to
various different organisations, often with a technology-specific approach, rather than a consistent
emphasis on overall energy efficiency and CO2 emissions reduction (Raja Noriza Raja Ariffin, 2012).

49
Lack of carbon emissions emphasis in transport policy
Policy initiatives tend to be ‘ad hoc’ and often address individual technology aspects. There is a lack
of coordinated sustainable transportation policy. Policies are often oriented towards providing
incentives for manufacturers (of which there are very few in Malaysia) rather than focusing on
consumers, which would have a greater effect on the overall market.
Lack of resources for implementation and monitoring
Currently there is an insufficient structural framework to guide policy development down to the
implementation authorities responsible for enforcement. Also, once signed into law, there is a lack of
follow through or feedback to policy makers on the effectiveness of the policy. Development,
monitoring and enforcement of policy are often hampered by a lack of human resources and proper
training and equipment. Additionally, the level of resources varies greatly from state to state. Often
good policies are developed but not implemented effectively as development is at a federal level,
whereas implementation is at local authority or implementing agency which may not have the
required resources or priorities to properly enforce them.
Low awareness of sustainable transport
The concept of sustainable transport is not fully understood by many government officials. Generally
economic goals and growth are viewed as the primary objective of policy, whereas environmental
impact is secondary. There is low awareness of the positive long-term economic effects of
sustainable transportation, thus sustainability may be sacrificed in favour of shorter term economic
goals.
Summary of policy development barriers
The fragmented nature of multiple government agencies with overlapping areas of responsibility in
the transportation field, and lack of integration from the federal policy development level to local
enforcement hampers both the effective development and implementation of sustainable policies. In
some cases, the implementing agencies do not have the required training, equipment or
understanding of federal policy required for proper enforcement. Although sustainable
transportation can greatly contribute to economic growth by saving resources, and reducing the
economic burden of transportation, there is a perception that sustainable transportation conflicts
with economic interests which may lead to a perpetuation of non-sustainable practices in the interest
of shorter term economic gains.
50
4.2. Physical and infrastructural barriers to sustainable
transport policy
This section highlights issues which require significant infrastructure or physical resource
development, such as adding new railways or building new laboratory facilities. Improving these gaps
will require a commitment of time and money, and may span many years.
Absence of central technical lab supporting vehicle type approval
testing
As mentioned in the previous section, the policy makers lack sufficient technical knowledge required
to develop competent policies relating to energy efficiency and sustainability. Ideally there should be
a central test facility with complete Vehicle Type Approval (VTA) testing capabilities including
emissions, fuel consumption, and road noise testing and resources to support the technical
information requirements of the government today as well as developing core competencies required
for future growth. Additionally, local automotive industries would benefit by being able to conduct
these types of tests. As of 2016, this facility does not exist in Malaysia.
Upgrading PUSPAKOM inspection and testing facilities
Currently, PUSPAKOM performs “static” emission testing or “Free Acceleration Static Test” with
no load applied to the vehicles for public and commercial vehicles, which are inspected and tested
twice a year. However, this testing is not sufficient to identify polluting trucks as they only tend to
emit smoke when significantly loaded on the road or dynamometer. Upgrading the current testing to
the more accurate “Chassis Dynamometer Smoke Test” represents a major improvement in the
ability to identify inefficient, polluting vehicles.
Integrated database system for sustainable transport management
Currently, all information from curb-side inspections is captured by DOE and, for commercial and
public vehicles, by PUSPAKOM. However, vehicle owner and VTA information are captured by
JPJ. This data is not yet integrated into a centralised database accessible by all parties. Establishing
and expanding the scope of this type of database would allow improved analysis and decision
making.
Integrated land use/urban area transport planning
The greater Kuala Lumpur area is currently the only region undergoing consistent urban
transportation planning. This should be extended to the other major cities including Ipoh, Penang,
Johor Bahru, etc.

51
Insufficient transport hub interconnectivity
Outside of the Kuala Lumpur, the individual transportation hubs are often poorly interconnected.
For example, in Ipoh the express bus station is located near the highway, outside of town, with no
direct link to the train station. Many towns, such as Sibu and Melaka have no public transport
accessibility from the adjacent airport to town except from taxis. Also, parking is often grossly
insufficient at major transportation hubs, such as the train station at Parit Buntar with space for
about 10 cars and no link to other transportation sources at all. A similar situation exists for freight
hubs as well: While all major ports have both road and rail links, there are numerous bottlenecks in
the road system and within the port terminals themselves, causing significant inefficiencies.
Dedicated freight routes should be expanded to prevent road freight – passenger traffic conflicts.
Underutilisation of inland port rail, port congestion and multi-
modality
Rail transportation is seriously underutilised in the freight sector, despite the fact that all major ports,
including inland “dry” port freight hubs have rail links. Currently SPAD and JPJ are in charge of
freight regulation and enforcement. Within SPAD, however, there are separate divisions dedicated to
road freight and rail freight. Bottlenecks and delays at the freight hubs put rail haulage at a
disadvantage compared to road haulage. Additionally, there are passenger rail – freight conflicts on
some lines resulting in delays for both freight and passenger trains.
Figure 24: Explanation of intermodal container transportation (Source: Nasir, 2014).

52
Light commuter rail expansion
Recently (2015) the northern peninsular Malaysia “electrified double track” commuter rail project
was opened, and is exceedingly popular. This convenient, efficient mode of transportation should be
expanded, and perhaps subsidised at the expense of private vehicle ownership both between cities
and within developed areas as well.
Alternative fuels
While the CNG infrastructure and fleet size are growing, LPG is virtually non-existent as an
alternative fuel in Malaysia. LPG could form an important part of the “clean energy” picture for
Malaysia, especially in areas not yet served by CNG stations. Local industries also tend to have a low
awareness of alternative fuel technologies.
Insufficient parking
Parking is generally left up to local authorities. Issues with parking are regulation and enforcement,
and parking spaces are frequently insufficient for the needs of a region, causing people to park on the
roads, thereby interfering with traffic flow. “Park and Ride” at commuter rail and bus stations is well
established in the KL area, but underexploited in other areas. Work is currently being performed in
this area, the importance of which should be highlighted.
Non-motorised transport: Nascent
Walking infrastructure is being expanded in KL. Bicycling lanes and bike share programmes are only
just beginning and need to be expanded, to become an integral part of all urban space planning.
4.3. Behavioural and informational barriers to sustainable
transport policy
This section expounds upon various issues which predominantly require behavioural changes,
and/or information sharing to overcome, with relatively little physical infrastructure development.
Overcoming these barriers could happen relatively quickly, with much smaller investments of funds
than major infrastructure projects.
Certification of corporate CO2 emissions
Malaysia has implemented an innovative programme called “My Carbon” which allows companies to
voluntarily report their CO2 emissions in order to be eligible for various tax incentives. While this is a
good start, the programme needs to be expanded, made mandatory, and utilise standard tools to be
verified by third parties to insure legitimacy.

53
Green technology encouragement via taxation/subsidies
Current energy/emissions related taxation and subsidies are fragmented, often being applied on a
project-by-project or technology specific basis. Ideally this would be converted to a CO2 emissions
basis and applied equally to all technologies. Inefficient or polluting vehicles should be taxed and the
revenue could be applied towards subsidies of more efficient vehicles or transport modes.
Energy efficiency labelling (all classes)
Vehicle energy efficiency labelling is currently not mandatory. It should be applied uniformly to all
classes of vehicles so end users can judge the relative efficiency of competing products for the best
effect.
Road use (congestion) pricing
A pilot programme began back in the 1970’s however it was abandoned as no other options existed.
With the acute urban congestion in many cities, it may be time to look again at this as a way of
reducing congestion, parking problems, fuel consumption, and improving the balance sheet for
public transportation. This applies to trucks, passenger cars and even motorcycles.
Bus route optimisation
With ever changing development and transportation densities, bus routes require continual
optimisation to maintain an effective alternative to private car ownership. This is just beginning to
happen in the greater KL/KV, and should be expanded to the rest of the country.
Integrated ticketing
The KL train and bus systems now have almost fully integrated ticketing via the “Touch and Go”
RFID cards. This could be expanded to all other public transport modes, and even taxis. Application
to taxis may have the spill over effect of reducing fare “haggling”.
Intelligent transport information systems
Since an on-line “Waze” type application with real time information would be of tremendous benefit
to commuters, some train/bus stops in KL already feature this technology. Currently only major city
centres have significant coverage. Improved bus timing reliability would be a major improvement
even in remote locations where busses may only run once an hour. An excellent opportunity exists to
integrate the existing traffic monitoring networks in the hands of the government agencies with
commercial services such as “Waze” in order to cover a wide variety of transportation options all in
one package.

54
Cars/truck restriction times/zones
A local and very successful example of this is the highway trucking banned during the Chinese New
Year/Hari Raya (Ramadan) festive seasons when countless families travel back to their hometowns.
A similar program could be implemented on a wider basis to improve traffic flow in other frequently
congested areas.
Car share
One way to improve transport efficiency is via “car share” programs which eliminate the inefficiency
inherent in taxis (where the vehicle is driven to or from a customer pickup/drop off point “empty”).
There is currently only one “car share” programme with Electric Vehicles in the KL metro area,
“COMOS”. This system is really only useful for hub-to-hub transport where existing public
transport already exists. Even in very congested traffic it can be observed that the vast majority of
passenger cars have only one occupant. Every effort should be made to increase the number of
passengers per car to reduce the number of cars on the road. Other “car share” programmes such as
Uber and Grab are becoming more popular in urban centres despite occasional friction from
traditional taxi. These can help improve efficiency by allowing an operator to pick up a paying
passenger travelling in their same general direction they are going. Multi-passenger lanes or car pool
lanes may also help to encourage car sharing
Freight “load share”
Many freight companies are operating with reduced overall efficiencies due to empty back hauling.
This is caused by a lack of coordinated information sharing which would allow the various freight
companies to work together in order to reduce empty back hauls. The concept is sometimes referred
to as a “freight exchange” where various firms can post their available trucks and routs so as to
exchange loads and minimise under loading of trucks on the road.
Inspection, maintenance and vehicle End of Life (EOL)
Passenger vehicles are only inspected when ownership is transferred, or when modified via the
approved process8. Many of the older vehicles on the roads are in a poor state, and consume much
more fuel than reasonable. A mandatory Inspection and Maintenance (IM) programme could be
implemented to identify the worst polluters, and either have them fixed, or deny their renewal of
road permit. Simultaneously a “clunker” scrapping programme should be initiated to insure the
poorly operating vehicles are indeed recycled, and the owners compensated appropriately.
8 Many vehicles undergo modifications which are not reported or inspected. Such modifications are illegal and owners of such vehicles may be subject to prosecution.

55
5. Recommendations for action
While Malaysia has a very mature policy development structure and advanced transportation
infrastructure, there are still some areas which can be improved in order to reduce the fuel
consumption and CO2 emissions intensity to improve the overall sustainability of the transport
sector in Malaysia. The following suggestions have been derived from careful analysis of existing
governmental policy as well as in comparison with policies and practices in other countries.
Additionally, GIZ has performed related work in a number of countries under the “Mobilise Your
City” programme, which includes much useful information for comparison 9 . The resulting
recommendations for action have been separated into institutional improvements and capacity
building, avoidance strategies, suggestions to shift to another more efficient transport mode, and
improvements for existing transport modes.
5.1. Strengthening institutions and capacity building
Paramount in effectively addressing the environmental concerns is to clearly define what
organisation is responsible for implementing any environmental policy, and give the responsible
party the appropriate training, funds and tools required to implement and monitor the policy.
Establish centralised authority for fuel efficiency and CO2
assessment
What is lacking here in Malaysia is a single central authority which oversees energy efficiency
and CO2 emissions, similar to the US Environmental Protection Agency. Rather than creating yet
another government organisation the recommendation is to strengthen the existing NRE by giving it
the tools and training to be able to generate the required data and analysis in order to properly advise
the policy makers in this area. The NRE should have the authority to develop appropriate policies,
standards and dictate the overall direction of legislation relating to fuel consumption and emissions.
As the NRE is already responsible for the collection of air quality data, it is believed that they are the
appropriate organisation to head the overall CO2 emissions assessment for the country.
Institutional and capacity improvements for the various
stakeholders
Along with the responsibility for collecting data is the need to establish and maintain a laboratory
with the appropriate tools for measuring the emissions and fuel economy/energy consumption of
the various vehicles (including petrol, CNG, LPG, diesel, hybrid and electric vehicles) in use under
local conditions. This is required for three reasons:
■ To measure the fuel efficiency/energy consumption/emissions for policy purposes
9 “Mobilise Your City” information available at: http://www.codatu.org/wp-content/uploads/MobiliseYourCity-A3-BD.pdf

56
■ To verify the fuel efficiency and emissions of fleet vehicles
■ To promote and establish new vehicle efficiency labelling
The responsibility for verification of new and in-use vehicles on an on-going basis should be left up
to the existing PUSPAKOM organisation; however, it should be equipped with expanded
capabilities, such as loaded dynamometer testing of vehicular emissions.
All the stakeholders and policy makers, especially within the EPU, should be provided with sufficient
knowledge and the latest information and long-term financial returns of sustainable development.
When the long-term returns on investments of sustainable policies are apparent, expenditures to this
end are much easier to justify.
Use CO2 emissions per passenger kilometre as the unit for
comparison of all transportation modes
To consistently emphasise the fuel efficiency, a consistent unit of measurement needs to be
used. Rather than creating technology specific legislations, taxation and subsidies should be made on
the basis of CO2 emissions per passenger kilometre, of per ton kilometre for freight.
Public education pertaining to sustainable transportation
Education on the importance of sustainable transportation should be implemented in primary
and secondary schools, as well as reinforced through education of the general public. Specifically, the
inefficiency of single-occupant cars and the inherent efficiency of two-wheeled transport and public
transport should be stressed. Additionally, ecological driving practices should be highlighted and
contrasted with inefficient practices. Currently there is very little understanding of efficient “eco”
driving, and the effect of speed on efficiency. This could be emphasised via public education,
including coverage in both primary and secondary education.

57
5.2. Avoidance strategies
Coordinate land use/urban planning on all municipalities
Even small and medium towns and cities should receive education about the importance of
sustainable transportation and town planning. Standard practices should be explained and rigorously
implemented in all urban locations above a given size, including all the major towns. Coordination of
local development and federal transportation infrastructure is imperative for seamless, efficient
transportation.
Single passenger cars should be restricted during peak transit hours
In especially congested areas single passenger cars and/or unloaded trucks could be banned
during different times of the day (e.g. rush hour) or times of the year (e.g. Ramadan, Chinese New
Year) in order to reduce traffic congestion. More generally, in areas where more efficient
transportation options exist, road use costs can be increased, making it expensive to drive in already
crowded metro areas.
Car-pooling
One of the most effective ways to improve transportation efficiency is to increase the number of
passengers in existing passenger cars. Single rider cars should be discouraged, and car-pooling should
be encouraged. Public education programmes, on-line “ride share boards” and corporate incentives
for car-pooling should be implemented. Incentives could include “car share” vehicles at work for
workers who car-pool. Prioritised “multiple passenger vehicle” parking at Mass Rapid Transit (MRT)
stations may also have a positive impact on MRT ridership.
Restrict truck freight in congested areas
Unless the point of origin or destination of a truck is within the congested area, the truck should be
kept out of that area. This can be done by scheduling “truck times” at off peak hours (as is done in
the UK and elsewhere), or building in specific bypass routes (also called truck routes in some areas)
to avoid urban centres altogether.
National or regional freight exchange database
The Logistics and Trade Facilitation Master Plan includes the development of a well organised and easily
accessible freight exchange database to allow even smaller freight carriers to reduce empty back-
hauling and improve overall efficiency. This should be implemented at a national level, and expanded
internationally especially along the Singapore – Bangkok corridor through Peninsular West Malaysia.

58
5.3. Modal shift strategies
Interconnect all transportation hubs
New transportation hubs require an interconnection plan, for example from a train station to
the local bus station, or from either of these to the town centre. Existing transport hubs, including
train stations, bus stations, airports and ferry terminals should have interconnecting links retrofitted
in. For example, many towns (Melaka, Sibu, etc.) have no public transport from the local airport to
the town centre or other transportation hubs, requiring large number of passengers to use taxis.
This is especially true for freight link between trucks and rail lines. Despite the numerous benefits of
rail transport to haul large quantities of long distance freight, utilisation of rail freight services
throughout Malaysia is still limited. The underutilisation of existing rail freight is to some extent due
to poor service and absence of last mile connectivity (EPU; Logistics and Trade Facilitation Masterplan,
2015).
Park and ride
Parking in urban centres needs to be handled on a consistent basis. While this is being done in
the KL area, it is less common elsewhere. Sufficient parking should be provided, especially at
transportation hubs. To encourage utilisation of alternative transportation modes, parking should be
free at transportation hubs. Additionally, parking on the road, where it blocks traffic flow, should be
strictly forbidden.
Encouraging use of energy efficient transportation
An increasing number of Energy Efficient Vehicles are becoming available including both two and
four-wheeled electric and hybrid vehicles. EEV’s should be encouraged in all forms. Two-wheelers
are significantly more efficient than cars and they make an ideal first/last mile link in a mass
transit commute, however they are at a much greater risk regarding accidents, with over 4,000
motorcyclists dying in crashes compared to about 2,800 other road users in 2010 (MIROS 2011).
While many things can be done to encourage usage of two-wheelers, perhaps the most important
changes involve making motorcycling safer. Motorcycle ridership and safety can be encouraged by:
■ Expansion of motorcycle-only infrastructure
■ Free, priority parking for motorcycles and helmet storage at all transportation hubs and
government offices
■ Subsidised road usage fees and insurance
■ Continuing “Share The Road” public education underscoring the efficiency and vulnerability of
two-wheelers
Encouragement of non-motorised transport in urban areas
This pertains both to urban/town planning as well as transportation hubs, and for retrofit into
existing urban areas. Examples include bicycle paths and bike-share programmes, unobstructed
sidewalks and covered walkways as well as pedestrian bypasses for busy roads as is common in

59
Singapore and South Korea. While this is being addressed in the KL area, it needs to be considered
nationwide.
Expansion of the light-rail network
Light rail is the most efficient mass transportation mode; however, it requires large capital
investments and many years of planning and construction. A consistent programme of expansion, as
is currently happening in the Kuala Lumpur area, needs to be implemented in other urban areas as
well, along the lines of the German Inter City Express (ICE) and S-Bahn model.
Optimise bus routes
With changes in developments re-optimisation of bus routes and other transportation modes
has to occur. Bus routes can be changed quickly, whereas rail services require much more time. A
rational and consistent bus route optimisation programme should be included in the expanding light
rail development, helping point towards optimum rail routes as well as improving overall
transportation efficiency.
Intelligent transportation information systems
An integrated approach to transportation information should be taken, including the local display
boards at transport hubs, train and bus stations, but extending country wide via the internet, and
incorporating real-time features such as those found in Waze. For example, a commuter ideally
should be able to check on a smart phone and determine which public transpiration options exist in
their vicinity, where the various vehicles are, and what their Estimated Time of Arrival (ETA) is at
the closest stations. This is currently being used on only some transportation segments, such as the
Sunway BRT.
Integrated ticketing
Malaysia had made major improvements in this area, using the “Touch and Go” ticketing system on
toll roads, MTR, car parks and other systems. The existing “Touch and Go” integrated ticketing
should be expanded to include transportation outside of the KL area, and applied to taxis and other
modes of transport, such as bike share or car share programmes.
Rail freight share increase
SPAD and other concerned parties need to take a holistic approach to making freight hub to port
interconnectivity more advantageous for rail transport. Increased frequency and reliability of freight
trains, greater flexibility of loading, unloading and routing loads are key factors to making rail
transport more attractive (EPU; Logistics and Trade Facilitation Masterplan 2015).

60
5.4. Improvement strategies
Make CO2 assessment mandatory for all companies above a
certain size, including transport
For non-transportation industries this would include making the “My Carbon” mandatory, and
independently verified (by, for example, an organisation equivalent to PUSPAKOM, however with a
non-transport orientation). For transport this would include fleets, and analysing the vehicles being
used, loads and routes in order to help optimise fleet efficiency.
Efficiency label and standards
As is done in many other countries, all new vehicles and in fact any energy consuming product above
a certain power rating, should be labelled as to depict relative efficiency in easily understandable
terms. This would be the responsibility of the centralised energy efficiency laboratory of the NRE
under the expansion outlined above. Additionally, this can form the basis of enacting Vehicle
Efficiency Standards once the relevant laboratory capable of confirmation is established.
Fleet inspection and maintenance and scrapping programme
Exceptionally poorly tuned older vehicles account for a disproportionate amount of fuel
consumption and emissions of both passenger vehicles as well as freight vehicles. Currently there is
no existing mechanism to eliminate or enforce reparation of these vehicles. An inspection and
maintenance programme for cars and motorcycles of say 10, 15 and 20 years old should be
implemented to catch the very worst polluters. To avoid massive public backlash, the initial
standards need not be particularly strict, and should include the option to repair the vehicle to
conform to the standards. For vehicles that repeatedly fail a conservative CO2 or fuel consumption
specifications these vehicles should be scrapped, and the owners compensated in some manner so
that they might acquire a newer, more efficient vehicle.

61
6. Conclusion
Road transportation accounts for approximately 85% of all transportation related CO2 emissions in
Malaysia. Of that by far the largest share, 59%, comes from cars while 27% is attributed to freight
(including a small amount from buses), and 11% comes from motorcycles. In the intermediate term
(the next decade or two) the largest improvements in transportation sustainability can be made from
a modal shift away from personal cars and motorcycles to use of buses and commuter rail services.
Improvements in the taxi fleet can be made by moving towards hybrid electric designs. Freight
efficiency can be greatly improved by shifting from trucks (which carry 95% of all freight currently in
Malaysia) to rail.
Additionally, “freight exchange” services which help reduce empty back-hauling, and freight hub
intermodal connectivity and debottlenecking can make a significant contribution as well.
Improvements in the efficiencies of individual freight trucks, as well as driver training in fuel efficient
techniques, and the use of 20% biodiesel will also have a significant impact on transport related CO2
emissions. While a large number of additional recommendations are presented in this paper, the few
enumerated above could potentially reduce transportation CO2 emissions by as much as 50% if fully
adopted. This would reduce CO2 emissions by approximately 71Mt per year by 2030.
Malaysia is well positioned to become a leader in transportation sustainability within South East Asia:
It has a growing public transportation segment and long term urban planning and funding. There are,
however, several ways which policy making could be enhanced to promote more efficient and
sustainable transportation. Malaysia needs a single lead organisation with all the tools and resources
required to get the appropriate data on fuel consumption and emissions of various technologies, and
then to guide policy makers towards the most sustainable long-term policy decisions. Ideally, there
should be a central laboratory with the proper facilities and human resources to support vehicle type
approval, certification of energy consumption and emissions, and standards development and
verification. Implementing authorities require resources and training to help them understand the
importance of policies which they are responsible to enforce.
Public education in terms of transportation sustainability and energy efficiency will be an ongoing
need so that end consumers can make more informed decisions before deciding to drive a car, or
even buying one. Many of the recommendations presented do not require large government funding
efforts, for example energy efficiency labelling on automobiles and motorcycle. Some suggestions,
such as taxing inefficient vehicles, and using the funds to subsidise energy efficient vehicles can be a
zero-sum game: The revenue from taxes should go directly to expenditures in subsidies. Finally,
government policy should be based on energy efficiency, with a consistent metric of CO2 emissions
per passenger kilometre travelled, or per ton-kilometre of freight shipped.
International oil prices are currently at a relative low, making this perhaps the best time to take
action. CO2 emissions from transportation are growing at approximately 6% per year. If this trend is
left unchecked, not only will Malaysia be emitting considerably more CO2 then necessary, but its
citizens will be burdened with an inherently inefficient system, requiring overdependence on
personal automobiles and liquid petroleum fuels.

62
References
Car ownership in M’sia third highest in the world: Nielsen. (2014, April 16). Retrieved May 19, 2016, from
The Star Online: http://www.thestar.com.my/business/business-news/2014/04/16/car-
ownership-in-msia-third-highest-in-the-world/
A. B. Aizura, T. M. I. Mahlia, H. H. Masjuki. (2010). Potential fuel saving and emission reduction
from fuel economy standards implementation for motor vehicles . Clean Technologies and
Enviroment Policy, 255-263.
American Association of Port Authorites. (2013). World Port Ranking 2013. Retrieved May 18, 2016,
from American Association of Port Authorities: http://aapa.files.cms-
plus.com/PDFs/WORLD%20PORT%20RANKINGS%202013.pdf
Aziz, N. A. (2015, April 8). Rainfall in Malaysia 2008-2015. Retrieved May 16, 2016, from OR
Technologies: http://www.ortechnologies.net/blog/posts/rainfall-in-malaysia-2008-2015/
Conglin Xu, L. B. (2014, January). Global reserves, oil production show increases for 2014. Oil &
Gas Journal.
Davis, Stacy C; Susan W.Diegel; Robert G. Boundy. (2011). Transporttation Energy Data Book: Edition
30. United State: US Department of Energy.
Emrah Demir, Tolga Bektaş, Gilbert Laporte. (2014). A review of recent research on green road
freight transportation. European Journal of Operational Research, 775-793.
EPU; Logistics and Trade Facilitation Masterplan. (2015, March). Executive Summary Logistics and Trade
Facilitation Masterplan. Retrieved May 18, 2016, from Official Protal of Ministry of
Transportation Malaysia:
http://www.mot.gov.my/en/Penerbitan%20Rasmi/Executive%20Summary%20Logistics%
20and%20Trade%20Facilitation%20Masterplan.pdf
GIZ. (2014). Institutional Cooperation for Sustainable Transport in Malaysia Workshop Report. Putrajaya,
Malaysia: ASEAN – German Technical Cooperation Transport and Climate Change.
H.C. Ong, T. M. (2011). A review on emissions and mitigation strategies for road transport in
Malaysia. Renewable and Sustainable Energy Reviews, Elsevier, 3516-3522.
Hill, H. (2003, September 23). Online Extra: Behind Malaysia's Economic Miracle. Retrieved May 15,
2016, from Bloomberg: http://www.bloomberg.com/news/articles/2003-09-28/online-
extra-behind-malaysias-economic-miracle
Hosseini, S. E., Wahid, M. A., Aghili, N. (2013). The Scenario of Greenhouse Gases Reduction in
Malaysia. Renewable and Sustainable Energy Reviews. 28, 400-409.

63
Joseph, M. (2014). This is the first haul exchange purely for the Malaysia road network. Retrieved May 18,
2016, from Transport4U: http://www.transport4u.my/haulage-exchange.html
KeTTHA. (2014, January). National Efficiency Action Plan Final Draft 2014. Retrieved May 18, 2016,
from Official Protal of Ministry of Energy, Green Technology and Water :
http://www.kettha.gov.my/kettha/portal/document/files/NEEAP%20For%20Comments
%20Final%20January%202014.pdf
Lee Jih Hor, Chong Chew Liang, Dr. Horizon, Gitano. (2010). Analysis of Motorcycle Fuel
Consumption in Malaysia. SAE Technical Paper, 20.
Liang, C. C. (2010). Motorcylce Chasis Dynamometer Testing. Penang, Malaysia: USM Senior Thesis.
MOT. (2013). Transportation Statistic Malaysia. Malaysia: Ministry of Transport.
Marc E. J. Stettler, William J. B. Midgley, Jacob J. Swanson, David Cebon, Adam M. Boies. (2016).
Greenhouse Gas and Noxious Emissions from Dual Fuel Diesel and Natural Gas Heavy
Goods Vehicles. ACE Publication Enviromental Science and Technology , 2018-2026.
MIROS. (2011) ADSA Fact Sheet Vol. 1, May 2011
MIROS. (2013). Car Annual Vehicle Kilometer Travelled Estimated From Car Manufacturer Data . Retrieved
March 14, 2016, from The Official Web Site of Malaysia Institute of Road Safety Research:
http://www.miros.gov.my/1/publications.php?id_event=115&idxs_page=22
Nasir, S. (2014). International Container Transport Logistic To And From Malaysia Ports. Doctor
Thesis in Transport Science Stockholm, Sweden.
Oregon Department Of Environmental Air Quality publication http://www.deq.state.or.us/aq/committees/docs/truck/measurePresentation.pdf
Raja Noriza Raja Ariffin, R. K. (2012). The challenges of implementing urban transport policy in the
Klang Valley, Malaysia. The 3rd International Conference on Sustainable Future for Human Security,
Elsevier, 469-477.
Sani, E. M. (2012). Malaysia: Key Logistics and Transportation System (Road and Rail). Ministry of
Transport Malaysia, (p. 20).
Shamsuddin Shahid, Anil Minhans, Othman Che Puan. (2014). Assessment of Greenhouse Gas
Emission Reduction Measures in Transportation Sector Malaysia. Journal Teknologi UTM, vol
70, 1-8.
Siti Indati Mustapa, H. A. (2015). Investigating Factors Affecting CO2 Emissions in Malaysian Road
Transport Sector. International Journal of Energy Economics and Policy, 1073-1083.
Sgouris P. Sgouridis (2003). Freight Transportation in Malaysia: Technological and Organizational
Issues from an ITS Perspective AY 2002/2003 Spring Inception Report Massachusetts Institute of
Technology
64
Taleb, N. N. (2007). The Black Swan: The Impact of the Higly Improbable. United State of America:
Random House (U.S) .
Tan Ching Tiong, Joy Jacqueline Pereira, Koh Fui Pin. (2009). Stakeholder Consultation in the
Development of Climate Change Policy: Malaysia’s Approach. KDI School of Public Policy and
Management. Seoul, South.
Teoh Say Lai, Dr.Horizon Gitano Briggs. (2009). Development of a Small Motorcycle EFI Retrofit
System. SAE Technical Paper, 5.
UK Department for Transportation “Transport Statistics Bulletin: Road Freight Statistics 2007”,
June 2008, SB (08) 21. Available at: http://www.dft.gov.uk
US EPA. (2015). US EPA Light-Duty Automotive Technology CO2 Emissions and Fuel Economy Trends:
1975 through 2015. United State: EPA.
UKM. (2008). Policy Framework on Climate Change: Stakeholder viewpoints. Putrajaya, Malaysia: Institute
for Environment and Development.

65
Appendix 1: List of policies related to
transportation in Malaysia
Malaysia pledged to reduce its greenhouse gas emissions intensity per GDP by 45% by the year 2030 relative to the emissions intensity in 2005. This consists of 35% on an unconditional basis and a further 10% that is condition upon receipt of climate finance, technology transfer and capacity building from developed countries. Malaysia’s Intended National Determined Contribution (INDC) was developed through an inter-ministerial/agency working group. Stakeholder consultations were conducted to obtain inputs on possible measures to reduce greenhouse gas emissions. The projected outcomes from the 11th Malaysian Development Plan and the following policies and plans form the basis for the development of this INDC: a. National Petroleum Policy (1975) b. National Energy Policy (1979) c. National Depletion Policy (1980) d. Four-Fuel Diversification Policy (1981) e. National Forestry Policy (1978, Revised 1992) f. National Policy on Biological Diversity (1998) g. Five-Fuel Policy (2001) h. National Policy on the Environment (2002) i. National Strategic Plan for Solid Waste Management (2005) j. National Biofuel Policy (2006) k. National Energy Policy (2008) l. National Green Technology Policy (2009) m. National Policy on Climate Change (2009) n. New Economic Model, Government & Economic Transformation Programs (2010) o. Renewable Energy Policy and Action Plan (2010) p. Second National Physical Plan (2010) q. Low Carbon Cities Framework (2011) r. National Agro-food Policy (2011) s. National Water Resources Policy (2012) t. National Automotive Policy (2014) u. National Energy Efficiency Action Plan (2014) Policy Description 1 National Petroleum Policy
(1975) - Efficient utilisation of petroleum resources - Ensuring the nation exercises majority control in the
management and operation of the industry 2 National Energy Policy (1979) - Supply objective:
Ensure adequate, secure and cost-effective energy supply
- Utilisation Objective Promote efficient utilisation of energy and eliminate wasteful and non-productive usage
- Environment Objective Minimise negative impact to the environment
3 National Depletion policy (1980)
- Formulated to prolong the life span of the nation’s oil and gas reserves
4 Four-fuel Diversification Policy (1981)
- Aimed at ensuring reliability and security of supply through diversification of fuel (oil, gas, hydro and coal)

66
5 Five-Fuel Policy (2001) - Encourage the utilisation of renewable resources such as biomass, solar, mini hydro etc.
- Efficient utilisation of energy 6 National Policy on the
Environment (2002) Set out the principles and strategies for Malaysia to exploit its natural resources in sustainable way base on 8 principles - Stewardship of the Environment - Conservation Nature’s Vitality and Diversity - Continuous Improvement in the Quality of the
Environment, - Sustainable Use of Natural Resources - Integrated Decision Making - The Role of the Private Sector - Commitment and Accountability - Active Participation in the International Community
7 National Biofuel Policy (2006) - Use of environment-friendly, sustainable and viable alternative source of energy in order to reduce dependency on depleting fossil fuels
- Enhance prosperity and well-being of all the stakeholder in the agriculture and commodity-based industries, through stable and remunerative prices
8 National Energy Policy (2008) - Ensure provision of adequate, secure and cost-effective energy supplies through developing indigenous energy resources both non-renewable and renewable resources
- Promote efficient utilisation of energy and discourage wasteful and non-productive patterns of energy consumption
- Minimise negative impact of energy production, transportation, conversion, utilisation and consumption on the environment
9 National Green Technology Policy (2009)
Green Technology shall be a driver to accelerate the national economy and promote sustainable development - To minimise growth of energy consumption while
enhancing economic development - To facilitate the growth of GT industry & enhance
its contribution to national economy - To increase national capability and capacity for
innovation in GT development & enhance Malaysia’s competitiveness in global arena
- To ensure sustainable development & conserve environment for future generations
- To enhance public education & awareness on green technology and encourage its widespread use
10 National Policy on Climate Change (2009)
Ensure climate-resilient development to fulfil National aspirations for sustainability 1. Mainstreaming climate change for strengthened
competitiveness and improved quality of life 2. Integration of climate change responses into
policies, plans and programmers 3. Strengthening of institutional and implementation
capacity 11 New Economic Model, NEM

67
Government Transformation Programme and Economic Transformation Programme (2010)
i) To stimulate economic growth by improving worker productivity across all sector of society, in part through an improved system of affirmative action, with an eye toward sustainability
GTP i) To transform the government to be more effective in
its delivery of services and accountable for outcomes that matter most the rakyat.
ii) To move Malaysia forward to become an advanced, united, and just society with high standards of living for all.
ETP 12 National Key Economic Area (NKREs), representing sectors where growth will be focus on. These sectors were identified based on their potential to contribute to GNI and create multiplier effect across the economy. Government also factored in Malaysia competitive advantages such as its skilled workforce, abundance of natural resources, expertise in manufacturing and its potential to create a niche for itself in the selected sectors
12 Renewable Energy Policy and Action Plan (2010)
Enhancing the utilisation of indigenous renewable energy resources to contribute towards National electricity supply and sustainable socio-economic development - To increases RE contribution in the national power
generation mix - To facilitate the growth of the RE industry - To ensure reasonable RE generation cost - To conserve the environment for future generation - To enhance awareness on the role and importance
of RE 13 Second National Physical Plan
(2010) Establish of an efficient, equitable and sustainable national spatial framework to guide the overall development of the country towards achieving developed and high-income national status
v) To rationalise and consolidate the national spatial planning framework supported by key strategic infrastructure for economic efficiency and global competitiveness
vi) To optimise utilisation of land and natural resources for sustainable development and biodiversity conservation
vii) To promote more balance regional development for national economic integration and social unity
viii) To enhance spatial and environmental quality diversity and safety for a high quality of life and liveability
14 National Automotive Policy (2014)
- Ensure orderly development as well as long term competitiveness and capability of the domestic automotive industry as a result of market liberalisation
- Create a conducive environment to attract new investment and expand existing opportunities
- Enhance the competitiveness of the national car

68
manufacturer through strategic partnerships - Foster the development of the latest sophisticated
technology in the domestic automotive industry - Develop high value-added manufacturing activities
in niche areas - Enhance Bumiputera participation in the domestic
automotive industry - Improve safety standards for consumers and
promote environment-friendly opportunities - Enhance the implementation of current NAP's
policy instruments 15 National Energy Efficiency
Action Plan (2014) Promote energy efficiency to productive use of energy and minimise waste in order to contribute to sustainable development and increased welfare and competitiveness - Establish an overall long term national plan for
energy efficiency - Strengthen implementation capacity to promote
energy efficiency - Create adequate and sustainable funding mechanism
for energy efficiency - Implement Energy Efficiency Programs - Enable commercial finance institutions to support
energy efficiency Remark:
i) The Ninth Malaysia Plan (2006-2010), Malaysia has started initiatives to increase the share of
use of non-fossil fuel energy
ii) The Tenth Malaysia Plan (2011-2015) focused on sustainable growth and introducing
mitigation strategies to reduce emissions of GHG. Three significant financial stools were
introduced to promote sustainability measures
iii) The Eleventh Malaysia Plan (2016-2020) will further focus on pursuing green growth for
sustainability and resilience. These include strengthening enabling environment for green
growth, adoption of sustainable consumption and production, conserving natural resources
and strengthening resilience against climate change and natural disasters. These actions will
further reduce Malaysia’s carbon footprint

69
Appendix 2: New vehicle registration data for year 2014 (Source: MOT)
Total motor vehicles by type and state in Malaysia, 2014
Motorcycles Motorcar Bus Taxi
Hire & Drive
Car Goods Vehicle Others Total
Perlis 4,603 1,604 2 0 0 33 24 6,266
Kedah 40,987 13,456 36 21 25 955 489 55,969
Pulau Pinang 47,203 40,053 267 201 65 2,973 743 91,505
Perak 41,577 26,699 174 11 25 2,273 1,053 71,812
Selangor 70,813 31,177 225 2,411 314 8,294 5,464 118,698
W.Persekutuan 80,606 191,012 756 2,363 4,214 11,419 3,252 293,622
N.Sembilan 18,869 10,127 51 11 3 1,988 211 31,260
Melaka 16,791 12,169 28 6 3 760 510 30,267
Johor 76,003 58,136 286 562 14 5,723 2,305 143,029
Pahang 23,344 12,309 23 6 1 1,215 513 37,411
Terengganu 16,833 7,951 15 5 1 417 50 25,272
Kelantan 27,311 12,402 39 5 1 583 95 40,436
Sabah 32,718 35,169 277 118 177 3,021 1,875 73,355
Sarawak 43,727 40,457 81 47 140 3,696 2,880 91,028
Malaysia 541,387 664,335 2,260 5,768 4,991 43,705 19,490 1,281,936
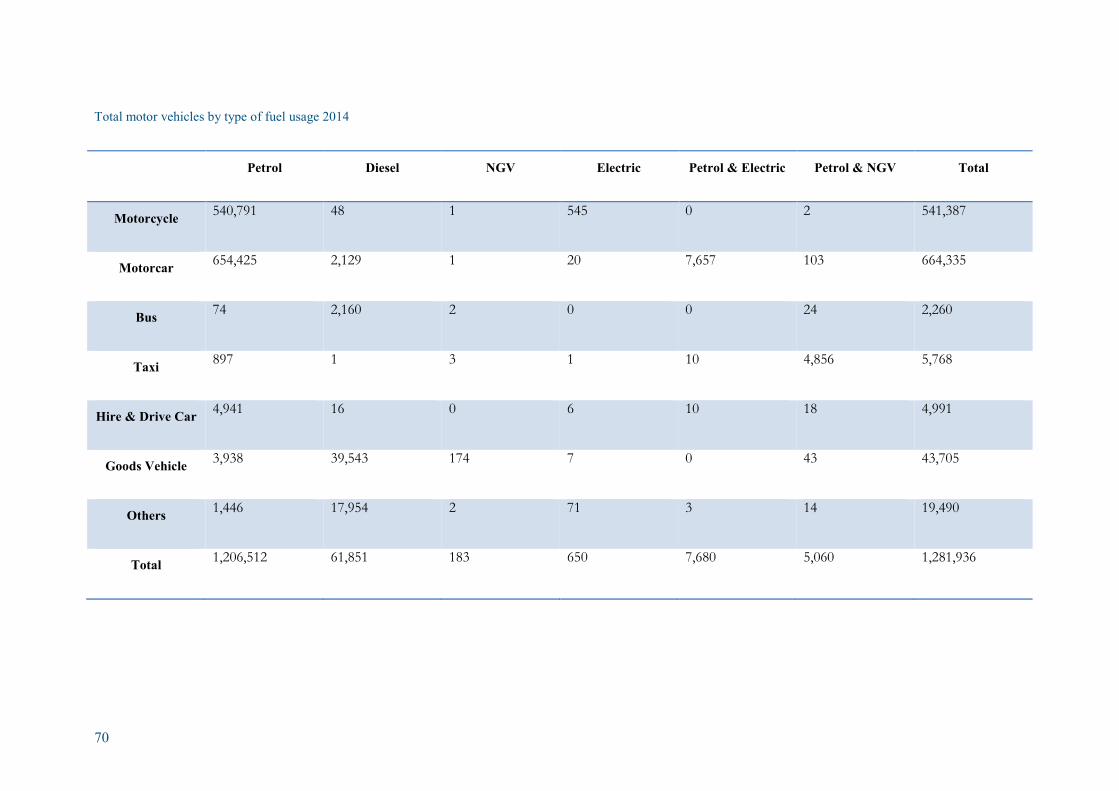
70
Total motor vehicles by type of fuel usage 2014
Petrol Diesel NGV Electric Petrol & Electric Petrol & NGV Total
Motorcycle 540,791 48 1 545 0 2 541,387
Motorcar 654,425 2,129 1 20 7,657 103 664,335
Bus 74 2,160 2 0 0 24 2,260
Taxi 897 1 3 1 10 4,856 5,768
Hire & Drive Car 4,941 16 0 6 10 18 4,991
Goods Vehicle 3,938 39,543 174 7 0 43 43,705
Others 1,446 17,954 2 71 3 14 19,490
Total 1,206,512 61,851 183 650 7,680 5,060 1,281,936

71
Number of vehicles on the road by state, Malaysia, 2010-2014
2010 2011 2012 2013 2014
Active Non-Active Active Non-Active Active Non-Active Active Non-Active Active Non-Active
Perlis 63,743 18,045 66,618 19,373 68,853 22,593 71,505 25,730 74,580 26,502
Kedah 671,989 330,155 717,393 347,955 745,237 385,710 781,143 417,655 800,867 442,820
Pulau Penang 1,614,307 492,924 1,686,521 527,226 1,735,367 590,849 1,797,153 642,102 1,832,586 667,634
Perak 1,305,640 505,529 1,361,606 537,163 1,390,851 601,404 1,429,589 653,967 1,443,940 698,699
Selangor 1,582,587 679,296 1,636,011 727,322 1,663,026 803,089 1,709,452 867,564 1,753,950 926,005
W.Persekutuan 3,785,566 849,646 4,041,587 922,059 4,290,989 1,029,573 4,620,264 1,129,866 4,748,442 1,201,043
N.Sembilan 525,097 251,757 544,534 266,055 553,716 292,089 567,574 313,346 574,857 330,367
Melaka 487,240 185,188 509,414 196,547 524,690 217,297 543,866 234,797 554,993 245,759
Johor 2,003,475 764,791 2,105,420 818,478 2,185,121 909,835 2,283,489 984,923 2,341,035 1,044,689
Pahang 570,653 237,155 603,906 252,373 619,965 285,966 641,885 314,336 648,717 337,323
Terengganu 351,839 115,242 376,449 122,952 394,851 139,758 414,316 153,634 423,171 165,493
Kelantan 473,470 190,382 505,713 203,021 526,996 232,451 554,596 253,904 569,828 268,634
Sabah 649,911 213,270 712,093 230,344 770,272 256,595 784,487 272,211 873,124 292,177
Sarawak 968,255 301,413 1,039,390 323,746 1,100,360 364,718 1,168,915 400,397 1,214,427 427,524
Malaysia 15,053,772 5,134,793 15,906,655 5,494,614 16,570,294 6,131,927 17,368,234 6,664,432 18,026,509 7,074,683
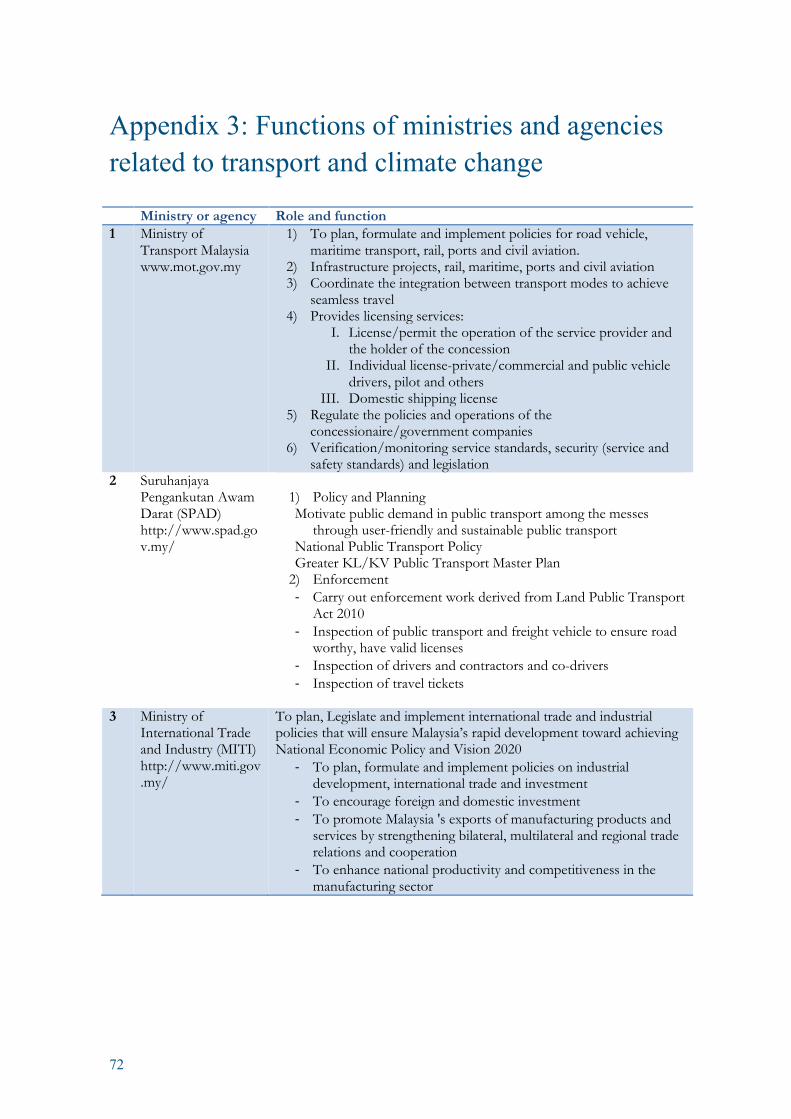
72
Appendix 3: Functions of ministries and agencies
related to transport and climate change
Ministry or agency Role and function 1 Ministry of
Transport Malaysia www.mot.gov.my
1) To plan, formulate and implement policies for road vehicle, maritime transport, rail, ports and civil aviation.
2) Infrastructure projects, rail, maritime, ports and civil aviation 3) Coordinate the integration between transport modes to achieve
seamless travel 4) Provides licensing services:
I. License/permit the operation of the service provider and the holder of the concession
II. Individual license-private/commercial and public vehicle drivers, pilot and others
III. Domestic shipping license 5) Regulate the policies and operations of the
concessionaire/government companies 6) Verification/monitoring service standards, security (service and
safety standards) and legislation 2 Suruhanjaya
Pengankutan Awam Darat (SPAD) http://www.spad.gov.my/
1) Policy and Planning Motivate public demand in public transport among the messes
through user-friendly and sustainable public transport National Public Transport Policy Greater KL/KV Public Transport Master Plan
2) Enforcement - Carry out enforcement work derived from Land Public Transport
Act 2010 - Inspection of public transport and freight vehicle to ensure road
worthy, have valid licenses - Inspection of drivers and contractors and co-drivers - Inspection of travel tickets
3 Ministry of
International Trade and Industry (MITI) http://www.miti.gov.my/
To plan, Legislate and implement international trade and industrial policies that will ensure Malaysia’s rapid development toward achieving National Economic Policy and Vision 2020
- To plan, formulate and implement policies on industrial development, international trade and investment
- To encourage foreign and domestic investment - To promote Malaysia 's exports of manufacturing products and
services by strengthening bilateral, multilateral and regional trade relations and cooperation
- To enhance national productivity and competitiveness in the manufacturing sector

73
4 Kementerian Tenaga, Teknologi Hijau dan Air (Kettha) http://www.kettha.gov.my/
To innovate and manage resources strategically, thereby ensuring availability, reliability and affordability of energy and water services and to champion the application of green technology to promote green economy and green living
- Ensure the implementation of development policies in the power industry, water and green technology effectively
- Ensure the provision of comprehensive infrastructure, an integrated, standards and quality
- To provide a conducive environment for industrial development and technology
- Provide research and development (R & D) continued to increase in the use of technology
- Ensure service delivery system that is efficient, effective and affordable
- Ensuring that the regulatory mechanisms implemented in accordance with the provisions of existing legislation and
- Improving the ability of the organisation on an ongoing basis to achieve the industry and green technologies
5 Ministry of Finance (MOF) http://www.treasury.gov.my/
1) To formulate and implement fiscal and monetary policies in order to ensure effective and efficient distribution and management of financial resources
2) To formulate financial management and accounting processes, procedures and standards to be implement by all government
3) To manage the acquisition and disbursement of federal government loans for domestic and external sources
4) To monitor that minister of finance incorporated companies are managed effectively
5) To monitor the financial management of ministries, government department and statutory bodies
6) To formulate and administer policies related to be the management of government procurement
7) To formulate policies and administer government housing loans for public sector employees
6 Ministry of Natural Resources and Environment (NRE) http://www.nre.gov.my/
NRE was established on March 27, 2004 following the formation of new cabinet. NRE responsible for:
1) Natural resources management - Forest management - Irrigation and drainage management - Wildlife management - Minerals management
2) Conservation and management of environment and shelters - Environmental conservation - Marine park management
3) Management of land survey and mapping administration - Land management and administration - Land survey - Mapping processing
7 Prime Minister Department (PMD) www.jpm.gov.my
- Providing support services including administration, finance,
human resource management, security, social and other services
to staff of the prime minister’s department, according to the
rules and regulations, and directives that have been set
- Management of all property owned by the federal government
efficiently and effectively

74
- Providing efficient, quality and effective services to the cabinet
and the chief secretary who is also acting as secretary to the
cabinet, as well as tracking and monitoring of implementation
of government decisions
- As a reference centre for all issues pertaining to security and
protection encompassing physical security, documents and
personnel formulating, issuing and establishing the security
policy to be properly implemented
- Establishing the coordination of the national economic
development policies, strategies and programmes for the
medium and long terms in a structured, planned, efficient and
proper manner, in order to strengthen the country’s
competitiveness, to promote economic growth, to promote
public-private sector cooperation, to intensify the k-economy,
and to promote the country’s socio-economic developments
- Central agency that monitors implementation of policies,
strategies, programmes and development projects, as well as
resolves related issues efficiently and effectively, to ensure they
are implemented in line with the national development goals
- Ensuring the formulation and coordination as well as the
implementation of policies relating to national security and the
direction of the security measures undertaken by well-planned,
comprehensive and integrated
- Enforcement of law and order under any federal law
8 Ministry of Works
(MOW) http://www.kkr.gov.my/en
The details of the functions of the MOW are as follows:
1) To plan the development of the federal road networks nationwide;
2) To coordinate and monitor the implementation of the federal road
projects and other projects under the supervision of MOW;
3) To regulate the privatised maintenance work of federal roads and;
4) The development of Bumiputera entrepreneurs in the construction
sector;
5) To monitor the construction, operation, toll handling and
maintenance of the tolled expressways;
6) To plan and coordinate human resource and financial
(administration and development) of MOW and PWD;
7) To monitor departments and agencies under its purview;
8) To monitor the implementation of the development projects of
the client ministries carried out by PWD;
9) To give advice and support services to CIDB in the development
of the country’s construction industry and skilled workforce;
10) To give advice and support services to MHA, BEM, BAM and
BQSM in the development of the professional services
programmes for the domestic and international
9 Ministry of Housing and Local Government
At 15 May 2013, KPKT was restructured and known as the “Ministry of Urban Wellbeing, Housing and Local Government”. The role and function involves the implementation of programmers and activities to

75
(KPKT) http://www.kpkt.gov.my/
improve the quality of life for urban citizens 1) To provide affordable housing, regulate aspects of private
housing of residential strata as well as solving housing disputes 2) Help guide local authority in providing municipal services,
quality recreational and socioeconomic facilities to meet the needs of local residents
3) To provide and efficient and effective fire prevention services, firefighting and rescue operations to protect lives and properties
4) To provide policy and technical advice to the federal government, state governments and local authorities in relations to the planning, management, development and conservation of land in accordance with the National Physical Plan
5) To provide policy and technical advice to the federal governments and local authorities in relations to the planning, implementing and managing of lands capes, parks and recreational areas
6) To provide a more integrated, efficient and cost effective policy for development and overseeing the solid waste management services and public cleansing
7) To implement programmes and activities to enhance the liveability of cities and public participation in local authority governance
8) To develop and regulate the activities of money lenders and pawn brokers
9) To implement programmes and activities to eradicate urban poverty and improve the quality of life of the urban poor
10 Economic Planning Unit (EPU) http://www.epu.gov.my/en/home
To manage the country’s socio- economic development in a strategic and sustainable manner
- Comprehensive planning though formulation effective policy
- Development programme through outcome base approach
- Maximise the usage of finance resources through effective distribution of allocation
- Strengthen human capital toward elevate efficiency and professionalism
- Establish organisation capacity to effective services delivery
11 Malaysia Automotive Institute (MAI) http://mai.org.my/v3/
To act as strategic thinker for the Malaysia automotive industry and to develop and promote the competitiveness of the Malaysian automotive industry.
- To transform the Malaysia automotive industry into a globally competitive sector, committed to wider application of research and technology in market driven niche areas, in efforts to widen the industrial base in enhancing the competitiveness of local automotive manufactured products and services and other related value added activities on world market
- To harness and mobilise collective efforts amongst the automotive stakeholders in the planning and implementation of industrial strategy towards a common direction at national level and to promote collaboration, strategic alliances, partnerships and linkages for technology and market outreach including

76
serves as focal point in providing the necessary support to various government and industry stakeholders
- To undertake strategic research and studies for inputs and policy advice to the government through the combined effort of the public and private sectors, to promote capacity and capability building of the local automotive industry and in general to serve and work with the Ministry of International trade and Industry (MITI) in shaping a national industrial competitiveness in the automotive sector towards sustainable prosperity
12 National Corporate GHG Reporting (MyCarbon)
Objective of the programme 1. Set up a globally recognised, standard corporate GHG
accounting and reporting programme in Malaysia 2. Data source for analysis and development of local emissions
factors 3. Encourage corporate level carbon accounting and emission
reductions 4. Provide standards, guidance and support measures
13 Malaysian Greentech Corporation (MGTC) http://www.kettha.gov.my/
- To minimise growth of energy consumption while enhancing
economic development;
- To facilitate the growth of the green technology industry and
enhance its contribution to the national economy;
- To increase national capability and capacity for innovation in
green technology development and enhance Malaysia’s
competitiveness in green technology in the global arena;
- To ensure sustainable development and conserve the
environment for future generations; and
- To enhance public education and awareness on green
technology and encourage its widespread use.
14 Road Transport
Department (JPJ) 1) To establish and regulate the vehicle regulations and formulate
the type approval system. 2) To establish and regulate the registration and licensing of motor
vehicles in systematic, reliable and innovative manner. 3) Establish and administer the road transport law with
commitment to produce competent, law abiding and prudent drivers of motor vehicle.
4) To enforce and administer the road transport law with integrity and commitment to create a society that has culture of adherence to the rules of the road.
5) To monitor and administer motor vehicle safety standards with efficiency and integrity to meet needs of the environment and the country’s automotive industry
15 Department of Environment (DOE) http://www.doe.gov.my/
The main function of the DOE is to prevent, eliminate, control
pollution and improve the environment, consistent with the purposes of
the Environmental Quality Act 1974 and the regulations there under DOE
is also responsible for the implementation of the resolutions decided by
the conventions of the international environment such as Vienna
Convention for the protection of the Ozone Layer 1985, Montreal Protocol on
Substances That Deplete the Ozone Layer 1987, the Basel Convention on the
Transboundary Movement of Hazardous Waste and Their Disposal Act 1989 and
other areas while the success of programmes of bilateral cooperation

77
and multilateral cooperation between Indonesia, Singapore and other
ASEAN countries on environmental management.
16 Malaysian Investment Development Authority (MIDA) http://www.mida.gov.my/
1. To promote foreign and local investments in the manufacturing
and services sectors
2. To undertake planning for industrial development in Malaysia
3. To recommend policies and strategies on industrial promotion
and development to the Ministry of International Trade
Industry
4. To evaluate application for manufacturing licenses and
expatriate posts; tax incentives; duty exemptions
5. Issuance of confirmation letter for the application of import
duty and/or sales tax exemption on machinery, equipment,
spare parts, consumables, prime movers and container trailers
for manufactures in the principal customs area (PCA),
companies engaged in a hotel business and haulage operates
under the self-declaration mechanism
6. To assists companies in the implementation and operation of
their projects and offer assistance through direct consultation
and co-operation with the relevant authorities at both the
federal and state levels
7. To facilitate the exchange of information and co-ordination
among institutions engaged in or connected with industrial
development

78
Appendix 4: Laws and regulations related to transportation in Malaysia Department Laws Agreements and conventions Department of Civil Aviation is an agency under the Ministry of Transport Malaysia that regulates civil aviation affairs especially pertaining to aviation security and standards.
Civil Aviation Act 1969 [Act 3]
Carriage by Air Act1974 [Act 148]
Aviation Offences Act1984 [Act 307]
Act of Aviation Services (Operating Company) 1991 [Act 467 Aviation]
Interest Act in Mobile Equipment (Aircraft) 2006 [Act 659]
Civil Aviation Regulations 1996
With 100 countries, Malaysia has A bilateral Air Services Agreement (ASA) is the basic document most often used by states to jointly regulate their international air services relationships. Most bilateral ASA cover only schedule international air services. Bilateral regulation is regulation undertaken jointly by two parties, most typically by two states. The goal of bilateral regulation in the international air transport field is typically the conclusion, implementation or continuance of some kind of intergovernmental agreement or understanding concerning air services between the territories of the two parties. A significant amount of intergovernmental bilateral regulatory activity involves formal consultation undertaken to conclude, interpret, expand or amend, or resolve a dispute under an intergovernmental agreement, arrangement or understanding concerning international air services. The bilateral regulation of international air services evolved over many decades. Although international air services were first developed in the 1920s, few bilateral intergovernmental agreements were concluded in those early decades due to the small volume of international air transport activities and then to the virtual cessation of many commercial flights during the 1939-1945 (World War II) period. Bilateral agreements now in force, which constitute the largest volume of international air transport regulatory documents, largely date after the 1944 International Civil Aviation Conference held in Chicago. This extensive use by states of bilateral agreements to regulate international air transport is a consequence of agreement in the Convention on International Civil Aviation on the principle of national sovereignty over territorial air-space, agreement on the requirement for special permission or other authorisation to operate scheduled international air services over or into the territory of a Contracting States, and the lack of success of efforts to establish a multilateral regulatory regime for the commercial aspects of international air transport. As a country that sits on the International Civil Aviation Organization (ICAO), Malaysia has ratified several International Convention as follows: 1929: Convention for the Unification of Certain Rules Relating to International

79
Carriage by Air 1944: Convention on International Civil Aviation 1947: Convention on the Privileges and Immunities of the Specialized Agencies 1963: Convention on Offences and Certain Other Acts Committed on Board Aircraft 1970: Convention for the Suppression of Unlawful Seizure of Aircraft (Hague Convention 1970) 1971: Convention for the Suppression of Unlawful Acts against the Safety of Civil Aviation (Montreal Convention 1971) 2001: Convention on International Interests in Mobile Equipment
Road Safety Department (JKJR) was established on 15 September 2004 is an agency under the MOT to promote and facilitate the development of road safety in Malaysia. The Department will also act as a One Stop Agency to carry out all activities that encompasses education, enforcement, engineering and road safety. Among the main goals of RSD is to reduce accidents, injuries and deaths to a minimum level on par with developed countries through the coordination and management of road safety programs at both national and state levels. On 1 April 1946, the Road Transport Department (RTD) was established to coordinate all aspects relating
Road Transport Act 1987
The Ministry of Transport Malaysia is a signatory to the various international conventions and protocols. It is also actively involved together with the government of other counties as well as the relevant international associations and organisations in programs related to land transport and road safety. The purposes of such active involvements are: i)to coordinate, monitor and manage the land transportation industry efficiently and effectively, particularly within the ASEAN region; ii) to provide platform for discussions and negotiations at international level; iii) to coordinate and simplify procedures for the operation of transit transportation; iv) to keep update of the global changes in the legal framework governing the land transportation system; and v) to draft infrastructure development policies and review the domestic legal framework in order to adopt and adapt the best global practices. 1998: Cooperation at ASEAN level: The agreements/Protocols/MOUs ratified/signed are as follows: ASEAN Framework Agreement on the Facilitation of Goods in Transit (AFAFGIT)
Protocol 1 Designation of Transit Transport Routes and Facilities- The Negotiation Stage
Protocol 2 Designation of Frontier Posts –
Protocol 3 Types and Quantity of Road Vehicles
Protocol 4 Technical Requirements of Vehicles
Protocol 5 ASEAN Scheme of Compulsory Motor Vehicle Third-Party

80
to motor vehicle regulations, type approval system and drivers registration and licensing in the entire country. The JPJ is the main authority under the Ministry of Transport. It is responsible for the provision of counter services as well as e-services for the registration and licensing of vehicles and drivers and the enforcement of the Road Transport Act 1987 in order to ensure safe drivers and vehicles.
Liability Insurance
Protocol 6 Railways Border and Interchange Stations
Protocol 7 Customs Transit System
Protocol 8 Sanitary and Phyto-sanitary Measures
Protocol 9 Dangerous Goods ASEAN Framework Agreement on the Facilitation of Inter-State Transport (AFAFIST) ASEAN Framework Agreement on Multimodal Transport (AFAMT) MoU Between The Government of Brunei Darussalam, Indonesia, Malaysia and The Philippines on Cross-Border Movement of Commercial Buses and Coach. MoU Between The Government of Brunei Darussalam, Indonesia, Malaysia and The Philippines on Transit and Inter-State Transport of Goods MoU Between The Government of Brunei Darussalam, Indonesia, Malaysia and The Philippines on Transit and Inter-State Transport of Goods
Railway Assets Corporation (RAC) is a Federal Statutory Body under Ministry of Transport Malaysia.
Railways Act 1991 RAC was established under the Railways Act 1991 (Act 463), commenced officially as an organisation on 1st August 1992 and gazetted under Volume 36 No.16 on 30th July 1992. RAC was fully operated on 1st October 1992. In conjunction with the establishment of RAC, the railway operation service was corporatized and Keretapi Tanah Melayu (KTM), a public entity which exists since 1894 was dissolved and officially known as Keretapi Tanah Melayu Berhad (KTMB). At the same time, Department of Railway (DOR) was formed to ensure and promote safe, efficient and affordable railway transport system in Malaysia. RAC, DOR and KTMB will jointly concentrate their efforts to enhance the level and quality of railway services in the country.
Marine Department of Malaysia is a government department under the Ministry of Transport Malaysia. This department was created to administer the business of shipping and port and maritime affairs
Cargo Transport by Sea Act1950 [Act 527] Merchant Shipping Ordinance 1952 [Ord. 70/1952] Federal Fire Dues Act 1953 [Act 243] Penang Port Commission
Malaysia has concluded maritime transport agreements with a number of countries since the eighties to strengthen bilateral cooperation in the maritime sector. The main provisions of the agreement are: i) Special treatment clause; ii) Confirmation of ships and seafarers certificates; and iii) Bilateral consultation mechanism to strengthen cooperation. Malaysia has concluded a total of 12 agreements of bilateral shipping as indicated

81
of Malaysia. Act 1955 [Act 140] Port Authorities Act 1963 [Act 488] Bintulu Port Authority Act 1981 [Act 243] Privatization Port Act 1990 [Act 422] Langkawi International Yacht Registry Act 2003 [Act 630] Government Gazette Gazette On The Exemption Of Foreign Cruise Vessels From The Domestic Shipping License Requirement
below: Malaysia has ratified several International Conventions adopted by the International Maritime Organization (IMO). The International Convention are as follows: 1971: International Convention on Load Lines (LL) 1966 1971: Convention on the International Maritime Organization 1948 1980: Convention on the International Regulations for Preventing Collisions at Sea (COLREG) 1972, as amended 1984: International Convention for the Safety of Life at Sea (SOLAS) 1974, as amended 1984: Protocol of 1978 relating to the International Convention for the Safety of Life at Sea 1974, as amended 1984: International Convention on Tonnage Measurement of Ships (Tonnage) 1969 1986: Convention on the International Mobile Satellite Organization (INMARSAT) 1976, as amended 1986: Convention on the International Mobile Satellite Organization (INMARSAT) 1976, as amended 1971 Convention on the International Maritime Organization 1948 1986: Operating Agreement on the International Mobile Satellite Organization 1976, as amended 1992: International Convention on Standards of Training, Certification and Watchkeeping for Seafarers (STCW) 1978, as amended 1997: Protocol of 1978 relating to the International Convention for the Prevention of Pollution from Ships (MARPOL) 1973, as amended (Annexes I and II) 1997: Protocol of 1978 relating to the International Convention for the Prevention of Pollution from Ships (MARPOL) 1973, as amended (Annexes V) 1997: International Convention on Oil Pollution Preparedness, Response and Co-operation (OPRC) 1990 2004: Amendments Adopted in November 1991 to the Convention of the International Maritime Organization (Institutionalization of the Facilitation Committee) 2005: International Convention on Civil Liability for Oil Pollution Damage (CLC) 1992 2005: International Convention on the Establishment of an International Fund for

82
Compensation for Oil Pollution Damage (FUND) 1992 2009: The International Convention on Civil Liability for Bunker Oil Pollution Damage, 2001 (Bunkers Convention 2001) 2009: The International Convention for the Limitation of Liability for Maritime Claims, 1976 as Amended by Protocol of 1996 (LLMC Convention 1996) 1978: International Convention on the Establishment of an International Fund for Compensation for Oil Pollution Damage (FUND) 1992: MARPOL 73/78, Annex III: Regulations for the Prevention of Pollution by Harmful Substances Carried by Sea in Packaged Form 2003: MARPOL 73/78, Annex IV: Regulations for the Prevention of Pollution by Sewage from Ships 2005: MARPOL 73/78, Annex VI: Regulations for the Prevention of Air Pollution from Ships. 2008: MARPOL 73/78, Annex VI: Regulations for the Prevention of Air Pollution from Ships. (Yet to Enter Into Force): The Control and Management of Ship’s Ballast Water 2004

83
Appendix 5: Existing policies and measures on transport
Category
Policy / measure
Implementation
period
Lead organisati
on(s) Description Status Assessment/remarks
AS
I (G
)*
Pas
sen
ger
/
Fre
igh
t
Typ
e o
f p
oli
cy
inst
rum
ent*
*
G F I Certification system for low-carbon companies
August 2013
Ministry of Natural Resources and Environment (NRE) United Nation Development Programme (UNDP)
NRE and UNDP Malaysia initiated a 2-year programme for a National Corporate Greenhouse Gas (GHG) Reporting Programme for Malaysia (MY Carbon) in collaboration with
Bursa Malaysia10. National Corporate GHG Reporting Programme for Malaysia MY Carbon (Voluntary carbon reduction programme)
On-going In Dec 2014, more than 20 companies have submitted their reports and nearly 100 participants
have benefitted from the training11.As a voluntary participation programme, support from industry is slow.
G P/F
I Emissions monitoring system
PUSPAKOM/JPJ
Commercial and public vehicles are required to go through routine inspection for permit (inspection disk) renew. Emission test is one of the procedures during inspection. Vehicle will be tested under Free Acceleration Test and the emission have to below certain level
Partially implemented
Emission test only perform under free acceleration test and not loaded test, therefor the test result did not reflect on road performance.
G P/F
E CO2-based fuel pricing / taxation
Ministry of International Trade and Industry
The National Automatic Policy 201412 envisions Malaysia as regional automotive hub in Energy Efficient Vehicle (EEV). As Malaysia is using the Euro 2M fuel quality standard, the
Not Implemented The fuel quality shall be upgraded in phases:
Euro 4M RON 97 petrol: September 2015
Euro 4M RON 95 petrol: October 2018
10 http://www.mycarbon.gov.my/web/index.php 11 http://www.my.undp.org/content/malaysia/en/home/presscenter/speeches/2014/12/04/special-remarks-at-the-mycarbon-awards-ceremony-2014/ 12 http://www.maa.org.my/pdf/NAP_2014_policy.pdf

84
Category
Policy / measure
Implementation
period
Lead organisati
on(s) Description Status Assessment/remarks
AS
I (G
)*
Pas
sen
ger
/
Fre
igh
t
Typ
e o
f p
oli
cy
inst
rum
ent*
*
systems (MITI) implementation of EEV will only be based on fuel consumption specification. Carbon emission will only be used once the EURO 4M fuel quality standard is introduced.
* Sulphur content reduced to 50 ppm * Delayed from initial 2012 plan due to large
investments in upgrading infrastructure
standards13 * Challenges in pricing for Euro 4M petrol * Euro 3 emission standards for motorcycle will
be implemented14 * Emission standard Euro 1 to Euro 2 in 2015 for diesel driven engine.
G P/F
E Fuel subsidy reduction
1 December 2014
Ministry of Finance Ministry of Domestic Trade, Cooperatives and Consumerism
Government removed the subsidies for RON95 petrol and
diesel15. Retail prices will be fixed according to a managed float similar to the Automatic Pricing Mechanism (APM) for RON97 petrol price if the global oil prices stay at below US$80 a
barrel 16 . Sulphur content of the fuel will be reduced from 500ppm to 50ppm
Implemented At above US$80 a barrel, targeted subsidy rationalisation to be implemented i.e. multi-tiered fuel subsidy scheme based on household income levels, different quota limits scheme, sales tax or further financial assistance to households through the 1Malaysia People’s Aid (BR1M) program, etc. This might see possible introduction in mid-2015 if the fuel price increase.
A P/F
E Road pricing 18 November 2014
Ministry of Works
Road pricing in Malaysia is means of financing road infrastructure project, but not as congestion charging measure. However, Kuala Lumpur City Hall is planning to impose road pricing or congestion charges for private vehicles on 2017 in the capital’s business district.
Implemented The compensation based on a formula stipulated in the concession agreement and the actual amount would only be decided after the process of traffic verification by the Malaysian Highway Authority. Government pays RM 558 M in compensation to highway concessionaires following its plan not to
raise toll rates at 20 highways in year 201517. For congestion pricing, KL city mayor Amin Nordin Abdul Aziz state that, congestion pricing may implement after the completion of Mass Rapid Transit Line 1. To made the use of public transport in capital more enticing.
13 http://paultan.org/2014/11/17/malaysia-get-euro-4-petrol-next-year-euro-5-diesel-delayed-2020-says-mustapa-mohamed 14 http://www.uncrd.or.jp/content/documents/24608EST-Country-Report_Malaysia_ppt.pdf 15 http://www.thestar.com.my/News/Nation/2014/11/21/no-more-petrol-subsidy-dec-1/ 16 http://dealer.affinhwang.com/Archive-CompanyFocus/Affin%20Research/6.%20Economy/201411%20NOV/Economy%20Fuel%20Subsidy%2020141124%20AffinHwang.pdf 17 http://www.themalaysianinsider.com/malaysia/article/concessionaires-to-be-paid-rm558-million-for-toll-hike-delay-bernama

85
Category
Policy / measure
Implementation
period
Lead organisati
on(s) Description Status Assessment/remarks
AS
I (G
)*
Pas
sen
ger
/
Fre
igh
t
Typ
e o
f p
oli
cy
inst
rum
ent*
*
A P/F
P Integrated land-use planning
2014 & 2015
Federal Department Of Town And Country Planning Malaysia, Ministry Of Urban Wellbeing, Housing And Local Government
National Physical Plan (NPP)18,19
- Implementing an integrated national land use and transport system.
- A national integrated high-speed rail system. - The national road network shall be further extended
for regional travel and for local access.
On-going Future Cities Initiative: Focuses on encouraging people to use public transport for commuting in city areas.
A P P/E TOD/ compact development/mixed-use planning
- TCPD MFT SA LA
TOD, compact development and mixed-use planning are among the main thrusts of the Malaysian government as stated in the Tenth Malaysia Plan 20 , the National Urbanization Policy 21 , National Physical Plan 22 and National Land Public Transport Masterplan23. State and local authorities are encouraged to emphasise this in their respective Structural and Local Plans24.
Implementation on-going
TOD concept is introduced in KL Central, residential areas near transit nodes in Subang Jaya, public housing near Sentul, Mid Valley, while mixed-use planning is being applied at service apartments in KL, PJ, Subang Jaya. High-density development 25
A P E/P Parking pricing and management
Currently, the parking fee is set by private parking companies or city/local councils. Few shopping and business offices subsidies parking fee to their customers (some with minimum spending at their stores).
Not intended in the near future
This measure is not applied in Malaysia.
A P C Telecommu - - - Not in discussion -
18 http://www.epu.gov.my/documents/10124/667951ff-f114-4f66-9777-ac948ef73299 19 http://www.uncrd.or.jp/content/documents/24608EST-Country-Report_Malaysia_ppt.pdf 20 http://www.epu.gov.my/epu-theme/RMKE10/img/pdf/en/chapt6.pdf (Chapter 6) 21 http://www.kpkt.gov.my/kpkt_2013/fileupload/dasar/DPN_BI.pdf (page 70 for compact development, and page76 for TOD) 22 http://www.epu.gov.my/documents/10124/667951ff-f114-4f66-9777-ac948ef73299 23 http://www.spad.gov.my/sites/default/files/national-land-public-transport-master-plan-final-draft.pdf 24 http://www.epu.gov.my/epu-theme/RMKE10/img/pdf/en/chapt6.pdf (Chapter 6) 25 http://www.epu.gov.my/c/document_library/get_file?uuid=280f12a1-a3f7-4014-9eec-3bf4860c7687&groupId=283545

86
Category
Policy / measure
Implementation
period
Lead organisati
on(s) Description Status Assessment/remarks
AS
I (G
)*
Pas
sen
ger
/
Fre
igh
t
Typ
e o
f p
oli
cy
inst
rum
ent*
*
nication promotion
S P P/Infra
Bike-sharing - City Council of Penang Island (MPPP)
A contract to design, install, operate and maintain a bike-sharing system in George Town, Penang, has been awarded in 2014. It will be in operation in May 2015 and the whole system will be fully complete by 2017.
Pilot in Penang The system will see at least 25 bike stations set up across George Town, with 1,000 bicycle docks and 500 bicycles.26
S P Infra Cycling infrastructure
2012 City Council of Penang Island 27
Penang Bicycle Lane Masterplan, launched in 2012, is an initiative of the state to become a bike state.28 The state government of Penang mandated that new housing projects be equipped with bike lanes.29 Kuala Lumpur city council has planned cycling infrastructure in Kuala Lumpur to promote healthy life style and last-mile transportation. The proposal was announced during 2013 and infrastructure will be located in the populated area connected with nearby rapid transit system
Piloted in Kuala Lumpur and Penang
For instance, there is an improvement of existing cycling path in Putrajaya involving 22.8km in length to connect the city centre with residential areas as a pilot project. In year 2014, Penang state has launch for completion of a RM 30 M coastal bicycle route that stretches 12.5km as first phase of Penang Bicycle Route Master Plan Kuala Lumpur has opened to the public its first dedicated bicycle path, a 5.5km stretch from Mid Valley to Dataran Merdeka, in April 2015.30
S P Infra Walking
infrastructure
- Ministry of Housing and Local Government 31
Moving people via public transport, supported by pedestrian-friendly streets and transit-oriented developments are covered in the Tenth Malaysia Plan 2011-2015, National Physical Plan-2 (with emphasis on interconnectivity between developments and rail stations).
Varies in level of implementation
A fully air conditioned pedestrian walkway at KLCC (Kuala Lumpur City Centre) has open to public since 2012. The elevated walkway is 1.173km stretch which links the KLCC area to Bukit Bintang area. Various walkways have been included in Kuala Lumpur MRT project as passenger last
26 http://www.themalaymailonline.com/malaysia/article/penang-kicks-off-ambitious-transport-revolution-with-rm9.2m-bike-sharing-sy 27 City Council of Penang Island. http://www.mbpp.gov.my/en/web/guest/home 28 http://www.freemalaysiatoday.com/category/nation/2014/10/31/rm30-million-spent-on-12km-bicycle-route-in-penang/ 29 http://www.thesundaily.my/news/220582 . Laluan Basikal di Pulau Pinang. http://www.mppp.gov.my/png_mpp-theme/pdf/LALUANBASIKAL_905.pdf 30 http://paultan.org/2015/04/15/kuala-lumpur-opens-first-bicycle-path-for-public-use/ 31 Ministry of Housing and Local Government. http://www.kpkt.gov.my/kpkt_2013/fileupload/dasar/NPP.pdf
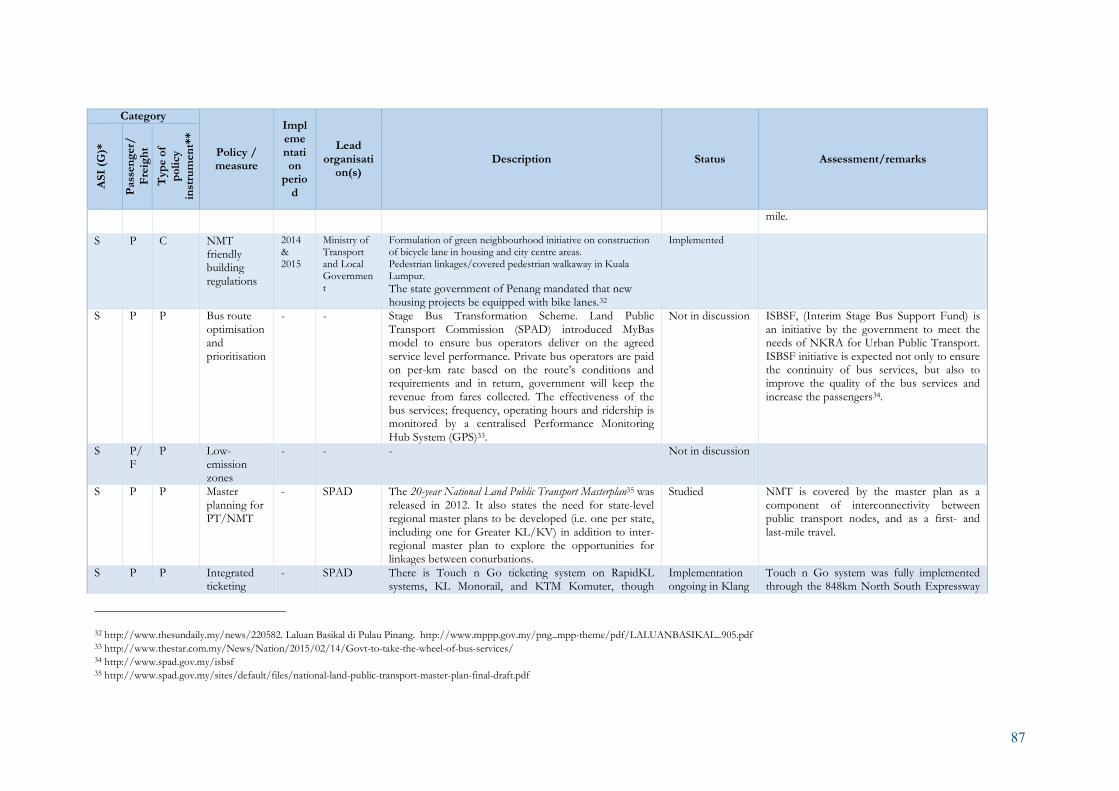
87
Category
Policy / measure
Implementation
period
Lead organisati
on(s) Description Status Assessment/remarks
AS
I (G
)*
Pas
sen
ger
/
Fre
igh
t
Typ
e o
f p
oli
cy
inst
rum
ent*
*
mile.
S P C NMT friendly building regulations
2014 & 2015
Ministry of Transport and Local Government
Formulation of green neighbourhood initiative on construction of bicycle lane in housing and city centre areas. Pedestrian linkages/covered pedestrian walkaway in Kuala Lumpur. The state government of Penang mandated that new housing projects be equipped with bike lanes.32
Implemented
S P P Bus route optimisation and prioritisation
- - Stage Bus Transformation Scheme. Land Public Transport Commission (SPAD) introduced MyBas model to ensure bus operators deliver on the agreed service level performance. Private bus operators are paid on per-km rate based on the route’s conditions and requirements and in return, government will keep the revenue from fares collected. The effectiveness of the bus services; frequency, operating hours and ridership is monitored by a centralised Performance Monitoring Hub System (GPS)33.
Not in discussion ISBSF, (Interim Stage Bus Support Fund) is an initiative by the government to meet the needs of NKRA for Urban Public Transport. ISBSF initiative is expected not only to ensure the continuity of bus services, but also to improve the quality of the bus services and increase the passengers34.
S P/F
P Low-emission zones
- - - Not in discussion
S P P Master planning for PT/NMT
- SPAD The 20-year National Land Public Transport Masterplan35 was released in 2012. It also states the need for state-level regional master plans to be developed (i.e. one per state, including one for Greater KL/KV) in addition to inter-regional master plan to explore the opportunities for linkages between conurbations.
Studied NMT is covered by the master plan as a component of interconnectivity between public transport nodes, and as a first- and last-mile travel.
S P P Integrated ticketing
- SPAD There is Touch n Go ticketing system on RapidKL systems, KL Monorail, and KTM Komuter, though
Implementation ongoing in Klang
Touch n Go system was fully implemented through the 848km North South Expressway
32 http://www.thesundaily.my/news/220582. Laluan Basikal di Pulau Pinang. http://www.mppp.gov.my/png_mpp-theme/pdf/LALUANBASIKAL_905.pdf 33 http://www.thestar.com.my/News/Nation/2015/02/14/Govt-to-take-the-wheel-of-bus-services/ 34 http://www.spad.gov.my/isbsf 35 http://www.spad.gov.my/sites/default/files/national-land-public-transport-master-plan-final-draft.pdf

88
Category
Policy / measure
Implementation
period
Lead organisati
on(s) Description Status Assessment/remarks
AS
I (G
)*
Pas
sen
ger
/
Fre
igh
t
Typ
e o
f p
oli
cy
inst
rum
ent*
*
Touch n Go cards are mainly used for toll expressways and highways. Public transport in Malaysia is run by different operators, but SPAD is working toward a single cashless ticket for both buses and trains36. An integrated smart ticketing system is among the action plans mentioned in National Land Public Transport Master plan.
Valley; planned for integration with other modes.
on 15 November 1998. Made it one of the world’s longest single stretches if expressway to have electronic toll payment system, from Kempas in Johor to Jitra in Kedah. Touch n Go was first implemented on stage bus service in 2000 in Klang Valley and later on Rapid KL in 2011 as an initiative to meet Urban Public Transport NKRA.
S P Infra Non-urban rail improvements
September 2015
SPAD
The National Land Public Transport Master plan emphasised the need for better interconnectivity between rural growth centres37. Buses remain to be the primary mode of transport outside the cities.
Intended Beside commuter service in Kuala Lumpur, a new northern KTM Komuter service (Komuter Utara) run from Gurun to Kamuting on 11th Sep 2015 and following by 2nd commuter rail service in north Malaysia, which run from Butterworth, Penang to Padang Besar, Perlis, starting on 1st January 2016.
S P Infra Urban PT infrastructure
SPAD; Under purview of the Prime Minister
The Greater KL/Klang Valley Land Public Transport Master Plan is supported by six Subsidiary Plans: Urban Rail Development Plan for development of urban rail services and future corridors in the GKL/KV region, Bus Transformation Plan and Taxi Transformation Plan, Interchange & Integration Plan to link the modes for first and last mile and reduce barriers of using public transport, and Land Use Plan and Travel Demand Management Plan identify measures to assist the development of public transport in the Region38.
Implementation ongoing
Urban rail journey is significantly longer than private cars. Reason identified is in-frequent and long route length of feeder buses and also the wide spread of housing areas. Among proposals is to introduce Tuk Tuk service promote non-motorised transport, vehicles with improved efficiency 39
S P E Regulatory and physical restrictions
- - - Not in discussion
36 http://www.thestar.com.my/Lifestyle/Features/2014/01/20/Integration-is-the-key-to-public-transport/ 38 http://www.spad.gov.my/projects/national-master-plan/draft-greater-klklang-valley 39 http://www.thesundaily.my/news/1294889
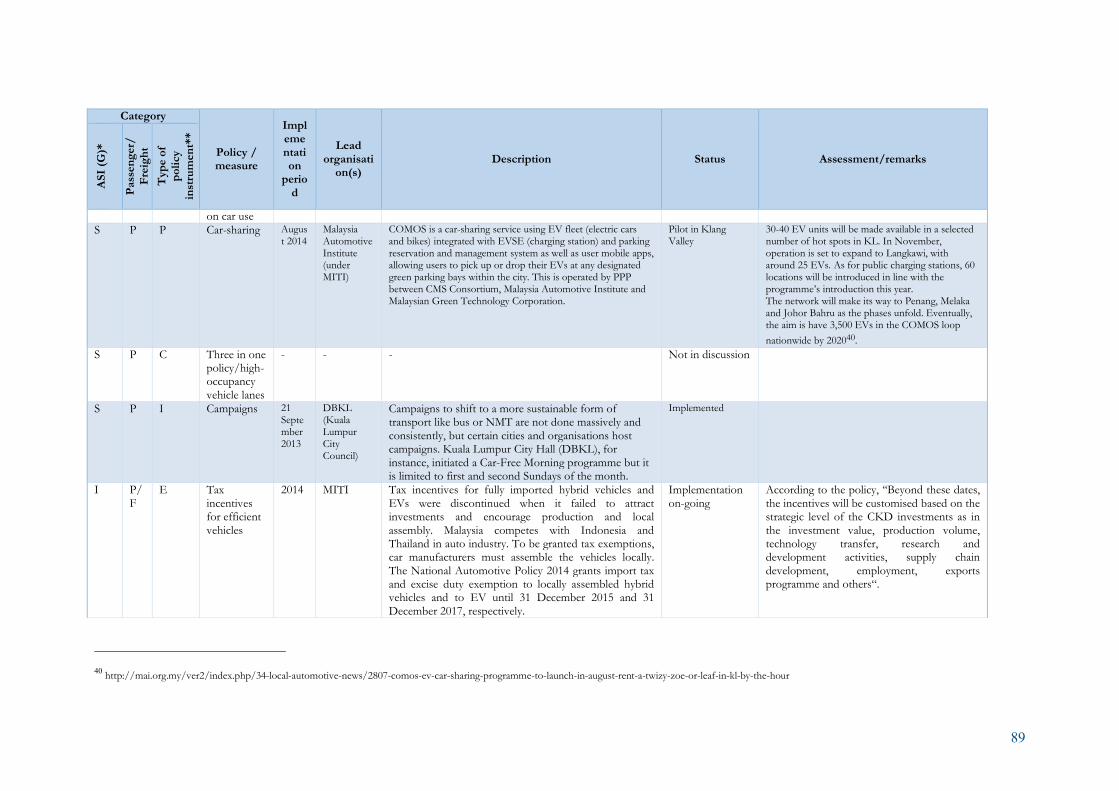
89
Category
Policy / measure
Implementation
period
Lead organisati
on(s) Description Status Assessment/remarks
AS
I (G
)*
Pas
sen
ger
/
Fre
igh
t
Typ
e o
f p
oli
cy
inst
rum
ent*
*
on car use S P P Car-sharing Augus
t 2014 Malaysia Automotive Institute (under MITI)
COMOS is a car-sharing service using EV fleet (electric cars and bikes) integrated with EVSE (charging station) and parking reservation and management system as well as user mobile apps, allowing users to pick up or drop their EVs at any designated green parking bays within the city. This is operated by PPP between CMS Consortium, Malaysia Automotive Institute and Malaysian Green Technology Corporation.
Pilot in Klang Valley
30-40 EV units will be made available in a selected number of hot spots in KL. In November, operation is set to expand to Langkawi, with around 25 EVs. As for public charging stations, 60 locations will be introduced in line with the programme’s introduction this year. The network will make its way to Penang, Melaka and Johor Bahru as the phases unfold. Eventually, the aim is have 3,500 EVs in the COMOS loop
nationwide by 202040.
S P C Three in one policy/high-occupancy vehicle lanes
- - - Not in discussion
S P I Campaigns 21 September 2013
DBKL (Kuala Lumpur City Council)
Campaigns to shift to a more sustainable form of transport like bus or NMT are not done massively and consistently, but certain cities and organisations host campaigns. Kuala Lumpur City Hall (DBKL), for instance, initiated a Car-Free Morning programme but it is limited to first and second Sundays of the month.
Implemented
I P/F
E Tax incentives for efficient vehicles
2014 MITI Tax incentives for fully imported hybrid vehicles and EVs were discontinued when it failed to attract investments and encourage production and local assembly. Malaysia competes with Indonesia and Thailand in auto industry. To be granted tax exemptions, car manufacturers must assemble the vehicles locally. The National Automotive Policy 2014 grants import tax and excise duty exemption to locally assembled hybrid vehicles and to EV until 31 December 2015 and 31 December 2017, respectively.
Implementation on-going
According to the policy, ‘‘Beyond these dates, the incentives will be customised based on the strategic level of the CKD investments as in the investment value, production volume, technology transfer, research and development activities, supply chain development, employment, exports programme and others“.
40 http://mai.org.my/ver2/index.php/34-local-automotive-news/2807-comos-ev-car-sharing-programme-to-launch-in-august-rent-a-twizy-zoe-or-leaf-in-kl-by-the-hour

90
Category
Policy / measure
Implementation
period
Lead organisati
on(s) Description Status Assessment/remarks
AS
I (G
)*
Pas
sen
ger
/
Fre
igh
t
Typ
e o
f p
oli
cy
inst
rum
ent*
*
I P/F
E
Fuel economy/ Fuel efficiency standard
MITI/ MAI/ JPJ
Fuels currently comply with Euro 2 standards. There were plans to make Euro 4 diesel available in Malaysia by June 2015 but
was postponed to 201841. Fuel consumption and emission information for every vehicle modal in Malaysia are tested and recorded by JPJ under the Vehicle Type Approval (VTA) system
Implementation on-going
I P/F
I/Infra
Intelligent transport systems
2015 SPAD Integrated Transport Information System was completed in 2005. It monitors traffic flow and it is operated by Kuala Lumpur City Hall, disseminating information via variable-
message signs,42 Performance Monitoring Hub System will be introduced to monitor performance of all bus operators in city centre by
installation of GPS unit on board and control centre43. GPS-
based centralised taxi service system (CTSS)44 was also developed to direct the taxi driver to the closest waiting passenger, rather than have people call for a ride. Real-time traffic information, meanwhile, is provided to highway users through the Traffic Monitoring Centre developed by PLUS Expressways Berhad. The centre will also manage the ITS equipment like the Variable Message Sign and Automatic
Vehicle Detection System. 45 46
Implementation on-going
Introduced to improve the frequency of public transport system in Malaysia.
I P I Real-time public transport information
SPAD MyRapid Journey Planner is a tool that allows commuters to view bus/rail routes, fares and interchanges within Klang Valley. Passenger Information system (PIS) was used in both rail public transport system and bus. The system included LED Panel
Implementation on-going in Klang Valley.
Syarikat Prasarana Nasional Bhd has setting up a Fleet Tracking System on 2012 for RapidKL’s bus, including 59 LED. Installed at major transit hub in Klang Valley
41 http://www.thestar.com.my/News/Nation/2014/05/03/Stop-postponing-Euro-Standard-4-Petroleum-firms-should-offer-higher-grade-diesel-without-delay-say-l/ http://paultan.org/2014/11/17/malaysia-get-euro-4-petrol-next-year-euro-5-diesel-delayed-2020-says-mustapa-mohamed/#ixzz3VYyENiXV 42 http://www.apec-tptwg.org.cn/new/Archives/tpt-wg39/Intermodal/IIEG/07.%207-Economy%20Report-Implementation%20of%20ITS%20in%20Malaysia.pdf 43 http://www.themalaymailonline.com/malaysia/article/spad-to-moot-contract-system-for-stage-buses-in-transport-overhaul 44 http://www.spad.gov.my/sites/default/files/04_-_ctss_tender_briefing_deck_v1.0_0.pdf 45 http://www.traffictechnologytoday.com/news.php?NewsID=11834 46 http://www.spad.gov.my/journeyplanner

91
Category
Policy / measure
Implementation
period
Lead organisati
on(s) Description Status Assessment/remarks
AS
I (G
)*
Pas
sen
ger
/
Fre
igh
t
Typ
e o
f p
oli
cy
inst
rum
ent*
*
displaying estimation time of arrivals for next ride. I P/
F I Traffic flow
improvement and traffic information
2008 in Subang
Private sector
For highway users, a USD 15M Traffic Monitoring Centre was opened by one of the largest Malaysian toll road operators, PLUS Expressways Berhad. The centre disseminates traffic information to users through radio stations, electronic message boards (VMS), the PLUSLine and the PLUSTrafik Twitter service47.
I P/F
C Speed limits Road Transport Department48, Royal Malaysia Police49
National Speed Limit Order 1989 indicates that the default is 110km/h on intercity highways, 90km/h on federal and state roads, but may be reduced in town areas50 For trucks, an 80-90 km/hr speed limit is imposed on expressways, while 70-80 km/hr is imposed on federal and state roads, and 60 km/hr in urban areas.
I P/F
I Eco-driving - - While there seems to be no mandates on eco-driving programmes, the government collaborates with the private sector to raise awareness on fuel-efficient driving methods.
Not in discussion Malaysian-German Chamber of Commerce & Industry (MGCC) and TÜV Rheinland Malaysia Sdn. Bhd., in cooperation with GIZ, are running a 2-year project on Road Safety and Eco-Driving for Malaysian Logistic and Transportation Sector
(2014-2015). This is a PPP project. 51 Those organised solely by the private sector include Honda Safety Driving Course as well as Eco-driving Techniques Course for Honda Customers52,
I P/F
C Inspection and maintenance
20 January 2014
MITI, Malaysia Automotive
In Malaysia, all commercial and public vehicles are mandatory
for inspection53 but not required for private vehicles. However, NAP 2014 seeks to introduce Voluntary Vehicle Inspection
Implementation on-going
VVI is offered by PUSPAKOM Inspection
Centres 55 . PUSPAKOM’s concession agreement (i.e. exclusive rights for commercial and public
47 http://www.plus.com.my/index.php?option=com_content&view=article&id=90&Itemid=114 48 http://www.jpj.gov.my/web/eng/kejara 49 http://www.rmp.gov.my/faq ---I see Laser Speed Detector. Please confirm. One of the police’s mandates is also to assist MOT. Also, POL 170A is a notice issued for offenses committed by vehicles 50 http://www.theborneopost.com/2015/03/20/no-plans-to-increase-speed-limit-on-highways/#ixzz3VT5TZ1F2 , http://www.who.int/violence_injury_prevention/road_safety_status/2009/laws/speed_malaysia.pdf 51 http://www.malaysia.ahk.de/fileadmin/ahk_malaysia/CR_Competence_Ctr/Road_Safety/Road_Safety_E_Flyer_20141211.pdf 52 http://www.honda.com.my/microsite/eco_safety/ 53 Road Transport Act 1987; http://www.agc.gov.my/Akta/Vol.%207/Act%20333.pdf

92
Category
Policy / measure
Implementation
period
Lead organisati
on(s) Description Status Assessment/remarks
AS
I (G
)*
Pas
sen
ger
/
Fre
igh
t
Typ
e o
f p
oli
cy
inst
rum
ent*
*
Institute (MAI)
programme through an annual vehicle inspection for passenger vehicles aged 5 years and above to ensure roadworthiness of
vehicles and compliance to Road Transport Act 198754.
vehicle inspection) is valid until 2024 56 . The monopoly is causing allegations of corruption and
underperformance57. Other improvement strategies includes introduction of international standard for inspection and increased smoke inspection standards by the Department of Environment (DOE) to meet with the requirement of UNR83
For Emission58
I P/F
E/C Vehicle scrapping/fleet replacement
- - The government prioritises the roadworthiness of the vehicles over the age of the vehicles.59 An end-of-life vehicle policy (12-year limit on cars) was proposed but was eventually not included in the NAP 2014 due to public opposition.60
Intended The policy regarding End-of-Life Vehicle (ELV) is under development by MAI
I P/F
E Incentives for low-carbon fuel ( 1st/2nd gen Biofuel, CNG, LPC)
MPIC Malaysia launched National Biofuel Policy in 2006; low-interest loan and grants for research and development and demonstration projects were granted but there is no direct incentive for usage of biofuels.
On-going The biofuel industry benefits from incentives offered by Promotion of Investments Act 1986, and biodiesel projects are eligible to be considered for Pioneer Status or Investment Tax Allowance,61 but actual incentives like tax exemption are difficult to assess.62 As in year 2014, government of Malaysia subsidised RM0.50 per litre of CNG, which reduced the rental price to RM1.05 per litre.
55 http://www.puspakom.com.my/en/inspections-a-services/types-of-inspection/voluntary-inspection.html 54 http://www.maa.org.my/pdf/NAP_2014_policy.pdf 56 http://www.freemalaysiatoday.com/category/highlight/2014/11/08/end-puspakoms-monopoly-on-commercial-vehicle-inspection/ 57 http://www.freemalaysiatoday.com/category/highlight/2014/11/08/end-puspakoms-monopoly-on-commercial-vehicle-inspection/ 58 http://www.uncrd.or.jp/content/documents/24608EST-Country-Report_Malaysia_ppt.pdf 59 http://paultan.org/2014/01/21/nap-2014-voluntary-vehicle-inspection/ 60 http://paultan.org/2015/01/30/vehicle-end-of-life-policy-public-not-ready/ 61 http://www.biomass-asia-workshop.jp/biomassws/04workshop/presentation_files/05_Lunjew.pdf 62 http://www.iisd.org/gsi/sites/default/files/final_malaysia_2.pdf

93
Category
Policy / measure
Implementation
period
Lead organisati
on(s) Description Status Assessment/remarks
AS
I (G
)*
Pas
sen
ger
/
Fre
igh
t
Typ
e o
f p
oli
cy
inst
rum
ent*
*
Beside exempted from import duty and sales tax for NGV conversion kits, NGV was given reduction on road tax, 50% reduction of road tax for monogas vehicle, 25% for bi-fuel (petrol and natural gas) vehicle
I P E CNG/LPG for taxis and buses
- CNG is predominantly confined to taxis in Klang Valley and Penang. PETRONAS, Malaysia’s state-owned oil enterprise, has a monopoly on CNG sector.
Implementation on-going
Up to 2013, there are 37,000 taxies in capital Kuala Lumpur use natural gas
A F P Empty hauling reduction
- Transport4u, a private company has taking initiative on providing online ‘stock exchange’ and load matching service to reduce empty hauling63.
Piloted
A F P Improve logistics centres and their location
MITI The logistics sector is identified as a key sector in the Third Industrial Master Plan 2006-202064 which recognises the need for strategic logistics centres at the border areas as well as in areas around Ipoh in Perak, Northern Johor-Melaka and the East Coast of Peninsular Malaysia. It placed emphasis on the development of rail and freight distribution centres, and distribution parks near major seaports and airports or in inland industrial locations. Infrastructure development was recognise as important strategic in Logistics and Trade Facilitation Masterplan (2015-2020), improve last mile connectivity to Port Klang, address bottlenecks at Padang Besar Terminal and creating integrated hub and spoke model are among the key action items in masterplan
Implementation on-going
S F E Lorry restrictions
15th May 2010
SPAD/ JPJ
Vehicle weighing 10,000 kg and above are banned from North-South Expressway between 6.30 am and 9.30 am on weekdays since 15th May 2010. However, this restriction is means to reduce rush hour congestion.
Implemented Lorry restriction in this discussion is mean for reduce congestion
63 http://www.transport4u.my/ 64 http://www.miti.gov.my/cms/documentstorage/com.tms.cms.document.Document_879bae59-c0a81573-1bef1bef-926c5327/chapter14_25.pdf

94
Category
Policy / measure
Implementation
period
Lead organisati
on(s) Description Status Assessment/remarks
AS
I (G
)*
Pas
sen
ger
/
Fre
igh
t
Typ
e o
f p
oli
cy
inst
rum
ent*
*
S P/F
Infra High-speed rail infrastructure
Estimated at 2022
SPAD The Kuala Lumpur – Singapore High Speed Rail (HSR) project was announced by Malaysia Prime Minister Najibin September 2010 and it is proposed to connect Kuala Lumpur and Johor Bahru and Singapure. The construction will be monitored by SPAD, the commencement of work to be in 2017 and completion in 2022. The construction cost will be RM43 billion6566
Intended The estimated length of Kuala Lumpur – Singapore HSR is 375km and the travel time will be 90 minutes
S F P Master planning for rail and water / Logistic planning
MITI The logistics sector is identified as a key sector in the Third Industrial Master Plan 2006-2020 67 and the Tenth Malaysia Plan. Rail freight transportation
Implementation on-going
S F E Rail incentives
- - Not in discussion
S F E NMT freight incentives
- - Not in discussion
S F Infra Multimodal facilities/dry ports
Multimodal transport network is among the action plans stated in the Tenth Malaysia Plan. Investments are made to build roads and rails that lead to key ports and airports.
Implementation on-going
S F I “Branding” campaigns
- - Not in discussion
I F E CO2 based vehicle taxation/registration fees
- Malaysia vehicle taxation was based on vehicle type and engine capacity. However, government officers showing intension on setting up CO2 base taxation mechanism during internal meeting in stocktaking report preparation
Not in discussion
I F C Tyre standards
JPJ Enforcement of tyre standard is based on Malaysian Standard (MS), UN regulations.
Implemented
65 http://www.railway-technology.com/projects/kuala-lumpur-singapore-high-speed-rail/ 66 http://www.myhsr.com.my/ 67 http://www.miti.gov.my/cms/documentstorage/com.tms.cms.document.Document_879bae59-c0a81573-1bef1bef-926c5327/chapter14_25.pdf

95
Category
Policy / measure
Implementation
period
Lead organisati
on(s) Description Status Assessment/remarks
AS
I (G
)*
Pas
sen
ger
/
Fre
igh
t
Typ
e o
f p
oli
cy
inst
rum
ent*
*
I F C Aerodynamic standards
- - Not in discussion
I F I Driving information
- - Not in discussion
96
Items from named contributors do not necessarily reflect the views of the company/the editors. Published by: Deutsche Gesellschaft für Internationale Zusammenarbeit (GIZ) GmbH Registered offices: Bonn and Eschborn, Germany Lake Rajada Office Complex (16th floor) New Ratchadapisek Road, Klongtoey, 10110 Bangkok www.giz.de www.TransportAndClimateChange.org Authors: Dr Horizon Gitano Briggs, Leong Hau Kian Editors: Jeyashri Kisna, Julia Nagel, Kyra Hagge, Tali Trigg Version: 1.0 Picture credits / Sources: Norris (justnorris) available at https://www.flickr.com/photos/99790222@N08/15676585174 Maps: The geographical maps are for information purposes only and do not constitute recognition under international law of boundaries and territories. GIZ does not guarantee in any way the current status, accuracy or completeness of the maps. All liability for any loss or damage arising directly or indirectly out of their use is excluded. Printed and distributed by: Deutsche Gesellschaft für Internationale Zusammenarbeit (GIZ) GmbH Kuala Lumpur, Malaysia, November 2016

97
Deutsche Gesellschaft für Internationale Zusammenarbeit (GIZ) GmbH Registered offices Bonn und Eschborn, Germany Dag-Hammarskjöld-Weg 1-5 65760 Eschborn, Germany T +49 61 96 79-0 F +49 61 96 79-11 15 E [email protected] I www.giz.de