Embed Size (px)
Citation preview
MALAYSIA’S SEWERAGE & SANITATION SECTOR REGULATORY FRAMEWORK

PRESENTATION OUTLINE
■ TONE SETTING - SNAPSHOT IN A GLANCE
■ EVOLUTION OF REGULATORY LANDSCAPES
■ PRIVATE SECTOR PARTICIPATION
■ POTENTIAL TAKE AWAY POINTS

Description During Independence - 1957 Today - 2019
Population 7 million 32 million
Urban population 30% 75%
Improved sanitation 4.5% 96% (4% unimproved sanitation)
Population served by
connected services
5% 70%
Policy Makers Ministry of Health Ministry of Water, Land and Natural Resources
Regulatory Framework Fragmented Water and sewerage – 1 regulator
Sewerage Tariff No tariff (part of annual
assessment)
Monthly billing. Standardized tariff nationwide
Services Water – State owned departments
Sewerage – Local Authorities
Water – Private companies, state government
controlled private company, corporatized government
department
Sewerage – Private company, federal & state
government owned private companies & local authority
Beneficiaries Direct user Community & environment
Nos of regional STPs No regional STP 101 regional STPs
SNAPSHOT OF MALAYSIA’S WATER SERVICES
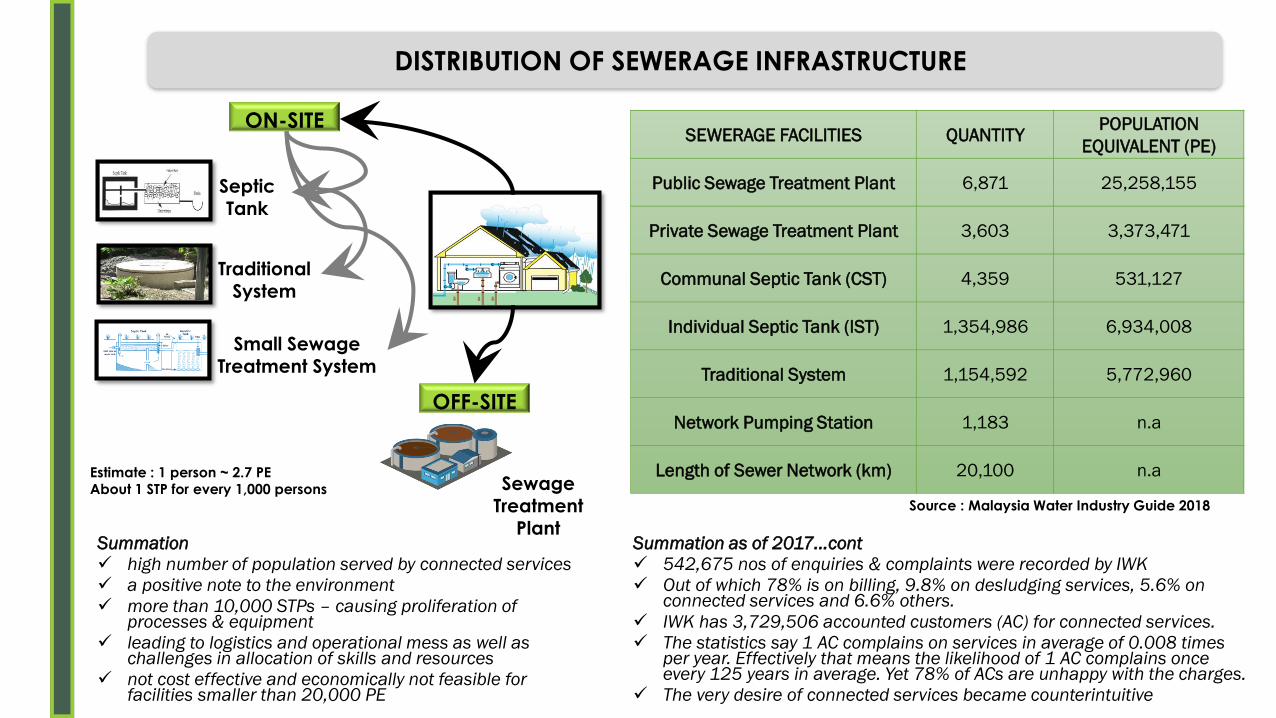
SEWERAGE FACILITIES QUANTITYPOPULATION
EQUIVALENT (PE)
Public Sewage Treatment Plant 6,871 25,258,155
Private Sewage Treatment Plant 3,603 3,373,471
Communal Septic Tank (CST) 4,359 531,127
Individual Septic Tank (IST) 1,354,986 6,934,008
Traditional System 1,154,592 5,772,960
Network Pumping Station 1,183 n.a
Length of Sewer Network (km) 20,100 n.a
Source : Malaysia Water Industry Guide 2018
DISTRIBUTION OF SEWERAGE INFRASTRUCTURE
OFF-SITE
ON-SITE
Sewage Treatment
Plant
Traditional System
Septic Tank
Small Sewage Treatment System
Estimate : 1 person ~ 2.7 PEAbout 1 STP for every 1,000 persons
Summation
✓ high number of population served by connected services
✓ a positive note to the environment
✓ more than 10,000 STPs – causing proliferation of processes & equipment
✓ leading to logistics and operational mess as well as challenges in allocation of skills and resources
✓ not cost effective and economically not feasible for facilities smaller than 20,000 PE
Summation as of 2017…cont
✓ 542,675 nos of enquiries & complaints were recorded by IWK
✓ Out of which 78% is on billing, 9.8% on desludging services, 5.6% on connected services and 6.6% others.
✓ IWK has 3,729,506 accounted customers (AC) for connected services.
✓ The statistics say 1 AC complains on services in average of 0.008 times per year. Effectively that means the likelihood of 1 AC complains once every 125 years in average. Yet 78% of ACs are unhappy with the charges.
✓ The very desire of connected services became counterintuitive

10
01
20
14
01
60
18
0
05
00
1,0
00
1,5
00
2007 2008 2009 2010 2011 2012 2013 2014 2015
Tota
l E
xpe
nd
itu
re/to
tal R
eve
nu
e (
%)
Tota
l E
xpe
nd
itu
re a
nd
Co
st
(RM
millio
n)
Total Revenue Total Expenditure % Total Expenditure/ Revenue
UNDER PRICING OF TARIFF
Summation
✓ Conversion of non mechanize facilities to mechanize systems to improve treatment efficiency
✓ 87.5 % are domestic accounts; 8.6% are commercial accounts; 3.8% are government facilities and 0.1% are industrial accounts
✓ Revenue from industrial AC break even the OPEX. While 87.5% domestic AC are cross subsidized by commercial and government AC as well as annual subsidy
PRESENTATION OUTLINE
■ TONE SETTING - SNAPSHOT IN A GLANCE
■ EVOLUTION OF REGULATORY LANDSCAPES
■ PRIVATE SECTOR PARTICIPATION
■ POTENTIAL TAKE AWAY POINTS

REGULATORY ENTITIES AND LEGISLATIVE TOOLS
Agencies Legal Instruments
National Water Services Commissions (SPAN)1. Water Services Industry Act (WSIA) 2006
2. Suruhanjaya Perkhidmatan Air Negara Act (SPAN Act) 2006
Department of Environment (JAS)1. Environmental Quality Act (EQA) 1974
2. Environmental Quality Regulations (Sewage) 2009
Department of Safety and Health (DOSH)1. Factories and Machinery Act (FMA) 1967
2. Occupational Safety and Health Act (OSHA) 1994
Construction Industry Development Board
(CIDB)1. Construction Industry Development Board Malaysia 1994
Ministry of Housing and Local Government 1. Street, Drainage and Building Act (SDBA) 1974 (model law)
Local Authorities (PBT) 1. Uniform Building By Laws
National Solid Waste Management
Department (JPSPN)
1. Solid Waste and Public Cleansing Management Act (SWPCMA)
2007

EVOLUTION - INSTITUTIONAL STRUCTURE
Upto 1993 1993 - 2006 2006 onwards
ControlFederal Constitution places sewerage sector under
states power
Federal Constitution places sewerage sector
under concurrent list. Hence the control of
sewerage services became the
responsibility of Federal Government
Federal Constitution places water services
under concurrent list. Hence the control of
water services became the responsibility of
Federal Government
Policy
MakerMinistry of Health
Ministry of Housing & Local Government and
later to Ministry of Energy, Water and
Communication
Ministry of Energy, Water and Communication
which later restructured to Minister of Energy,
Green Technology and Water and again
restructured to Minister of Water, Land and
Natural Resources
RegulatorAreas within local authority (LA) boundary by LA
Areas outside LA boundary by Ministry of HealthSewerage Services Department
National Water Services Commission for both
water and sewerage services
Capital
Funding
By state government, local councils and property
developers for area within LA
By property developers and federal government for
rural area
By Federal Government, concessionaire and
private developers for area within LA
By property developers and federal
government for rural area
By Federal Government, SPAN and private
developers. Ideally supposed
Operational
Funding
Through assessment fees and support from state
government and local councils
By federal government for rural area when required
Through sewerage tariff and federal
government subsidy
Through sewerage tariff and federal
government subsidy
Services
Areas within local authority (LA) boundary by LA
Areas outside LA boundary by Ministry of Health as
when required
Areas within local authority (LA) boundary by
IWK as concessionaire
Areas outside LA boundary by federal
government as when required
Areas within local authority (LA) boundary by
IWK as concessionaire (based on past regime)
New operators are licensed based on service
area which covers the whole state. No pockets
left unserved.
Objective of
Sewerage
Management
Protecting Public Health Protecting Water Resource Protecting Environment
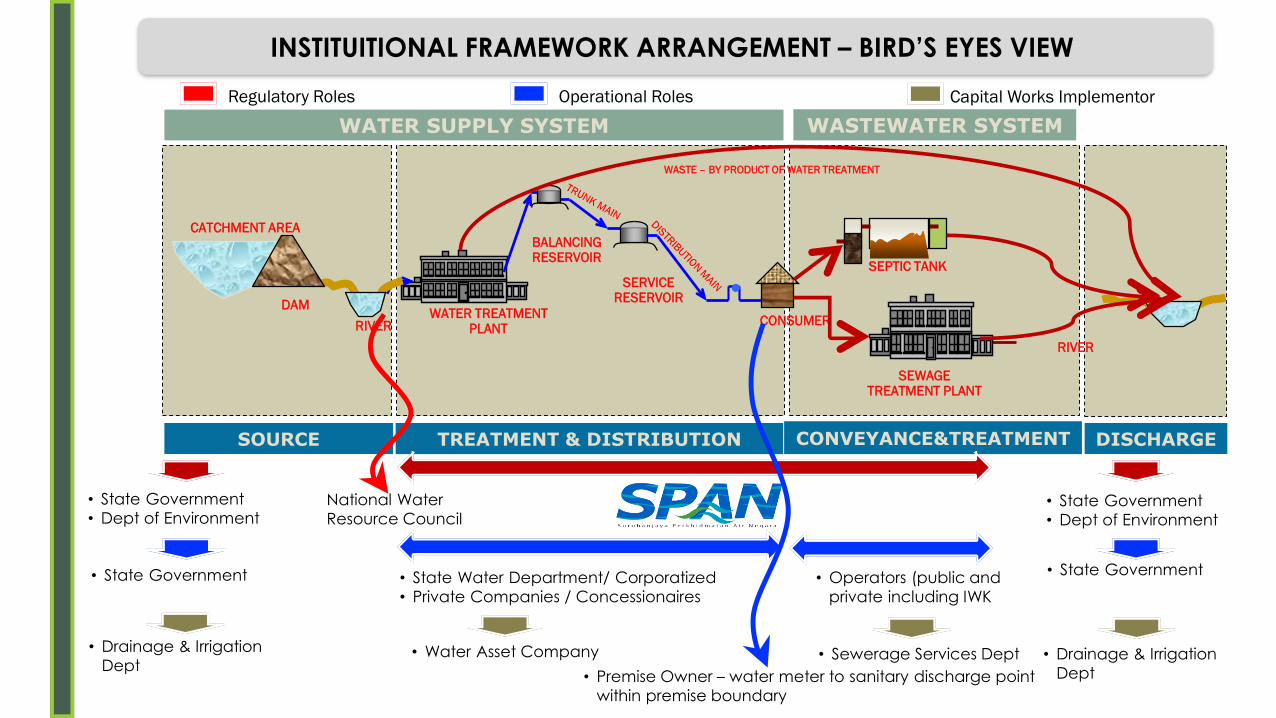
INSTITUITIONAL FRAMEWORK ARRANGEMENT – BIRD’S EYES VIEW
DAM
RIVERWATER TREATMENT
PLANT
BALANCINGRESERVOIR
SERVICERESERVOIR
CONSUMER
l
SEPTIC TANK
SEWAGETREATMENT PLANT
RIVER
WATER SUPPLY SYSTEM WASTEWATER SYSTEM
SOURCE
• State Government
• Dept of Environment
TREATMENT & DISTRIBUTION CONVEYANCE&TREATMENT
CATCHMENT AREA
DISCHARGE
• State Government
• Dept of Environment
• State Government • State Water Department/ Corporatized
• Private Companies / Concessionaires
• Operators (public and
private including IWK
• State Government
• Premise Owner – water meter to sanitary discharge point
within premise boundary
National Water
Resource Council
Regulatory Roles Operational Roles Capital Works Implementor
• Drainage & Irrigation
Dept• Drainage & Irrigation
Dept
WASTE – BY PRODUCT OF WATER TREATMENT
• Sewerage Services Dept• Water Asset Company
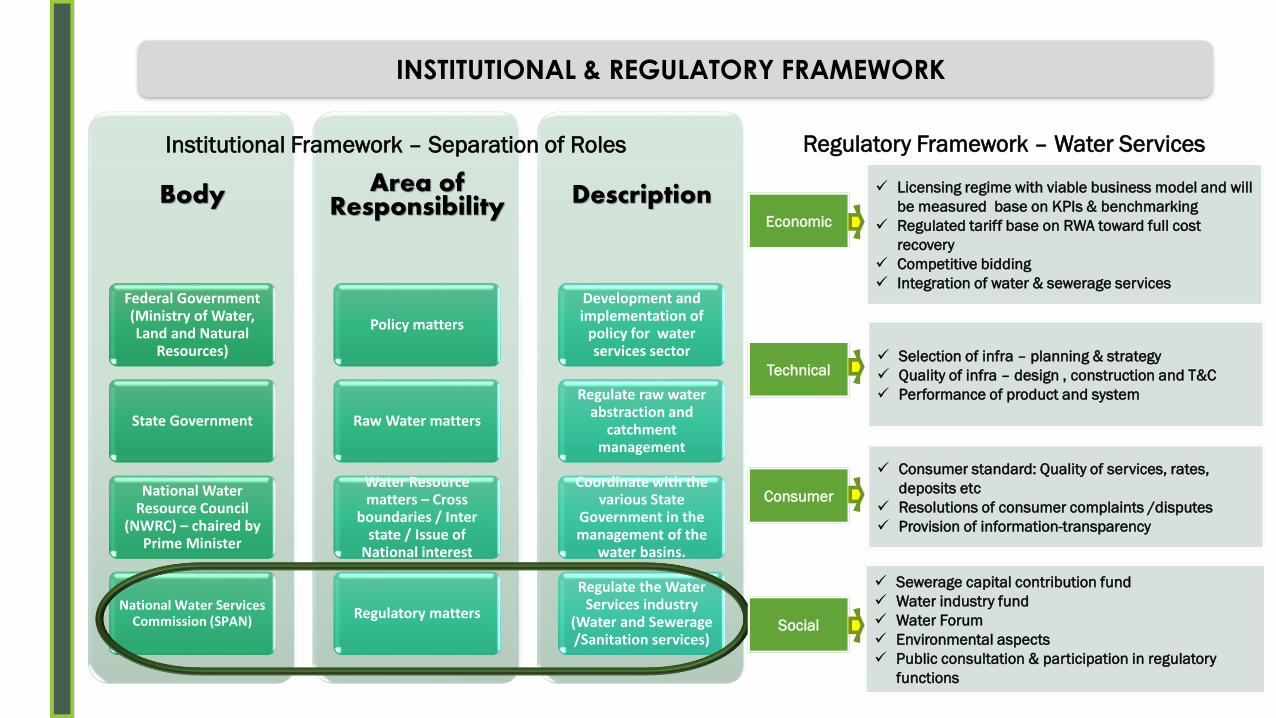
Body
Federal Government (Ministry of Water, Land and Natural
Resources)
State Government
National Water Resource Council
(NWRC) – chaired by Prime Minister
National Water Services Commission (SPAN)
Area of Responsibility
Policy matters
Raw Water matters
Water Resource matters – Cross
boundaries / Inter state / Issue of
National interest
Regulatory matters
Description
Development and implementation of
policy for water services sector
Regulate raw water abstraction and
catchment management
Coordinate with the various State
Government in the management of the
water basins.
Regulate the Water Services industry
(Water and Sewerage /Sanitation services)
INSTITUTIONAL & REGULATORY FRAMEWORK
✓ Licensing regime with viable business model and will
be measured base on KPIs & benchmarking
✓ Regulated tariff base on RWA toward full cost
recovery
✓ Competitive bidding
✓ Integration of water & sewerage services
✓ Selection of infra – planning & strategy
✓ Quality of infra – design , construction and T&C
✓ Performance of product and system
✓ Consumer standard: Quality of services, rates,
deposits etc
✓ Resolutions of consumer complaints /disputes
✓ Provision of information-transparency
✓ Sewerage capital contribution fund
✓ Water industry fund
✓ Water Forum
✓ Environmental aspects
✓ Public consultation & participation in regulatory
functions
Economic
Technical
Consumer
Social
Regulatory Framework – Water ServicesInstitutional Framework – Separation of Roles
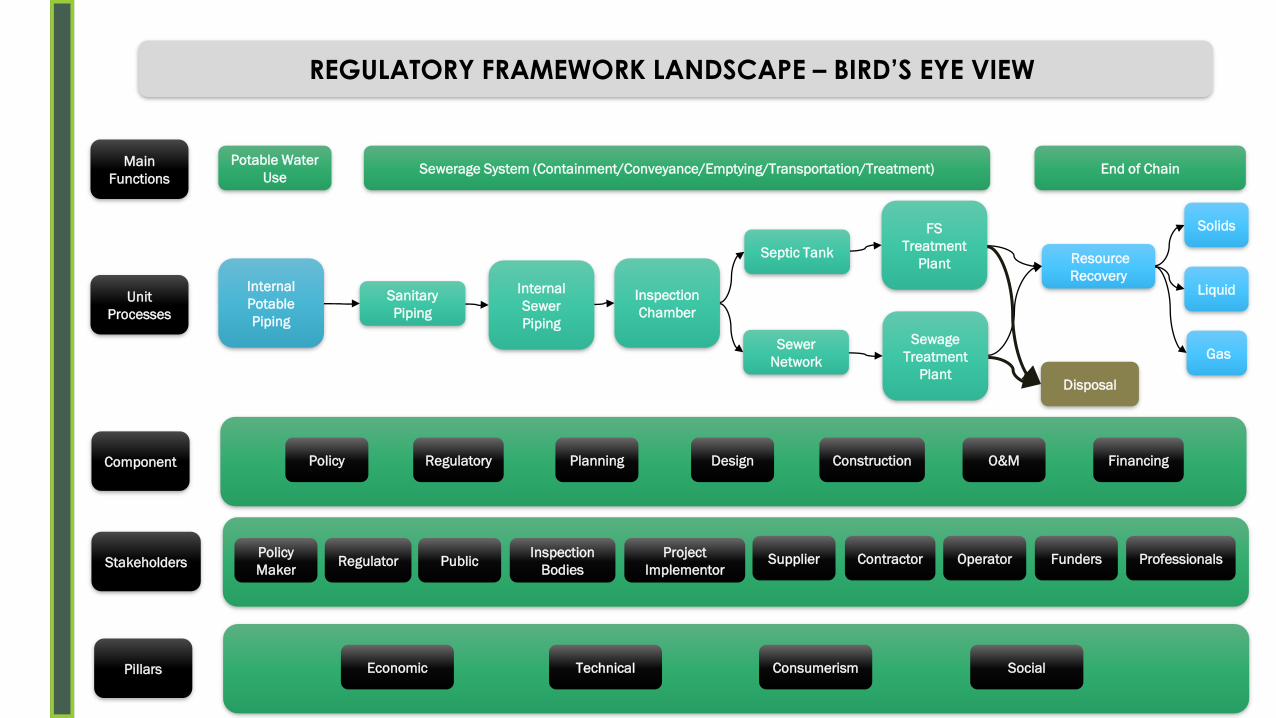
Main
Functions
Unit
Processes
Potable Water
UseSewerage System (Containment/Conveyance/Emptying/Transportation/Treatment) End of Chain
Internal
Potable
Piping
Sanitary
Piping
Internal
Sewer
Piping
Inspection
Chamber
Septic Tank
Sewer
Network
FS
Treatment
Plant
Sewage
Treatment
Plant
Resource
Recovery
Disposal
Solids
Liquid
Gas
Component Policy Regulatory Planning Design Construction FinancingO&M
StakeholdersPolicy
MakerRegulator Public
Inspection
Bodies
Project
ImplementorFundersContractorSupplier Operator Professionals
REGULATORY FRAMEWORK LANDSCAPE – BIRD’S EYE VIEW
Pillars Economic Technical Consumerism Social
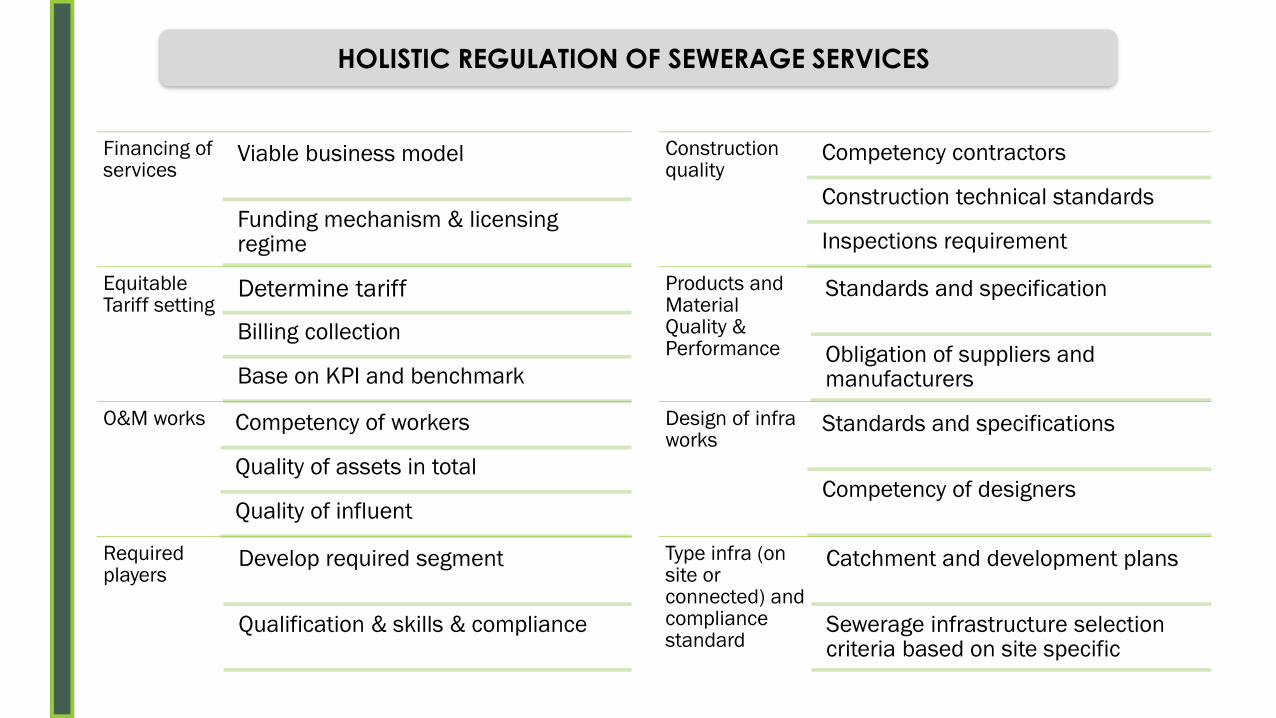
Financing of services
Viable business model
Funding mechanism & licensing regime
Equitable Tariff setting
Determine tariff
Billing collection
Base on KPI and benchmark
O&M works Competency of workers
Quality of assets in total
Quality of influent
Required players
Develop required segment
Qualification & skills & compliance
Construction quality
Competency contractors
Construction technical standards
Inspections requirement
Products and Material Quality & Performance
Standards and specification
Obligation of suppliers and manufacturers
Design of infra works
Standards and specifications
Competency of designers
Type infra (on site or connected) and compliance standard
Catchment and development plans
Sewerage infrastructure selection criteria based on site specific
HOLISTIC REGULATION OF SEWERAGE SERVICES

Clarity of
Roles and
Objectives
Legal Framework❑ SPAN Act – functions and operation of regulator
❑ WSI Act – provisions to regulate the sector (regulatory framework)
Distinctive institutional framework
Autonomy
❑ Amendment to Federal Constitution
◼ Moving sewerage and sanitation matters from local & state government to federal
government
◼ Moving water services matter from state government to federal government
❑ Commission comprises of board members from various sector appointed
by Minister.
❑ Can be appointed as commissioner up to 5 terms with 2 years per term
❑ Board decides on matters pertaining to regulatory and operation of the
Commission
❑ Commission is funded thorough permit and licensing fees
SPAN AS SERVICES REGULATOR #1
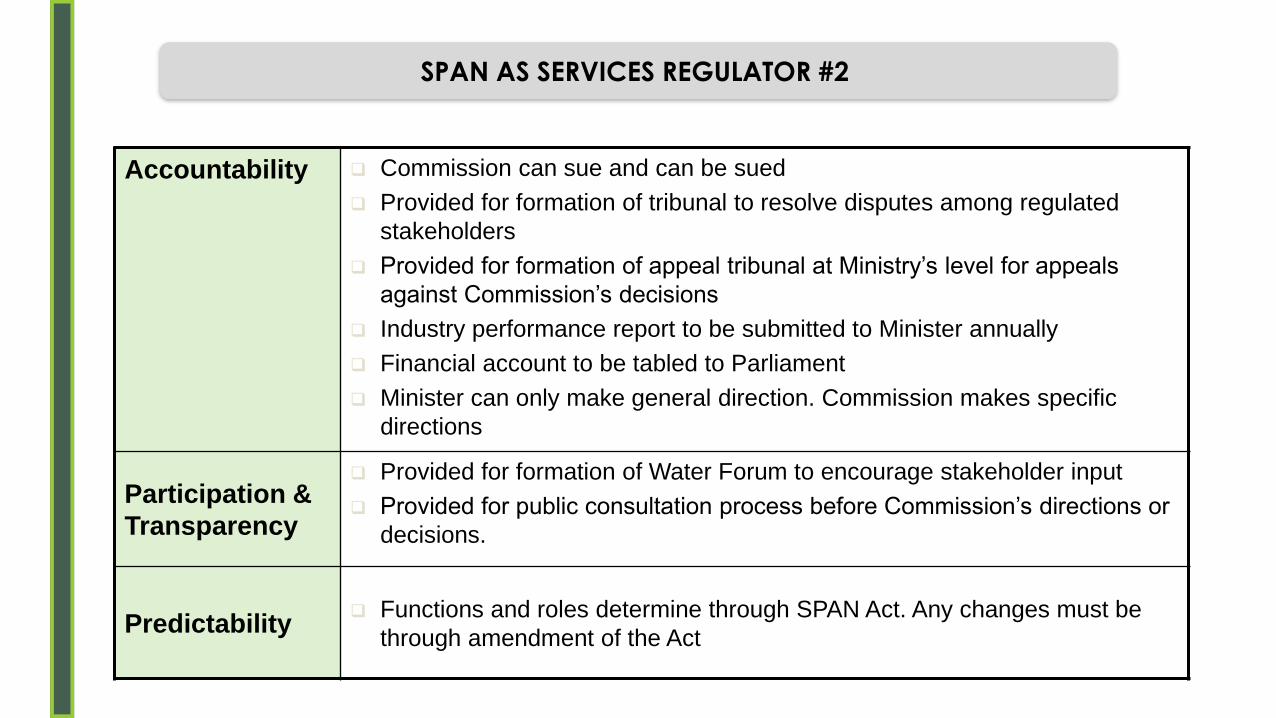
Accountability ❑ Commission can sue and can be sued
❑ Provided for formation of tribunal to resolve disputes among regulated
stakeholders
❑ Provided for formation of appeal tribunal at Ministry’s level for appeals
against Commission’s decisions
❑ Industry performance report to be submitted to Minister annually
❑ Financial account to be tabled to Parliament
❑ Minister can only make general direction. Commission makes specific
directions
Participation &
Transparency
❑ Provided for formation of Water Forum to encourage stakeholder input
❑ Provided for public consultation process before Commission’s directions or
decisions.
Predictability❑ Functions and roles determine through SPAN Act. Any changes must be
through amendment of the Act
SPAN AS SERVICES REGULATOR #2

Functions
Sanitation SubmarketFinancing
Planning and
DesignConstruction O&M
Sewer-
based
Sanitation
Sewage ConveyanceGovernment/ Private
Developers
Professionals
SPAN (approvals)
Professionals
SPAN (approvals)
Operator
SPAN (license)
Industrial/ Prohibited
Effluent Discharged
into Public Sewer
Market DrivenProfessional
SPAN (approvals)Not Determined Not Determined
Sewage TreatmentGovernment/ Private
Developers
Professionals
SPAN (approvals)
Professionals
SPAN (approvals)
Operator
SPAN (license)
On-site
Sanitation
Onsite Sanitation
Facility
Government/ Private
Developers
Professionals
SPAN (approvals)
Professionals
SPAN (approvals)Asset Owner
Faecal Sludge
Desludging ServicesOperator Not relevant Not relevant
Operator
SPAN (license)
Treatment of Faecal
SludgeOperator
Professionals
SPAN (approvals)
Professionals
SPAN (approvals)
Operator
SPAN (license)
Re-use of Faecal
SludgeMarket Driven Not Determined Not Determined Not Determined
CAPITAL WORKS REGULATORY MODEL – ROLES & FUNCTIONALITY

Regulatory Functions
Sanitation SubmarketPrice
Regulation
Service Quality
Regulation
Competition
Regulation
Consumer
Protection
Sewer-
based
sanitation
Sewage Conveyance SPAN SPANSPAN (certain
segments)SPAN
Industrial/ Prohibited
Effluent Discharged
into Public Sewer
SPAN (certain
segments)SPAN None SPAN
Sewage Treatment SPANSPAN (Services)
DOE (Effluent standards)
SPAN (certain
segments)SPAN
On-site
sanitation
Onsite Sanitation
FacilityMarket Driven SPAN None SPAN
Faecal Sludge
Desludging ServicesSPAN SPAN
SPAN (certain
segments)SPAN
Treatment of Faecal
SludgeSPAN
SPAN
DOE (Disposal sites)
SPAN (certain
segments)SPAN
Re-use of Faecal
SludgeNone Not Determined None Not Determined
SERVICES REGULATORY MODEL – ROLES & FUNCTIONALITY
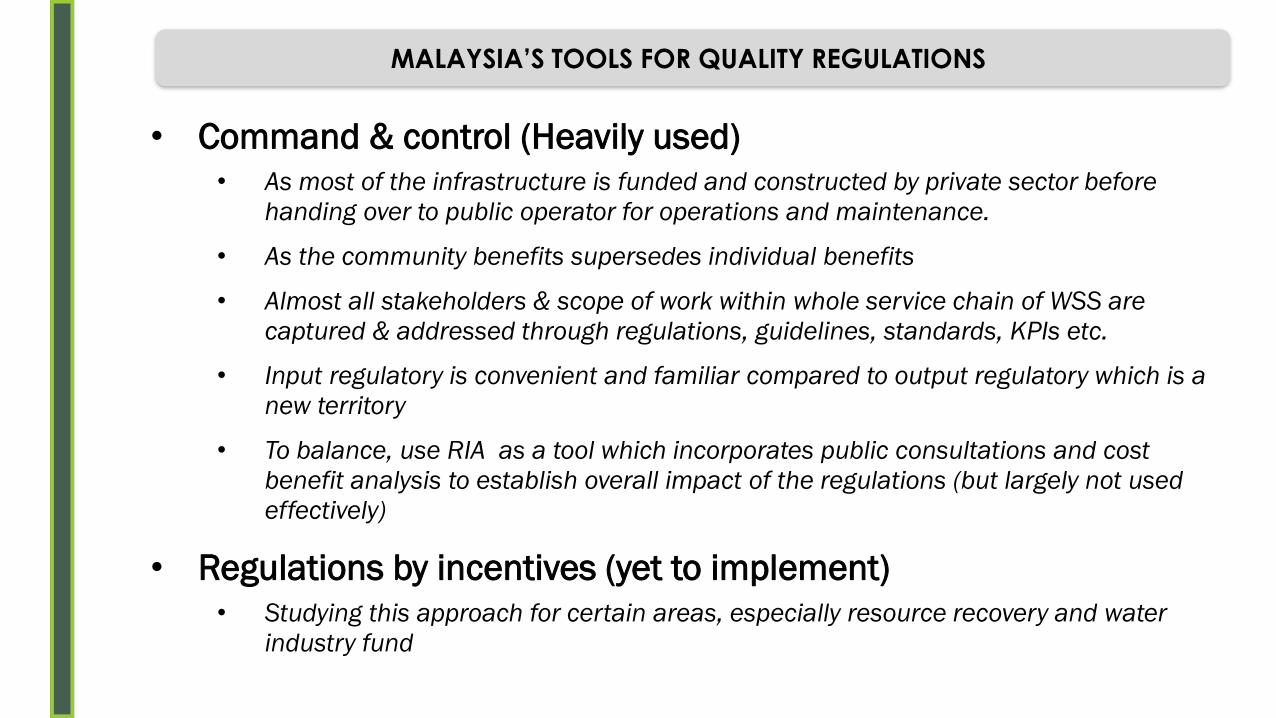
• Command & control (Heavily used)
• As most of the infrastructure is funded and constructed by private sector before
handing over to public operator for operations and maintenance.
• As the community benefits supersedes individual benefits
• Almost all stakeholders & scope of work within whole service chain of WSS are
captured & addressed through regulations, guidelines, standards, KPIs etc.
• Input regulatory is convenient and familiar compared to output regulatory which is a
new territory
• To balance, use RIA as a tool which incorporates public consultations and cost
benefit analysis to establish overall impact of the regulations (but largely not used
effectively)
• Regulations by incentives (yet to implement)
• Studying this approach for certain areas, especially resource recovery and water
industry fund
MALAYSIA’S TOOLS FOR QUALITY REGULATIONS

REGULATORY RULES & ROLES
Legal Instruments
Contracts Licenses Statutes
Organizations
MinistryDepartments
/UnitsRegulatory Office
Professional Associations
IDENTIFYING THE ‘RIGHT’ REGULATORY DESIGN
Country context / administrative and legal traditions affects the selection of regulatory design
Any form of regulatory design in simple term
is government’s interference in businesses.
Hence ”WHY” and “HOW” is essential to
achieve the objective of interference with
least impact to overall economy
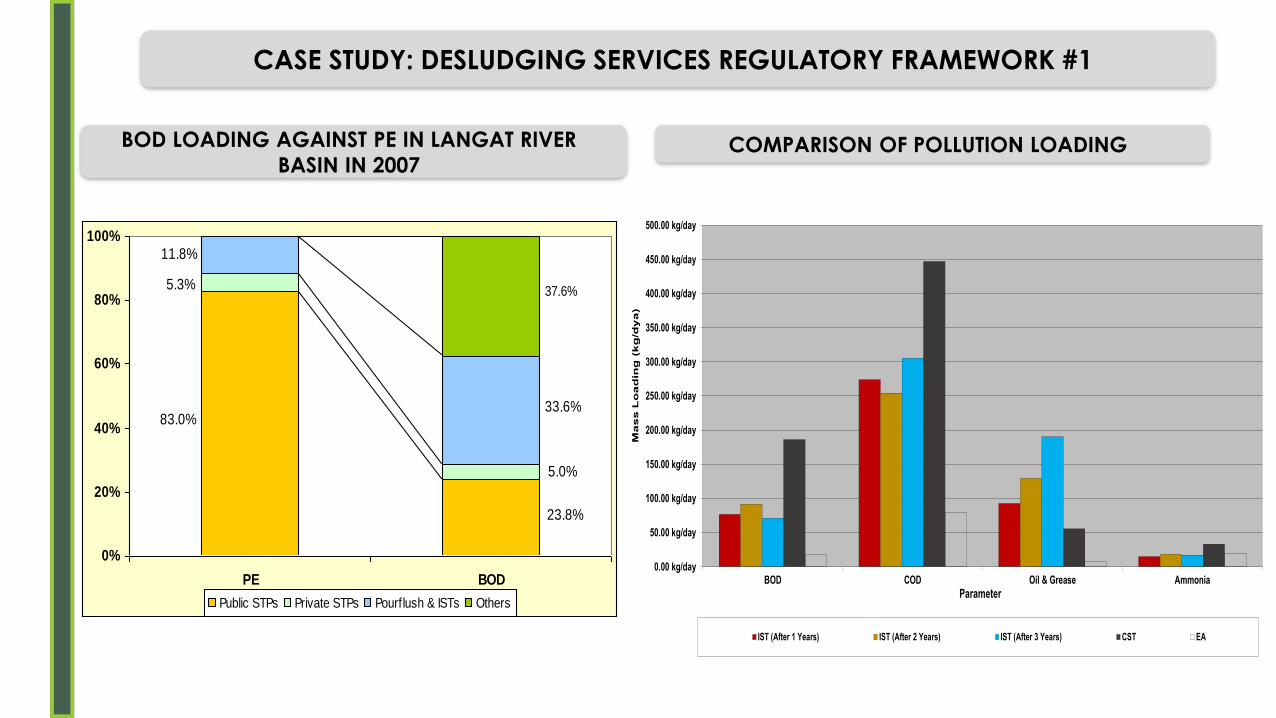
0.00 kg/day
50.00 kg/day
100.00 kg/day
150.00 kg/day
200.00 kg/day
250.00 kg/day
300.00 kg/day
350.00 kg/day
400.00 kg/day
450.00 kg/day
500.00 kg/day
BOD COD Oil & Grease Ammonia
Ma
ss
Lo
ad
ing
(k
g/d
ya
)
Parameter
IST (After 1 Years) IST (After 2 Years) IST (After 3 Years) CST EA
COMPARISON OF POLLUTION LOADING
CASE STUDY: DESLUDGING SERVICES REGULATORY FRAMEWORK #1
BOD LOADING AGAINST PE IN LANGAT RIVER
BASIN IN 2007
83.0%
23.8%
5.3%
5.0%
11.8%
33.6%
37.6%
0%
20%
40%
60%
80%
100%
PE BOD
Public STPs Private STPs Pourflush & ISTs Others
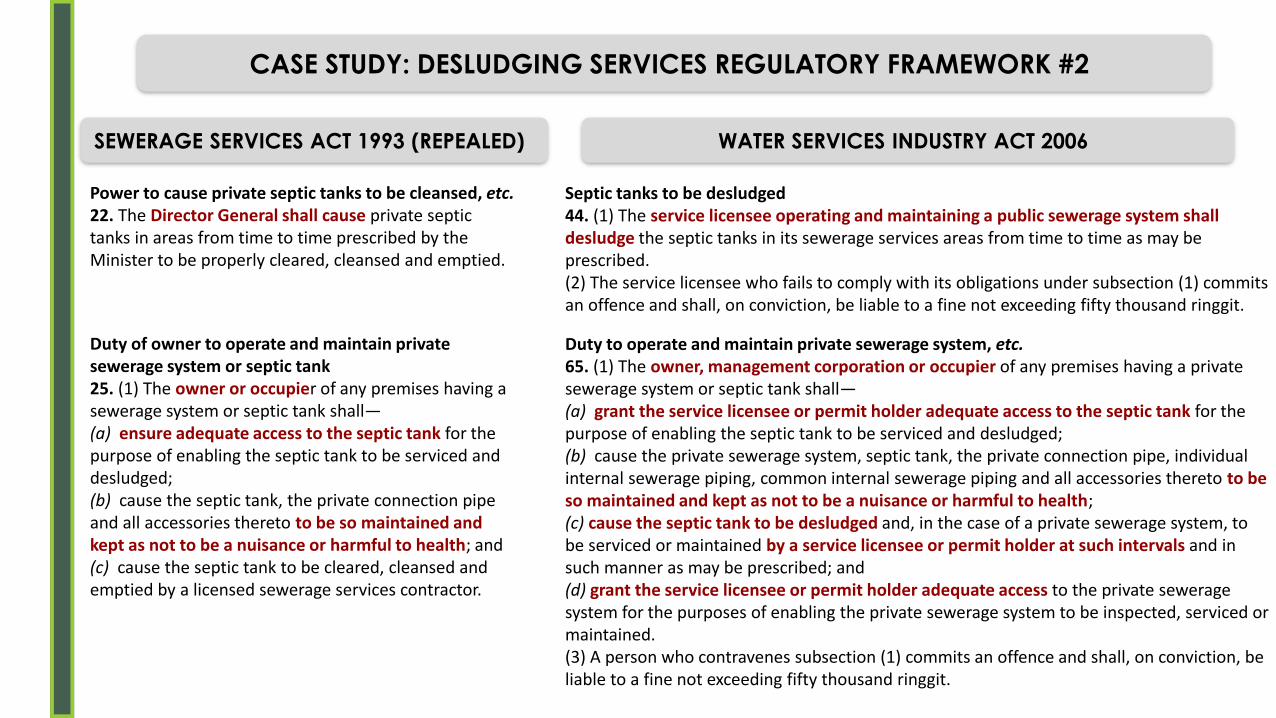
Power to cause private septic tanks to be cleansed, etc. 22. The Director General shall cause private septic tanks in areas from time to time prescribed by the Minister to be properly cleared, cleansed and emptied.
Duty of owner to operate and maintain private sewerage system or septic tank25. (1) The owner or occupier of any premises having a sewerage system or septic tank shall—(a) ensure adequate access to the septic tank for the purpose of enabling the septic tank to be serviced and desludged; (b) cause the septic tank, the private connection pipe and all accessories thereto to be so maintained and kept as not to be a nuisance or harmful to health; and (c) cause the septic tank to be cleared, cleansed and emptied by a licensed sewerage services contractor.
Septic tanks to be desludged44. (1) The service licensee operating and maintaining a public sewerage system shall desludge the septic tanks in its sewerage services areas from time to time as may be prescribed. (2) The service licensee who fails to comply with its obligations under subsection (1) commits an offence and shall, on conviction, be liable to a fine not exceeding fifty thousand ringgit.
Duty to operate and maintain private sewerage system, etc. 65. (1) The owner, management corporation or occupier of any premises having a private sewerage system or septic tank shall—(a) grant the service licensee or permit holder adequate access to the septic tank for the purpose of enabling the septic tank to be serviced and desludged; (b) cause the private sewerage system, septic tank, the private connection pipe, individual internal sewerage piping, common internal sewerage piping and all accessories thereto to be so maintained and kept as not to be a nuisance or harmful to health; (c) cause the septic tank to be desludged and, in the case of a private sewerage system, to be serviced or maintained by a service licensee or permit holder at such intervals and in such manner as may be prescribed; and (d) grant the service licensee or permit holder adequate access to the private sewerage system for the purposes of enabling the private sewerage system to be inspected, serviced or maintained. (3) A person who contravenes subsection (1) commits an offence and shall, on conviction, be liable to a fine not exceeding fifty thousand ringgit.
CASE STUDY: DESLUDGING SERVICES REGULATORY FRAMEWORK #2
SEWERAGE SERVICES ACT 1993 (REPEALED) WATER SERVICES INDUSTRY ACT 2006
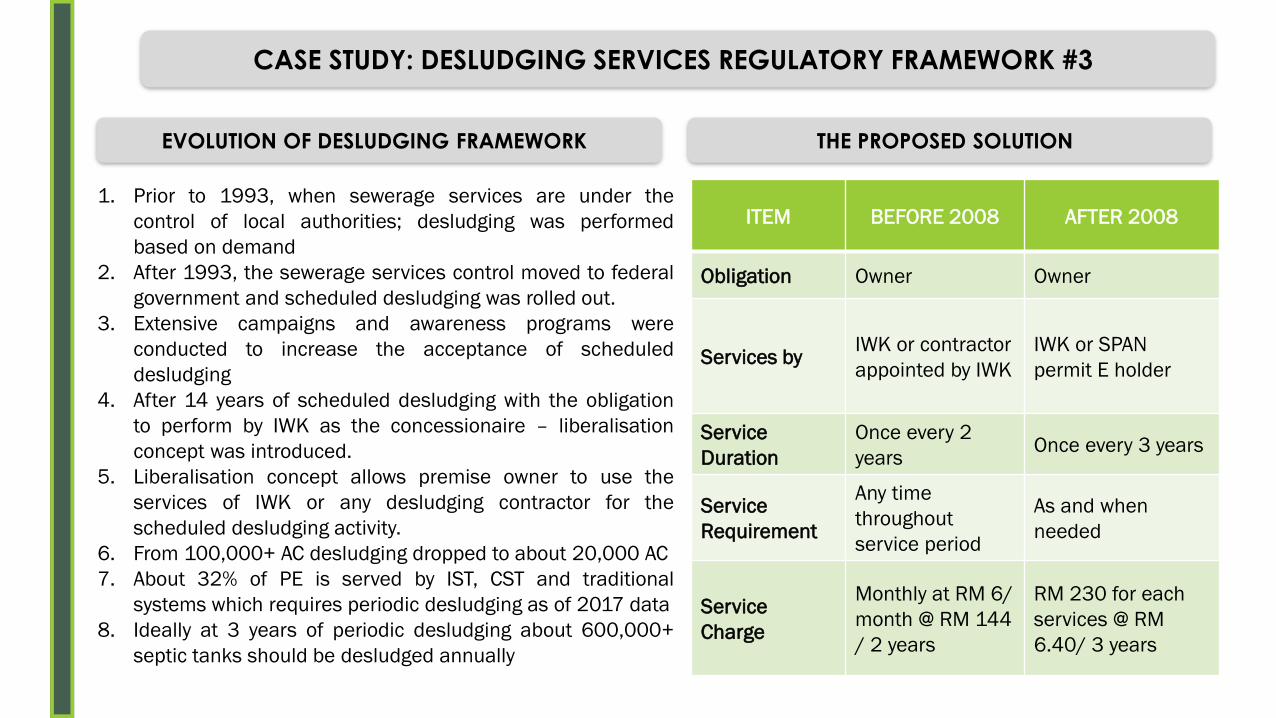
CASE STUDY: DESLUDGING SERVICES REGULATORY FRAMEWORK #3
1. Prior to 1993, when sewerage services are under the
control of local authorities; desludging was performed
based on demand
2. After 1993, the sewerage services control moved to federal
government and scheduled desludging was rolled out.
3. Extensive campaigns and awareness programs were
conducted to increase the acceptance of scheduled
desludging
4. After 14 years of scheduled desludging with the obligation
to perform by IWK as the concessionaire – liberalisation
concept was introduced.
5. Liberalisation concept allows premise owner to use the
services of IWK or any desludging contractor for the
scheduled desludging activity.
6. From 100,000+ AC desludging dropped to about 20,000 AC
7. About 32% of PE is served by IST, CST and traditional
systems which requires periodic desludging as of 2017 data
8. Ideally at 3 years of periodic desludging about 600,000+
septic tanks should be desludged annually
EVOLUTION OF DESLUDGING FRAMEWORK
ITEM BEFORE 2008 AFTER 2008
Obligation Owner Owner
Services byIWK or contractor
appointed by IWK
IWK or SPAN
permit E holder
Service
Duration
Once every 2
yearsOnce every 3 years
Service
Requirement
Any time
throughout
service period
As and when
needed
Service
Charge
Monthly at RM 6/
month @ RM 144
/ 2 years
RM 230 for each
services @ RM
6.40/ 3 years
THE PROPOSED SOLUTION

0
50,000
1,00,000
1,50,000
2,00,000
2,50,000
3,00,000
3,50,000
4,00,000
4,50,000
2003 2004 2005 2006 2007 2008 2009 2010 2011 2012 2013
No IST
Year
LIBERALISATION CONCEPTINITIATED BY OWNERS
SCHEDULED DESLUDGING
INITIATED BY IWK
Total Attempted Total Unsuccessful Total Desludged
CASE STUDY: DESLUDGING SERVICES REGULATORY FRAMEWORK #4
NATURE OF FAILURETHE ISSUES
✓ The basis for liberalization concept✓ IWK was not interested in desludging business
due the problems listed below
✓ The cost of desludging by IWK is high hence high
refusal rate
✓ Introducing competition/alternative options for
septic owners will increase desludging rate
✓ The alternative options will bring desludging cost
lower
✓ The problems IWK faced since 1993✓ Refusal From Owners
✓ Location Inaccessible and septic tank covers
sealed
✓ Owner Not In During Visit
✓ Septic Tank Not Found/ Missing
✓ Premise Not Found or unoccupied
✓ Non Standard Septic Tank
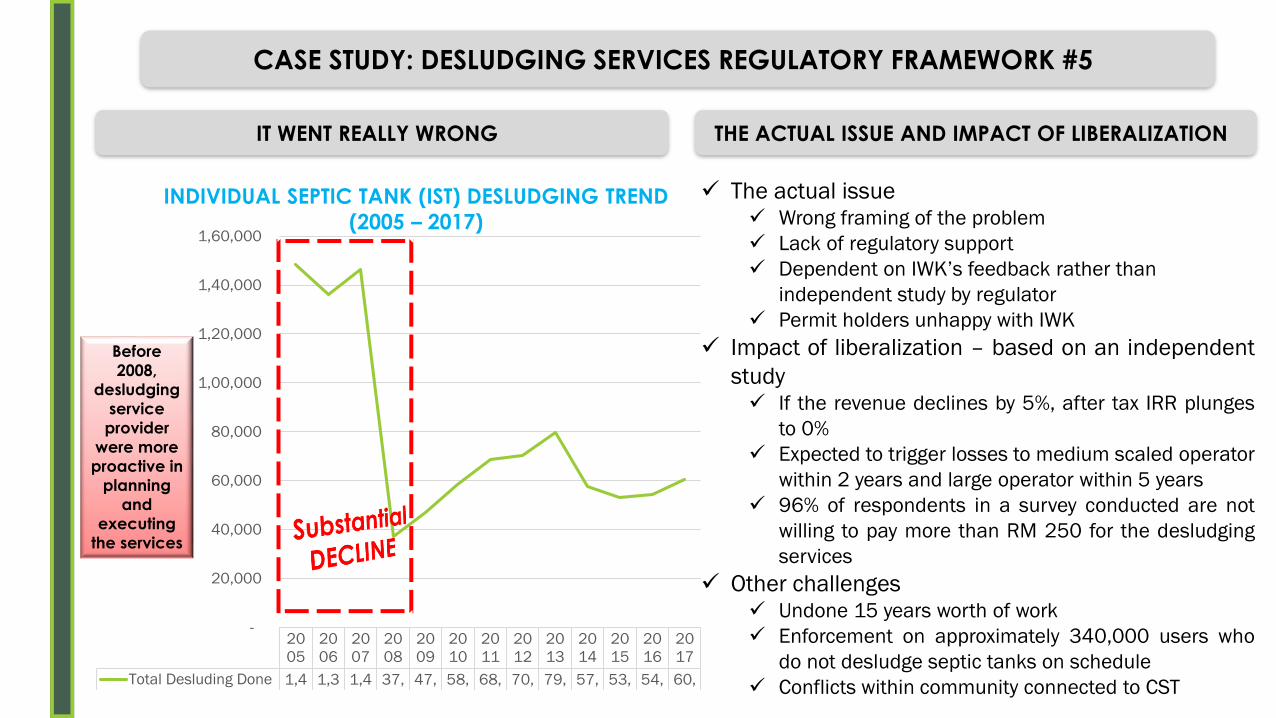
CASE STUDY: DESLUDGING SERVICES REGULATORY FRAMEWORK #5
✓ The actual issue✓ Wrong framing of the problem
✓ Lack of regulatory support
✓ Dependent on IWK’s feedback rather than
independent study by regulator
✓ Permit holders unhappy with IWK
✓ Impact of liberalization – based on an independent
study✓ If the revenue declines by 5%, after tax IRR plunges
to 0%
✓ Expected to trigger losses to medium scaled operator
within 2 years and large operator within 5 years
✓ 96% of respondents in a survey conducted are not
willing to pay more than RM 250 for the desludging
services
✓ Other challenges✓ Undone 15 years worth of work
✓ Enforcement on approximately 340,000 users who
do not desludge septic tanks on schedule
✓ Conflicts within community connected to CST
THE ACTUAL ISSUE AND IMPACT OF LIBERALIZATION
20
05
20
06
20
07
20
08
20
09
20
10
20
11
20
12
20
13
20
14
20
15
20
16
20
17
Total Desluding Done 1,4 1,3 1,4 37, 47, 58, 68, 70, 79, 57, 53, 54, 60,
-
20,000
40,000
60,000
80,000
1,00,000
1,20,000
1,40,000
1,60,000
Before
2008,
desludging
service
provider
were more
proactive in
planning
and
executing
the services
INDIVIDUAL SEPTIC TANK (IST) DESLUDGING TREND
(2005 – 2017)
IT WENT REALLY WRONG
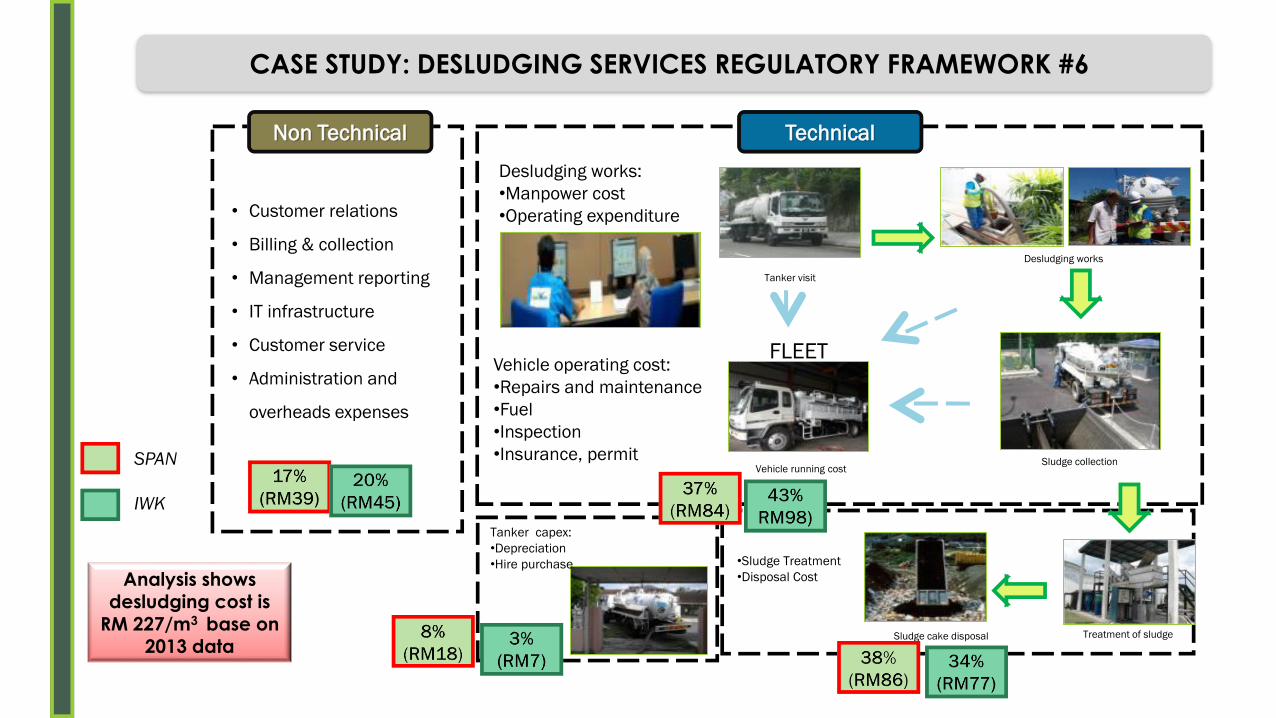
Tanker visit
Treatment of sludgeSludge cake disposal
FLEET
• Customer relations
• Billing & collection
• Management reporting
• IT infrastructure
• Customer service
• Administration and
overheads expenses
•Sludge Treatment
•Disposal Cost
Vehicle running cost
Desludging works:
•Manpower cost
•Operating expenditure
Vehicle operating cost:
•Repairs and maintenance
•Fuel
•Inspection
•Insurance, permit
Desludging works
Sludge collection
Tanker capex:
•Depreciation
•Hire purchase
Non Technical Technical
SPAN
IWK
Analysis shows desludging cost is
RM 227/m3 base on 2013 data
CASE STUDY: DESLUDGING SERVICES REGULATORY FRAMEWORK #6

CASE STUDY: DESLUDGING SERVICES REGULATORY FRAMEWORK #7
Option I Option II Option III (proposed) Option IV
➢Same rates for
all category;
➢Huge impact
to residential
consumers;
➢ IWK would
earn profit
with high
profit margin
more than
20%
➢Non-
residential
rates higher
than
residential;
➢Proposed
rates lower
than existing
rates for
residential
(charged by
MAJAARI);
➢Revenue
insufficient to
cover OPEX;
➢ IWK would
incur losses
more than
20%
➢ Non-residential rates
higher than residential;
➢ Huge impact to
residential consumers
(90% of total accounts
are residential);
➢ Rates for residential
based on 30m³ water
consumption is more
than average usage for
residential consumers
i.e. 48.5% below 20m³
(desludging bill higher
than connected bill of
majority of residential
consumers)
➢ IWK earns reasonable
profit margin around
10%
➢ Non-residential
rates higher than
residential;
➢ All consumers
(desludging &
connected)
paying based on
the same
concept i.e.
usage of water;
➢ Revenue
insufficient to
cover OPEX;
➢ IWK would incur
losses around
10%;
➢Average bill
residential :
RM18.92 /
month;
➢Average bill
residential :
RM9.60 /
month;
➢ Average bill : RM15.00
/ month;
➢ Average bill
residential :
RM8.00 / month;
CONSIDERED TARIF STRUCTURE
✓ Scheduled desludging services to be planned and
implemented by public operators
✓ Legal action on owners for refusal of desludging
services
✓ Creation of vendor program by operator to enable
business growth of permit holders to provide the
necessary support
✓ Tariff concept based on water usage volumetric
charges with same tariff structure with connected
services as 43% of revenue from desludging
services is used to support connected services.
✓ Unsuccessful trips of desludging tanker
✓ Pricing policy under the principle of ‘user pay’ and
to encourage efficient use of water;
✓ Same regulations and implementation date for both
connected and desludging services;
✓ To minimize impact on tariff increase, government
to continue subsidy to IWK for period until they
achieve full cost recovery of OPEX.
✓ To recommend to Minister on implementation of
joint billing to achieve collection efficiency.
PROPOSED FRAMEWORK
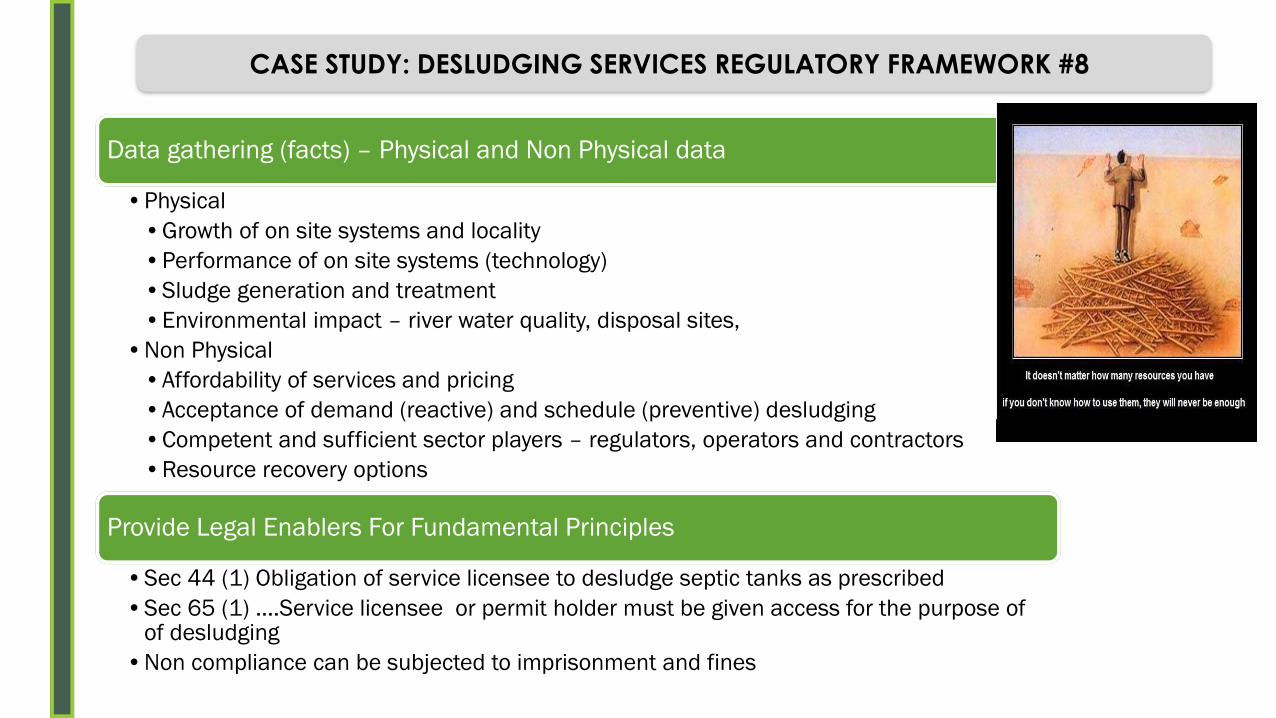
Data gathering (facts) – Physical and Non Physical data
•Physical
•Growth of on site systems and locality
•Performance of on site systems (technology)
•Sludge generation and treatment
•Environmental impact – river water quality, disposal sites,
•Non Physical
•Affordability of services and pricing
•Acceptance of demand (reactive) and schedule (preventive) desludging
•Competent and sufficient sector players – regulators, operators and contractors
•Resource recovery options
Provide Legal Enablers For Fundamental Principles
•Sec 44 (1) Obligation of service licensee to desludge septic tanks as prescribed
•Sec 65 (1) ….Service licensee or permit holder must be given access for the purpose of of desludging
•Non compliance can be subjected to imprisonment and fines
CASE STUDY: DESLUDGING SERVICES REGULATORY FRAMEWORK #8

PRESENTATION OUTLINE
■ TONE SETTING - SNAPSHOT IN A GLANCE
■ EVOLUTION OF REGULATORY LANDSCAPES
■ PRIVATE SECTOR PARTICIPATION
■ POTENTIAL TAKE AWAY POINTS

Low Tariff
Capital Intensive Industry
Lack of CAPEX Funding
Minimal maintenance programs & infrastructure development
High Outstanding Loan
Inefficient and ineffective Service Delivery
Unprofitable and
require substantial
funding from
Federal
Government and
private developers
Requires business
models to
transform the
industry for long
term sustainable
operations
Corporatization will
lead to managerial/
financial autonomy
clearer
accountability
WHERE IS THE MONEY – CAPEX & OPEX
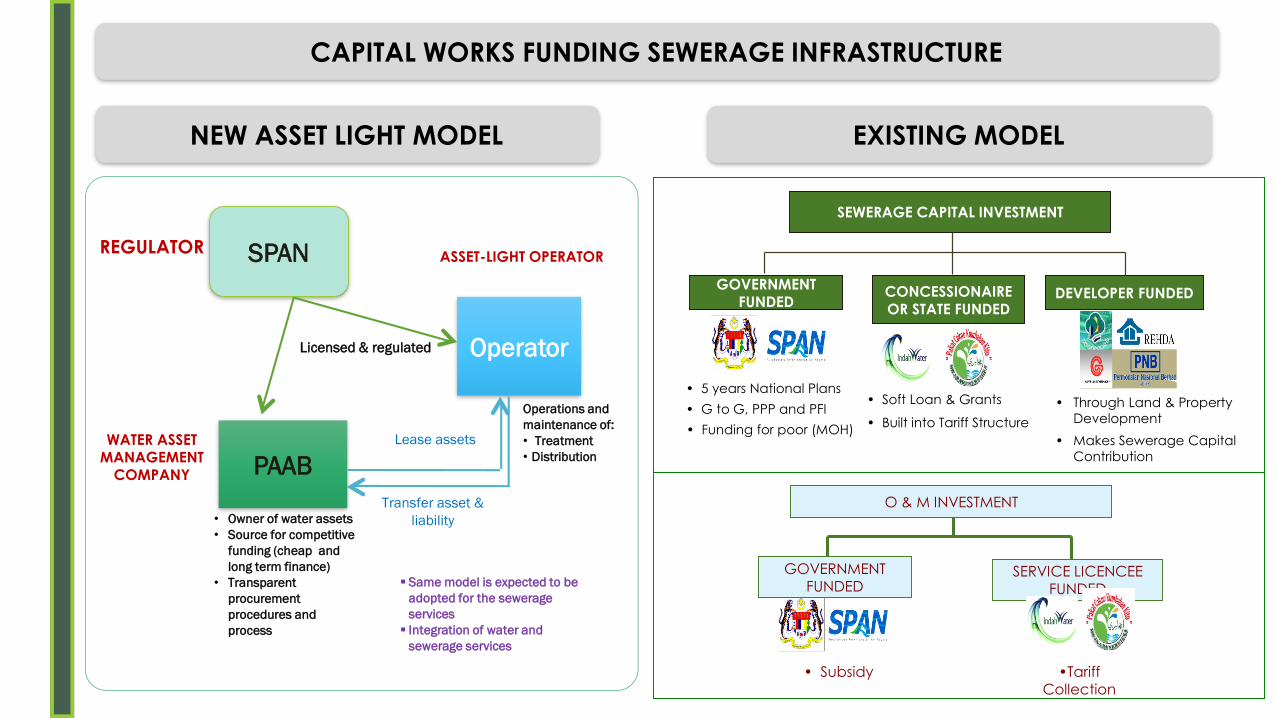
PAAB
Operator
SPAN
• Owner of water assets
• Source for competitive
funding (cheap and
long term finance)
• Transparent
procurement
procedures and
process
Transfer asset &
liability
Lease assets
Operations and
maintenance of:
• Treatment
• Distribution
WATER ASSET MANAGEMENT
COMPANY
REGULATOR
Licensed & regulated
ASSET-LIGHT OPERATOR
▪ Same model is expected to be
adopted for the sewerage
services
▪ Integration of water and
sewerage services
NEW ASSET LIGHT MODEL
CAPITAL WORKS FUNDING SEWERAGE INFRASTRUCTURE
SEWERAGE CAPITAL INVESTMENT
GOVERNMENT FUNDED
CONCESSIONAIRE OR STATE FUNDED
DEVELOPER FUNDED
• 5 years National Plans
• G to G, PPP and PFI• Soft Loan & Grants
• Built into Tariff Structure
• Through Land & Property
Development
• Makes Sewerage Capital
Contribution
O & M INVESTMENT
SERVICE LICENCEE FUNDED
• Subsidy •Tariff Collection
GOVERNMENT FUNDED
• Funding for poor (MOH)
EXISTING MODEL

Note:*Amount allocation for water supply is not available
**For RMK-11, amount refers to shortlisted project for Rolling Plan No. 1 and subject to approval by EPU/KETTHA.
Sources: Laporan Rancangan Malaysia, RMK 1-10 issued by the Economic Planning Unit (EPU).Official website of Kementerian Penerangan Komunikasi dan Kebudayaan (KPKK), Kementerian Tenaga, Teknologi Hijau dan Air (KeTTHA), Pejabat Perdana Menteri (PPP),Malaysian Administrative Modernisation and Management Planning Unit (MAMPU), Utusan, STAR, New Straits Times (NST), Wikipedia, etc
RMK1 RMK2 RMK3 RMK4 RMK5 RMK6 RMK7 RMK8 RMK9 RMK10 RMK11
Total Allocation 5.3 13.1 41.1 78.5 40.0 58.5 103.6 170.0 200.0 215.0 2.6
Water Supply 0.2 0.3 0.9 2.8 3.2 3.5 3.1 3.1 6.5 6.5 0.0
Sewerage 0.0 0.0 0.2 0.3 0.1 0.5 0.6 1.3 2.5 2.3 2.6
0.0
50.0
100.0
150.0
200.0
250.0
RM
bill
ion
INFRASTRUCTURE DEVELOPMENT BUDGET

0.92.3
5.5 5.98.55.0
12.5
16.018.5
22.2
0
5
10
15
20
25
30
35
RMK7 RMK8 RMK9 RMK10 RMK11
RM
Bil
lio
nCumulative Private Sector investment
Cumulative Government investment
• Base on current goals and approach and
estimated RM 50 bil for next 30 years (RM
1.7bil/year for West Malaysia)
• Current RMK allocation is about RM 500 mil for
Malaysia (about RM 250 mil for WM)
• SCC funds averaging about RM 250 million
annually and cumulatively amounting more
than RM 2 billion to-date since 2011
• Investment from private sector averaging about
RM 500 million annually – diluted and not used
strategically. Which currently causing more
problems than delivering solutions
• Private developer funding should be
consolidated and utilized through SISCA matrix.
• Whole life cycle cost of the works and services
should be main consiideration
• Short fall of strategic funding (government +
SCC) about RM 1.2 bil a year. Net short fall
(including private sector) = RM 200 mil a year
INVESTMENT FOR SEWERAGE INFRASTRUCTURE
Type of Sewerage Capital Contribution Amount (RM)
Connection RM 316, 194, 731
Septic Tank RM 12, 780, 581
Upgrading RM 5, 466, 117
Sludge Treatment Facility RM 2, 949, 364
Total for 2016 RM 337, 390, 793

Economic Dynamic
Influencer
Socio Ecological Influencer
SISCA Matrix
Thrust 2 - Safety &
Public Health
Thrust 3 – Protection of
Evironmental and Water Source
Thrust 1 – Overiding
Criteria & Economic
Feasibilty
SSM study includes:~ Population equivalent tabulation for various types of building use
~ Q peak factor and sewage generation per capita
~ Trends and pattern of sewage quantity and quality for various types of development
PLANNING GUIDELINE: SEWERAGE INFRASTRUCTURE SELECTION CRITERIA (SISCA)
TILL TO DATE:
1. 150 PE AND ABOVE MUST CONSTRUCT STP SINCE 1994
2. BASE ON THE PE TABULATION ESTABLISHED IN LATE 1980’S
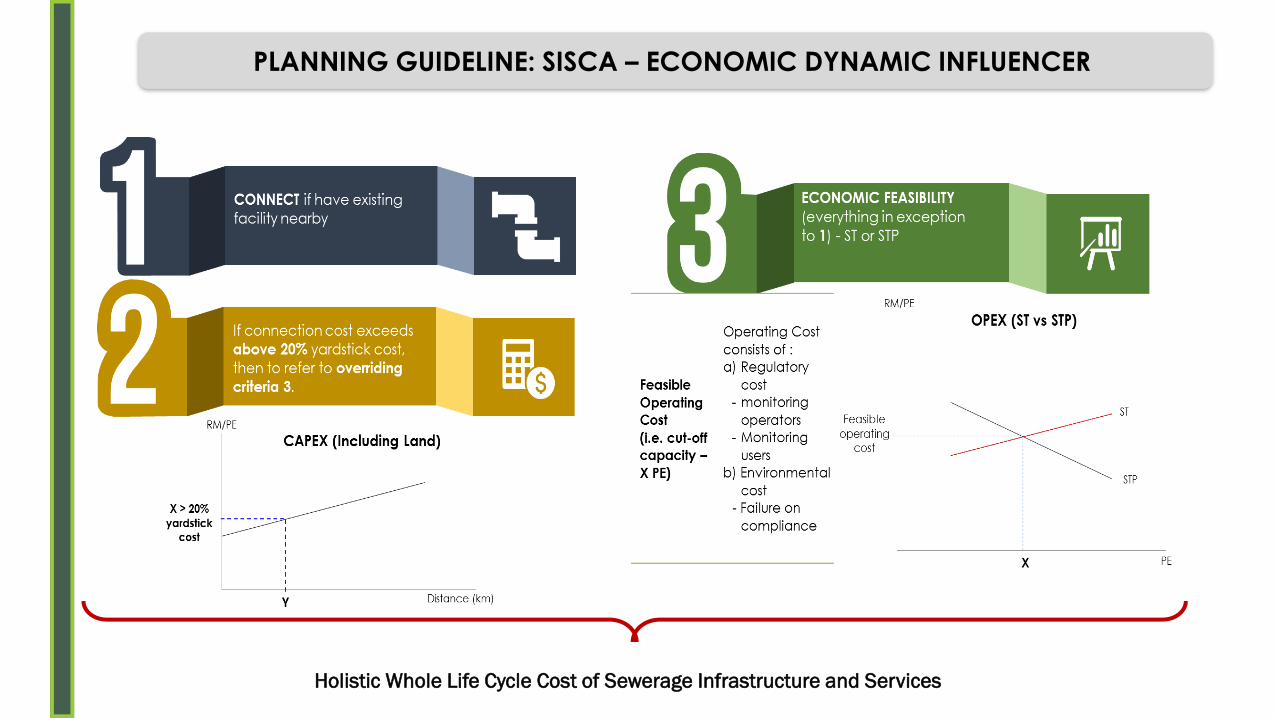
Holistic Whole Life Cycle Cost of Sewerage Infrastructure and Services
PLANNING GUIDELINE: SISCA – ECONOMIC DYNAMIC INFLUENCER

Sewerage
Strategy Matrix
(SSM)
Assimilative
CapacityUrbanisation
Population
Density
Population
Growth Rate
Strategic
ImportanceRiver/Dam/
Groundwater
Usage
River Water
Quality
01
03
04
05
06
07
Criteria 5 – 7
Protection of Environment
& Water Resource
Criteria 1 – 4
Safety & Public Health
. 03
04
02
PLANNING GUIDELINE: SISCA – SOCIO ECOLOGICAL INFLUENCER

Minimum Maximum
No. CRITERIA RANGEWEIGH-
TAGERANGE SCORE RANGE SCORE
1Urbanization
(10%)
Rural Small town District Capital/Town State capital Major city
Outside local
authority area
Within local
authority area
(other small
towns besides the
District Capital)
District Capital (e.g.
Majlis Perbandaran
Klang)
Administrative
Capital of the State
(e.g. MBSA)
All major cities with
population above 500k
(based on the Statistical
Department of Malaysia)
1 2 3 4 5 10 1 10 5 50
2Population
density (10%)
very low low medium high very high
<100 people/km2101 -500
people/km2501 - 1000 people/km2
1001 -1500
people/km2>1500 people/km2
1 2 3 4 5 10 1 10 5 50
3
Population
Growth Rate
(10%)
low medium high
< 1% 1 - 3% > 3%
1 3 5 10 1 10 5 50
4
Strategic
importance
(10%)
Agriculture IndustrialAdministrative &
Economic CentreResidential Tourism
Outside local
authority areaFactories Town and cities Housing area Tourist attraction
1 2 3 4 5 10 1 10 5 50
5
River/Dam/
Groundwater
Water Use
(25%)
NilNon Potable - Not
CriticalNon Potable - Critical Potable Water
No usageNo / minimal
body contact
Anything involves body
contact (tourism /
recreational, aquaculture
/ ablution
For drinking
purposes
1 2 4 5 35 1 35 5 175
6River water
quality (15%)
Class V Class IV Class III Class II Class I
None of the rest Irrigation
Extensive treatment
required for water supply
& fishery
Conventional
treatment required
for water supply &
fishery
Recreational use
with body contact
Treatment not required for
water supply & fishery
1 2 3 4 5 25 1 25 5 125
100 100 500
PLANNING GUIDELINE: SOCIO ECOLOGICAL INFLUENCER MATRIX

PRESENTATION OUTLINE
■ TONE SETTING - SNAPSHOT IN A GLANCE
■ EVOLUTION OF REGULATORY LANDSCAPES
■ PRIVATE SECTOR PARTICIPATION
■ POTENTIAL TAKE AWAY POINTS

Take Away Points #1■ Rely on DATA & FACTs – opinions leave it at coffee table
■ Effective, sufficient and meaningful consultation with all the stakeholders in drafting and implementation of policies.
■ Depoliticize segments that are politically sensitive. Unload the pressure of political masters.
■ Create vibrant environment to attract private sector participation. There is not a single problem a government faces can be resolved by government alone. Leverage to accelerate growth.
■ Identify industry and sectoral champions. Essential to drive forward
■ Starting some where is better than not starting at all..
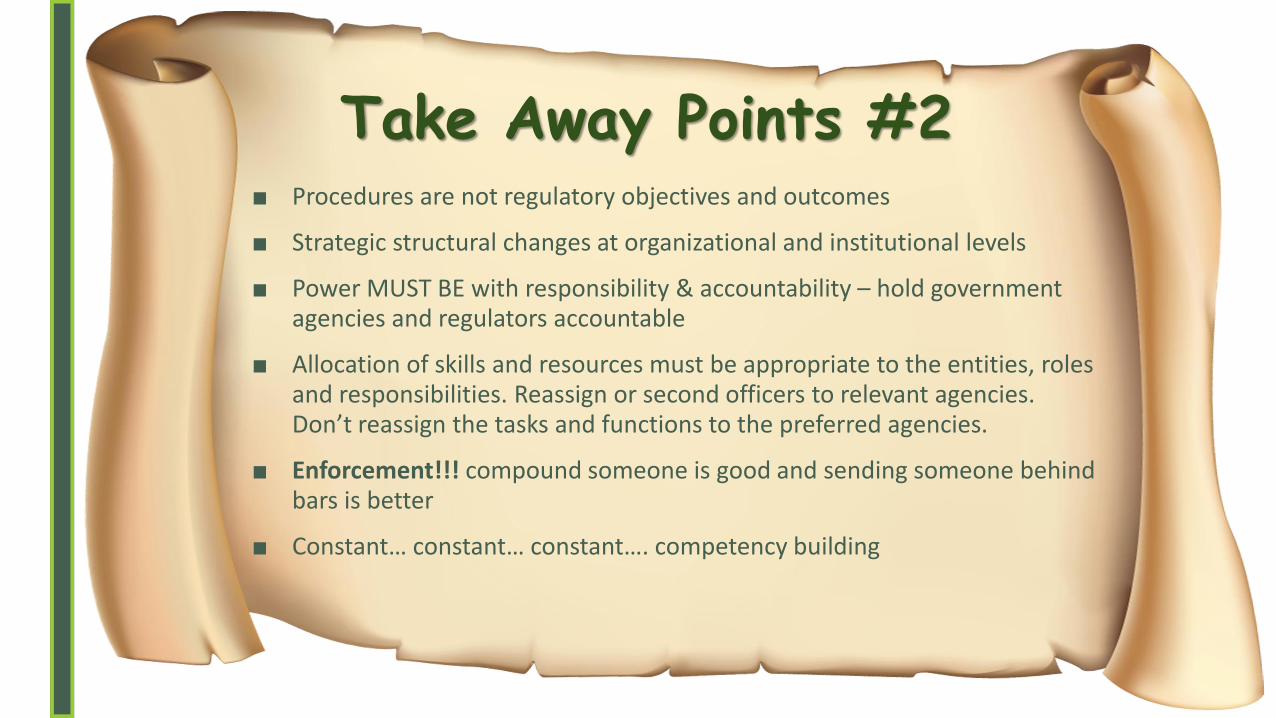
Take Away Points #2■ Procedures are not regulatory objectives and outcomes
■ Strategic structural changes at organizational and institutional levels
■ Power MUST BE with responsibility & accountability – hold government agencies and regulators accountable
■ Allocation of skills and resources must be appropriate to the entities, roles and responsibilities. Reassign or second officers to relevant agencies. Don’t reassign the tasks and functions to the preferred agencies.
■ Enforcement!!! compound someone is good and sending someone behind bars is better
■ Constant… constant… constant…. competency building