Embed Size (px)
Citation preview

Studies in International and Comparative Education
--------------------------------- 74 ---------------------------------
DETERMI�A�TS A�D CO�SEQUE�CES
OF LA�GUAGE-I�-EDUCATIO�
POLICIES
Essays in Economics of Education
Christelle Garrouste
Institute of International Education Department of Education Stockholm University
2007

2
© Christelle Garrouste 2007
Institute of International Education
Department of Education
Stockholm University
SE-10691 Stockholm, Sweden
All rights reserved
ISBN 978-91-7155-517-5
ISSN 0348-95-23
Printed in Sweden by
US-AB Print Center, Stockholm 2007

3
To my father

4

5
ABSTRACT
This thesis consists of three empirical studies in economics of education on the determinants and consequences of language-in-education (LiE) policies. The “Environmental settings – Inputs – Processes – Immediate outcomes – Long-term outcomes” (EIPOL) evaluation model is applied to LiE policies and programs and serves as the overall framework of this research (see Introductory Chapter). Each study then targets at least one stage of the EIPOL framework to test the validity of the “green” vs. “free-market” linguistic theories. Whereas the two first studies derive models tested empirically in the African context, the third is tested on a sample of countries from the International Adult Literacy Survey (IALS).
The first study, Rationales to Language-in-Education Policies in Postcolonial Africa:
Towards a Holistic Approach, considers two issues. First, it explores the factors affecting the choice of an LiE policy in 35 African countries. The results show that the countries adopting a unilingual education system put different weights on the influential parameters than countries adopting a bilingual education system and that both groups of countries validate somehow both the “green” and the “free-market” approaches. Second, the article investigates how decision makers can ensure the optimal choice of language(s) of instruction by developing a non-cooperative game theoretic model with network externalities. The model shows that it is never optimal for two countries to become bilingual, or for the majority linguistic group to learn the language of the minority group, unless there is minimum cooperation to ensure an equitable redistribution of payoffs. This finding confirms the “free-market” theory.
The second study, The Role of Language in Learning Achievement: A �amibian Case
Study, investigates the role played by home language and language proficiency on mathematics scores of 5048 Grade-6 learners in 275 Namibian schools, via the second survey data by the Southern and Eastern Africa Consortium for Monitoring Educational Quality (SACMEQ). Hierarchical linear modeling is used to partition the total variance in mathematics achievement into its within- and between-school components. Results of the analysis show that although home language plays a limited role in explaining within- and between-school variations in mathematics achievement, language proficiency, when proxied by reading scores, plays a significant role in the heterogeneity of results. Thus, confirming the role of language skills in learning achievement and so validating the “green” theory. Finally, the third study, Language Skills and Economic Returns, investigates the economic returns to language skills, assuming that language competencies constitute key components of human capital. It presents results from eight countries enrolled in the International Adult Literacy Survey (IALS). The study finds commonalities between countries in terms of the valuing of language skills, independent of the type of language policy applied at the national level. In each of the eight countries compared, skills in a second language are estimated to be a major factor constraining wage opportunities. This study validates the “free-market” theory. Descriptors: Language-in-education policies, decision making analysis, non-cooperative game, language skills, hierarchical linear modeling, human capital theory, rate of return analysis, post-colonial Africa, IALS, SACMEQ ISBN 978-91-7155-517-5 ISSN 0348-95-23

6

7
CO�TE�TS
ABSTRACT…………………………………………………………………………..……5
ACK�OWLEDGEME�TS………………………………………………………………9
I�TRODUCTIO�…………………………………………………………………..........11
STUDY I Rationales to Language-in-Education Policies in Postcolonial Africa:
Towards a Holistic Approach………………………………………...........25
STUDY II The Role of Language in Learning Achievement: A Namibian Case
Study………..……………………………………….……………………..63
STUDY III Language Skills and Economic Returns………….………………………..97
A��EXES ……………………………………………………………………………127
Table A Current language settings of countries in Study I
Table B Current external settings of countries in Study I (economic and
financial dependency)

8

9
ACK�OWLEDGEME�TS
This thesis is the result of a long intellectual and life journey, which started many years
ago when I was still a little girl and was listening to my family’s stories about former
French Indochina and Africa. My need to explore my family’s history and, beyond that, to
understand the tenants and consequences of that significant piece of World’s history that is
colonialism, have motivated me to study fervently international economics and
international relations at university. I was seeking answers to naive questions, such as,
what impact does colonialism still have on former colonies and how can these countries
emerge successfully from that past. During an internship at UNESCO in 2001, I came
across the very specific field of international and comparative education and realized what
powerful tools it could provide me to explore these questions. It became then obvious that
the way national education policies were formulated was not only one of the tenants and
consequences of colonialism, but also one of the keys for former colonies to move forward
from that past.
Consequently, in 2002, I moved to Sweden, Stockholm, and embarked on a long
and exciting PhD journey at the Institute of International Education (IIE). The people met
there have all greatly stimulated me intellectually by their exceptional world culture, field
experience and/or scientific knowledge. The fact that IIE is in the true sense of the word an
international and cross-disciplinary working environment fulfilled all my expectations as a
young and hungry-for-knowledge researcher. The support from Professor Chinapah, who
advised me to apply to IIE, Professor Tuijnman, who was my initial supervisor at IIE, and
Professor Daun, who took over my supervision during the later stages of my thesis, has
enabled me to explore freely all the corners of this topic. Thanks should also be addressed
to Dr. Benson from the Center of Bilingual Studies at Stockholm University and Dr.
Limage from UNESCO for their support and enthusiasm for my topic and feedback on
early drafts of Study I, and Dr. Taylor for proof reading the introduction of this work.
Yet, this work would probably never have been completed without the academic
year spent at Teachers College, Columbia University, in 2004-2005, under the supervision
of Professor Levin. A very special thank goes therefore to Professor Levin and Professor
Steiner-Khamsi for their availability and wise advises, as well as to Professor Garcia and
Professor Rivera-Batiz for fruitful discussions on the whole thesis.

10
The Department of Economics of Stockholm University has also provided me with
econometrics tools that enabled the completion of the empirical studies presented in this
thesis. Moreover, the Marie Curie Fellowship obtained at the Department of Economics of
Padua University has provided me with the final methodological inputs at the very last
stage of this work. Special thanks go to Professor Brunello, Professor Rettore and
Professor Battistin for sharing with me their extended research experience via wise and
constructive comments and suggestions on Study II.
Furthermore, I would like to address my gratitude to all the Government officers,
NEPRU and UNAM researchers, SIDA officers, school headmasters, school inspectors,
teachers and students met during my fieldtrips to Namibia in December 2003 and April-
May 2004 in preparation of Study II. They have all shown great enthusiasm for this project
and provided me with all the support I needed. Thank you all, I will come back!
Special thanks to all my friends in and outside academia all over the world for their
magnificent friendship and support throughout this journey. No need to list any names
here, you recognize yourselves!
Last but not least, I want to dedicate this work to my loving family who has
brought me where I am today, especially my beloved Dad, my Mum and my brother Erik,
but also Massimo who knows how to stimulate my soul and brain like no other and who is
leading me through my next life journey.
Christelle Garrouste
Stockholm, November 2007

11
I�TRODUCTIO�
The dominant monolingual orientation is cultivated in the developed world and
consequently two languages are considered a nuisance, three languages uneconomic and
many languages absurd. In multilingual countries, many languages are facts of life; any
restriction in the choice of language is a nuisance; and one language is not only
uneconomic, it is absurd (Pattanyak, 1984; quoted by Skutnabb-Kangas & Garcia, 1995, p.
221).
1. General Framework of the Thesis
The present thesis builds upon the paradoxical position endorsed by the education sector as
a mediator between two opposite linguistic theoretical approaches. On the one hand, the
“green” theory of ecological protection claims that endangered languages should be
protected by all means respecting linguistic human rights. On the other hand, the “free-
market” theory advocates for a homogenization of the market’s communication tools to
facilitate trade in globalized markets (Kibbee, 2003)1.
It is in this complex ideological environment that education policies have to define
which language(s) should be selected as media of instruction within the classroom.
Answering that question is of course not straightforward since the type of language-in-
education (LiE) policy adopted by a government reflects its social, cultural and economic
ambitions.
The present thesis adopts a holistic approach to the choice of LiE policies by
suggesting the consideration of both the rationales and the consequences of an LiE option
in the decision making process. Such an approach enables the constructive confrontation of
the two theoretical linguistic schools by highlighting their complementarities rather than
their oppositions. More concretely, this thesis opts for the “Environmental settings – Inputs
– Processes – Immediate outcomes – Long-term outcomes” (EIPOL) grid of evaluation
suggested by Bhola (1990). Within this grid, environmental settings aim at providing
information on the settings to be able to make planning decisions; inputs aim at making
programming decisions such as alternative project designs and personnel decisions;
process aims at making decisions related to methodologies and implementation; immediate
1 For more details about the tenants of this debate, see Study III.

12
outcomes cover learning outcomes and other intermediary outcomes of the program; and
long-term outcomes cover the long-term effects of the program on the educational and
socio-economic domains (ibid.).
The environmental settings are here defined according to Lewis’ (1980)
classification in terms of diffusion variables, setting variables and mobility variables and a
distinction is made between private and social outcomes (or benefits) with respect to the
principles of the human capital approach.
As Figure 1 displays, this classification enables the inclusion of all the dimensions
necessary for the evaluation of an LiE policy, and constitutes therefore an ideal structure
for the design of this thesis’ overall conceptual framework. The theoretical assumptions
grounding this framework are presented in each of the three studies compiled for this
thesis: Study I – Rationales to Language-in-Education Policies in Postcolonial Africa:
Towards a Holistic Approach; Study II – The Role of Language in Learning Achievement:
A Namibian Case Study; and Study III – Language Skills and Economic Returns.
Each of the three studies targets specific levels of analysis of this framework. For
instance, Study I targets explicitly the environmental settings, inputs and process levels. In
turn, Study II, by addressing the role of languages in the learning achievement of Namibian
grade-6 pupils, targets the private immediate outcomes dimension. Finally, Study III
targets the social immediate outcomes and long-term private outcomes of the framework.
Environmental
settings
Input
evaluation
Process
evaluation
Immediate
outcomes
Long-term
outcomes
Diffusion variablesInter-country
communication
Setting variablesHistorical,
institutional,
behavioral,
external and
community-type
settings
MobilityvariablesNomadism/seaso
nal migration,
voluntary/involunt
ary migration
Orientation tolanguageAs a problem
As a right
As a resource
IdeologyAssimilation
Pluralism
Separatism
Vernacularization
Internationalization
Language policy
Language planning
Status
Corpus
Acquisition
LiE policy
LiE planningCurriculum
Personnel
Material
Community
Evaluation
Private outcomesCognitive
development
Learning
achievement
Literacy
Private outcomesEco welfare
(wages)
Social outcomesSkilled labor
force
Social outcomesEconomic
growth
Eco welfare
(social rate of
return to
education)
Social welfarea
Figure 1 General Framework of the Thesis
Note: a. Social welfare designates civic involvement, democratic empowerment, social cohesion, etc.

13
2. Aims and Objectives of the Research
The overall objective of this thesis is to investigate the determinants and consequences of
LiE policies in the frame of the theoretical debate opposing the “green” and the “free-
market” theories, to identify which level of evaluation each theory serves best. It is
assumed that neither of the two approaches is sufficient to explain all the levels of
evaluation identified in Figure 1. Rather, it is believed that either approach can be validated
as optimal from a decision-making point of view according to which level of analysis is
identified as the priority by the decision maker.
This potential complementary nature of the two theories is tested by each study
within this thesis. More specifically, each study aims at answering the following questions:
Study I:
A. How much do environmental settings affect the nature of LiE policies in
postcolonial Africa?
A conceptual and theoretical framework is developed based on sociolinguistics literature
and tested empirically on 35 African countries with ordered logistic regression (see Tables
A and B in Annexes). The main hypothesis is that in some countries, internal factors (e.g.,
behavioral, community-type and institutional settings) might have a larger impact on the
number of languages retained as media of instruction than external factors (e.g., financial
and economic dependency, colonial history and openness to external ideologies). If so, the
“green” theory is expected to be validated. In the opposite case of a comparatively stronger
position of external factors the “free-market” is expected to be validated.
B. What is the optimal decision for a LiE policy-maker?
A non-cooperative game with network externalities is developed to inform this issue. The
assumption is that the most optimal LiE policy ranks the language of the majority group
first as the medium of instruction. This implies that the “free-market” theory should be
validated unless a cooperative approach is adopted by the players of the game.
Study II:
A. How much do pupils’ linguistic characteristics affect mathematics
achievement compared to some other individual and structural parameters?

14
A hierarchical linear model (HLM) is developed and tested on Grade-6 Namibian learners,
controlling for within- and between-school variations. In this model, the assumption is that
mathematics achievement is facilitated by language proficiency, which is itself facilitated
by mother-tongue instruction. The “green” theory is therefore expected to be validated by
this model. The data used are all issued from the Namibian SACMEQ II survey but the
modeling process results mainly from non-quantitative observations gathered upon two
short field visits to Namibia in December 2003 and April-May 20042.
Study III:
A. Does proficiency in the official language(s) play a significant role on wages?
B. Are language skills more rewarded in countries applying an official bilingual
policy than in countries applying another type of language policy?
An empirical human capital model is developed to elucidate both questions controlling for
gender and immigration status. The assumptions are, first, that language skills are expected
to have a positive impact on wage opportunities and, second, that the reward of language
skills are higher in countries implementing a bilingual LiE policy. These assumptions are
tested using the International Adult Literacy Survey (IALS) for eight countries. In this last
study, the “green” theory is expected to be validated if wage opportunities are positively
affected by language skills in non-international or dominant languages, and if the second
assumption is true. Otherwise, the “free-market” theory will be validated.
3. Main Findings
Study I’s first model shows that of the 35 countries considered, the countries adopting a
unilingual education system weigh differently the environmental parameters than countries
adopting a bilingual education system. For instance, multilingual policies appear positively
influenced by both external settings and community-type settings, and negatively
influenced by institutional settings and degree of openess.
These results neither validate or invalidate the hypothesis in favor of the ”green” vs.
”free-market” theory, which demonstrates that both theoretical approaches may be of equal
validity when addressing Bhola’s (1990) three first levels of evaluation (i.e. environmental
settings, inputs and process).
2 See acknowledgements in Study II.

15
Study I’s second model confirms the hypothesis in favor of the ”free-market”
theory by demonstrating that it is never optimal for two countries to become bilingual in
one another’s language, or for the majority linguistic group to learn the language of the
minority group, unless there is minimum cooperation to ensure an equitable redistribution
of payoffs.
In turn, Study II suggests that although home language plays a limited role in
explaining within- and between-school variations in Namibian pupils’ mathematics
achievment, language proficiency (proxied by reading scores) plays a significant role at
both levels of analysis, thus supporting the significant role of language in learning
achievement. This study confirms the hypothesis in favor of the ”green” theory.
Finally, Study III reveals commonalities between the eight countries of the sample
in terms of language skills valuying, independent of the type of language policy,
confirming the hypothesis that the higher the second language skills the higher the wage
opportunities. However, this positive effect of language skills on earnings is only observed
for skills in an international or dominant language, which confirms the ”free-market”
theory at the expense of the ”green” theory.
4. Definitions and Delimitations of the Research
Among the terms recurrently used in this study and grounding its raison d’être are
‘language-in-education policy’, ‘bilingual education policy’, ‘bilingual skills’, ‘value’ of
bilingual skills, and ‘literacy’. Although the theoretical background of each concept is
depicted in the following studies, a short definition of each term is presented to avoid any
lexical confusion and to delimitate the scope of the study.
The term ‘language-in-education (LiE) policy’ is, throughout this dissertation, used
to refer to the third element of language planning, named by Cooper (1989) as ‘acquisition
planning’. According to language policy theories, ‘language planning’ corresponds to the
activity – most visibly undertaken by governments because of the massive changes it
involves in a society – that aims at changing the linguistic behavior of a speech
community. On the other hand, ‘language policy’ refers to the “body of ideas, laws,
regulations, rules and practices intended to achieve the planned language change in the
society, group or system” underlying the actual language planning process (Kaplan &

16
Baldauf, 1997, p. xi)3. Language planning consists of three elements: status planning,
corpus planning and acquisition planning. The two first derive from Kloss’ (1969) addition
to Haugen’s (1966) Model of language planning, and the third was later introduced by
Cooper (1989). Kloss (1969) defined corpus planning as concerned with the internal
structure of the language, and status planning as the efforts undertaken to change the use
and function of a language within a given society. Cooper (1989) later added acquisition
planning to cover the efforts to spread and promote the learning of a language. Because
most of these efforts are monitored by the education system, ‘acquisition planning’ is also
called ‘language-in-education policy’ (see Study I for a detailed classification of language
policies and LiE policies).
Note that countries are classified in this work in terms of their ‘official’ LiE policy
with no effort made to verify whether the policy is actually implemented or not. This
delimitation constitutes a limitation, which could have been overcome with a rigorous
qualitative investigation in absence of time or budget constraints. This limitation should be
taken into consideration in the interpretation of the results.
Further, the definition of bilingual education retained for this dissertation (in Study
I and Study III) is the one offered by Fishman (1979), in which, “[i]n very general terms,
bilingual education implies some use of two (or more) languages of instruction in
connection with teaching other than language per se” (p. 12). Consequently, bilingual
education policies are the programs using two or more languages of instruction. A
bilingual person is, in turn, defined as one whose linguistic ability in two languages is
similar to that of a native speaker (Malmkjær, 1991).
Moreover, the concept of value as applied to language competences refers to the
theory of utility-value according to which the value of a good depends on the utility that
consumers estimate the good will provide them. Thus, the utility-value theory defines the
link between the usage value and the exchange value, which is the market price. In the case
of education, the value reflects the objective preferences of the actors for that activity
above other activities, and the price is no more than the translation of these preferences in
monetary terms in the context of scarcity at a given place and time (Grin, 1999, p. 33).
3 “‘Language policy’ may be realized at a number of levels, from very formal language planning documents and pronouncements to informal statement of intend (i.e. the discourse of language, politics and society) which may not at first glance seem like language policies at all. Indeed, …, policy statements tend to fall into two types – symbolic and substantive, where the first articulates good feelings toward change (or perhaps ends up being so nebulous that it is difficult to understand what language specific concepts may be involved), and the latter articulates specific steps to be taken” (Kaplan & Baldauf, 1997, p. xi).

17
The value of language can be given a market or non-market, private or social
equivalent. The private market value of competences in second languages is defined by
wage differentials, which fall to the share of individuals in possession of these
competences. This study is especially interested in net differentials that is, the wage gaps
between individuals that are unequal in terms of their level of possession of linguistic
competences, but similar in terms of age or professional experience. The estimation
methods are presented in Study III. Further, the private non-market value targets the
satisfaction directly felt by the practice of activities enabled by certain language
proficiency. The social market value is the sum of private market values, moderated by
positive or negative externalities. Finally, the social non-market value is the aggregation of
private non-market values collected at the individual level. However, despite the obvious
worth of non-market and social market values, the complexity of the collection of
comparative data on such values compelled this study to limit its analysis solely to market
values of second language competences.
Furthermore, the definition of literacy used in this study is the one adopted by the
IALS, according to which literacy is a mode of adult behavior (see Study III for the
rationale behind this definition). Overall, literacy consists in “[u]sing printed and written
information to function in society, to achieve one’s goals, and to develop one’s knowledge
and potential” (Statistics Canada, 2002, p. 15).
Beyond the above lexical specifications, it is important to mention that the general
complexity embedded in language issues requires from any research on these matters a
certain interdisciplinary research method. In the present case, although the research
questions adhere to the fundamental positivist economic paradigm, references to
sociolinguistic, political, educational and linguistic concepts are judged necessary to
capture the manifold dimensions of the topic. Following Grin’s (1999, p. 3) argument, the
method adopted here is therefore applied interdisciplinarity (or “interdisciplinarity by
articulation” as defined by Coenen-Huther, 1989) rather than methodological
interdisciplinarity (as defined by Wallerstein, 1989; 2004, as part of his world-systems
analysis4).
4 Against the dissection of social phenomena in separate independent academic disciplines, such as politics, economics, sociology, and culture studies, the world-systems analysis claims the need for a holistic historical social science. Originally, the ambition of this perspective was to broaden the loci of analysis in the following way: “World-systems analysis was an attempt to combine coherently concern with the unit of analysis, concern with social temporalities, and concern with the barriers that had been erected between different social science disciplines” (Wallerstein, 2004, p. 16). This implies the analysis of materials from

18
Finally, due to the relatively recent development of the consideration of languages
in economic terms, and hence, the consequent scarcity of empirical demonstrations of its
impact on education, it should be underlined that this study defines itself more as a
tentative and explorative study than as a demonstration of definite or well established
findings.
5. Significance of the Studies
In view of the above delimitations and limitations, the significance of this work lies mainly
in its effort to address LiE policy issues within a holistic and interdisciplinary frame of
analysis at an international comparative level. In so doing, this study hopes to improve
political decision-making and implementation practices at several levels. First of all,
understanding the construct rationales to LiE policies, their outcome in term of learning
achievement, and the status of languages for the international labor market, can provide
necessary information to help policy makers and international donor agencies evaluate LiE
policies in a more holistic, and hence efficient, perspective.
Such contribution falls well into the demands for interdisciplinarity raised by
several sociologists, linguists and sociolinguists, who recommended integrating linguistic
analysis as part of the peoples’ and nation states’ economic, political and cultural
development (Goke-Patriola, 1993; and Mackey, 1992). They hoped this would avoid the
emergence of an educational hegemony built on the exclusive cultural, political and
economic positions of the schools (Apple, 1990; Williams, 1976), which had already led to
the rise of elitist systems, such as described by Bourdieu (1991) in occidental countries,
and witnessed by Goke-Patriola (1993) in postcolonial countries.
Secondly, all the studies of this thesis belong to the broad category of quantitative
multilevel analysis. Studies I and III are classic inter-country analyses and Study II is an
inter-pupil and inter-school analysis. As underlined by Bray & Thomas (1995), the
importance of multilevel analysis for certain types of inquiry is an increasingly recognized
multiple disciplines, for example history, economics, political science or sociology, within a single analytical frame. Therefore, Wallerstein specifies that “The resulting world-systems analysis was not multidisciplinary, since the analysts were not recognizing the intellectual legitimacy of these disciplines. They were being unidisciplinary” (p. 19). Hence, this unidisciplinarity can be understood as resulting much more from a methodological ‘interdisciplinary’ quest than from ‘multidisciplinarity’.

19
fact5. However, they claim that too many studies lack an international dimension or a
multilevel dimension within a national framework. A decade later, this weakness persists
and the present study hopes to overcome these traditionally observed weakness by
attempting to combine different units and levels of analysis in each study. For instance, by
comparing the results of the environmental factors analysis among 35 countries, Study I
adds an international-level to the initial country-level analysis. In turn, Study II
investigates both pupil and school levels within the Namibian framework and Study III
lifts up the traditional human capital return analysis to an international dimension.
Finally, the results of this research have the capacity to challenge the attitudes at
the microeconomic (individuals and firms) and macroeconomic (public) levels towards
language skills. For instance, among the hypotheses6 tested in this work, the validation of
the hypothesis that “the higher the level of bilingual skills, the higher the wages” tested in
Study III has the potential to support private and public efforts to develop competencies in
languages, either through bilingual education policies or other vocational education and
training options, if the environmental settings necessary for their construction and
implementation are gathered. On the other hand, if this hypothesis had been invalidated by
this study it could have led to the questioning of the worth of bilingual education policies
and promoted unilingual education policies7 or even no LiE policy at all. The significance
of this study lies therefore also in its capacity to address the interests of the stakeholders
involved in this debate, namely decision-makers, entrepreneurs, teaching staff and
students.
6. Limitations of the Studies and Recommendations for Further Research
Among the three studies of this thesis, two make use of international educational
achievement or literacy studies: the second survey from the Southern African Consortium
on Monitoring and Evaluation of Education Quality (SACMEQ II survey) is used in Study
5 See, for instance, Burstein (1980; 1988); Cronbach (1976); Goldstein (1987); Raudenbush & Willms (1991). 6 In this dissertation, the terms hypothesis and assumption are used as synonyms. 7 Policies of promotion of the official language, also called ‘unilingualism’, consist in promoting a single language at all levels of the society, i.e. political, legislative, social, economic, educational, etc. They can promote the dominant language, in which case it is the national language when it has acquired the status of official language, or a colonial language of international diffusion. Although these policies only recognize one language, minority languages can still beneficiate from certain linguistic rights (Leclerc, 2006).

20
II; and the International Adult Literacy Survey (IALS) in Study III. It is important to
underscore the limitations of such datasets. As explained by Beaton, Postlethwaite, Ross,
Spearritt & Wolf (1999), such international studies have the advantage of compelling
participating countries to subject their curricula to close scrutiny. They can alert ministries
to differences between their curricula and that of other countries, in terms of emphasis
given to different subject areas for instance. However, the weakness of these studies is the
misinterpretation that may result from such comparisons. Differences among countries do
not necessarily imply any deficiency of curricula, rather the adoption of a particular
curriculum may be justified by the state of development of a country’s education system.
Furthermore, the nature of the variables derived from such surveys does not allow
for in-depth analyses of the tenants of within- and between-countries variations. Hence,
any result should be supplemented by further field study analyses before deriving any
policy recommendations. Besides, as an outsider to the data collection process, the
researcher analyzing these data is subject to ‘ecological fallacy’ [i.e. conclusions drawn
from the erroneous assumption that a relationship established at one level of aggregation
(e.g., among countries) holds at any other level of analysis (e.g., among students within
countries)]. For the same reason, sampling error bias and endogeneity issues are also
common fallacies encountered by empirical works based on such datasets. Rather than
resolving them, the present research has put emphasis in attempting to account for these
issues.
Beyond the general weaknesses embedded in large international survey data, it is
worth emphasizing the limitations suffered by the empirical applications of all three studies
due to lack of data on language background and language skills at an international level.
This lack of data has resulted in the use of challenging proxies which weaken the impact of
the findings. For instance, Study I bases its empirical test solely on data arbitrarily recoded
(see Tables A and B in the Annex section of this thesis for a detailed overview of the
information grounding the computation of the data used in Study I)8; Study II makes use of
a seriously questionable dummy variable to define pupils’ home language status; and, in
absence of informative data, all the studies make the challenging assumption that the
official LiE policies of the sampled countries are actually implemented in all schools.
Similarly, the lack of longitudinal studies at the international level addressing the issues
8 These two tables were removed from the version of Study I submitted to the Economics of Education Review (reproduced in this thesis with authorization from Elsevier) to comply with the format imposed by the journal. They are annexed to this thesis for transparency and clarification reasons.

21
raised in this thesis limited the interpretation scope of the results tremendously. These data
pitfalls need to be addressed by further international survey designers and researchers.
Finally, this research did not include any analysis of the social returns to language
skills nor of the impact of language skills on economic development. These two
dimensions would of course need to be accounted for to complete the holistic evaluation
framework presented in this introduction. Such analyses are therefore strongly
recommended for further research.

22
References
Apple, M.W. (1990). Ideology and Curriculum (2nd ed.). London: Routledge.
Beaton, A. E., Postlethwaite, T. N., Ross, K.N., Spearritt, D., & Wolf, R.M. (1999). The
Benefits and Limitations of International Educational Achievement Studies. Paris:
UNESCO, IIEP.
Bhola, H. S. (1990). Evaluating "Literacy for development" projects, programs and
campaigns: Evaluation planning, design and implementation, and utilization of
evaluation results. Hamburg: UNESCO Institute for Education; DSE [German
Foundation for International Development].
Bourdieu, P. (1991). Language and Symbolic Power. Cambridge: Polity Press.
Bray, M., & Thomas, R.M. (1995). Levels of Comparison in Educational studies :
Different Insights from Different Literatures and the Value of Multilevel Analyses.
Harvard Educational Review, 65(3), 472-490.
Burstein, L. (1980). Analysis of multilevel data in educational research and education. In
D. Berliner (Ed.), Review of research in education, (Vol. 8) (pp.158-233).
Washington, DC: American Educational Research Association.
Burstein, L. (1988). Units of analysis. In J. Keeves (Ed.), Educational research,
methodology and measurement: an international handbook (pp. 775-781). Oxford:
Pergamon Press.
Coenen-Huther, J. (1989). Sociologie et interdisciplinarité: modalités, problèmes,
perspectives. Revue Suisse de Sociologie, 15, 1-13.
Cooper, R. L. (1989). Language Planning and Social Change. Cambridge, UK: Cambridge
University Press.
Cronbach, L. (1976). Research on classrooms and schools: Formulation of questions,
design and analysis (occasional paper). Stanford, CA: Stanford Educational
Consortium.
Fishman, J.A. (1979). Bilingual Education: What ad Why? In H.T. Trueba and C.Barnett-
Mizrahi (Ed.), Bilingual Multicultural Education and the Professional. Rowley, MA:
Newbury House Publishers, pp. 11-19.
Goke-Patriola, A. (1993). The Role of Language in the struggle for Power and Legitimacy
in Africa. African Studies, (Vol. 31). Lewinston: The Edwin Mellen Press.

23
Goldstein, H. (1987). Multilevel models in educational and social research. New York:
Oxford University Press.
Grin, F. (1999). Compétences et récompenses: La valeur des langues en Suisse. Fribourg :
Editions Universitaires Fribourg Suisse.
Haugen, E. (1966). Language Conflict and Language Planning: The Case of Modern
�orwegian. Cambridge: Harvard University Press.
Kaplan, R.B. and Baldauf, R.B. (1997). Language Planning from Practice to Theory.
Multilingual Matters (Series), (Vol. 108).
Kibbee, D.A. (2003). Language Policy and Linguistic Theory. In J. Maurais and M.A.
Morris (Eds.), Languages in a Globalising World. New York: Cambridge University
Press.
Kloss, H. (1969). Research Possibilities on Group Bilingualism: a Report. Quebec:
International Center for Research on Bilingualism.
Leclerc, J. (2006). L’aménagement linguistique dans le monde, Québec : TLFQ, Université
Laval. [URL : http://www.tlfq.ulaval.ca/axl/europe/danemark.htm].
Lewis, E.G. (1980). Bilingualism and Bilingual Education: A Comparative Study.
Albuquerque: University of New Mexico Press.
Mackey, W.F. (1992). Mother tongues, other tongues and link languages: What they mean
in a changing world. Quarterly Review of Education, XXII (1), 41-52.
Malmkjær, K. (1991) Bilingualism and Multilingualism. In K. Malmkjær (Ed.), The
Linguistics Encyclopedia. New York: Routledge.
Pattanyak, D.P. (1984). Language policies in multilingual states. In A. Gonzales (ed.),
Panagani. Language planning, implementation and evaluation. Manila: Linguistic
Society of the Philippines. (Quoted in T. Kutnabb-Kangas and O. Garcia, 1995).
Raudenbush, S.W., and Willms, J.D. (1991). Schools, classrooms and pupils: International
studies of schooling from a multilevel perspective. San Diego: Academic Press.
Skutnabb-Kangas, T. and Garcia, O. (1995). Multilingualism for All – General Principles?
In T., Skutnabb-Kangas (Ed.), Multilingualism for All. Lisse: Swets & Zeitlinger B.V.
Statistics Canada (2002). International Adult Literacy Survey: Microdata User’s Guide.
Ottawa: Statistics Canada.
Trueba, H.T. (1979). Bilingual-education models. In H.T. Trueba and C.Barnett-
Mizrahi (Ed.), Bilingual Multicultural Education and the Professional. (pp. 54-
73). Rowley, MA: Newbury House Publishers.

24
Wallerstein, I. (1989). The Modern World-System III: The Second Era of Great Expansion
of the Capitalist World-Economy, 1730-1840s. San Diego: Academic Press.
Wallerstein, I. (2004). World-Systems Analysis: An Introduction. Durham: Duke
University Press.
Williams, R. (1976). Base and Superstructure in Marxist Cultural Theory. In R. Dale et al.
(Eds.), Schooling and Capitalism: A Sociological Reader. London: Routledge &
Kegan Paul.

25
STUDY I

26

27
Rationales to Language-in-Education Policies in
Postcolonial Africa: Towards a Holistic Approach∗∗∗∗
Christelle Garrouste+
Institute of International Education, Department of Education, Stockholm University,
106 91 Stockholm, Sweden
Abstract
This article considers two issues regarding language-in-education (LiE) policies in
the African postcolonial context. First, it explores the factors affecting the choice of a LiE
policy. In that effort, the literature from the sociolinguistics is reviewed towards the design
of a conceptual and theoretical framework identifying the different influential parameters
on LiE policies. That framework is then tested empirically on 35 African countries. The
results show that the countries adopting a unilingual education system put different weights
on the influential parameters than countries adopting a bilingual education system. Second,
the article investigates how the decision makers can ensure an optimal choice of
language(s) of instruction by developing a non-cooperative game theoretic model with
network externalities. The model shows that it is never optimal for two countries to
become bilingual, or for the majority linguistic group to learn the language of the minority
group, unless there is minimum cooperation to ensure an equitable redistribution of
payoffs.
JEL classification: I21; I28.
Keywords: Educational economics; Efficiency
∗ Submitted to the Economics of Education Review, August 7, 2007. Reproduced with permission from Elsevier. + Corresponding author: Tel: +46-8163208; Fax: +46-8153133; Email address: [email protected] (C. Garrouste).

28
1. Introduction
The globalization of the debate around language policy options emerged at the end
of the Second World War as an indirect consequence of the major economic and social
recession that reached as far as the participating countries’ economic partners and colonial
territories. In the early 1960s, occidental economists – among whom Schultz, Becker,
Mincer, Weisbrod and Denison – started to study the elements affecting the capacity of
production of human beings and their effect on production. Analyzing the quantitative and
qualitative characteristics of a population (e.g., health, migrations, information and
education) as production factors implied incorporating their contribution to economic
growth into a production function. These works led to the theorization of human capital,
which received major echoes in the political occidental world and it became soon
commonly admitted that the pursuit of education leads to individual and national economic
growth. This new approach aroused the interest of governments to analyze the causes of
the human skills deficit characterizing most post-war economies. Consequently, large
literacy assessment surveys were developed, especially in North America, and international
campaigns for universal literacy1 were launched in most developing countries.
These efforts have led to different explanations of human skills deficit, among
which one of the most recurrent is the fact that the education of indigenous peoples and
minorities in large parts of the world has so far been organized in direct contradiction to
our best scientific knowledge of how it should be organized (Skutnabb-Kangas, 2001).
More specifically, the assumption that literacy is limited to a single language is particularly
pernicious, because of its political, social and educational implications (Kaplan & Baldauf,
1997, 146).
In order to understand what motivates most governments around the world to opt
for such language policies, it is important to keep in mind the economic stimuli that lay
behind. Language policy and planning2 is primarily an outgrowth of the positivist
economic and social paradigms which dominated the 1950s and 1960s. As a result, “most
of the motivation for language planning, during its early development as a discipline in the
1 In this context, ‘literacy’ refers to the ability to deal with written text – both to encode and decode it. In other words, literacy consists of the set of skills, required by any given society, of individuals who wish to function above the subsistence level. Unequivocally, the teaching of literacy has passed over time to the professional education sector, whose main function is to ensure the dissemination of an appropriate literacy through the population (Kaplan & Baldauf, 1997: 143-145). 2 Originally designated ‘language engineering’, the discipline emerged as an approach to articulating programs (usually in newly independent ‘developing countries’) for ‘language problems’ solving (Kaplan & Baldauf, 1997, xi).

29
1960s and 1970s, was socio-political and focused on nation building, primarily using the
nineteenth century European model of one state, one language, one culture, regardless of
how inappropriate such a model might have been for the new emerging multilingual
polities” (Kaplan & Baldauf, 1997, 153).
The consequences of this political orientation were dramatic. Nyati-Ramahobo
(1999) argues that the recurrent underachievement that characterizes African education
systems and continues to exclude many children from economic performance ensues from
the use of a foreign language as medium of instruction. In Van Dyken’s (1990) words, “the
[African] continent’s limited literacy is related to the degree to which the mother tongue
has been ignored in favor of the international colonial languages” (Van Dyken, 1990, 40).
Nowadays, it is widely admitted that the adoption and elevation of an African language to
“official status” constitutes a positive step for literacy (Bhola, 1981; Kagan, 1982; Ouane,
1990), identity building, cultural reaffirmation and group identity, thereby for democracy;
and the existence of a positive relationship between literacy in local languages and
economic growth is well recognized. More generally, language is today commonly viewed
as a special commodity necessary for national and international development and
communication (see, for instance, Jernudd, 1981; Baldauf & Jernudd, 1983; Jernudd & Jo,
1985; Swales, 1985; and Kaplan & Baldauf, 1997).
In view of the spectacular evolution that has taken place in the contextual settings
for the decision-making of language planners over the past decades, several African
countries have moved from unilingual planning to multilingual approaches. Yet, still today,
among the 2011 languages (i.e. 30 percent of the world’s languages) counted for the 56
African Nation-States, only 14 have an official status, of which French still dominates in
23 countries, English in 19 countries, Portuguese in 5 countries, and Spanish (including
Canary Islands) in 2 countries (Grimes, 2000; Leclerc, 2006). Hence, in view of the
remaining dominance of colonial languages with official status, the rationales behind this
evolution of choice remain obscure.
This paper aims, therefore, at lifting the shade on the rationales ruling decisions on
language-in-education (LiE) policies in post-colonial Africa. In that effort, this paper
divides this issue into two sub-issues: (1) What are the most influential factors affecting the
decision process of African policy makers? (2) How can a policy maker choose the most
privately and socially optimal subset of languages of instruction?

30
To answer the first question, a conceptual framework is designed building on
findings from sociolinguistics (section 2), which is then tested empirically on 35 African
countries selected on the basis of the availability, reliability and comparability of their data
(section 3). Finally, to answer the second question, a game-theoretical model is developed
(section 4). This paper deviates from previous research mainly by its cross-disciplinary
theoretical and methodological frameworks.
2. Conceptual framework
2.1 Conceptualizing language-in-education (LiE) policies
In order to understand what language-in-education policy embeds it is essential to
understand the terms ‘language planning’ and ‘language policy’. On the one hand,
‘language planning’ is an activity – most visibly undertaken by governments because of
the massive changes it involves in a society – that aims at changing the linguistic behavior
of a speech community. On the other hand, ‘language policy’ refers to the “body of ideas,
laws, regulations, rules and practices intended to achieve the planned language change in
the society, group or system” underlying the actual language planning process (Kaplan &
Baldauf, 1997, xi). Hence, “the exercise of language planning leads to, or is directed by,
the promulgation of a language policy by government (or other authoritative body or
person)” (ibid.).
The term ‘language planning’ includes both structural (‘form’) and contextual
(‘function’) aspects of language planning (Haugen, 1966 and 1983) and differentiates
between ‘corpus planning’ and ‘status planning’ (Kloss, 1969). Whereas corpus planning is
concerned with the internal structure of the language, status planning3, in contrast, refers to
all efforts undertaken to change the use and function of a language (or language variety)
within a given society (Mesthrie, Swann, Deumert & Leap, 2000, 385). More recently, two
additional dimensions of language planning have been identified, namely ‘acquisition
planning’ (Cooper, 1989) and ‘prestige planning’ (Haarmann, 1990). Whereas acquisition
planning covers the efforts to spread and promote the learning of a language mainly
through language-in-education planning, prestige planning is directed towards creating the
favorable psychological background necessary for a sustainable success of the language
3 Usually the term ’status’ is used to mean ’rank’, ’(social) position’ or even ’prestige’. Kloss, however, uses the term as a synonym of ‘function’ or ‘domain’ (Mesthrie et al., 2000, 418).

31
planning activities (Mesthrie et al., 2000). Interested specifically in the use of language as
medium of instruction, i.e. LiE policies, this paper retains ‘acquisition planning’ as the
third dimension of language planning (after corpus and status planning) and deliberately
ignores Haarmann’s prestige planning.
Even if LiE planning takes place at only one level of the language planning process
(i.e. acquisition planning), its efficiency depends on its ability to proceed interdependently
with the other two dimensions of the system (i.e. the corpus and status planning). Hence,
the legitimacy of a LiE planning requires first the existence of a national language planning
and then the adoption of a LiE policy. In return, all decisions taken at the educational level
should be reported to the national language planning organ.
2.2 Rationales to LiE policies
In 1974, Fishman commented on the necessity to add to the language policy
analysis even the most technical aspects of language planning in a social context as “there
are always habits and attitudes and values and loyalties and preferences, not only in the
target populations, but among the planners themselves” (Fishman, 1974, 19). Fishman’s
(1974) argument is supported by many critical linguists, such as Garvin (1974) and Joseph
& Taylor (1990), for whom language issues can not be addressed without considering their
relationship with power and ideology. Hence, because language planning process is
affected by social variables such as attitudes, power and authority relationships, as well as
ideologies, a language policy should integrate factors such as the viability, historical
presence, geographic importance and demographic and political status of the language(s)
involved. Indeed, as Mackey (1992) stresses, the making of a language policy is not a mere
academic exercise, but more often a practical response to social, economic and political
pressures.
In his analysis of the relationship between hegemony and curriculum, and referring
to Williams (1976), Apple (1990) explains that the interrelationship between all these
variables is related to the existence of a strong hegemonic power in all educational
policies. Schools do not only process people, they process knowledge as well4. They act as
agents of cultural and ideological hegemony, in Williams’ words, as agents of ‘selective
tradition’ and of ‘cultural incorporation’, helping to create people with the meanings and
4 This idea has been defended by most British sociologists. See, for instance, Young (1971).

32
values required by the economic environment. As a consequence, the socially ‘legitimate’
knowledge taught in schools depends on the school’s cultural, political and economic
position (Apple, 1990, 6-7). Applied to language-in-education, this hypothesis can be
illustrated by the sustainable relative power of colonial languages in African education in
favor of the promulgation of elite status.
As Goke-Patriola (1993) highlights in the context of post-colonial states in Africa,
“one of the things which educational systems do is to define the ‘legitimate language’” and
as a consequence “all other varieties of speech are subject to sanctions which are either
externally imposed (by the authorities and the reality of the market, for example) or they
are self-imposed” (p. 97). This can be explained by what Bourdieu (1991) refers to as ‘the
laws of the transmission of linguistic capital’, which have the following consequences:
As a linguistic market strictly subject to the verdicts of the guardians of legitimate culture, the
educational market is strictly dominated by the linguistic products of the dominant class and tends to
sanction the pre-existing differences in capital. The combined effect of low cultural capital and the
associated low propensity to increase it through educational investment condemns the least favored
classes to the negative sanctions of the scholastic market, i.e. exclusion or early self-exclusion induced
by lack of success… those least inclined and least able to accept and adopt the language of the school
are also exposed for the shortest time to this language and to educational monitoring, correction and
sanction (Bourdieu, 1991, 62).
In addition to this internal hegemony, Goke-Patriola (1993) highlights the influence
of external hegemony and power in African societies, characterized by economic, cultural
and psychological dependency on foreign culture and powers. This external dependency is
largely favored by the inherited educational systems and their LiE policies.
Alongside this global understanding of the construct of LiE policies, Lewis (1980)
explains that the significance of bilingualism and bilingual education5 is determined by its
relation to the ‘total structure’ of political, economic and religious institutions. Within this
total social structure, differences in language can occur, led by, or leading to, a complex
system of heterogeneities in the formulation of bilingualism and the implementation of LiE
policies. Lewis (1980) identifies the nature of linguistic heterogeneity using the following
sets of variables: 1) diffusion variables, 2) setting variables, and 3) mobility variables (see
Figure 1).
5 If we understand bilingual education as the use of two or more languages as media of instruction, then bilingualism and multilingualism become synonymous. This amalgam is used throughout this paper.

33
This classification has the advantage of covering all the factors and dimensions
highlighted by the literature reviewed above. By weighting each set of variables for a
sample of ten countries applying official bilingual education programs, Lewis’ (1980)
study was the first of its kind to offer an international comparative picture of the
determinants of bilingual education policies. In this paper we adapt this classification to
any type of LiE policy.
The combination of all these environmental settings influences the choice of
language policy and in turn, of LiE policy, which can range from multilingual education
programs to unilingual education programs (see Figure 2 for a classification of language
policies and corresponding LiE programs based on the definitions by Leclerc, 2006;
Trueba, 1979; and Skutnabb-Kangas & Garcia, 1995). Whereas unilingual education
programs consist in the use of one single language as medium of instruction, usually the
national language or majority language, multilingual education programs imply the use of
two (or more) languages of instruction in connection with teaching other than language per
se (Fishman, 1979).
Figure 1 summarizes these contributions into a concept map6 serving as a reference
framework within which the findings of the present investigation will be examined,
quantified and interpreted. The inter-concept relationships are ruled by the sociolinguistic
theories presented in this section. Figures 1 and 2 show that the environmental settings
defined by Lewis (1980) have an impact on the nature of the language policy which in turn
defines the LiE policy. The LiE policy can then be implemented by bilingual or unilingual
programs according to the orientation of the language policy. The environmental settings
are composed of three sets of variables: (1) diffusion variables; (2) setting variables
(composed of behavioral, external, community-type, institutional and historical settings);
and (3) mobility variables.
The first set of variables is ‘diffusion variables’, which refers to the influence of
international practices on the provision of bilingual education in a given country. Although
Lewis (1980) defines diffusion variables in terms of increase of inter-nation
communication, he does not specify the nature of these diffusion variables. Therefore, in
the current study, we choose to define Lewis’ concept of ‘diffusion’ as a synonym of
policy borrowing or lending. In her book The Global Politics of Educational Borrowing
6 This concept map was designed using CmapTools, which is a software environment developed by the Institute for Human and Machine Cognition (IHMC).

34
and Lending, Steiner-Khamsi (2004) alongside other educationalists analyzes the effects of
globalization on education in terms of ‘borrowing’ and ‘lending’ of education policies. She
defines the concept of ‘borrowing’ as “what can be learned and imported from elsewhere”
and the concept of ‘lending’ as “what can be taught and exported to elsewhere” (ibid, 1-2).
In this context, diffusion can be understood in terms of degree of openness to new political
inputs. A proxy indicator of such openness is the Index of Economic Freedom which takes
into account ten different types of freedoms ranging from trade freedom to investment
freedom. If a country presents a high degree of freedom then we assume that its openness
for import or export of education policies will be high.
The second set of variables identified by Lewis (1980) targets the ‘settings’ of
bilingual education policies, i.e. the historical, institutional, behavioral, external, and
community-type settings. These ‘settings’ embody “the differences in the immediate
context of the provision of bilingual education in different countries or for different ethnic
groups within a single country” (ibid., 6). More specifically, historical settings can be
determined by the study of historical antecedents such as colonization. They help
identifying the chances of national acceptability of any kind of bilingual education among
succeeding generations. Moreover, institutional settings cover the rules and measures
developed by political institutions to guarantee the implementation of bilingual education.
Here, we adapt this definition to the needs of our study by measuring institutional settings
in terms of the relevance of the languages chosen for instruction to the needs of the labor
market, where the more common languages between the education sector and the labor
market the more positive the expected effect of the institutional settings. Furthermore,
behavioral settings reflect the way in which systems behave towards target groups of
bilingual education, rather than the way in which students, teachers, or parents, behave. For
instance, Lewis shows that a comparative study may reveal whether causal relations exist
between the demand for bilingual education (emphasizing the vernacular) and levels of
economic advance and types of educational philosophy adhered to. He shows that in the
case of the United States economic advances are correlated to the homogenization of
education systems, including the homogenization of LiE policies. In the African context,
however, this type of homogenization has proven to be instead correlated to the colonial
era, which is not a sign of economic development. Therefore, we decide instead to
understand behavioral settings as the efforts made by the African authorities to implement
bilingual programs that incorporate mother-tongue instruction. In turn, external settings

35
have to do with a country’s relationship with other states, far and near. For instance,
external settings include commercial and financial dependency towards other states. Then,
community-type settings characterize the type of bilingual community for which bilingual
education is thought desirable, with an emphasis on geographical situation (isolated
communities, enclaves, bounded communities, and segregated communities). However, in
this paper, we define community-type in terms of scope of applicability of the LiE policy
(for all vs. for a specific group).
Finally, the third and last set of variables identified by Lewis (1980) is ‘mobility
variables’, which depict movements within and across linguistic, ethnic and national
boundaries. Movements can be classified into two main types according to their within or
across national boundaries nature: nomadism and seasonal migration or commuting, and
voluntary vs. involuntary migration. All these types of migrations may have different
effects on the nature of languages (i.e. corpus planning) and language needs (i.e. status and
acquisition planning). However, Lewis added this category in the context of occidental
countries. In the African context, it does not bring in anything specific, since all the
countries have been similarly positively influenced by such flows of populations. We,
therefore, treat this parameter as a constant and not as an explicative variable.
The objective of this section was to review the contributions of the sociolinguistics
to our research question. What emerged from this review is the fact that sociolinguistics
provides specifically strong insights into the influence of a combination of pedagogical
rationales and powerful contextual social, economic and political forces on decisions about
medium of instruction (Tollefson & Tsui, 2004). Nevertheless, sociolinguistics could not
provide for deeper analysis of the explicit mechanisms characterizing the identified
relationships. The methodological tools necessary for such inquiry (i.e. for the
quantification of the above mechanisms) are instead to be found in the positivist economic
paradigm.
3. How much do environmental settings affect the nature of LiE policies in
postcolonial Africa?
This section aims at quantifying the relationships identified in Figure 1. In that
effort, 35 African countries have been selected based on the availability, reliability and
comparability of their data. These countries are Angola, Benin, Botswana, Burkina Faso,

36
Burundi, Cameroon, Central Africa (Republic of), Congo-Brazzaville, Congo-Kinshasa,
Cote d’Ivoire, Egypt, Gabon, Gambia, Ghana, Guinea-Bissau, Kenya, Lesotho, Libya,
Mali, Mauritania, Morocco, Mozambique, Namibia, Niger, Nigeria, Rwanda, Senegal,
Sierra Leona, Swaziland, Tanzania, Togo, Tunisia, South Africa, Zambia, and Zimbabwe.
The empirical model estimates an ordered logistic regression, where the
independent variable is the type of LiE policy adopted, defined as four categories: 0.
unilingual policy; 1. bilingual (excluding mother-tongue instruction); 2. bilingual
(including mother-tongue instruction); 3. trilingual. This formulation gives equal weight to
all categories. It orders the different types of LiE policies from the weakest to the strongest
category of multilingual policies (see Trueba, 1979 and Skutnabb-Kangas & Garcia’s,
1995, classifications of multilingual programs presented in Figure 2).
The explanatory variables are defined as follows7:
� L is a count of the number of languages that the schools can officially choose among as
media of instruction.
� E measures the external settings, i.e. a country’s relationship with other states, far or
near. It is defined as the proportion of linguistic commonalities with the exportation
and importation main partners, and the main bilateral donor. Here, we assume all the
languages to have the same weight. The linguistic commonality takes values ranging
between 1, when all the languages of instruction are common to the languages of the
main export partner (or main import partner or main bilateral donor), and 0 if none of
the languages of instruction is common to any of the languages of the main partner.
� C is the community-type settings, i.e. the type of language ideology applied, namely
pluralism, vernacularization, assimilation, separatism or internationalization (see
previous section). It takes the value of 1 if it is designed to cover the whole school
population (e.g., assimilation/integrative approach) and 0 if it only targets a distinctive
community or a non-compulsory level of education (e.g., separatism approach, such as
Apartheid).
� I covers the institutional settings, i.e. the rules and measures developed by political
institutions to guarantee the implementation of bilingual education. It is defined as the
proportion of languages taught in school that are common to the languages spoken on
the labor market. This variable is used as a proxy of the capacity of the LiE policy to
respond to the linguistic needs of the labor market. The value of I ranges between 1, if
7 See Annexes A and B for a detailed outline of the sources of computation of these variables.

37
all the labor market languages are taught in school, and 0, if none of the languages of
the labor market are offered by the education system.
� H refers to the historical settings, i.e. the colonial influence on the LiE policies. It is
defined as the portion of colonial languages in the total number of languages of
instruction defined in the LiE policy.
� D measures the diffusion variables, i.e. the influence of external practices on the
provision of a type of LiE policy. This parameter is measured by the 2006 Index of
Economic Freedom, which measures and ranks 161 countries based on their overall
percentage of freedom calculated across 10 specific freedoms equally weighted. These
freedoms are business freedom, trade freedom, monetary freedom, freedom from
government, fiscal freedom, property rights, investment freedom, freedom from
corruption and labor freedom. This index is a good proxy of the degree of openness of
a country to new ideas and practices8.
From our theoretical framework, we expect a negative sign for the L, I, H and D
estimates and a positive sign for E and C. In other words, we expect that the higher the
weight of L, I, H and D the higher the probability that the country will opt for a unilingual
policy; and reciprocally, the higher the weight of E and C the higher the probability for the
implementation of a multilingual policy.
Among the thirty-five countries of our sample, ten are Francophone unilingual9, six
are English-speaking unilingual10, four are Arabic-speaking unilingual11, three are
Lusophone unilingual12, one is solely Francophone and English-speaking13, one is solely
Francophone and Arabic-speaking14, six are bilingual in English and a national language15,
two are bilingual in French and a national language16 and two are trilingual (in at least 1
8 For more details about the computation of the Index of economic Freedom see http://www.heritage.org/index/ 9 The 10 Francophone unilingual countries of the sample are Benin, Burkina Faso, Congo-Brazzaville, Congo-Kinshasa, Cote d’Ivoire, Gabon, Mali, Niger, Senegal and Togo. 10 The 6 English-speaking unilingual countries of the sample are Botswana, Gambia, Ghana, Nigeria, Sierra Leona, Zambia. 11 The 4 Arab-speaking unilingual countries of the sample are Egypt, Libya, Morocco and Tunisia. 12 The 3 Lusophone unilingual countries of the sample are Angola, Guinea-Bissau and Mozambique. 13 The only solely Francophone and English-speaking country of the sample is Cameroon. 14 The only solely Francophone and Arab-speaking country of the sample is Mauritania. 15 The 6 countries bilingual in English and a national language are Kenya, Lesotho, Namibia, South Africa, Swaziland and Tanzania. 16 The 2 countries bilingual in French and a national language are Burundi and Central Africa.

38
national language)17. The gathered information is coded using the principles for each
parameter outlined above and displayed in Table 1. The data sources used to compute
Table 1 are the CIA (2006) World Fact Book, Leclerc’s (2006) online dataset on language
policies across the world, the OECD (2006) statistics on Gross Bilateral ODA, the WTO’s
statistics on bilateral trade from March 2006 and the 2006 Index of Economic Freedom by
the Heritage Foundation & the Wall Street Journal, as well as consultations of official
documents in all the sampled countries.
Table 2 presents the sample means and Table 3 shows the results of the estimated
ordered logistic model (complete and reduced forms).
In the complete model, which includes all the above defined variables, the variable
H (historical settings) appeared non-significant. A test for collinearity revealed it to be
highly negatively correlated with the community-type settings C (r = -.5815). After testing
for different specifications of the model, the exclusion of the H variable from the
regression proved to be the only option to improve the fit of the model as a whole.
Therefore, the historical settings H are thereafter assumed to be partly embedded in the
community-type settings C.
In the reduced model (which excludes H), all estimates present the expected sign.
For instance, for a one unit increase in E, the expected ordered log odds increases by 6.07
as we move to the next higher category of LiE policy. For one unit increase in C, we
expect a 4.42 increase in the expected log odds as we move to the next higher category of
LiE policy. Whereas E and C appear strongly significant statistically (at the .05 and 0.1
levels respectively), there is no statistically significant effect of L, I and D (which is
actually not surprising given the extremely small size of our sample).
Nevertheless, the likelihood ratio chi-square of 19.68 with a p-value of .0014 tells
us that our model as a whole is statistically significant. Moreover, the tests conducted on
the proportional odds assumption, namely the likelihood ratio test and the Brant test, both
confirm that our model does not violate the proportional odds assumption; and the robust
test applied to test for the presence of heteroskedasticity also confirmed the absence of
correlation between the error term and the explanatory variables.
Hence, what comes out from this analysis is that Lewis’ framework (or at least, our
arbitrary numerical interpretation of it) appears suitable to explain the contextual factors
influencing the choice between different types of LiE policy in post-colonial Africa.
17 The 2 trilingual countries are Rwanda and Zimbabwe.

39
According to this model, “unilingual” countries may justify their choice by either a strong
inclination for a separatist language ideology (C); low initial linguistic commonalities with
their main external economic or financial partner (E), strong degree of influence from
external ideologies and practices (D), which corresponds to a high inclination to policy
borrowing; perfect institutional settings (I) with the same language being taught at school
and used on the labor market; or a too high number of official languages to choose between
as media of instruction (L).
The opposite set of explanations applies to “multilingual” countries, who may
justify their choice by either a strong inclination to the vernacularization of languages (C);
high initial linguistic commonalities with their main external economic or financial partner
(E), low degree of influence from external ideologies and practices (D), which corresponds
to a low inclination to policy borrowing; weak institutional settings (I) with the need to
improve the adequacy between the languages being taught at school and the languages
used on the labor market; or a reasonably low number of official languages to choose
between as media of instruction (L).
All the above results can partly be indirectly imputed to the distribution of
countries within each group, with a majority of English-speaking countries among the
bilingual countries, and all Lusophone and Arabic-speaking and most Francophone
countries among unilingual countries. The English-speaking countries are still influenced
by the British colonial education system, which privileged bilingual mother-tongue
instruction. At independence, English-speaking countries opted therefore for a
democratization of the learning of English to the whole population and kept the teaching of
the mother tongues (which also explains the high weight of the community-type settings
C). On the contrary, the French and Portuguese colonial policies privileged unilingual
education systems with instruction exclusively in the colonial language18. The remaining
unilingualism of these countries is therefore also an indirect heritage of the colonial era but
with opposite consequences as for former British colonies.
Finally, all the results presented here should be taken with cautiousness because of
the exploratory nature of this empirical application, which implies questionable definitions
of the estimated parameters. The most explicit example is the use of the Index of Economic
Freedom as a poor proxy of degree of openness to new ideas and practices. Because
18 See Gifford & Louis, 1971; Kelly, 2000; and Lin & Martin, 2005, for an extended overview of colonial and postcolonial education in Africa.

40
specification errors in the parameters may increase the risk for collinearity and endogeneity
which may bias the results, further research should attempt to improve the definition of
these parameters.
Hence, by providing some exploratory insights on the role played by environmental
settings on the number of potential languages of instruction and thereby on the type of LiE
policy (e.g., unilingualism vs. bilingualism), the model tested in this section answered
partially the question of which factors may affect the LiE policies in postcolonial Africa
but it did not tell us whether or not the decision taken was rational. It is, therefore, now
important to find out which combination of languages, i.e. which LiE policy, would
theoretically produce an optimal outcome to the community. This second question is
answered in the next section.
4. What is the optimal decision for a LiE policy-maker?
This section is concerned with how a LiE policy-maker can select the languages of
instruction that will optimize the utility of its community. A non-cooperative game with
network externalities is developed as a suggestive option to answer this issue. We rely
mainly upon the works by Selten & Pool (1991), Church & King (1993) and Dalmazzone
(1999) who explored the concept of network externalities and how it applies to public
investments in language knowledge and language learning. More specifically, it relies
upon Selten & Pool’s (1991) game equilibrium of the distribution of foreign language
skills, as well as Church & King’s (1993) game-theoretical model of bilingualism and
network externalities and Dalmazzone’s (1999) discussion of the use and usefulness of
network externalities to address second language (i.e. any language additional to the
mother-tongue) issues.
4.1 �etwork externalities approach
Dalmazzone (1999) explains that, in the specific context of languages, the network
externalities approach builds on the assumption that the ‘user-value’ of belonging to a
given linguistic group increases with the size of the group itself. Hence, learning a
language means becoming part of a network, that is “a community made up of
complementary components in which every new entrant, besides gaining access to the

41
benefits of a set of services, also adds to the potential benefits of all other members (i.e.,
generates an external effect)” (Dalmazzone, 1999, 63).
The external effects can be both direct and indirect. The direct external effect is the
communication value associated with a language, when it is used to serve as an interface in
the largest possible number of potential interactions. Indeed, in order to benefit from the
knowledge in a language, one needs to interact with at least one other person who knows
that language. In a community of n individuals speaking the same language, there are n(n-
1) potential binary interactions. Further, an additional (n+1)th individual speaking the
same language would yield direct benefits to all others by adding 2n potential new
interactions. This means that once a language has acquired an advantage over other
potential alternatives, its comparative advantage tends to become greater and greater (e.g.,
this is the case of English, which is now the most commonly studied foreign language and
the most used language of commerce, communication and information storage19).
In addition to this direct effect, an additional member of a linguistic group can also
provide an indirect benefit to other members by increasing the demand for language-
sensitive goods and services (schools, libraries, bookstores, broadcasting, theatre,
productions, etc.) and thereby, if economies of scale are present, improving the supply and
possibly the variety of such services within the community. Although it is generally
assumed that externalities associated to a network are positive, they can become negative
when the exposure of a small country to a larger linguistic community’s culture and
ideologies leads to the loss of its indigenous culture and set of beliefs. In this particular
case, not belonging to the linguistic network would be more beneficial since it would
provide that country with a natural protection against cultural colonization and other
unwanted foreign mass cultural products.
An important point highlighted by Dalmazzone (1999) is the fact that the number
of speakers alone is not necessarily the only, nor always the most, fundamental factor in
determining the communication value of a language. Rather, it is important to take into
account factors such as the variety of the potential interactions, the particular purpose or
job for which the language is to be used, the geographic and economic position of a
country, etc.
19 English counts 397 million secondary speakers, and 70 percent of the world’s mail and about 80 percent of all information stored in data banks are estimated to be in English (Dalmazzone, 1999).

42
Selten & Pool’s (1991) predictive model of some general features of distributions
of non-native20 language skills demonstrates the role played by the size of a language
community in determining the strategic choice to learn a foreign language. Their model
defines the learning costs, communicative benefit and payoffs at individual, group and
aggregated levels. Finally, they provide a proof of the existence of equilibrium points for
every aggregated game. This very theoretical work is a solid input in the research on
language acquisition as a network externality game.
Finally, building on Selten & Pool (1991), Church & King (1993) derived a formal
proof that the private optimum of foreign language learning and the collective optimum
may not coincide21 by applying conclusions reached by the literature on network
externalities to problems of language. Their result implies that the maximization of
collective welfare, in the presence of externalities in a language market, requires collective
institutions capable of internalizing the externality (i.e. capable of correcting the
inefficiencies in the aggregated result of individual choices) (Dalmazzone, 1999). In other
terms, languages are public goods and require LiE policies to maximize their utility.
In his analysis of knowledge as a global public good, Stiglitz (2006) insists on two
critical properties of public goods: non-rivalrous consumption and non-exclusivity. Non-
rivalrous consumption occurs when the consumption of one individual does not detract
from that of another (i.e. the marginal cost of usage is zero), and non-exclusivity means
that it is difficult, if not impossible, to exclude an individual from enjoying the good. It is
easy to see how the knowledge of languages satisfies both attributes: if I teach you a
language, I continue to enjoy (even more) the knowledge of the language at the same time
as you; and, by the same token, once the language is accessible for learning in all schools,
anyone can enjoy the language, i.e. no one can be excluded, so everyone might want to
enjoy it. Hence, the central public policy implication of public goods is that the state must
play some role in the provision of such goods to make sure they will not become
undersupplied. One way of financing this type of investment is by charging a monopoly
price on the language. Carr (1985) was the first to defend this idea that the market of
languages is similar to a natural monopoly.
20 The terminology “native” versus “non-native” languages is used by Selten & Pool (1991) to designate “mother-tongues” versus “foreign languages”. 21 Whereas the private optimum results from the uncoordinated investments of individuals maximizing their own utility, the collective optimum maximizes total social welfare (see Church & King, 1993, for further details).

43
Dalmazzone (1999) builds upon this monopoly assumption and highlights that the
presence of positive effects related to network size can give rise to a “critical mass”, which
corresponds to a minimum size for a linguistic group, relative to the whole population,
necessary to be sustained in equilibrium. Hence, minority languages of small populations
can easily be assimilated if they are not effectively protected, because the return on a
human capital investment in these languages is perceived as low, ceteris paribus (“all other
things being equal”), relative to the yield on other languages. Conversely, once diffusion
has reached a given level, further expansion may be self-sustaining.
This theoretical hypothesis seems to fit rather well the context of selection and use
of African languages, which appear to have been successful only when the given languages
were spoken by large numbers of people. Swahili has been successfully used in Tanzania
and Kenya. Similarly, Hausa, which is spoken by more than 8 million people in Nigeria, is
serving both the purposes of literacy and national integration at least in the northern parts
of Nigeria and in neighboring Niger (Ntiri, 1993, 363). Moreover, the decision to adopt an
African language for an educational purpose is often not based on the mother tongue
criterion (how large a number of people speak the language as a mother tongue) but on the
community language criterion (the function of the language as the dominant means of
communication in a certain area of the country), which refers to the network externalities
approach. In this context, there are about 159 languages identified as community languages
that serve the purposes of general communication over fairly wide areas within countries in
Africa (UNESCO/BREDA, 1985, 10). Twenty-three of these are shared community
languages, that is, they are spoken in more than two countries. For example, Fulfulde is
spoken in 10 countries and Kiswahili and Malinke in six. Monolingualism in an African
language is reported for only seven countries, namely: Cape Verde, Comores, Lesotho, the
Seychelles, Somalia, Swaziland and Madagascar. All others adopt more than one African
language for educational purposes (ibid, 13).
Dalmazzone (1999) summarizes the prerequisites for efficient public intervention
in the provision of public goods that embed complex systems, such as culture, traditions
and languages, by referring to Arthur’s (1988) four generic conditions: (1) large set-up or
fixed costs; (2) learning effects; (3) coordination effects; and (4) adaptive expectations.
Whereas large set-up and fixed costs such as those associated with the investment
necessary to the maintenance and development of a modern language give the advantage of
falling unit costs as the size of the speech community expands, learning effects improve

44
the efficiency of investments in language capital, provision of language-related services
and, more generally, activities meant to promote a language diffusion and export.
Moreover, coordination effects refer to the advantages associated with undertaking actions
and making choices synergetic to those of the other individuals in the same environment.
These effects result from the application of cooperative games, i.e. “the formation of
coalitions in which participants must work together to maximize a payoff, which will later
be divided among members” (Cornes & Sandler, 1996, 18)22. Finally, adaptive
expectations account for the fact that the increased prevalence of a language enhances
beliefs of further prevalence.
From Selten & Pool’s (1991) and Church & King’s (1993)23 game-theoretic models
of bilingual education policies we know that if the available policy instruments affect all
members of a language group homogeneously, then policies that effectively subsidize
language acquisition are warranted only for the majority language (i.e. the language with
the largest number of speakers). The analysis run in the previous section verifies this
assumption (see effect of C = 1 on logLiE). Hence, we expect that the belonging to a large
linguistic network will be more prized than the willingness to give equal status to all
languages independently of the size of the linguistic population.
This supports as well what Dalmazzone (1999) explains with regard to the potential
negative nature of network externalities, that is that the belonging to networks has a
negative impact on the survival of endogenous languages in the formulation of national
LiE policies. Again, this is confirmed by the analysis run in previous section where the
languages of instructions are often the same as the languages of the former colonial power,
or trade partner or donor partner. African countries tend to opt for bilingual education
systems mainly to support/facilitate the learning of a colonial language or international
trade language24. For instance, among the few bilingual Francophone countries, only one is
bilingual in a national language, namely Burundi. All the others are bilingual in French and
English or French and Arabic, which are all international languages.
22 Although pure public goods are often associated with non-cooperative games, it is expected that the repetition of plays of the games might elicit the cooperative strategy as players see that cooperation will augment everyone’s payoffs when compared with non-cooperation (see Prisoners’ Dilemma) (Cornes & Sandler, 1996). 23 We strongly recommend the reading of Selten & Pool’s (1991) and Church & King’s (1993) respective article for an appreciation of the game-theoretic models they have developed and upon which this study relies. 24 As shown in Table 2A, whenever used, mother-tongue instruction is merely used in pre-primary education and first cycle of primary education before transiting to a colonial or international language.

45
Hence, the high weight put on colonial and trade networks confirms Selten &
Pool’s (1991), Church & King’s (1993) and Dalmazzone’s (1999) common hypothesis that
the incentive to learn a language increases with the size of the network.
4.2 The model
Based on the theoretical principles of the public goods’ network externalities
approach presented above, this paper proposes to develop a non-cooperative game model
describing how an African policy-maker can choose optimally the languages of instruction
in schools depending on the strategy adopted by the other policy-makers, e.g., former
colonial powers, trade partners, main foreign investors and bilateral donors.
From Selten & Pool’s (1991) model, we keep three important assumptions: (1) we
impose no limit on the number of languages in existence; (2) we assume that there is a
positive number of languages in the world; and (3) we treat as fixed the distribution of
native languages, assuming that everyone has one and only one native language25. These
restrictions allow Selten & Pool to partition the world population into communities, each
community consisting of the native speakers of a particular language.
However, whereas Selten & Pool and Church & King assume that a member of
language community i always learns language i and has no choice in this respect (which
delimitates their analysis to second language acquisition), our model assumes that the
learning of language i is conditioned by the individual strategy (hence, it is not obvious).
This assumption is necessary to reflect the reality in African countries where individuals
are not necessarily taught in their native language (see results from previous section in that
matter). Therefore, our model aims at broadening the scope of Selten & Pool’s and Church
& King’s studies.
The game takes place in a world with m languages, 1, …, m. Every individual has
one and only one of these languages as his native language. He is a native speaker of that
language. Every language other than an individual’s native language is a foreign language
for that individual. Let M be the set {1, …, m} of all languages. All languages are perfect
substitutes. This assumption was applied by Church & King (1993) to overcome the
25 In addition to the three assumptions presented here, Selten & Pool (1991) also identify a fourth assumption, namely they permit languages with native speakers and languages without native speakers to exist. Although this assumption may be justified by attempts to create non-native languages such as “Esperanto” to play the role of international lingua franca, no such language actively belongs today to the languages of the world (see Grimes, 2000). This assumption has therefore no rationality in our model.

46
difficulties raised by the fact that some languages may be more efficient communicative
media than others and that some languages might beneficiate from particular intrinsic
value. Here, “no one cares if one language disappears, and no one prefers communicating
in one language rather than in an other” (ibid, 343)26.
The set of all individuals with native language i is the community i. Each language
community i is described as a continuum of individuals represented as points in an interval
[i, i + ia ], with ia > 0. Each member of the ith community is identified with a number s
such that ii s i a≤ ≤ + . The measure of all individuals is normalized to 1:
(2.1) 1
1m
i
i
a=
=∑ .
We call ia the size of language community i. The players of the game are the
members of the language communities 1, …, m. Geometrically, the world community can
therefore be represented as a set of m line segments, where m is the number of
communities. The ith community is represented as a line segment from i to i + ia . Figure 3
replicates the example given by Selten & Pool (1991) of such a geometric representation
for a world of four communities. The sum of the lengths of the four line segments is 1.
Each individual must know at least one language to be able to communicate with
others. We assume that all members of the language communities are identical except for
their language endowment27. Each player can choose between three pure strategies. He/she
can learn his/her native language (i.e. mother-tongue) at a learning cost ic and remain
unilingual. He/she can learn a non-native language (i.e. foreign language) at a cost jc
(where j is any other language than i) or decide to learn both his/her native language and a
non-native language (and thereby become bilingual) at a cost i jc + , where i jc c< and
i j i jc c c+ = + . The benefit of language i is a function of the size of the community i, ia and
the cost of learning a language is a function of the degree to which the language learnt is
26 For analyses not treating languages as perfect substitutes, see Marschak (1965), Sabourin (1985) and Grin (1992). 27 Church & King (1993) use this assumption.

47
different from the native language28. Hence, the cost of learning the native language (or
mother tongue) will be assumed to tend towards null and the cost of learning a foreign
language to tend towards 1.
A member is obtains utility ( )iv a if he learns only his native language i, ( )jv a if
he learns only a foreign language j and ( )i jv a a+ if he learns both his native language and
a foreign language j. It is the fact that we assume that the utility of each member increases
with the size of the community, i.e. v’ > 0, that creates the existence of the network
externality underlying this model. Hence, the payoff of is associated with learning a
language is affected by the learning decisions of all other individuals, including the
member of his own community i.
To solve the equilibrium of this game let us fix the number of world languages to
two, i.e. 2m = . Hence, a member 1s obtains utility 1( )v a if he learns only language 1 (i.e.
his mother tongue), 2( )v a if he learns only language 2 and 1 2( )v a a+ if he learns both
languages.
4.3 Equilibrium
By assuming that no agent learns unless there is a strictly positive net benefit from
doing so, we can formulate the best-response functions as the following decision rules:
(2.2a) any member 1s learns language 1 iff 1 2 2 1ˆ( ) ( )v a v a a c− + > ;
(2.2b) any member 1s learns language 2 iff 2 1 1 2ˆ( ) ( )v a v a a c− + > ;
(2.2c) any member 1s learns languages 1 and 2
iff 1 2 1 1 1 2ˆ( ) ( )v a a v a a c c+ − + > + ;
and reciprocally,
(2.2a)’ any member 2s learns language 1 iff 2 1 1 2ˆ( ) ( )v a v a a c− + > ;
28 Selten & Pool (1991) opt for a similar assumption, focusing however, on the differences of learning costs between foreign languages, whereas Church & King (1993) opt for identical costs of learning for all languages. Here, we opt for a differentiation of learning costs between native and foreign languages, assuming the learning cost of all foreign languages to be identical.

48
(2.2b)’ any member 2s learns language 2 iff 1 2 2 1ˆ( ) ( )v a v a a c− + > ;
(2.2c)’ any member 2s learns languages 1 and 2
iff 1 2 2 2 1 2ˆ( ) ( )v a a v a a c c+ − + > + ;
where 1a and 2a are the number of individuals from the other community that choose to
speak language 2 and the number of individuals from the other community that choose to
speak language 1, respectively, in equilibrium.
We now assume that the language community 1 is larger than the language
community 2 ( 1 2a a> ⇔ 1 2( ) ( )v a v a> ) and the cost of learning a mother tongue is much
less than the cost of learning a foreign language ( i jc c< ). For simplification we assume
that the learning cost of learning a mother-tongue is equal to zero and the learning cost of
learning a foreign language is equal to 1 ( 0, 1i jc c= = ) The Nash equilibrium of this game
is characterized by proposition 1.
PROPOSITION 1:
(i) If 1 2 1 1 2 2( ) ( ) ( ) ( ) jv a a v a v a a v a c+ − < + − < , then ( 1 2ˆ ˆ0, 0a a= = ) is the unique
pure-strategy Nash equilibrium;
(ii) If 1 2 1 1 2 2( ) ( ) ( ) ( )jv a a v a c v a a v a+ − < < + − , then there are two pure-strategy
Nash equilibria ( 1 1 2ˆ ˆ, 0a a a= = ) and ( 1 1 2 2
ˆ ˆ, 0a a a a= + = );
(iii) If 1 2 1( ) ( )jc v a a v a< + − , then there exist three pure-strategy Nash equilibria
( 1 1 2 2ˆ ˆ, 0a a a a= + = ) , ( 1 2 1 2
ˆ ˆ0,a a a a= = + ) and ( 1 1 2 2 1 2ˆ ˆ,a a a a a a= + = + );
Proof:
(The proof of Proposition 1 follows the same logic as the first proposition of the model by
Church & King, 1993)29
According to proposition 1, if the cost of learning a foreign language is too high,
then no one learns a foreign language, which means that unilingualism in mother-tongue is
optimal. If the cost of bilingualism pays for speakers of language 2 but not for speakers of
language 1 (because 1 2a a> ), then there are two pure-strategy Nash equilibrium. The first
29 See Church & King’s (1993) appendix p. 344.

49
is that all speakers of language 2 learn language 1 (unilingualism in a foreign language)
and speakers of language 1 only learn language 1. The second is that all speakers of
language 2 learn both language 1 and 2 (bilingualism) and speakers of language 1 only
learn language 1. If the cost is very low, then there are three equilibria. In the first
equilibrium, all speakers of language 2 learn languages 1 and 2 and speakers of language 1
only learn language 1. In the second equilibrium, all speakers of language 1 learn
languages 1 and 2 and all speakers of language 2 learn language 2. In the third equilibrium,
all speakers of languages 1 and 2 learn both languages 1 and 2.
Further, let us assume that the decision of any agent of a language community to
learn only his mother tongue, only a foreign language or become bilingual is representative
of the decision of all the members of that community30. Hence, the efficiency of the
strategy adopted by a policy maker who wishes to maximize total surplus depends again on
the learning costs ic , jc and i jc + .
Let the total surplus be denoted by ��W if both communities decide to only learn
their respective native language (mother-tongue education policy); BBW if both
communities decide to become bilingual in languages 1 and 2 (bilingual education policy);
B�W if community 1 decides to learn both languages 1 and 2 and community 2 only learns
its native language; �BW if community 1 only learns its native language and community 2
decides to become bilingual; 12�W if community 1 decides to learn only language 2 and
community 2 learns its national language (language 2); 21�W if community 2 decides to
learn only language 1 (unilingual education policy in foreign language) and community 1
only learns language 1 (mother-tongue education policy); 12BW if community 1 learns only
language 2 and community 2 decides to become bilingual; and 21BW if community 1
decides to become bilingual and community 2 learns only language 1. In this context,
1 2a a> , 0ic = and 1jc = yield:
(2.3a) 1 1 2 2( ) ( )��W a v a a v a= + ;
(2.3b) 12 21 1 2 1 2 1 2 2 12( ) ( ) ( )BB B BW W W a a v a a a c a c= = = + + − + ;
(2.3c) 12 2 2 1 2 1 2 1 2( ) ( ) ( )B� �W W a v a a a v a a a c= = + + + − ;
30 This assumption is applied by Selten & Pool (1991) and Church & King (1993).

50
(2.3d) 21 1 1 1 2 1 2 2 1( ) ( ) ( )�B �W W a v a a a v a a a c= = + + + − .
PROPOSITION 2:
(i) BB B� �BW W W< <
(ii) �� �BW W< iff [ ] [ ]1 1 2 1 2 1 2 2( ) ( ) ( ) ( )c a a v a a v a a v a< + + + −
Proof:
(i) Follows directly from (2.3b), (2.3c) and (2.3d), since 1 2a a> .
(ii) From (2.3a) and (2.3d), 1 2 1 2 2 1 2 2( ) ( ) ( )�B ��W W a a v a a a c a v a− = + + − − which is
positive iff proposition (ii) holds.
According to proposition 2, when taking into consideration the benefits of
communication and the cost of learning a foreign language (assuming the cost of learning a
mother-tongue equal to zero), the optimal policy is the one where the community 1 learns
its native language (language 1) and the community two decides to learn both languages,
or to learn only the language of community 1 (i.e. the language of the majority). This result
confirms the ones from Church & King (1993) and Selten & Pool (1991). The reason why
it is never optimal for all individuals to become bilingual is because the sufficient
condition for all individuals to be able to communicate with each other is that one
community becomes bilingual. If more than one community learns both languages, no
further gains will be generated (Church & King, 1993, 340).
Moreover, the reason why group 2 should become bilingual and not group 1 is
because we assume the size of the language community 1 to be larger than the one of
community 2. Hence, only the smallest group should become bilingual or at least learn the
language of the majority group (size effect).
Finally, when comparing the private optima (proposition 1) with the social optima
(proposition 2), it appears that when the cost of learning is very high it is privately and
socially optimal to learn only the native language; when the cost is very low, it is privately
and socially optimal for members of communities 1 and 2 to learn language 1.
Nevertheless, the private and social equilibria do not coincide anymore when the cost of

51
learning is close to its maximum border (i.e. [ ] [ ]1 2 1 2 1 2 2( ) ( ) ( ) ( )a a v a a v a a v a+ + + − . In
that case, it is socially optimal for everyone to learn language 1 but it is privately optimal
for everyone to only learn the native language. In equilibrium, both groups will therefore
learn their native language only. Again this result confirms the findings by Church & King
(1993), who explain this divergence between the efficient and Nash equilibrium solutions
as a consequence of the existence of network externalities: “when an individual makes the
choice whether to learn or not, she does not take into account the benefit that others get
from being able to communicate with one additional person” (ibid, 341).
Finally, it is worth noticing that in all cases, it is always more efficient to learn at
least the native language (as component of a bilingual education program or as unique
language of instruction when the cost of learning a foreign language is too high). However,
our model has also shown that the presence of network externalities in cooperative games
can cause the extinction of minority languages. As suggested by Dalmazzone (1999), apart
from the application of targeted bilingualism to specific linguistic groups, another way to
combat this extinction is therefore by applying cooperative games. By forming coalitions,
members of minority linguistic groups may work together to maximize a payoff, which
could later be divided among members. Both the private and social equilibria could be
affected by such cooperation in favor of minority languages. By producing learning effects
(through the development of services and media or other diffusion networks in the
minority language) the coalitions could even generate sufficient payoff to incite the
majority language group to learn the minority language (i.e. B� �BW W> , where
12B� �W W= and 21�B �W W= still hold).
Acknowledgments
The author would like to thank Henry M. Levin and Gita Steiner-Khamsi for
valuable discussions during her stay as a visiting scholar at the National Center for the
Study of Privatization in Education, Teachers College, Columbia University, over the
academic year 2004-2005. The work conducted during that period inspired the present
paper. The author would also like to thank the participants to the Francophone Symposium
of the XXII CESE conference, Granada, July 3-6, 2006, for their valuable comments and
feedback on a preliminary version of this paper.

52
References
Apple, M.W. (1990). Ideology and Curriculum (2nd ed.). London: Routledge.
Baldauf, R.B., and Jernudd, B.H. (1983). Language of publication as a variable in
scientific communication. Australian Review of Applied Linguistics, 6(1), 97-108.
Bhola, H.S. (1981). Campaigning for Literacy (A study submitted to UNESCO, Chapter
2). Toronto: International Council for Adult Education.
Bourdieu, P. (1991). Language and Symbolic Power. Cambridge: Polity Press.
Carr, J. (1985). Le bilinguisme au Canada: l’usage consacre-t-il l’anglais monopole
naturel ? In F. Vaillancourt (ed.), Economie et Langue. Montréal : Université de
Montréal, Centre de Recherche en Développement Economique.
Church, J. And King, I. (1993). Bilingualism and Network Externalities. The Canadian
Journal of Economics, 26 (2), 337-345.
CIA. (2006). The World Fact Book 2006. URL:
[http://www.cia.gov/cia/publications/factbook], (June 18, 2006).
Cooper, R. L. (1989). Language Planning and Social Change. Cambridge, UK: Cambridge
University Press.
Cornes, R. and Sandler, T. (1996). The Theory of Externalities, Public Goods and Club
Goods. Second Edition. Cambridge: Cambridge University Press.
Dalmazzone, S. (1999). Economics of Language: A Network Externalities Approach. In A.
Breton (ed.), Exploring the Economics of Language. Quebec: The Department of
Canadian Heritage.
Devarajan, S., Dollar, D., and Holmgren, T. (2001). Aid and Reform in Africa: Lessons
from Ten Case Studies. Washington, D.C.: The International Bank for Reconstruction
and Development, World Bank.
Fishman, J.A. (1974). Language planning and language planning research: The state of the
art. In J.A. Fishman (ed.), Language Planning: Current Issues and Research, 15-36.
Washington, DC: Georgetown University Press.
Fishman, J.A. (1979). Bilingual Education: What and Why?. In H.T. Trueba and C.
Barnett-Mizrahi (eds.), Bilingual Multicultural Education and the Professional.
Rowley, M.A.: Newbury House Publishers.

53
Garvin, P.L. (1974). Some comments on language planning. In J.A. Fishman (ed.),
Language Planning: Current Issues and Research, 69-78. Washington, D.C.:
Georgetown University Press.
Gifford, P., and Louis, R. (1971). France and Britain in Africa: Imperial Rivalry and
Colonial Rule. New Haven: Yale University Press.
Goke-Patriola, A. (1993). The Role of Language in the struggle for Power and Legitimacy
in Africa. African Studies, 31. Lewinston: The Edwin Mellen Press.
Grimes, B.F. (2000). Ethnologue Volume 1: Languages of the World. Dallas, TX: SIL
International.
Grin, F. (1992). Towards a threshold theory of minority language survival. Kyklos, 45, 69-
97.
Haarmann, H. (1990). Language planning in the light of a general theory of language: a
methodological framework. International Journal of Socio-Linguistics, 86, 103-126.
Haugen, E. (1966). Language Conflict and Language Planning: The Case of Modern
�orwegian. Cambridge: Harvard University Press.
Haugen, E. (1983). The implementation of corpus planning: Theory and practice. In J.
Cobarrubias and J.A. Fishman (Eds.), Progress in Language Planning: International
Perspectives: 269-290. Amsterdam: Mouton Publishers.
Heritage Foundation (The) and The Wall Street Journal (2006). 2006 Index of Economic
Freedom. URL: [http://www.heritage.org/index/], (December 12, 2006).
Jernudd, B. H. (1981). Planning language treatment: linguistics for the third world.
Language and Society, 10, 43-52.
Jernudd, B.H. and Jo, S-H. (1985). Bilingualism as a resource in the United States. In R.B.
Kaplan et al. (Eds.), Annual Review of Applied Linguistics, 6, 10-18. New York:
Cambridge University Press.
Joseph, J.E., and Taylor, T.J. (eds.). (1990). Ideologies of Language. London: Routledge.
Kagan, A. (1982). Literacy, Libraries and Underdevelopment – with Special Attention to
Tanzania. Africana Journal, XIII (1-4), 1-23.
Kaplan, R.B., and Baldauf, R.B. (1997). Language Planning from Practice to Theory.
Multilingual Matters (Series), 108.
Kelly, G.P. (2000). French Colonial Education. New York : AMS Press.
Kloss, H. (1969). Research Possibilities on Group Bilingualism: a Report. Quebec:
International Center for Research on Bilingualism.

54
Leclerc, J. (2006). L’aménagement linguistique dans le monde. Québec : TLFQ, Université
Laval. URL: [http://www.tlfq.ulaval.ca/axl.htm], (June 17, 2006).
Lewis, E.G. (1980). Bilingualism and Bilingual Education: A Comparative Study.
Albuquerque: University of New Mexico Press.
Lin, A, and Martin, P.W. (eds.) (2005). Decolonisation, Globalisation: Language-in-
Education Policy and Practice. Toronto: Multilingual Matters, New Perspectives on
Language & Education.
Mackey, W.F. (1992). Mother tongues, other tongues and link languages: What they mean
in a changing world. Quarterly Review of Education, XXII (1), 41-52.
Marschak, J. (1965). Economics of language. Behavioral Science, 10, 135-40.
Mesthrie, R., Swann, J., Deumert, A., and Leap, W. (2000). Introducing Sociolinguistics.
Philadelphia: John Benjamins Publishing Company.
Ntiri, D.W. (1993). Africa’s Educational Dilemma: Roadblocks to Universal Literacy for
Social Integration and Change. International Reviw of Education, 39(5), 357-372.
Nyati-Ramahobo, L. (1999). Political Dilemma in Language Planning in Africa. In
Comparative Perspectives on Language and Literacy, Chapter 48. Dakar:
UNESCO/BREDA.
OECD. (2006). Aid Statistics, Recipient Aid Charts. URL:
[http://www.oecd.org/countrylist/0,2578,en_2649_34447_25602317_1_1_1_1,00.html
], (June 18, 2006).
Ouane, A. (1990). National Languages and Mother Tongues. The U�ESCO Courier, July,
27-29.
Sabourin, C. (1985). La théorie des environnements linguistiques. In, F. Vaillancourt (ed.),
Economie et Langue. Montréal : Editeur Officiel du Québec.
Selten, R., and Pool, J. (1991). The Distribution of Foreign Language Skills as a Game
Equilibrium. In R. Selten (ed.), Game Equilibrium Models IV: Social and Political
Interaction. Berlin: Springer-Verlag, 64-87.
Skutnabb-Kangas, T. (2001). The Globalization of (Educational) Language Rights.
International Review of Education, 47(3-4), 201-219.
Skutnabb-Kangas, T. and Garcia, O. (1995). Multilingualism for All – General Principles?
In Skutnabb-Kangas, T. (ed.), Multilingualism for All. Lisse: Swets & Zeitlinger B.V.,
European Studies on Multilingualism, 4, 221-256.
55
Steiner-Khamsi, G. (ed.). (2004). The Global Politics of Educational Borrowing and
Lending. New York: Teachers College Press.
Stiglitz, J.E. (2006). Knowledge as a Global Public Good. In I. Kaul, I. Grunberg and M.
Stern (eds.), Global Public Goods. Oxford: Oxford University Press.
Swales, J. (1985). Episodes in ESP. Oxford: Pergamon.
Tollefson, J.W. and Tsui, B.M. (eds.). (2004). Medium of Instruction Policies: Which
Agenda? Whose Agenda? Mahwah, NJ: Erlbaum.
Trueba, H.T. (1979). Bilingual-education models. In H.T. Trueba and C.Barnett-
Mizrahi (Ed.), Bilingual Multicultural Education and the Professional. Rowley,
MA: Newbury House Publishers, 54-73.
UNESCO/BREDA (1985). African Community Languages and their Use in Literacy and
Education (A Regional Survey). Dakar: Regional Office for Education in Africa.
Van Dyken, J.R. (1990). The role of Languages of Minority Groups for Literacy and
Education in Africa. African Studies Review, 33(3), 39-52.
Williams, R. (1976). Base and Superstructure in Marxist Cultural Theory. In R. Dale et al.
(Eds.), Schooling and Capitalism: A Sociological Reader. London: Routledge &
Kegan Paul).
WTO. (2006). Statistics Country Profiles March 2006. URL:
[http://stat.wto.org/CountryProfiles/], (June 18, 2006).
Young, M.F.D. (Ed.). (1971). Knowledge and Control. London: Collier-Macmillan.

56
Figure 1
Conceptual framework
Note: See Figure 2 for further details

57
Figure 2
Path towards the adoption of a LiE policy
Note: The environmental settings (E.S.) are composed of diffusion variables (e.g., inter-country
communication), setting variables (e.g., historical settings, institutional settings, behavioral settings, external
settings, and community-type settings), and mobility variables (e.g., nomadism vs. seasonal migration, and
voluntary vs. involuntary migration). The nine types of language policies are derived from Leclerc (2006)
and the LiE policies from Trueba (1979) and Skutnabb-Kangas & Garcia (1995).

58
____ ____ _______ ___
1 1+ 1a 2 2+ 2a 3 3+ 3a 4 4+ 4a
Figure 3
Partition of hypothetical population into native-language communities
(Source: Selten & Pool, 1991, 66)

59
Table 1
Variable values
LiEpa L B E C I H D
b
Angola 0 1 0 0.33 0 1 1 0.433
Benin 0 1 0 0.33 0 1 1 0.543
Botswana 0 2 0 1 1 1 0.5 0.703
Burkina Faso 0 4 0 0.67 0 1 1 0.557
Burundi 2 2 1 0.33 1 0.67 0.5 0.496
Cameroon 1 2 0 0.67 1 1 1 0.542
Central Africa 2 1 0 1 0 0.5 1 0.548
Congo-
Brazzaville
0 1 0 0.67 0 1 1 0.264c
Congo-Kinshasa 0 1 0 0.33 0 0 1 0.436
Cote d’Ivoire 0 1 0 1 0 1 1 0.568
Egypt 0 1 0 0 0 0.5 0 0.522
Gabon 0 1 0 0.67 0 1 1 0.549
Gambia 0 1 0 0.33 0 1 1 0.579
Ghana 0 1 0 0.33 0 0 1 0.567
Guinea-Bissau 0 1 0 0 0 1 1 0.471
Kenya 2 1 0 1 0 0.5 1 0.60
Lesotho 2 2 1 1 1 1 0.5 0.57
Libya 0 1 0 0 0 0 0 0.343
Mali 0 32 1 0.67 0 0.5 1 0.541
Mauritania 1 2 0 0.33 1 0.5 0.5 0.556
Morocco 0 2 0 0 0 0.33 0.5 0.53
Mozambique 0 1 0 0 0 1 1 0.551
Namibia 2 13 1 0.67 1 0.33 0.5 0.609
Niger 0 21 1 1 1 1 0.33 0.536
Nigeria 0 4 0 0.67 1 1 0.5 0.488
Rwanda 3 3 1 0.67 1 1 0.33 0.543
Senegal 0 7 1 0.67 1 1 0.33 0.574
Sierra Leona 0 1 0 0.33 0 0.25 1 0.467
South Africa 2 11 1 0.67 1 1 0.67 0.663
Swaziland 2 2 0 0.67 1 1 0.5 0.622
Tanzania 2 2 0 0.67 1 1 0.5 0.593
Togo 0 3 0 0.67 0 1 1 0.485
Tunisia 0 2 0 0 1 0.33 0.5 0.592
Zambia 0 8 0 1 1 1 0.5 0.591
Zimbabwe 3 9 1 1 1 1 0.33 0.34
Notes: (a) LiEp: 0. Unilingual; 1. Bilingual (excl. Mother-tongue); 2. Bilingual (incl. Mother-tongue); 3.
Trilingual. (b). All values of D (Index of Economic Freedom) are computed for the year 2006 except for
Congo-Brazille (c), for which the latest valid data is from year 2000.

60
Table 2
Summary statistics
Variable Obs Mean Std. Dev. Min Max
LiEp 35 .6857143 1.022437 0 3
L 35 4.228571 6.472047 1 32
E 35 .5528572 .3433877 0 1
C 35 .4571429 .5054327 0 1
I 35 .7545714 .3497843 0 1
H 35 .6997143 .3207756 0 1
D 35 .5306286 .0879826 .264 .703

61
Table 3
Results Ordered logistic regression
a. Complete model
Ordered logistic regression Number of obs = 35
LR chi2(6) = 19.68
Prob > chi2 = 0.0032
Log likelihood = -23.071533 Pseudo R2 = 0.2990
------------------------------------------------------------------------------
liep | Coef. Std. Err. z P>|z| [95% Conf. Interval]
-------------+----------------------------------------------------------------
l | -.1735128 .1150151 -1.51 0.131 -.3989383 .0519127
e | 6.068395* 2.514478 2.41 0.016 1.140108 10.99668
c | 4.419177** 1.90489 2.32 0.020 .6856611 8.152693
i | -3.910656 2.251928 -1.74 0.082 -8.324354 .5030427
h | -.008578 2.381896 -0.00 0.997 -4.677007 4.659851
d | -6.350042 5.947425 -1.07 0.286 -18.00678 5.306697
-------------+----------------------------------------------------------------
/cut1 | .0610169 3.377253 -6.558277 6.680311
/cut2 | .4983525 3.390367 -6.146645 7.14335
/cut3 | 3.072046 3.317035 -3.429223 9.573314
------------------------------------------------------------------------------
legend: * p<0.05; ** p<0.01; *** p<0.001
b. Multicollinearity test
(obs=35)
| l e c i h d
-------------+------------------------------------------------------
l | 1.0000
e | 0.3100 1.0000
c | 0.2189 0.3685 1.0000
i | 0.0263 0.4368 0.2923 1.0000
h | -0.1202 0.0485 -0.5815 0.0893 1.0000
d | 0.1118 0.2374 0.3492 0.1480 -0.0179 1.0000
c. Reduced model
Ordered logistic regression Number of obs = 35
LR chi2(5) = 19.68
Prob > chi2 = 0.0014
Log likelihood = -23.071539 Pseudo R2 = 0.2990
------------------------------------------------------------------------------
liep | Coef. Std. Err. z P>|z| [95% Conf. Interval]
-------------+----------------------------------------------------------------
l | -.1733908 .1098959 -1.58 0.115 -.3887829 .0420012
e | 6.067499* 2.501969 2.43 0.015 1.16373 10.97127
c | 4.422515** 1.664344 2.66 0.008 1.160461 7.684569
i | -3.911179 2.247007 -1.74 0.082 -8.315232 .4928752
d | -6.353552 5.866549 -1.08 0.279 -17.85178 5.144673
-------------+----------------------------------------------------------------
/cut1 | .0666254 2.99782 -5.808993 5.942244
/cut2 | .5039706 3.01121 -5.397893 6.405835
/cut3 | 3.077235 2.988813 -2.780731 8.935201
------------------------------------------------------------------------------
legend: * p<0.05; ** p<0.01; *** p<0.001

62

63
STUDY II

64

65
The Role of Language in Learning Achievement:
A �amibian Case study∗∗∗∗
Christelle Garrouste+
Abstract
This study investigates the role played by home language and language proficiency on learning
achievement. It compares characteristics of 5048 Grade-6 learners in 275 Namibian schools. The outcome
variable is the standardized SACMEQ mathematics achievement score collected in year 2000. Hierarchical
linear modeling is used to partition the total variance in mathematics achievement into its within- and
between-school components. The social distribution of achievement in each school is represented by a
within-school model regressing mathematics achievement on home language, gender, social class (SES),
grade repetition and reading test scores. The between-school model serves in turn at explaining
heterogeneities as a function of school characteristics. An explanatory model is developed to identify specific
features of school’s academic organization and normative environment that are expected to contribute to the
distribution of achievement. The results of the analysis show that although home language plays a limited
role in explaining within-school variations in mathematics achievement and no significant role at the
between-school level, language proficiency appears to play a much stronger role in explaining both within-
and between-school heterogeneity of scores in Namibia, which confirms the role of language skills in
learning achievement.
Keywords: Learning achievement, language skills, multilevel analysis, HLM, Namibia.
JEL Codes: I2, C13, C3.
∗ Reproduced with permission from Working Paper Series, No.20 (October 2007). http://www.interped.su.se/publ_working.asp. Copyright 2007 by the Institute of International Education, Stockholm University. + Christelle Garrouste is Doctoral Candidate at IIE, Stockholm University and Marie Curie Research Fellow at the Department of Economics “Marco Fanno”, Padua University ([email protected] / [email protected]). The author would like to address her gratitude to all the Government Officers, NEPRU and UNAM Researchers, SIDA Officers, School Headmasters, School Inspectors and Students met during her fieldtrips to Namibia in December 2003 and April-May 2004, for their availability and cooperation in providing her with free access to all school databases, official documents and school facilities. Moreover, the author would also like to thank the SACMEQ Coordinating Center of Harare for granting her access to the SACMEQ I and II datasets, as well as the participants to her final research seminar at IIE, Stockholm University, September 25, 2007, and internal seminar at the Department of Economics “Marco Fanno”, Padua University, October 16, 2007, for their comments and suggestions on preliminary versions of this paper.

66
Introduction
The need for reconstruction after the Second World War has rapidly led to a world-
wide growth of interest in the application of large-scale scientific survey research
techniques to the study of issues related to improving the productivity of workers through
an increase of the number of literate people, among which Husén’s (1969) work and the
international research ran by the Association for the Evaluation of Education and
Achievement (IEA) in the early 1970s which encompassed twenty-three countries (see
Elley, 1992, 1994; Lundberg & Linnakyla, 1993; Postlethwaite & Ross, 1992). This trend
spread progressively to developing countries. In the 1980s the focus of these surveys
slowly moved from an increase of quantity of education to an improvement of quality of
education. Most occidental countries and an increasing number of developing countries are
now applying such techniques to undertake systematic studies of the conditions of
schooling and student achievement levels.
Summarizing the results of the IEA and other studies for developing countries,
Alexander & Simmons (1975) note the lack of consistency across studies and the
conflicting nature of the results. For instance, school-related variables, such as class size,
school size, and teacher characteristics, appear to be significant in some countries and non-
significant (or negatively significant) in others. Finally, although non-school variables
appear of high importance in all the studies, home background seems to have less influence
on pupils’ performance in developing than in developed countries.
In 1983, Heyman & Loxley examined the effects of socioeconomic status and
school factors on students’ science achievement in primary school in sixteen low-income
countries and thirteen high-income countries. They observed that the influence of family
background varies significantly with national economic development between countries,
and that the percentage of achievement variance explained by school and teacher variables
is negatively correlated with the level of a country’s development. This result is confirmed
by Saha (1983) and Fuller (1987) who examined the effects of school factors on student
achievement in the Third World. Fuller concluded that “much of this empirical work
suggests that the school institution exerts a greater influence on achievement within
developing countries compared to industrialized nations, after accounting for the effect of
pupil background” (pp. 255-6; italics in original).

67
Further studies have highlighted the role of language proficiency on academic
achievement. For instance, Geary, Bew-Thomas, Liu & Stigler (1996) found that the
language structure of Asian number names assisted Chinese children in developing
meaningful early number concepts. Valverde (1984) noted that differences in English and
Spanish contributed to Hispanic Americans’ poor performance and involvement in
mathematics (see also Bush, 2002, for similar conclusions).
More recent international survey data have attempted to improve the quality of
sampling methods to enable the run of more valid and sophisticated forms of statistical
analyses. One example of such effort is the cooperative project launched in 1991 by the
International Institute for Educational Planning (IIEP) together with a number of Ministries
of Education in the Southern Africa Sub-region for the establishment of long-term
strategies for building the capacity of educational planners to monitor and evaluate basic
education systems. In 1993, an association was created to extend the reach and formal
status of that work, namely the Southern Africa Consortium for Monitoring Educational
Quality (SACMEQ), and in 1995 the first SACMEQ survey project was launched in six
Southern African countries. The SACMEQ I project was completed in 1998 followed by
the SACMEQ II project launched in 2000 in fourteen Southern and Eastern African
countries.
By 2005, all fourteen national reports presenting the results from SACMEQ II had
been released. What emerged from these results was the fact that most countries were still
demonstrating large between- and within-school variations. Within-school variation is an
indication of differences in abilities among learners within each school, and between-
school variations, an indication of equity problems within the education system. South
Africa, followed by Uganda and Namibia, demonstrated then the highest percentage of
between-school variation.
More specifically, the Namibian results display very poor learners and teachers
reading and mathematics scores, a definite decline in reading scores between the first
SACMEQ study of 1995 and the second one of 2000 and considerable variation among
regions (Makuwa, 2005). These results deserve further investigation in view of the high
resource allocation efforts made by the Namibian authorities to launch substantial
education reforms since independence in 1990, including the adoption of a bilingual
language-in-education policy aiming primarily at facilitating the cognitive development
68
and, hence, the learning process of pupils, and with regard to the ambitious National Plans
formulated since 1999.
Hence, after a short review of the status of Namibian schools and political agenda
at the time the SACMEQ II was conducted (i.e. year 2000), this paper attempts to
investigate the main factors explaining the poor scores of Namibian Grade-6 learners.
More specifically, the objective is to see whether the home language and language
proficiency constitute a significant discrimination factor in mathematics achievement to
explain the within-school and between-school variations. The method used is an adaptation
of the Hierarchical Linear Modeling (HLM). This paper follows the theoretical steps
enounced by Bryk & Raudenbush (1988) and Hox (1995) for the use of the HLM method
for education analyses.
�amibia’s School Structure and Policy Agenda at the Time of the Study
The Republic of Namibia is situated on the south west coast of Africa and is
bordered by the Atlantic Ocean to the west, the republics of Angola and Zambia to the
north and north-east respectively and the republics of Botswana and South Africa to the
east and south respectively. It obtained national independence from former apartheid South
African government on March 21, 1990, after many years of political, diplomatic and
armed, national liberation struggle. Even if the country is well endowed with good deposits
of uranium, diamonds, and other minerals as well as rich fishing grounds, there are wide
disparities in the distribution of incomes. With a per capita income of US$2,000 Namibia
may be regarded as a middle income country. Yet, the richest 10 percent of the society still
receives 65 percent of the incomes. As a consequence, the ratio of per capita income
between the top 5 percent and the bottom 50 percent is about 50:1 (Makuwa, 2005). This
provides a brief understanding of the socio-economic context under which the education
system has to develop in Namibia.
Since independence, Namibia has made strides in the provision of basic education,
which by 2001 had resulted in a primary education net enrolment of 94 percent of all
children aged 7-13 (in Grades 1-7), and by 2006 Namibia ranked among the top eight
African countries in term of primary completion rate ( > 80 percent) (Vespoor, 2006).
While much seems to have been achieved in terms of access to schooling, the quality of

69
education, efficiency and equity issues are since the late 1990s at the center of political
preoccupations.
Because Article 20 of the Constitution of the Republic of Namibia provides for free
and compulsory education for all learners between the ages of 6 and 16 or learners from
Grade 1 up to the end of Grade 7; and because the government has declared education to
be a priority among all other priorities in Namibia, education has received since
independence the largest share of the national recurrent budget. For instance, out of the
estimated total government current expenditure of N$8.35 billion for the 2001/2002
financial year, N$1.86 billion, i.e. about 20 percent of the budget, was earn-marked for
basic education only. Of the total amount allocated for basic education, N$986.56 million
was earn-marked for primary education and the rest for secondary education. Yet, almost
90 percent of the money allocated for primary education was spent on personnel costs
(e.g., salaries and/or subsidies to teachers in a number of private schools), leaving only
about 10 percent for all the other services and school supplies (Makuwa, 2005). As a
consequence, the financial allocation per learner ratio is more favorable to regions with
more qualified staff and fewer learners than to rural regions with more unqualified teachers
and large pupil-teacher ratios. Finally, the authorized practice of collect by schools of
school development funds from parents is again more favorable to schools in urban areas
where parents have an income than to schools in more remote areas.
In addition to these obvious resource allocation issues, it is also important to
highlight the many changes that took place in the education sector between 1995 and 2000.
As explained in Makuwa’s (2005) report, there were for instance more learners and more
schools in 2000 than in 1995; the department of Sport was added to the Ministry of Basic
Education and Culture; and, more important, the HIV/AIDS pandemic became a national
problem affecting infected administrators, teachers, learners and/or parents. In view of
these new contextual settings, the Ministry of Basic Education, sports and Culture
(MBESC) defined eight new national priority areas in its “Strategic Plan” for the period
2001-2006: equitable access; education quality; teacher education and support; physical
facilities; efficiency and effectiveness; HIV/AIDS; lifelong learning; and sports, arts and
cultural heritage.
Finally, to understand the context framing the data used in this study, it is also
essential to give an overview of the structure of the Namibian primary school system. The
primary phase consists of the Lower Primary (Grades 1-4), during which mother tongue is

70
used as medium of instruction, and Upper Primary (Grades 5-7), during which English
becomes the medium of instruction up to Grade 12. By the year 2000, there were 998
primary schools hosting a total of 406,623 learners, of which 952 were government schools
and the rest were private schools. Nearly two thirds of all primary schools were located in
the six most populated northern regions namely, Caprivi, Kavango, Ohangwena, Oshikoto,
Oshana and Omusati.
It is in the above milieu that the second SACMEQ survey used in the present paper
was conducted and it is therefore in that frame that the results of the analysis should be
interpreted.
Data and method
The sampling procedure for the SACMEQ II survey was geared by methodological
recommendations to all participating countries, but with certain flexibility to take into
account contextual differences. Hence, as for all other participating countries, the desired
target population in Namibia was all learners enrolled in Grade 6 in the ninth month of the
school year (i.e. in September 2000). The net enrolment ratio for the age group 7-13 years
old who were enrolled in Grades 1 to 7 in Namibia in 2000 was 91.3 percent. However, in
Namibia it was decided to exclude certain learners namely, learners in schools with less
than fifteen Grade 6 learners, learners in “inaccessible” schools, and learners in special
schools. A two-stage cluster sampling was employed using approximately equal size
clusters stratified into the 13 educational regions, which led to a final sample of 5048
learners and 275 schools (Makuwa, 2005).
The HLM6.0 program is used in this study to partition the total variance in
mathematics scores into its within- and between-school components. The HLM framework
was developed during the 1980s by Aitkin & Longford (1986), DeLeeuw & Kreft (1986),
Goldstein (1987), Mason et al. (1983) and Raudenbusk & Bryk (1986). As explained by
Raudenbush & Bryk (1995), these procedures share two core features. First, they enable
researchers to formulate and test explicit statistical models for processes occurring within
and between educational units, thereby resolving the problem of aggregation bias under
appropriate assumptions. Second, these methods enable specification of appropriate error
structures, including random intercepts and random coefficients, which can solve the

71
problem of misestimated precision that characterized previous conventional linear models
and hindered their capacity to test hypotheses1.
Among the empirical works using this approach on international survey data is the
study by Lamb & Fullarton (2002) which compared mathematics achievement in Australia
and the U.S. using the HLM on TIMSS data. The results found that classroom differences
accounted for about one-third of the variation in student achievement in the U.S. and over
one-quart in Australia. Most of the classroom variation in both countries was due to
compositional and organizational factors, very little due to differences between teachers.
Moreover, Howie (2002, 2005) and Gustafsson (2007) used HLM on TIMSS and
SACMEQ data, respectively, to understand school production in South Africa. Howie
(2002, 2005) applied multilevel analysis (2002, 2005) on TIMSS data to show that
significant predictors of between-school variations include pupils’ performance in the
English test, pupils’ SES (to a lesser extent), pupils’ self concept, pupils’ perception of the
importance of mathematics, their exposure to English, how pupils’ math teachers perceive
their professional status, pupils’ math teachers beliefs about mathematics, the location of
the school, the extent to which English is used in the classroom, the amount of time
teachers spend working and the amount of time teachers spend in lesson planning. More
recently, Gustafsson (2007) applied HLM to South Africa’s SACMEQ II data and found
that physical infrastructure, textbooks, nutrition budgets, correct allocation of teaching and
management time in schools, less learner repetition, and better teaching methodologies are
important factors of variations in mathematics scores within and between South African
schools. This last study respects the theoretical steps of multilevel analysis more reliably
than Howie’s works but does not include any language related variable.
The theoretical framework of HLM modeling applied in the present study is the one
derived from Bryk & Raudenbush (1988) and defined by Hox (1995) consisting in 5 steps:
(1) the Null Model; (2) the estimation of the fixed effects of the within-school model; (3)
the estimation of the variance components of the within-school model; (4) the exploration
of between-school effects; and (5) the estimation of the cross-level interactions between
the within- and between-school variables. Note that relevance to the Namibian context,
correlations with test scores and correlations between input variables were taken into
1 Lynch, Sabol, Planty & Shelly (2002) confirm the strength of HLM models compared to other multilevel models to produce superior unbiased estimates of coefficients and robust standard errors even when the assumptions required by OLS are violated.

72
account in the selection of all the parameters retained for this model. Table 1 displays the
descriptive statistics relative to each parameter.
Results
The �ull Model
The first step in fitting an HLM model is to analyze a model with no explanatory
variables. The output variable is pupil’s total raw score in mathematics at the SACMEQ
test (MATOTP). The SACMEQ II Mathematics test is composed of three domains, namely
(1) number (i.e. operations and number line, square roots, rounding and place value,
significant figures, fractions, percentages, and rations); (2) measurement (i.e.
measurements related to distance, length, area, capacity, money, and time); and (3) space-
data (i.e. geometric shapes, charts and data tables)2.
This intercept-only model is defined by:
+=
+=
jj
ijjij
U
Ry
0000
0
µβ
β (1)
Hence,
ijjij RUy ++= 000µ . (2)
In this intercept-only model, which is the null model of our analysis, the base coefficient
0jβ is defined as the mean mathematics score in school j. It is a standard one-way random
effects ANOVA model where schools are a random factor with varying numbers of
students in each school sample (Bryk & Raudenbush, 1988, p.75).
Whereas the within-school variance )var( ijR , i.e. the variability in student
mathematics scores around their respective school means, is estimated to 25.556, the
between-school variance )var()var( 00 jjU β= , i.e. the variability among school means, is
2 For a detailed overview of the levels and items composing the SACMEQ II Mathematics test, see the blueprint in Makuwa (2005, p. 31).
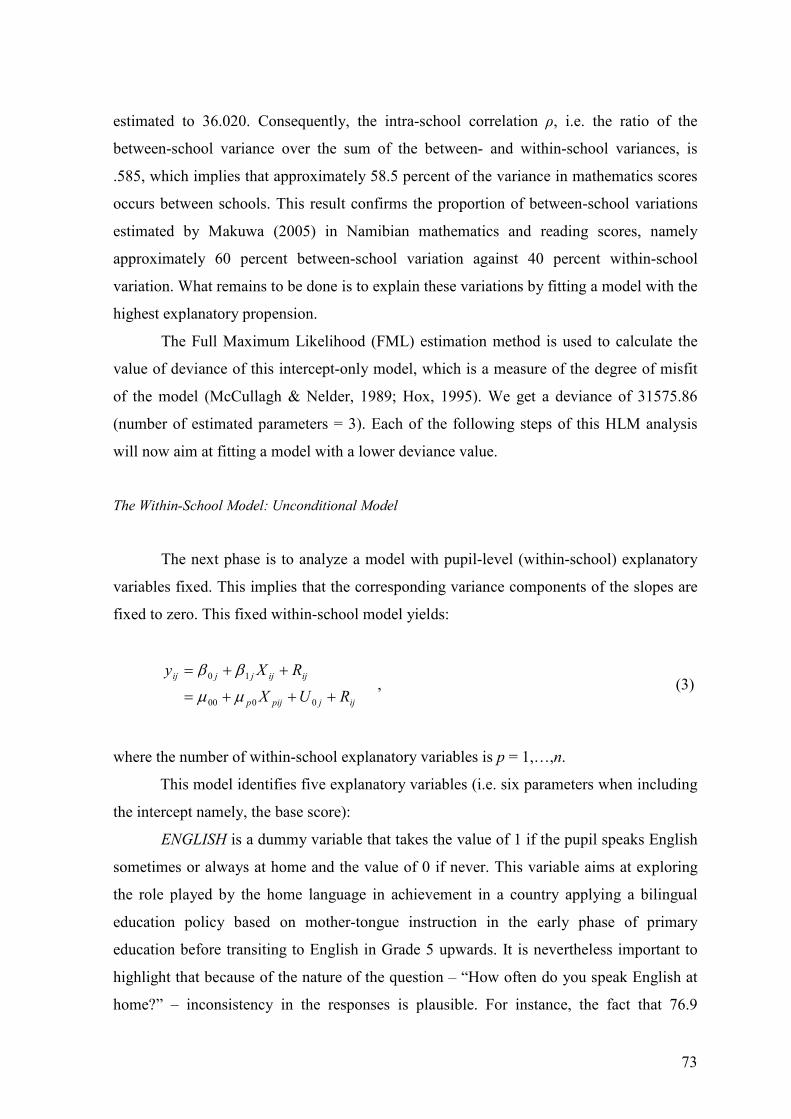
73
estimated to 36.020. Consequently, the intra-school correlation ρ, i.e. the ratio of the
between-school variance over the sum of the between- and within-school variances, is
.585, which implies that approximately 58.5 percent of the variance in mathematics scores
occurs between schools. This result confirms the proportion of between-school variations
estimated by Makuwa (2005) in Namibian mathematics and reading scores, namely
approximately 60 percent between-school variation against 40 percent within-school
variation. What remains to be done is to explain these variations by fitting a model with the
highest explanatory propension.
The Full Maximum Likelihood (FML) estimation method is used to calculate the
value of deviance of this intercept-only model, which is a measure of the degree of misfit
of the model (McCullagh & Nelder, 1989; Hox, 1995). We get a deviance of 31575.86
(number of estimated parameters = 3). Each of the following steps of this HLM analysis
will now aim at fitting a model with a lower deviance value.
The Within-School Model: Unconditional Model
The next phase is to analyze a model with pupil-level (within-school) explanatory
variables fixed. This implies that the corresponding variance components of the slopes are
fixed to zero. This fixed within-school model yields:
ijjpijp
ijijjjij
RUX
RXy
+++=
++=
0000
10
µµ
ββ , (3)
where the number of within-school explanatory variables is p = 1,…,n.
This model identifies five explanatory variables (i.e. six parameters when including
the intercept namely, the base score):
E�GLISH is a dummy variable that takes the value of 1 if the pupil speaks English
sometimes or always at home and the value of 0 if never. This variable aims at exploring
the role played by the home language in achievement in a country applying a bilingual
education policy based on mother-tongue instruction in the early phase of primary
education before transiting to English in Grade 5 upwards. It is nevertheless important to
highlight that because of the nature of the question – “How often do you speak English at
home?” – inconsistency in the responses is plausible. For instance, the fact that 76.9

74
percent of the sampled pupils answered that they speak sometimes or all the time English
at home does not mean that English is the mother-tongue of 76.9 percent of that
population. In reality, English is the mother-tongue of only .56 percent of the Namibian
population (Gordon, 2005). Moreover, no indication is provided about the nature and the
level of communication in English that is occurring at home. Hence, this home language
parameter should NOT be interpreted as a proxy of mother-tongue rather as a proxy of the
linguistic home background of the pupil.
FEMALE takes the value of 1 if the pupil is a girl and the value of 0 if the pupil is a
boy. Entering a gender parameter aims at addressing potential gender gaps in mathematics
achievement. In the present case, although the mean mathematics score for boys (= 18.86)
is very close to the one for girls (= 18.25) the existence of very high variance for each
group (66.41 for boys and 56.45 for girls) justifies further exploration.
SES is a computed variable measuring the pupil’s SES (in terms of parents’
education, possessions at home, light, wall, roof, floor) that takes values between 1 and 15.
Although the link between social background and achievement has been demonstrated to
be less strong within-school in less developed countries than in industrial countries (see
Heyman & Loxley, 1983; Saha, 1983; Fuller, 1987), it is still essential to include it in our
analysis to avoid missing any explanation of between-school variations.
RATOTP is the pupil’s total raw score in reading at the SACMEQ test. The reading
test scores serve here as a proxy of English language proficiency (see Geary et al., 1997;
Valverde, 1984; Collier, 1992; Ehindero, 1980; Yip et al., 2003; Clarkson & Galbraith,
1992). Note that the strong correlation expected between RATOTP and E�GLISH is
present in our sample with a significance at the .01 level (2-tailed) and that the mean
reading score of pupils who never speak English at home (= 29.86) is, again as expected,
less than the mean score of pupils speaking sometimes or all the time English at home (=
35.00).
Finally, REPEAT is a dummy variable taking the value of 1 if the pupil has
repeated at least one class and 0 if not. It provides information on the learning
facilities/difficulties of the pupil and serves thereby as a proxy of the pupil’s academic
background when combined with RATOTP (Bryk & Raudenbush, 1988). In our sample the
mean mathematics score of grade repeating pupils is 16.66 compared to 20.55 for pupils
on-track with much larger variance among the first (= 87.95) than among the latter group
(= 29.18).

75
The predictors SES and REPEAT are centered around their respective group mean.
Figures 2.1-2.5 present the Stem & Leaf plots of Mathematics scores by each parameter.
Each figure shows the existence of large variations between and/or within groups, which
justify the conduct of the present HLM analysis on these parameters to investigate the
source of this variance.
Replacing each parameter by its label-value in equation (3) we get:
ijjijjij
jijijijij
RUREPEATRATOTPRATOTP
SESSESFEMALEE�GLISHMATOTP
+++−+
−+++=
•
•
05040
30201000
)(
)(
µµ
µµµµ . (3’)
The final estimation of these fixed effects with robust standard errors is displayed
in Table 2. It appears that the most significant parameters are the pupil’s mean
mathematics score, gender and reading raw score. The slopes’ signs show that, whereas
being a girl has an overall negative impact on mathematics scores, a high mean
mathematics score in the school attended and a high individual reading score have a
positive impact on individual mathematics scores. The lack of statistical significance of the
E�GLISH, SES and REPEAT parameters is however not strong enough to justify at this
stage a removal from the model. So far, what the model shows is that speaking English at
home and a high SES background have a positive impact on mathematics achievement,
which confirms the theory. According to previous research on developing countries
(Heyneman & Loxley, 1983; Saha, 1983; Fuller, 1987; etc.), it is expected that SES and
REPEAT will remain non-significant.
Moreover, grade repetition has a negative impact on mathematics achievement,
which confirms the conclusions reached by Verspoor (2006) in his report for ADEA.
However, before claiming that this result either invalidates or confirms the assumption that
repetition has a negative effect on pupil’s achievement improvement, it is important to
highlight that the SACMEQ dataset does not provide for any longitudinal data. This lack
implies that it is impossible to know whether the pupil who repeated a grade did improve
its mathematics score compared to the previous year or not. All we know from the present
analysis is that, overall, pupils who have repeated a grade perform less well than their non-
repeating peers. Hence, combined with the RATOTP parameter, this gives us an idea of the
role of the educational background of the pupil on mathematics scores at a fixed date t,

76
with a higher mathematics achievement when the pupil is on school track (no repetition)
and highly proficient in English.
The deviance of this model is 30002.99 (number of estimated parameters = 8)
which means an improvement from the null model. This fixed model explains 61.7 percent
of the total variance in mathematics scores.
The third step consists now in assessing whether the slope of any of the explanatory
variables has a significant variance component between schools. The model considered is:
ijjpijpjpijpij RUXUXy ++++= 0000 µµ . (4)
Replacing the parameters by their label name in equation (4) yields:
ijjijjj
ijjjijjijj
ijjijjij
jijijijij
RUREPEATURATOTP
RATOTPUSESSESUFEMALEU
E�GLISHUREPEATRATOTPRATOTP
SESSESFEMALEE�GLISHMATOTP
+++−
+−++
++−+
−+++=
•
•
•
•
05
432
15040
30201000
)
()(
)(
)(
µµ
µµµµ
. (4’)
The testing of random slopes variations is done on a one-by-one basis. The
deviance is now equal to 29663.63 (number of estimated parameters = 28), which implies a
further improvement from to the null model. Table 2 presents all the results for the within-
school explanatory model unconditioned by the between-school variables.
As explained by Raudenbush & Bryk (1987; 1988; 1992; 1995), the unconditional
model is particularly valuable because it provides estimates of the total parameter
variances and covariances among the βpj. When expressed as correlations they describe the
general structure among these within-school effects. Table 2 shows that a high base level
of achievement is associated with less grade repetition (r = .974), higher reading scores (r
= .915), higher SES (r = .602), and male pupils (r = .650) who do not have English as
home language (r = .192). There is also a substantial association between pupil high SES
and academic achievement (with a high negative correlation between SES and grade
repetition (r = .624) and a positive correlation with reading achievement (r = .278)).
Moreover, HLM derives an indicator of the reliabilities of the random effects by
comparing the estimated parameter variance in each regression coefficient, var(βij), to the
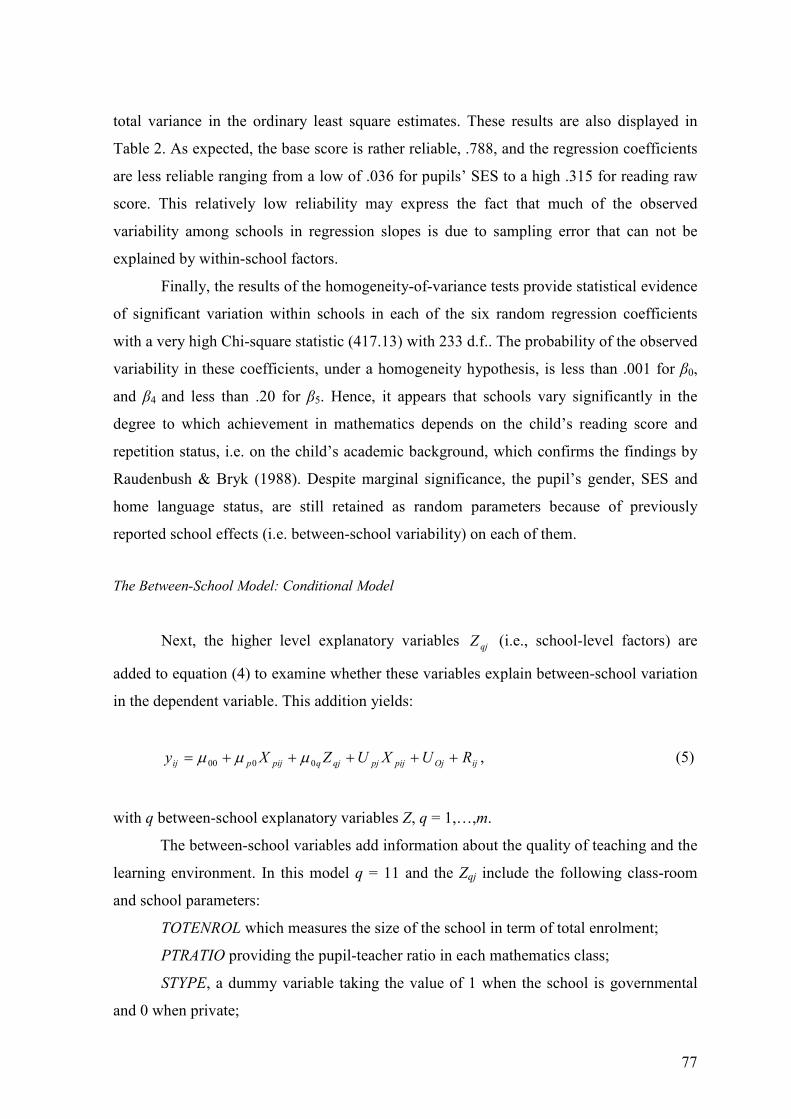
77
total variance in the ordinary least square estimates. These results are also displayed in
Table 2. As expected, the base score is rather reliable, .788, and the regression coefficients
are less reliable ranging from a low of .036 for pupils’ SES to a high .315 for reading raw
score. This relatively low reliability may express the fact that much of the observed
variability among schools in regression slopes is due to sampling error that can not be
explained by within-school factors.
Finally, the results of the homogeneity-of-variance tests provide statistical evidence
of significant variation within schools in each of the six random regression coefficients
with a very high Chi-square statistic (417.13) with 233 d.f.. The probability of the observed
variability in these coefficients, under a homogeneity hypothesis, is less than .001 for β0,
and β4 and less than .20 for β5. Hence, it appears that schools vary significantly in the
degree to which achievement in mathematics depends on the child’s reading score and
repetition status, i.e. on the child’s academic background, which confirms the findings by
Raudenbush & Bryk (1988). Despite marginal significance, the pupil’s gender, SES and
home language status, are still retained as random parameters because of previously
reported school effects (i.e. between-school variability) on each of them.
The Between-School Model: Conditional Model
Next, the higher level explanatory variables qjZ (i.e., school-level factors) are
added to equation (4) to examine whether these variables explain between-school variation
in the dependent variable. This addition yields:
ijOjpijpjqjqpijpij RUXUZXy +++++= 0000 µµµ , (5)
with q between-school explanatory variables Z, q = 1,…,m.
The between-school variables add information about the quality of teaching and the
learning environment. In this model q = 11 and the Zqj include the following class-room
and school parameters:
TOTE�ROL which measures the size of the school in term of total enrolment;
PTRATIO providing the pupil-teacher ratio in each mathematics class;
STYPE, a dummy variable taking the value of 1 when the school is governmental
and 0 when private;

78
SLOC, a dummy variable taking the value of 1 when the school is situated in an
urban area and 0 when in a rural or isolated area;
PRACAD, a measure of the proportion of pupils on track (no grade repetition) in
each school j;
DISCLIM which measures the overall discipline climate of the school. It is
computed as the average value of the following dummy variables: pupil arrive late, pupil
absenteeism, pupil skip class, pupil dropout, pupil classroom disturbance, pupil cheating,
pupil language, pupil vandalism, pupil theft, pupil bullying pupils, pupil bullying staff,
pupil injure staff, pupil sexually harass pupils, pupil sexually harass teachers, pupil drug
abuse, pupil alcohol abuse, pupil fights, teacher arrive late, teacher absenteeism, teacher
skip classes, teacher bully pupils, teacher harass sexually teachers, teacher harass sexually
pupils, teacher language, teacher drug abuse, and teacher alcohol abuse. Each variable
takes the value of 1 if the answer is “never”; and 0 if the answer is “sometimes/often”.
LGM�TY, a dummy variable taking the value of 1 when 40 percent or more of the
pupils speak English at home in school j and the value of 0 when less than 40 percent never
speak English at home. This computation follows Raudenbush & Bryk’s (1988)
computation of racial minority in the U.S. context.
MSES, the mean SES in school j;
TSEX taking the value of 1 when the mathematics teacher is a female and the value
of 0 when a male;
TSATPLR� taking the value of 1 when the mathematics teacher considers the
pupils’ learning as very important and 0 when not important or of some importance; and
MATOTT, the mathematics raw score of the teacher, which serves as a proxy of the
teacher’s qualifications based on its mastery of the subject.
The predictors TOTE�ROL, PTRATIO, MSES and MATOTT are centered around
their respective grand mean.
Replacing these variable labels into equation (5) yields the following model:

79
ijjijj
jijjjijjijj
ijjjj
jjj
jjjj
jj
ijjij
jijijijij
RUREPEATU
RATOTPRATOTPUSESSESUFEMALEU
E�GLISHUMATOTTMATOTTTSATPLR�
TSEXMSESMSESLGM�TY
DISCLIMPRACADSLOCSTYPE
PTRATIOPTRATIOTOTE�ROLTOTE�ROL
REPEATRATOTPRATOTP
SESSESFEMALEE�GLISHMATOTP
+++
−+−++
+−++
+−++
++++
−+−
++−+
−+++=
••
•
•
••
•
•
05
432
1011010
090807
06050403
0201
5040
30201000
)()(
)(
)(
)()(
)(
)(
µµ
µµµ
µµµµ
µµ
µµ
µµµµ
(5’)
The FML estimation method is again used to test (with the global chi-square test)
the improvement of fit of the new model. After adding the between-school explanatory
parameters, the deviance is 29495.19 (degree of freedom = 39), which improves again the
null model. Table 3 presents the results for this conditional model. What appears from that
analysis is that the proportion of students on track, the mean pupil’s SES and the level of
mathematics of the math teacher explain very significantly (significant at the .001 level)
variations in the individual mathematics scores. At a lesser level, the school’s overall
disciplinary climate and the type of school also play a significant role, with t-values of
1.812 and -1.281 respectively. The negative slope of the type of school indicates that
private schools perform on average better than governmental schools.
The Final Model: Cross-Level Interaction Model
Finally, cross-level interactions between explanatory school-level variables and
those pupil-level explanatory variables that had significant slopes variation in equation (4)
are added. This last addition leads to the full model formulated in equation (6):
ijOjpijpjpijqjpqqjqpijpij RUXUXZZXy ++++++= µµµµ 0000 , (6)
which yields equation (6’):

80
ijjijj
jijjjijjijj
ijjijjijj
ijjijj
jijj
jijjjijj
jijj
jijjijj
jijijj
ijijj
ijjijj
jjjjij
RUREPEATU
RATOTPRATOTPUSESSESUFEMALEU
E�GLISHUREPEATMSESMSESREPEATSTYPE
REPEATRATOTPRATOTPMATOTTMATOTT
RATOTPRATOTPMSESMSES
RATOTPRATOTPPRACADRATOTPRATOTPSTYPE
RATOTPRATOTPTOTE�ROLTOTE�ROL
RATOTPRATOTPSESSESDISCLIM
SESSESFEMALEMSESMSES
FEMALEE�GLISHDISCLIM
E�GLISHSTYPEE�GLISHMATOTTMATOTT
MSESMSESPRACADSLOCSTYPEMATOTP
+++
−+−++
+−++
+−−+
−−+
−+−+
−−+
−+−+
−+−+
++
++−+
−++++=
••
•
••
••
••
••
••
••
•
•
05
432
15251
5045
44
43142
41
4031
3021
2012
111005
0403020100
)()(
)(
))((
))((
)()(
))((
)()(
)()(
)(
)(
µµ
µµ
µ
µµ
µ
µµ
µµ
µµ
µµµ
µµµµµ
Here again, the FML estimation method is used to derive the global chi-square test
to formally test the improvement of fit. The deviance is now 29354.015 (number of
estimated parameters = 44), which means a 7.57 percent improvement compared to the null
model. The OLS regression of the full explanatory model improves the capacity of
explanation of the variations in mathematics scores by almost 2 percent (R2 = .635
percent). The results of the final explanatory model are displayed in Table 4.
Table 4 shows that the base score differences between private and public schools
(STYPE) disappear once the school location (SLOC), the portion of pupils on track
(PRACAD), the mean SES (MSES) of the school and the mathematics score of the math
teacher (MATOTT) are taken into account. The negative slope of the school type means
that greater mathematics achievement is associated with private schools situated in urban
areas, with a high proportion of pupils on track, a high average SES and a good mastery of
mathematics by the teacher. The effect of the school type (public or private) on the
attraction of home English speaking pupils disappears once the disciplinary climate
(DISCLIM) is taken into account. Home-English speaking pupils tend to attend private
schools where the disciplinary climate is safer. Furthermore, low average school SES tends
to be more associated with boys than with girls (FEMALE), and pupil’s SES is associated
to important disciplinary problems. Greater reading scores are associated with public
schools if they are of small size (TOTE�ROL), if the proportion of pupils on track is high
and the school average SES is not too low. In addition, great reading scores are also

81
associated with a good mastery of mathematics by the math teacher. Finally, there seems to
be less grade repetition in public schools and in schools with a lower average SES.
The last panel of Table 4 compares the residual parameter variances from the
explanatory model with the total parameter variances estimated in the unconditional model.
The proportion reduction in these parameter variances can be interpreted as an indicator of
the power of the explanatory model. The fitted model accounts for a substantial percentage
of the variance (percent of R²) of each within-school parameters ranging from 33.94
percent for E�GLISH to 72.72 percent for RATOTP.
Finally, the most rigorous test of the explanation power of the final model involves
acceptance of the homogeneity of residual variance hypotheses, i.e. “after modeling each
βjk as a function of some school-level variables, is there evidence of residual parameter
variation in the βjk that remains unaccounted?” (Bryk & Raudenbush, 1988, p. 79). Table 4
shows evidence of significant residual variation (high Chi-square) in base achievement
score and academic background (RATOTP and REPEAT). Moreover, the homogeneity
hypothesis for the home language (p > .500), gender (p > .500) and social differentiation (p
> .500) are still not sustained3. This means that the remaining variance in βpj might be due
to sampling variance arising because pjβ measures βpj with error (i.e. pjpjpj R+= ββ ) and
because of the existence of correlation between Xpij and Upj (i.e. { } 0≠pijpj XUE ) (see
Pedhazur, 1982, for a comprehensive discussion of measurement errors, specification
errors, and multicollinearity). In microeconomics modeling, the existence of a “non-zero”
correlation between Xpij and Upj violates one of the basic validity conditions. It is however
a very common issue in most empirical applications and especially in multilevel linear
models (Billy, 2001). Indeed, it implies that pupils’ performance and school quality can be
positively correlated, which means that the residual variability across schools with respect
to Upj, remaining after accounting for the observable heterogeneity Xpij, understates the true
variability of Upj . For instance, pupils with better than average characteristics might be
better informed and thus more able to choose the best school (“pupils self-selection”), and
schools that attract better pupils (because of a better location, better status – private vs.
public – or better organizational characteristics) also tend to attract better teachers
(“teachers self-selection”). Moreover, schools with better teachers and management are in
3 The test of homogeneity of level-1 variance gives a Chi-square statistic of 417.13 for 233 d.f. and a P-value = .000.

82
a position to recruit better students and “weed out” less promising cases (“creaming”), as it
is the case for Namibian private schools (see Grilli & Rampichini, 2007; Fielding & Steele,
2007; Peng, 2007; Frank, 2005; Rettore & Martini, 2001; Mason, 2001; and Willms &
Raudenbush, 1989; for methodological discussions and statistical proposals or attempts to
solve this endogeneity bias).
In the case of this paper, the existence of potential endogeneity bias has partially
been accounted for by the computation of the indicator of the reliabilities of random
effects. This indicator examines the reliability of the ordinary least squares (OLS) estimate
and the correlation among the model’s parameters at the pupil and school levels. The
reliability of the level-2 outcome variables (which are the input variables of level-1) is
expected to ensure that the data can detect systematic relations between within- and
between-school variables (Raudenbush & Bryk, 1992). The reliabilities depend on two
factors: first, the degree to which the true underlying pupil parameters vary from school to
school; and, second, the precision with which each school regression equation is estimated.
For each school at Level-2,
reliability][
)ˆ(2
jk
pjtσττ
τβ
ββ
β
+= (7)
is the reliability of the schools’ sample mean as an estimate of its true mean. The average
of these reliabilities across schools presented in Tables 2-4 provide summary measures of
the reliability of the school means (Xiao, 2001).
This indicator demonstrates weak reliability of all regression coefficients, except
j0β , and a decrease of overall reliability between the final model (Table 4) and the
unconditional model (Table 2), which confirms the presence of potential underestimation
bias of the size of the random effects on the outcome variable. However, it is worth
noticing that the bias is small when the number of Level-1 observations is large and the
number of Level-2 groups is small (Miller & Phillips, 2002), which is exactly the case in
our study (5048 pupils in Level-1 and 275 schools in Level-2).
Hence, although the sampling error and endogeneity bias should be accounted for
when interpreting the results presented in this paper, it is reasonable to assume that the bias
size is not problematic in this application.

83
Conclusions
In sum, this HLM analysis provides empirical support for the contention that
academic organization and normative environment of schools have a substantial impact on
the social distribution of achievement within them. At the individual level, the base
mathematics score of the school, followed by the academic background of the pupil
(RATOTP and REPEAT), its gender as well as its home language play a statistically
significant role in the individual mathematics achievement. The only non-significant
parameter is the SES of the pupil. At the school level, the analysis shows that, overall,
individual mathematics achievement is facilitated in schools with a higher proportion of
students on-track (RATOTP), a higher average SES and a strong mastery of the subject by
the mathematics teacher (MATOTT). Pupils also tend to perform better in private schools
than in governmental schools (STYPE) which confirms the observed tendency for higher
achievement in schools with less disciplinary problems (DISCLIM). The home language
parameter looses of its significance when comparing between-school variations which
could be due to the specification problems of the variable E�GLISH as explained earlier.
However, the language proficiency parameter (RATOTP) increases even more its
explanatory capacity at the between-school level which makes it one of the most
significant explanatory variables of this model and confirms the role played by language
skills in learning achievement.
The policy implications of these results are a necessary improvement of the quality
of resource allocations in teacher training to improve the subject mastery of teachers and,
more generally, in the development of better supervision structures to improve the
disciplinary climate in governmental schools. Moreover, it is important to investigate
further the potential negative direct (on the targeted pupil) and indirect (via peer-effect)
role played by high repetition rates in primary education. Lastly, the positive results
reached by this study on the role played by linguistic parameters on learning achievement
should guide decision makers in their search for optimal solutions for school effectiveness.
Hence, this study wants to underscore the need for more and better information about
pupils’ and teachers’ home language and mother-tongue in further international surveys in
Africa to investigate deeper the actual efficiency of bilingual and multilingual education
programs on overall learning achievement.

84
Finally, although assumed to have a potential positive effect on the fit of the final
model in view of the HIV/AIDS pandemic affecting the whole country, the health status of
the pupils could not be accounted for by this study. Because less than half4 of the pupils
sampled (�=2199 out of 5048) answered the question related to the reasons of their
absenteeism (illness, work, family or fee not paid), and because of the very unspecific
nature of the question, this parameter could not be included in this analysis. Moreover, in
absence of information about the type of illness or the duration of absenteeism in the
SACMEQ II dataset, the choice of this parameter as a proxy of the potential role of
HIV/AIDS on learning achievement would have been highly questionable. Further
research should therefore attempt, first of all, to collect appropriate data on this
phenomenon in the frame of larger international surveys such as SACMEQ and, second, to
include this parameter in an HLM analysis to respond to the concerns raised by many
African Governments about the negative effects of the HIV/AIDS pandemic on school
effectiveness.
4 The parameters retained in this HLM analysis suffered no missing data, except for the outcome variable. In the case of the total raw mathematics scores of the pupils, 58 cases (1.1 percent) were missing because of non-completion of the test but these data could be recomputed by estimating a probabilistic value from the school mean and the grand mean.

85
References
Aitkin, M. & Longford, N. (1986). Statistical Modeling Issues in School Effectiveness
Studies. Journal of the Royal Statistical Society, Series A, 149(1), 1-43.
Alexander, L. & Simmons, J. (1975). The Determinants of School Achievement in
Developing Countries: A Review of Research. Economic Development and Cultural
Change, 26, 341-58.
Billy, J.O.G. (2001). Better Ways to do Contextual Analysis: Lessons From Duncan and
Raudenbush. In A.C. Crouter (ed.), Does it Take a Village?: Community Effects on
Children, Adolescents, and Families. Mahwah, NJ: Lawrence Erlbaum.
Bush, W.S. (2002). Culture and Mathematics: An Overview of the Literature with a View
to Rural Contexts. Working Paper Series, 2. Louisville: University of Louisville,
Appalachian Collaborative Center for Learning, Assessment and Instruction in
Mathematics.
Clarkson, P.C. & Galbraith, P. (1992). Bilingualism and Mathematics Learning: another
Perspective. Journal for Research in Mathematics Education, 23(1), 34-44.
Collier, V.P. (1992). A Synthesis of Studies Examining Long-Term Language Minority
Student Data on Academic Achievement. Bilingual Research Journal, 16(1&2), 187-
212.
DeLeeuw, J. & Kreft, I. (1986). Random Coefficient Models for Multilevel Analysis.
Journal of Educational Statistics, 11(1), 57-85.
Ehindero, O. J. (1980). The Influence of Two Languages of Instruction on Students’
Levels of Cognitive Development and Achievement in Science. Journal of Research
in Science Training, 17(4), 283-8.
Elley, W.B. (1992). How in the World do Children Read? The Hague: IEA.
Elley, W.B. (1994). (ed.). The IEA Study of Reading Literacy: Achievement and Instruction
in Thirty-Two School Systems. Oxford: Pergamon Press.
Fielding, A. & Steele, F. (2007). “Handling Endogeneity by a Multivariate Response
Model: Methodological Challenges in Examining School and Area Effects on Student
Attainment”. Paper presented at the Sixth International Conference on Multilevel
Analysis, Amsterdam, April 16-17, 2007.

86
Frank, R. (2005). “Help or Hindrance?: A Multi-level Analysis of the Role of Families and
Communities in Growing up American”. Paper presented at the Population
Association of America’s Annual Meeting, Philadelphia, PA, March 31-April 3, 2005.
Fuller, B. (1987). What School Factors Raise Achievement in the Third World? Review of
Educational Research, 57(3), 255-97.
Geary, D.C., Bow-Thomas, C.C., Liu, F., & Stigler, R.S. (1996). Development of
Arithmetic Computation in Chinese and American Children: Influence of Age,
Language, and Schooling. Child Development, 67, 2022-2044.
Goldstein, H. (1987). Multilevel Models in Educational and Social Research. Oxford:
Oxford University Press.
Gordon, R. G., Jr. (ed.). (2005). Ethnologue: Languages of the World, 15th ed. Dallas,
T.X.: SIL International. URL: http://www.ethnologue.com/.
Grilli, L. & Rampichini, C. (2007). “Endogeneity Issues in Multilevel Linear Models”.
Paper presented at the Sixth International Conference on Multilevel Analysis,
Amsterdam, April 16-17, 2007.
Gustafsson, M. (2007). Using the Hierarchical Linear Model to Understand School
Production in South Africa. South African Journal of Economics, 75 (1), 84-98.
Heyneman, S. & Loxley, W. (1983). The Distribution of Primary School Quality within
High and Low Income Countries. Comparative Education Review, 27(1), 108-18.
Howie, S. (2002). English Language Proficiency and Contextual Factors Influencing
Mathematics Achievement of Secondary Schools in South Africa. Twente: University
of Twente, Unpublished PhD thesis.
Howie, S. (2005). System-Level Evaluation: Language and Other Background Factors
Affecting Mathematics Achievement. Prospects, XXXV(2), 175-186.
Hox, J.J. (1995). Applied Multilevel Analysis. Amsterdam: TT-Publikaties.
Husén, T. (1969). Talent, Opportunity and Career: A 26 Year Follow-up of 1500
Individuals. Stockholm: Almqvist & Wiksell.
Lamb, S. & Fullarton, S. (2002). Classroom and School Factors Affecting Mathematics
Achievement: A Comparative Study of Australia and the United States using TIMSS.
Australian Journal of Education, 46.
Lundberg, I. & Linnakyla, P. (1993). Teaching Reading Around the World. The Hague:
IEA.

87
Lynch, J.P., Sabol, W.J., Planty, M. & Shelly, M. (2002). Crime, Coercision and
Community: the Effects of Arrest and Incarceration Policies on Informal Social
Control in �eighborhoods. Rockville, MD: National Criminal Justice Reference
Services (NCJRS).
Makuwa, D. (2005). The SACMEQ II project in �amibia: a Study of the Conditions of
Schooling and the Quality of Education. Harare: SACMEQ Educational Policy
Research Series.
Mason, W.M. (2001). Multilevel Methods of Statistical Analysis. On-Line Working Paper
Series, CCPR-006-01. Los Angeles, CA: University of California, California Center
for Population Research.
Mason, W.M., Wong, G.Y., Entwistle, B. (1983). Contextual Analysis through the
Multilevel Linear Model. In S. Leinhardt (ed.), Sociological Methodology 1983-1984,
14. San Francisco, C.A.: Jossey-Bass.
McCullagh, P. & Nelder, J.A. (1989). Generalized Linear Models. London: Chapman &
Hall.
Miller, J. E. & Phillips, J. A. (2002). Does Context Affect SCHIP Disenrollment? Findings
from a Multilevel Analysis. Working paper, 316. Chicago: Northwestern
University/University of Chicago Joint Center for Poverty Research.
Pedhazur, E.J. (1982). Multiple Regression in Behavioral Research: Explanation and
Prediction, 2nd ed. New York, NY: Holt, Rinehart and Winston.
Peng, X. (2007). Estimates of School Productivity and Implications for Policy. Columbia,
MO: University of Missouri-Columbia. Unpublished M.A. thesis.
Postlethwaite, T. & Ross, K. (1992). Effective Schools in Reading: Implications for
Planners. The Hague: IEA.
Raudenbush, S.W. & Bryk, A.S. (1986). A Hierarchical Model for Studying School
Effects. Sociology of Education, 59(1), 1-17.
Raudenbush, S.W. & Bryk, A.S. (1987). Application of Hierarchical Linear Models to
Assessing Change. Psychological Bulletin, 101(1), 147-58.
Raudenbush, S.W. & Bryk, A.S. (1988). Toward a More Appropriate Conceptualization of
Research on School Effects: A Three-Level Linear Model. The American Journal of
Education, 97(1), 65-108.
Raudenbush, S.W. & Bryk, A.S. (1992). Hierarchical Linear Models: Applications and
Data Analysis Methods. Beverly Hills, C.A.: Sage.

88
Raudenbush, S.W. & Bryk, A.S. (1995). Hierarchical Linear Models. In T. Husén & T.N.
Postlethwaite (eds.), The International Encyclopedia of Education, 2nd ed., 5, 2590-6.
Rettore, E. & Martini, A. (2001). “Constructing League Tables of Service Providers when
the Performance of the Provider is Correlated to the Characteristics of the Clients”.
Paper presented at the Convegno Intermedio della Società Italiana di Statistica
Processi Metodi Statistici di Valutazione, Rome, June 4-6, 2001.
Saha, L.J. (1983). Social Structures and Teacher Effects on Academic Achievement: A
comparative Analysis. Comparative Education Review, 27(1), 69-88.
Valverde, L.A. (1984). Underachievement and Underrepresentation of Hispanics in
Mathematics and Mathematics Related Careers. Journal for Research in Mathematics
Education, 15, 123-33.
Vespoor, A. (2006). Schools at the Center of Quality. ADEA �ewsletter, 18(1), 3-5.
Willms, J.D. & Raudenbush, S.W. (1989). A Longitudinal Hierarchical Linear Model for
Estimating School Effects and Their Stability. Journal of Educational Measurement,
26(3), 209-32.
Xiao, J. (2001). Determinants of Employee Salary Growth in Shanghai: An Analysis of
Formal Education, On-the-Job Training, and Adult Education with a Three-Level
Model. The China Review, 1(1), 73-110.
Yip, D.Y., Tsang, W.K. & Cheung, S.P. (2003). Evaluation of the Effects of Medium of
Instruction on the Science Learning of Hong Kong Secondary Students: Performance
on the Science Achievement Test. Bilingual Research Journal, 27(2), 295-331.

89
Tab
le 1
Sam
ple
Des
crip
tive
Sta
tist
ics
Var
iab
les
�
Min
imu
m
Max
imu
m
Mea
n
Std
. S
kew
nes
s K
urt
osi
s
MA
TO
TP
E�
GL
ISH
FE
MA
LE
SE
S
RA
TO
TP
RE
PE
AT
TO
TE
�R
OL
PT
RA
TIO
ST
YP
E
SL
OC
PR
AC
AD
DIS
CL
IM
LG
M�
TY
MS
ES
TS
EX
TS
AT
PL
R�
MA
TO
TT
Val
id �
(L
istw
ise)
50
48
50
48
50
48
50
48
50
48
50
48
50
48
50
48
50
48
50
48
50
48
50
48
50
48
50
48
50
48
50
48
50
48
50
48
4.0
0
.00
.00
1.0
0
4.0
0
.00
11
2.0
0
8.0
5
.00
.00
.00
.00
.00
1.8
9
.00
.00
7.0
0
57
.00
1.0
0
1.0
0
15
.00
78
.00
1.0
0
15
10
.00
53
.93
1.0
0
1.0
0
1.0
0
.92
1.0
0
13
.58
1.0
0
1.0
0
41
.00
18
.54
.77
.51
6.8
5
33
.81
.52
59
4.6
1
30
.20
.95
.44
.48
.49
.05
6.8
5
.46
.94
23
.24
7.8
35
.42
1
.50
0
3.3
9
13
.617
.50
0
29
7.1
86
6.7
97
.20
9
.49
6
.19
0
.18
0
.22
6
2.7
22
.49
9
.23
1
.34
3
1.7
06 (
.03
4)
-1.2
80
(.0
34)
-.0
49
(.0
34
) .3
15
(.0
34
) 1
.25
8 (
.03
4)
-.0
63
(.0
34
) .7
05
(.0
34
) .2
39
(.0
34
) -4
.33
8 (
.03
4)
.25
7 (
.034
) .1
50
(.0
34
) .1
51
(.0
34
) .3
.953
(.0
34
) .5
27
(.0
34
) .1
54
(.0
34
) -3
.84
5 (
.03
4)
.34
3 (
.034
)
3.6
49 (
.06
9)
-.3
63
(.0
69
) -1
.99
8 (
.06
9)
-.8
96
(.0
69
) .9
22
(.0
69
) -1
.99
7 (
.06
9)
-.0
74
(.0
69
) 1
.06
1 (
.06
9)
16
.825
(.0
69)
-1.9
35
(.0
69)
-.2
39
(.0
69
) -.
42
7 (
.06
9)
13
.630
(.0
69)
-.7
31
(.0
69
) -1
.97
7 (
.06
9)
12
.786
(.0
69)
-.4
39
(.0
69
)
No
te:
The
skew
nes
s an
d k
urt
osi
s’ S
tand
ard
Err
ors
are
dis
pla
yed
in b
rack
ets.
89

90
Table 2
Unconditional Model
Fixed Effects Estimated Coefficient
Robust Standard
Error
t-Ratio
Base score, µ0
E�GLISH, µ1
FEMALE, µ2
SES, µ3
RATOTP, µ4
REPEAT, µ5
18.578 .397 -.673 .045 .252 -.381
.433
.163
.125
.029
.010
.139
42.875 2.441 -5.349 1.541
22.562 -2.742
Random Parameter Estimated Parameter Variance
Degrees of Freedom
Chi-square P-Value
Base score, β0
E�GLISH, β1
FEMALE, β2
SES, β3
RATOTP, β4
REPEAT β5
43.570 .439 .682 .012 .011 .880
233 233 233 233 233 233
1335.669 216.276 242.089 215.688 409.413 252.234
.000 >.500 .327
>.500 .000 .185
Correlation Matrix of Random Effects
β0 β1 β2 β3 β4
Base score, β0
E�GLISH, β1
FEMALE, β2
SES, β3
RATOTP, β4
REPEAT β5
-.192 -.650 .602 .915 -.974
-.540 -.601 .118 .193
.092 -.864 .617
.278 -.624
-.866
Reliability of Within-School Random Effects
Base score, β0
E�GLISH, β1
FEMALE, β2
SES, β3
RATOTP, β4
REPEAT β5
.788
.050
.119
.036
.315
.127
Notes: All estimates for two-level models reported in this article were computed using the HLM6.0 program.
The reliability estimates reported above are based on only 234 of 270 units that had sufficient data for
computation. Fixed effects and variance components are based on all the data.

91
Table 3
Between-School Effects: Conditional Model
Fixed Effects Estimated
Coefficient
Robust Standard
Error t-Ratio
Base score, β0
I�TERCEPT(*)
TOTE�ROL
PTRATIO
STYPE
SLOC
PRACAD
DISCLIM
LGM�TY
MSES
TSEX
TSATPLR�
MATOTT
E�GLISH, β1
I�TERCEPT(*)
FEMALE, β2
I�TERCEPT(*)
SES, β3
I�TERCEPT(*)
RATOTP, β4
I�TERCEPT(*)
REPEAT β5
I�TERCEPT(*)
17.5982 -.0004 .0207
-2.4568 .4107 5.0594 2.0183 -.2038 .8508 .3916 -.4477 .1051
.3433
-.6484
.0527
.2695
-.3063
1.977 .001
.0325 1.918 .511 .966
1.114 .667 .127 .375 .569 .030
.162
.127
.030
.011
.133
8.901 -.464 .594
-1.281 .804
5.239 1.812 -.306 6.668 1.043 -.787 3.548
2.123
-5.106
1.758
24.184
-2.299
Random Parameter
Estimated Parameter Variance
Degrees of Freedom Chi-square P-Value
Base score, β0
E�GLISH, β1
FEMALE, β2
SES, β3
RATOTP, β4
REPEAT, β5
17.300 .383 .740 .012 .011 .716
222 233 233 233 233 233
651.016 216.635 242.144 216.462 397.302 252.032
.000 >.500 .326
>.500 .000 .187
Reliability of Within-School Random Effects
Base score, β0
E�GLISH, β1
FEMALE, β2
SES, β3
RATOTP, β4
REPEAT β5
.615
.044
.128
.037
.318
.106
Notes: (*) I�TERCEPT corresponds to the base score.
The reliability estimates reported above are based on only 234 of 270 units that had sufficient data for
computation. Fixed effects and variance components are based on all the data.

92
Table 4 (1/2)
Final Explanatory Model of Mathematics Achievement
Fixed Effects Estimated
Coefficient Robust
Standard Error t-Ratio
Base score, β0
I�TERCEPT
STYPE
SLOC
PRACAD
MSES
MATOTT
E�GLISH, β1
I�TERCEPT
STYPE
DISCLIM
FEMALE, β2
I�TERCEPT
MSES
SES, β3
I�TERCEPT
DISCLIM
RATOTP, β4
I�TERCEPT
TOTE�ROL
STYPE
PRACAD
MSES
MATOTT
REPEAT β5
I�TERCEPT
STYPE
MSES
19.799 -4.568 .210
6.405 1.392 .147
-1.786 2.247 -.029
-.675 -.237
-.169 .436
.091
-.000029 .061 .213 .018 .004
-1.706 1.423 -.256
2.639 2.704 .519
1.088 .145 .032
1.352 1.333 .651
.119 .053
.082 .165
.044
.000024 .039 .049 .004 .001
.814 .833 .059
7.501 -1.689 .405
5.884 9.568 4.585
-1.321 1.686 -.045
-5.673 -4.442
-2.054 2.636
2.037 -1.215 1.553 4.326 4.390 3.552
-2.095 1.707 -4.359
Reliability of Within-School Random Effects
Base score, β0
E�GLISH, β1
FEMALE, β2
SES, β3
RATOTP, β4
REPEAT β5
.576 .034 .061 .021 .133 .051

93
Tab
le 4
(2/2
)
Fin
al
Exp
lan
ato
ry M
od
el o
f M
ath
emati
cs A
chie
vem
ent
Ran
do
m E
ffec
ts
Est
imat
ed
Par
amet
er V
aria
nce
D
egre
es o
f F
reed
om
C
hi-
squar
e P
-Val
ue
Ba
se s
core
, β
0
E�
GL
ISH
, β
1
FE
MA
LE
, β
2
SE
S,
β3
RA
TO
TP
, β
4
RE
PE
AT
, β
5
1
4.4
94
.29
0
.32
3
.00
7
.00
3
.32
1
22
8
23
1
23
2
23
2
22
8
23
1
55
4.2
45
21
3.2
03
23
0.7
90
21
4.0
36
27
5.3
74
24
1.3
38
.00
0
>.5
00
>.5
00
>.5
00
.01
7
.30
7
MO
DE
L
Per
centa
ge
of
Var
iance
Exp
lain
ed
Bas
e sc
ore
E
NG
LIS
H
FE
MA
LE
S
ES
R
AT
OT
P
RE
PE
AT
var
(β0)
%R
² var
(β1)
%R
² var
(β2)
%R
² var
(β3)
%R
² var
(β4)
%R
² var
(β5)
%R
²
Unco
nd
itio
nal
4
3.5
70
…
.43
9
…
.68
2
…
.01
2
…
.01
1
…
.88
0
…
Exp
lanat
ory
1
4.4
94
66
.73
.29
0
33
.94
.32
3
52
.64
.00
7
41
.67
.00
3
72
.72
.32
1
63
.52
No
tes:
(*)
I�T
ER
CE
PT
co
rres
po
nd
s to
the
bas
e sc
ore
.
The
reli
abil
ity e
stim
ates
rep
ort
ed a
bo
ve
are
bas
ed o
n o
nly
23
4 o
f 2
70 u
nit
s th
at h
ad s
uff
icie
nt
dat
a fo
r co
mp
uta
tio
n.
Fix
ed e
ffec
ts a
nd
var
iance
co
mp
on
ents
are
bas
ed o
n a
ll
the
dat
a.
93

94
never sometimes/all the time
R:/ speaking English at home
0
20
40
60
80
SCR:/ pupil reading-all total raw score
2 729
3 624
4 6944 7124 7784 7962 5294 7972 6062 495
5 0264 9705 0285 0275 0245 0234 715
7401 4304 7252 5164 7572 358
Figure 1. English Proficiency by Home Language Stem-and-Leaf Plots
never sometimes/all the time
R:/ speaking English at home
0
10
20
30
40
50
60
SMEAN(matotp)
4 7962 5992 5874 7162 516
4 7105 0224 7604 7185 0272 527
2 495
293734291
871246
872
2 5332518757362274 713
Figure 2.1 Mathematics Achievement by Home Language Stem-and-Leaf Plots

95
boy girl
R:/ pupil sex
0
10
20
30
40
50
60
SMEAN(matotp)
4 9745 0215 0234 7114 7495 025
4 9984 7255 0154 7544 7075 018
5 0272 527817870252736227
8802 4962 533866875321
876
Figure 2.2 Mathematics Achievement by Pupil’s Gender Stem-and-Leaf Plots
1,00 2,00 3,00 4,00 5,00 6,00 7,00 8,00 9,00 10,00 11,00 12,00 13,00 14,00 15,00
D:/ pupil's SES [parents education; possessions at home; light; wall; roof; floor]
0
10
20
30
40
50
60
SMEAN(matotp)
4 928
3 344
4 590
4 546
4 6231 9023 3464 778
4 576
4 4501 982
4 7961 9951 147
1 062
2 8732 5873 342
3 465
4 718
2 936
4 6901 436
4 7162 356
4 750
1851 879
2 523
4 7564 7114 7077254 735
867
2 461877
249252
227
246
280
2 4563 343
2 591
4 7344 749
2 4977
4 737
817
941
Figure 2.3 Mathematics Achievement by Pupil’s SES Stem-and-Leaf Plots

96
4 9 11
14
16
18
20
22
24
26
28
30
32
34
36
38
40
42
44
46
48
50
52
54
56
58
60
62
64
66
68
70
72
74
76
78
SCR:/ pupil reading-all total raw score
0
10
20
30
40
50
60
SMEAN(matotp)
4 560
3 3684 546
4 421
2 117408
4 928
2 881
3 455
3 426
1 867
4 5702 8702 781
1 033
5 0214 717
2 032
4 7004 750
3163 34232 369
2 474
116
748284
246
2 664
2 517
242
1 394
3 536
3 287
318
8692 531
Figure 2.4 Mathematics Achievement by English Proficiency Stem-and-Leaf Plots
never repeated at least once
R:/ grade repetition
0
10
20
30
40
50
60
SMEAN(matotp)
4 7075 0254 7355 0118718782 307872
4 7005 0191 8674 7103 343
2274 713
3 4654 749975 017874
870
Figure 2.5 Mathematics Achievement by Grade Repetition Stem-and-Leaf Plots

97
STUDY III

98
99
Language Skills and Economic Returns∗∗∗∗
Christelle Garrouste+
Institute of International Education (IIE), Department of Education, Stockholm University,
10691 Stockholm, Sweden
Abstract
This paper focuses on the contributions from the positivist epistemological approach,
endorsed by the economics of language and the economics of education, to study the
returns to language skills, assuming that language competencies constitute key components
of human capital. It presents results on economic returns to language skills in eight
countries enrolled in the International Adult Literacy Survey (IALS) – Chile, Czech
Republic, Denmark, Finland, Hungary, Italy, Norway and Italian-speaking Switzerland.
The study shows commonalities between countries in terms of language skills valuing,
beyond the type of language policy applied at the national level. In each of the eight
countries compared, skills in a second language are estimated to be a major factor
constraining positively wage opportunities.
∗ Reproduced with permission from Policy Futures in Education, 6(3) (in print). Copyright 2008 by Symposium Journals. + The author would like to acknowledge Statistics Canada for providing her with formal authorization to access and use the IALS data in the frame of this study. An earlier version of this paper was presented at the CIES conference, Honolulu, HI, March 14-18, 2006.
100
1. Introduction
At the dawn of the new millennium, debates on language policy are more and more
focused on the role of multilingualism and multiculturalism in the globalization process.
The complexity of this issue lies mainly in the fact that the process of globalization at the
cultural level produces contradictory behaviors. As Stromquist & Monkman (2000)
explain:
While the world is becoming smaller and more homogeneous at some levels, in a variety of ways
local cultures are making efforts to retain their identity and, in some cases, even to rediscover it
(Stromquist & Monkman, 2000, p. 7).
Hence, Cvetkovich & Kellner (1997) claim that:
Although global forces can be oppressive and erode cultural traditions and identities they can
also provide new material to rework one’s identity and can empower people to revolt against
traditional forms and styles to create new, more emancipatory ones (Cvetkovitch & Kellner,
1997, p. 10).
This paradox is very well captured by Pattanyak (1984) in his overview of the different
positions in the current debate:
The dominant monolingual orientation is cultivated in the developed world and consequently
two languages are considered a nuisance, three languages uneconomic and many languages
absurd. In multilingual countries, many languages are facts of life; any restriction in the choice
of language is a nuisance; and one language is not only uneconomic, it is absurd (Pattanyak,
1984; quoted by Skutnabb-Kangas & Garcia, 1995, p. 221).
In the face of this complicated climate, where, on the one hand, the labor market is
required to homogenize to its maximum its communication tools (i.e. languages of trade)
and, on the other hand, the national political leaders are fighting for the preservation of the
cultural and linguistic identity of their people, the education sector serves as the mediator
between these two parties[1]. Hence, the sociology of learning in schools is built on the
assumption that a polity targeting sustainable-development needs to focus on providing
[1] Educationalists, such as Giddens, 1994, and Stromqvist & Monkman, 2000, are increasingly interested in the role of globalization in the re-conceptualization of knowledge.

101
children with the knowledge, skills and values needed to make them become competent
adult members of the society (Broadfoot, 1994). And so, by definition, the type of
language-in-education policy (if any) adopted by a government reflects its ambition to
educate a skilled and attractive labor force. As Marland (1977) highlighted in his advocacy
for language across the curriculum (LAC):
If a school devotes thought and time to assisting language development, learning in all areas
will be helped; if attention is given to language in the content and skill subjects, language
development will be assisted powerfully by the context and purpose of those subjects (Marland,
1977; quoted by Froese, 1994, p. 3205).
Building on the hypothesis that bilingual education programs favor cognitive learning, and
thereby literacy (Jacob, 1994; Ogbu, 1994; Pease-Alvarez, 1994), and given the
contradictory linguistic interpretations of globalization, the question of which languages to
choose as part of a bilingual education policy confronts two main linguistics theorist
groups, namely the ‘free-market’ theorists and the ‘green’ theorists. On the one hand, the
‘free-market’ theory of unfettered capitalism defines linguistic geo-strategy as a race for
‘market share’ ran by the governments representing the major international languages. On
the other hand, the ‘green’ theory of ecological protection advocates for a linguistic geo-
strategy of “protection of endangered languages undertaken by linguists and by those
interested in linguistic human rights” (Kibbee, 2003, p. 47).
Although the emergence of this debate results from works in sociolinguistics and
linguistics, this paper aims at showing that economics of education and economics of
language contribute to this debate principally via their fundamental assumption that an
optimal combination of languages exists for each labor market (Vaillancourt, 1982/1983, p.
167). This hypothesis, which supports the ‘free-market’ theory, has inspired Vaillancourt
(1980) and Lacroix & Vaillancourt (1980, 1981) to elaborate a framework transforming
this demand for language skills into a demand for individuals embodying language skills,
thereby allowing them to make predictions on the relative earnings of Anglophone and
Francophone salaried in Quebec. A similar framework was used by Boulet (1980) to
examine the situation in Montreal. In total, more than two dozen studies have been
conducted since 1970 based on this hypothesis and using either a 1/100 sample drawn from
the 1971 Census of Canada or data from large-scale surveys. Vaillancourt (1982/1983)
102
highlights that “[a]ll studies make use of regression analysis, usually linking the logarithm
of earnings to individual characteristics such as education and age, in addition to language
skills” (p. 168). This method is derived from the ‘mincerian’ specifications of human
capital. The principle is to add to his Mincer’s (1974) specification of the link between
income and its determinants, one or several variables denoting linguistic competences
(Grin, 1999, p. 30). The inherent hypothesis is that the higher the level of language
competences, the higher the wages.
These studies have the advantage of coherently supporting the validity of the above
framework to predict the relative returns to language skills, even when taking into account
the level of knowledge of these languages (e.g., Boulet, & Castonguay, 1979; Chizwick &
Miller, 1992; Fixman, 1990; Grenier & Vaillancourt, 1982; Grin, 1999; Sabourin, 1979;
Veltman, Vaillancourt & Pes, 1980). On the other hand, their weakness lies in their use of
datasets that are nationally designed and thereby not internationally comparative.
The purpose of this paper is therefore to go beyond this limitation by testing the ‘free-
market’ theory on eight countries, using the database provided by the International Adult
Literacy Survey (IALS), ran between 1994 and 1998. Three countries (Finland, Hungary
and Norway) officially apply a bilingual education policy and five (Chile, Czech Republic,
Denmark, Italy and Italian-speaking Switzerland) officially apply another type of
language-in-education policy. Table I presents the language policy of all IALS countries
covered by this study. Note that these countries have been selected among the twenty-one
countries participating in the IALS, based on availability and reliability of data.
Among the linguistic factors influencing wages, the level of literacy in the working
language (which is assumed to be the national official language) and the number of
languages spoken are retained for this study. One of the objectives is to test the assumption
that proficiency in the national language is more significant to immigrants (measured as
not born in country of survey) than to native individuals. Further, the number of languages
spoken serves to test the assumption that globalization requires skills in foreign languages
(free-market theory).

103
Building the hypotheses mainly on results found by previous studies in the United States
and in Canada in the past twenty-five years (with the exception of the works by Grin in
Switzerland), this study attempts to test their generalizability at the international level.
Interestingly, the studies conducted so far show rather mixed results. For instance, some
find that a variable measuring English proficiency is not statistically significant in
influencing hourly wages. In the U.S., such findings include the studies by Borjas (1984)
using the 1976 Survey of Income and Education (SIE) for various Hispanic groups,
Reimers (1983, 1985) for males and females in the SIE data set, and Gwartney & Long
(1978) and Carliner (1980) using Census data. In Canada, Bloom & Grenier (1992),
Chizwick & Miller (1992), Grenier (1987), Robinson (1988), Shapiro & Stelcner (1987)
and Vaillancourt (1992) failed to find strong language effects on earnings outside Quebec
(where the returns to bilingualism in French and English are generally positive),
confirming thereby the findings from the U.S.
On the other hand, research by Grenier (1984), Kossoudji (1988), McManus et al. (1983),
Rivera-Batiz (1990), Tainer (1988), have found significant positive effects of English
language proficiency on earnings in the U.S. Moreover, in Canada, Christofides &
Swidinsky (1998) have shown that, relative to the earnings of unilingual Anglophones, the
returns to bilingualism have increased significantly between 1971 and 1991 in both Quebec
and the Rest-of-Canada, which alters previous results. Further, Grin’s (1999) study on the
returns to proficiency in a foreign language (namely, English) in Switzerland confirms a
significant effect on earnings.
Rivera-Batiz’s (1990) and Grin’s (1999) studies differ from the other studies in their use of
test-based measurements of language proficiency, rather than self-assessed subjective
measurements. The present study offers similar reliability for skills in the official national
language(s) by using the test-based measurement of prose, document and quantitative
literacy computed by the IALS. However, skills in foreign languages are based on self-
assessment.
Because the aim of this study is to test the free-market theory, this paper addresses the
following specific questions:

104
1) Does proficiency in the official national language(s) play a significant role on
wages?
2) Does this result differ by gender and between native and non-native individuals to
the country of survey?
3) Are language skills more rewarded in countries applying an official bilingual policy
than in countries applying another type of language policy?
2. The empirical model
This study applies the following empirical human capital model, estimated separately for
men and women, and native and non-native individuals in each country of the sample:
ijkijkijk UXW += 'log β ,
where ijkW is the estimate of personal income from only wages, salary or self-employment
in the year of the survey received by individual i of gender j, and place of birth k (i.e. in or
not in country of survey); β is a vector of coefficients to be estimated; ijkX is a vector of
human capital and demographic characteristics affecting wages; and ijkU is a stochastic
disturbance.
In order to determine the role played by language proficiency on earnings, three human
capital equations have been computed. The first one is a ‘standard’ human capital equation,
where vector ijkX includes two key explanatory variables. First of all, years of schooling,
a7, as an indication of the impact of academic skills on earnings. Moreover, years of on-
the-job experience, proxied by the variable exper, measured as age minus years of
schooling minus six[2], to incorporate the effect of non-academic skills on wages.
The second human capital equation adds to the previous the scores received by individuals
in literacy, as measured by the IALS. The IALS defines three domains of literacy:
[2] On average, compulsory education starts at the age of six at the international level, including in the countries of this sample. It is therefore commonly admitted to define exper as age minus years of schooling minus six (Rivera-Batiz, 1990).

105
a) Prose Literacy – the knowledge and skills needed to understand and use information from
texts including editorials, news stories, poems, and fiction;
b) Document literacy – the knowledge and skills required to locate and use information
contained in various formats, including job applications, payroll forms, transportation
schedules, maps, tables, and graphics; and
c) Quantitative literacy – the knowledge and skills required to apply arithmetic operations,
either alone or sequentially, to numbers embedded in printed materials, such as balancing a
checkbook, calculating a tip, completing an order form, or determining the amount of
interest on a loan from an advertisement (Statistics Canada, 2002, p. 15; italic in original).
For each of these three scales (prose, document and quantitative), individuals are assigned
scores, ranging from 0 to 500, according to how well they perform on a number of tasks of
varying difficulty. The scale scores are in turn grouped into five empirically determined
literacy levels, each of them implying an ability to cope with a particular subset of reading
tasks. Variables prose, doc and quant provide the average score for prose literacy,
document literacy and quantitative literacy respectively (see Table II for a definition of
each level and score range).
Finally, the third human capital equation adds skills in two languages, proxied by the
dummy variable lang2, which equals 1 if the person can conduct a conversation in a
foreign language in addition to the national official language, and zero otherwise. Although
this variable is based on self-assessment, and can therefore not be considered as an
evidence of bilingual proficiency, it helps measuring the significance given by the labor
market to language competences beyond the official national language.
Only individuals for whom non-zero wages are observed are retained for the analysis. This
implies a non-random selection of cases, which biases the error term ijU . This selectivity
bias problem could be solved with the two-stage sample selection bias correction
procedure postulated by Heckman (1979).

106
3. Results
The results for the countries of our sample are grouped by type of national language policy
(bilingual and other types). Tables III-A and III-B depict the sample means for bilingual
and non-bilingual countries respectively for the variables included in the analysis. Tables
IV-A and IV-B show the results for native men and women in bilingual and non-bilingual
countries respectively. Whenever possible, results have been computed for individuals
born in another country than the country of survey to look for eventual differences of
results with the individuals born in the country of survey.
For comparison purposes, equation (1) presents the estimated coefficients when all
variables on language skills are excluded from the wage equation. Equation (2) then shows
the results when the variables in prose, document and quantitative literacy in the official
national language are included. Finally, equation (3) presents the results including skills in
two languages (see annex). Note that cases with negative adjusted R2 are not presented in
these tables.
Countries applying bilingual (or multilingual) policies are assumed to value skills in two
languages more than countries applying other types of language policies. This implies that
the significance of lang2 on wages is expected to be higher in bilingual countries.
Conversely, proficiency in the official national language is expected to have a higher
significance in countries valorizing their unique official language.
First of all, the results presented in this paper show that the three human capital equations
estimated in this study provide a sufficient percentage of explanation of variations in
wages only for Finnish men and women born in Finland (between 12.2 and 13.8 percent),
Norwegian men born in Norway (between 11.2 and 12.7 percent), Danish men born in
Denmark (between 12.5 and 13.3 percent) and women leaving in Italy and born abroad (up
to 21.9 percent). For all other cases, the low level of adjusted R2 highlights the need to
refine the estimated equations. However, previous empirical studies applying the same
Mincerian approach did not obtain higher explanation degrees, which allows us
nevertheless to treat our results as valid.
107
In the two countries applying a national policy of bilingualism (Finland and Norway)
linguistic skills, both in terms of literacy skills in the national official language and skills in
a second language, have a significant effect on wages, as demonstrated by the increasing
adjusted R2 when incorporating the linguistic variables. However, the weights estimated
for pros, doc and quant are very small compared to the weights estimated for lang2. This
shows that for individuals born in the country of residency and work, although they can
influence the type of work and thereby the income range one is eligible for, literacy skills
in the national official language are not a requirement for wage improvements. On the
other hand, the weight estimated for second language skills goes pass the weights
estimated for educational level and professional experience in both countries. It is however
worth noticing that although Swedish is the second official language of Finland, 55 percent
of the Finnish population has English as second language (41.7 percent speaks Swedish as
second language). The same applies to Norway, with English being spoken by 93 percent
of Bokmål-speaking population as the second language.
Moreover, looking at the results for the six countries applying a national language policy
other than bilingualism (Chile, Czech Republic, Denmark, Hungary, Italy and Italian-
speaking Switzerland), it appears that despite the explicative weakness of the model, the
inclusion of language skill variables also improves the adjusted R2. It is interesting to see
that skills in a second language are as praised by the labor market in non-bilingual
countries as they are in bilingual countries and that the role played by literacy in the
national official language varies strongly between countries and even between types of
literacy skills. Furthermore, second language skills are more valued in women’s wages
than in men’s wages in all countries of our sample except Switzerland (Italian-speaking
part). These differences could be explained by the distribution of gender by type of
professional occupation.
When examining the nature of the second language spoken by the individuals of our
sample it is striking to see that English comes first in Chile (58 percent) and Denmark (79
percent), and second in Hungary after German (29 percent versus 52 percent) and in Italy
after French (35 percent against 44 percent). The only exception to this trend in favor of
English as common communication means are the Czech Republic, where 41 percent of
the population still speaks Russian as second language before German (20 percent) -

108
English comes only in third position with 14 percent -, and the Italian-speaking
Switzerland with 58 percent speaking the regional dialect, 24 percent speaking German,
and 13 percent French[3] (only 1.5 percent for English). From this distribution of languages
it is clear that the choice of the second language is more highly correlated to economic
factors than the choice of the first language, which is still very much correlated to socio-
cultural and historical factors. This finding for second languages supports the free-market
theory, which states that the choice of languages should be ruled by competitiveness.
Finally, although one of the objectives of this study was to compare results for men and
women according to their place of birth (assuming that immigrants would be included in
the individuals not born in the country of survey), lack of valid data for individuals born
outside the country of survey in all countries of our sample - except for Norway and the
Italian-speaking Switzerland - hinders us from drawing any conclusions from that angle
(see Tables III-A and III-B for sample means by gender and place of birth). In the case of
Norway, none of the three human capital equations tested have the capacity to explain
more than 0.5 percent of the variations in wages for men born abroad, and in the Swiss
case, the inclusion of the linguistic variables diminishes the explanatory level of the model,
implying that the sources of variations of wages of non-natives should be sought among
other factors.
4. Conclusions
Rare study on economic returns to language skills conducted at the international level, this
paper has made use of a test-based measure of literacy skills in national official language
and self-assessment measure of competences in a second language to estimate the role
played by language skills in explaining earnings in eight countries. This paper thereby
contrasts with the previous literature in this field, which has used non-comparative national
datasets.
This analysis demonstrates the existence of commonalities between countries in terms of
language skills valuing, which go beyond the type of language policy applied at the
[3] Together with Italian and Romansh, German and French are the official languages of Switzerland.

109
national level. In each of the eight countries compared, skills in a second language are
estimated to be a major factor constraining positively wage opportunities.
The initial objective of this empirical study was to test the free-market theory according to
which ‘competitive’ bilingualism or multilingualism needs to prevail ‘ecological’
multilingualism. Based on the nature of the second languages spoken by our sample, and
on their estimated economic return, this study validates fully the free-market theory.
However, the returns to literacy skills in the official national language (assumed to be
equal to the working language) were expected to be higher. The re-computation of literacy
skills as an average of prose, document and quantitative literacy might alter this result in
favor of the free-market theory, i.e. in favor of high skills in the language of the market.
Finally, a suggestion for further research would be to add a control for the type of
professional occupation in order to explain better the differences in returns to language
skills by countries, genders, native vs. non-natives, and even individuals of a same group.

110
References
Bloom, D.E., and Grenier, G. (1992). Earnings of the French Minority in Canada and the
Spanish Minority in the United States. In, B.R. Chiswick, ed., Immigration,
Language, and Ethinicity: Canada and the United States. Washington, D.C.: The
AEI Press.
Borjas, G. (1984). The economic status of male Hispanic migrants and natives in the
United States. In R. Ehrenberg, ed., Research in Labor Economics. Greenwich: JAI
Press, 65-122.
Boulet, J.A. (1980). Language and Earnings in Montreal. Hull, Quebec: Economic Council
of Canada.
Broadfoot, P. (1994). Sociology of Learning in School. In, T.Husén and T.N.
Postlethwaite, eds., The International Encyclopedia of Education (2nd ed.), 6.
Stockholm: Pergamon Press, 3306-3312.
Carliner, G. (1980). Wages, earnings and hours of first, second, and third generation
American males. Economic Inquiry, 18, 87-102.
Chizwick, B.R., and Miller, P.W. (1992). Language in the Immigrant Labor Market. In,
B.R. Chiswick, ed., Immigration, Language, and Ethnicity. Washington, D.C.: The
AEI Press.
Christofides, L.N., and Swidinsky, R. (1998). Bilingualism and Earnings: A Study Based
on 1971, 1981 and 1991 Census Data. In, A. Breton, ed., Economic Approaches to
Language and Bilingualism. Toronto: Department of Economics, University of
Toronto. URL: http://www.canadianheritage.gc.ca/progs/lo-
ol/perspectives/english/economic/ch4_01.html
Cvetkovich, A. and Kellner, D. (1997). Articulating the Global and the Local:
Globalization and Cultural Studies. Boulder, C.O.: Westview.
Fixman, C.S. (1990). The foreign language needs of U.S.-based corporations. Annals of the
American Academy of Political and Social Science, 511, Foreign Language in the
Workplace (Sep., 1990), 25-46.
Froese, V. (1994). Language across the Curriculum. In, T.Husén and T.N. Postlethwaite,
eds., The International Encyclopedia of Education (2nd ed.), 6. Stockholm: Pergamon
Press, 3205-3209.

111
Giddens, A. (1994). Beyond Left and Right: The Future of Radical Politics. Stanford:
Stanford University Press.
Grenier, G., and Vaillancourt, F. (1982). An economic perspective on learning a second
language. Cahiers de Recherche, 8238. Montreal : University of Montreal,
Departement de Sciences Economiques.
Grenier, G. (1984). The effects of language characteristics on the wages of Hispanic-
American males. Journal of Human Resources, 19, 35-52.
Grenier, G. (1987). Earnings by language group in Quebec in 1980 and emigration from
Quebec between 1976 and 1981. The Canadian Journal of Economics, 20(4), 774-
791.
Grin, F. (1999). Compétences et récompenses: La valeur des langues en Suisse. Fribourg :
Editions Universitaires Fribourg Suisse.
Gwartney, J.D., and Long, J.E. (1978). The relative earnings of blacks and other
minorities. Industrial and Labor Relations Review, 31, 336-346.
Heckman, J.J. (1979). Sample selection bias as a specific error. Econometrica, 47, 153-
162.
Jacob, E.J. (1994). Perspectives on Culture, Cognition, and Education. In, T. Husén and
T.N. Postlethwaite, eds., The International Encyclopedia of Education (2nd ed.), 3.
Stockholm: Pergamon Press, 1246-1253.
Kibbee, D.A. (2003). Language Policy and Linguistic Theory. In, J. Maurais and M.A.
Morris, eds., Languages in a Globalising World. New York: Cambridge University
Press.
Kossoudji, S.A. (1988). English language ability and the labor market opportunities of
Hispanic and East Asian immigrant men. Journal of Labor Economics, 6, 205-228.
Lacroix, R., and Vaillancourt, F. (1980). Attributs linguistiques et disparités de revenu au
sein de la main d’œuvre hautement qualifiée du Québec. Report presented to the
Conseil de la langue française, Centre de recherche et développement économique of
Montreal University, Vol. 6. Québec : l’Editeur officiel du Québec.
Lacroix, R., and Vaillancourt, F. (1981). Les revenus et la langue au Québec (1970-1978).
Québec : Conseil de la langue française.
Leclerc, J. (2001). L’aménagement linguistique dans le monde, Québec : TLFQ, Université
Laval. http://www.tlfq.ulaval.ca/axl/europe/danemark.htm

112
Marland, M. (1977). Language Across the Curriculum: The Implementation of the Bullock
Report in the Secondary School. London: Heinemann.
McManus, W., Gould, W., and Welch, F. (1983). Earnings of Hispanic men: The role of
English language proficiency. Journal of Labor Economics, 1, 101-130.
Mincer, J. (1974). Schooling, Experience and Earnings. New York: National Bureau of
Economic Research.
Ogbu, J.U. (1994). Language and Learning in Education. In, T.Husén and
T.N.Postlethwaite, eds., The International Encyclopedia of Education (2nd ed.), 6.
Stockholm: Pergamon Press, 3213-3216.
Pattanyak, D.P. (1984). Language policies in multilingual states. In A. Gonzales (ed.),
Panagani. Language planning, implementation and evaluation. Manila: Linguistic
Society of the Philippines. (Quoted in T. Skutnabb-Kangas and O. Garcia, 1995).
Pease-Alvarez, L. (1994). Bilingual Education: Anthropological Perspectives. In, T.Husén
and T.N.Postlethwaite, eds., The International Encyclopedia of Education (2nd ed.), 1.
Stockholm: Pergamon Press, 531-535.
Reimers, C. (1983). Labor market discrimination against Hispanic and black men. Review
of Economics and Statistics, 65, 570-579.
Reimers, C. (1985). A comparative analysis of the wages of Hispanics, blacks and non-
Hispanic whites. In, G. Borjas and M. Tienda, eds., Hispanics in the U.S. Economy.
Orlando, FL: Academic Press, 27-76.
Rivera-Batiz, F.L. (1990). English language proficiency and the economic progress of
immigrants. Economics Letter, 34(1990), 295-300.
Robinson, C. (1988). Language choice: the distribution of language skills and earnings in a
dual-language economy. In, R.G. Ehrenberg, ed., Research in Labor Economics.
Greenwich: JAI Press.
Sabourin, C. (1979). Le Français Québécois: Bibliographie Analytique. Québec :
Gouvernement du Québec.
Shapiro, D.M., and Stelcner, M. (1987). The persistence of the male-female earnings gap
in Canada, 1970-1980: The impact of equal pay laws and language policies.
Canadian Public Policy, XIII(4), 462-476.
Skutnabb-Kangas, T. and Garcia, O. (1995). Multilingualism for All – General Principles?
In Skutnabb-Kangas, T. (ed.), Multilingualism for All. Lisse: Swets & Zeitlinger B.V.,
European Studies on Multilingualism, 4, 221-256.

113
Statistics Canada (2002). International Adult Literacy Survey: Microdata User’s Guide.
Ottawa: Statistics Canada.
Stromquist, N.P. and Monkman, K. (2000). Defining Globalization and Assessing its
Implications on knowledge and Education. In, N.P. Stromquist and K. Monkman, eds.,
Globalization and Education: Integration and Contestation across Cultures. New
York: Rowman & Littlefield.
Tainer, E. (1988). English language proficiency and the determination of earnings among
foreign-born men. Journal of Human Resources, 23, 108-122.
Vaillancourt, F. (1980). Difference in earnings by language groups in Quebec, 1970. An
economic analysis. Québec: Centre international de recherche sur le bilinguisme
[publication B-90].
Vaillancourt, F. (1982/1983). The Economics of Language and Language Planning.
Language Problems and Language Planning, 7(2), 162-178. Reproduced in D.
Lamberton (2002), ed., The Economics of Language. Cheltenham: Edward Elgar
Publishing Limited, The International Library of Critical Writings in Economics.
Vaillancourt, F. (1992). An economic perspective on language and public policy in Canada
and the United States. In, B.R. Chiswick, ed., Immigration, Language, and Ethnicity:
Canada and the United States. Washington, D.C.: The AEI Press.
Vaillancourt, F., and Pes, J. (1980). Revenus et niveaux de bilinguisme écrit et oral: les
hommes québécois en 1971. Cahiers de Recherche, 8008. Montreal : University of
Montreal, Departement de Sciences Economiques.
Veltman, C.J., Boulet, J.A., and Castonguay, C. (1979). The Economic Context of
Bilingualism and Language Transfer in the Montreal Metropolitan Area. Canadian
Journal of Economics, 12(3), 468-479.

114
Table I Official language policy of the sample countries
Country Language Policy
Chile Mixed policy: Valorization of official language and Differentiate status (minority languages). Non-intervention.
Czech Republic Mixed policy: Non-intervention (official language) and Sector policy (minority languages).
Denmark Sector policy. Finland Bilingualism based on territorial personal rights. Hungary Non-intervention and sector policy (minority languages). Italy Unilingualism (valorization of the national official language). Norway (Bokmål) Bilingualism based on personal rights. Switzerland (Italian-speaking)
Unilinguism (territorial borders between official languages).
Source: Based on Leclerc (2001).

115
Tab
le I
I L
iter
acy
Lev
els
an
d S
core
Ran
ges
Lev
el
Sco
re R
an
ge
Def
init
ion
Pro
se L
iter
acy
1
0 t
o 2
25
Mo
st o
f th
e ta
sks
at t
his
lev
el r
equir
e th
e re
ader
to
lo
cate
one
pie
ce o
f in
form
atio
n i
n t
he
text
that
is
iden
tica
l to
or
syno
ny
mo
us
wit
h t
he
info
rmat
ion g
iven
in t
he
dir
ecti
ve.
If
a p
lau
sib
le i
nco
rrec
t an
swer
is
pre
sent
in t
he
text,
it
tend
s no
t to
be
nea
r th
e co
rrec
t in
form
atio
n.
2
22
6 t
o 2
75
Tas
ks
at t
his
lev
el g
ener
ally
req
uir
e th
e re
ader
to
lo
cate
on
e o
r m
ore
pie
ces
of
info
rmat
ion i
n t
he
text,
but
sever
al d
istr
acte
rs m
ay b
e p
rese
nt,
o
r lo
w-l
evel
in
fere
nce
s m
ay b
e re
quir
ed.
Tas
ks
at t
his
lev
el a
lso
beg
in t
o a
sk r
ead
ers
to i
nte
gra
te t
wo
or
mo
re p
iece
s o
f in
form
atio
n,
or
to
com
par
e an
d c
ontr
ast
info
rmat
ion.
3
27
6 t
o 3
25
Tas
ks
at th
is le
vel
gen
eral
ly d
irec
t re
ader
s to
lo
cate
in
form
atio
n th
at re
quir
es lo
w-l
evel
in
fere
nce
s o
r th
at m
eets
sp
ecif
ied
co
nd
itio
ns.
S
om
etim
es t
he
read
er i
s re
quir
ed t
o i
den
tify
sev
eral
pie
ces
of
info
rmat
ion t
hat
are
lo
cate
d i
n d
iffe
rent
sente
nce
s o
r p
arag
rap
hs
rath
er t
han
in a
si
ng
ula
r se
nte
nce
. R
ead
ers
may
als
o b
e as
ked
to
inte
gra
te o
r to
co
mp
are
and
co
ntr
ast
info
rmat
ion a
cro
ss p
arag
rap
hs
or
sect
ions
of
text.
4
32
6 t
o 3
75
Thes
e ta
sks
req
uir
e re
ader
s to
per
form
mu
ltip
le-f
eatu
re m
atch
ing o
r to
pro
vid
e se
ver
al r
esp
onse
s w
her
e th
e re
ques
ted
info
rmat
ion m
ust
be
iden
tifi
ed t
hro
ug
h t
ext-
bas
ed i
nfe
rence
s. T
asks
at t
his
lev
el m
ay a
lso
req
uir
e th
e re
ader
to
inte
gra
te o
r co
ntr
ast
pie
ces
of
info
rmat
ion,
som
etim
es p
rese
nte
d i
n r
elat
ivel
y l
ength
y t
exts
. T
yp
ical
ly,
thes
e te
xts
co
nta
in m
ore
dis
trac
tin
g i
nfo
rmat
ion,
and
the
info
rmat
ion r
eques
ted
is
mo
re a
bst
ract
.
5
37
6 t
o 5
00
Tas
ks
at t
his
lev
el t
yp
ical
ly r
equir
e th
e re
ader
to
sea
rch f
or
info
rmat
ion i
n d
ense
tex
t th
at c
onta
ins
a n
um
ber
of
pla
usi
ble
dis
trac
ters
. S
om
e re
quir
e re
ader
s to
mak
e hig
h-l
evel
in
fere
nce
s o
r to
use
sp
ecia
lize
d k
no
wle
dge.
Do
cum
ent
Lit
era
cy
1
0 t
o 2
25
Mo
st o
f th
e ta
sks
at t
his
lev
el r
equir
e th
e re
ader
to
lo
cate
a s
ingle
pie
ce o
f in
form
atio
n b
ased
on a
lit
eral
mat
ch.
Dis
trac
tin
g i
nfo
rmat
ion,
if
pre
sent,
is
typ
ical
ly l
oca
ted
aw
ay f
rom
the
curr
ent
answ
er.
So
me
task
s m
ay d
irec
t th
e re
ader
s to
ente
r p
erso
nal
info
rmat
ion o
nto
a f
orm
.
2
22
6 t
o 2
75
Do
cum
ent
task
s at
this
lev
el a
re a
bit
mo
re v
arie
d.
Whil
e so
me
stil
l re
quir
e th
e re
ader
to
mat
ch a
sin
gle
fea
ture
, m
ore
dis
trac
tin
g i
nfo
rmat
ion
may
be
pre
sen
t o
r th
e m
atch
may
req
uir
e a
low
-lev
el i
nfe
rence
. S
om
e ta
sks
at t
his
lev
el m
ay r
equir
e th
e re
ader
to
ente
r in
form
atio
n o
nto
a
form
or
to c
ycl
e th
rou
gh i
nfo
rmat
ion i
n a
do
cum
ent.
3
27
6 t
o 3
25
Tas
ks
at t
his
lev
el a
re v
arie
d.
So
me
req
uir
e th
e re
ader
to
mak
e li
tera
l o
r sy
no
ny
mo
us
mat
ches
, b
ut
usu
ally
the
read
er m
ust
tak
e co
nd
itio
nal
in
form
atio
n i
nto
acc
oun
t o
r m
atch
on t
he
bas
is o
f m
ult
iple
fea
ture
s o
f in
form
atio
n.
So
me
req
uir
e th
e re
ader
to
inte
gra
te i
nfo
rmat
ion
fro
m o
ne
or
mo
re d
isp
lays
of
info
rmat
ion.
Oth
ers
ask t
he
read
er t
o c
ycl
e th
rou
gh a
do
cum
ent
to p
rovid
e m
ult
iple
res
po
nse
s.
4
32
6 t
o 3
75
Tas
ks
at t
his
lev
el,
like
tho
se a
t th
e p
revio
us
level
s, a
sk t
he
read
er t
o m
atch
on t
he
bas
is o
f m
ult
iple
fea
ture
s o
f in
form
atio
n,
to c
ycl
e th
rou
gh
d
ocu
men
ts,
and
to
inte
gra
te i
nfo
rmat
ion;
freq
uen
tly,
ho
wev
er,
thes
e ta
sks
req
uir
e th
e re
ader
to
mak
e hig
her
-ord
er i
nfe
rence
s to
arr
ive
at t
he
corr
ect
answ
er.
So
met
imes
the
do
cum
ent
conta
ins
cond
itio
nal
in
form
atio
n t
hat
mu
st b
e ta
ken
into
acc
ou
nt
by t
he
read
er.
5
37
6 t
o 5
00
Tas
ks
at t
his
lev
el r
equir
e th
e re
ader
to
sea
rch t
hro
ug
h c
om
ple
x d
isp
lays
of
info
rmat
ion t
hat
co
nta
in m
ult
iple
dis
trac
ters
, to
mak
e hig
h-l
evel
in
fere
nce
s, p
roce
ss c
ond
itio
nal
in
form
atio
n,
or
use
sp
ecia
lize
d k
no
wle
dge.
115

116
Tab
le I
I (C
on
t’d
)
Lev
el
Sco
re R
an
ge
Def
init
ion
Qu
an
tita
tive
Lit
era
cy
1
0 t
o 2
25
Alt
ho
ug
h n
o q
uan
tita
tive
task
s use
d i
n t
he
asse
ssm
ent
fall
bel
ow
the
sco
re v
alue
of
22
5,
exp
erie
nce
su
gges
ts t
hat
such
tas
ks
wo
uld
req
uir
e th
e re
ader
to
per
form
a s
ingle
, re
lati
vel
y s
imp
le o
per
atio
n (
usu
ally
ad
dit
ion)
for
whic
h e
ither
the
nu
mb
ers
are
clea
rly n
ote
d i
n t
he
giv
en d
ocu
men
t an
d t
he
op
erat
ion i
s st
ipula
ted
, o
r th
e nu
mb
ers
are
pro
vid
ed a
nd
the
op
erat
ion d
oes
no
t re
quir
e th
e re
ader
to
fin
d t
he
nu
mb
ers.
2
22
6 t
o 2
75
Tas
ks
at t
his
lev
el t
yp
ical
ly r
equir
e re
ader
s to
per
form
a s
ingle
ari
thm
etic
op
erat
ion (
freq
uen
tly a
dd
itio
n o
r su
btr
acti
on
), u
sin
g n
um
ber
s th
at
are
easi
ly l
oca
ted
in t
he
text
or
do
cum
ent.
The
op
erat
ion t
o b
e p
erfo
rmed
may
be
easi
ly i
nfe
rred
fro
m t
he
wo
rdin
g o
f th
e q
ues
tio
n o
r th
e fo
rmat
of
the
mat
eria
l (f
or
exam
ple
, a
ban
k d
epo
sit
or
ord
er f
orm
s).
3
27
6 t
o 3
25
Tas
ks
at th
is le
vel
ty
pic
ally
re
quir
e th
e re
ader
to
p
erfo
rm a
single
o
per
atio
n.
Ho
wev
er,
the
op
erat
ions
bec
om
e m
ore
var
ied
–
so
me
mu
ltip
lica
tio
n a
nd
div
isio
n t
ask
s ar
e in
clud
ed.
So
met
imes
the
read
er n
eed
s to
id
enti
fy t
wo
or
mo
re n
um
ber
s fr
om
var
ious
pla
ces
in t
he
do
cum
ent,
and
the
nu
mb
ers
are
freq
uen
tly e
mb
edd
ed i
n c
om
ple
x d
isp
lays.
Whil
e se
man
tic
rela
tio
n t
erm
s su
ch a
s “h
ow
man
y”
or
“cal
cula
te
the
dif
fere
nce
” ar
e o
ften
use
d,
som
e o
f th
e ta
sks
req
uir
e th
e re
ader
to
mak
e hig
her
-ord
er i
nfe
rence
s to
det
erm
ine
the
app
rop
riat
e o
per
atio
n.
4
32
6 t
o 3
75
Wit
h o
ne
exce
pti
on,
the
task
s at
this
lev
el r
equir
e th
e re
ader
to
per
form
a s
ingle
ari
thm
etic
op
erat
ion w
her
e ty
pic
ally
eit
her
the
quan
titi
es o
r th
e o
per
atio
n a
re n
ot
easi
ly d
eter
min
ed.
That
is,
fo
r m
ost
of
the
task
s at
this
lev
el,
the
ques
tio
n o
r d
irec
tive
do
es n
ot
pro
vid
e a
sem
anti
c re
lati
on t
erm
such
as
“ho
w m
any”
or
“cal
cula
te t
he
dif
fere
nce
” to
hel
p t
he
read
er.
5
37
6 t
o 5
00
Thes
e ta
sks
req
uir
e re
ader
s to
per
form
mu
ltip
le o
per
atio
ns
seq
uen
tial
ly,
and
they
mu
st l
oca
te f
eatu
res
of
the
pro
ble
m e
mb
edd
ed i
n t
he
mat
eria
l o
r re
ly o
n b
ack
gro
un
d k
no
wle
dge
to d
eter
min
e th
e q
uan
titi
es o
r o
per
atio
ns
nee
ded
.
So
urc
e: S
tati
stic
s C
anad
a (2
00
2).
116

117
Table III-A Sample means for wage equations, by gender and place of birth:
countries applying a bilingual policy
Variables Born in country of survey Not born in country of survey
Males Females Males Females
Mean S.D. Mean S.D. Mean S.D. Mean S.D.
Finland
wage a7 exper prose
doc
quant
lang2
Number of observations
982256 12.59 19.29
291.72 298.77 298.43
0.51
1104
2785377 3.545
12.879 41.78 47.01 41.41 0.500
1038858 13.11 18.69
303.56 301.23 291.68
0.58
1049
2926830 3.451
12.904 39.17 44.48 38.96 0.591
1495678 13.00 11.68
282.70 290.66 285.37
0.79
28
3536005 2.867
10.111 69.39 58.67 55.81 0.418
1314993 14.44
9.69 311.01 300.56 289.30
0.88
16
3390997 2.898 9.075 59.69 59.58 57.57 0.342
Norway
Wage a7 exper prose
doc
quant
lang2
Number of observations
1107591 12.53 20.93
291.68 306.91 308.22 0.8215
1227
2781348 4.621
13.726 37.35 44.39 43.65
0,38308
1546490 12.42 20.36
302.31 305.11 303.03 0.8324
1241
3427086 3.705
13.265 36.03 43.41 40.58
0.37367
1936607 15.92 16.01
266.56 278.25 287.56 0.9813
107
3765607 8.942
13.548 65.42 77.33 65.28
0.13607
2203896 14.71 16.55
286.05 289.97 290.04 0.9740
77
4019355 3.769
10.754 62.37 68.34 58.38
0.16010
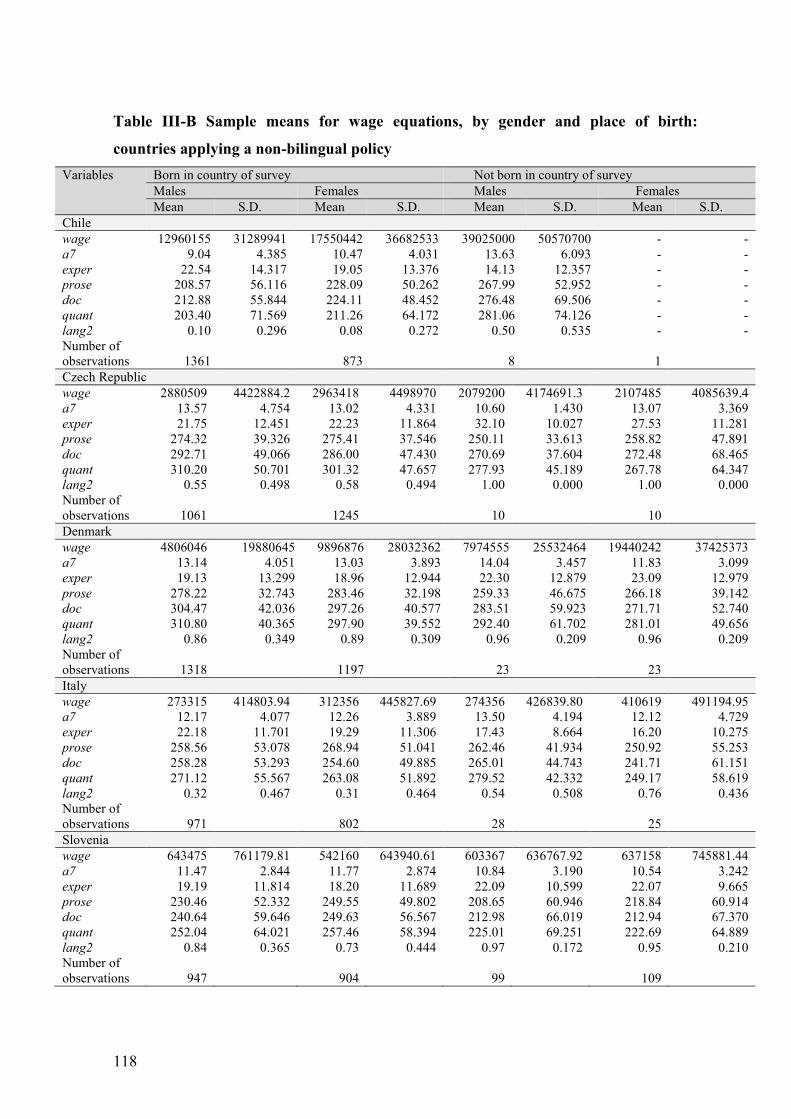
118
Table III-B Sample means for wage equations, by gender and place of birth:
countries applying a non-bilingual policy
Variables Born in country of survey Not born in country of survey
Males Females Males Females
Mean S.D. Mean S.D. Mean S.D. Mean S.D.
Chile
wage a7 exper prose
doc
quant
lang2
Number of observations
12960155 9.04
22.54 208.57 212.88 203.40
0.10
1361
31289941 4.385
14.317 56.116 55.844 71.569 0.296
17550442 10.47 19.05
228.09 224.11 211.26
0.08
873
36682533 4.031
13.376 50.262 48.452 64.172 0.272
39025000 13.63 14.13
267.99 276.48 281.06
0.50
8
50570700 6.093
12.357 52.952 69.506 74.126 0.535
- - - - - - -
1
- - - - - - -
Czech Republic
wage a7 exper prose
doc
quant
lang2
Number of observations
2880509 13.57 21.75
274.32 292.71 310.20
0.55
1061
4422884.2 4.754
12.451 39.326 49.066 50.701 0.498
2963418 13.02 22.23
275.41 286.00 301.32
0.58
1245
4498970 4.331
11.864 37.546 47.430 47.657 0.494
2079200 10.60 32.10
250.11 270.69 277.93
1.00
10
4174691.3 1.430
10.027 33.613 37.604 45.189 0.000
2107485 13.07 27.53
258.82 272.48 267.78
1.00
10
4085639.4 3.369
11.281 47.891 68.465 64.347 0.000
Denmark
wage a7 exper prose
doc
quant
lang2
Number of observations
4806046 13.14 19.13
278.22 304.47 310.80
0.86
1318
19880645 4.051
13.299 32.743 42.036 40.365 0.349
9896876 13.03 18.96
283.46 297.26 297.90
0.89
1197
28032362 3.893
12.944 32.198 40.577 39.552 0.309
7974555 14.04 22.30
259.33 283.51 292.40
0.96
23
25532464 3.457
12.879 46.675 59.923 61.702 0.209
19440242 11.83 23.09
266.18 271.71 281.01
0.96
23
37425373 3.099
12.979 39.142 52.740 49.656 0.209
Italy
wage a7 exper prose
doc
quant
lang2
Number of observations
273315 12.17 22.18
258.56 258.28 271.12
0.32
971
414803.94 4.077
11.701 53.078 53.293 55.567 0.467
312356 12.26 19.29
268.94 254.60 263.08
0.31
802
445827.69 3.889
11.306 51.041 49.885 51.892 0.464
274356 13.50 17.43
262.46 265.01 279.52
0.54
28
426839.80 4.194 8.664
41.934 44.743 42.332 0.508
410619 12.12 16.20
250.92 241.71 249.17
0.76
25
491194.95 4.729
10.275 55.253 61.151 58.619 0.436
Slovenia
wage a7 exper prose
doc
quant
lang2
Number of observations
643475 11.47 19.19
230.46 240.64 252.04
0.84
947
761179.81 2.844
11.814 52.332 59.646 64.021 0.365
542160 11.77 18.20
249.55 249.63 257.46
0.73
904
643940.61 2.874
11.689 49.802 56.567 58.394 0.444
603367 10.84 22.09
208.65 212.98 225.01
0.97
99
636767.92 3.190
10.599 60.946 66.019 69.251 0.172
637158 10.54 22.07
218.84 212.94 222.69
0.95
109
745881.44 3.242 9.665
60.914 67.370 64.889 0.210

119
Table III-B (cont’d)
Variables Born in country of survey Not born in country of survey
Males Females Males Females
Mean S.D. Mean S.D. Mean S.D. Mean S.D.
Switzerland
wage a7 exper prose
doc
quant
lang2 Number of observations
1567338 13.86 18.79
285.16 292.36 303.67 0.9846
324
3565222.8 2.860
12.820 38.957 39.293 43.996
0.12345
1866260 13.20 19.65
282.58 283.11 288.88 0.9883
343
3863863.8 5.352
13.801 38.746 39.722 41.973
0.10752
1601025 12.12 26.45
245.54 257.36 262.19 0.9052
116
3615315.4 4.652
13.440 53.354 54.155 59.373
0.29425
1645139 11.10 24.76
246.63 246.00 249.15 0.9333
105
3689831.4 3.785
12.360 58.898 58.454 60.239
0.25064
Hungary
wage a7 exper prose
doc
quant
lang2
Number of observations
20601578 12.80 19.64
241.89 255.45 278.04
0.19
752
37899973 7.698
13.481 38.27 48.97 48.27 0.391
19202275 12.93 19.56
253.61 256.61 278.95
0.26
763
36963758 6.949
12.728 37.78 48.62 48.57 0.438
27951944 13.67 24.00
236.11 250.07 265.91
0.50
6
43043159 3.559
15.887 48.34 50.21 53.32 0.548
13948922 15.25 21.92
282.48 277.43 267.40
1.00
12
32496006 3.980
12.471 36.63 44.14 89.33

120
Table IV-A Estimated coefficients, human capital wage equations: countries applying
a bilingual policy
(Note: only cases presenting positive adjusted R2 are presented in these tables. For details about cases not
presented here, please contact the author)
Finland
Gender Independent variable
Dependent variable: Natural logarithm of annual wage rate (quintile)
(1) Parameter estimate
t-statistic
H0: β =0
Prob> |t |
(2) Parameter estimate
t-statistic
H0: β =0
Prob> |t |
(3) Parameter estimate
t-statistic
H0: β =0
Prob> |t |
Born in country of survey
Men
Intercept
a7
exper
prose
doc
quant
lang2
Adjusted R2
9.446 0.106 0.051
0.122
39.746 7.103
12.279
0.000 0.000 0.000
10.486 0.124 0.046
-0.013 0.007 0.002
0.136
24.663 7.542
10.134 -4.391 2.143 0.495
0.000 0.000 0.000 0.000 0.032 0.621
10.366 0.131 0.045
-0.013 0.008 0.001
-0.179 0.137
23.999 7.680 9.785
-4.170 2.209 0.393
-1.540
0.000 0.000 0.000 0.000 0.027 0.694 0.124
Dependent variable mean: 11.76, Number of observations: 1104. Women Intercept
a7
exper
prose
doc
quant
lang2
Adjusted R2
9.644 0.059 0.055
0.125
35.732 3.522
12.269
0.000 0.000 0.000
11.253 0.071 0.047
-0.013 0.003 0.004
0.138
20.695 4.044 9.001
-3.787 0.872 1.119
0.000 0.000 0.000 0.000 0.383 0.263
11.289 0.069 0.047
-0.013 0.003 0.004 0.070 0.137
20.663 3.831 8.991
-3.821 0.833 1.147 0.693
0.000 0.000 0.000 0.000 0.405 0.252 0.488
Dependent variable mean: 11.45, Number of observations: 1049.

121
Table IV-A (cont’d)
�orway
Gender Independent variable
Dependent variable: Natural logarithm of annual wage rate (quintile)
(1) Parameter estimate
t-statistic
H0: β =0
Prob> |t |
(2) Parameter estimate
t-statistic
H0: β =0
Prob> |t |
(3) Parameter estimate
t-statistic
H0: β =0
Prob> |t |
Born in country of survey
Men
Intercept
a7
exper
prose
doc
quant
lang2
Adjusted R2
10.816 0.062 0.040
0.112
66.675 6.446
12.292
0.000 0.000 0.000
10.963 0.051 0.034
-0.011 0.000 0.011
0.127
29.220 5.007 9.465
-3.595 -0.135 3.859
0.000 0.000 0.000 0.000 0.892 0.000
10.976 0.051 0.035
-0.011 0.000 0.011 0.088 0.127
29.217 4.989 9.444
-3.633 -0.151 3.812 0.725
0.000 0.000 0.000 0.000 0.880 0.000 0.469
Dependent variable mean: 12.42, Number of observations: 1227. Women Intercept
a7
exper
prose
doc
quant
lang2
Adjusted R2
11.419 0.036 0.022
0.024
51.626 2.517 5.603
0.000 0.012 0.000
12.153 0.040 0.017
-0.001 -0.006 0.005
0.025
23.448 2.673 3.793
-0.366 -1.516 1.324
0.000 0.008 0.000 0.714 0.130 0.186
12.173 0.039 0.018
-0.002 -0.006 0.005 0.164 0.025
23.474 2.559 3.924
-0.436 -1.590 1.334 1.073
0.000 0.011 0.000 0.663 0.112 0.183 0.284
Dependent variable mean: 12.31, Number of observations: 1241
Not born in country of survey
Men
Intercept
a7
exper
prose
doc
quant
lang2
Adjusted R2
11.516 0.037 0.028
0.003
15.840 1.298 1.467
0.000 0.197 0.146
10.790 0.024 0.024 0.001
-0.015 0.017
0.004
9.823 0.770 1.233 0.110
-1.456 1.647
0.000 0.443 0.220 0.913 0.148 0.103
12.217 0.029 0.026 0.001
-0.015 0.016
-1.497 0.005
6.988 0.928 1.346 0.122
-1.435 1.586
-1.049
0.000 0.356 0.181 0.903 0.154 0.116 0.297
Dependent variable mean: 12.56, Number of observations: 107.

122
Table IV-B Estimated coefficients, human capital wage equations: countries applying
a non-bilingual policy
(Note: Only cases presenting positive adjusted R2 are presented in these tables. For details about cases not
presented here, please contact the author)
Chile
Gender Independent variable
Dependent variable: Natural logarithm of annual wage rate (quintile)
(1) Parameter estimate
t-statistic
H0: β =0
Prob> |t |
(2) Parameter estimate
t-statistic
H0: β =0
Prob> |t |
(3) Parameter estimate
t-statistic
H0: β =0
Prob> |t |
Born in country of survey
Men
Intercept
a7
exper
prose
doc
quant
lang2
Adjusted R2
12.835 0.138 0.015
0.085
69.509 10.915 3.781
0.000 0.000 0.000
12.492 0.107 0.015 0.001 0.001 0.001
0.087
41.889 6.032 3.726 0.243 0.403 0.384
0.000 0.000 0.000 0.808 0.687 0.701
12.485 0.108 0.015 0.001 0.001 0.001
-0.063 0.087
41.780 6.035 3.746 0.280 0.373 0.384
-0.402
0.000 0.000 0.000 0.779 0.710 0.701 0.688
Dependent variable mean: 14.41, Number of observations: 1361. Women Intercept
a7
exper
prose
doc
quant
lang2
Adjusted R2
12.073 0.154 0.036
0.069
41.692 7.821 6.065
0.000 0.000 0.000
11.454 0.094 0.036 0.004
-0.002 0.004
0.078
22.730 3.570 6.141 0.997
-0.456 0.941
0.000 0.000 0.000 0.319 0.648 0.347
11.490 0.088 0.037 0.005
-0.003 0.003 0.336 0.079
22.776 3.313 6.150 1.061
-0.497 0.914 1.300
0.000 0.000 0.000 0.289 0.619 0.361 0.194
Dependent variable mean: 14.37, Number of observations: 873.
Czech Republic
Gender Independent variable
Dependent variable: Natural logarithm of annual wage rate (quintile)
(1) Parameter estimate
t-statistic
H0: β =0
Prob> |t |
(2) Parameter estimate
t-statistic
H0: β =0
Prob> |t |
(3) Parameter estimate
t-statistic
H0: β =0
Prob> |t |
Born in country of survey
Men
Intercept
a7
exper
prose
doc
quant
lang2
Adjusted R2
12.192 0.026 0.014
0.005
45.991 1.824 2.474
0.000 0.069 0.014
12.685 0.025 0.008
-0.009 -0.012 0.018
0.027
23.782 1.729 1.356
-2.392 -3.134 5.036
0.000 0.084 0.175 0.017 0.002 0.000
12.732 0.023 0.008
-0.009 -0.012 0.018 0.108 0.026
23.715 1.586 1.404
-2.469 -3.167 5.073 0.780
0.000 0.113 0.160 0.014 0.002 0.000 0.436
Dependent variable mean: 12.84, Number of observations: 1061. Women Intercept
a7
exper
prose
doc
quant
lang2
Adjusted R2
12.275 0.032
-0.004
0.004
40.892 1.967
-0.731
0.000 0.049 0.465
13.538 0.031
-0.012 -0.010 -0.014 0.019
0.024
22.796 1.869
-1.986 -2.575 -3.338 4.746
0.000 0.062 0.047 0.010 0.001 0.000
13.541 0.029
-0.012 -0.010 -0.014 0.019 0.149 0.024
22.802 1.760
-1.845 -2.634 -3.360 4.755 1.078
0.000 0.079 0.065 0.009 0.001 0.000 0.281
Dependent variable mean: 12.60, Number of observations: 1245.

123
Table IV-B (cont’d)
Denmark
Gender Independent variable
Dependent variable: Natural logarithm of annual wage rate (quintile)
(1) Parameter estimate
t-statistic
H0: β =0
Prob> |t |
(2) Parameter estimate
t-statistic
H0: β =0
Prob> |t |
(3) Parameter estimate
t-statistic
H0: β =0
Prob> |t |
Born in country of survey
Men
Intercept
a7
exper
prose
doc
quant
lang2
Adjusted R2
10.529 0.080 0.045
0.125
58.758 7.184
13.215
0.000 0.000 0.000
11.271 0.084 0.045
-0.015 0.009 0.002
0.133
27.542 7.117
12.075 -3.986 2.335 0.736
0.000 0.000 0.000 0.000 0.020 0.462
11.268 0.083 0.045
-0.015 0.009 0.002 0.032 0.132
27.513 7.052
11.751 -3.985 2.312 0.752 0.223
0.000 0.000 0.000 0.000 0.021 0.452 0.824
Dependent variable mean: 12.43, Number of observations: 1318. Women Intercept
a7
exper
prose
doc
quant
lang2
Adjusted R2
11.318 0.048 0.027
0.021
39.978 2.739 5.139
0.000 0.006 0.000
12.773 0.064 0.027
-0.011 0.008
-0.003
0.025
19.817 3.459 4.677
-2.042 1.527
-0.729
0.000 0.001 0.000 0.041 0.127 0.466
12.698 0.063 0.030
-0.013 0.008
-0.003 0.555 0.029
19.717 3.452 5.060
-2.404 1.504
-0.612 2.423
0.000 0.001 0.000 0.016 0.133 0.540 0.016
Dependent variable mean: 12.45, Number of observations: 1197.
Hungary
Gender Independent variable
Dependent variable: Natural logarithm of annual wage rate (quintile)
(1) Parameter estimate
t-statistic
H0: β =0
Prob> |t |
(2) Parameter estimate
t-statistic
H0: β =0
Prob> |t |
(3) Parameter estimate
t-statistic
H0: β =0
Prob> |t |
Born in country of survey
Men
Intercept
a7
exper
prose
doc
quant
lang2
Adjusted R2
10.984 0.057 0.034
0.015
27.442 3.129 3.292
0.000 0.002 0.001
10.299 0.046 0.028
-0.021 0.002 0.019
0.037
11.522 2.521 2.539
-3.183 0.413 3.458
0.000 0.012 0.011 0.002 0.680 0.001
10.476 0.043 0.030
-0.021 0.002 0.019 0.788 0.043
11.726 2.325 2.682
-3.237 0.305 3.417 2.529
0.000 0.020 0.007 0.001 0.761 0.001 0.012
Dependent variable mean: 12.39, Number of observations: 752. Women Intercept
a7
exper
prose
doc
quant
lang2
Adjusted R2
11.517 0.024 0.014
0.000
27.629 1.203 1.347
0.000 0.229 0.178
10.129 0.011 0.015
-0.005 -0.005 0.015
0.011
10.147 0.534 1.323
-0.758 -0.948 2.810
0.000 0.593 0.186 0.448 0.343 0.005
10.199 0.012 0.018
-0.006 -0.005 0.015 0.481 0.013
10.221 0.606 1.591
-0.857 -0.961 2.757 1.689
0.000 0.545 0.112 0.391 0.337 0.006 0.092
Dependent variable mean: 12.10, Number of observations: 763.

124
Table IV-B (cont’d)
Italy
Gender Independent variable
Dependent variable: Natural logarithm of annual wage rate (quintile)
(1) Parameter estimate
t-statistic
H0: β =0
Prob> |t |
(2) Parameter estimate
t-statistic
H0: β =0
Prob> |t |
(3) Parameter estimate
t-statistic
H0: β =0
Prob> |t |
Born in country of survey
Men
Intercept
a7
exper
prose
doc
quant
lang2
Adjusted R2
10.257 0.044 0.018
0.014
42.300 3.123 3.586
0.000 0.002 0.000
10.090 0.036 0.015
-0.007 -0.002 0.010
0.026
29.367 2.226 3.010
-2.682 -0.642 2.895
0.000 0.026 0.003 0.007 0.521 0.004
10.086 0.037 0.015
-0.007 -0.002 0.010
-0.027 0.025
29.303 2.217 3.007
-2.658 -0.655 2.898
-0.226
0.000 0.027 0.003 0.008 0.513 0.004 0.821
Dependent variable mean: 11.18, Number of observations: 971. Women Intercept
a7
exper
prose
doc
quant
lang2
Adjusted R2
10.563 0.015 0.013
0.002
30.121 0.733 1.795
0.000 0.464 0.073
10.850 0.014 0.008
-0.009 -0.008 0.016
0.017
21.998 0.591 1.107
-2.364 -1.599 3.655
0.000 0.555 0.269 0.018 0.110 0.000
10.863 0.012 0.008
-0.009 -0.008 0.016 0.046 0.016
21.923 0.509 1.116
-2.373 -1.603 3.660 0.289
0.000 0.611 0.265 0.018 0.109 0.000 0.773
Dependent variable mean: 11.00, Number of observations: 802.

125
Table IV-B (cont’d)
Switzerland (Italian-speaking)
Gender Independent variable
Dependent variable: Natural logarithm of annual wage rate (quintile)
(1) Parameter estimate
t-statistic
H0: β =0
Prob> |t |
(2) Parameter estimate
t-statistic
H0: β =0
Prob> |t |
(3) Parameter estimate
t-statistic
H0: β =0
Prob> |t |
Born in country of survey
Men
Intercept
a7
exper
prose
doc
quant
lang2
Adjusted R2
9.754 0.079 0.041
0.049
14.325 1.860 4.312
0.000 0.064 0.000
10.387 0.093 0.038
-0.005 -0.001 0.004
0.044
9.896 2.022 3.794
-0.873 -0.204 0.676
0.000 0.044 0.000 0.383 0.838 0.500
9.207 0.083 0.036
-0.006 -0.001 0.004 1.442 0.048
7.090 1.791 3.549
-0.907 -0.223 0.696 1.538
0.000 0.074 0.000 0.365 0.824 0.487 0.125
Dependent variable mean: 11.61, Number of observations: 324. Women Intercept
a7
exper
prose
doc
quant
lang2
Adjusted R2
10.543 0.017 0.025
0.009
19.201 0.573 2.204
0.000 0.567 2.204
13.125 0.027 0.019
-0.015 0.004 0.002
0.024
10.633 0.906 1.535
-2.079 0.438 0.303
0.000 0.366 0.126 0.038 0.662 0.762
13.142 0.027 0.019
-0.015 0.004 0.002
-0.018 0.021
7.844 0.905 1.530
-2.060 0.434 0.303
-0.014
0.000 0.366 0.127 0.040 0.664 0.762 0.988
Dependent variable mean: 11.25, Number of observations: 343.
Not born in country of survey
Men
Intercept
a7
exper
prose
doc
quant
lang2
Adjusted R2
11.578 -0.016 0.009
-0.011
13.367 -0.355 0.546
0.000 0.723 0.586
12.154 0.033 0.010
-0.027 0.019 0.002
0.032
10.358 0.593 0.642
-2.717 1.901 0.261
0.000 0.554 0.522 0.008 0.060 0.795
11.829 0.028 0.008
-0.027 0.018 0.002 0.624 0.032
9.680 0.507 0.490
-2.699 1.816 0.279 0.958
0.000 0.614 0.625 0.008 0.072 0.781 0.340
Dependent variable mean: 11.61, Number of observations: 116. Women Intercept
a7
exper
prose
doc
quant
lang2
Adjusted R2
8.643 0.052 0.072
0.098
7.921 0.782 3.527
0.000 0.436 0.001
8.586 0.043 0.074 0.009 0.001
-0.010
0.078
6.162 0.543 3.517 0.800 0.118
-0.756
0.000 0.588 0.001 0.426 0.907 0.451
8.381 0.040 0.074 0.009 0.002
-0.010 0.228 0.069
5.152 0.500 3.485 0.807 0.127
-0.762 0.247
0.000 0.618 0.001 0.422 0.899 0.448 0.806
Dependent variable mean: 11.01, Number of observations: 105.

126

127
A��EXES

128

129
Tab
le A
Cu
rren
t la
ngu
age
sett
ings
of
cou
ntr
ies
in S
tud
y I
(‘U
’=U
nil
ingu
al;
‘B
’=B
ilin
gu
al;
an
d ‘
T’=
Tri
lin
gu
al
) (1
/7)
C
olo
nia
l
La
ng
uag
e(s)
Off
icia
l
La
ng
uag
e(s)
�a
tio
na
l L
an
gua
ge(
s)
To
tal
�u
mb
er
of
La
ng
uag
e(s)
La
ng
uag
e(s)
of
Inst
ruct
ion
LiE
Sys
tem
L
an
gu
ag
e(s)
of
the
La
bo
r M
ark
et
Lin
gu
isti
c
Gro
up
(U,
B,
T)
An
go
la
Po
rtugues
e P
ort
ugues
e (d
e
fact
o)
Um
bu
nd
u,
Kim
bund
u,
Kik
on
go
, Q
uio
co a
nd
G
anguel
a.
41
Po
rtugues
e/A
ngo
lan
Po
rtugues
e P
ort
ugues
e unil
ing
ual
sy
stem
An
go
lan P
ort
ug
ues
e L
uso
pho
ne
(U)
Ben
in
Fre
nch
F
rench
>
50
, am
on
g w
hic
h
Fo
n,
Yo
roub
a, B
arib
a,
Ad
ja,
Go
un a
nd
Ayiz
o
are
the
mo
st s
po
ken
.
51
Fre
nch
(th
e nat
ional
la
ng
uag
es a
re o
nly
use
d i
n
no
n-f
orm
al e
duca
tio
n f
or
adult
lit
erac
y).
Fre
nch
unil
ing
ual
syst
em
Fre
nch
F
ranco
pho
ne
(U)
Bo
tsw
ana
Engli
sh
Engli
sh
Tsw
ana
30
Pri
mar
y:
Tsw
ana;
Sec
ond
ary a
nd
up
war
d:
Engli
sh
Bil
ing
ual
sy
stem
E
ngli
sh a
nd
Tsw
ana
Engli
sh-
spea
kin
g (
U)
Burk
ina
Fas
o
Fre
nch
F
rench
M
oo
ré (
or
Mo
ssi)
, D
ioula
and
Fo
ulf
oud
é (a
lso
cal
led
Fulb
é,
Peu
lar
or
Peu
l)
71
Fre
nch
and
Nat
ional
L
ang
uag
es1.
Fre
nch
unil
ing
ual
sy
stem
Fre
nch
F
ranco
pho
ne
(U)
Buru
nd
i F
rench
K
irund
i (d
e ju
re)
and
F
rench
(d
e fa
cto
)
N/A
3
G
rad
es 1
-3:
Kir
und
i;
Gra
des
4-6
: In
clu
sio
n o
f F
rench
;
Sec
ond
ary u
pw
ard
: F
rench
o
nly
Bil
ing
ual
sy
stem
K
irund
i, F
rench
(f
orm
al a
nd
off
icia
l se
ttin
gs)
, S
wah
ili
(mai
nly
in S
ME
) an
d E
ng
lish
(
busi
nes
s an
d t
rad
e)
Fra
nco
pho
ne
(B)
1 H
ow
ever
, in
pra
ctic
e, o
nly
Fre
nch
is
use
d a
s m
ediu
m o
f in
stru
ctio
n i
n f
orm
al e
duca
tio
n,
and
the
nat
ional
lan
guag
es o
nly
fo
r li
tera
cy p
rogra
ms.
129
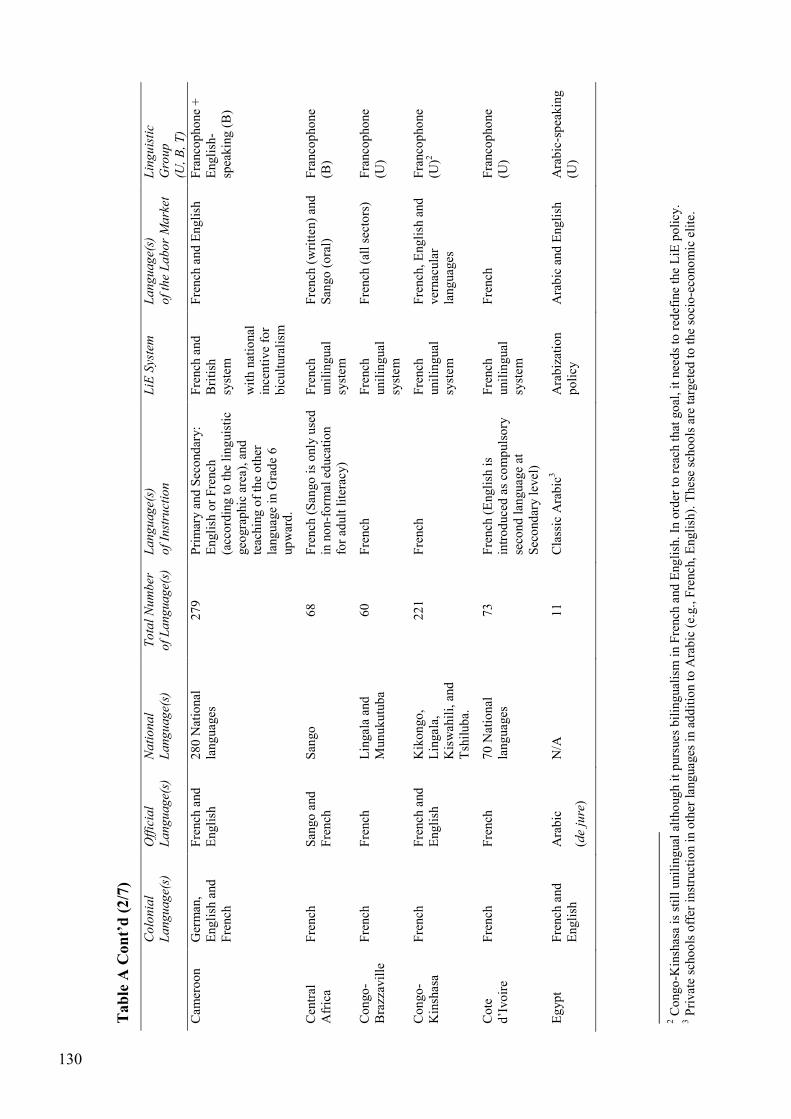
130
Tab
le A
Con
t’d
(2/7
)
C
olo
nia
l
La
ng
uag
e(s)
Off
icia
l
La
ng
uag
e(s)
�a
tio
na
l
La
ng
uag
e(s)
To
tal
�u
mb
er
of
La
ng
ua
ge(
s)
La
ng
uag
e(s)
of
Inst
ruct
ion
LiE
Sys
tem
L
an
gu
ag
e(s)
of
the
La
bo
r M
ark
et
Lin
gu
isti
c
Gro
up
(U,
B,
T)
Cam
ero
on
G
erm
an,
Engli
sh a
nd
F
rench
Fre
nch
and
E
ngli
sh
28
0 N
atio
nal
la
ng
uag
es
27
9
Pri
mar
y a
nd
Sec
ond
ary:
Engli
sh o
r F
rench
(a
cco
rdin
g t
o t
he
lin
guis
tic
geo
gra
phic
are
a),
and
te
achin
g o
f th
e o
ther
la
ng
uag
e in
Gra
de
6
up
war
d.
Fre
nch
and
B
riti
sh
syst
em
wit
h n
atio
nal
in
cen
tive
for
bic
ult
ura
lism
Fre
nch
and
En
gli
sh
Fra
nco
pho
ne
+
Engli
sh-
spea
kin
g (
B)
Cen
tral
A
fric
a F
rench
S
ango
and
F
rench
S
ango
6
8
Fre
nch
(S
ango
is
only
use
d
in n
on-f
orm
al e
duca
tio
n
for
adult
lit
erac
y)
Fre
nch
unil
ing
ual
sy
stem
Fre
nch
(w
ritt
en)
and
S
ango
(o
ral)
F
ranco
pho
ne
(B)
Co
ngo
-B
razz
avil
le
Fre
nch
F
rench
L
ingal
a an
d
Mun
uku
tub
a 6
0
Fre
nch
F
rench
unil
ing
ual
sy
stem
Fre
nch
(al
l se
cto
rs)
F
ranco
pho
ne
(U)
Co
ngo
-K
insh
asa
Fre
nch
F
rench
and
E
ngli
sh
Kik
on
go
, L
ingal
a,
Kis
wah
ili,
and
T
shil
ub
a.
22
1
Fre
nch
F
rench
unil
ing
ual
sy
stem
Fre
nch
, E
ngli
sh a
nd
ver
nac
ula
r la
ng
uag
es
Fra
nco
pho
ne
(U)2
Co
te
d’I
vo
ire
Fre
nch
F
rench
7
0 N
atio
nal
la
ng
uag
es
73
Fre
nch
(E
ngli
sh i
s in
tro
duce
d a
s co
mp
uls
ory
se
cond
lan
guag
e at
S
eco
nd
ary l
evel
)
Fre
nch
unil
ing
ual
sy
stem
Fre
nch
F
ranco
pho
ne
(U)
Eg
yp
t F
rench
and
E
ngli
sh
Ara
bic
(de
jure
)
N/A
1
1
Cla
ssic
Ara
bic
3
Ara
biz
atio
n
po
licy
A
rab
ic a
nd
En
gli
sh
Ara
bic
-sp
eakin
g
(U)
2 C
ongo
-Kin
shas
a is
sti
ll u
nil
ingual
alt
ho
ug
h i
t p
urs
ues
bil
ing
ual
ism
in F
rench
and
Eng
lish
. In
ord
er t
o r
each
that
go
al,
it n
eed
s to
red
efin
e th
e L
iE p
oli
cy.
3 P
rivat
e sc
ho
ols
off
er i
nst
ruct
ion i
n o
ther
lan
guag
es i
n a
dd
itio
n t
o A
rab
ic (
e.g.,
Fre
nch
, E
ngli
sh).
Thes
e sc
ho
ols
are
tar
get
ed t
o t
he
soci
o-e
cono
mic
eli
te.
130
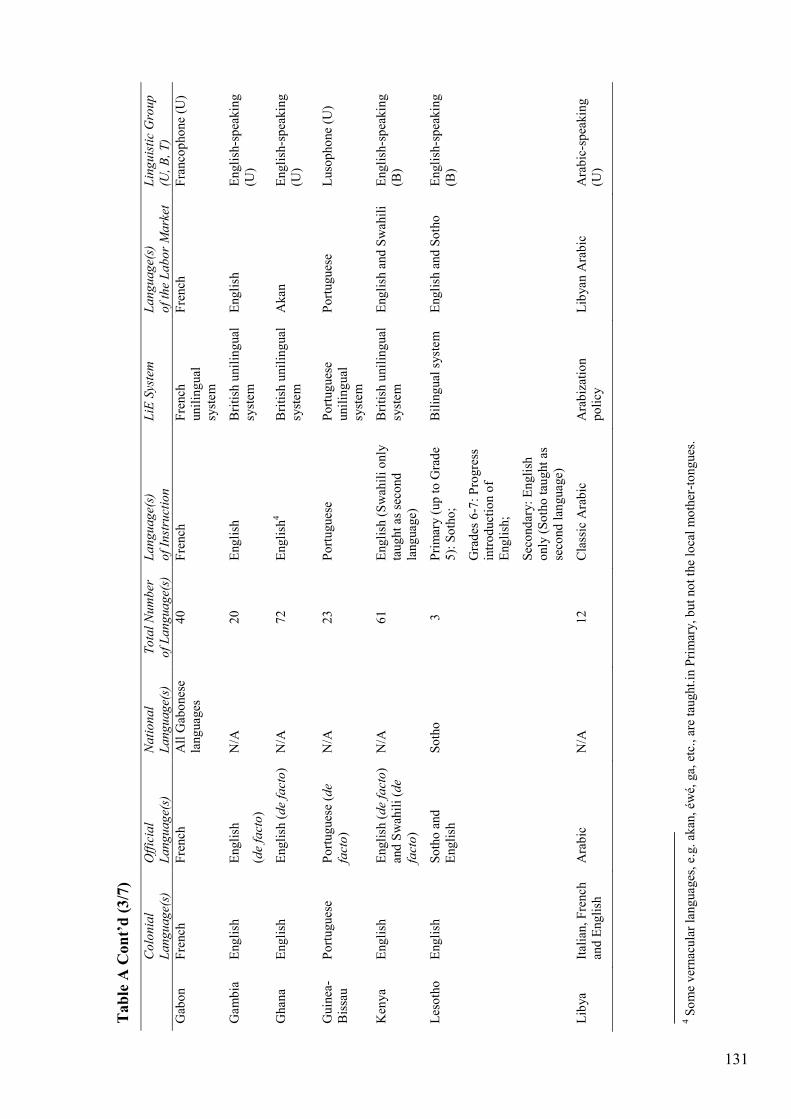
131
Tab
le A
Con
t’d
(3/7
)
C
olo
nia
l
La
ng
uag
e(s)
Off
icia
l
La
ng
uag
e(s)
�a
tio
na
l
La
ng
uag
e(s)
To
tal
�u
mb
er
of
La
ng
ua
ge(
s)
La
ng
uag
e(s)
of
Inst
ruct
ion
LiE
Sys
tem
L
an
gu
ag
e(s)
of
the
La
bo
r M
ark
et
Lin
gu
isti
c G
rou
p
(U,
B,
T)
Gab
on
Fre
nch
F
rench
A
ll G
abo
nes
e la
ng
uag
es
40
Fre
nch
F
rench
unil
ing
ual
sy
stem
Fre
nch
F
ranco
pho
ne
(U)
Gam
bia
E
ngli
sh
Engli
sh
(de
fact
o)
N/A
2
0
Engli
sh
Bri
tish
unil
ing
ual
sy
stem
E
ngli
sh
Engli
sh-s
pea
kin
g
(U)
Ghan
a E
ngli
sh
Engli
sh (
de
fact
o)
N/A
7
2
Engli
sh4
Bri
tish
unil
ing
ual
sy
stem
A
kan
E
ngli
sh-s
pea
kin
g
(U)
Guin
ea-
Bis
sau
P
ort
ugues
e P
ort
ugues
e (d
e
fact
o)
N/A
2
3
Po
rtugues
e P
ort
ugues
e unil
ing
ual
sy
stem
Po
rtugues
e L
uso
pho
ne
(U)
Ken
ya
Engli
sh
Engli
sh (
de
fact
o)
and
Sw
ahil
i (d
e
fact
o)
N/A
6
1
Engli
sh (
Sw
ahil
i o
nly
ta
ug
ht
as s
eco
nd
la
ng
uag
e)
Bri
tish
unil
ing
ual
sy
stem
E
ngli
sh a
nd
Sw
ahil
i E
ngli
sh-s
pea
kin
g
(B)
Les
oth
o
Engli
sh
So
tho
and
E
ngli
sh
So
tho
3
P
rim
ary (
up
to
Gra
de
5):
So
tho
;
Gra
des
6-7
: P
rogre
ss
intr
od
uct
ion o
f E
ngli
sh;
Sec
ond
ary:
En
gli
sh
only
(S
oth
o t
aught
as
seco
nd
lan
guag
e)
Bil
ing
ual
syst
em
Engli
sh a
nd
So
tho
E
ngli
sh-s
pea
kin
g
(B)
Lib
ya
Ital
ian,
Fre
nch
an
d E
ng
lish
A
rab
ic
N/A
1
2
Cla
ssic
Ara
bic
A
rab
izat
ion
po
licy
L
ibyan
Ara
bic
A
rab
ic-s
pea
kin
g
(U)
4 S
om
e ver
nac
ula
r la
ng
uag
es,
e.g.
akan
, éw
é, g
a, e
tc.,
are
tau
ght.
in P
rim
ary,
bu
t no
t th
e lo
cal
mo
ther
-to
ng
ues
.
131

132
Tab
le A
Con
t’d
(4/7
)
C
olo
nia
l
La
ng
uag
e(s)
Off
icia
l
La
ng
uag
e(s)
�a
tio
na
l
La
ng
uag
e(s)
To
tal
�u
mb
er
of
La
ng
ua
ge(
s)
La
ng
uag
e(s)
of
Inst
ruct
ion
LiE
Sys
tem
L
an
gu
ag
e(s)
of
the
La
bo
r M
ark
et
Lin
gu
isti
c G
rou
p
(U,
B,
T)
Mal
i F
rench
F
rench
A
ll M
alia
n
lang
uag
es
32
Pre
-pri
mar
y:
Mo
ther
-to
ng
ue;
Gra
des
1-3
: M
oth
er-t
ong
ue;
Gra
de
4
up
war
d:
Fre
nch
5.
Off
icia
lly:
bil
ing
ual
ism
;
In p
ract
ice:
F
rench
unil
ing
ual
sy
stem
Fre
nch
and
Bam
bar
a F
ranco
pho
ne
(U)
Mau
rita
nia
F
rench
C
lass
ic
Ara
bic
M
od
ern A
rab
ic,
Po
ula
r, S
onin
ké
and
Wo
lof
8
Mo
der
n A
rab
ic a
nd
Fre
nch
B
ilin
gual
ar
abiz
atio
n
po
licy
Cla
ssic
Ara
bic
and
F
rench
F
ranco
pho
ne
+
Ara
b-s
pea
kin
g
(B)
Mo
rocc
o
Fre
nch
C
lass
ic
Ara
bic
N
/A
11
Cla
ssic
Ara
bic
and
Fre
nch
(c
om
puls
ory
sec
ond
la
ng
uag
e)
Ara
biz
atio
n
po
licy
A
rab
ic,
Fre
nch
and
B
erb
ère
A
rab
ic-s
pea
kin
g
(U)
Mo
zam
biq
ue
Po
rtugues
e P
ort
ugues
e (d
e ju
re)
14
Nat
ional
la
ng
uag
es
33
Po
rtugues
e6
Po
rtugues
e unil
ing
ual
sy
stem
Po
rtugues
e L
uso
pho
ne
(U)
Nam
ibia
G
erm
an a
nd
E
ngli
sh
Engli
sh (
de
fact
o)
12
Nat
ional
la
ng
uag
es
28
Gra
des
1-3
: M
oth
er-
tong
ue
Gra
de
4:
Intr
od
uct
ion o
f E
ngli
sh
Gra
de
5 u
pw
ard
: E
ngli
sh
Mult
ilin
gual
sy
stem
A
frik
aan
s, E
ngli
sh
and
Ger
man
E
ngli
sh-
spea
kin
g (
B)
5 I
n p
ract
ice,
this
bil
ing
ual
syst
em i
s o
nly
ap
pli
ed i
n 3
00
sch
oo
ls o
ver
the
cou
ntr
y a
nd
Fre
nch
rem
ains
the
sole
med
ium
of
inst
ruct
ion f
rom
Gra
de
1 u
pw
ard
in m
ost
sc
ho
ols
. 6 C
urr
entl
y,
a new
syst
em o
f ed
uca
tio
n i
s ex
per
imen
ted
, in
clu
din
g 1
bil
ing
ual
ed
uca
tio
n p
rogra
m (
Po
rtug
ues
e an
d a
Mo
zam
biq
ue
lang
uag
e);
1 m
ono
lin
gual
pro
gra
m w
her
e th
e M
oza
mb
ique
lan
guag
es a
re o
nly
use
d a
s p
edag
ogic
al s
up
po
rt;
and
1 u
nil
ingual
syst
em w
her
e M
oza
mb
ique
lang
uag
es a
re t
aug
ht
as s
eco
nd
lan
guag
es.
132

133
Tab
le A
Con
t’d
(5/7
)
C
olo
nia
l
La
ng
uag
e(s)
Off
icia
l
La
ng
uag
e(s)
�a
tio
na
l
La
ng
uag
e(s)
To
tal
�u
mb
er
of
La
ng
ua
ge(
s)
La
ng
uag
e(s)
of
Inst
ruct
ion
LiE
Sys
tem
L
an
gu
ag
e(s)
of
the
La
bo
r M
ark
et
Lin
gu
isti
c G
rou
p
(U,
B,
T)
Nig
er
Fre
nch
F
rench
2
0 N
atio
nal
la
ng
uag
es
21
Pre
-pri
mar
y:
Mo
ther
-to
ng
ue
Gra
des
1-3
: N
atio
nal
la
ng
uag
es
Gra
de
4 u
pw
ard
: F
rench
Bil
ing
ual
sy
stem
F
rench
(w
ritt
en)
and
N
atio
nal
lan
guag
es
(ora
l)
Fra
nco
pho
ne
(U)
Nig
eria
E
ngli
sh
Engli
sh
Hau
sa,
Ibo
and
Y
oro
ub
a 4
70
Gra
des
1-3
: N
atio
nal
L
ang
uag
es (
En
gli
sh a
s se
cond
lan
guag
e);
Gra
de
4 u
pw
ard
: E
ngli
sh
Fo
reig
n
lang
uag
e p
rio
rity
sy
stem
Hau
sa,
Ibo
, Y
oro
ub
a an
d P
idgin
En
gli
sh
Engli
sh-s
pea
kin
g
(U)
Rw
and
a F
rench
K
inyar
wan
da,
F
rench
and
E
ngli
sh
N/A
3
G
rad
es 1
-3:
Kin
yar
wan
da;
G
rad
es 4
-6:
Fre
nch
; S
eco
nd
ary:
Kin
yar
wan
da
and
Fre
nch
(E
ng
lish
as
seco
nd
lan
guag
e)
Ter
tiar
y:
Fre
nch
or
Engli
sh7
Mult
ilin
gual
sy
stem
K
inyar
wan
da,
F
rench
and
En
gli
sh
Fra
nco
pho
ne
+
Engli
sh-s
pea
kin
g
(T)
Sen
egal
F
rench
F
rench
D
iola
, M
alin
ké,
P
oula
r, S
érèr
e,
So
nin
ké
and
W
olo
f
39
Pre
-pri
mar
y:
Mo
ther
-to
ng
ue;
G
rad
es 1
-3:
Mo
ther
-to
ng
ue;
P
rim
ary a
nd
Sec
ond
ary:
Wo
lof
and
Fre
nch
Mult
ilin
gual
sy
stem
W
olo
f an
d F
rench
F
ranco
pho
ne
(U)
Sie
rra
Leo
na
Engli
sh
Engli
sh (
de
fact
o)
N/A
2
3
Engli
sh
Bri
tish
unil
ing
ual
sy
stem
Engli
sh,
Kri
ol,
M
end
é an
d T
hem
né
Engli
sh-s
pea
kin
g
(U)
7 A
fter
19
96
, th
e la
rge
amo
unt
of
refu
gee
s re
turn
ing f
rom
Ug
and
a an
d T
anza
nia
has
rai
sed
a n
ew i
ssue:
tho
usa
nd
s o
f ch
ild
ren c
ould
only
rea
d o
r w
rite
in E
ngli
sh a
nd
no
t at
al
l in
Fre
nch
. T
her
efo
re,
the
Rw
and
an M
inis
try o
f E
duca
tio
n h
as c
reat
ed i
nte
nsi
ve
sup
po
rt c
lass
es i
n F
rench
and
En
gli
sh i
n t
he
scho
ols
wh
ere
it w
as j
ud
ged
nec
essa
ry
(esp
ecia
lly a
t th
e S
eco
nd
ary a
nd
Ter
tiar
y l
evel
s).
133

134
Tab
le A
Con
t’d
(6/7
)
C
olo
nia
l
La
ng
uag
e(s)
Off
icia
l
La
ng
uag
e(s)
�a
tio
na
l
La
ng
uag
e(s)
To
tal
�u
mb
er
of
La
ng
uag
e(s)
La
ng
uag
e(s)
of
Inst
ruct
ion
LiE
Sys
tem
L
an
gu
ag
e(s)
of
the
La
bo
r M
ark
et
Lin
gu
isti
c
Gro
up
(U,
B,
T)
So
uth
A
fric
a E
ngli
sh a
nd
A
frik
aan
s N
atio
nal
: E
ngli
sh,
Afr
ikaa
ns
Pro
vin
cial
: N
déb
élé,
S
oth
o,
Ses
oth
o,
Sw
azi,
T
songa,
Tsw
ana,
V
end
a, X
ho
sa a
nd
Z
oulo
u.
N/A
2
7
Pre
-pri
mar
y a
nd
Pri
mar
y:
mo
ther
-to
ng
ue
inst
ruct
ion
(if
one
of
the
loca
l o
ffic
ial
lang
uag
es)
and
sec
ond
la
ng
uag
e le
arnin
g (
oft
en
Engli
sh o
r A
fro
kaa
ns)
;
Sec
ond
ary u
pw
ard
: P
rogre
ssiv
e m
ove
tow
ard
s E
ngli
sh a
nd
/or
Afr
ikaa
ns.
Mult
ilin
gual
sy
stem
E
ngli
sh
Engli
sh-
spea
kin
g (
B)
Sw
azil
and
A
frik
aan
s an
d E
ng
lish
E
ngli
sh a
nd
Sw
ati
(de
jure
) N
/A
3
Pri
mar
y:
Sw
ati
(En
gli
sh a
s se
cond
lan
guag
e);
Sec
ond
ary:
En
gli
sh (
Sw
ati
as s
eco
nd
lan
guag
e)
Mai
nly
B
riti
sh
syst
em
Engli
sh
Engli
sh-
spea
kin
g (
B)
Tan
zania
E
ngli
sh
Engli
sh (
de
fact
o)
and
S
wah
ili
(de
fact
o)
N/A
1
31
Pri
mar
y:
Sw
ahil
i;
Sec
ond
ary:
En
gli
sh
Bil
ing
ual
sy
stem
S
wah
ili
(ora
l),
Engli
sh (
wri
tten
) E
ngli
sh-
spea
kin
g (
B)
To
go
Fre
nch
F
rench
E
wé
and
Tem
4
3
Pre
-pri
mar
y:
Nat
ional
la
ng
uag
es a
nd
Fre
nch
;
Pri
mar
y u
pw
ard
: F
rench
Fre
nch
unil
ing
ual
sy
stem
Fre
nch
(w
ritt
en)
and
nat
ional
lan
guag
es
(ora
l)
Fra
nco
pho
ne
(U)
Tunis
ia
Fre
nch
C
lass
ic A
rab
ic
N/A
9
P
re-p
rim
ary a
nd
Gra
des
1-
3:
Ara
bic
;
Gra
de
4 u
pw
ard
: A
rab
ic
and
Fre
nch
Bil
ing
ual
sy
stem
T
unis
ian d
iale
ctic
A
rab
ic a
nd
Fre
nch
A
rab
ic-
spea
kin
g (
U)
Zam
bia
E
ngli
sh
Engli
sh
7 N
atio
nal
la
ng
uag
es
39
Pri
mar
y:
En
gli
sh;
Sec
ond
ary:
En
gli
sh a
nd
N
atio
nal
lan
guag
es (
no
t ap
pli
ed m
uch
in p
ract
ice)
.
Bil
ing
ual
sy
stem
E
ngli
sh
Engli
sh-
spea
kin
g (
U)
134

135
Tab
le A
Con
t’d
(7/7
)
C
olo
nia
l
La
ng
uag
e(s)
Off
icia
l
La
ng
uag
e(s)
�a
tio
na
l
La
ng
uag
e(s)
To
tal
�u
mb
er
of
La
ng
ua
ge(
s)
La
ng
uag
e(s)
of
Inst
ruct
ion
LiE
Sys
tem
L
an
gu
ag
e(s)
of
the
La
bo
r M
ark
et
Lin
gu
isti
c
Gro
up
(U,
B,
T)
Zim
bab
we
Engli
sh a
nd
A
frik
aan
s E
ngli
sh,
Sho
na,
N
déb
élé,
Ven
da,
N
amb
ya,
Shan
gaa
n,
Kal
anga,
So
uth
ou a
nd
T
onga
(de
jure
)
Sho
na,
N
déb
élé,
and
o
ther
Z
imb
abw
ean
lang
uag
es
19
Pre
-pri
mar
y:
Nat
ional
la
ng
uag
es (
En
gli
sh o
nly
in
larg
e urb
an a
reas
);
Gra
des
1-3
: M
oth
er-
tong
ue;
Gra
de
4 u
pw
ard
: E
ngli
sh.
Mult
ilin
gual
sy
stem
E
ngli
sh,
Sho
na
and
N
déb
élé
Engli
sh-
spea
kin
g (
T)
So
urc
e: A
dap
ted
fro
m L
ecle
rc,
J. (
20
06).
L’a
mén
ag
emen
t li
ng
uis
tiq
ue
dan
s le
mo
nd
e. Q
uéb
ec:
TL
FQ
, U
niv
ersi
té L
aval
. U
RL
: [h
ttp
://w
ww
.tlf
q.u
laval
.ca/
axl.
htm
] (J
un
e 1
7,
20
06).
No
te:
In a
ll t
he
abo
ve
cou
ntr
ies,
wher
ever
ap
pli
cab
le,
Cla
ssic
Ara
bic
is
the
med
ium
of
inst
ruct
ion i
n Q
ur’
anic
sch
oo
ls.
135

136
Table B Current external settings of countries in Study I
(economic and financial dependency)
Primary Trade Partners (Export-Import) Primary Bilateral Donor
Angola US-South Corea Portugal Benin Nigeria-China France Botswana European Free Trade Association (EFTA)-
Southern African Customs Union (SACU) U.S.
Burkina Faso Ghana-France France Burundi Switzerland-Kenya U.S. Cameroon Spain-France France Central Africa Belgium-France France Comoros US-France France Congo-Brazzaville China-France France Congo-Kinshasa Belgium-South Africa U.S. Cote d’Ivoire France-France France Egypt Italy-US U.S. Gabon US-France France Gambia India-China Japan Ghana Netherlands-Nigeria Japan Guinea-Bissau India-Senegal Italy Kenya Uganda-UAE U.S. Lesotho US-Hong Kong Ireland Liberia Denmark-South Korea U.S. Libya Italy-Italy France Mali China-France France Mauritania Japan-France Japan Morocco France-France France Mozambique Netherlands-South Africa U.S. Namibia South Africa-South Africa Germany Niger France-France France Nigeria US-China U.S. Rwanda Indonesia-Kenya U.S. Senegal India-France France Sierra Leone Belgium-Germany U.K. South Africa US-Germany U.K. Swaziland South Africa-South Africa Netherlands Tanzania India-South Africa U.K. Togo Burkina Faso-China France Tunisia France-France France Zambia South Africa-South Africa U.K. Zimbabwe South Africa-South Africa U.K.
Sources: CIA. (2006). The World Fact Book 2006. URL: [http://www.cia.gov/cia/publications/factbook/], (June 18, 2006). OECD. (2006). Aid Statistics, Recipient Aid Charts. URL: [http://www.oecd.org/countrylist/0,2578,en_2649_34447_25602317_1_1_1_1,00.html], (June 18, 2006). WTO. (2006). Statistics Country Profiles March 2006. URL: [http://stat.wto.org/CountryProfiles/], (June 18, 2006).

137
Publications
Studies in International and Comparative Education
1. Sixten Marklund Educational
Administration and Educational
Development, ISBN: 91-85996-00-2.
October 1979
2. Sixten Marklund The Democratization of
Education in Sweden. A Unesco Case
Study, ISBN: 91-85966-01-0. October
1980
3. Alex Gorham Education and Social
Change in a Pastoral Society:
Government Initiatives and Local
Responses to Primary School Provision in
Kenya Maasailand, ISBN: 91-85966-02-9.
December 1981
4. Ulla Kann Career Development in a
Changing Society: The Case of Botswana,
ISBN: 91-85966-03-7. March 1981
5. Mauno Mbamba Primary Education for an
Independent Namibia: Planning in a
Situation of Uncertainty and Instability,
ISBN: 91-22-0661-7. March 1982
6. Roland Duberg Schooling, Work
Experience and Earnings: A Study of
Determinants of Earning in a Third World
Corporate Setting, ISBN: 91-85966-05-3.
June 1982
7. Ann-Margret Fris Policies for Minority
Education: A Comparative Study of Britain
and Sweden, ISBN: 91-85966-06-1.
October 1982
8. Vinayagum Chinapah Participation and
Performance in Primary Schooling: A
Study of Equality of Educational
Opportunity in Mauritius, ISBN: 91-7146-
417-4. September 1983
9. Kjell Nyström Schooling and Disparities:
A Study of Regional Differences in Sri
Lanka, ISBN: 91-7146-453-0. November
1985
10. Ingemar Gustafsson Schools and the
Transformation of Work: A Comparative
Study of Four Productive Work
Programmes in Southern Africa,, ISBN:
91-7146-479-4. 1987
11. Vasilios Makrakis Computers in School
Education: The Cases of Sweden and
Greece, ISBN: 91-7146-398-4. March
1988
12. Agneta Lind Adult Literacy Lessons and
Promises: Mozambican Literacy
Campaigns 1978-1982, ISBN: 91-7146-
587-1. July 1988
13. Birgit Negussie Traditional Wisdom and
Modern Development: A Case Study of
Traditional Peri-Natal Knowledge Among
Elderly Women in Southern Shewa,
Ethiopia, ISBN: 91-7146-712-2. December
1988
14. Anton Johnston Study, Produce and
Combat! Education and the Mozambican
State 1962-1984, ISBN: 91-7146-720-3.
March 1989
15. Christine McNab Language Policy and
Language Practice: Implementation
Dilemmas in Ethiopian Education, ISBN:
91-7146-732-7. April 1989
16. Wendy Duncan Engendering School
Learning: Science, Attitudes and
Achievement Among Girls and Boys in
Botswana, ISBN: 91-7146-75-8. April
1989

138
17. Eva Olkiewicz Invandrarfamiljer i
förändring: En studie över finska och
jugoslaviska invandrar-ungdomar och
deras föräldrar, ISBN: 91-7146-836-6.
April 1990
18. Hanne Bang Religious Identity over Two
Generations: Roman Catholic Immigrant
and Convert Families in Sweden, ISBN:
91-7146-834-X. April 1990
19. Maria Emília Catela Education Reform
and Political Transition: A Study of
Change in Portuguese Education in the
1970s, ISBN: 91-7146-842-0. July 1990
20. Ingemar Fägerlind, Sixten Marklund
and Vinayagum Chinapah (eds) Torsten
Husén. An Educator, ISBN: 91-630-0377-
5. 1991
21. Ulla Sirén Minority Language
Transmission in Early Childhood: Parental
Intention and Language Use, ISBN: 91-
7146-920-6. May 1991
22. Alf Carlsson Cooperatives and the State:
Partners in Development? A Human
Resource Perspective, ISBN: 91-7153-
013-4. May 1992
23. Vinayagum Chinapah (ed.) Strategies
and Modalities for Educational Financing
in Africa, ISBN: 91-7153-049-5. December
1992
24. Holger Daun Childhood Learning and
Adult Life: The Functions of Indigenous,
Islamic and Western Education in an
African Context, ISBN: 91-7153-062-2.
1992
25. Gary Miron Choice and the Use of Market
Forces in Schooling: Swedish Education
Reforms for the 1990s, ISBN: 91-7153-
107-6. 1993
26. Zhao Shangwu Chinese Science
Education: A Comparative Study of
Achievement in Secondary Schools
Related to Student, Home and School
Factors, ISBN: 91-7153-119-X. 1993
27. Paul Pawar Training for the New
Competition: Applications of Critical
Theory to Industrial Relations Training in
Kenya and Nigeria, ISBN: 91-7153-155-6.
1993
28. Jan-Åke Engström Science Achievement
and Student Interest: Determinants of
Success in Science among Swedish
Compulsory School Students, ISBN: 91-
7153-180-7. 1994
29. Geoffrey Nambira Educating Children
with Hearing Impairments in Tanzania:
Comparing Regular and Special Schools,
ISBN: 91-7153-239-0. September 1994
30. Fatima Salah Media Selection: Measuring
the Effectiveness of a Media Selection
Procedure in Moroccan Secondary School
Context, ISBN: 91-7153-240-4. 1994
31. Riitta Eriksson Biculturalism in Upper
Secondary Education: The Long Term
Effects of Finnish Language Programs on
Students' Educational and Occupational
Careers, ISBN: 91-7153-238-2. June 1994
32. Gary Miron Special Needs Education in
Nicaragua: A Study of the Prevalence of
Children with Disabilities in Primary
Schools and the Factors Affecting Their
Successful Participation, ISBN: 91-7153-
292-7. 1994
33. Nelly Kostoulas-Makrakis Language
Maintenance or Shift? A Study of Greek
Background Students in Sweden, ISBN:
91-7153-328-1. April 1995

139
34. Elisei Basil Temu Successful Schools in
Tanzania: A Case Study of Academic and
Production Programs in Primary and
Secondary Schools, ISBN: 91-7153-382-
6. 1995
36. Torsten Husén Printed Publications 1981
– 1995 (In Commemoration of his 80th
Birthday), ISBN: 91-7153-439-3. 1996
37. Xiaoda Chen Quality Schooling with
Limited Resources: An International
Comparison of Mathematics and Science
Education in China, Korea and Hungary,
ISBN: 91-7153-465-2. June 1996
38. Anne Welle-Strand Policy, Evaluation
and Leadership: The Context of
Educational Change in Zimbabwe, ISBN:
91-7353-468-7. June 1996
39. Sixten Marklund Printed Publications
1956-1996 (In Commemoration of his 75th
Birthday), ISBN: 91-7153-507-1.
September 1996
39. (a) Romanus Ejiaga Higher Education
and the Labor Market: A Study of
University Access and Graduate
Employment Opportunities in Nigeria,
ISBN: 91-7153-669-8. November 1997
40. (a) Paul Vedder and Mina O'Dowd
Social Competence in Swedish Primary
School Pupils: The Validity of the RCP-
Scale, ISBN: 91-7153-560-8. 1996
40. Karen Sørensen Polish Higher Education
En Rout to the Market: Institutional
Change and Autonomy at Two Economics
Academies, ISBN: 91-7153-672-8.
December 1997
41. Luciana Benincasa A Journey, a
Struggle, a Ritual: Higher Education and
the Entrance Examinations in a Greek
Province Town, ISBN: 91-7153-688-4.
1997
42. Anne Welle-Strand Educational
Evaluation in Norwegian Development
Aid: Does Competence in Education Make
a Difference?, ISBN: 91-7153-730-9. 1998
43. Catherine A. Odora Hoppers Structural
Violences as a Constraint to African Policy
Formation in the 1990s: Repositioning
Education in International Relations,
ISBN: 91-7153-806-2. 1998
44. Liu Bing The State, Ethnic Identity and
Education: A Study of Primary Schooling
for Minorities in Xinjiang and Inner
Mongolia in China, ISBN: 91-7153-832-1.
November 1998
45. Teshome Nekatibeb Media Utilization
and School Improvement: A Case Study
of Primary Education Radio Support
Programs in Ethiopia, ISBN: 91-7153-837-
2 November 1998
46. Kah Slenning Future School
Management. Do Plans and Needs
Match? A Comparative Study with
Examples from Four OECD Countries,
ISBN: 91-7153-914-X. May 1999
47. Indra Dedze Reading Ability of Latvian
Students. Results from an International
Study, ISBN: 91-7153-981-6. October
1999
48. Ingemar Fägerlind, Içara Holmesland,
and Görel Strömqvist (eds) Higher
Education at the Crossroads: Tradition or
Transformation?, ISBN: 91-7265-021-4.
1999
49. Mina O'Dowd The Changing Nature of
Knowledge: Mapping the Discourse of the
Malmö Longitudinal Study, 1939-1995,
ISBN: 91-7265-088-5. May 2000
50. Alexander N. Kanaev Civic Education in
Central Asia: Re-conceptualization of
Citizenship in Newly Independent States,
ISBN: 91-7265-083-4. 2000

140
51. Wycliffe H. Odiwour HIV/Aids and
Primary Education in Kenya. Effects and
Strategies, ISBN: 91-72-65-089-3. June
2000
52. Mina O'Dowd and Ingemar Fägerlind
(eds) Mapping European Comparative
Education Research Perspectives. The
PRESTiGE TMR Network, ISBN: 91-7265-
128-8. 2000
53. Yu Qiang Bilingual Education, Cognitive
Development and School Achievement: A
Study of the Bilingual Programs for
Tibetan Children, ISBN: 91-7265-132-6.
2000
54. Wycliffe Humphrey Odiwuor The Impact
of HIV/Aids on Primary Education. A Case
Study of Selected Districts of Kenya,
ISBN: 91-7265-140-7. Sep. 2000
55. Elizabeth F. Heen The Research
University: Quo Vadis? Doctoral Research
Training in Economics – Case Studies
from France and Norway, ISBN: 91-7265-
190-3. December 2000
56. Marit Storeng Giving Learners a Chance:
Learner-Centredness in the Reform of
Namibian Teaching, ISBN: 91-7265-236-
5. March 2001
57. Emmanuel Boudard Literacy Proficiency,
Earnings, and Recurrent Training: A Ten
Country Comparative Study, ISBN: 91-
7265-356-6. December 2001.
58. Anne Smehaugen Inclusion & Exclusion
in Culture, Learning and Education: A
European Perspective. The Cases of
Spain and Norway, ISBN: 91-7265-366-3.
November 2001
59. Dinah Richard Mmbaga The Inclusive
Classroom in Tanzania: Dream or Reality?
2002, ISBN: 91-7265-441-4. May 2002
60. Ulf Fredriksson Reading Skills among
Students of Immigrant Origin in
Stockholm, ISBN: 91-7265-460-0. May
2002
61. Ann-Kristin Boström Lifelong Learning,
Intergenerational Learning, and Social
Capital, ISBN: 91-7265-571-2. February
2003
62. Katrina Hugosson Working Life,
Sustainable Health and Retirement for
Women, ISBN: 91-7265-662-X. May 2003
63. Michiyo Kiwako Okuma-Nyström God
Turns the Chapter and Everything
Changes: Children's Socialization in Two
Gambian Villages, ISBN: 91-7265-656-5
ISSN: 0348-095-023. June 2003
64. Nuzzly Ruiz de Forsberg School
Community Voices: Implementation of the
Autonomous School Program in
Nicaragua, ISBN: 91-7265-739-1 ISSN:
0348-095-023. October 2003
65. Richard Desjardins Learning for Well
Being: Studies using the International
Adult Literacy Survey, ISBN: 91-7265-
792-8. March 2004
66 Lidija Kolouh-Westin Learning
Democracy Together in School? Student
and Teacher Attitudes in Bosnia and
Hercegovina, ISBN: 91-7265-828-2. April
2004.
67. Richard Desjardins, Christelle
Garrouste-Norelius, Shawn Mendes.
Benchmarking Education and Training
Systems in Europe, ISBN: 91-7265-915-7
June 2004
68. Lihong Huang Elitism and Equality in
Chinese Higher Education. Studies of
Student Socio-economic Background,
Investment in Education, and Career
Aspirations, ISBN: 91-7155-063-1 June
2005

141
69. Sheila Brooks Learning Motivation in
International Primary Schools: The Voices
of Children, ISBN: 91-7155-129-8 October
2005
70. Ernesto Villalba The uniqueness of
knowledge management in small
companies: Knowledge management as a
strategy for lifelong learning, ISBN: 91-
7155-252-9 June 2006
71. Mikiko Cars Project Evaluation in
Development Cooperation: A Meta-
Evaluative Case Study in Tanzania; ISBN:
91-7155-319-3. October 2006
72. Pia Karlsson, Amir Mansory An Afghan
Dilemma: Education, Gender and
Globalisation in an Islamic Context; ISBN:
November 2007
73. Björn Söderqvist School Leaders’ View
on Market Forces and Decentralization;
ISBN: November 2007
74. Christelle Garrouste Determinants and
consequences of Language-in-Education
Policies: Essays in Economics of
Education; ISBN: 978-91-7155-517-5.
December 2007