Embed Size (px)
Citation preview

N a t i o n a l C e r t i f i c a t e : G e n e r i c M a n a g e m e n t
( S u s t a i n a b i l i t y L e a d e r s h i p )
US ID 252040 Learner Guide
Manage the finances of a unit
i | P a g e
Table of Contents Table of Contents ............................................................................................. i
UNIT STANDARD 252040 ................................................................................... 1
SECTION 1: UNDERSTAND THE KEY CONCEPTS OF MANAGERIAL FINANCE ...................... 5
1.1 Understanding the Key Concepts of Managerial Finance ....................................... 5
a. The Accounting Cycle (SO1 AC1) ........................................................................... 7
b. Inventories ................................................................................................... 13
c. Revenue ...................................................................................................... 16
d. Using IFRS in Financial Analysis .......................................................................... 17
e. Calculating Ratios according to IFRS .................................................................... 18
f. The Role of Budgeting and Forecasting in Strategic Planning (SO1 AC2) ......................... 19
g. The Accounting Conventions applied in Financial Management (SO1 AC3) ...................... 22
h. The Financial Reports Published in the Organisation (SO1 AC4) ................................... 24
2.1 Interpreting Financial Statements (SO2 AC1) .................................................. 28
a. Purpose of Financial Analysis ............................................................................. 28
b. Financial Analysis Users ................................................................................... 29
c. Analyse Financial Statements ............................................................................ 30
d. Ratio Analysis ............................................................................................... 32
e. Apply Ratios to Measure Profitability and Liquidity (SO2 AC2) ..................................... 34
f. Apply Ratios to Measure Working Capital and Asset Utilisation (SO2 AC3) ....................... 36
g. Apply Ratios to Measure Return (SO2 AC4) ............................................................ 38
h. Make Recommendations based on Ratio Analysis (SO2 AC5) ........................................ 39
i. Applying Ratios to measure Profitability ............................................................... 43
j. Applying Ratios to measure Working Capital and Asset Utilisation ................................ 46
k. Making Recommendations after an Analysis ........................................................... 49
SECTION 3: DESCRIBE AND PREPARE FINANCIAL FORECASTS .................................... 50
3.1 Describing and Preparing Financial Forecasts ................................................. 50
a. Analysing Past Performance, Recognising Opportunities and Planning for the Future (EEK4) 51
b. Identifying Opportunities for Growth ................................................................... 52
c. Identify Types and Formats of Financial Forecasts (SO3 AC1) ...................................... 53
d. Trend Analysis ............................................................................................... 54
e. Identify Sources of Financial Forecasts ................................................................. 56
f. Analyse Financial Forecasts to Determine Viability (SO3 AC5) ..................................... 57
g. Using Liquidity Ratios to Analyse the Organisation’s Viability ..................................... 58
h. Using Leverage Ratios to Analyse the Organisation’s Viability ..................................... 59
SECTION 4: DRAFT BUDGETS ACCORDING TO THE OPERATIONAL PLAN ....................... 62
4.1 Drafting Budgets according to the Operational Plan ......................................... 62
ii | P a g e
a. Link Budget Plans to Operational Objectives (SO4 AC1)............................................. 62
b. Establish Operational Objectives (SO4 AC2) ........................................................... 63
c. Formulate the Budget (SO4 AC3) ........................................................................ 65
d. Analysing Past Trends in the Budget .................................................................... 68
e. Review and Modify the Drafted Budget (SO4 AC4) ................................................... 70
SECTION 5: SUPERVISE FINANCIAL MANAGEMENT OF A UNIT .................................... 72
Supervising Financial Management of a Unit ....................................................... 72
a. Agree and Adhere to Monitoring Systems (SO5 AC1) ................................................. 76
b. Monitor Expenditure Reports (SO5 AC2) ................................................................ 77
c. Implement Corrective Actions where Necessary (SO5 AC3) ......................................... 77
References and Further Reading ..................................................................... 79
1 | P a g e
UNIT STANDARD 252040
Title
Manage the finances of a unit
NQF Level
5
Credits
8
Purpose Of The Unit Standard
This unit standard is intended for managers in all economic sectors. These managers would typically be second level managers such as heads of department, section heads or divisional heads, who may have more than one team reporting to them.
The qualifying learner is capable of:
▪ Demonstrating an understanding of the key concepts of managerial finance.
▪ Interpreting financial statements.
▪ Drafting financial forecasts.
▪ Drafting budgets according to operational plans of the unit.
▪ Supervising the financial management of a unit against given requirements.
Learning Assumed To Be In Place And Recognition Of Prior Learning
It is assumed that learners are competent in:
▪ Communication at NQF Level 4.
▪ Mathematical Literacy at NQF Level 4.
▪ Computer Literacy at NQF Level 4.
Unit Standard Range
▪ The learner is required to apply the learning in respect of this/her own area of responsibility.
▪ The learner will be required manages the financial resources of the unit by developing forecasts and budgets.
▪ Unit refers to the division, department or business unit in which the learner is responsible for managing and leading staff.
▪ Entity includes, but is not limited to, a company, business unit, public institution, small business, Non-Profit Organisation or Non-Governmental Organisation.
▪ GAAP refers to Generally Accepted Accounting Practices.
2 | P a g e
Specific Outcomes and Assessment Criteria:
Specific Outcome 1
Demonstrating an understanding of the key concepts of managerial finance.
Assessment Criteria
▪ The accounting cycle is explained by means of a diagram.
▪ The role of budgeting and forecasting in the strategic planning process is explained with reference to the manager's specific organisational context.
▪ The accounting conventions applied in the financial management of a unit are explained with examples.
➢ RANGE The accounting conventions include consistency, going concern, prudence, realisation, disclosure, objectivity and matching.
▪ The financial reports published by the manager's entity are explained with examples.
➢ RANGE The financial reports include audit reports, Statement of Comprehensive Income (Income Statement), Statement of Cash Flows and Statement of Financial Position (balance sheet).
Specific Outcome 2
Interpret financial statements.
Assessment Criteria
▪ Financial statements are analysed, using data sources identified and evaluated for authenticity and accuracy.
▪ The ratios are applied to measure the profitability and liquidity of an entity.
▪ The ratios are applied to measure the working capital and asset utilisation of an entity.
▪ The ratios are applied to measure the return of an entity.
➢ RANGE Return ratios include, return on equity, return on investment and debt ratio.
▪ Recommendations are made regarding the profitability of, liquidity, working capital, return and resource utilisation by the entity using the results obtained from the application of the ratios.
Specific Outcome 3
Describe and prepare financial forecasts.
Assessment Criteria
▪ The types and formats of financial forecasts are identified with examples.
▪ Sources of financial forecasts are identified as per the entity's standard practice.
▪ Factors in preparing financial forecasts are outlined in line with entity's standard operating procedures.
▪ Relevant factors are incorporated in the preparation of financial forecasts.
▪ Financial forecasts are analysed to determine viability against the entity's requirements.
Specific Outcome 4
Draft budgets according to the operational plan of the unit.
3 | P a g e
Assessment Criteria
▪ Budget plans are linked to operational objectives.
▪ Operational objectives are established in line with the unit's strategic plan.
▪ The budget is formulated according to standard operating procedures.
▪ Drafted budget is reviewed, reflected on and modified to ensure alignment to the operational plan of the unit.
Specific Outcome 5
Supervise financial management of a unit against given requirements.
Assessment Criteria
▪ Monitoring systems are agreed and adhered to, according to standard operating procedures.
▪ Expenditure reports are monitored for the year for each team within the unit against given criteria.
▪ Corrective actions are implemented where necessary in accordance with the entity's policies and procedures.
Unit Standard Accreditation And Moderation Options
▪ Anyone assessing a candidate against this Unit Standard must be registered as an assessor with the relevant ETQA or an ETQA that has a Memorandum of Understanding with the relevant ETQA.
▪ Any institution offering learning that will enable achievement of this Unit Standard must be accredited as a provider through the relevant ETQA or an ETQA that has a Memorandum of Understanding with the relevant ETQA.
▪ Moderation of assessment will be overseen by the relevant ETQA according to the moderation guidelines and the agreed ETQA procedures.
Unit Standard Essential Embedded Knowledge
▪ Understand the difference between finance and accounting.
▪ Understanding financial relationships.
▪ Understanding of trends and ratios.
▪ Understanding how to analyse past performance, recognise opportunities and plan for the future.
▪ Financial performance measurement techniques.
Critical Cross-field Outcomes (CCFO):
Unit Standard CCFO Identifying
Identify and solve problems through making recommendations to address discrepancies.
4 | P a g e
Unit Standard CCFO Working
Work effectively with others when gathering information for financial ratio analysis.
Unit Standard CCFO Organising
Organise and manage oneself and one`s activities when calculating ratios and reporting findings.
Unit Standard CCFO Collecting
Collect, evaluate, organise and critically evaluate information when monitoring expenditure against budget.
Unit Standard CCFO Communicating
Communicate effectively with stakeholders in written reports.
Unit Standard CCFO Science
Use science and technology formulating a capital budget.
Unit Standard CCFO Demonstrating
Demonstrate an understanding of the world as a set of related systems showing how the results of the unit impact on the whole entity.
5 | P a g e
SECTION 1: UNDERSTAND THE KEY CONCEPTS OF MANAGERIAL FINANCE
Specific Outcome 1
Demonstrating an understanding of the key concepts of managerial finance.
Assessment Criteria
1. The accounting cycle is explained by means of a diagram.
2. The role of budgeting and forecasting in the strategic planning process is explained with reference to the manager's specific organisational context.
3. The accounting conventions applied in the financial management of a unit are explained with examples.
RANGE The accounting conventions include consistency, going concern, prudence, realisation, disclosure, objectivity and matching.
4. The financial reports published by the manager's entity are explained with examples.
RANGE The financial reports include audit reports, Statement of Comprehensive Income (Income Statement), Statement of Cash Flows and Statement of Financial Position (balance sheet).
1.1 Understanding the Key Concepts of Managerial Finance Financial figures, by themselves, usually do not mean much. When you compare the financial figures with certain other numbers you can learn much about how your organisation is doing. For example, you can compare the planned expenses depicted in your budget with your actual expenses to see if your spending is on track. You could also use ratios to analyse the financial figures. A ratio is a comparison made by dividing one figure by another, such as how salaries are related to the total expenses for a department to find the implications thereof.
✓ Difference between Finance and Accounting (EEK1)
Finance may be considered to be “The science of money”. It studies the principles and the methods of obtaining control of money from those who have saved it, and of administering it by those into whose control it passes.
Finance is the process of conversion of accumulated funds to productive use. It is so inter-connected with other economic forces that there is difficulty in appreciating the role it plays.
Howard and Uptron1 in their book’s introduction to Business Finance defined finance “as that administrative area or set of administrative function in an organization which relate with the arrangement of cash and credit so that the organization may have the means to carry out its objectives as satisfactorily as possible”.
1 ICWAI Finance Related Discipline - Financial Management & International Finance study material; www.scribd.com/doc/28899183/
6 | P a g e
In simple terms, finance is defined as the activity concerned with the planning, raising, controlling and administering of the funds used in the business.
Financial management is managerial activity which is concerned with the planning and controlling of the firm’s financial resources. Financial Management is an integral part of the overall management of other disciplines and fields of study like economics, accounting, production, marketing, personnel and quantitative methods. The relationship between financial management and other fields of study is explained as below:
Accounting and finance are closely related. Accounting is an important input in financial decision-making processes. Accounting is concerned with the recording of business transactions. It generates information relating to business transactions and reporting them to the concerned parties. The end product of accounting is financial statements namely, profit and loss account, Statement of Financial Position (balance sheet) and the statements of changes in financial position. The information contained in these statements assists the financial managers in
7 | P a g e
evaluating the past performance and future direction of the firm (decisions) in meeting certain obligations like payment of taxes and so on. Thus, accounting and finance are closely related.
Financial analysis starts with accounting. Accounting is a service-based profession that provides reliable and relevant financial information for making decisions.
Accounting is the method in which financial information is gathered, processed and summarised into financial statements and reports.
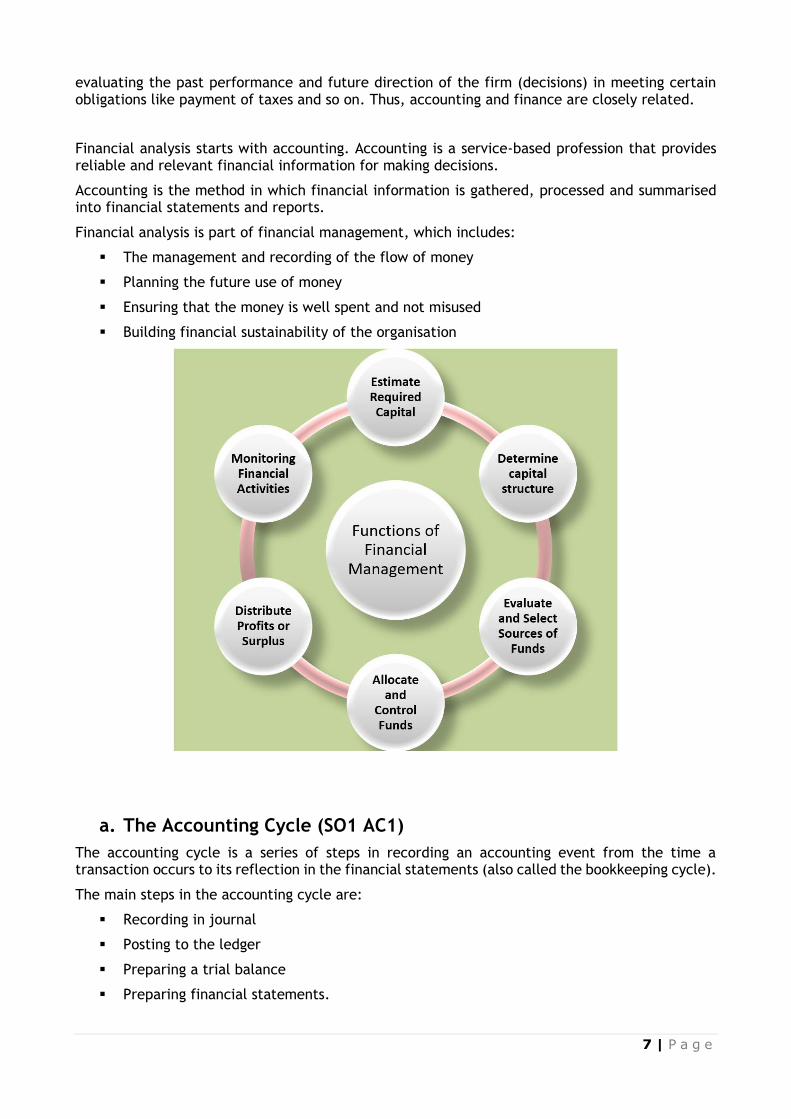
Financial analysis is part of financial management, which includes:
▪ The management and recording of the flow of money
▪ Planning the future use of money
▪ Ensuring that the money is well spent and not misused
▪ Building financial sustainability of the organisation
a. The Accounting Cycle (SO1 AC1)
The accounting cycle is a series of steps in recording an accounting event from the time a transaction occurs to its reflection in the financial statements (also called the bookkeeping cycle).
The main steps in the accounting cycle are:
▪ Recording in journal
▪ Posting to the ledger
▪ Preparing a trial balance
▪ Preparing financial statements.
8 | P a g e
This procedure is further described as:
1. Analyse transactions. The accounting process begins with analysing transactions. The company first looks at the source documents which describe the transactions and events. Source documents can be either hard copy or electronic. Some examples of source documents include bank statements, cheques, and purchase orders.
2. Journalise/ enter transactions in the journal. When the company journalises, the accountant applies the rules of double-entry accounting. Double-entry accounting means that each transaction must be recorded in at least two accounts or that the debits must equal the credits. After applying the rules of debits and credits, the accountant should then record the transactions in a journal, or journalise. A journal is a complete record of each transaction.
3. Post to ledger accounts. Posting involves transferring information from the journal to the ledger. A ledger is simply a collection of all accounts – it shows all of the number detail about a company’s accounts.
4. Prepare a Trial balance. To verify that the company’s debits equal the credits, an unadjusted trial balance is prepared. A trial balance is a list of all accounts and their balances at a point in time. The information used in a trial balance comes from the ledger. The account balances from the ledger are used to create the trial balance. We call this trial balance an unadjusted trial balance because it is prepared before the adjusting entries.
5. Make adjusting entries. Adjusting entries involve bringing an asset or liability account balance to its proper amount and updating the corresponding revenue or expense account. Adjusting entries are recorded in the general journal and then posted to the ledger. All adjusting entries are made at the end of the accounting time period.
6. Prepare Adjusted Trial balance. This trial balance is called the adjusted trial balance because it is prepared AFTER the adjusting entries. This trial balance is used to verify that the debits equal the credits and also is used to prepare the financial statements.
7. Prepare financial statements. The financial statements must be prepared in a very specific order. The order for the financial statements is: Statement of Comprehensive Income (income statement), statement of retained earnings, Statement of Financial Position (balance sheet), and then statement of cash flows. This order is important because information provided in the Statement of Comprehensive Income (income statement) is used in the statement of retained earnings, and information from the statement of retained earnings is used in the Statement of Financial Position (balance sheet).
8. Journalise and post-closing entries. Closing entries are prepared after the financial statements are completed. The purpose of closing entries is to prepare the accounts for recording transactions and events for the next period.
9. Prepare an after closing Trial balance. For many companies this is the last step in the accounting cycle, as the company is now ready to start the new accounting period. A post-closing trial balance should only contain the debit and credit balance for permanent accounts, because these are the only accounts that are remaining after the closing process. Once again, the purpose of this trial balance is to ensure that the debits equal the credits and that all temporary accounts have a zero balance.
And then…
10. Reversing entries are optional. These entries reverse certain adjustments in the next period.
9 | P a g e
Retrieved from Pinterest.com
✓ International Financial Reporting Standards - IFRS (GAAP)
Many people and organisations make decisions based on financial information that accountants prepare. That's why it is important for these people to understand how this information is measured. To facilitate this communication, accountants establish rules that business people can use to ensure they are talking about the same thing.
All the rules of accounting and accounting measurement are collected in one group called International Financial Reporting Standards (IFRS) (Note: South Africa used to use Generally Accepted Accounting Principles (GAAP) and these are subject to certain statutory regulations.
As a basis for financial analysis, we need to understand some basics first, such as:
▪ Statutory regulations
▪ IFRS
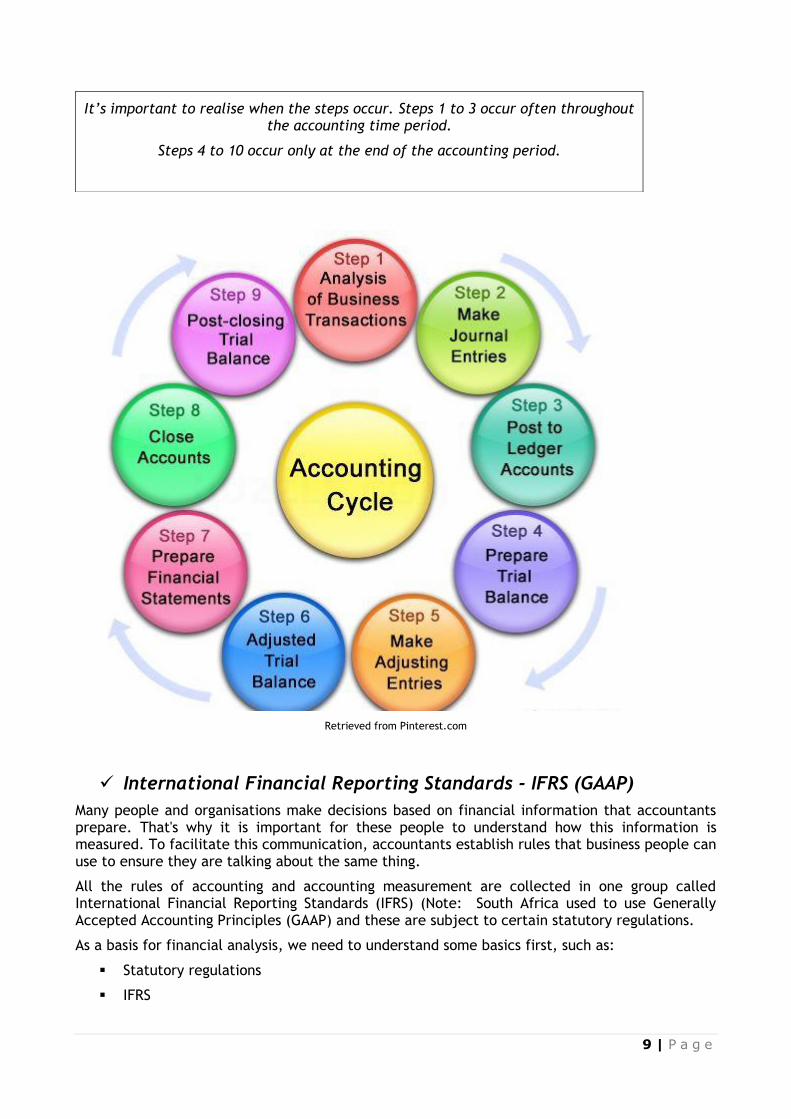
It’s important to realise when the steps occur. Steps 1 to 3 occur often throughout the accounting time period.
Steps 4 to 10 occur only at the end of the accounting period.
10 | P a g e
✓ Statutory Regulations
Accounting Records
In terms of the Companies Act, 2008, all companies must keep accounting records in one of the eleven official languages. At a minimum, these records must include:
▪ The assets and liabilities of the company;
▪ A fixed-assets register;
▪ Cash receipts and payments;
▪ Details of goods purchased and sold; and
▪ Annual stock-taking (inventory) statements.
The accounting records must be such as to fairly present the state of affairs and business of the company and explain the transactions and financial position of the trade or business of the company.
✓ Annual Financial Statements
The Companies Act, 2008 aims to provide a flexible regime that balances accountability and transparency, with less of a regulatory burden. To that end, it sets certain common requirements for all companies. Differentiated requirements depend on the company’s wider responsibility to the public and the social and economic impact that the company’s operations have. This flexibility is illustrated by the following provisions:
▪ All companies must prepare annual financial statements (AFSs), unless the company can satisfy the Commission that it meets certain criteria.
▪ Public companies are subjected to a more demanding regime, with the added requirement that their AFSs have to undergo an annual audit.
▪ All companies have to file annual returns with the Commission.
▪ Public companies have to file a copy of their audited AFSs with their annual return.
▪ Public companies must appoint a company secretary, auditors and an audit committee.
▪ Certain private companies with a greater responsibility to the wider public as a consequence of their significant social or economic impact may be required to have their AFSs audited. All other companies must be either voluntarily audited or independently reviewed.
▪ All financial statements, or a summary thereof, must satisfy the prescribed financial reporting standards. These standards may vary for different categories of companies but must be consistent with International Financial Reporting Standards as set by the International Accounting Standards Board.
▪ All public and certain private companies must appoint an auditor.
Thus, the law (which is part of an organisation’s business environment) requires that an organisation’s annual financial statements shall be set out in accordance with certain financial reporting frameworks.
This manual will refer to the appropriate IFRS standards in the terminology that it is published. Thus, standards will be referred to as IAS x. IAS stands for International Accounting Standard and the ‘x’ denotes the number of the standard for example “IAS 2”.
✓ The framework deals with:
1. The objective of financial statements which is to:
11 | P a g e
o To provide financial information about the:
i. Financial position
ii. Performance
iii. Changes in financial position
of an organisation that is useful to a wide range of users for making economic decisions, such as investors, employees, lenders of finance, suppliers of trade credit, customer, government and the general public.
2. The qualitative characteristics that determine the usefulness of information in financial statements
3. The elements from which financial statements are constructed
4. The concepts of capital and maintenance
It is important to note that financial statements, even though they may comply with the framework, should be treated with care for the following reasons:
▪ They do not necessarily supply all the financial information required
▪ They are historically based
▪ They do not necessarily provide non-financial information
To expand your knowledge, it is suggested that you acquire and read guidelines to IFRS in South Africa. These guidelines should be available from:
▪ Your organisation (probably through your finance department)
▪ Your organisation’s auditors
▪ A supplier or publisher of financial publications
✓ IFRS Standards
Some of the IFRS standards referred to in this manual include:
Standard Topic
IAS 1 Presentation of financial statements
IAS 2 Inventories
IAS 16 Accounting for property, plant and equipment
IAS 18 Revenue
Presentation of financial statements
IAS 1 sets out how financial statements should be presented. Organisations that follow these practices will be able to compare their own financial statements with:
▪ Their own organisation’s previous financial statements
▪ Financial statements of other organisations that follow these practices
12 | P a g e
Financial statements should ‘fairly present’ the financial position of an organisation. An organisations financial statements that adhere to IAS, disclose relevant interpretations and provide additional disclosures when necessary, are presumed to be fairly presented and should contain a note to this effect.
IAS 1 defines a complete set of financial statements as comprising of the following:
Let’s examine the Statement of Financial Position (balance sheet) as an example of a financial statement:
The Statement of Financial Position (balance sheet) comprises two main sections:
▪ Assets (The properties used in the operation or investment activities of a business)
▪ Liabilities (Claims by creditors to the property /assets of a business until they are paid) and Equity (The owner's rights to the property (assets) of the business; also called proprietorship and net worth)
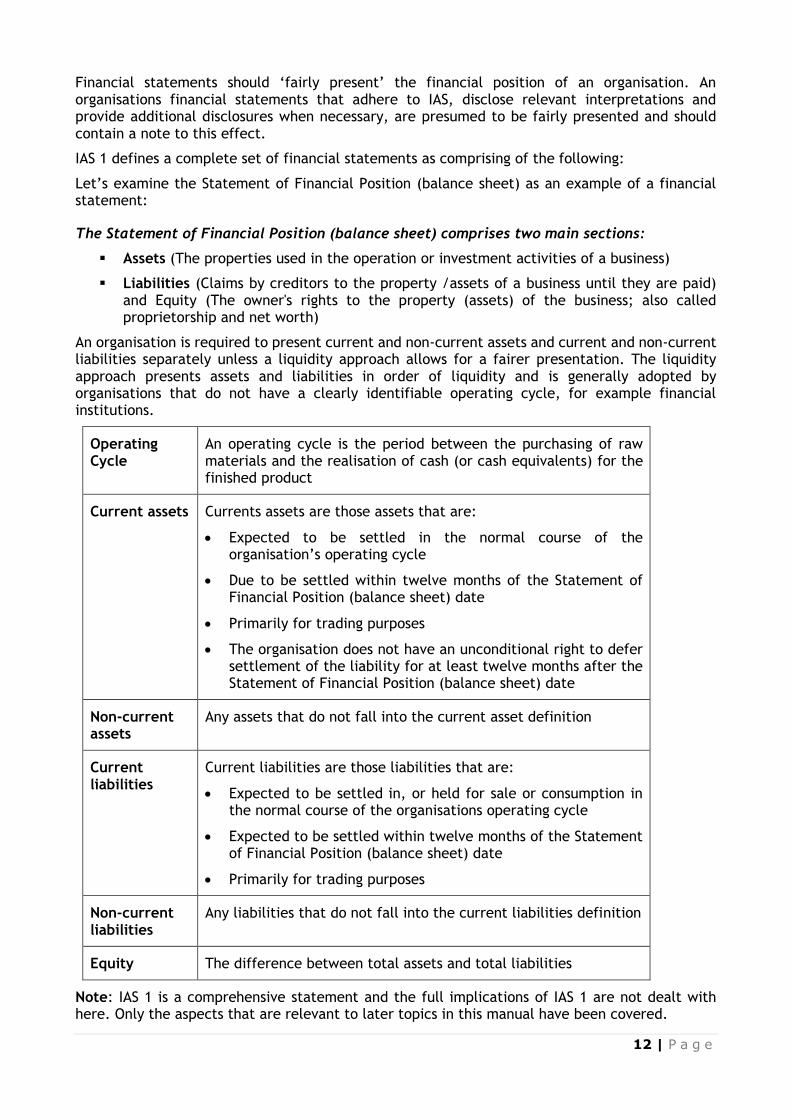
An organisation is required to present current and non-current assets and current and non-current liabilities separately unless a liquidity approach allows for a fairer presentation. The liquidity approach presents assets and liabilities in order of liquidity and is generally adopted by organisations that do not have a clearly identifiable operating cycle, for example financial institutions.
Operating Cycle
An operating cycle is the period between the purchasing of raw materials and the realisation of cash (or cash equivalents) for the finished product
Current assets Currents assets are those assets that are:
• Expected to be settled in the normal course of the organisation’s operating cycle
• Due to be settled within twelve months of the Statement of Financial Position (balance sheet) date
• Primarily for trading purposes
• The organisation does not have an unconditional right to defer settlement of the liability for at least twelve months after the Statement of Financial Position (balance sheet) date
Non-current assets
Any assets that do not fall into the current asset definition
Current liabilities
Current liabilities are those liabilities that are:
• Expected to be settled in, or held for sale or consumption in the normal course of the organisations operating cycle
• Expected to be settled within twelve months of the Statement of Financial Position (balance sheet) date
• Primarily for trading purposes
Non-current liabilities
Any liabilities that do not fall into the current liabilities definition
Equity The difference between total assets and total liabilities
Note: IAS 1 is a comprehensive statement and the full implications of IAS 1 are not dealt with here. Only the aspects that are relevant to later topics in this manual have been covered.
13 | P a g e
b. Inventories
IAS 2 relates to accounting for inventories (or stock).
Inventories are defined by IAS 2 as assets:
▪ Held for sale in the ordinary course of business, or
▪ In the process of production for sale, or
▪ In the form of materials or supplies to be consumed in the production process or in the rendering of services.
As such, inventories include:
▪ Finished goods for sale,
▪ Work-in- progress,
▪ Raw materials,
▪ Consumables (as specified in the third point above),
▪ Merchandise
▪ Products and services
Accounting for inventories
The main concern in accounting for inventories is the cost to be recognised as an asset. Inventory is recognised as an asset when:
▪ It is controlled by the organisation
▪ It is the result of a past event (purchase or production)
▪ There are probable future benefits to be derived from the asset
▪ There is a cost that can be reliably measured and attached
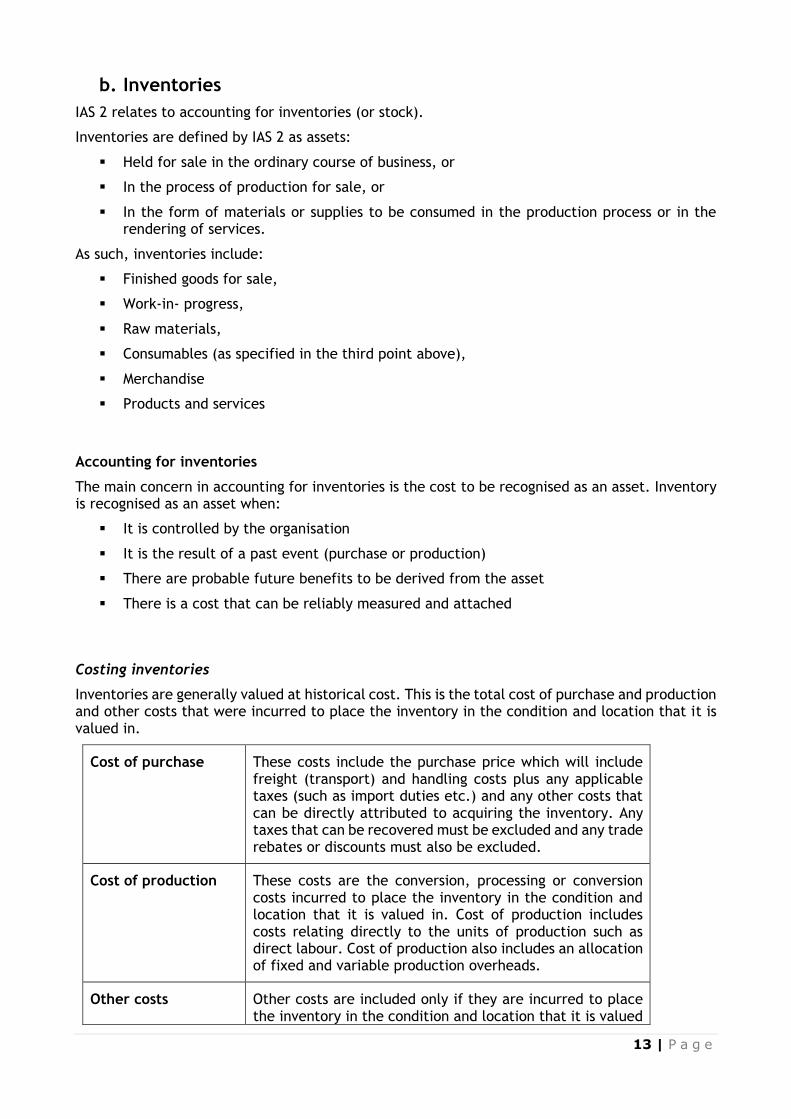
Costing inventories
Inventories are generally valued at historical cost. This is the total cost of purchase and production and other costs that were incurred to place the inventory in the condition and location that it is valued in.
Cost of purchase These costs include the purchase price which will include freight (transport) and handling costs plus any applicable taxes (such as import duties etc.) and any other costs that can be directly attributed to acquiring the inventory. Any taxes that can be recovered must be excluded and any trade rebates or discounts must also be excluded.
Cost of production These costs are the conversion, processing or conversion costs incurred to place the inventory in the condition and location that it is valued in. Cost of production includes costs relating directly to the units of production such as direct labour. Cost of production also includes an allocation of fixed and variable production overheads.
Other costs Other costs are included only if they are incurred to place the inventory in the condition and location that it is valued
14 | P a g e
in, for example storage costs directly related to the production process.
Specific exclusions
IAS 2 excludes the following from the cost of inventories:
▪ selling expenses,
▪ general administration overheads,
▪ storage costs of finished goods and
▪ abnormal waste incurred in the production process which does not relate to placing the inventory in the condition and location that it is valued in.
✓ Net realisable value
Inventory should be measured at the lower of:
▪ Cost and
▪ Net realisable value
One of the conditions (noted earlier) for inventory to be recognised as an asset is that there are probable future benefits to be derived from the asset. If the future economic benefit of the inventory is less than the cost of the inventory then the value of the inventory should be diminished to reflect the anticipated future revenues. In other words, inventory should be written down to net realisable value. These write downs may be reversed if circumstances change.
IAS 2 defines net realisable value as the estimated selling price in the ordinary course of business less the estimated costs of completion and the estimated costs to make the sale.
Note: IAS 2 is a comprehensive statement and the full implications of IAS 2 are not dealt with here. Only the aspects that are relevant to later topics in this manual have been covered.
✓ Property, plant and equipment
Property, plant and equipment are defined as tangible assets that:
▪ are used in the production or supply of goods and services, for rental to others or for administrative purposes; and
▪ are expected to be used for more than one accounting period.
IAS 16 relates to accounting for property, plant and equipment and deals with two major issues in accounting for property, plant and equipment:
1. Timing– the timing of recognition of property, plant and equipment
2. Charges – determining carrying charges and related depreciation charges
✓ Recognition of property, plant and equipment
Property, plant and equipment should be recognised as assets when:
▪ it is probable that future economic benefits associated with the item will flow to the organisation; and
15 | P a g e
▪ the cost of the item can be measured reliably.
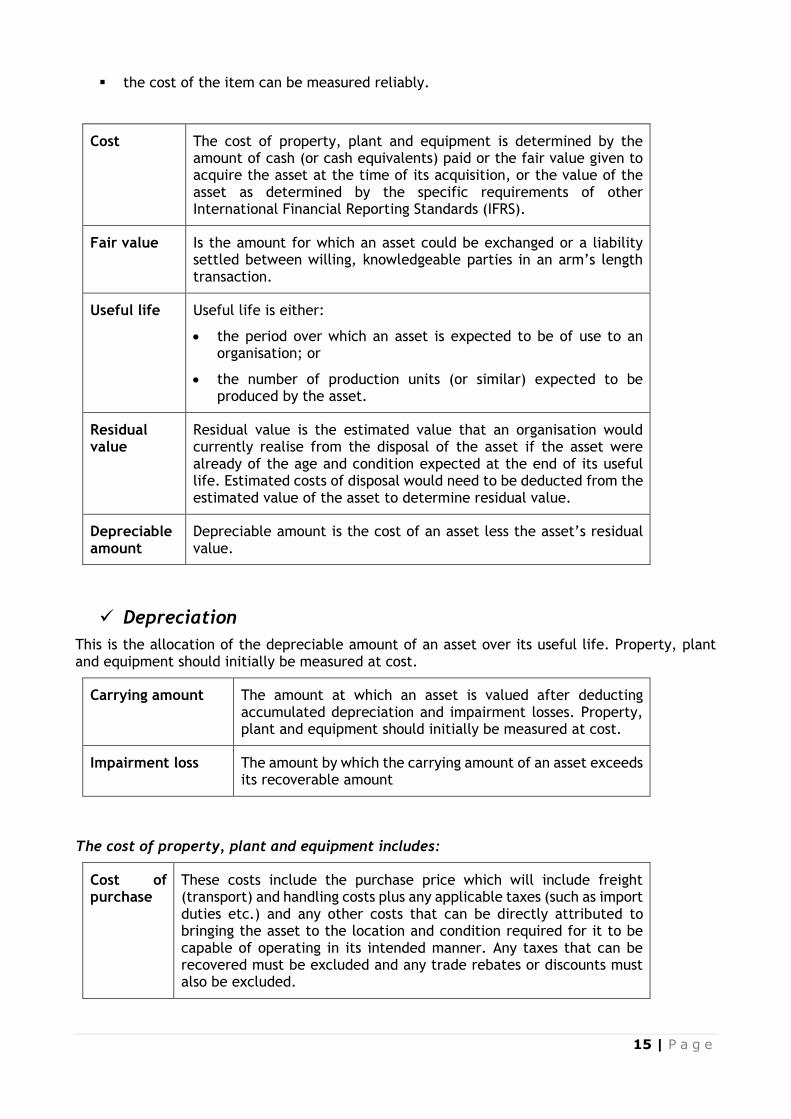
Cost The cost of property, plant and equipment is determined by the amount of cash (or cash equivalents) paid or the fair value given to acquire the asset at the time of its acquisition, or the value of the asset as determined by the specific requirements of other International Financial Reporting Standards (IFRS).
Fair value Is the amount for which an asset could be exchanged or a liability settled between willing, knowledgeable parties in an arm’s length transaction.
Useful life Useful life is either:
• the period over which an asset is expected to be of use to an organisation; or
• the number of production units (or similar) expected to be produced by the asset.
Residual value
Residual value is the estimated value that an organisation would currently realise from the disposal of the asset if the asset were already of the age and condition expected at the end of its useful life. Estimated costs of disposal would need to be deducted from the estimated value of the asset to determine residual value.
Depreciable amount
Depreciable amount is the cost of an asset less the asset’s residual value.
✓ Depreciation
This is the allocation of the depreciable amount of an asset over its useful life. Property, plant and equipment should initially be measured at cost.
Carrying amount The amount at which an asset is valued after deducting accumulated depreciation and impairment losses. Property, plant and equipment should initially be measured at cost.
Impairment loss The amount by which the carrying amount of an asset exceeds its recoverable amount
The cost of property, plant and equipment includes:
Cost of purchase
These costs include the purchase price which will include freight (transport) and handling costs plus any applicable taxes (such as import duties etc.) and any other costs that can be directly attributed to bringing the asset to the location and condition required for it to be capable of operating in its intended manner. Any taxes that can be recovered must be excluded and any trade rebates or discounts must also be excluded.
16 | P a g e
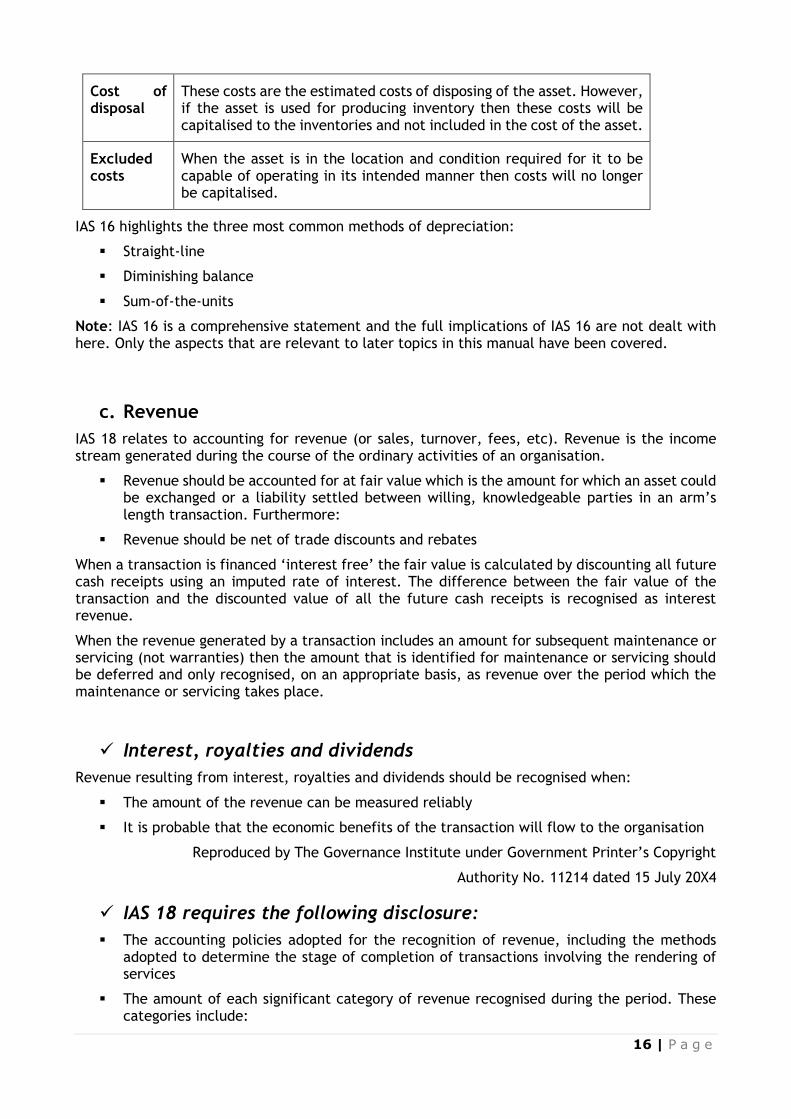
Cost of disposal
These costs are the estimated costs of disposing of the asset. However, if the asset is used for producing inventory then these costs will be capitalised to the inventories and not included in the cost of the asset.
Excluded costs
When the asset is in the location and condition required for it to be capable of operating in its intended manner then costs will no longer be capitalised.
IAS 16 highlights the three most common methods of depreciation:
▪ Straight-line
▪ Diminishing balance
▪ Sum-of-the-units
Note: IAS 16 is a comprehensive statement and the full implications of IAS 16 are not dealt with here. Only the aspects that are relevant to later topics in this manual have been covered.
c. Revenue
IAS 18 relates to accounting for revenue (or sales, turnover, fees, etc). Revenue is the income stream generated during the course of the ordinary activities of an organisation.
▪ Revenue should be accounted for at fair value which is the amount for which an asset could be exchanged or a liability settled between willing, knowledgeable parties in an arm’s length transaction. Furthermore:
▪ Revenue should be net of trade discounts and rebates
When a transaction is financed ‘interest free’ the fair value is calculated by discounting all future cash receipts using an imputed rate of interest. The difference between the fair value of the transaction and the discounted value of all the future cash receipts is recognised as interest revenue.
When the revenue generated by a transaction includes an amount for subsequent maintenance or servicing (not warranties) then the amount that is identified for maintenance or servicing should be deferred and only recognised, on an appropriate basis, as revenue over the period which the maintenance or servicing takes place.
✓ Interest, royalties and dividends
Revenue resulting from interest, royalties and dividends should be recognised when:
▪ The amount of the revenue can be measured reliably
▪ It is probable that the economic benefits of the transaction will flow to the organisation
Reproduced by The Governance Institute under Government Printer’s Copyright
Authority No. 11214 dated 15 July 20X4
✓ IAS 18 requires the following disclosure:
▪ The accounting policies adopted for the recognition of revenue, including the methods adopted to determine the stage of completion of transactions involving the rendering of services
▪ The amount of each significant category of revenue recognised during the period. These categories include:
17 | P a g e
➢ The sale of goods
➢ The rendering of services
➢ Interest
➢ Royalties
➢ Dividends; and
➢ The amount of revenue arising from the exchanges of goods or services, analysed by category.
Note: IAS 18 is a comprehensive statement and the full implications of IAS 18 are not dealt with here. Only the aspects that are relevant to later topics in this manual have been covered.
Note: IAS 17 deals with the recognition of income from leases and IAS 28 deals with profits from associates. These are beyond the scope of this manual.
d. Using IFRS in Financial Analysis
The statutory requirements and the IFRS requirements must be considered while doing financial analysis and working through this learner guide. Remember that for internal reporting and analysis purposes an organisation has to abide by IFRS. However, the organisation must be consistent in its treatment of financial recording and analysis if the recording and analysis is to be of value to the organisation. It is therefore recommended that organisations adopt IFRS for internal use where possible.
IFRS includes numerous guidelines and conventions that help insure that reported financial information is accurate, objective and reasonably consistent for all types of business, so that results from one business can be compared to those from another.
Although accountants apply International Financial Reporting Standards, there is room for variation among different businesses (and among different accountants) in the application of IFRS.
Consistency generally is required within a particular business. However, different policies in different businesses can affect their reported results and distort the picture of where your business stands in relation to other businesses.
In this regard, consider that:
▪ The time at which sales show up on a Statement of Comprehensive Income (income statement) may differ from business to business. A more aggressive approach may accelerate income items by reporting them at the earliest possible moment, while a more conservative approach may postpone revenues.
▪ Depreciation charges for financial reporting purposes on essentially similar assets can differ from business to business, depending on accounting policies with regard to depreciation methods and useful lives.
▪ Inventory accounting policies may differ. A business using first-in, first-out (FIFO) accounting will show higher profits in a period of rising prices than will a business using last-in, first-out (LIFO) accounting. Note that LIFO is not in terms of IFRS.
▪ Policies may differ in regard to expensing. One business may charge an item to income immediately as an expense, while another business may capitalise the same item and report a higher profit.
▪ Different methods of treating the cost of developing a product will affect the cost of goods sold and affect the gross profit reported.
▪ Extraordinary or nonrecurring charges may or may not be reflected in operating income, depending on your accounting policies.
18 | P a g e
▪ The treatment of tax items may vary from one business to the next.
For all these reasons, when you're comparing your financial statements to industry standards or to those of another business, take the results with a grain of salt.
e. Calculating Ratios according to IFRS
IFRS includes numerous guidelines and conventions that help insure that reported financial information is accurate, objective and reasonably consistent for all types of business, so that results from one business can be compared to those from another.
Although accountants apply International Financial Reporting Standards, there is room for variation among different businesses (and among different accountants) in the application of IFRS
Consistency generally is required within a particular business. However, different policies in different businesses can affect their reported results and distort the picture of where your business stands in relation to other businesses.
IFRS Standards that are useful and important in using ratios to analyse financial statements include:
▪ IAS 1 - Presentation of financial statements
▪ IAS 2 – Inventories
▪ IAS 16 - Accounting for property, plant and equipment
▪ IAS 18 - Revenue, to define sales (revenue)
There are other IAS statements that impact on defining and valuing assets but these are beyond the scope of this learner guide.
✓ Financial Relationships (EEK2)
The Relationship between the Financial Statements:
The financial statements of a company are developed from the bookkeeping process of the business. As the company records the financial transactions of the firm over an accounting time period, the financial statements begin to appear. They are developed through recording the transactions in the accounting journal and the general ledger. The financial statements come together from those records. The financial statements are based on the accounting equation.
✓ The Statement of Comprehensive Income (income statement) and the Accounting Equation
The Statement of Comprehensive Income (income statement / statement of profit and loss) shows how profitable the firm is. A positive net income means the firm is making money. A negative net income means the firm is losing money. The Statement of Comprehensive Income (income statement) is developed from the accounting entries for revenues and expenses over the accounting period.
The accounting equation is stated as:
✓ Assets = Liabilities + Owner's Equity
In the accounting equation, owner's equity is made up of revenue and expenses. Revenue increases owner's equity and expenses decrease owner's equity (the money the owners have invested in the company). Since the firm's Statement of Financial Position (balance sheet) is based on the accounting equation, with owner's equity a component of the left side of the Statement of
19 | P a g e
Financial Position (balance sheet), this is the tie to the Statement of Comprehensive Income (income statement).
✓ The Statement of Retained Earnings
The Statement of Retained Earnings is developed after the Statement of Comprehensive Income (income statement) because it uses data from the Statement of Comprehensive Income (income statement). The net income from the Statement of Comprehensive Income (income statement) is either retained by the firm or paid out as dividends or a combination of both.
✓ The Statement of Financial Position (balance sheet) and the Accounting Equation
The business firm's Statement of Financial Position (balance sheet) shows how much money the firm is worth -- its net worth. The Statement of Financial Position (balance sheet) items are stated in terms of book value. The two sides of the accounting equation mirror the format of the Statement of Financial Position (balance sheet). The two sides of the Statement of Financial Position (balance sheet) have to balance since every asset has to be purchased with either a liability, like a bank loan, or owner's equity, such as a portion of the retained earnings.
The Statement of Financial Position (balance sheet) is an indicator of net worth while the Statement of Comprehensive Income (income statement) or statement of profit and loss is an indicator of profitability.
✓ The Statement of Cash Flows
The Statement of Cash Flows uses data from both the Statement of Comprehensive Income (income statement) and Statement of Financial Position (balance sheet). It is the financial statement that is developed last due to this fact.
f. The Role of Budgeting and Forecasting in Strategic Planning (SO1 AC2)
Strategic planning is a structured and coordinated approach for developing long-term organisational goals and for developing strategies to accomplish them. It is typically used to
20 | P a g e
facilitate communication, to accommodate divergent interests, and to foster decision making through leadership and consensus building.
One of the primary purposes of strategic planning is to set the stage for the annual budget process, providing a roadmap for annual resource allocation decisions.
The budget process consists of activities that encompass the development, implementation, and evaluation of a plan for the provision of services and capital assets.
Budgeting is implementing a business plan on paper before any resources are committed to production; it helps you predict the consequences of an adjustment in your operation before ever making the adjustment. While records serve as a record of the past, budgets are an anticipation of the future. After budgets are done, they become a standard for monitoring what actually happens in the operation.
Budgets are usually compiled and re-evaluated on a periodic basis. A budget is a tool that managers use to translate future plans into quantitative terms. Through budgeting, managers ensure that they have the resources available to carry out the plans to reach the organisation’s goals.
Depending on the nature of the business, detailed plans may be formulated for the next few months, the next year, the next 5 years, or even longer.
A company engaged in heavy construction is constantly submitting tenders that may or may not be successful; therefore, it cannot plan as far ahead as an renewable energy utility company. The utility company can base its projections on population growth, which is predictable for 5- to 10-year periods. It must plan asset acquisitions years ahead, because of the long lead times involved in constructing dams, nuclear power plants, etc.
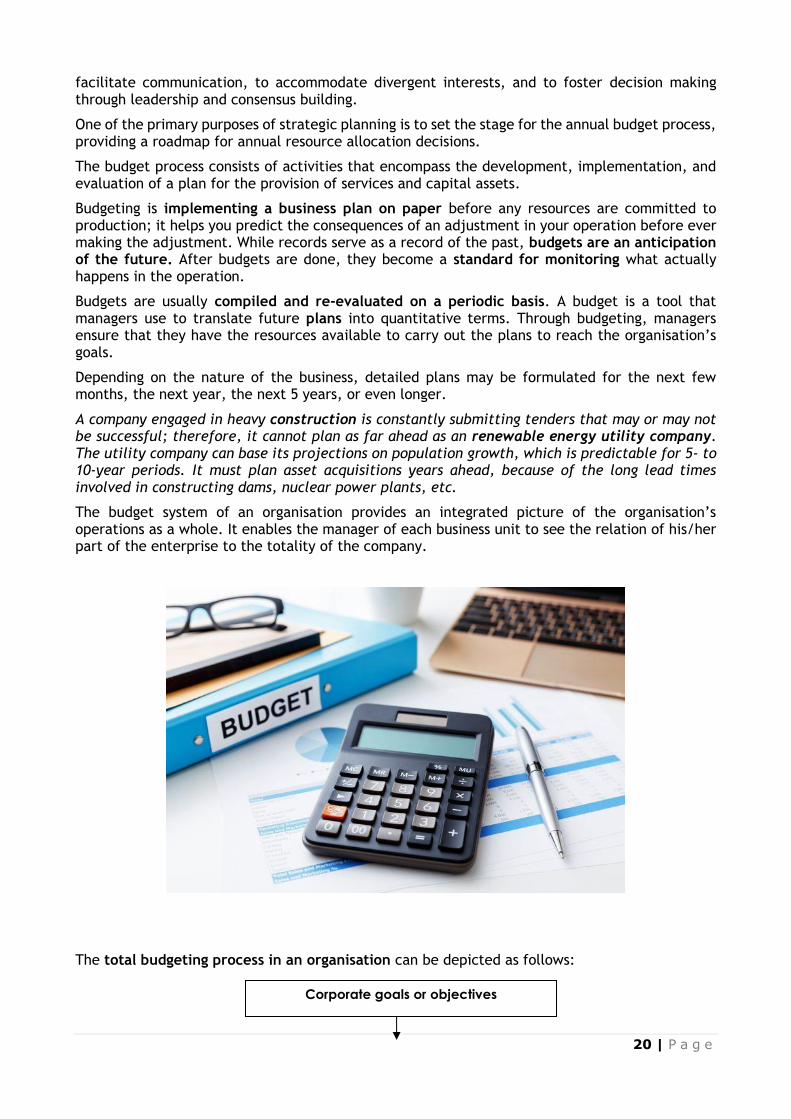
The budget system of an organisation provides an integrated picture of the organisation’s operations as a whole. It enables the manager of each business unit to see the relation of his/her part of the enterprise to the totality of the company.
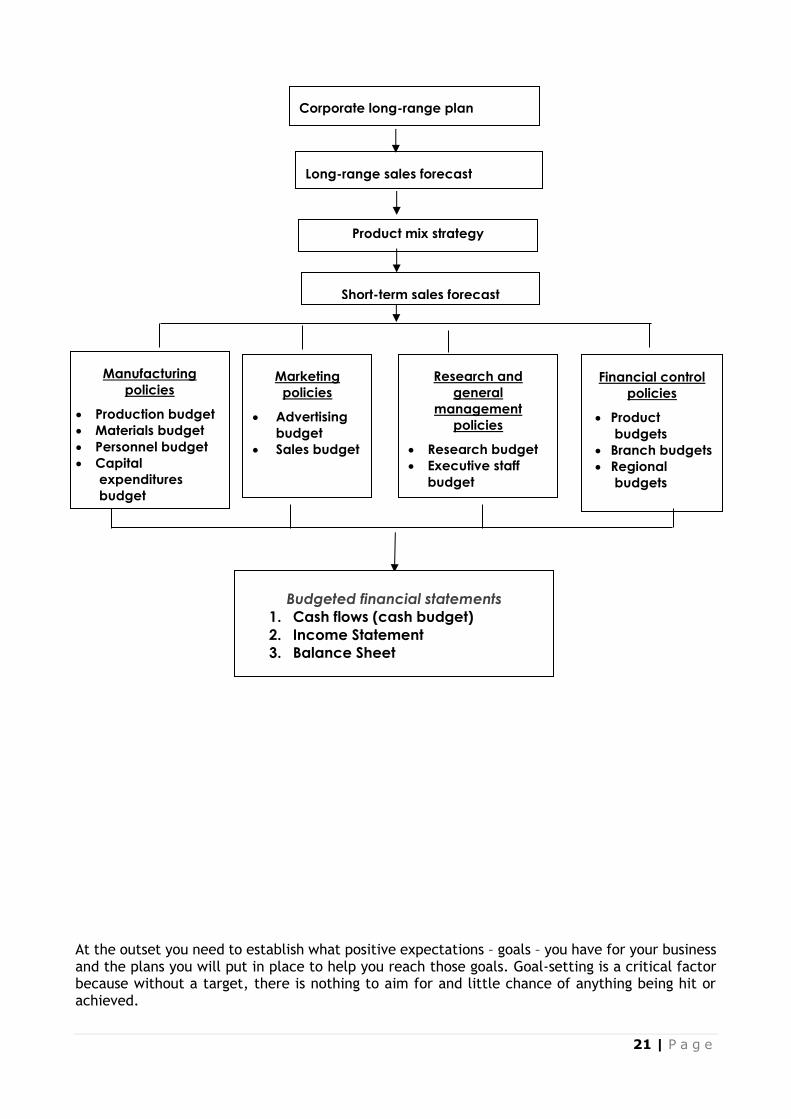
The total budgeting process in an organisation can be depicted as follows:
Corporate goals or objectives
21 | P a g e
At the outset you need to establish what positive expectations – goals – you have for your business and the plans you will put in place to help you reach those goals. Goal-setting is a critical factor because without a target, there is nothing to aim for and little chance of anything being hit or achieved.
Corporate long-range plan
Long-range sales forecast
Product mix strategy
Short-term sales forecast
Manufacturing
policies
• Production budget
• Materials budget
• Personnel budget
• Capital
expenditures
budget
Marketing
policies
• Advertising
budget
• Sales budget
Research and
general
management
policies
• Research budget
• Executive staff
budget
Financial control
policies
• Product
budgets
• Branch budgets
• Regional
budgets
Budgeted financial statements
1. Cash flows (cash budget)
2. Income Statement
3. Balance Sheet
22 | P a g e
A budget provides a good way of directing your business towards goals in terms of both expenses and revenues. It gives a constant overview of costs incurred and revenues raised, which then allows for the micro control of both of those elements.
Communicate your long-term plan to all concerned with drawing up budgets. Get the right people involved from the start. Internally, staff members with financial responsibilities should definitely have a role, as well as those who head specific projects, and those accountable for devising sales targets and production costs.
g. The Accounting Conventions applied in Financial Management (SO1 AC3)
In drawing up accounting statements, whether they are external "financial accounts" or internally-focused "management accounts", a clear objective has to be that the accounts fairly reflect the true "substance" of the business and the results of its operation.
The theory of accounting has, therefore, developed the concept of a "true and fair view". The true and fair view is applied in ensuring and assessing whether accounts do indeed portray accurately the business' activities.
To support the application of the "true and fair view", accounting has adopted certain concepts and conventions which help to ensure that accounting information is presented accurately and consistently.
✓ Accounting Conventions
The most commonly encountered convention is the "historical cost convention". This requires transactions to be recorded at the price ruling at the time, and for assets to be valued at their original cost.
Under the "historical cost convention", therefore, no account is taken of changing prices in the economy.
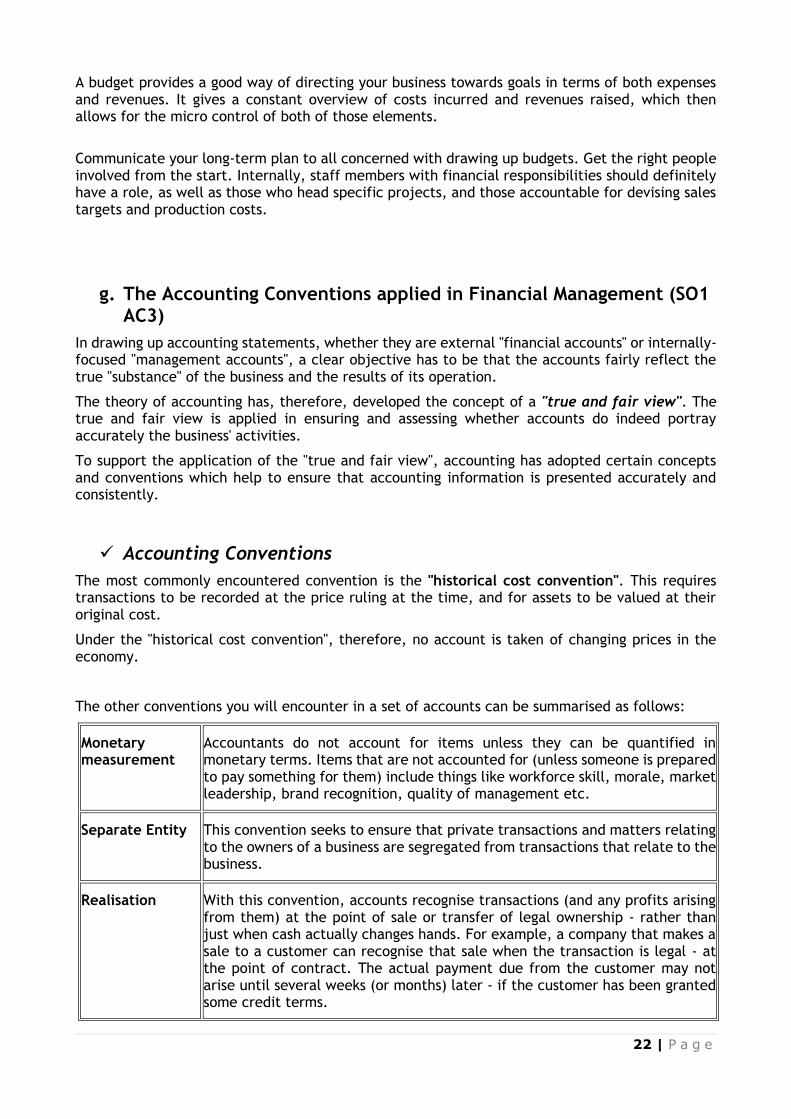
The other conventions you will encounter in a set of accounts can be summarised as follows:
Monetary measurement
Accountants do not account for items unless they can be quantified in monetary terms. Items that are not accounted for (unless someone is prepared to pay something for them) include things like workforce skill, morale, market leadership, brand recognition, quality of management etc.
Separate Entity This convention seeks to ensure that private transactions and matters relating to the owners of a business are segregated from transactions that relate to the business.
Realisation With this convention, accounts recognise transactions (and any profits arising from them) at the point of sale or transfer of legal ownership - rather than just when cash actually changes hands. For example, a company that makes a sale to a customer can recognise that sale when the transaction is legal - at the point of contract. The actual payment due from the customer may not arise until several weeks (or months) later - if the customer has been granted some credit terms.
23 | P a g e
Materiality An important convention. As we can see from the application of accounting standards and accounting policies, the preparation of accounts involves a high degree of judgement. Where decisions are required about the appropriateness of a particular accounting judgement, the "materiality" convention suggests that this should only be an issue if the judgement is "significant" or "material" to a user of the accounts. The concept of "materiality" is an important issue for auditors of financial accounts.
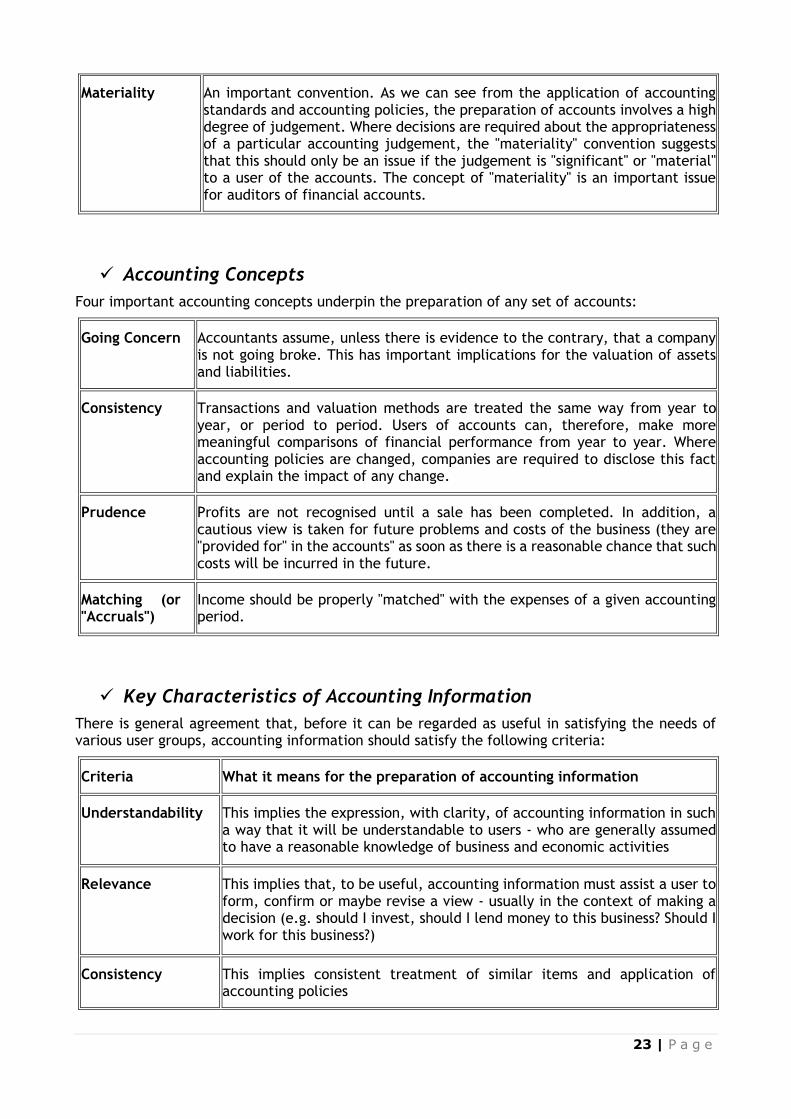
✓ Accounting Concepts
Four important accounting concepts underpin the preparation of any set of accounts:
Going Concern Accountants assume, unless there is evidence to the contrary, that a company is not going broke. This has important implications for the valuation of assets and liabilities.
Consistency Transactions and valuation methods are treated the same way from year to year, or period to period. Users of accounts can, therefore, make more meaningful comparisons of financial performance from year to year. Where accounting policies are changed, companies are required to disclose this fact and explain the impact of any change.
Prudence Profits are not recognised until a sale has been completed. In addition, a cautious view is taken for future problems and costs of the business (they are "provided for" in the accounts" as soon as there is a reasonable chance that such costs will be incurred in the future.
Matching (or "Accruals")
Income should be properly "matched" with the expenses of a given accounting period.
✓ Key Characteristics of Accounting Information
There is general agreement that, before it can be regarded as useful in satisfying the needs of various user groups, accounting information should satisfy the following criteria:
Criteria What it means for the preparation of accounting information
Understandability This implies the expression, with clarity, of accounting information in such a way that it will be understandable to users - who are generally assumed to have a reasonable knowledge of business and economic activities
Relevance This implies that, to be useful, accounting information must assist a user to form, confirm or maybe revise a view - usually in the context of making a decision (e.g. should I invest, should I lend money to this business? Should I work for this business?)
Consistency This implies consistent treatment of similar items and application of accounting policies
24 | P a g e
Comparability This implies the ability for users to be able to compare similar companies in the same industry group and to make comparisons of performance over time. Much of the work that goes into setting accounting standards is based around the need for comparability.
Reliability This implies that the accounting information that is presented is truthful, accurate, complete (nothing significant missed out) and capable of being verified (e.g. by a potential investor).
Objectivity This implies that accounting information is prepared and reported in a "neutral" way. In other words, it is not biased towards a particular user group or vested interest
Information on Accounting Conventions retrieved from: http://tutor2u.net/business/accounts/accounting_conventions_concepts.htm
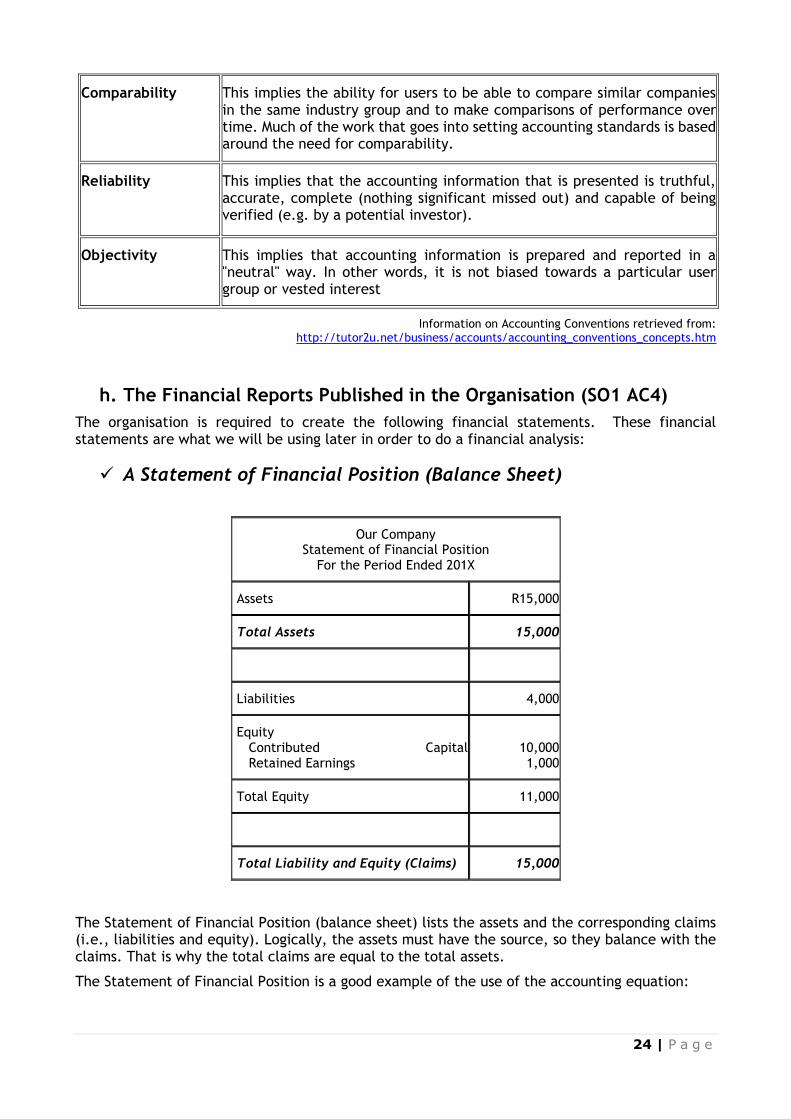
h. The Financial Reports Published in the Organisation (SO1 AC4)
The organisation is required to create the following financial statements. These financial statements are what we will be using later in order to do a financial analysis:
✓ A Statement of Financial Position (Balance Sheet)
Our Company Statement of Financial Position
For the Period Ended 201X
Assets R15,000
Total Assets 15,000
Liabilities 4,000
Equity Contributed Capital Retained Earnings
10,000 1,000
Total Equity 11,000
Total Liability and Equity (Claims) 15,000
The Statement of Financial Position (balance sheet) lists the assets and the corresponding claims (i.e., liabilities and equity). Logically, the assets must have the source, so they balance with the claims. That is why the total claims are equal to the total assets.
The Statement of Financial Position is a good example of the use of the accounting equation:
25 | P a g e
ASSETS = LIABILITIES + OWNER'S EQUITY
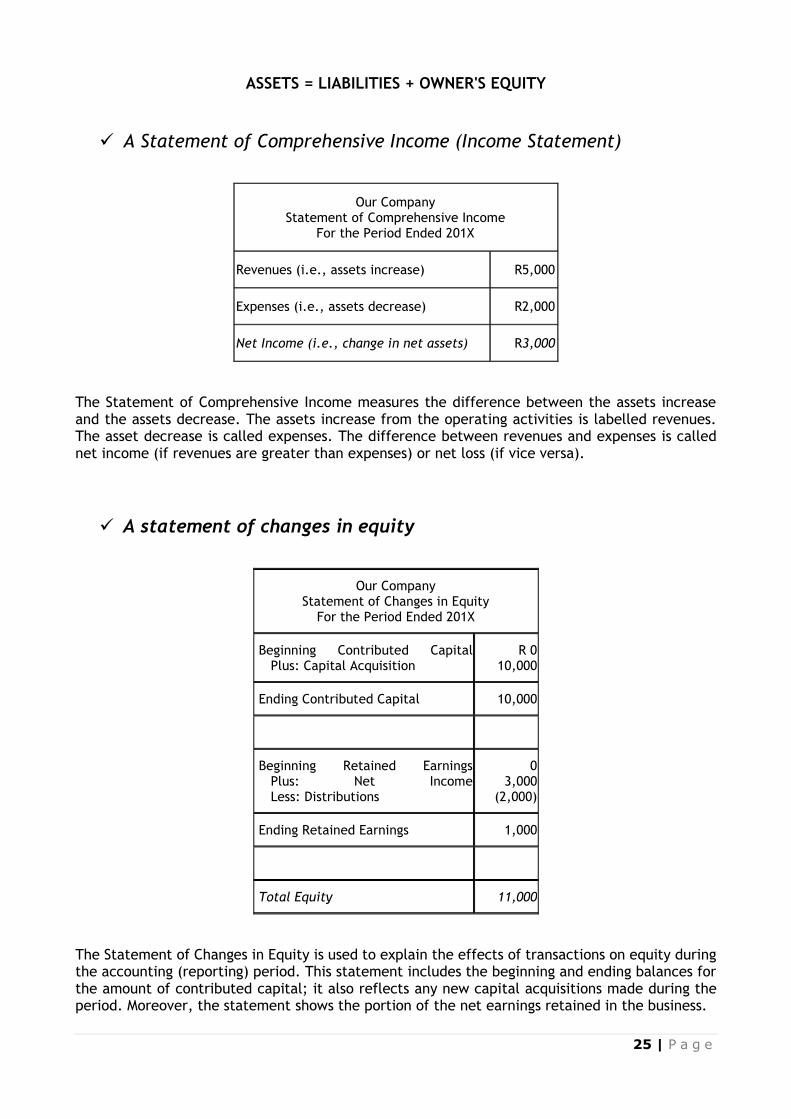
✓ A Statement of Comprehensive Income (Income Statement)
Our Company Statement of Comprehensive Income
For the Period Ended 201X
Revenues (i.e., assets increase) R5,000
Expenses (i.e., assets decrease) R2,000
Net Income (i.e., change in net assets) R3,000
The Statement of Comprehensive Income measures the difference between the assets increase and the assets decrease. The assets increase from the operating activities is labelled revenues. The asset decrease is called expenses. The difference between revenues and expenses is called net income (if revenues are greater than expenses) or net loss (if vice versa).
✓ A statement of changes in equity
Our Company Statement of Changes in Equity
For the Period Ended 201X
Beginning Contributed Capital Plus: Capital Acquisition
R 0 10,000
Ending Contributed Capital 10,000
Beginning Retained Earnings Plus: Net Income Less: Distributions
0 3,000
(2,000)
Ending Retained Earnings 1,000
Total Equity 11,000
The Statement of Changes in Equity is used to explain the effects of transactions on equity during the accounting (reporting) period. This statement includes the beginning and ending balances for the amount of contributed capital; it also reflects any new capital acquisitions made during the period. Moreover, the statement shows the portion of the net earnings retained in the business.
26 | P a g e
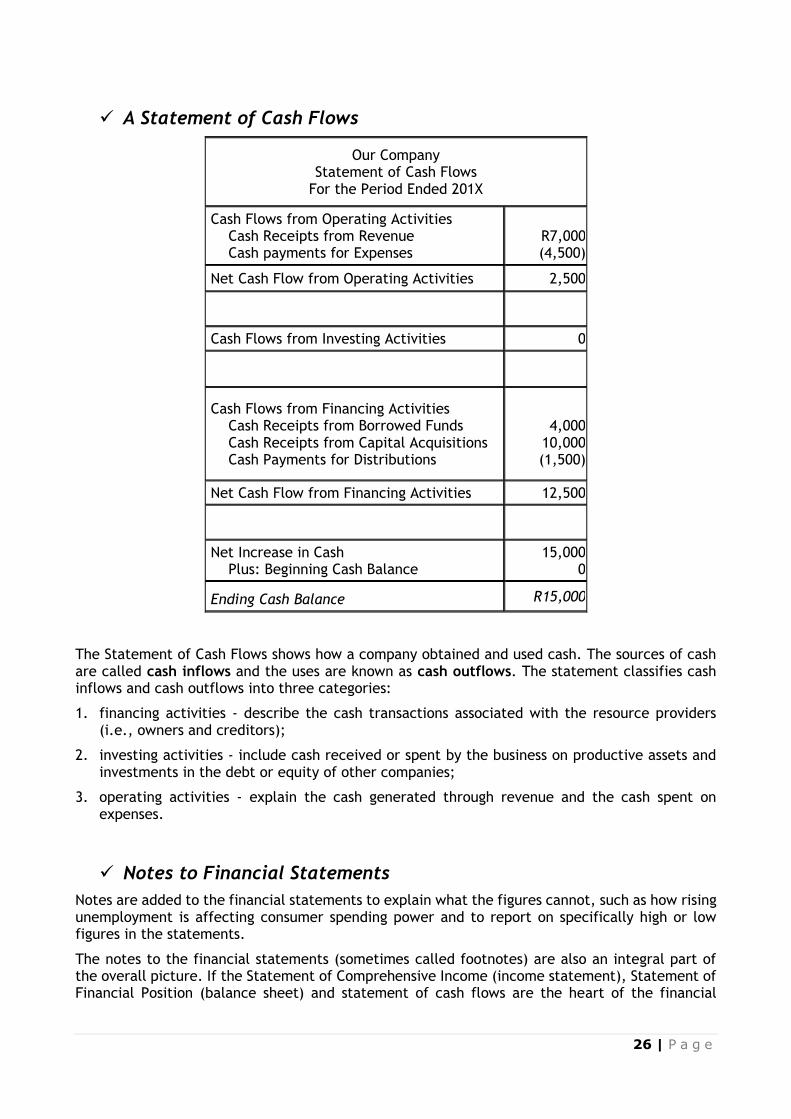
✓ A Statement of Cash Flows
Our Company Statement of Cash Flows
For the Period Ended 201X
Cash Flows from Operating Activities Cash Receipts from Revenue Cash payments for Expenses
R7,000 (4,500)
Net Cash Flow from Operating Activities 2,500
Cash Flows from Investing Activities 0
Cash Flows from Financing Activities Cash Receipts from Borrowed Funds Cash Receipts from Capital Acquisitions Cash Payments for Distributions
4,000
10,000 (1,500)
Net Cash Flow from Financing Activities 12,500
Net Increase in Cash Plus: Beginning Cash Balance
15,000 0
Ending Cash Balance R15,000
The Statement of Cash Flows shows how a company obtained and used cash. The sources of cash are called cash inflows and the uses are known as cash outflows. The statement classifies cash inflows and cash outflows into three categories:
1. financing activities - describe the cash transactions associated with the resource providers (i.e., owners and creditors);
2. investing activities - include cash received or spent by the business on productive assets and investments in the debt or equity of other companies;
3. operating activities - explain the cash generated through revenue and the cash spent on expenses.
✓ Notes to Financial Statements
Notes are added to the financial statements to explain what the figures cannot, such as how rising unemployment is affecting consumer spending power and to report on specifically high or low figures in the statements.
The notes to the financial statements (sometimes called footnotes) are also an integral part of the overall picture. If the Statement of Comprehensive Income (income statement), Statement of Financial Position (balance sheet) and statement of cash flows are the heart of the financial
27 | P a g e
statements, then the footnotes are the arteries that keep everything connected. If you aren't reading the footnotes, you're missing out on a lot of information.
The footnotes list important information that could not be included in the actual ledgers. Could you imagine if the company listed out individual expenses on the Statement of Comprehensive Income (income statement) instead of putting them under one or two neat headings? The Statement of Comprehensive Income (income statement) would be 20 pages long!
The notes will list relevant things like outstanding leases, the maturity dates of outstanding debt and even details on where the revenue actually came from. Generally speaking, there are two types of footnotes:
▪ Accounting Methods - This type of footnote identifies and explains the major accounting policies of the business. This portion of the footnotes will tell you the nature of the company's business, when its fiscal year starts and ends, how inventory costs are determined and any other significant accounting policies that the company feels that you should be aware of. This is especially important if a company has changed accounting policies. It may be that an organisation is practicing "cookie jar accounting" and is changing policies only to take advantage of current conditions to hide poor performance.
▪ Disclosure - The second type of footnote provides additional disclosure that simply could not be put in the financial statements. The financial statements in an annual report are supposed to be clean and easy to follow. To maintain this cleanliness, other calculations are left for the footnotes. For example, details of long-term debt such as maturity dates and the interest rates at which debt was issued can give you a better idea of how borrowing costs are laid out. Other areas of disclosure include everything from pension plan liabilities for existing employees to details about ominous legal proceedings in which the company is involved.
The majority of investors and analysts read the Statement of Financial Position (balance sheet), Statement of Comprehensive Income (income statement) and Statement of Cash Flows but, for whatever reason, the footnotes are often ignored.
In South Africa, a directors’ report is to be included in the financial statements. This is a requirement of the Companies Act 1973 (updated 2009).
✓ A Financial Audit is an independent evaluation performed for the purpose of attesting to the fairness, accuracy, and reliability of financial data.
It is important to note that auditor reports on financial statements are only an opinion on whether the information presented is correct and free of material misstatements, whereas all other determinations are left for the user to decide.
Formative Assessment 1: AC 1-4
28 | P a g e
SECTION 2: INTERPRET FINANCIAL STATEMENTS
Specific Outcome 2
Interpret financial statements.
Assessment Criteria
1. Financial statements are analysed, using data sources identified and evaluated for authenticity and accuracy.
2. The ratios are applied to measure the profitability and liquidity of an entity.
3. The ratios are applied to measure the working capital and asset utilisation of an entity.
4. The ratios are applied to measure the return of an entity.
RANGE Return ratios include, return on equity, return on investment and debt ratio.
5. Recommendations are made regarding the profitability of, liquidity, working capital, return and resource utilisation by the entity using the results obtained from the application of the ratios.
2.1 Interpreting Financial Statements (SO2 AC1) Financial statements are used to do financial analysis. Financial statements are accounting reports prepared periodically to inform the owner, creditors and other interested parties as to the financial condition and operating results of the business.
a. Purpose of Financial Analysis
The purpose of financial analysis varies in every organisation, but generally it would include:
▪ To determine whether the organisation achieved its main objective which is the maximisation of profit
▪ To determine whether the organisation will be able to repay interest and capital on long-term loans
▪ To determine whether an organisation will be able to service its short-term debts from liquid funds
▪ To determine whether a company will be able to honour commitments relating to guarantees supplied
▪ To establish if certain investments yield a fair and acceptable return
▪ To establish whether a company has the potential to issue further ordinary shares, preference shares or debentures
▪ To establish, if an organisation is underperforming, what the problem areas are
▪ To make recommendations in connection with the take-over, reconstruction or amalgamation of organisations
▪ To evaluate the ability of an organisation to pay personnel and supply other benefits to personnel
▪ To establish tax policy
29 | P a g e
▪ To prepare and use national income statistics
▪ To regulate the operations of organisations
b. Financial Analysis Users
There are two broad categories of accounting information and financial analysis users:
▪ External
▪ Internal
✓ External Users
Accounting information that is designed to satisfy the needs of resource owners (external users) is called financial accounting. Investors, creditors and brokers, to name a few, represent external users; they are interested in a company because they have money invested, etc.
✓ Internal Users
Managerial accounting provides information that is useful to internal users in running a business. The group of internal users includes managers, employees and unions that show interest in accounting information due to their direct concern in prosperity of a business.
✓ Users and their Information Requirements
From the above, you will realise that there are many users of financial analysis information, such as:
▪ Management: Management is interested in information contained in the financial statements in order to carry out its planning, decision making and control responsibilities.
▪ Owners: Regardless of the form of the enterprise, the owners, partners, members, trustees and shareholders will be interested in the total financial well-being of the enterprise. This includes the profit potential, financial stability and growth potential. Owners need information to assist them in deciding if they should buy, sell or retain their investment.
▪ Potential investors: The providers of risk capital and their advisors (brokers, auditors, economists) are concerned with the risk inherent in and return provided by, their investment and also the ability of the enterprise to pay dividends.
▪ Employees: Employees and their representative groups (e.g. trade unions) are interested in information pertaining to the stability and profitability of employers. They are also interested in information which enables them to assess the ability of the enterprise to provide remuneration, retirement benefits and employment opportunities.
▪ Lenders of money: Lenders of money are interested in information enabling them to assess whether their loans and the interest payable on these loans, will be paid when due.
▪ Suppliers and other trade creditors: Suppliers and other creditors are interested in information enabling them to establish whether amounts owing to them will be paid when due. Trade creditors, as opposed to lenders, are likely to be interested in an enterprise over a shorter period, unless they are dependent on the enterprise (being a major customer) for their continued existence.
30 | P a g e
▪ Customers: Customers are interested in information about the continued existence of an enterprise if they are involved with it over the long term or if they are dependent on the enterprise being their chief supplier.
▪ Governments and their agencies: Governments and their agencies are interested in the allocation of resources and therefore, the activities of enterprises. Agencies such as these would include the Receiver of Revenue, the Departments of Statistics, Trade and Industry, Health and so forth. These agencies require the information in order to regulate the activities of enterprises, to determine taxation policies and as the basis for national income and other similar statistics.
▪ The public and consumer organisations: Enterprises affect members of the public in a variety of ways. For instance, enterprises may make a substantial contribution to the local economy in many ways, including the number of people they employ and their patronage of local suppliers. Financial statements may assist the public by supplying information in connection with trends and recent developments in the prosperity of the enterprise and the range of its activities.
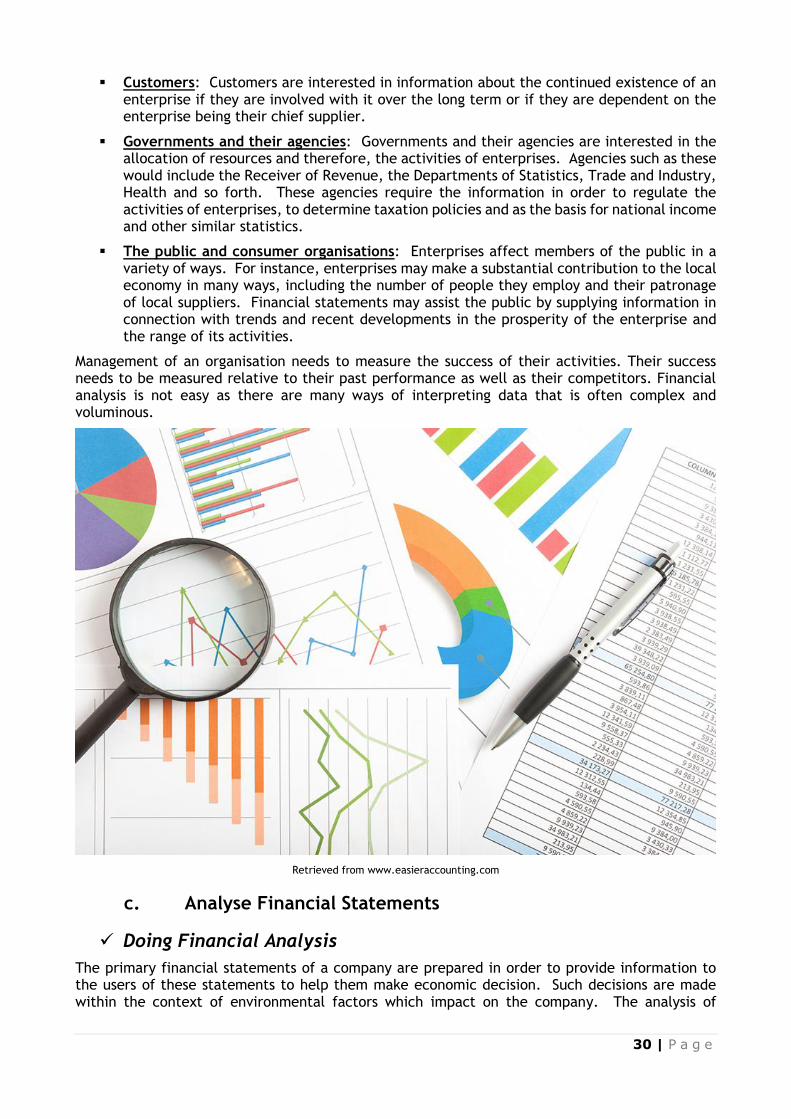
Management of an organisation needs to measure the success of their activities. Their success needs to be measured relative to their past performance as well as their competitors. Financial analysis is not easy as there are many ways of interpreting data that is often complex and voluminous.
Retrieved from www.easieraccounting.com
c. Analyse Financial Statements
✓ Doing Financial Analysis
The primary financial statements of a company are prepared in order to provide information to the users of these statements to help them make economic decision. Such decisions are made within the context of environmental factors which impact on the company. The analysis of
31 | P a g e
financial statements must therefore be conducted with insight into the expected economic conditions which will prevail in the industry and economy.
The main considerations in every analysis are:
▪ To establish the purpose of the analysis that needs to be done.
▪ Only when the purpose of the analysis is defined is it possible to select the appropriate ratios and items for analysis.
▪ The results of the analysis are then compared and evaluated in a trend analysis.
▪ Finally, the decisions require a prediction based on the ratio and trend analysis.
Financial analysis is used to fulfil one of the key challenges facing an organisation - establishing how well the organisation is performing. This is also known as a financial health check or organisational viability and is also referred to as organisational sustainability.
✓ Trends and Ratios (EEK3)
Using trends and ratios to analyse financial reports provides the organisation (management) with an understanding of financial information.
In assessing the significance of various financial data, experts engage in ratio analyses, the process of determining and evaluating financial ratios. A financial ratio is a relationship that indicates something about a company's activities, such as the ratio between the company's current assets, current liabilities or between its accounts receivable and its annual sales. The basic sources for these ratios are the company's financial statements that contain figures on assets, liabilities, profits, or losses.
Financial analysis is done by doing a comparative analysis. It is conducted by setting consecutive Statement of Financial Position (balance sheet), Statement of Comprehensive Income (income statement) or statement of cash flow side-by-side and reviewing changes in individual categories on a period to period multi-period basis. The most important item revealed by comparative financial statement analysis is trend.
Financial ratios are only meaningful when compared with other information. Since they are most often compared with industry data, ratios help an individual understand a company's performance relative to that of competitors; they are often used to trace performance over time.
Ratio analysis can reveal much about a company and its operations. However, there are several points to keep in mind about ratios.
▪ First, financial statement ratios are "flags" indicating areas of strength or weakness. One or even several ratios might be misleading, but when combined with other knowledge of a company's management and economic circumstances, ratio analysis can tell much about a corporation.
▪ Second, there is no single correct value for a ratio. The observation that the value of a particular ratio is too high, too low, or just right depends on the perspective of the analyst and on the company's competitive strategy.
▪ Third, a ratio is meaningful only when it is compared with some standard, such as an industry trend, ratio trend, a ratio trend for the specific company being analysed, or a stated management objective.
In trend analysis, financial ratios are compared over time, typically years. Year-to-year comparisons can highlight trends, pointing to the need for action. Trend analysis works best with five years of data.
32 | P a g e
d. Ratio Analysis
Step 1: Selection for Ratio Analysis
There are many possible ratios which could be selected. The objective of the analysis is the criteria used when deciding upon the relevant ratios to be selected. The analyst must be convinced that the number and denominator line items selected have a relationship which is meaningful. It is probable that a number of relevant ratios may be identified and selection from among these will be necessary to avoid information overload. You need to identify:
▪ What is the purpose of the analysis?
▪ What are the appropriate tools to use?
Step 2: Comparison of Ratio Analysis
The use of ratios for comparison between companies is limited by the differing accounting policies and the lack of uniformity in disclosure between organisations’ financial statements. This makes the comparison of ratio outcomes difficult between organisations. You need to identify who or what you are going to compare the ratio analysis with:
▪ With other companies
▪ With previous years
▪ With the industry
▪ With budgets
▪ With ideal targets
Step 3: Evaluation of Ratio Analysis
Factors such as the size of a company, outside influences on the company during the period under review, seasonal differences which arose within the period bounded by the two Statement of Financial Position (balance sheet) dates and which may not be reflected in either of the two Statement of Financial Position (balance sheet)s, must be noted when evaluating the ratio analysis. You need to identify:
▪ Is it good or bad?
▪ Was the result expected?
▪ If bad, why?
▪ If good, maintainable?
▪ Who/what is responsible?
Ratio analysis involves expressing one piece of financial information (for example profit) in terms of another (for example total assets).
Ratio analysis cannot be performed using only one set of figures.
Ratio analysis involves the comparison of ratios either with ratios of other companies and/or with previous ratios within the same organisation.
33 | P a g e
Step 4: Prediction based on Ratio Analysis
The decision to be made resulting from the analysis of historic data will require taking many variables into consideration for the present and future. The usual judgement must be exercised as any mechanical application is likely to be questionable. You need to identify:
▪ What is likely to happen if no action is taken?
▪ What improving action is possible?
Ratios are calculated to provide you with information about four aspects of a business’s operations:
▪ Profitability
▪ Liquidity
▪ Efficiency
▪ Leverage
Note: The categories must not be considered to be mutually exclusive, as the selection of a ratio for the primary purpose of establishing liquidity for example, may include a ratio with we have place into the efficiency category.
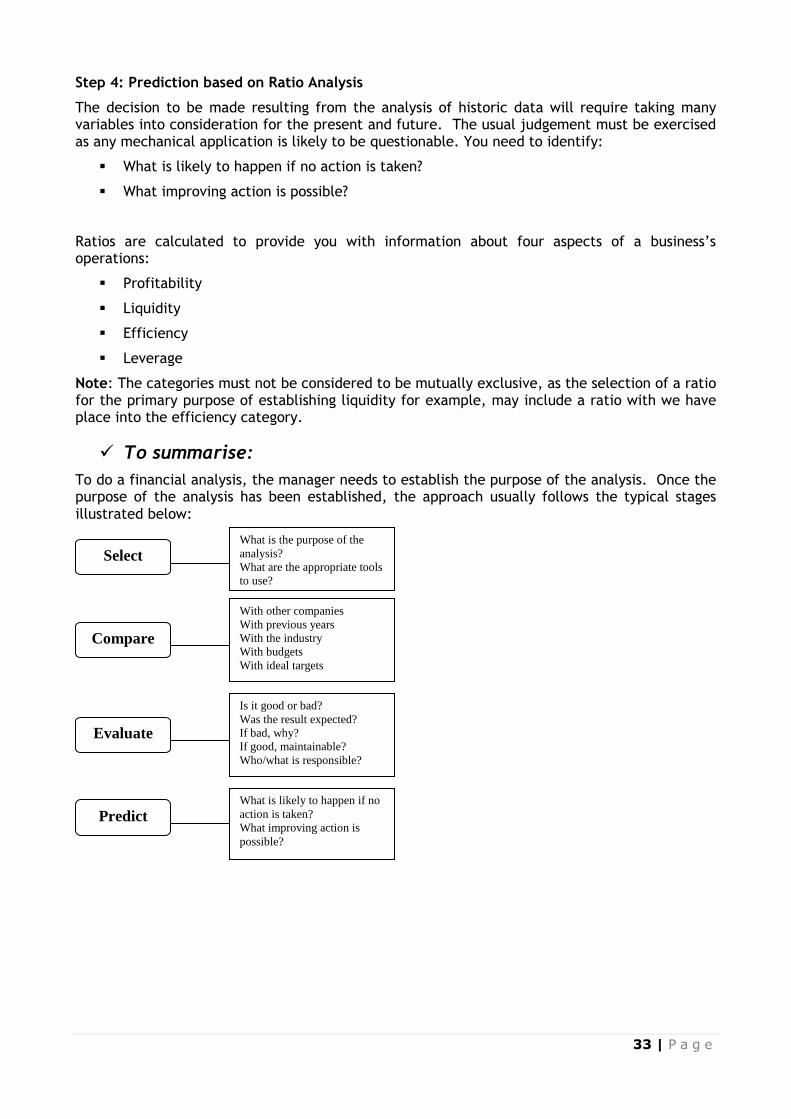
✓ To summarise:
To do a financial analysis, the manager needs to establish the purpose of the analysis. Once the purpose of the analysis has been established, the approach usually follows the typical stages illustrated below:
Select
Compare
Predict
Evaluate
What is the purpose of the
analysis?
What are the appropriate tools
to use?
With other companies
With previous years
With the industry
With budgets
With ideal targets
Is it good or bad?
Was the result expected?
If bad, why?
If good, maintainable?
Who/what is responsible?
What is likely to happen if no
action is taken?
What improving action is
possible?
34 | P a g e
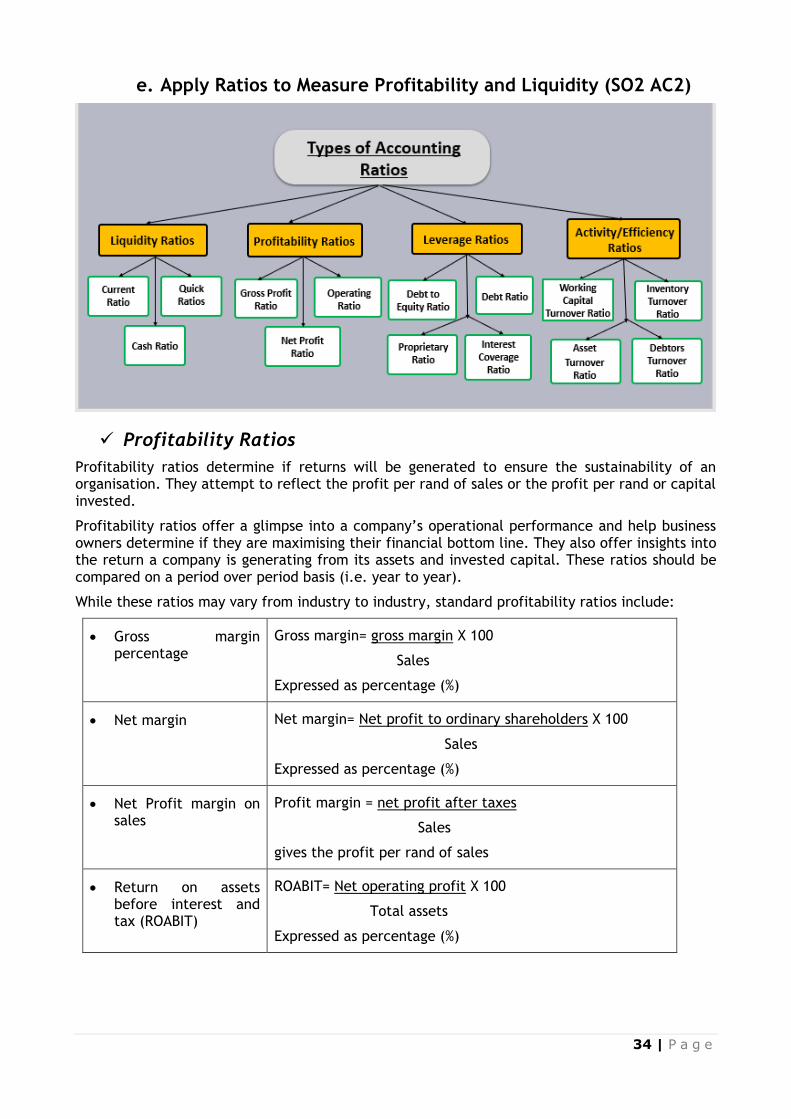
e. Apply Ratios to Measure Profitability and Liquidity (SO2 AC2)
✓ Profitability Ratios
Profitability ratios determine if returns will be generated to ensure the sustainability of an organisation. They attempt to reflect the profit per rand of sales or the profit per rand or capital invested.
Profitability ratios offer a glimpse into a company’s operational performance and help business owners determine if they are maximising their financial bottom line. They also offer insights into the return a company is generating from its assets and invested capital. These ratios should be compared on a period over period basis (i.e. year to year).
While these ratios may vary from industry to industry, standard profitability ratios include:
• Gross margin percentage
Gross margin= gross margin X 100
Sales
Expressed as percentage (%)
• Net margin Net margin= Net profit to ordinary shareholders X 100
Sales
Expressed as percentage (%)
• Net Profit margin on sales
Profit margin = net profit after taxes
Sales
gives the profit per rand of sales
• Return on assets before interest and tax (ROABIT)
ROABIT= Net operating profit X 100
Total assets
Expressed as percentage (%)
35 | P a g e
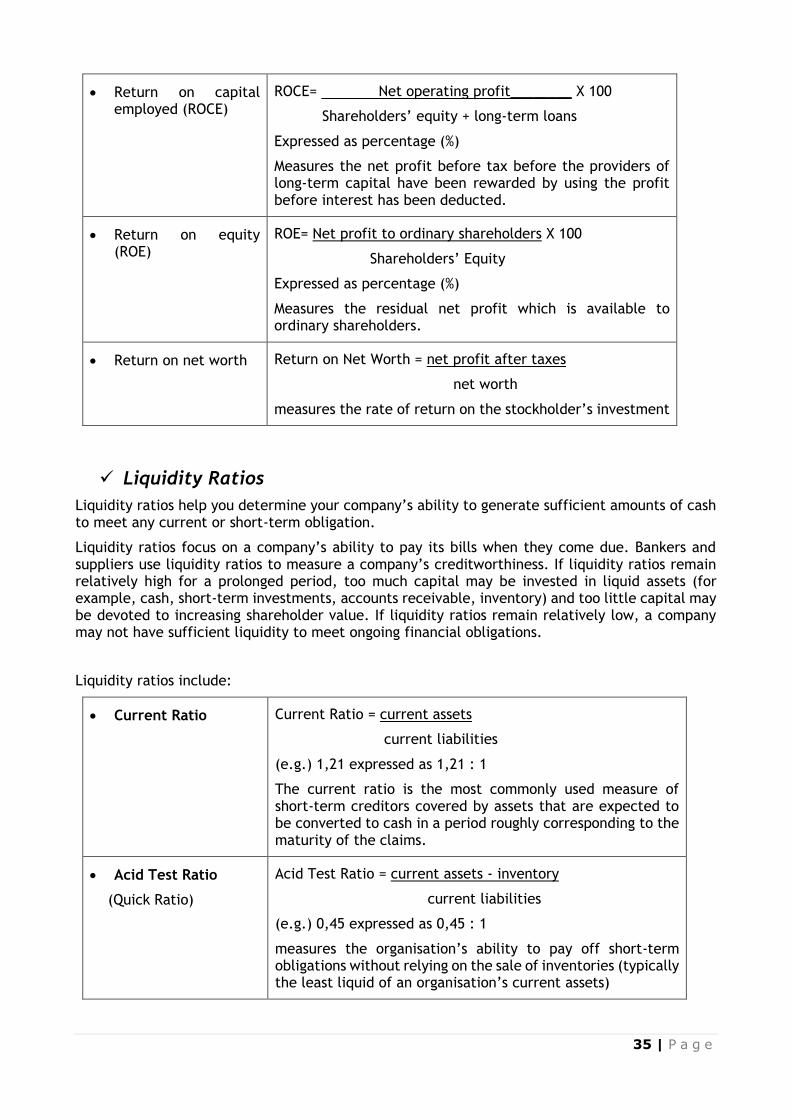
• Return on capital employed (ROCE)
ROCE= Net operating profit________ X 100
Shareholders’ equity + long-term loans
Expressed as percentage (%)
Measures the net profit before tax before the providers of long-term capital have been rewarded by using the profit before interest has been deducted.
• Return on equity (ROE)
ROE= Net profit to ordinary shareholders X 100
Shareholders’ Equity
Expressed as percentage (%)
Measures the residual net profit which is available to ordinary shareholders.
• Return on net worth Return on Net Worth = net profit after taxes
net worth
measures the rate of return on the stockholder’s investment
✓ Liquidity Ratios
Liquidity ratios help you determine your company’s ability to generate sufficient amounts of cash to meet any current or short-term obligation.
Liquidity ratios focus on a company’s ability to pay its bills when they come due. Bankers and suppliers use liquidity ratios to measure a company’s creditworthiness. If liquidity ratios remain relatively high for a prolonged period, too much capital may be invested in liquid assets (for example, cash, short-term investments, accounts receivable, inventory) and too little capital may be devoted to increasing shareholder value. If liquidity ratios remain relatively low, a company may not have sufficient liquidity to meet ongoing financial obligations.
Liquidity ratios include:
• Current Ratio
Current Ratio = current assets
current liabilities
(e.g.) 1,21 expressed as 1,21 : 1
The current ratio is the most commonly used measure of short-term creditors covered by assets that are expected to be converted to cash in a period roughly corresponding to the maturity of the claims.
• Acid Test Ratio
(Quick Ratio)
Acid Test Ratio = current assets - inventory
current liabilities
(e.g.) 0,45 expressed as 0,45 : 1
measures the organisation’s ability to pay off short-term obligations without relying on the sale of inventories (typically the least liquid of an organisation’s current assets)
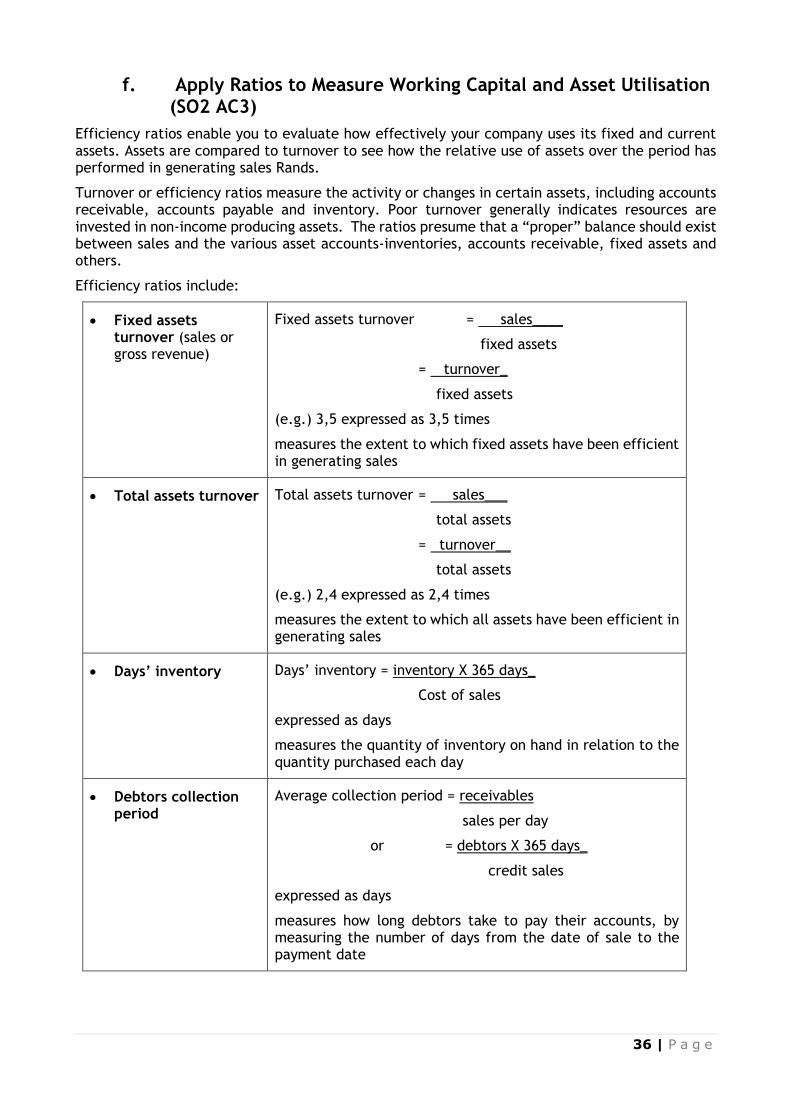
36 | P a g e
f. Apply Ratios to Measure Working Capital and Asset Utilisation (SO2 AC3)
Efficiency ratios enable you to evaluate how effectively your company uses its fixed and current assets. Assets are compared to turnover to see how the relative use of assets over the period has performed in generating sales Rands.
Turnover or efficiency ratios measure the activity or changes in certain assets, including accounts receivable, accounts payable and inventory. Poor turnover generally indicates resources are invested in non-income producing assets. The ratios presume that a “proper” balance should exist between sales and the various asset accounts-inventories, accounts receivable, fixed assets and others.
Efficiency ratios include:
• Fixed assets turnover (sales or gross revenue)
Fixed assets turnover = sales____
fixed assets
= turnover_
fixed assets
(e.g.) 3,5 expressed as 3,5 times
measures the extent to which fixed assets have been efficient in generating sales
• Total assets turnover
Total assets turnover = sales___
total assets
= turnover__
total assets
(e.g.) 2,4 expressed as 2,4 times
measures the extent to which all assets have been efficient in generating sales
• Days’ inventory
Days’ inventory = inventory X 365 days_
Cost of sales
expressed as days
measures the quantity of inventory on hand in relation to the quantity purchased each day
• Debtors collection period
Average collection period = receivables
sales per day
or = debtors X 365 days_
credit sales
expressed as days
measures how long debtors take to pay their accounts, by measuring the number of days from the date of sale to the payment date
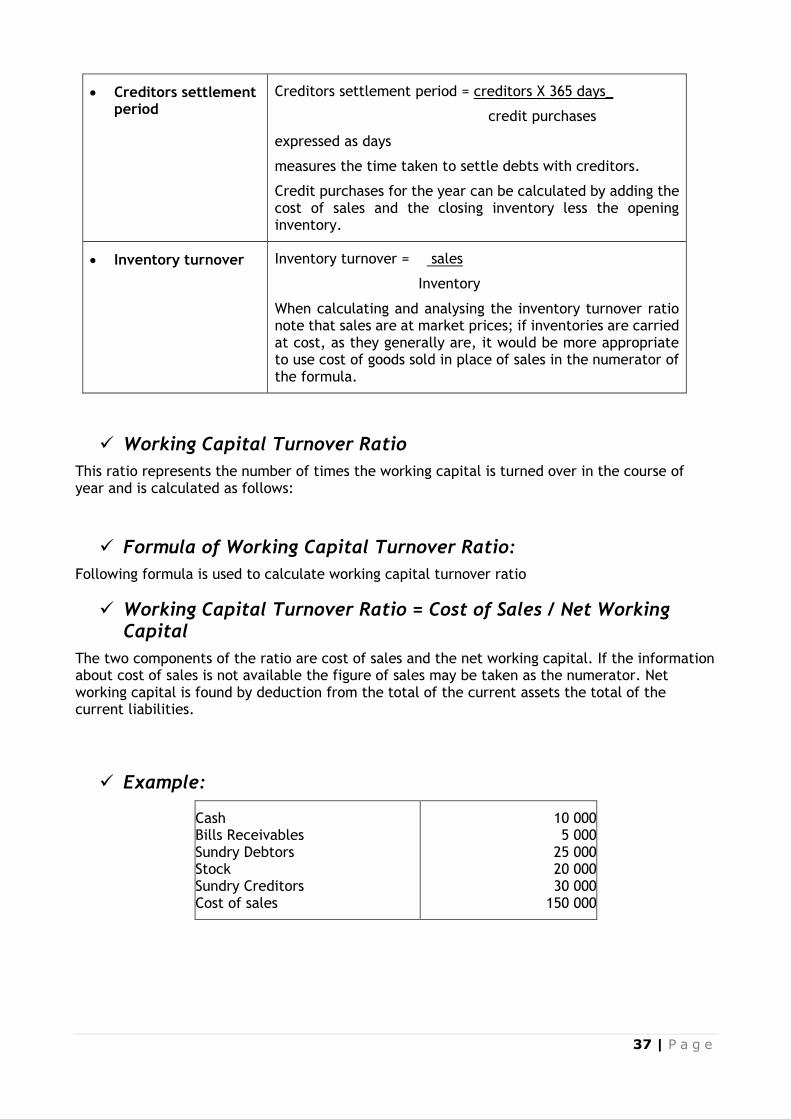
37 | P a g e
• Creditors settlement period
Creditors settlement period = creditors X 365 days_
credit purchases
expressed as days
measures the time taken to settle debts with creditors.
Credit purchases for the year can be calculated by adding the cost of sales and the closing inventory less the opening inventory.
• Inventory turnover
Inventory turnover = sales
Inventory
When calculating and analysing the inventory turnover ratio note that sales are at market prices; if inventories are carried at cost, as they generally are, it would be more appropriate to use cost of goods sold in place of sales in the numerator of the formula.
✓ Working Capital Turnover Ratio
This ratio represents the number of times the working capital is turned over in the course of year and is calculated as follows:
✓ Formula of Working Capital Turnover Ratio:
Following formula is used to calculate working capital turnover ratio
✓ Working Capital Turnover Ratio = Cost of Sales / Net Working Capital
The two components of the ratio are cost of sales and the net working capital. If the information about cost of sales is not available the figure of sales may be taken as the numerator. Net working capital is found by deduction from the total of the current assets the total of the current liabilities.
✓ Example:
Cash Bills Receivables Sundry Debtors Stock Sundry Creditors Cost of sales
10 000 5 000
25 000 20 000 30 000
150 000
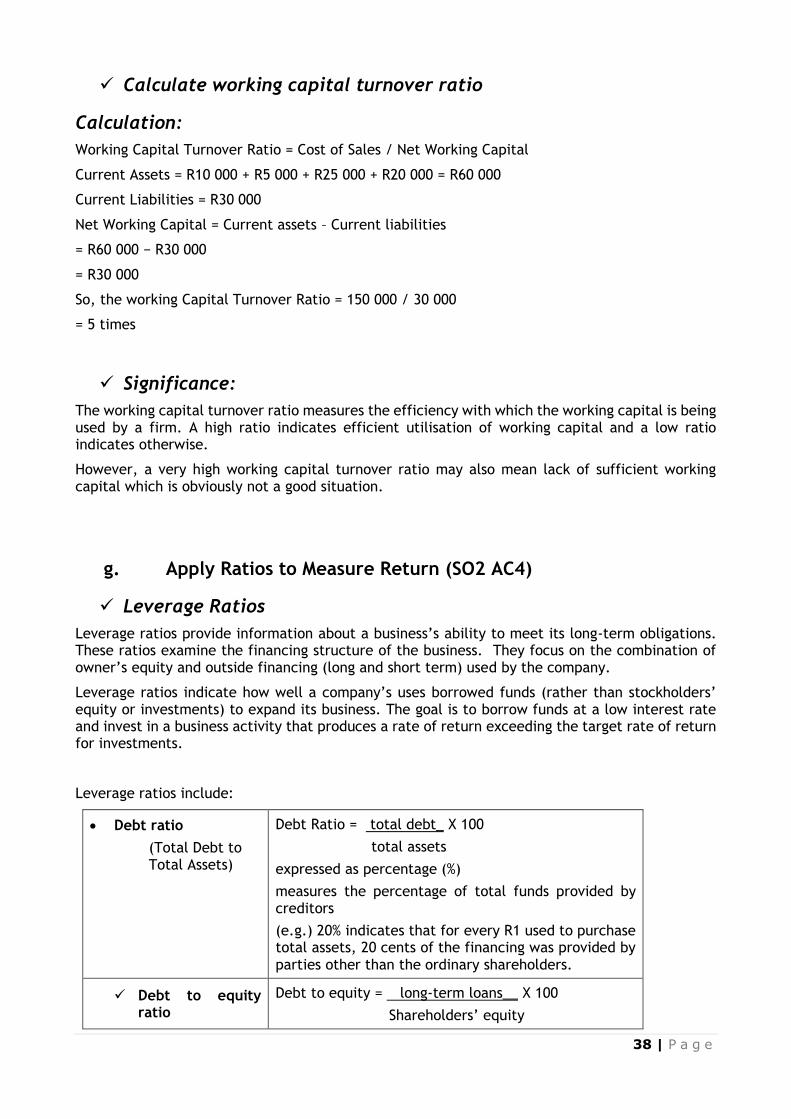
38 | P a g e
✓ Calculate working capital turnover ratio
Calculation:
Working Capital Turnover Ratio = Cost of Sales / Net Working Capital
Current Assets = R10 000 + R5 000 + R25 000 + R20 000 = R60 000
Current Liabilities = R30 000
Net Working Capital = Current assets – Current liabilities
= R60 000 − R30 000
= R30 000
So, the working Capital Turnover Ratio = 150 000 / 30 000
= 5 times
✓ Significance:
The working capital turnover ratio measures the efficiency with which the working capital is being used by a firm. A high ratio indicates efficient utilisation of working capital and a low ratio indicates otherwise.
However, a very high working capital turnover ratio may also mean lack of sufficient working capital which is obviously not a good situation.
g. Apply Ratios to Measure Return (SO2 AC4)
✓ Leverage Ratios
Leverage ratios provide information about a business’s ability to meet its long-term obligations. These ratios examine the financing structure of the business. They focus on the combination of owner’s equity and outside financing (long and short term) used by the company.
Leverage ratios indicate how well a company’s uses borrowed funds (rather than stockholders’ equity or investments) to expand its business. The goal is to borrow funds at a low interest rate and invest in a business activity that produces a rate of return exceeding the target rate of return for investments.
Leverage ratios include:
• Debt ratio
(Total Debt to Total Assets)
Debt Ratio = total debt_ X 100
total assets
expressed as percentage (%)
measures the percentage of total funds provided by creditors
(e.g.) 20% indicates that for every R1 used to purchase total assets, 20 cents of the financing was provided by parties other than the ordinary shareholders.
✓ Debt to equity ratio
Debt to equity = long-term loans__ X 100
Shareholders’ equity
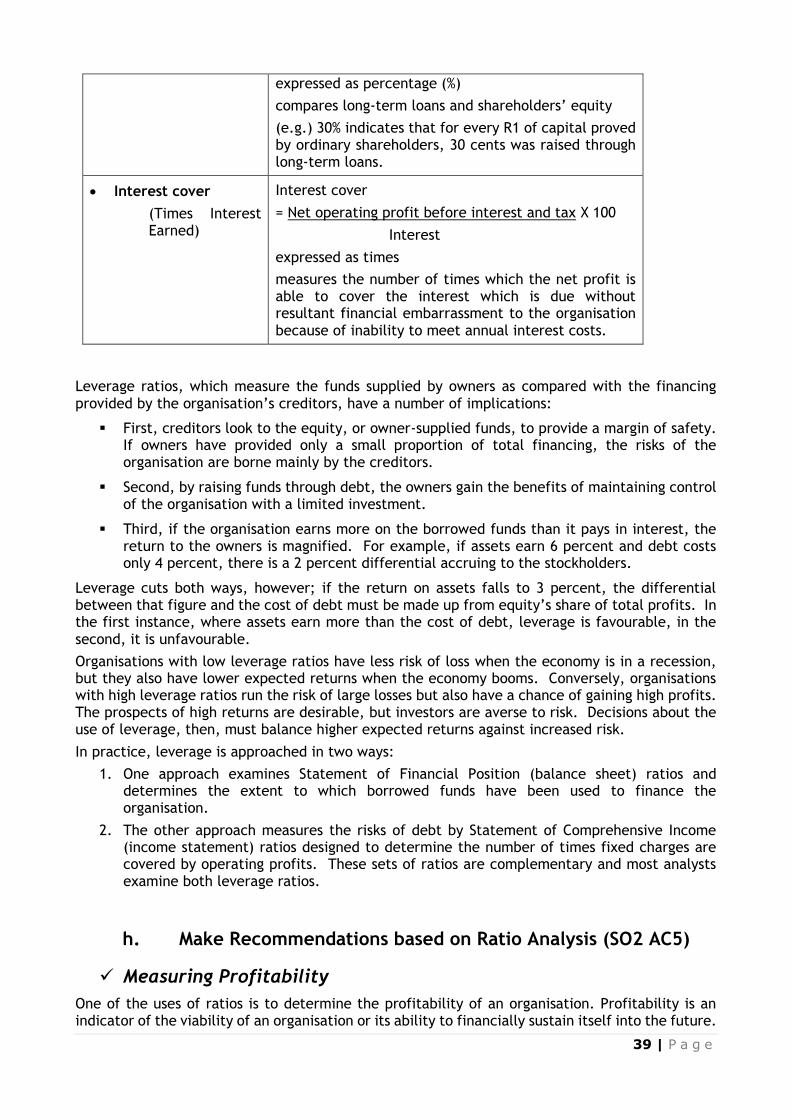
39 | P a g e
expressed as percentage (%)
compares long-term loans and shareholders’ equity
(e.g.) 30% indicates that for every R1 of capital proved by ordinary shareholders, 30 cents was raised through long-term loans.
• Interest cover
(Times Interest Earned)
Interest cover
= Net operating profit before interest and tax X 100
Interest
expressed as times
measures the number of times which the net profit is able to cover the interest which is due without resultant financial embarrassment to the organisation because of inability to meet annual interest costs.
Leverage ratios, which measure the funds supplied by owners as compared with the financing provided by the organisation’s creditors, have a number of implications:
▪ First, creditors look to the equity, or owner-supplied funds, to provide a margin of safety. If owners have provided only a small proportion of total financing, the risks of the organisation are borne mainly by the creditors.
▪ Second, by raising funds through debt, the owners gain the benefits of maintaining control of the organisation with a limited investment.
▪ Third, if the organisation earns more on the borrowed funds than it pays in interest, the return to the owners is magnified. For example, if assets earn 6 percent and debt costs only 4 percent, there is a 2 percent differential accruing to the stockholders.
Leverage cuts both ways, however; if the return on assets falls to 3 percent, the differential between that figure and the cost of debt must be made up from equity’s share of total profits. In the first instance, where assets earn more than the cost of debt, leverage is favourable, in the second, it is unfavourable.
Organisations with low leverage ratios have less risk of loss when the economy is in a recession, but they also have lower expected returns when the economy booms. Conversely, organisations with high leverage ratios run the risk of large losses but also have a chance of gaining high profits. The prospects of high returns are desirable, but investors are averse to risk. Decisions about the use of leverage, then, must balance higher expected returns against increased risk.
In practice, leverage is approached in two ways:
1. One approach examines Statement of Financial Position (balance sheet) ratios and determines the extent to which borrowed funds have been used to finance the organisation.
2. The other approach measures the risks of debt by Statement of Comprehensive Income (income statement) ratios designed to determine the number of times fixed charges are covered by operating profits. These sets of ratios are complementary and most analysts examine both leverage ratios.
h. Make Recommendations based on Ratio Analysis (SO2 AC5)
✓ Measuring Profitability
One of the uses of ratios is to determine the profitability of an organisation. Profitability is an indicator of the viability of an organisation or its ability to financially sustain itself into the future.
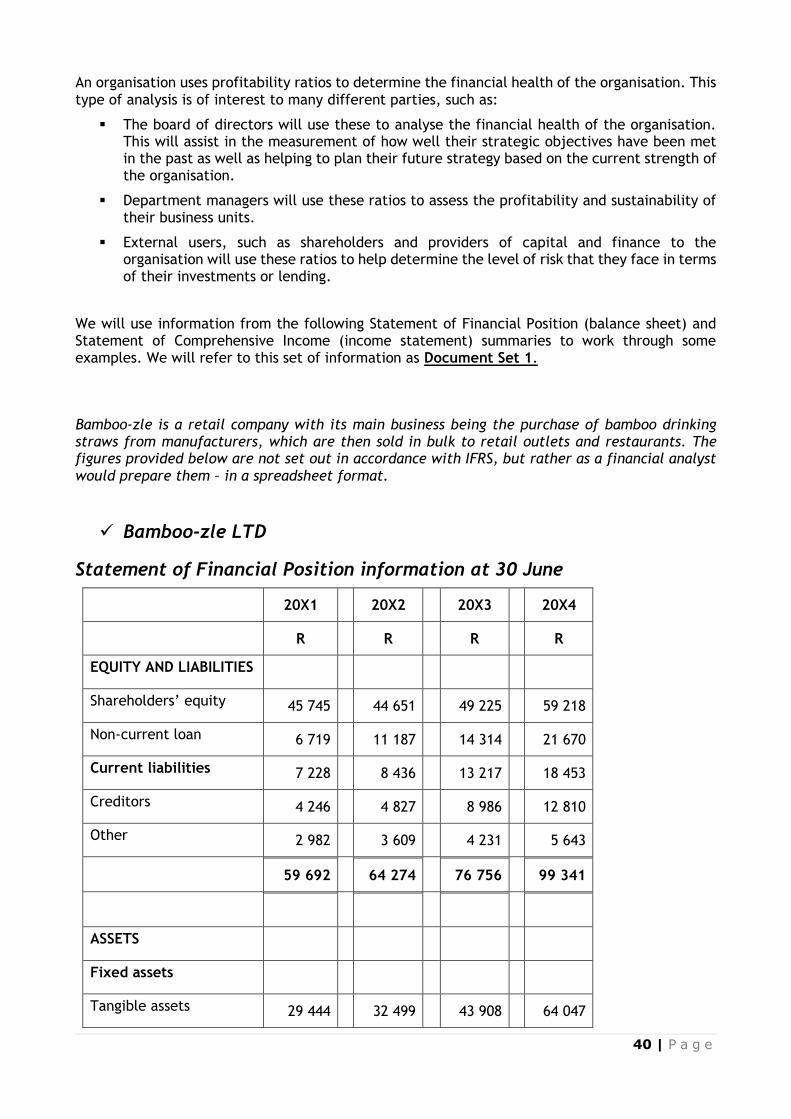
40 | P a g e
An organisation uses profitability ratios to determine the financial health of the organisation. This type of analysis is of interest to many different parties, such as:
▪ The board of directors will use these to analyse the financial health of the organisation. This will assist in the measurement of how well their strategic objectives have been met in the past as well as helping to plan their future strategy based on the current strength of the organisation.
▪ Department managers will use these ratios to assess the profitability and sustainability of their business units.
▪ External users, such as shareholders and providers of capital and finance to the organisation will use these ratios to help determine the level of risk that they face in terms of their investments or lending.
We will use information from the following Statement of Financial Position (balance sheet) and Statement of Comprehensive Income (income statement) summaries to work through some examples. We will refer to this set of information as Document Set 1.
Bamboo-zle is a retail company with its main business being the purchase of bamboo drinking straws from manufacturers, which are then sold in bulk to retail outlets and restaurants. The figures provided below are not set out in accordance with IFRS, but rather as a financial analyst would prepare them – in a spreadsheet format.
✓ Bamboo-zle LTD
Statement of Financial Position information at 30 June
20X1 20X2 20X3 20X4
R R R R
EQUITY AND LIABILITIES
Shareholders’ equity 45 745 44 651 49 225 59 218
Non-current loan 6 719 11 187 14 314 21 670
Current liabilities 7 228 8 436 13 217 18 453
Creditors 4 246 4 827 8 986 12 810
Other 2 982 3 609 4 231 5 643
59 692 64 274 76 756 99 341
ASSETS
Fixed assets
Tangible assets 29 444 32 499 43 908 64 047
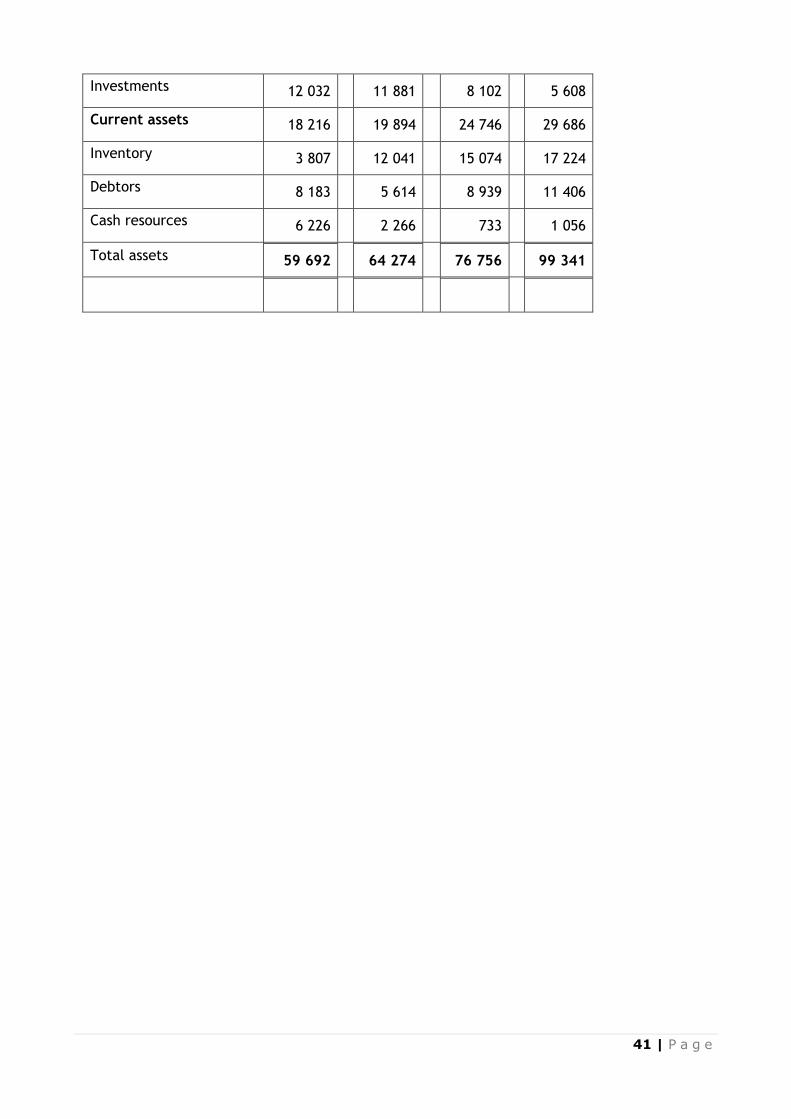
41 | P a g e
Investments 12 032 11 881 8 102 5 608
Current assets 18 216 19 894 24 746 29 686
Inventory 3 807 12 041 15 074 17 224
Debtors 8 183 5 614 8 939 11 406
Cash resources 6 226 2 266 733 1 056
Total assets 59 692 64 274 76 756 99 341
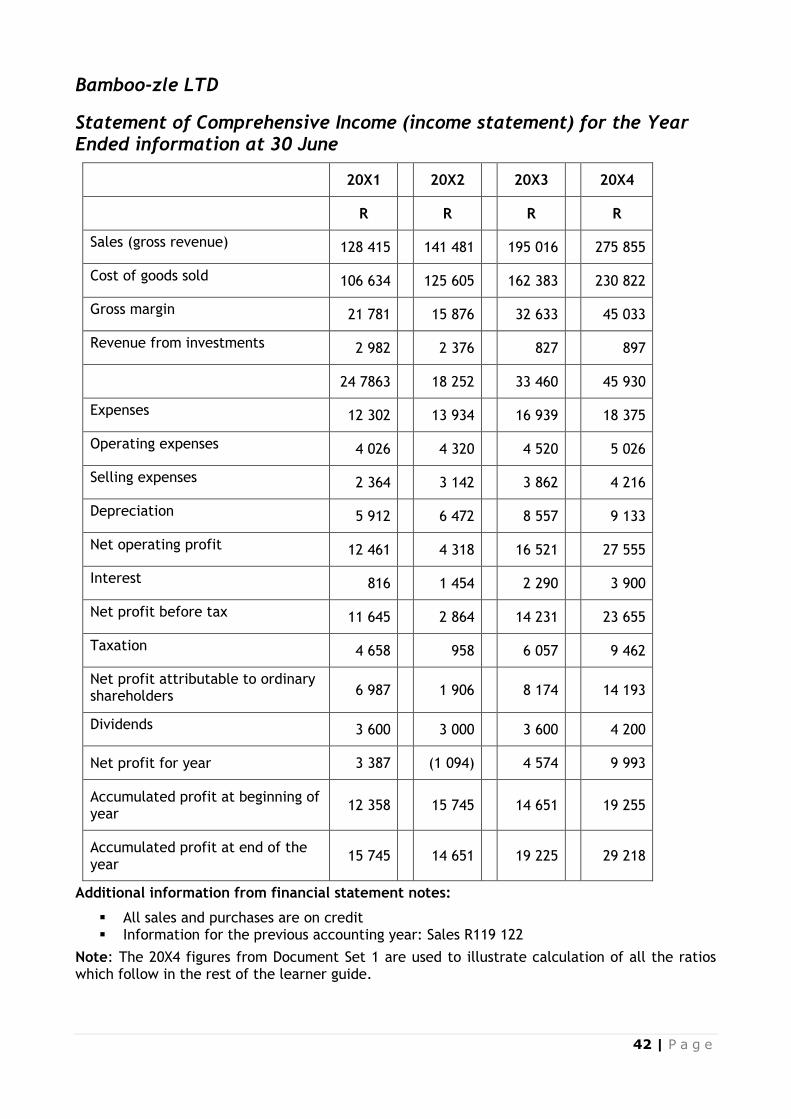
42 | P a g e
Bamboo-zle LTD
Statement of Comprehensive Income (income statement) for the Year Ended information at 30 June
20X1 20X2 20X3 20X4
R R R R
Sales (gross revenue) 128 415 141 481 195 016 275 855
Cost of goods sold 106 634 125 605 162 383 230 822
Gross margin 21 781 15 876 32 633 45 033
Revenue from investments 2 982 2 376 827 897
24 7863 18 252 33 460 45 930
Expenses 12 302 13 934 16 939 18 375
Operating expenses 4 026 4 320 4 520 5 026
Selling expenses 2 364 3 142 3 862 4 216
Depreciation 5 912 6 472 8 557 9 133
Net operating profit 12 461 4 318 16 521 27 555
Interest 816 1 454 2 290 3 900
Net profit before tax 11 645 2 864 14 231 23 655
Taxation 4 658 958 6 057 9 462
Net profit attributable to ordinary shareholders 6 987 1 906 8 174 14 193
Dividends 3 600 3 000 3 600 4 200
Net profit for year 3 387 (1 094) 4 574 9 993
Accumulated profit at beginning of year
12 358 15 745 14 651 19 255
Accumulated profit at end of the year
15 745 14 651 19 225 29 218
Additional information from financial statement notes:
▪ All sales and purchases are on credit ▪ Information for the previous accounting year: Sales R119 122
Note: The 20X4 figures from Document Set 1 are used to illustrate calculation of all the ratios which follow in the rest of the learner guide.
43 | P a g e
i. Applying Ratios to measure Profitability
We have selected five primary aspects of profitability which are commonly identified in various industries. The ratios attempt to reflect the profit per rand of sales or the profit per rand of capital invested, such as:
▪ Gross margin
▪ Net margin
▪ Return on assets before interest and tax
▪ Return on capital employed
▪ Return on equity
Note: The 20X4 figures from Document Set 1 are used to illustrate calculation of all the ratios which follow in the rest of the learner guide.
Gross margin percentage (GM)
Gross margin = gross margin X 100
Sales
= 45 033_ X 100
275 855
= 16,3%
This ratio indicates the percentages by which the total selling price is greater than the cost prices.
▪ A gross margin percentage of 16,3% indicates that for every R1 of sales, 16,3 cents was gross profit. The remaining 83,7 cents in each rand is the cost price of the goods.
The trend for Bamboo-zle shows:
Gross margin 20X1
17,0
20X2
11,2
20X3
16,7
20X4
16,3
When comparing this with previous years, the ratio has dropped from 17,0% in 20X120X1 to the current 16,3%. It is apparent that Bamboo-zle had pressure on its gross margin in 20X2, as gross margin fell to 11,2 %. This could have been from two sources:
▪ Pressure on selling prices as a result of competition in the industry
▪ Upward pressure on costs as a result of inflation or other cost factors.
▪ It is important to note that the rand amount of gross margin has more than doubled over the period as a result of the growth of sales.
Net margin (NM) Net margin
= Net profit to ordinary shareholders X 100
Sales
= 14 193_ X 100
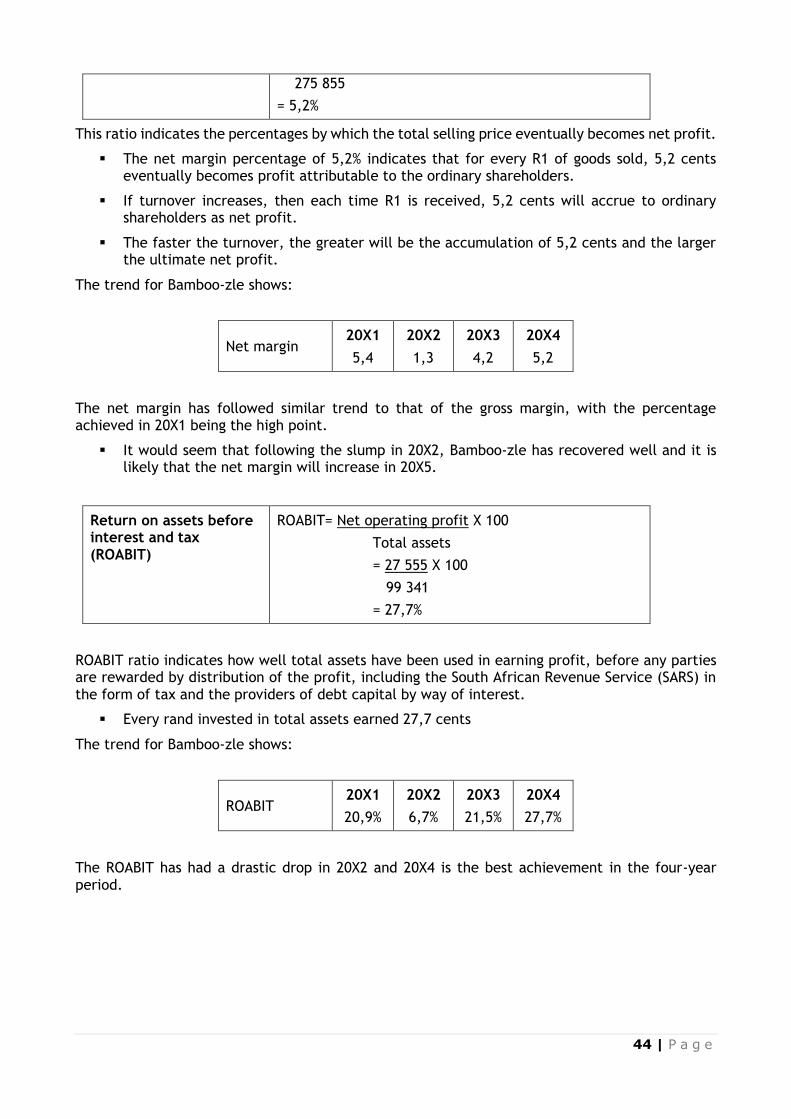
44 | P a g e
275 855
= 5,2%
This ratio indicates the percentages by which the total selling price eventually becomes net profit.
▪ The net margin percentage of 5,2% indicates that for every R1 of goods sold, 5,2 cents eventually becomes profit attributable to the ordinary shareholders.
▪ If turnover increases, then each time R1 is received, 5,2 cents will accrue to ordinary shareholders as net profit.
▪ The faster the turnover, the greater will be the accumulation of 5,2 cents and the larger the ultimate net profit.
The trend for Bamboo-zle shows:
Net margin 20X1
5,4
20X2
1,3
20X3
4,2
20X4
5,2
The net margin has followed similar trend to that of the gross margin, with the percentage achieved in 20X1 being the high point.
▪ It would seem that following the slump in 20X2, Bamboo-zle has recovered well and it is likely that the net margin will increase in 20X5.
Return on assets before interest and tax (ROABIT)
ROABIT= Net operating profit X 100
Total assets
= 27 555 X 100
99 341
= 27,7%
ROABIT ratio indicates how well total assets have been used in earning profit, before any parties are rewarded by distribution of the profit, including the South African Revenue Service (SARS) in the form of tax and the providers of debt capital by way of interest.
▪ Every rand invested in total assets earned 27,7 cents
The trend for Bamboo-zle shows:
ROABIT 20X1
20,9%
20X2
6,7%
20X3
21,5%
20X4
27,7%
The ROABIT has had a drastic drop in 20X2 and 20X4 is the best achievement in the four-year period.
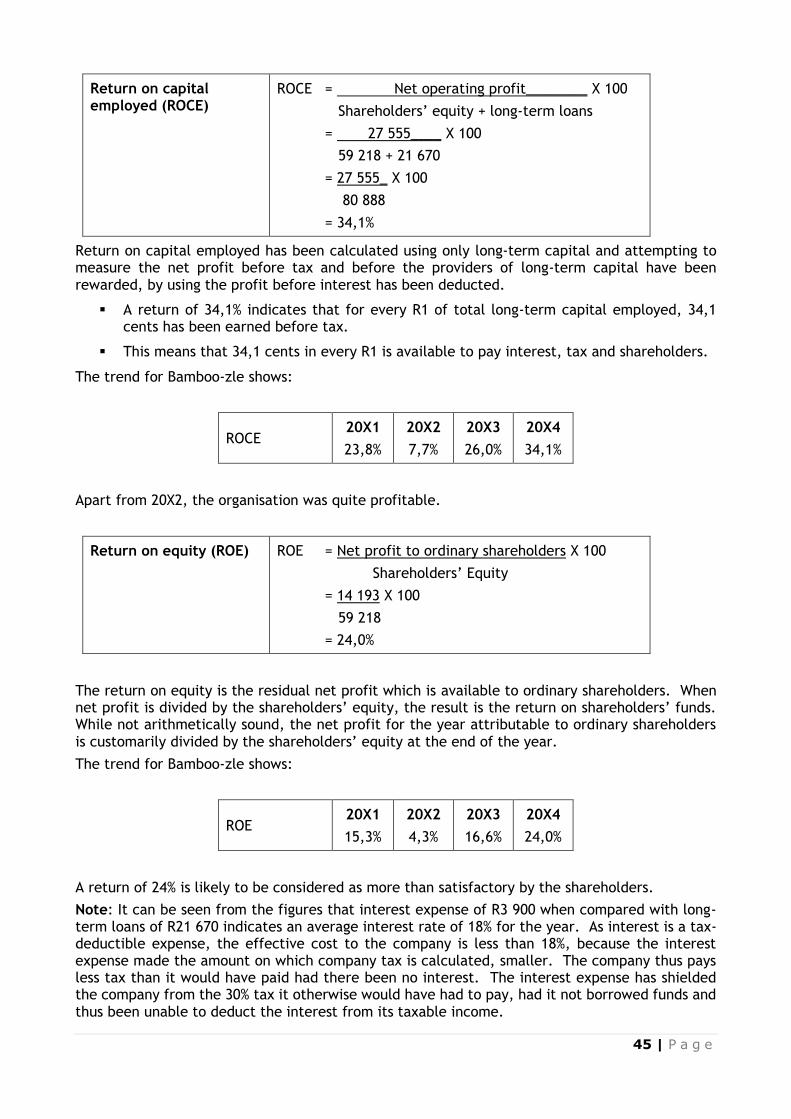
45 | P a g e
Return on capital employed (ROCE)
ROCE = Net operating profit________ X 100
Shareholders’ equity + long-term loans
= 27 555____ X 100
59 218 + 21 670
= 27 555_ X 100
80 888
= 34,1%
Return on capital employed has been calculated using only long-term capital and attempting to measure the net profit before tax and before the providers of long-term capital have been rewarded, by using the profit before interest has been deducted.
▪ A return of 34,1% indicates that for every R1 of total long-term capital employed, 34,1 cents has been earned before tax.
▪ This means that 34,1 cents in every R1 is available to pay interest, tax and shareholders.
The trend for Bamboo-zle shows:
ROCE 20X1
23,8%
20X2
7,7%
20X3
26,0%
20X4
34,1%
Apart from 20X2, the organisation was quite profitable.
Return on equity (ROE) ROE = Net profit to ordinary shareholders X 100
Shareholders’ Equity
= 14 193 X 100
59 218
= 24,0%
The return on equity is the residual net profit which is available to ordinary shareholders. When net profit is divided by the shareholders’ equity, the result is the return on shareholders’ funds. While not arithmetically sound, the net profit for the year attributable to ordinary shareholders is customarily divided by the shareholders’ equity at the end of the year.
The trend for Bamboo-zle shows:
ROE 20X1
15,3%
20X2
4,3%
20X3
16,6%
20X4
24,0%
A return of 24% is likely to be considered as more than satisfactory by the shareholders.
Note: It can be seen from the figures that interest expense of R3 900 when compared with long-term loans of R21 670 indicates an average interest rate of 18% for the year. As interest is a tax-deductible expense, the effective cost to the company is less than 18%, because the interest expense made the amount on which company tax is calculated, smaller. The company thus pays less tax than it would have paid had there been no interest. The interest expense has shielded the company from the 30% tax it otherwise would have had to pay, had it not borrowed funds and thus been unable to deduct the interest from its taxable income.
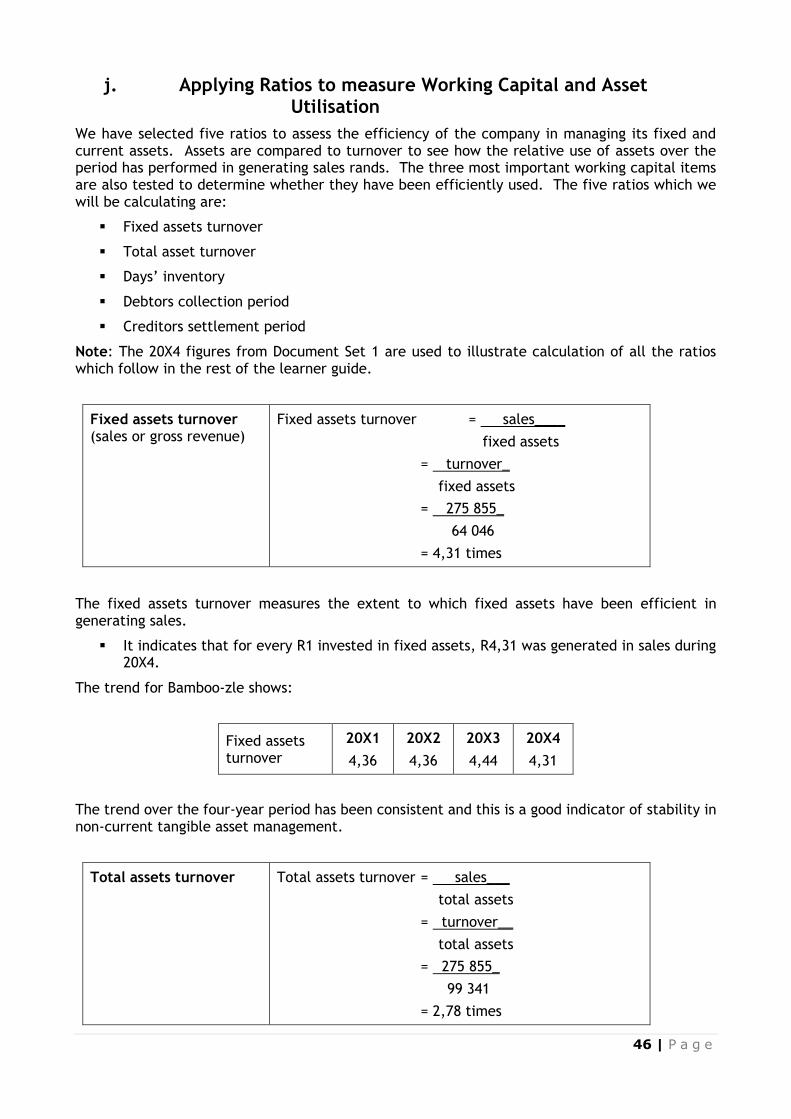
46 | P a g e
j. Applying Ratios to measure Working Capital and Asset Utilisation
We have selected five ratios to assess the efficiency of the company in managing its fixed and current assets. Assets are compared to turnover to see how the relative use of assets over the period has performed in generating sales rands. The three most important working capital items are also tested to determine whether they have been efficiently used. The five ratios which we will be calculating are:
▪ Fixed assets turnover
▪ Total asset turnover
▪ Days’ inventory
▪ Debtors collection period
▪ Creditors settlement period
Note: The 20X4 figures from Document Set 1 are used to illustrate calculation of all the ratios which follow in the rest of the learner guide.
Fixed assets turnover (sales or gross revenue)
Fixed assets turnover = sales____
fixed assets
= turnover_
fixed assets
= 275 855_
64 046
= 4,31 times
The fixed assets turnover measures the extent to which fixed assets have been efficient in generating sales.
▪ It indicates that for every R1 invested in fixed assets, R4,31 was generated in sales during 20X4.
The trend for Bamboo-zle shows:
Fixed assets turnover
20X1
4,36
20X2
4,36
20X3
4,44
20X4
4,31
The trend over the four-year period has been consistent and this is a good indicator of stability in non-current tangible asset management.
Total assets turnover
Total assets turnover = sales___
total assets
= turnover__
total assets
= 275 855_
99 341
= 2,78 times
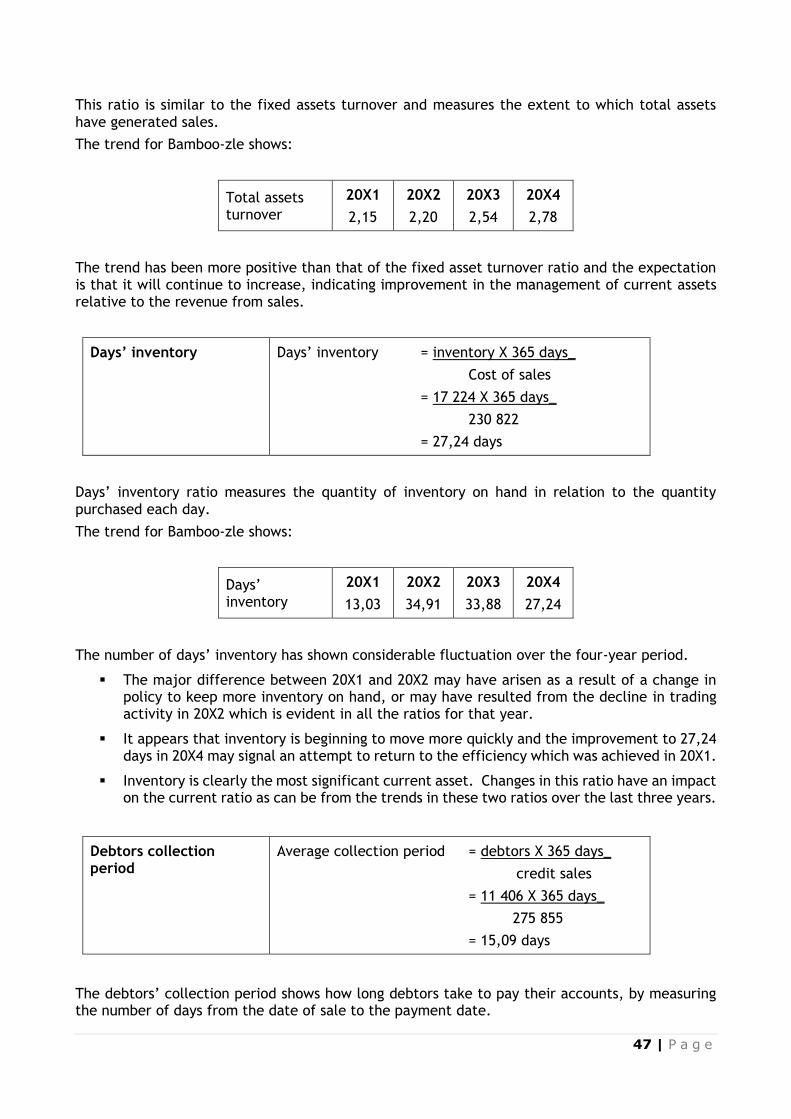
47 | P a g e
This ratio is similar to the fixed assets turnover and measures the extent to which total assets have generated sales.
The trend for Bamboo-zle shows:
Total assets turnover
20X1
2,15
20X2
2,20
20X3
2,54
20X4
2,78
The trend has been more positive than that of the fixed asset turnover ratio and the expectation is that it will continue to increase, indicating improvement in the management of current assets relative to the revenue from sales.
Days’ inventory
Days’ inventory = inventory X 365 days_
Cost of sales
= 17 224 X 365 days_
230 822
= 27,24 days
Days’ inventory ratio measures the quantity of inventory on hand in relation to the quantity purchased each day.
The trend for Bamboo-zle shows:
Days’ inventory
20X1
13,03
20X2
34,91
20X3
33,88
20X4
27,24
The number of days’ inventory has shown considerable fluctuation over the four-year period.
▪ The major difference between 20X1 and 20X2 may have arisen as a result of a change in policy to keep more inventory on hand, or may have resulted from the decline in trading activity in 20X2 which is evident in all the ratios for that year.
▪ It appears that inventory is beginning to move more quickly and the improvement to 27,24 days in 20X4 may signal an attempt to return to the efficiency which was achieved in 20X1.
▪ Inventory is clearly the most significant current asset. Changes in this ratio have an impact on the current ratio as can be from the trends in these two ratios over the last three years.
Debtors collection period
Average collection period = debtors X 365 days_
credit sales
= 11 406 X 365 days_
275 855
= 15,09 days
The debtors’ collection period shows how long debtors take to pay their accounts, by measuring the number of days from the date of sale to the payment date.
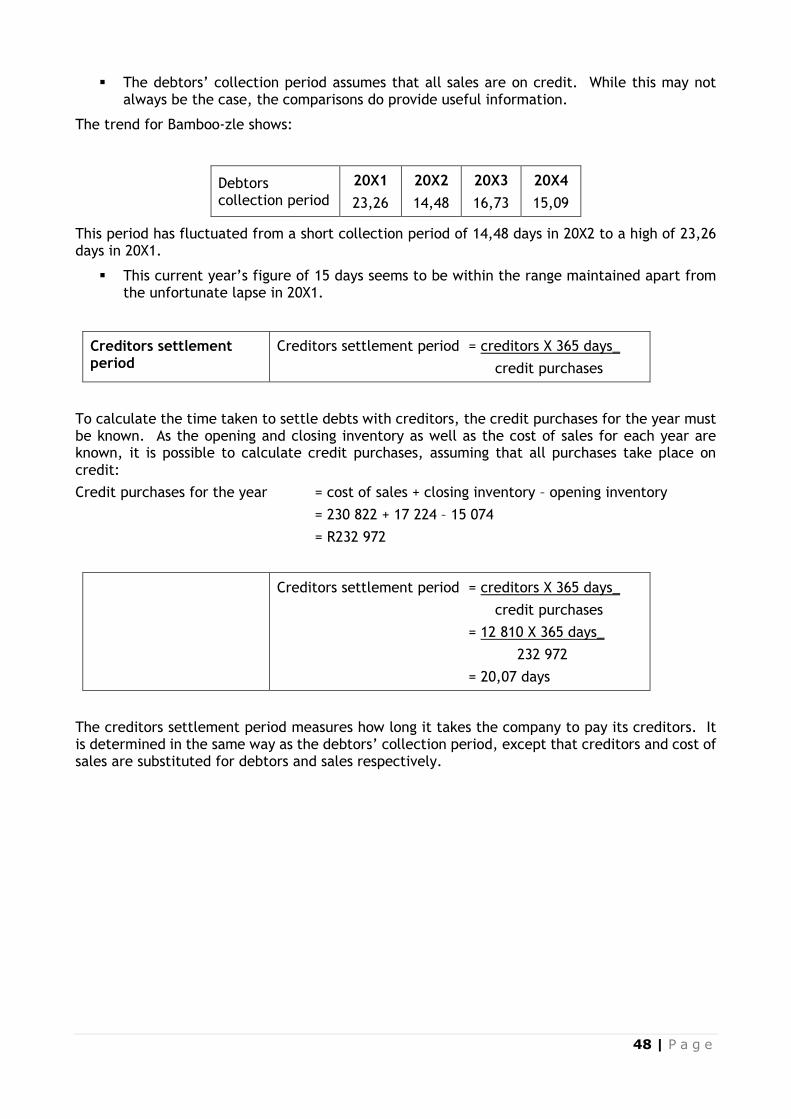
48 | P a g e
▪ The debtors’ collection period assumes that all sales are on credit. While this may not always be the case, the comparisons do provide useful information.
The trend for Bamboo-zle shows:
Debtors collection period
20X1
23,26
20X2
14,48
20X3
16,73
20X4
15,09
This period has fluctuated from a short collection period of 14,48 days in 20X2 to a high of 23,26 days in 20X1.
▪ This current year’s figure of 15 days seems to be within the range maintained apart from the unfortunate lapse in 20X1.
Creditors settlement period
Creditors settlement period = creditors X 365 days_
credit purchases
To calculate the time taken to settle debts with creditors, the credit purchases for the year must be known. As the opening and closing inventory as well as the cost of sales for each year are known, it is possible to calculate credit purchases, assuming that all purchases take place on credit:
Credit purchases for the year = cost of sales + closing inventory – opening inventory
= 230 822 + 17 224 – 15 074
= R232 972
Creditors settlement period = creditors X 365 days_
credit purchases
= 12 810 X 365 days_
232 972
= 20,07 days
The creditors settlement period measures how long it takes the company to pay its creditors. It is determined in the same way as the debtors’ collection period, except that creditors and cost of sales are substituted for debtors and sales respectively.
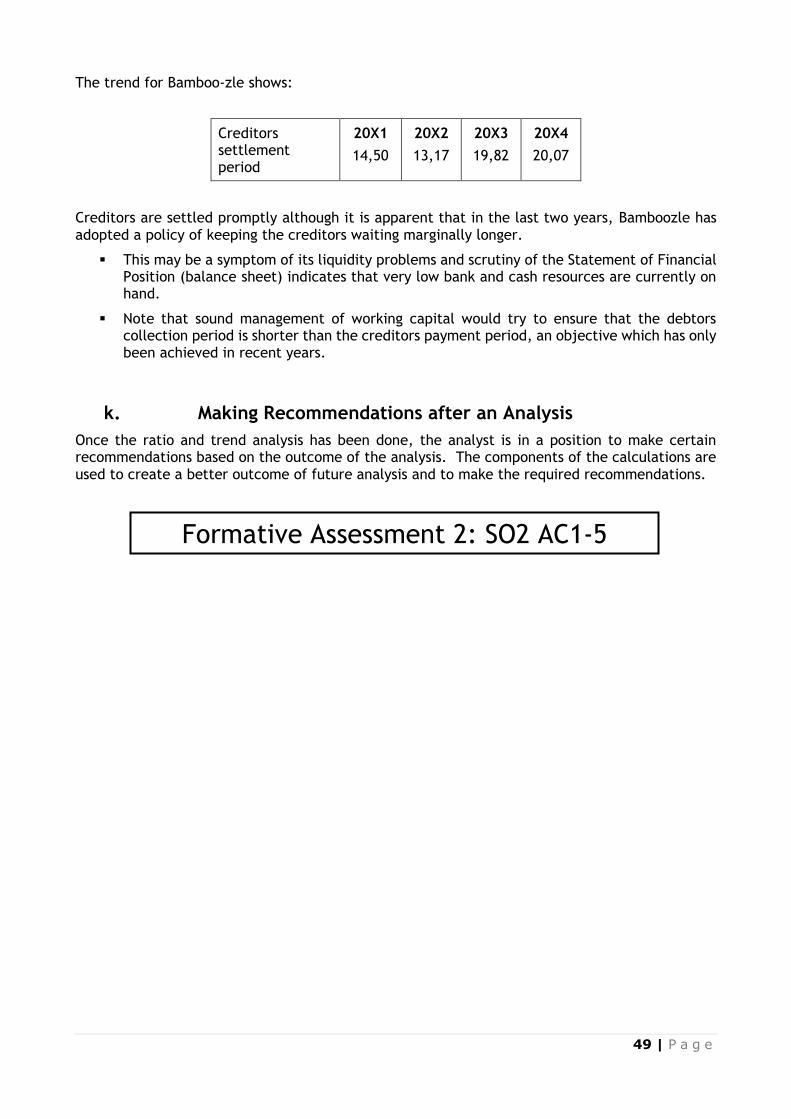
49 | P a g e
The trend for Bamboo-zle shows:
Creditors settlement period
20X1
14,50
20X2
13,17
20X3
19,82
20X4
20,07
Creditors are settled promptly although it is apparent that in the last two years, Bamboozle has adopted a policy of keeping the creditors waiting marginally longer.
▪ This may be a symptom of its liquidity problems and scrutiny of the Statement of Financial Position (balance sheet) indicates that very low bank and cash resources are currently on hand.
▪ Note that sound management of working capital would try to ensure that the debtors collection period is shorter than the creditors payment period, an objective which has only been achieved in recent years.
k. Making Recommendations after an Analysis
Once the ratio and trend analysis has been done, the analyst is in a position to make certain recommendations based on the outcome of the analysis. The components of the calculations are used to create a better outcome of future analysis and to make the required recommendations.
Formative Assessment 2: SO2 AC1-5
50 | P a g e
SECTION 3: DESCRIBE AND PREPARE FINANCIAL FORECASTS
Specific Outcome 3
Describe and prepare financial forecasts.
Assessment Criteria
1. The types and formats of financial forecasts are identified with examples.
2. Sources of financial forecasts are identified as per the entity's standard practice.
3. Factors in preparing financial forecasts are outlined in line with entity's standard operating procedures.
4. Relevant factors are incorporated in the preparation of financial forecasts.
5. Financial forecasts are analysed to determine viability against the entity's requirements.
3.1 Describing and Preparing Financial Forecasts Business entities need to plan for the future; they must consider alternative management strategies and prepare capital and operating budgets; they must also consider alternative funding and cash budget possibilities. An important part of the planning process is the preparation of prospective financial statements that attempt to predict the outcome of the business entity's activities in future periods.
Companies should also consider whether investors could expect that emerging risks including climate-related risks could affect the amounts and disclosure reported in the financial statements.
Financial forecasts and financial projections are prospective financial statements that present an entity's expected financial position, results of operations, and cash flows in future periods under two different conditions.
Financial forecasts assume that the entity will continue to function in the manner in which it is currently functioning. For example, that a retail store chain will continue to do business in the manner in which it is currently engaged. The financial forecast presents the predicted results for the next year.
Financial projections, on the other hand, make one or more hypothetical assumptions about an entity's future course of action. For example, if the retail store chain were considering making a move to only stock locally produced merchandise in future, a financial projection would provide expected results. Financial forecasts and projections should be distinguished from pro forma financial statements, which show the effect of a hypothetical future event on the historical financial statements results.
It is critical to your business success that you prepare realistic forecasts of your future business performance. You need to forecast your operations for three to five years in order to guide your
51 | P a g e
business growth. You will need realistic forecasts to support your business plan if you need a loan or investor funds. The elements of and influences on pro forma statements include2:
✓ Prior Financial Statements
Of course, you will have to use previous financial statements if your business has been operating for some time. From your prior financial statements, you will use sales and revenue levels, business ratios, average expenses, and any relevant information about your accounts receivable or payable. You should expect your prior financial statements to show financial improvement for each year of operation.
✓ Internal Factors
The status of your operations is important in preparing pro forma statements and projections. For example, you must consider whether your business needs to relocate due to expansion, or your business needs to buy expensive new equipment to replace older models. You also must consider your competition, how you are measuring up to them, and whether you need a new marketing plan to be more competitive. Also, consider whether your company needs additional personnel or additional training.
✓ External Factors
The status of the country's economy is very relevant to your company's future. Certain businesses may be affected by the status of the global economy. It is important to understand the industry trends to be certain that your product or services will continue to be marketable. The economy may be affected by a number of factors, such as socio-political trends, natural resource availability and environmental shifts due to the impacts of climate change.
✓ Projected Financial Statement
The pro forma financial statements will include estimated future sales, expenses, and profits. These items need to be broken down in order to be meaningful. The sales estimates should state which salesperson, which department, or which region will generate the sales. The estimated expenses must be broken down into general and administrative, operating expenses, depreciation, and taxes.
a. Analysing Past Performance, Recognising Opportunities and Planning for the Future (EEK4)
Part of your role as a manager requires that you analyse past performance, recognise opportunities and plan for the future of your unit.
It's easy to focus only on the day-to-day running of your business, especially in the early stages. But once you're up and running, it can pay dividends to think about longer-term and more strategic planning.
This is especially true as you take on more staff, create departments within the business, appoint managers or directors and become distanced from the everyday running of the business.
2 Retrieved from: http://ezinearticles.com/?Preparing-Financial-Projections-and-Pro-Forma-Statements&id=248204
52 | P a g e
Reviewing your progress will be particularly useful if you feel:
▪ uncertain about how well the business is performing
▪ unsure if you're getting the most out of the business or making the most of market opportunities
▪ your business plan may be out of date, e.g. you haven't updated it since you started trading
▪ your business is moving in a direction different to the one you had planned
▪ the business may be becoming unwieldy or unresponsive to market demands
Good decision making is an essential skill for career success generally, and effective leadership particularly. If you can learn to make timely and well-considered decisions, then you can often lead your team to spectacular and well-deserved success. However, if you make poor decisions, your team risks failure and your leadership will be in question or even jeopardised.
An organised and systematic decision-making process usually leads to better decisions. Without a well-defined process, you risk making decisions that are based on insufficient information and analysis. Many variables affect the final impact of your decision. However, if you establish strong foundations for decision making, generate good alternatives, evaluate these alternatives rigorously, and then check your decision-making process, you will improve the quality of your decisions.
“Why is it that some people recognise business opportunities where many others see only problems? Opportunities are everywhere, yet many people do not see them. Successful entrepreneurs, however, have the capacity to see what others do not”
Jeffry Timmons
Successful business unit managers, too, have the ability to look at the successes and failures of the past and see opportunities for growth and doing things better.
All of your estimates and projections must logically flow from previous years' financial statements, so that you have a benchmark or standard to evaluate future performance.
b. Identifying Opportunities for Growth
Once the analysis has been done, the analyst is in a position to identify where the organisation can change tactics and do things differently in order to create a better outcome of the ratio analysis and ensure growth.
Here are three easy ways to uncover potential opportunities3:
✓ Examine your current client base
The cost of securing a new client can be anywhere from five to 15 times that of securing a repeat client. Consequently, developing strategies that generate repeat business on a regular basis is essential to a business’s bottom line. It goes without saying that you need to provide quality service in the first place for your clients to come back. But after a transaction is completed between you and a client, do you have ways to stay in touch and stay top of mind? Do you provide reasons and incentives for repeat businesses? Can you up sell some of your past and current clients with a new service or product you have? Do they have family, friends, and associates you can offer
3Retrieved from: http://biznik.com/articles/how-to-identify-growth-opportunities
53 | P a g e
your services to? Assuming that you provided excellent work to your clients, they can be your biggest fans who will gladly promote and endorse you.
✓ Look at how you are currently receiving clients
A business’s client source is generally tied to its marketing effort. Besides identifying the appropriate marketing vehicles to reach your target clients, it is important to track the effectiveness of your tactics. Are your clients mostly through word of mouth referrals? Do they usually find you online? Are they typically attendees to speaking engagements you have throughout the year? Do your strategic alliances send the majority of your clients? Once you have identified the successful sources, explore creative ways to take those sources to the next level.
1. Identify complementary services/products that will open up a different market for you
c. Identify Types and Formats of Financial Forecasts (SO3 AC1)
The following guidelines for preparation of financial forecasts are excerpted from the American Institute of Certified Public Accountant's (AICPA) publication, Guide for Prospective Financial Information.
▪ Financial forecasts should be prepared in good faith. Good faith in this context includes making a diligent effort to develop appropriate assumptions and exercising care not to mislead a third-party reader. Good faith precludes preparing a financial forecast with either undue optimism or pessimism.
▪ Financial forecasts should be prepared with appropriate care by qualified personnel. Appropriate care means that diligence and proper attention should be exercised in the preparation of the financial forecasts.
▪ Financial forecasts should be prepared using appropriate accounting principles. The accounting treatment applied to events and transactions contemplated in financial forecasts should be the same as the accounting treatment expected to be applied in recording the events when or if they occur.
▪ The process used to develop financial forecasts should provide for seeking out the best information that is reasonably available at the time. The reliability of the basic data should be considered in the process of preparing the financial forecasts and the use of an appropriate level of detail is another key consideration.
▪ The information used in preparing financial forecasts should be consistent with the plans of the entity. Financial forecasts should be consistent with the expected economic effects of anticipated strategies, programs, and actions. An indication of the entity's plans can often be found in its budgets, goals, and policies.
▪ Key factors should be identified as a basis for the assumptions. Key factors are those significant matters upon which an entity's future results are expected to depend and are basic to the entity's operations.
▪ Assumptions used in preparing financial forecasts should be appropriate. Recognizing that assumptions are the essence of developing financial forecasts, the quality of the underlying assumptions largely determines the quality of financial forecasts. Assumptions should be reasonable and suitably supported.
▪ The process used to develop financial forecasts should provide the means to determine the relative effect of variations in the major underlying assumptions. Particular attention should be devoted to those assumptions (1) to which the attainment of forecasted results is particularly sensitive and (2) for which the probability of variation is high.
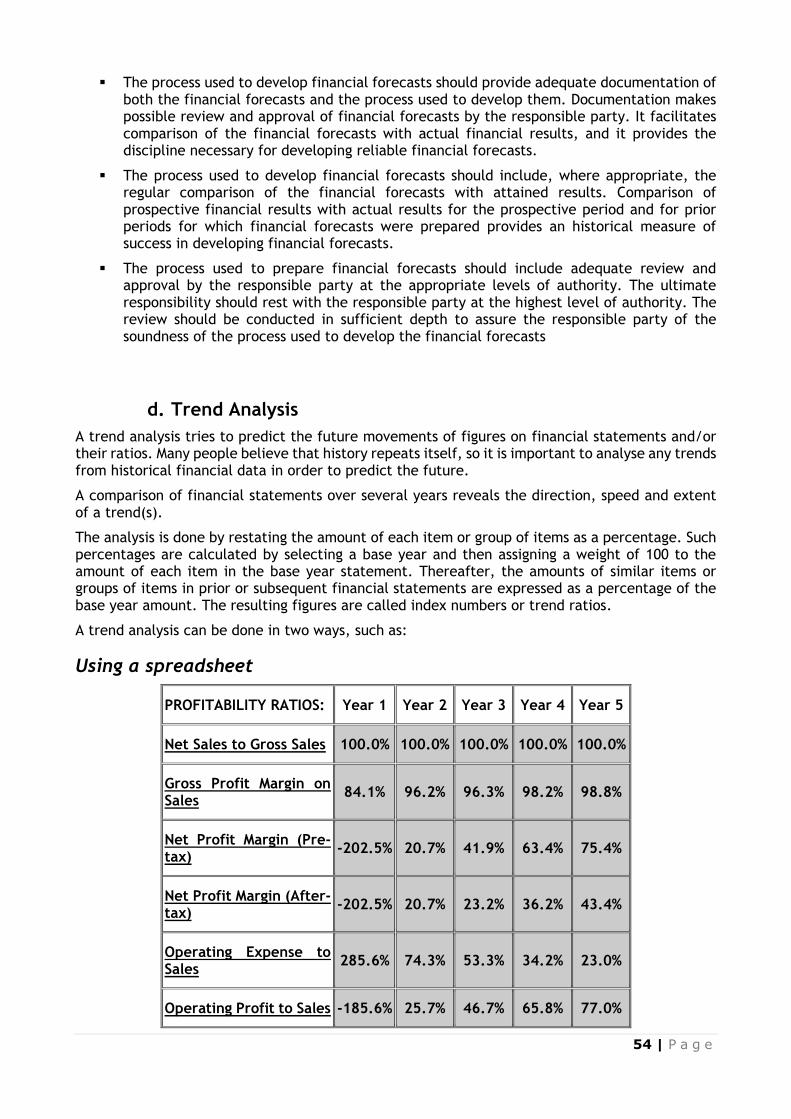
54 | P a g e
▪ The process used to develop financial forecasts should provide adequate documentation of both the financial forecasts and the process used to develop them. Documentation makes possible review and approval of financial forecasts by the responsible party. It facilitates comparison of the financial forecasts with actual financial results, and it provides the discipline necessary for developing reliable financial forecasts.
▪ The process used to develop financial forecasts should include, where appropriate, the regular comparison of the financial forecasts with attained results. Comparison of prospective financial results with actual results for the prospective period and for prior periods for which financial forecasts were prepared provides an historical measure of success in developing financial forecasts.
▪ The process used to prepare financial forecasts should include adequate review and approval by the responsible party at the appropriate levels of authority. The ultimate responsibility should rest with the responsible party at the highest level of authority. The review should be conducted in sufficient depth to assure the responsible party of the soundness of the process used to develop the financial forecasts
d. Trend Analysis
A trend analysis tries to predict the future movements of figures on financial statements and/or their ratios. Many people believe that history repeats itself, so it is important to analyse any trends from historical financial data in order to predict the future.
A comparison of financial statements over several years reveals the direction, speed and extent of a trend(s).
The analysis is done by restating the amount of each item or group of items as a percentage. Such percentages are calculated by selecting a base year and then assigning a weight of 100 to the amount of each item in the base year statement. Thereafter, the amounts of similar items or groups of items in prior or subsequent financial statements are expressed as a percentage of the base year amount. The resulting figures are called index numbers or trend ratios.
A trend analysis can be done in two ways, such as:
Using a spreadsheet
PROFITABILITY RATIOS: Year 1 Year 2 Year 3 Year 4 Year 5
Net Sales to Gross Sales 100.0% 100.0% 100.0% 100.0% 100.0%
Gross Profit Margin on Sales
84.1% 96.2% 96.3% 98.2% 98.8%
Net Profit Margin (Pre-tax)
-202.5% 20.7% 41.9% 63.4% 75.4%
Net Profit Margin (After-tax)
-202.5% 20.7% 23.2% 36.2% 43.4%
Operating Expense to Sales
285.6% 74.3% 53.3% 34.2% 23.0%
Operating Profit to Sales -185.6% 25.7% 46.7% 65.8% 77.0%
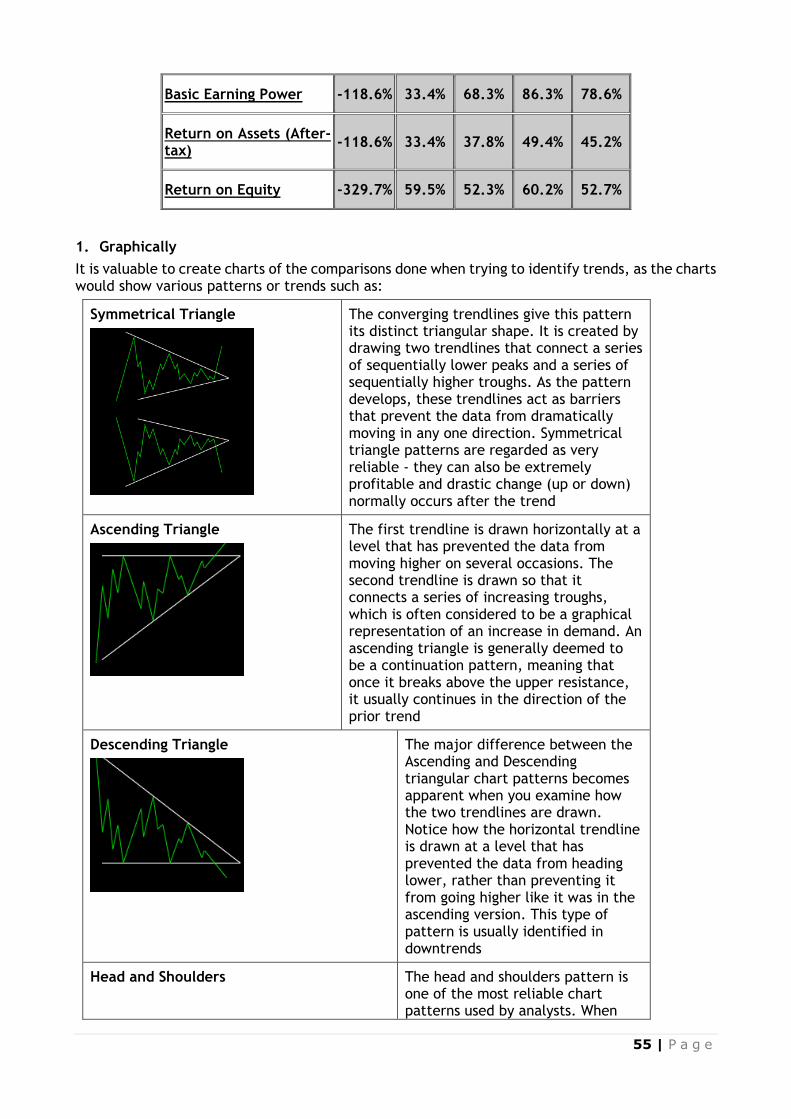
55 | P a g e
Basic Earning Power -118.6% 33.4% 68.3% 86.3% 78.6%
Return on Assets (After-tax)
-118.6% 33.4% 37.8% 49.4% 45.2%
Return on Equity -329.7% 59.5% 52.3% 60.2% 52.7%
1. Graphically
It is valuable to create charts of the comparisons done when trying to identify trends, as the charts would show various patterns or trends such as:
Symmetrical Triangle
The converging trendlines give this pattern its distinct triangular shape. It is created by drawing two trendlines that connect a series of sequentially lower peaks and a series of sequentially higher troughs. As the pattern develops, these trendlines act as barriers that prevent the data from dramatically moving in any one direction. Symmetrical triangle patterns are regarded as very reliable - they can also be extremely profitable and drastic change (up or down) normally occurs after the trend
Ascending Triangle
The first trendline is drawn horizontally at a level that has prevented the data from moving higher on several occasions. The second trendline is drawn so that it connects a series of increasing troughs, which is often considered to be a graphical representation of an increase in demand. An ascending triangle is generally deemed to be a continuation pattern, meaning that once it breaks above the upper resistance, it usually continues in the direction of the prior trend
Descending Triangle
The major difference between the Ascending and Descending triangular chart patterns becomes apparent when you examine how the two trendlines are drawn. Notice how the horizontal trendline is drawn at a level that has prevented the data from heading lower, rather than preventing it from going higher like it was in the ascending version. This type of pattern is usually identified in downtrends
Head and Shoulders The head and shoulders pattern is one of the most reliable chart patterns used by analysts. When
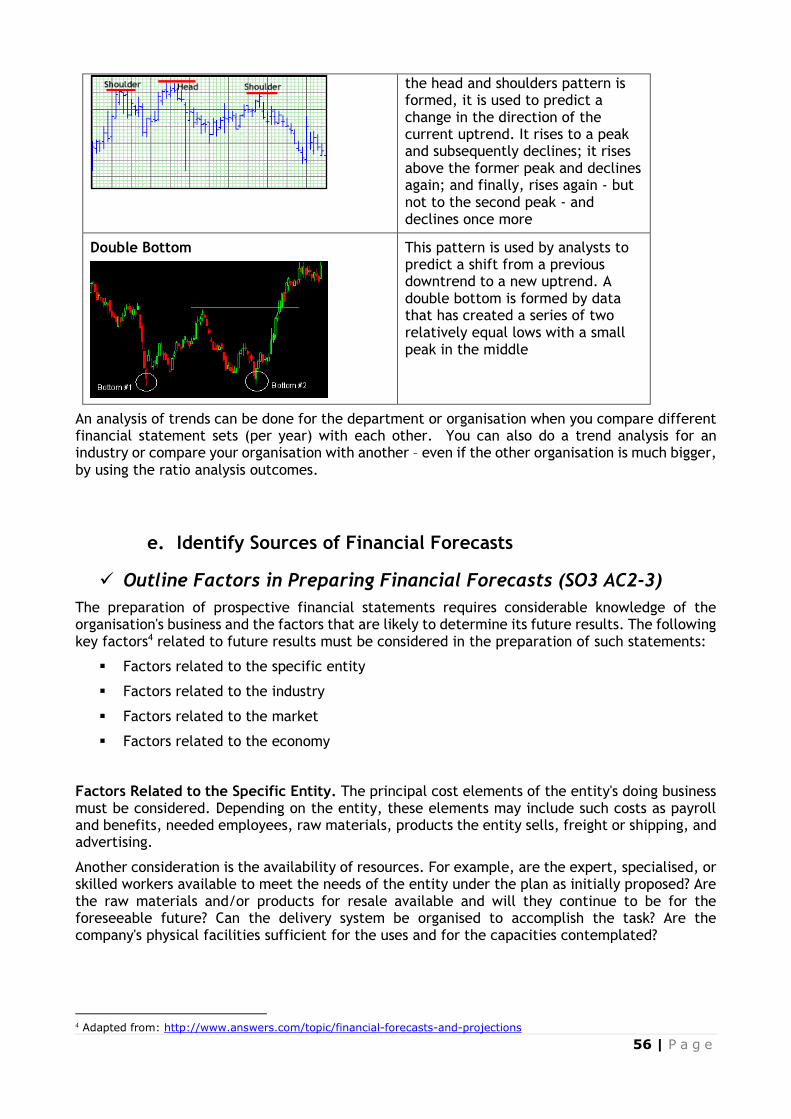
56 | P a g e
the head and shoulders pattern is formed, it is used to predict a change in the direction of the current uptrend. It rises to a peak and subsequently declines; it rises above the former peak and declines again; and finally, rises again - but not to the second peak - and declines once more
Double Bottom
This pattern is used by analysts to predict a shift from a previous downtrend to a new uptrend. A double bottom is formed by data that has created a series of two relatively equal lows with a small peak in the middle
An analysis of trends can be done for the department or organisation when you compare different financial statement sets (per year) with each other. You can also do a trend analysis for an industry or compare your organisation with another – even if the other organisation is much bigger, by using the ratio analysis outcomes.
e. Identify Sources of Financial Forecasts
✓ Outline Factors in Preparing Financial Forecasts (SO3 AC2-3)
The preparation of prospective financial statements requires considerable knowledge of the organisation's business and the factors that are likely to determine its future results. The following key factors4 related to future results must be considered in the preparation of such statements:
▪ Factors related to the specific entity
▪ Factors related to the industry
▪ Factors related to the market
▪ Factors related to the economy
Factors Related to the Specific Entity. The principal cost elements of the entity's doing business must be considered. Depending on the entity, these elements may include such costs as payroll and benefits, needed employees, raw materials, products the entity sells, freight or shipping, and advertising.
Another consideration is the availability of resources. For example, are the expert, specialised, or skilled workers available to meet the needs of the entity under the plan as initially proposed? Are the raw materials and/or products for resale available and will they continue to be for the foreseeable future? Can the delivery system be organised to accomplish the task? Are the company's physical facilities sufficient for the uses and for the capacities contemplated?
4 Adapted from: http://www.answers.com/topic/financial-forecasts-and-projections
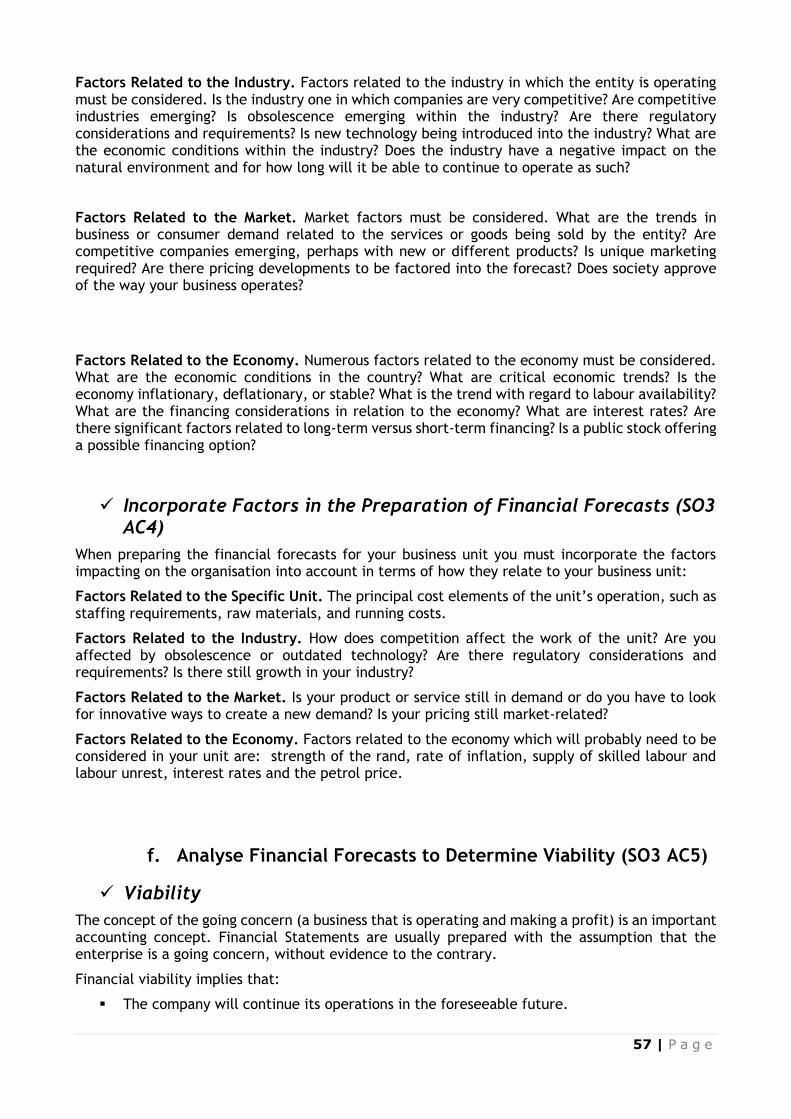
57 | P a g e
Factors Related to the Industry. Factors related to the industry in which the entity is operating must be considered. Is the industry one in which companies are very competitive? Are competitive industries emerging? Is obsolescence emerging within the industry? Are there regulatory considerations and requirements? Is new technology being introduced into the industry? What are the economic conditions within the industry? Does the industry have a negative impact on the natural environment and for how long will it be able to continue to operate as such?
Factors Related to the Market. Market factors must be considered. What are the trends in business or consumer demand related to the services or goods being sold by the entity? Are competitive companies emerging, perhaps with new or different products? Is unique marketing required? Are there pricing developments to be factored into the forecast? Does society approve of the way your business operates?
Factors Related to the Economy. Numerous factors related to the economy must be considered. What are the economic conditions in the country? What are critical economic trends? Is the economy inflationary, deflationary, or stable? What is the trend with regard to labour availability? What are the financing considerations in relation to the economy? What are interest rates? Are there significant factors related to long-term versus short-term financing? Is a public stock offering a possible financing option?
✓ Incorporate Factors in the Preparation of Financial Forecasts (SO3 AC4)
When preparing the financial forecasts for your business unit you must incorporate the factors impacting on the organisation into account in terms of how they relate to your business unit:
Factors Related to the Specific Unit. The principal cost elements of the unit’s operation, such as staffing requirements, raw materials, and running costs.
Factors Related to the Industry. How does competition affect the work of the unit? Are you affected by obsolescence or outdated technology? Are there regulatory considerations and requirements? Is there still growth in your industry?
Factors Related to the Market. Is your product or service still in demand or do you have to look for innovative ways to create a new demand? Is your pricing still market-related?
Factors Related to the Economy. Factors related to the economy which will probably need to be considered in your unit are: strength of the rand, rate of inflation, supply of skilled labour and labour unrest, interest rates and the petrol price.
f. Analyse Financial Forecasts to Determine Viability (SO3 AC5)
✓ Viability
The concept of the going concern (a business that is operating and making a profit) is an important accounting concept. Financial Statements are usually prepared with the assumption that the enterprise is a going concern, without evidence to the contrary.
Financial viability implies that:
▪ The company will continue its operations in the foreseeable future.
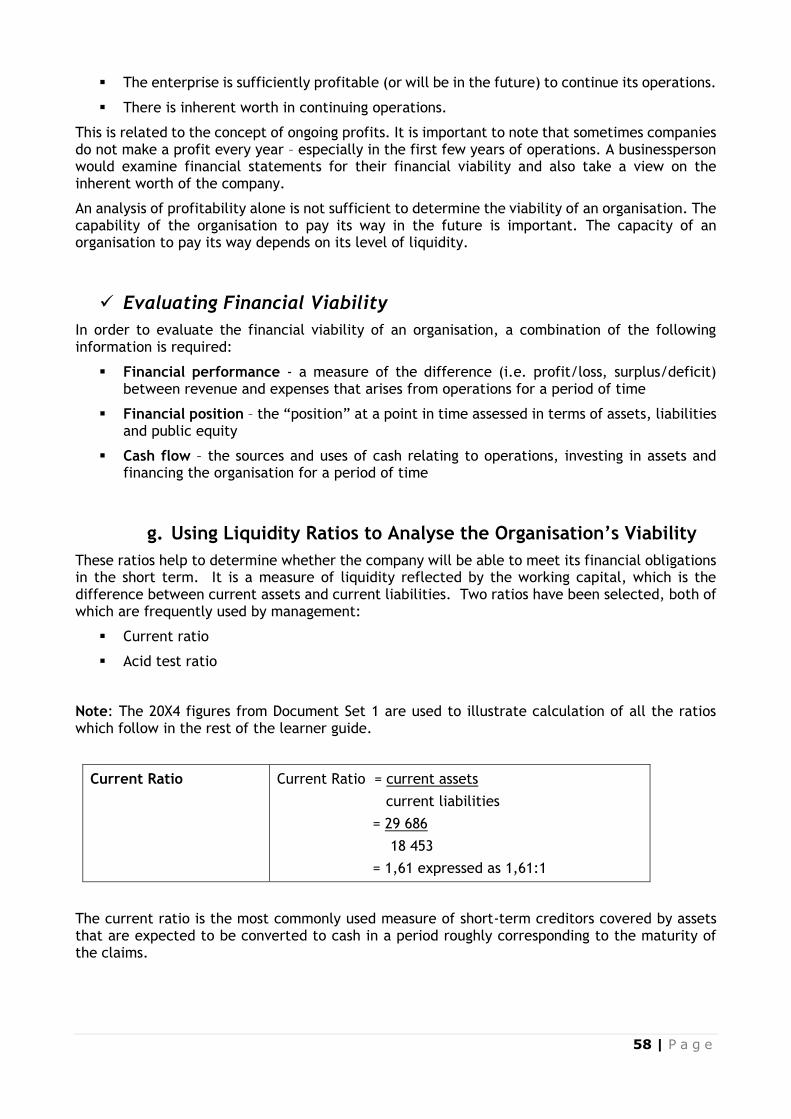
58 | P a g e
▪ The enterprise is sufficiently profitable (or will be in the future) to continue its operations.
▪ There is inherent worth in continuing operations.
This is related to the concept of ongoing profits. It is important to note that sometimes companies do not make a profit every year – especially in the first few years of operations. A businessperson would examine financial statements for their financial viability and also take a view on the inherent worth of the company.
An analysis of profitability alone is not sufficient to determine the viability of an organisation. The capability of the organisation to pay its way in the future is important. The capacity of an organisation to pay its way depends on its level of liquidity.
✓ Evaluating Financial Viability
In order to evaluate the financial viability of an organisation, a combination of the following information is required:
▪ Financial performance - a measure of the difference (i.e. profit/loss, surplus/deficit) between revenue and expenses that arises from operations for a period of time
▪ Financial position – the “position” at a point in time assessed in terms of assets, liabilities and public equity
▪ Cash flow – the sources and uses of cash relating to operations, investing in assets and financing the organisation for a period of time
g. Using Liquidity Ratios to Analyse the Organisation’s Viability
These ratios help to determine whether the company will be able to meet its financial obligations in the short term. It is a measure of liquidity reflected by the working capital, which is the difference between current assets and current liabilities. Two ratios have been selected, both of which are frequently used by management:
▪ Current ratio
▪ Acid test ratio
Note: The 20X4 figures from Document Set 1 are used to illustrate calculation of all the ratios which follow in the rest of the learner guide.
Current Ratio
Current Ratio = current assets
current liabilities
= 29 686
18 453
= 1,61 expressed as 1,61:1
The current ratio is the most commonly used measure of short-term creditors covered by assets that are expected to be converted to cash in a period roughly corresponding to the maturity of the claims.
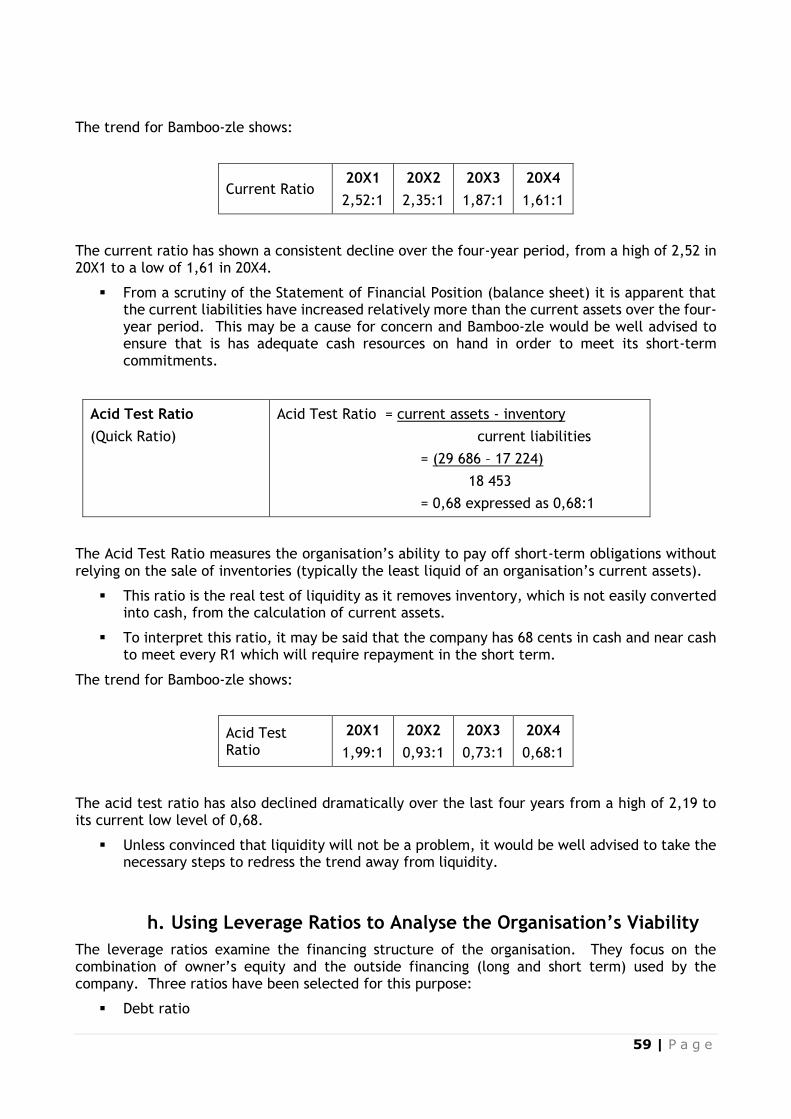
59 | P a g e
The trend for Bamboo-zle shows:
Current Ratio 20X1
2,52:1
20X2
2,35:1
20X3
1,87:1
20X4
1,61:1
The current ratio has shown a consistent decline over the four-year period, from a high of 2,52 in 20X1 to a low of 1,61 in 20X4.
▪ From a scrutiny of the Statement of Financial Position (balance sheet) it is apparent that the current liabilities have increased relatively more than the current assets over the four-year period. This may be a cause for concern and Bamboo-zle would be well advised to ensure that is has adequate cash resources on hand in order to meet its short-term commitments.
Acid Test Ratio
(Quick Ratio)
Acid Test Ratio = current assets - inventory
current liabilities
= (29 686 – 17 224)
18 453
= 0,68 expressed as 0,68:1
The Acid Test Ratio measures the organisation’s ability to pay off short-term obligations without relying on the sale of inventories (typically the least liquid of an organisation’s current assets).
▪ This ratio is the real test of liquidity as it removes inventory, which is not easily converted into cash, from the calculation of current assets.
▪ To interpret this ratio, it may be said that the company has 68 cents in cash and near cash to meet every R1 which will require repayment in the short term.
The trend for Bamboo-zle shows:
Acid Test Ratio
20X1
1,99:1
20X2
0,93:1
20X3
0,73:1
20X4
0,68:1
The acid test ratio has also declined dramatically over the last four years from a high of 2,19 to its current low level of 0,68.
▪ Unless convinced that liquidity will not be a problem, it would be well advised to take the necessary steps to redress the trend away from liquidity.
h. Using Leverage Ratios to Analyse the Organisation’s Viability
The leverage ratios examine the financing structure of the organisation. They focus on the combination of owner’s equity and the outside financing (long and short term) used by the company. Three ratios have been selected for this purpose:
▪ Debt ratio
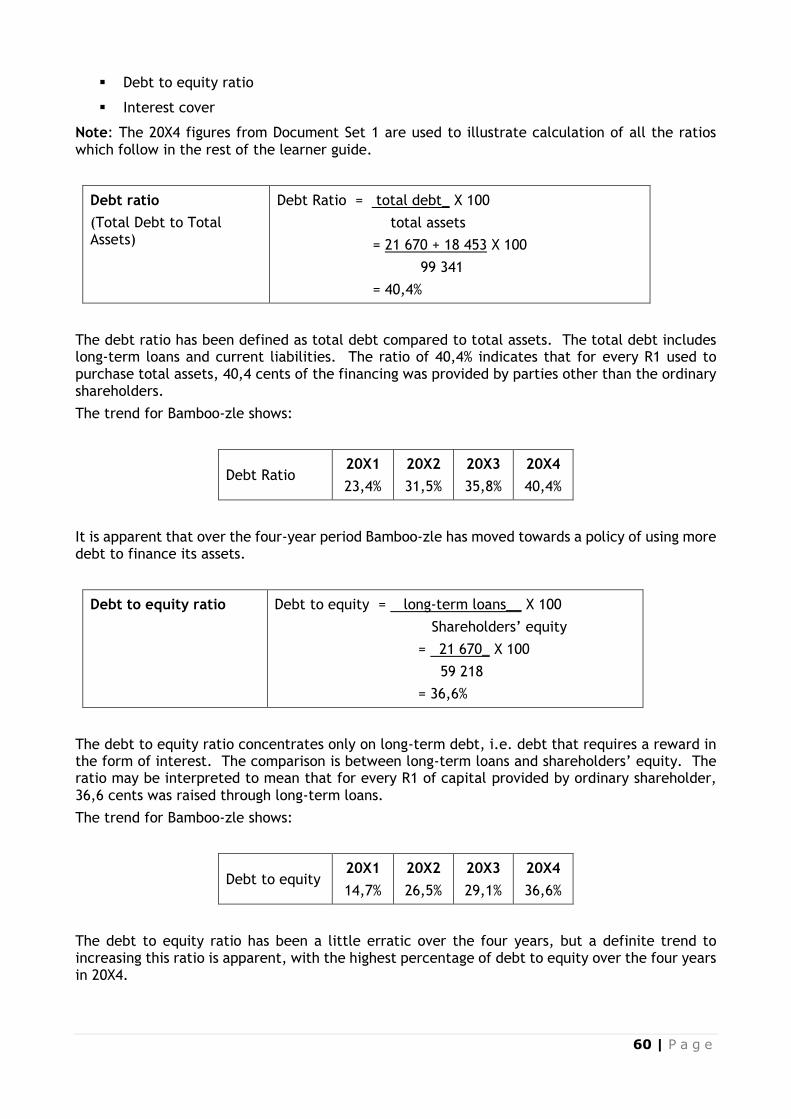
60 | P a g e
▪ Debt to equity ratio
▪ Interest cover
Note: The 20X4 figures from Document Set 1 are used to illustrate calculation of all the ratios which follow in the rest of the learner guide.
Debt ratio
(Total Debt to Total Assets)
Debt Ratio = total debt_ X 100
total assets
= 21 670 + 18 453 X 100
99 341
= 40,4%
The debt ratio has been defined as total debt compared to total assets. The total debt includes long-term loans and current liabilities. The ratio of 40,4% indicates that for every R1 used to purchase total assets, 40,4 cents of the financing was provided by parties other than the ordinary shareholders.
The trend for Bamboo-zle shows:
Debt Ratio 20X1
23,4%
20X2
31,5%
20X3
35,8%
20X4
40,4%
It is apparent that over the four-year period Bamboo-zle has moved towards a policy of using more debt to finance its assets.
Debt to equity ratio
Debt to equity = long-term loans__ X 100
Shareholders’ equity
= 21 670_ X 100
59 218
= 36,6%
The debt to equity ratio concentrates only on long-term debt, i.e. debt that requires a reward in the form of interest. The comparison is between long-term loans and shareholders’ equity. The ratio may be interpreted to mean that for every R1 of capital provided by ordinary shareholder, 36,6 cents was raised through long-term loans.
The trend for Bamboo-zle shows:
Debt to equity 20X1
14,7%
20X2
26,5%
20X3
29,1%
20X4
36,6%
The debt to equity ratio has been a little erratic over the four years, but a definite trend to increasing this ratio is apparent, with the highest percentage of debt to equity over the four years in 20X4.
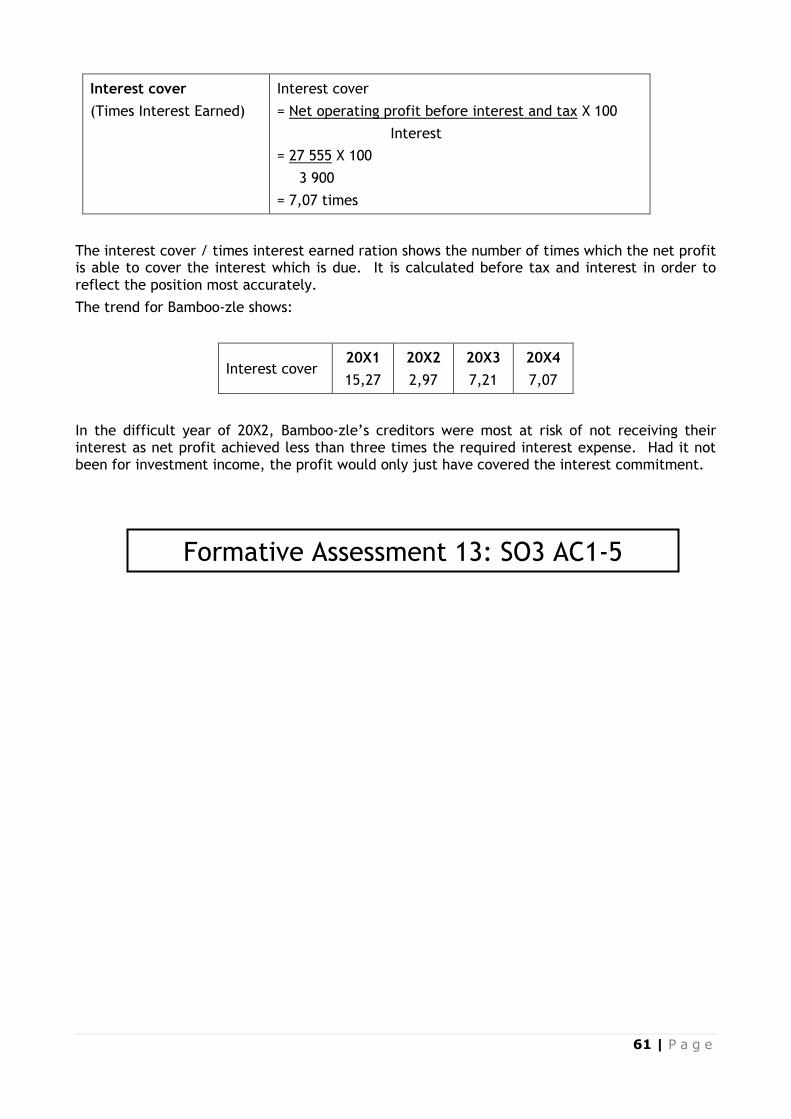
61 | P a g e
Interest cover
(Times Interest Earned)
Interest cover
= Net operating profit before interest and tax X 100
Interest
= 27 555 X 100
3 900
= 7,07 times
The interest cover / times interest earned ration shows the number of times which the net profit is able to cover the interest which is due. It is calculated before tax and interest in order to reflect the position most accurately.
The trend for Bamboo-zle shows:
Interest cover 20X1
15,27
20X2
2,97
20X3
7,21
20X4
7,07
In the difficult year of 20X2, Bamboo-zle’s creditors were most at risk of not receiving their interest as net profit achieved less than three times the required interest expense. Had it not been for investment income, the profit would only just have covered the interest commitment.
Formative Assessment 13: SO3 AC1-5
62 | P a g e
SECTION 4: DRAFT BUDGETS ACCORDING TO THE OPERATIONAL PLAN
Specific Outcome 4
Draft budgets according to the operational plan of the unit.
Assessment Criteria
1. Budget plans are linked to operational objectives.
2. Operational objectives are established in line with the unit's strategic plan.
3. The budget is formulated according to standard operating procedures.
4. Drafted budget is reviewed, reflected on and modified to ensure alignment to the operational plan of the unit.
4.1 Drafting Budgets according to the Operational Plan Budgeting is the process of planning financial activities for an upcoming accounting period, usually a year. It requires analysing how a business is currently performing and setting objectives for improving its future financial health. Specific revenue and expense expectations are identified with the intention of increasing a business’s profits while keeping expenses in check.
a. Link Budget Plans to Operational Objectives (SO4 AC1)
In some organisations the preference is for ‘top-down’ budgeting: Budgets are imposed by top managers with little or no consultation with lower-level managers.
Most companies, however, prefer the process of “bottom-up” budgeting: Budgets are prepared by those who must implement them. The budgets are then sent for approval to higher level managers.
In order to strengthen a business’s financial health, budgeting is necessary. Since the financial activities of a business can become quite complex, a budget is needed to outline a plan that managers and employees can follow. Budgeting provides the structure that is required in order to implement effective pricing and spending efforts.
Budgeting offers five main benefits:
1. Budgeting facilitates planning - Planning is the main key to budgeting. A business that plans its future financial activities is one that will have a vision for success. Budget planning requires a business to articulate its vision for the future and how it will accomplish it. Strategies are developed and deadlines are identified to accomplish the established budget.
The planning aspect of budgeting also helps a business establish benchmarks that it can use to measure its progress toward achieving its financial objectives.
2. Budgeting enhances communication - Budgets communicate the spending and sales expectations of the managers and employees within an organisation. Communication is enhanced when the individuals responsible for enforcing and meeting financial expectations can find these guidelines in a budget. Managers and employees know what their boundaries are for the upcoming accounting period and can adjust their spending and sales activities accordingly.
63 | P a g e
3. Budgeting reinforces accountability - Since budgets are communicated to those individuals responsible for implementing them, accountability is reinforced. The responsible managers and employees can be consulted if any deviations from the budget occur. Budgets enable accountable individuals to make wise financial decisions by giving them the information they need.
4. Budgeting identifies problems - Budget planning requires a business to identify any financial problems that are developing. Since a budgeted financial statement is broken into months or quarters, deviations from the budget can alert members of management to potential problems. Assigning specific numbers to financial expectations helps draw attention to situations the business needs to investigate.
5. Budgeting motivates employees - The clear guidelines that are outlined in a budget provide a method by which managers and employees can be rewarded for their efforts. It is easy to evaluate managers’ and employees’ performance by identifying whether the financial objectives articulated in the budget are met. The compensation that individuals will receive if they meet the financial expectations in the budget will motivate them to adhere to it.
In general, there are three different types of budgets:
1. Operating Budget: This is often referred to as the annual budget and shows how much money will be needed over a longer period, such as a year or for the duration of a specific project of programme. Budget amounts are usually divided into major categories, such as salaries, benefits, equipment, office supplies, training, research and development, etc. These major categories can be divided into smaller specific items if needed. The more detailed the categories, the more accurate the budget.
2. Cash Budget: shows the amount of cash you expect to receive and pay in the near term, such as a month.
3. Capital Budget: shows how much money you have to spend if you want to buy, operate and maintain major pieces of equipment, such as buildings, cars, computers, furniture, etc.
When you are required to create a budget, it is imperative that you understand exactly what you are budgeting for. You need to understand what the company’s vision, strategy and goals are; what the activities are that you need to budget for; and what the overall expectations of the budget is.
b. Establish Operational Objectives (SO4 AC2)
✓ Setting Budget Objectives
Objectives provide the direction you need when establishing a budget. The guidance objectives provide will ensure that your budgeting decisions relate back to promoting the overall financial health of your business. Without objectives, you risk making budgeting decisions that are misguided or simply not as effective as they could be.
In order to set effective objectives, you can follow four steps:
1. Use the data from the previous accounting periods - Since the first step of creating a budget is to analyse financial statements from previous accounting periods, you have already identified the strengths and weaknesses of your business’s financial operations. Use the figures provided from the ratio analysis to determine which financial activities are in need of improvement and which ones are healthy.
2. Address strengths and weaknesses - Once you have determined which financial activities are inadequate, create objectives that address these weaknesses. Since you also identified which
64 | P a g e
financial activities are strong, you can use this information to direct your efforts toward the areas that truly need attention.
For example, if your days sales outstanding is poor, you might decide to set a somewhat ambitious objective that decreases the amount of time it takes after making a sale to collect money from a customer. Conversely, if your debt-to-total-assets ratio is strong, you could set an objective that was less ambitious for decreasing the amount of debt your business owes.
3. Assess resources required - It is important that you examine your objectives to determine if you have the resources necessary to achieve them. If the resources are unavailable, it will be impossible to meet your objectives.
For example, imagine that one of your objectives for the upcoming accounting period is to improve your total assets turnover ratio by increasing the number of sales your company makes. You would have to determine whether or not you have the manpower available to accomplish this objective. Specifically, you would have to decide if you have enough sales people to handle the increase in projected sales.
4. Make adjustments to objectives - If you discover that you do not have sufficient resources to meet your objectives, you must adjust your objectives appropriately. Slight modifications might be all that are necessary to make your objectives achievable. However, a more creative strategy might be required to adjust your objectives.
For example, imagine that you do not have enough sales people to generate an increase in sales by a certain percentage. You’ll have to adjust your objective to reflect a lower, more reasonable figure and look for another financial activity that could be used to accommodate this adjustment, such as increasing your sales price or lowering sales commissions.
Any objective you set for your budget should possess these characteristics:
▪ Specific. A budget must be as specific as possible in order for any person who refers to the budget to be able to fully understand what needs to be accomplished.
▪ Measurable. In order to assess the budget’s progress, you should develop measurable objectives. For example, if you wanted to cut the cost of office electricity expenditure then a specific percentage should be chosen.
▪ Achievable. It is important to set challenging budgets, but they must be attainable. A budget that sets out unachievable goals will cause frustration and lead to the process losing its impact.
▪ Relevant. Budgets must be relevant to the overall objective of the organisation. If budgets serve no purpose, it is a waste of time and money to create them. Budgets should relate to the financial health of the organisation.
▪ Time-based. Establishing a timeline for goals involves identifying deadlines and milestones. Using milestones allows the team to track its progress and helps break the goal into manageable segments.
✓ Guidelines for Avoiding Budget Traps
▪ Losing sight of your objectives - Sometimes the process of budgeting becomes overwhelming resulting in the focus becoming more on the process of budgeting than the objectives of the budget. It is therefore important that you focus every decision toward the achievement of your objectives.
▪ Failing to keep objectives realistic - Often people overstate income and or expense projections and then become disappointed when the numbers on the budget do not match actual performance. Therefore, it is crucial that you compare all objectives for the upcoming accounting period with actual performances from previous periods. Also, carefully examine all assumptions made about the organisation and the economic environment for the upcoming accounting period.
65 | P a g e
▪ Using an incorrect approach - Historical-base budgeting is the process of basing your objectives for the upcoming accounting period on the previous period’s actual performance. Some persons automatically use the previous accounting period’s performance as the budgeted amount for the upcoming period, adding an inflationary increase.
The problem with this budgeting approach is that consideration is often not given to whether the previous accounting period’s performance was good or poor. If the financial activities from the previous accounting period were inadequate, using these figures as a guideline for the upcoming accounting period will simply prolong poor performance.
▪ Accepting arbitrary changes - Objectives are set for a reason: to guide the financial activities for an upcoming accounting period. Therefore, any deviations from the plan for achieving a budget objective should be investigated and, if found to be inappropriate, stopped.
▪ Believing that sales have to increase - It is often believed that sales have to increase with each new accounting period. In fact, some individuals think that if sales do not significantly increase each accounting period, the company’s efforts have been a failure. However, this is not always true.
▪ Inflexible budgets - Another difficulty with budgets is that they are often inflexible. Sometimes situations change beyond the control of those responsible for the budget. For example, an operating budget based on annual sales of R10 000 000 may be completely unrealistic if sales are reforecast to R15 000 000 by the time half the accounting period has passed. Since the cost of operations generally increases when more items are produced to meet increased demand, it would be unreasonable to expect those responsible for the operating budgets to keep to the original budget.
To overcome this potential problem, organisations use variable budgeting. Variable budgets show how each item should vary as the level of activity or output varies.
c. Formulate the Budget (SO4 AC3)
Budgeting allows a company to be cost effective by carefully monitoring operating expenses. Weekly, monthly, or quarterly monitoring of budget projections through performance reports allows a company to take corrective measures on short notice where and when necessary.
When we are compiling a budget, we would have to analyse the items in the budget from previous years or even the items in other business units, such as:
Costs Explanation
Fixed These are costs which do not change i.e. they are fixed, irrespective of how much we produce or sell. An example of a fixed cost would be that of the rental which we are paying for our premises
Variable These are costs which vary as production varies i.e. the more we produce, the more our variable costs will increase. An example of variable costs would be electricity i.e. the more we produce, the more electricity we will use up in the form of lighting etc. This is only one example of a variable cost. There are many others: advertising, wages, postage etc.
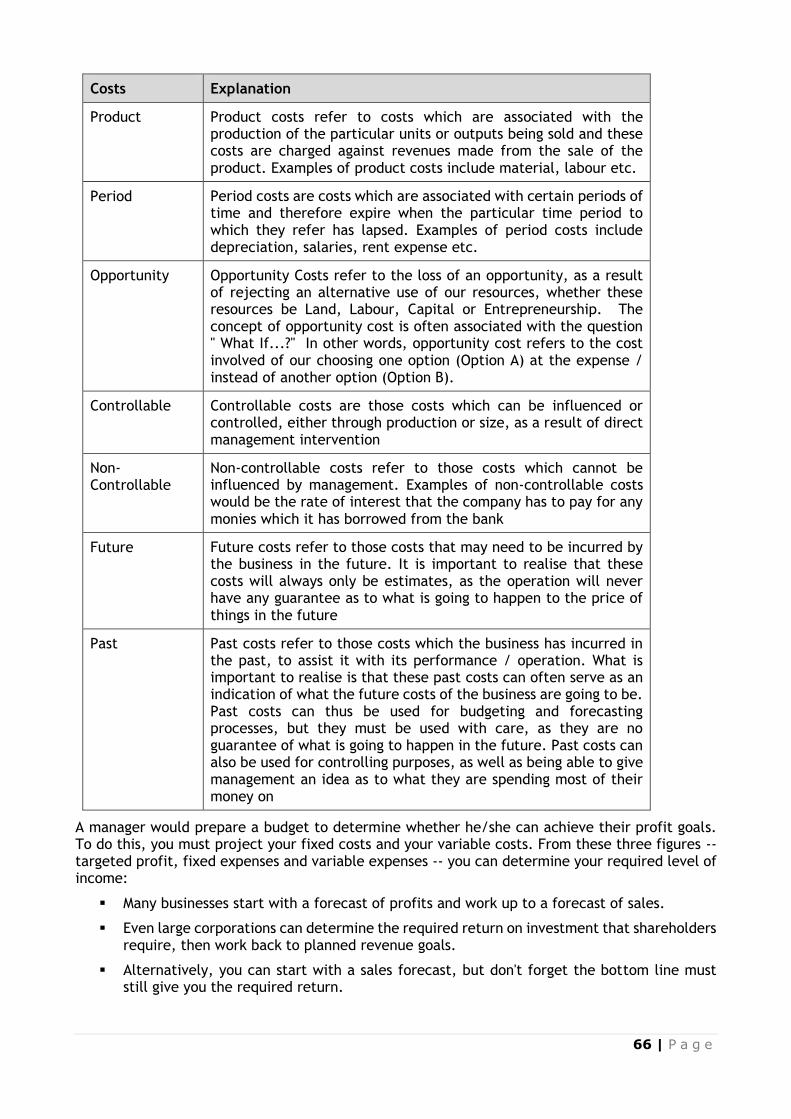
66 | P a g e
Costs Explanation
Product Product costs refer to costs which are associated with the production of the particular units or outputs being sold and these costs are charged against revenues made from the sale of the product. Examples of product costs include material, labour etc.
Period Period costs are costs which are associated with certain periods of time and therefore expire when the particular time period to which they refer has lapsed. Examples of period costs include depreciation, salaries, rent expense etc.
Opportunity Opportunity Costs refer to the loss of an opportunity, as a result of rejecting an alternative use of our resources, whether these resources be Land, Labour, Capital or Entrepreneurship. The concept of opportunity cost is often associated with the question " What If...?" In other words, opportunity cost refers to the cost involved of our choosing one option (Option A) at the expense / instead of another option (Option B).
Controllable Controllable costs are those costs which can be influenced or controlled, either through production or size, as a result of direct management intervention
Non-Controllable
Non-controllable costs refer to those costs which cannot be influenced by management. Examples of non-controllable costs would be the rate of interest that the company has to pay for any monies which it has borrowed from the bank
Future Future costs refer to those costs that may need to be incurred by the business in the future. It is important to realise that these costs will always only be estimates, as the operation will never have any guarantee as to what is going to happen to the price of things in the future
Past Past costs refer to those costs which the business has incurred in the past, to assist it with its performance / operation. What is important to realise is that these past costs can often serve as an indication of what the future costs of the business are going to be. Past costs can thus be used for budgeting and forecasting processes, but they must be used with care, as they are no guarantee of what is going to happen in the future. Past costs can also be used for controlling purposes, as well as being able to give management an idea as to what they are spending most of their money on
A manager would prepare a budget to determine whether he/she can achieve their profit goals. To do this, you must project your fixed costs and your variable costs. From these three figures -- targeted profit, fixed expenses and variable expenses -- you can determine your required level of income:
▪ Many businesses start with a forecast of profits and work up to a forecast of sales.
▪ Even large corporations can determine the required return on investment that shareholders require, then work back to planned revenue goals.
▪ Alternatively, you can start with a sales forecast, but don't forget the bottom line must still give you the required return.
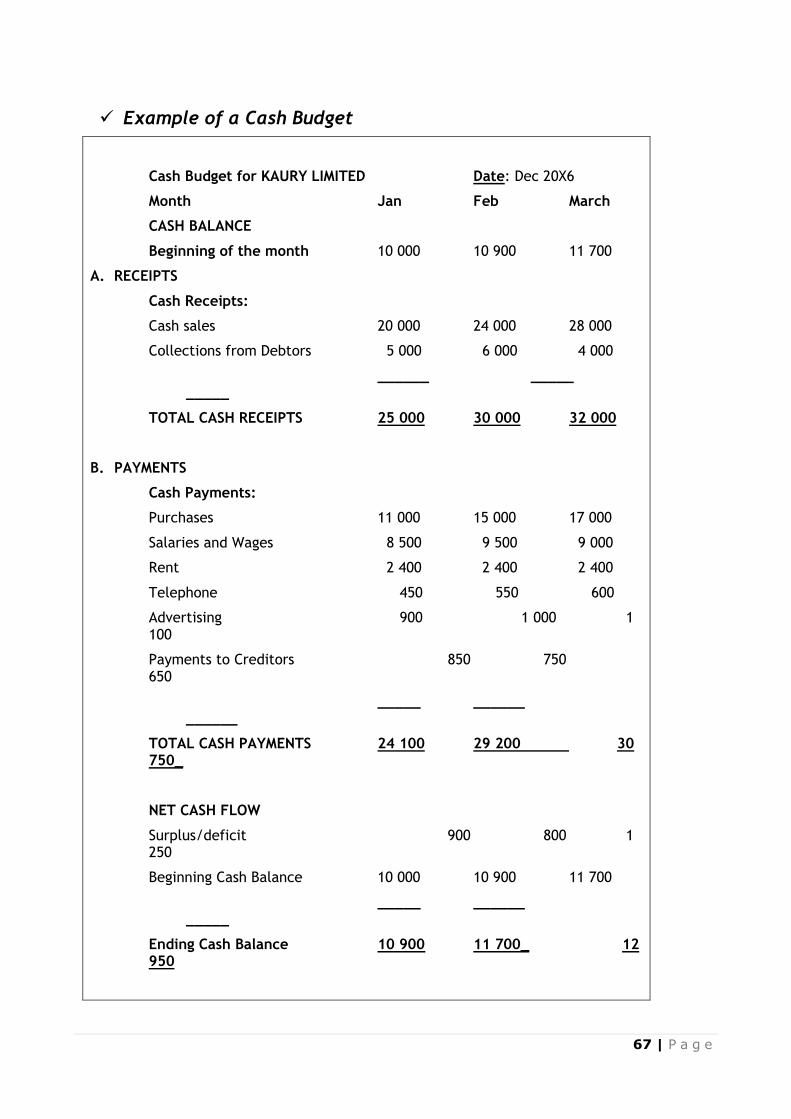
67 | P a g e
✓ Example of a Cash Budget
Cash Budget for KAURY LIMITED Date: Dec 20X6
Month Jan Feb March
CASH BALANCE
Beginning of the month 10 000 10 900 11 700
A. RECEIPTS
Cash Receipts:
Cash sales 20 000 24 000 28 000
Collections from Debtors 5 000 6 000 4 000
______ _____ _____
TOTAL CASH RECEIPTS 25 000 30 000 32 000
B. PAYMENTS
Cash Payments:
Purchases 11 000 15 000 17 000
Salaries and Wages 8 500 9 500 9 000
Rent 2 400 2 400 2 400
Telephone 450 550 600
Advertising 900 1 000 1 100
Payments to Creditors 850 750 650
_____ ______ ______
TOTAL CASH PAYMENTS 24 100 29 200 30 750_
NET CASH FLOW
Surplus/deficit 900 800 1 250
Beginning Cash Balance 10 000 10 900 11 700
_____ ______ _____
Ending Cash Balance 10 900 11 700_ 12 950
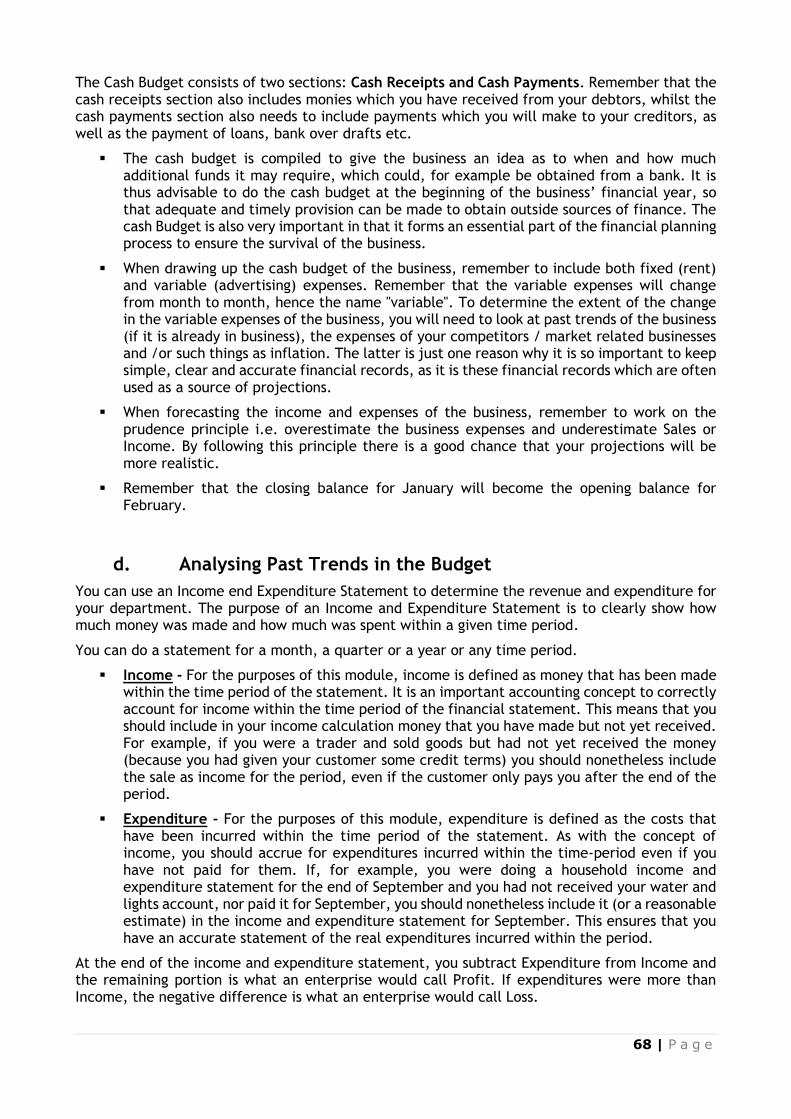
68 | P a g e
The Cash Budget consists of two sections: Cash Receipts and Cash Payments. Remember that the cash receipts section also includes monies which you have received from your debtors, whilst the cash payments section also needs to include payments which you will make to your creditors, as well as the payment of loans, bank over drafts etc.
▪ The cash budget is compiled to give the business an idea as to when and how much additional funds it may require, which could, for example be obtained from a bank. It is thus advisable to do the cash budget at the beginning of the business’ financial year, so that adequate and timely provision can be made to obtain outside sources of finance. The cash Budget is also very important in that it forms an essential part of the financial planning process to ensure the survival of the business.
▪ When drawing up the cash budget of the business, remember to include both fixed (rent) and variable (advertising) expenses. Remember that the variable expenses will change from month to month, hence the name "variable". To determine the extent of the change in the variable expenses of the business, you will need to look at past trends of the business (if it is already in business), the expenses of your competitors / market related businesses and /or such things as inflation. The latter is just one reason why it is so important to keep simple, clear and accurate financial records, as it is these financial records which are often used as a source of projections.
▪ When forecasting the income and expenses of the business, remember to work on the prudence principle i.e. overestimate the business expenses and underestimate Sales or Income. By following this principle there is a good chance that your projections will be more realistic.
▪ Remember that the closing balance for January will become the opening balance for February.
d. Analysing Past Trends in the Budget
You can use an Income end Expenditure Statement to determine the revenue and expenditure for your department. The purpose of an Income and Expenditure Statement is to clearly show how much money was made and how much was spent within a given time period.
You can do a statement for a month, a quarter or a year or any time period.
▪ Income - For the purposes of this module, income is defined as money that has been made within the time period of the statement. It is an important accounting concept to correctly account for income within the time period of the financial statement. This means that you should include in your income calculation money that you have made but not yet received. For example, if you were a trader and sold goods but had not yet received the money (because you had given your customer some credit terms) you should nonetheless include the sale as income for the period, even if the customer only pays you after the end of the period.
▪ Expenditure - For the purposes of this module, expenditure is defined as the costs that have been incurred within the time period of the statement. As with the concept of income, you should accrue for expenditures incurred within the time-period even if you have not paid for them. If, for example, you were doing a household income and expenditure statement for the end of September and you had not received your water and lights account, nor paid it for September, you should nonetheless include it (or a reasonable estimate) in the income and expenditure statement for September. This ensures that you have an accurate statement of the real expenditures incurred within the period.
At the end of the income and expenditure statement, you subtract Expenditure from Income and the remaining portion is what an enterprise would call Profit. If expenditures were more than Income, the negative difference is what an enterprise would call Loss.
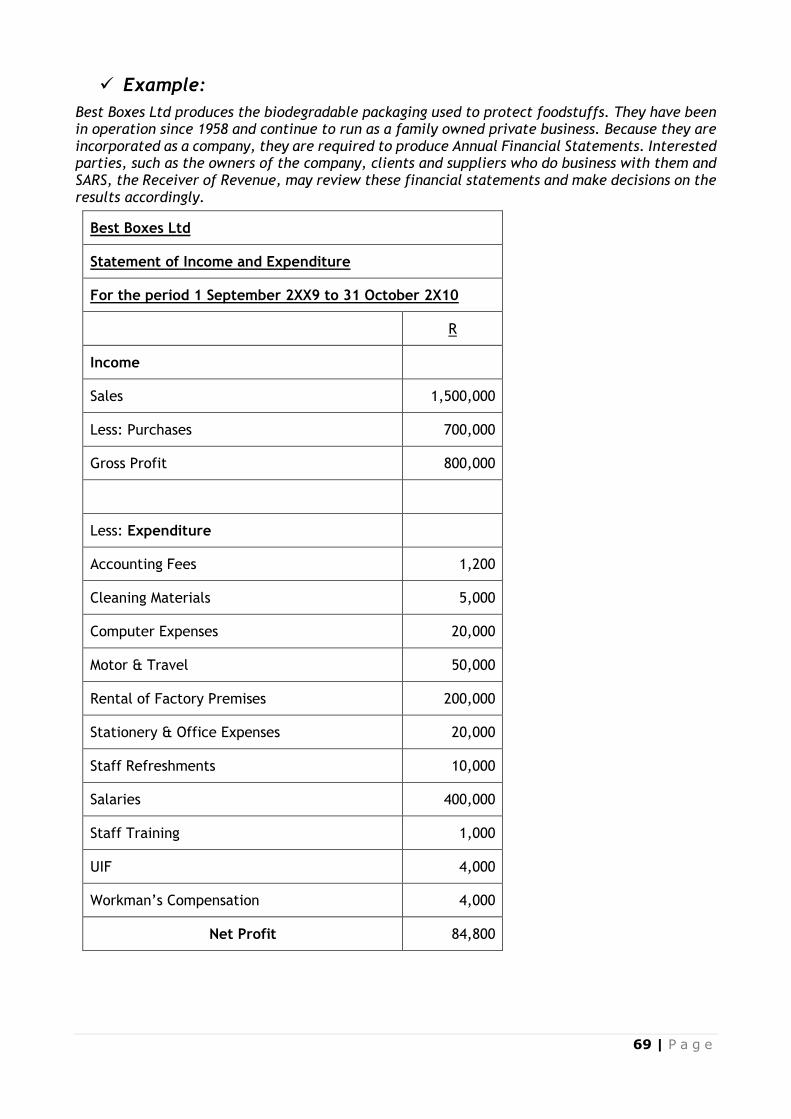
69 | P a g e
✓ Example:
Best Boxes Ltd produces the biodegradable packaging used to protect foodstuffs. They have been in operation since 1958 and continue to run as a family owned private business. Because they are incorporated as a company, they are required to produce Annual Financial Statements. Interested parties, such as the owners of the company, clients and suppliers who do business with them and SARS, the Receiver of Revenue, may review these financial statements and make decisions on the results accordingly.
Best Boxes Ltd
Statement of Income and Expenditure
For the period 1 September 2XX9 to 31 October 2X10
R
Income
Sales 1,500,000
Less: Purchases 700,000
Gross Profit 800,000
Less: Expenditure
Accounting Fees 1,200
Cleaning Materials 5,000
Computer Expenses 20,000
Motor & Travel 50,000
Rental of Factory Premises 200,000
Stationery & Office Expenses 20,000
Staff Refreshments 10,000
Salaries 400,000
Staff Training 1,000
UIF 4,000
Workman’s Compensation 4,000
Net Profit 84,800
70 | P a g e
✓ Sources of Income and Expenditure
Income and expenditure sources are as varied as the types of industries and businesses in operation. People too, derive their income and spend their money in all possible ways. The ways of income are many and varied: it is your task to identify these in the financial statements and be able to recognise the income from the costs.
The items that make up the gross revenue (income) in your specific business unit would include:
▪ Sales
▪ Interest earned
▪ Donations
▪ Grants
▪ Fees received, etc.
The items that make up the gross expenditure (expenses) in your specific business unit would include:
▪ Fixed Expenses - Regardless of sales, fixed expenses generally stay the same. Several examples of fixed expenses are insurance, rent, taxes on property, wages paid to salaried employees, depreciation of equipment, interest on borrowed money, building maintenance costs, office salaries and office expenses
▪ Variable Expenses - This type of expense varies with sales. In a product business, the cost of materials or goods for resale are the largest variable expenses. In some service businesses, the cost of labour is the biggest factor. Sales commissions, direct wages, payroll taxes, insurance, advertising and delivery expense are other examples of variable expenses
▪ Expenditure also includes, but is not limited to payments, commissions payable, claims, management expenses and remuneration
e. Review and Modify the Drafted Budget (SO4 AC4)
Once complete, the drafted budget is reviewed, reflected on and modified to ensure alignment to the operational plan of the unit.
The frequency with which a manager monitors the budget and checks for variances will differ: a sales person or production supervisor usually checks his/her performance daily, while the production or sales manager might check weekly.
Determine what caused the variance:
o Have we lost orders?
o Have we spent too much on raw materials?
o Have we used more materials than we thought we would?
o Have we spent too little or too much on promotion?
Variance analysis entails measuring actual performance against the standards and the coordinated plan. A variance is the difference between budgeted and actual performance. A deviation from the standard could be favourable or unfavourable, i.e. positive or negative.
React and report to everyone else who needs to know. If someone else has a variance, you need to ask yourself what it means to your bit of the business. What corrective action do you need to take?
71 | P a g e
A production variance occurs when a machine fails. If this is likely to cause a prolonged problem, Production should let Marketing know, as Marketing might commit the business to orders which cannot be filled, or spend money advertising products which cannot be delivered.
A budget is not cast in stone. The manager needs to take appropriate action to either get the original budget back on track, or revise the original budget commitment to take new facts into account, depending on how significant the variance is.
Questions the manager would ask, are:
o Should we reduce costs?
o Should we increase promotional expenditure to continue to maintain sales?
o Should we increase production to meet higher than expected sales figures?
o Should Marketing cut back because Production can’t keep up?
o Should the whole budget be revised to meet the new position?
Formative Assessment 4: SO4 AC1-4
72 | P a g e
SECTION 5: SUPERVISE FINANCIAL MANAGEMENT OF A UNIT
Specific Outcome 5
Supervise financial management of a unit against given requirements.
Assessment Criteria
1. Monitoring systems are agreed and adhered to, according to standard operating procedures.
2. Expenditure reports are monitored for the year for each team within the unit against given criteria.
3. Corrective actions are implemented where necessary in accordance with the entity's policies and procedures.
5.1 Supervising Financial Management of a Unit
If it can't be measured, it can't be managed
What gets measured gets watched
What gets watched gets done
Unknown author
Financial management consists of planning for the future of a business enterprise to ensure a positive cash flow. It includes the administration and maintenance of financial assets, as well as the process of identifying and managing risks.
The primary concern of financial management is the assessment rather than the techniques of financial quantification. A financial manager looks at the available data to judge the performance of the enterprise.
Some experts refer to financial management as the science of money management.
At the corporate level, the main aim of the process of managing finances is to achieve the various goals a company sets at a given point of time.
Businesses also seek to generate substantial amounts of profits, following a particular set of financial processes.
Financial managers aim to boost the levels of resources at their disposal. Besides, they control the functioning on money put in by external investors. Providing investors with sufficient amount of returns on their investments is one of the goals that every company tries to achieve. Efficient financial management ensures that this becomes possible.
From the business unit’s point of view, the manager’s role in its financial management is associated with financial planning and financial control.
Financial planning seeks to quantify various financial resources available and plan the size and timing of expenditures.
73 | P a g e
Financial control refers to monitoring cash flow. Inflow is the amount of money coming into the unit, while outflow is a record of the expenditure being made by the unit. Managing this movement of funds in relation to the budget is essential for the unit’s successful financial management.
A business unit manager must be able to:
▪ Interpret financial reports including Statement of Comprehensive Income (income statement)s, Profit and Loss statements, Statement of Cash Flows and Statement of Financial Position (balance sheet) statements
▪ Improve the allocation of working capital within business operations
▪ Review and fine tune financial budgeting, and revenue and cost forecasting
▪ Look at the funding options for business expansion, including both long- and short term financing
▪ Review the financial health of the company or business unit using ratio analyses
▪ Apply critical financial decision-making techniques to assess whether to proceed with a project
✓ Financial Performance Measurement Techniques (EEK5)
Planning, budgeting, and performance measurement transform strategy into action. They complete the strategic process of goal setting, strategy formulation, and implementation. Goals and strategy are the products of strategic thinking. The products of planning are objectives, timetables, budgets, and a baseline to measure and analyse performance.
Financial performance measurement is about using any of many different mathematical measures to evaluate how well a company is using its resources to make a profit. Common examples of performance measurement include operating income, earnings before interest and taxes, and net asset value. It is important to note that no one measure of performance should be taken on its own. Rather, to arrive at a true sense of how a company is doing, one must use as many different measures as possible together.5
Getting on top of financial measures of your performance is an important part of running a growing business, especially in the current economic climate.
✓ Measuring your profitability:
Most growing businesses ultimately target increased profits, so it's important to know how to measure profitability. The key standard measures are:
▪ Gross profit margin - how much money is made after direct costs of sales have been taken into account, or the contribution as it is also known.
▪ Operating margin - this lies between the gross and net measures of profitability. Overheads are taken into account, but interest and tax payments are not. For this reason, it is also known as the EBIT (earnings before interest and taxes) margin.
▪ Net profit margin - this is a much narrower measure of profits, as it takes all costs into account, not just direct ones. All overheads, as well as interest and tax payments, are included in the profit calculation.
▪ Return on capital employed - this calculates net profit as a percentage of the total capital employed in a business. This allows you to see how well the money invested in your business
5 http://financial-dictionary.thefreedictionary.com/Performance+Measurement
74 | P a g e
is performing compared with other investments you could make with it, like putting it in the bank.
✓ Other key accounting ratios:
There are a number of other commonly used accounting ratios that provide useful measures of business performance. These include:
▪ liquidity ratios, which tell you about your ability to meet your short-term financial obligations
▪ efficiency ratios, which tell you how well you are using your business assets
▪ financial leverage or gearing ratios, which tell you how sustainable your exposure to long-term debt is
✓ Principles of performance measurement
▪ All significant work activity must be measured.
➢ Work that is not measured or assessed cannot be managed because there is no objective information to determine its value. Therefore, it is assumed that this work is inherently valuable regardless of its outcomes. The best that can be accomplished with this type of activity is to supervise a level of effort.
➢ Unmeasured work should be minimised or eliminated.
➢ Work measurement must include the resources (manpower, expenses, and investment) required to accomplish the desired results.
▪ Desired performance outcomes must be established for all measured work.
➢ Outcomes provide the basis for establishing accountability for results rather than just requiring a level of effort.
➢ Desired outcomes are necessary for work evaluation and meaningful performance appraisal.
➢ Defining performance in terms of desired results is how managers and supervisors make their work assignments operational.
▪ A time phased performance baseline must be developed to evaluate total organisational performance. This baseline must incorporate all organisational activity. This includes:
➢ Operating performance outcomes that define the desired results from operations and the operational resources (manpower, material, assemblies, etc.) required to achieve these results.
➢ Financial performance outcomes that define the expected revenue and expense results, and investment required to support operating activity.
➢ Schedule performance that defines when these results and investment are expected to occur.
This baseline provides the standard for evaluating organisational results, determining variances from the plan, and implementing corrective action.
▪ Operating and financial performance reporting must be synchronized with the same reporting periods and reporting frequency.
▪ Reporting periods and frequency must be consistent with the time phasing of the performance baseline.
75 | P a g e
▪ Performance reporting and variance analyses must be accomplished frequently.
▪ Frequent reporting enables timely corrective action.
▪ Timely corrective action is needed for effective management control.
✓ Develop the Performance Measurement Baseline
▪ Work should be planned at the organisational level accountable for the results of that work.
➢ This planning establishes accountability for variance analysis and corrective action.
➢ Work planning may include breaking down the work into lower level results and resource requirements. Examples:
o Subdividing marketing expense requirements into advertising, promotion, administrative, etc.
o Subdividing production manpower requirements into direct manpower, indirect manpower, and overhead manpower.
o Subdividing sales expectations into product A sales, product B sales, etc.
➢ The lower the level of work planning and reporting, the more accurate will be the variance analysis.
➢ Meaningful work planning cannot go lower than the organisation's management reporting capability.
➢ Work planning includes identifying the desired results from the work activity and estimating the physical and financial resources needed to accomplish these results.
▪ Operational planning begins by determining the operating results to be achieved and estimating the physical resources needed to achieve them.
➢ Estimating relationships used to relate operating results and physical resources should be formalised so they can be monitored during performance measurement.
o Example- direct production man-hours per unit produced.
▪ Financial planning involves estimating the income and expense results from the operating plan and the investment needed to support the plan.
➢ Estimating relationships used to relate physical activity and resources to income, expense, and investment Rands should be formalised so they can be monitored during performance measurement.
o Example- revenue per unit sold.
▪ The performance measurement baseline integrates operational and financial planning results and displays them on a common timeline.
➢ Operational and financial planning results and resource requirements may be summarised to the organisational level accountable for the results of that work.
o Summary reporting may be more convenient for upper management needs.
o Lower reporting levels must still be maintained for variance analysis.
▪ Operating plans and budgets must be consistent with the performance measurement baseline.
➢ Functional operating budgets lower than the baseline can be used to provide an incentive to managers and supervisors but operating budgets may not exceed the baseline values.
76 | P a g e
o When operating budgets are less than the baseline the resource requirements must be reduced commensurately to preserve the estimating relationships used to develop the budget.
▪ Changes to the performance measurement baseline must be controlled and justified.
➢ No retroactive changes to completed work are permissible since this negates any meaningful variance analysis.
a. Agree and Adhere to Monitoring Systems (SO5 AC1)
The key aspects to financial controls and monitoring are:
✓ Accounting Records (or Accounts Receivable and Payable):
Establish a process that records every financial transaction by maintaining paper files, an electronic database, and copying all records in a virtual library. You need to be able to demonstrate what funds were received and how funds were spent.
Accounting records should be consistent. Choose a method and regular schedule for tracking income and expenses according to your organisation’s policies and procedures. This is important in case the organisation is audited.
✓ Financial Planning:
Financial planning converts your unit’s objectives into a budget. The budget serves as a critical planning guide for you and your staff. It is a record of how you intend to spend the funds received. Financial planning allows you to review your unit, examining successes and challenges in the past. Planning also enables you to make projections and set targets, informing strategies for future success.
✓ Financial Monitoring and Reporting:
Drawing from the information in the accounting records, you can create internal reports that help monitor progress by comparing budgets to actual expenses. Frequent reviews and monitoring allow you to measure your unit’s progress and help inform decision-making about the unit’s or a project’s future.
Internal reports, sometimes called management reports, allow you to be forward thinking as you assess the financial status of the unit and what will be needed to realise your goals.
Accounting records are also the source for creating external financial reports that demonstrate to stakeholders how funds have been spent.
Management may require financial reports at the completion of a project or periodically during a project’s implementation.
Internal Controls
Controls are financial practices that help safeguard your assets and ensure that money is being handled properly. Controls help detect errors in accounting, prevent fraud or theft, and help support the people responsible for handling your unit’s finances.
Examples of how to ensure that funds are spent transparently and in a manner for which they are intended:
77 | P a g e
▪ Have two people approve and sign the expenses over a certain amount of money
▪ Keep records that cannot be altered by numbering receipts, using a system where the data entry corresponds with a specific invoice or contract
▪ Assign qualified and experienced personnel to manage accounts
▪ Assign different staff in your unit distinct responsibilities related to managing income. For example, one person is responsible for authorising expenses, another is responsible for handling cash, and another is responsible for recording transactions
▪ Develop a procedural manual for record-keeping
b. Monitor Expenditure Reports (SO5 AC2)
Expenditure is defined6 as: “Actual payment of cash or cash-equivalent for goods or services, or a charge against available funds in settlement of an obligation as evidenced by an invoice, receipt, voucher, or other such document.
Revenue expenditure is cash used in payment for goods and services consumed in a short period.
A capital expenditure is cash used in purchase of fixed assets that last one year or more.”
Your team will report back on expenditures at the frequency and in the format required by your organisation. Your role is to control the submissions, analyse the reports and pick up variances timeously in order to strategise and implement corrective actions.
c. Implement Corrective Actions where Necessary (SO5 AC3)
✓ Variance Analysis
▪ The purpose of variance analysis is to determine the corrective action needed (if any) to accomplish the desired operating and financial results.
➢ Variance analysis effectiveness is directly proportional to the level of detail used to develop the performance measurement baseline.
o Comparing the estimating relationships used to develop the baseline with current measured values provides advance notice of the accuracy of the baseline estimates.
o Comparing the baseline to an estimate using these updated relationships will show how current results are impacting final performance.
➢ The decision whether to take corrective action is driven by the impact of current performance on estimated final results.
➢ Variance analysis contributes to learning and understanding the system dynamics that causes the observed results.
▪ Variance analysis has the following objectives.
➢ Analyse the impact of current performance on final operating and financial results.
o This will determine whether corrective action is indicated.
o If the estimated final results are unacceptable, corrective action is needed.
➢ Determine the root causes of the existing variances.
➢ Determine the corrective action needed to achieve the desired results.
▪ Operating results must be reported promptly and on a consistent schedule.
6 Retrieved from: http://www.businessdictionary.com/definition/expenditure.html

78 | P a g e
➢ Timely corrective action requires prompt variance analysis.
➢ Performance reporting should include the data needed to analyse the estimating relationships that were used to develop the baseline.
Formative Assessment 5: SO5 A1-3
79 | P a g e
References and Further Reading
▪ Flynn, David and Carolina Koornhof Fundamental Accounting , Juta & Co, 2000, Fourth edition
▪ Faul, MA, AC van Wyk and N Smith Accounting Fundamentals, Butterworths, Second edition
▪ Dickinson and King, Accounting Elementary, Wimble & Cairns, 1994, Seventh edition
▪ Operating Guidelines workbook – High Performance Work Systems, Inc. 1998
▪ Liberty Group – Compliance Department Information Brochure. 20X3
▪ www.investopedia.com, Investment Site
▪ www.werksmans.co.za, Werksmans Legal and Attorneys Site
▪ http://www.austincc.edu/accting/toolbox/documents/Steps%20to%20Accounting%20Cycle%20transcript.pdf
▪ http://bizfinance.about.com/od/yourfinancialposition/qt/Relation_FinSt.htm
▪ http://www.allbusiness.com/sales/sales-forecasting-sales-budget/661796-1.html
▪ http://ezinearticles.com/?Preparing-Financial-Projections-and-Pro-Forma-Statements&id=248204
▪ http://tutor2u.net/business/accounts/accounting_conventions_concepts.htm
▪ http://www.answers.com/topic/financial-forecasts-and-projections
▪ http://www.threesigma.com/Perfmeas_model.htm
▪ http://en.wikipedia.org/wiki/Expense_report#Bookkeeping_for_expenses
▪ http://www.businessdictionary.com/definition/expenditure.html