Embed Size (px)
Citation preview

Manage Your Mobile Time
University of Macau
Faculty of Science and Technology
Manage Your Mobile Time
by
Ao Ieong Kit Ha, Student No: DB027016
Final Project Report submitted in partial fulfillment
of the requirements of the Degree of
Bachelor of Science in Software Engineering
Project Supervisor
Dr. Zhuang Yan, Sofia
08 October 2014
Manage Your Mobile Time
DECLARATION
I sincerely declare that:
1. I and my teammates are the sole authors of this report,
2. All the information contained in this report is certain and correct to the best of
my knowledge,
3. I declare that the thesis here submitted is original except for the source
materials explicitly acknowledged and that this thesis or parts of this thesis
have not been previously submitted for the same degree or for a different
degree, and
4. I also acknowledge that I am aware of the Rules on Handling Student
Academic Dishonesty and the Regulations of the Student Discipline of the
University of Macau.
Signature : _________________________
Name : Ao Ieong Kit Ha
Student No. : DB027016
Date : 08 October 2014
Manage Your Mobile Time
ACKNOWLEDGEMENTS
I would like to express my utmost gratitude to UM for providing the opportunity to
carry out a project as a partial fulfillment of the requirement for the degree of
Bachelor of Science.
Throughout this project, I was very fortunate to receive the guidance and
encouragement from my supervisor Sofia. She gave us a lot of suggestions on
implementing the project and instruct us to think more from the user’s point of view.
I’ve learnt many in this project and in her instruction. I express my sincere thanks to
her.
Last but not least, I want to thank my partner Ho Sin Nga Veronica. We worked very
hard and we fight together in this project. This project can’t finish without her
intension.
Manage Your Mobile Time
ABSTRACT
Out of the world’s estimated 7 billion people, 6 billion have access to mobile phones.
The average smartphone user tends to spend around two hours a day using their
gadget, according to a study. While time management is important for improving
productivity, people are interested in finding out exactly how much time they have
spent on their smartphone daily.
In particular, people may like to know how much time they have used in the various
activities per day, including browsing the internet, checking social networks, listening
to music, playing games, making calls, text messaging, checking/writing emails,
reading books, watching TV/films, taking photographs, and etc. Statistics about time
spent on a particular activity can be more specific (for example, people spend
different time on different games). The project aims in helping people to know more
about their time spent on their smartphone per day, thus opt for better time
management.
To achieve the project goal – to help users to manage their time, we implement an
application for android OS to track the time usage of the mobile phone. Since IOS
can’t provide enough permission for us to implement, so the project we only focus on
implement the app in android OS.
Since my partner and me have not implemented app yet. So we do a lot of study and
research of implementing app and understanding android OS at the beginning.
In this report is mainly talk about the main function of the app. Besides, including our
understanding of developing the app. Other function in this app will be introduced by
my partner Ho Sin Nga.
Manage Your Mobile Time
TABLE OF CONTENTS
CHAPTER 1. INTRODUCTION ..................................................................................... 1
1.1 Background .......................................................................................................................... 1
1.2 Objective .............................................................................................................................. 1
1.3 Work flow ............................................................................................................................ 1
1.4 Work Scheduling .................................................................................................................. 1
1.5 Task Allocation ..................................................................................................................... 1
1.6 Environment ........................................................................................................................ 1
CHAPTER 2. LITERATURE SURVEY/RELATED WORK ...................................... 5
2.1 Related application .............................................................................................................. 5
2.2 Eclipse .................................................................................................................................. 5
2.3 Android SDK ......................................................................................................................... 5
2.4 Java SE Development Kit (JDK) ............................................................................................. 6
2.5 ADT plugin ............................................................................................................................ 6
2.6 AchartEngine ........................................................................................................................ 6
2.7 GenyMotion ......................................................................................................................... 6
CHAPTER 3. FUNCTIONAL SPECIFICATION .......................................................... 7
CHAPTER 4. SOFWARE DESIGN SPECIFICATION ................................................ 9
4.1 Flow chart .......................................................................................................................... 10
4.2 Database design ................................................................................................................. 13
CHAPTER 5. IMPLEMENTATION NARRATIVE AND DESCRIPTION ............ 16
5.1 Programming language ...................................................................................................... 16
5.2 Software environment ....................................................................................................... 16
5.3 Implementation narrative .................................................................................................. 16 5.3.1 Implementation ................................................................................................................... 16 5.3.2 Difficulty .............................................................................................................................. 21

Manage Your Mobile Time
CHAPTER 6. EVALUATION ....................................................................................... 22
6.1 Testing ............................................................................................................................... 22
6.2 Comparison ........................................................................................................................ 22
CHAPTER 7. SUMMARY ............................................................................................. 28
7.1 Future work........................................................................................................................ 28
7.2 Conclusion .......................................................................................................................... 29
CHAPTER 8. REFERENCES ........................................................................................ 30
Manage Your Mobile Time
LIST OF FIGURES
Figure 1: Data Flow Diagram ........................................................................................ 9
Figure 2: Flow chart of the app usage function. .......................................................... 11
Figure 3: Flow chart of the usage chart function ......................................................... 12
Figure 4: Flow chart of monitoring battery.................................................................. 12
Figure 5: Flow chart of checking screen status. ........................................................... 13
Figure 6: the relationship between the table AppTime and TotalTable ....................... 14
Figure 7: The new record of App A in AppTime Table .............................................. 14
Figure 8: Update the record of App A in TotalTable ................................................... 14
Figure 9: The PowerTable ........................................................................................... 15
Figure 10: The CheckScreen table ............................................................................... 15
Figure 11: Unlock Times Checking ............................................................................. 20
Figure 12: MobileTime’s size ...................................................................................... 22
Figure 13: The size of App Timer Mini 2 and AppUsage ........................................... 23
Figure 14: consumption picture captured in 26th
April ................................................ 23
Figure 15: consumption picture captured in 19th
May ................................................. 24
Figure 16: consumption picture captured in 30th
May ................................................. 24
Figure 17: consumption picture captured in 5th
June ................................................... 25
Figure 18: App Timer Mini 2 page .............................................................................. 26
Figure 19: App Timer Mini 2 Alert page ..................................................................... 26
Figure 20: AppUsage screenshot ................................................................................. 27
Manage Your Mobile Time
LIST OF TABLES
Table 1: Work Scheduling ............................................................................................. 2
Table 2: Task allocation ................................................................................................. 4
Table 3: function Description ........................................................................................ 7
Table 4: Flag Description............................................................................................. 21
Manage Your Mobile Time
1 of 29 08 October 2014
CHAPTER 1. INTRODUCTION
1.1 Background
Nowadays, people have at least one smart phone in their pocket. Smart phone is so
useful that people are more and more rely on it. We use it to check mails, browse the
internet, play games, take photos, listen to music etc. If we spend too much time day
by day, it will cause neck pain, short sight. Our app can show the usage of each
application in your smart phone, also you can set up a reminder to alert you to put
down your phone.
1.2 Objective
The objective of this project is to manage user’s time to use smart phone so that user
don’t become a morbid. In the project, we develop an application to monitor the status
of the mobile usage. It shows the time of each application which in the user’s mobile.
We hope the user can reduce the time on the phone through this application.
1.3 Work flow
We list the steps of the project. There are eight parts:
The decision of the requirement
The APP’s design for the function
The APP’s design for the interface
Implementation of function
Implementation of interface
Testing
Modification
Report
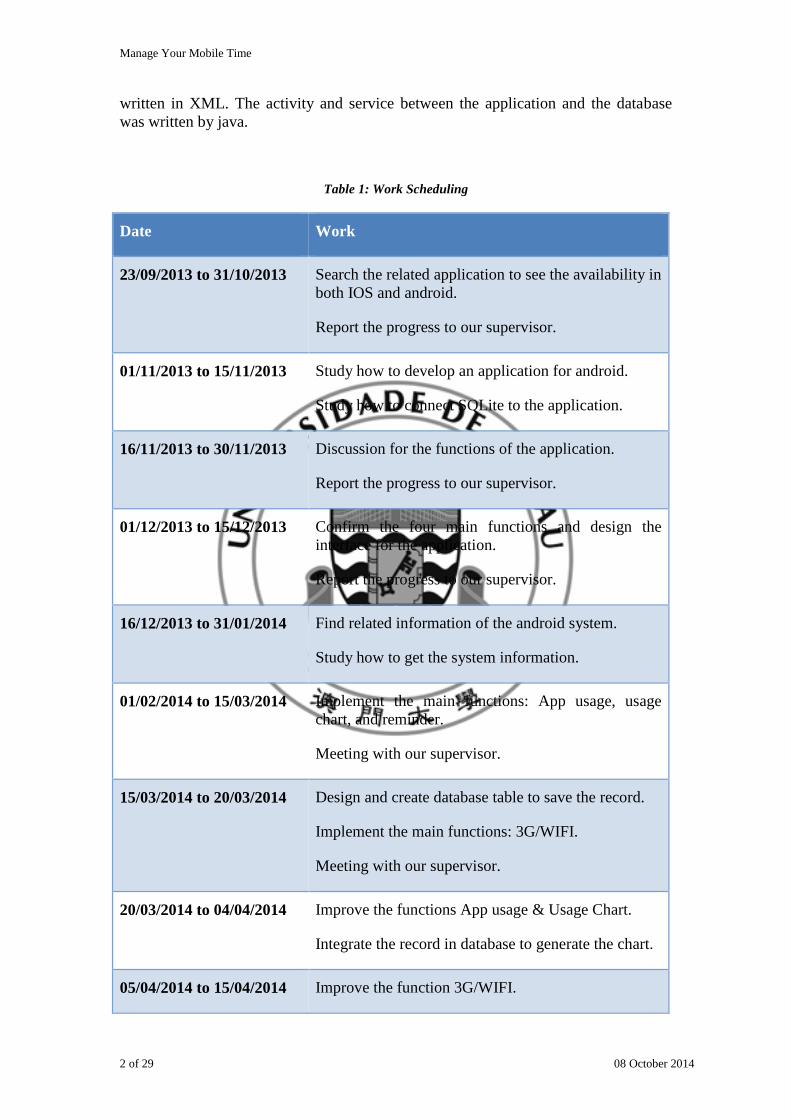
1.4 Work Scheduling
Table 1 shows the workload in the given period.
1.5 Task Allocation
Table 2 shows the task allocation.
1.6 Environment
Smart phone’s operating system is mainly divided into two type: android and IOS.
Since we need a permission to access to the system to get the other application’s data
and the system’s resources, IOS cannot provide such big permission that we only
focus on the mobile in android OS. In the project we have used java, SQLite and
XML. All the collected data we stored in SQLite. The interface of the application was
Manage Your Mobile Time
2 of 29 08 October 2014
written in XML. The activity and service between the application and the database
was written by java.
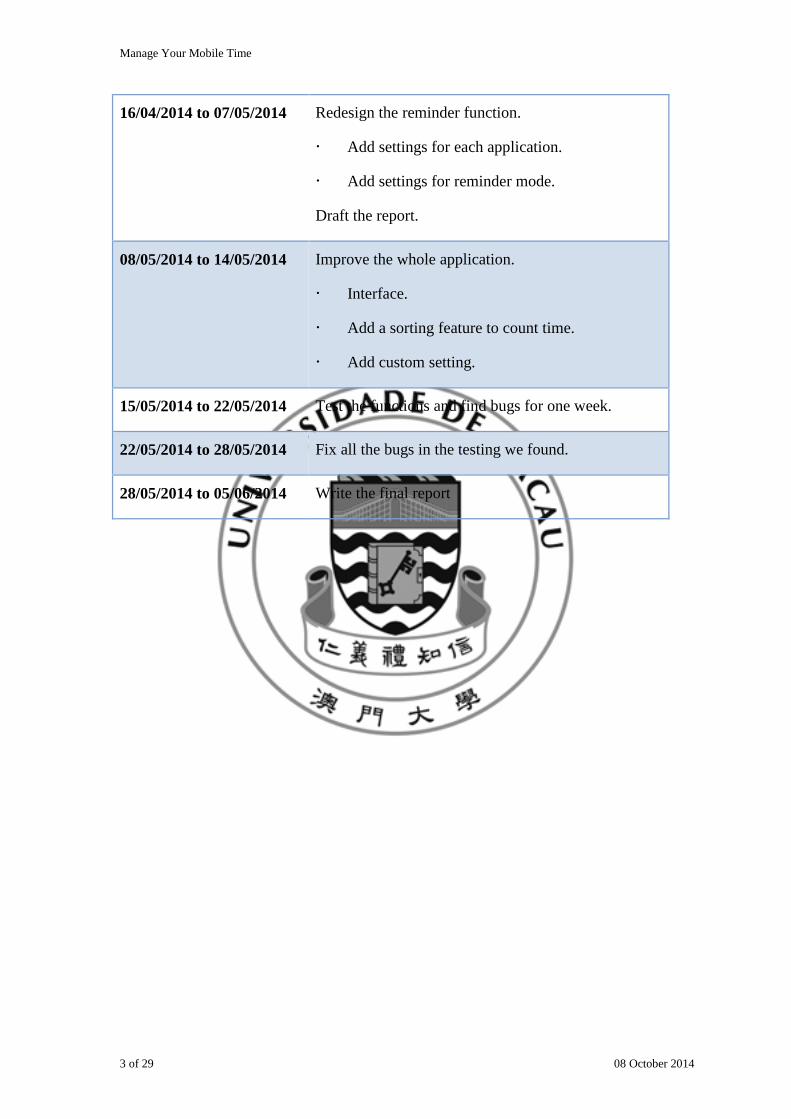
Table 1: Work Scheduling
Date Work
23/09/2013 to 31/10/2013 Search the related application to see the availability in
both IOS and android.
Report the progress to our supervisor.
01/11/2013 to 15/11/2013 Study how to develop an application for android.
Study how to connect SQLite to the application.
16/11/2013 to 30/11/2013 Discussion for the functions of the application.
Report the progress to our supervisor.
01/12/2013 to 15/12/2013 Confirm the four main functions and design the
interface for the application.
Report the progress to our supervisor.
16/12/2013 to 31/01/2014 Find related information of the android system.
Study how to get the system information.
01/02/2014 to 15/03/2014 Implement the main functions: App usage, usage
chart, and reminder.
Meeting with our supervisor.
15/03/2014 to 20/03/2014 Design and create database table to save the record.
Implement the main functions: 3G/WIFI.
Meeting with our supervisor.
20/03/2014 to 04/04/2014 Improve the functions App usage & Usage Chart.
Integrate the record in database to generate the chart.
05/04/2014 to 15/04/2014 Improve the function 3G/WIFI.
Manage Your Mobile Time
3 of 29 08 October 2014
16/04/2014 to 07/05/2014 Redesign the reminder function.
Add settings for each application.
Add settings for reminder mode.
Draft the report.
08/05/2014 to 14/05/2014 Improve the whole application.
Interface.
Add a sorting feature to count time.
Add custom setting.
15/05/2014 to 22/05/2014 Test the functions and find bugs for one week.
22/05/2014 to 28/05/2014 Fix all the bugs in the testing we found.
28/05/2014 to 05/06/2014 Write the final report
Manage Your Mobile Time
4 of 29 08 October 2014
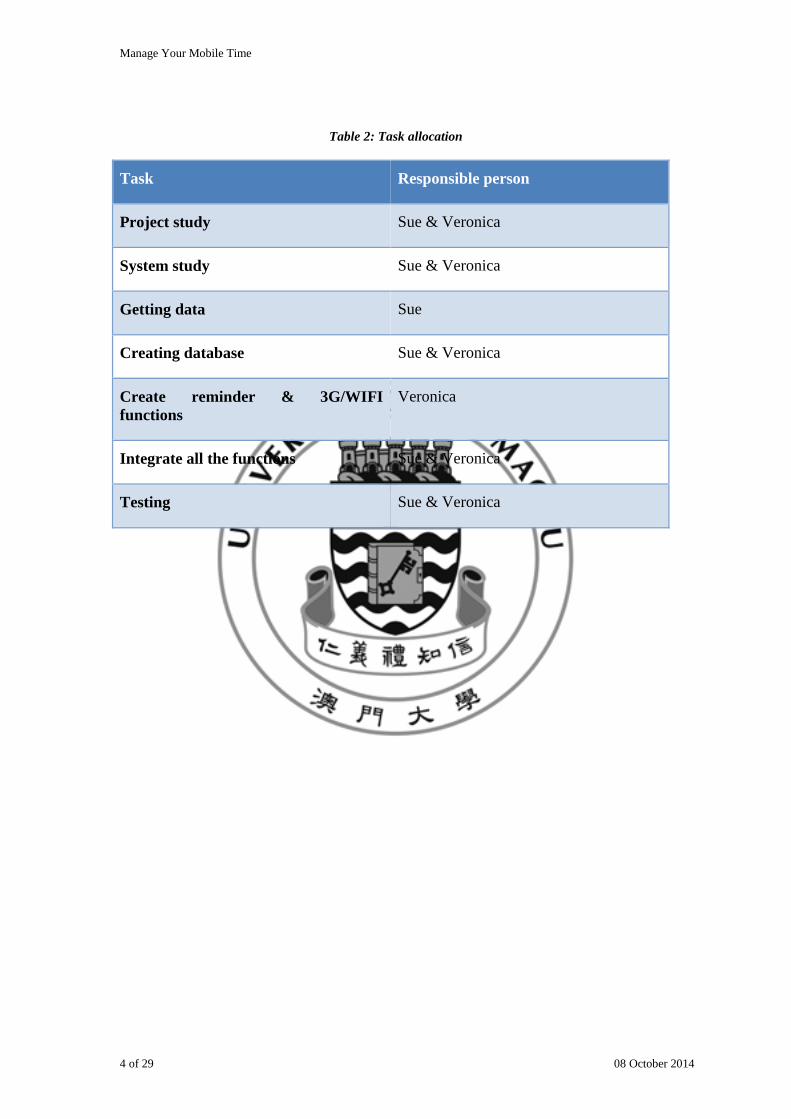
Table 2: Task allocation
Task Responsible person
Project study Sue & Veronica
System study Sue & Veronica
Getting data Sue
Creating database Sue & Veronica
Create reminder & 3G/WIFI
functions
Veronica
Integrate all the functions Sue & Veronica
Testing Sue & Veronica
Manage Your Mobile Time
5 of 29 08 October 2014
CHAPTER 2. LITERATURE SURVEY/RELATED
WORK
At the project beginning, we focus on search the applications that are related to our
project. We hope we can find any clue in both IOS and android. Actually, we get
many in android. Android is a good platform which is a fully open-source operating
system. However, we can’t find any applications that are related to our project in IOS.
We only can find the applications that need to be installed in a jailbreak iPhone. We
start to search why iPhone don’t have such application to manage mobile time. The
answer is that iPhone blocks some permissions to protect the phone and all the
developer’s application so that no one can get such information to implement this
kind of application only if the phone is been jailbreak. A jailbreak iPhone relieves all
permissions but it makes the phone become unstable. We don’t expect the user
jailbreak the phone for our application. So we decide to give up implementing the
application in IOS, only implement an application that in android OS.
2.1 Related application
In the store, there are some related applications. They can count the time for your
usage also but some have different addition functions.
In the beginning, we spend a period of time to search them in the word ‘time’,
‘manage’ etc. However, we can’t find any related applications. We realized that may
be such application’s name didn’t have those words. We started using another word
‘count’, ‘track’, and we get a little prospect. After the research process, we found a
fact that was those applications are not been widely use.
Although we are familiar with java environment, we still need to study about the
android system and specification. To develop an application, we need to design
interface for user with XML.
2.2 Eclipse
Eclipse[1] are the tools for Java developers creating Java EE and Web applications,
including a Java IDE, tools for Java EE, JPA, JSF, Mylyn, EGit and others. In this
project, we use Eclipse for Java EE. Eclipse can install many plugins. In order to
implement our project, we need to install the plugins android SDK and ADT plugin
into Eclipse.
2.3 Android SDK
The Android SDK[2] provides us the API libraries and developer tools necessary to
build, test, and debug apps for Android. API(Application Programming Index) is a
group of library for android developer to develop android application. Android SDK
also provides a set of virtual system for us to debug. This is the core tool to implement
the application.
Manage Your Mobile Time
6 of 29 08 October 2014
2.4 Java SE Development Kit (JDK)
Java SE Development Kit (JDK)[3] is for Java Developers. Includes a complete JRE
plus tools for developing, debugging, and monitoring Java applications.
2.5 ADT plugin
Android Development Tools (ADT)[4] is a plugin for the Eclipse IDE that is designed
to give you a powerful, integrated environment in which to build Android applications.
ADT extends the capabilities of Eclipse to let you quickly set up new Android
projects, create an application UI, add packages based on the Android Framework
API, debug your applications using the Android SDK tools, and even export signed
(or unsigned) .apk files in order to distribute your application.
2.6 AchartEngine
It is user friendly that we use chart to present our data. AChartEngine[5] is a charting
library for Android applications. It currently supports the following chart types:
line chart
time chart
bar chart
pie chart
bubble chart
doughnut chart
etc.
As you see, there are many charts are provided. We want to use some of them also.
But our instructor suggests us to choose a chart that is clear to express the usage is
enough. So we decided using the pie chart to show the usage.
2.7 GenyMotion
GenyMotion[6] is a fast android emulator. It has wifi feature and we can control the
battery. GenyMotion let us to simulate every environment that we will meet in real
mobile. It is an emulator for us to test and demo our project.
Manage Your Mobile Time
7 of 29 08 October 2014
CHAPTER 3. FUNCTIONAL SPECIFICATION
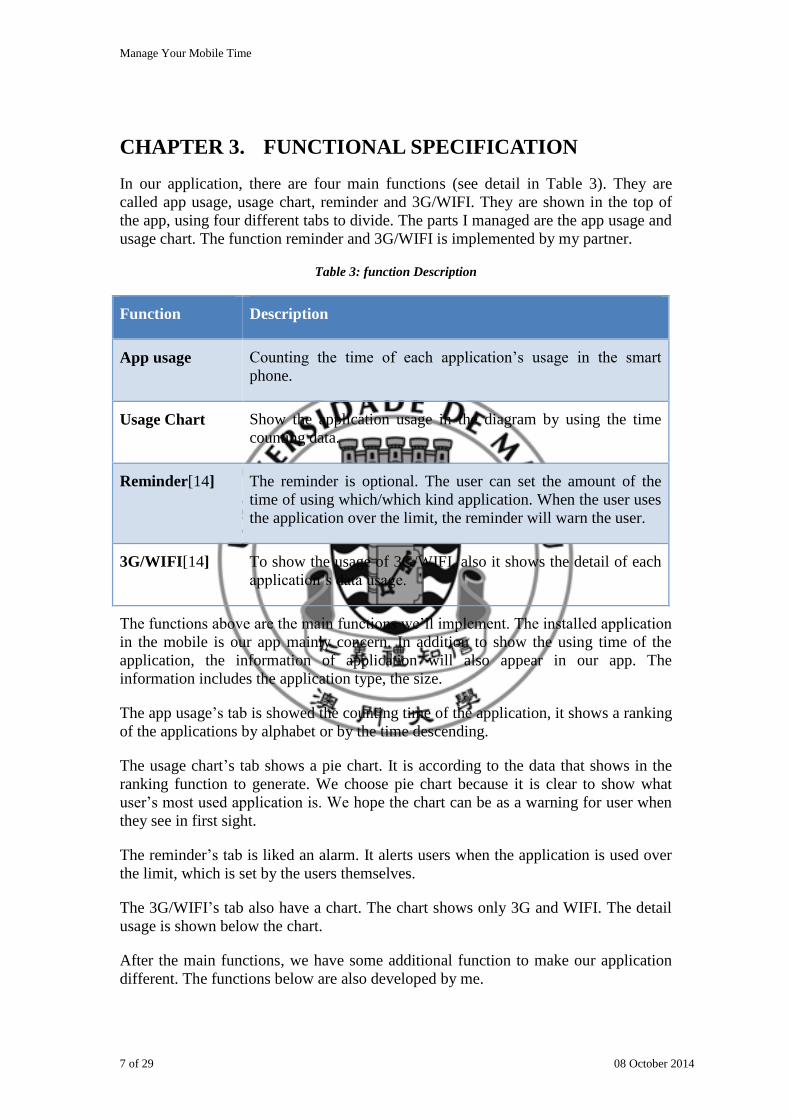
In our application, there are four main functions (see detail in Table 3). They are
called app usage, usage chart, reminder and 3G/WIFI. They are shown in the top of
the app, using four different tabs to divide. The parts I managed are the app usage and
usage chart. The function reminder and 3G/WIFI is implemented by my partner.
Table 3: function Description
Function Description
App usage Counting the time of each application’s usage in the smart
phone.
Usage Chart Show the application usage in the diagram by using the time
counting data.
Reminder[14] The reminder is optional. The user can set the amount of the
time of using which/which kind application. When the user uses
the application over the limit, the reminder will warn the user.
3G/WIFI[14] To show the usage of 3G/WIFI, also it shows the detail of each
application’s data usage.
The functions above are the main functions we’ll implement. The installed application
in the mobile is our app mainly concern. In addition to show the using time of the
application, the information of application will also appear in our app. The
information includes the application type, the size.
The app usage’s tab is showed the counting time of the application, it shows a ranking
of the applications by alphabet or by the time descending.
The usage chart’s tab shows a pie chart. It is according to the data that shows in the
ranking function to generate. We choose pie chart because it is clear to show what
user’s most used application is. We hope the chart can be as a warning for user when
they see in first sight.
The reminder’s tab is liked an alarm. It alerts users when the application is used over
the limit, which is set by the users themselves.
The 3G/WIFI’s tab also have a chart. The chart shows only 3G and WIFI. The detail
usage is shown below the chart.
After the main functions, we have some additional function to make our application
different. The functions below are also developed by me.
Manage Your Mobile Time
8 of 29 08 October 2014
One is to check your battery usage. When your phone’s battery is lower than the
limitation (the default is 30), it will alert you to charge your phone. The limitation and
the alert type can be set by the user.
The other is to check how many times the users turn the mobile’s screen on.
Nowadays, people rely on their mobile more and more. They don’t realize that they
turn on screen is meaningful or don’t. People have got used to play with their mobiles
consciously and even unconsciously. We hope user through this function can aware
this problem and reduce the time to turn on mobile.
Manage Your Mobile Time
9 of 29 08 October 2014
CHAPTER 4. SOFWARE DESIGN SPECIFICATION
In our project, data are very important and all the functions are relied on these data in
our database (see 錯誤! 找不到參照來源。錯誤! 找不到參照來源。). The Data
Flow Diagram doesn’t contain all tables in the database, it focuses on the activity flow
because other tables is made by my partner. My partner’s report will contain the other
in detail.
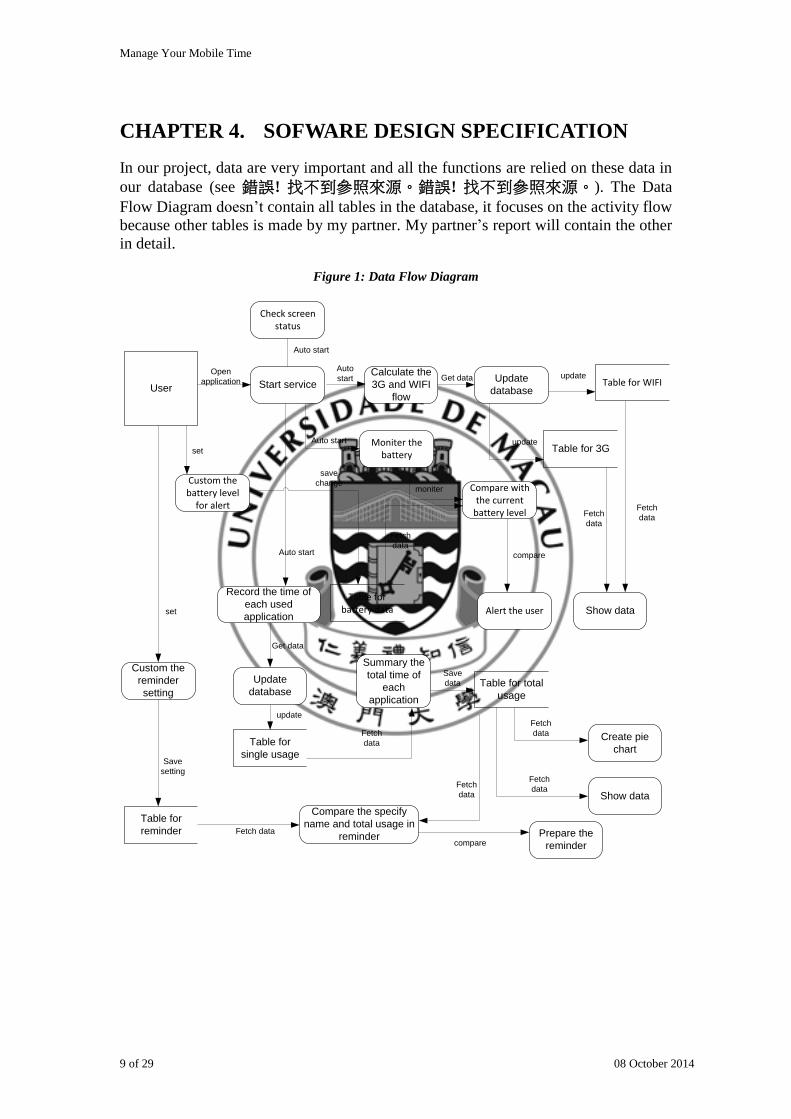
Figure 1: Data Flow Diagram
User Start service
Record the time of
each used
application
Table for
single usage
Update
database
Summary the
total time of
each
application
Table for total
usage
Show data
Create pie
chart
Compare the specify
name and total usage in
reminder
Table for
reminder Prepare the
reminder
Custom the
reminder
setting
Calculate the
3G and WIFI
flow
Update
database
Table for 3G
Open
application
Auto
start Get data
Auto start
Get data
update
update
Fetch
data
Save
data
Fetch
data
Fetch
data
Fetch
data
Fetch data
set
Save
setting
compare
Show data
Fetch
data
Moniter the battery
Custom the battery level
for alert
Table for battery data
Compare with the current
battery level
Alert the user
set
save
change
Fetch
datacompare
Auto start
moniter
Table for WIFI
Fetch
data
update
Check screen status
Auto start
Manage Your Mobile Time
10 of 29 08 October 2014
In the Data Flow Diagram, These functions are the core function of the application.
When users open our application, it will start the service in the back-end. The service
contains several functions: tracking the usage time of the application, calculating the
3G and WIFI flow, the reminder and monitoring battery.
As you see, there are five tables in the Data Flow Diagram. But this is not the real in
our application. There are ten tables in the database actually. Because I don’t know
the details of the function that my partners handles so some tables are omitted in the
data flow diagram.
In the next, I will introduce the part that I am response for. In this project, I am
handling the app usage, usage chart, monitoring battery and checking screen status. I
will separate them to talk about.
4.1 Flow chart
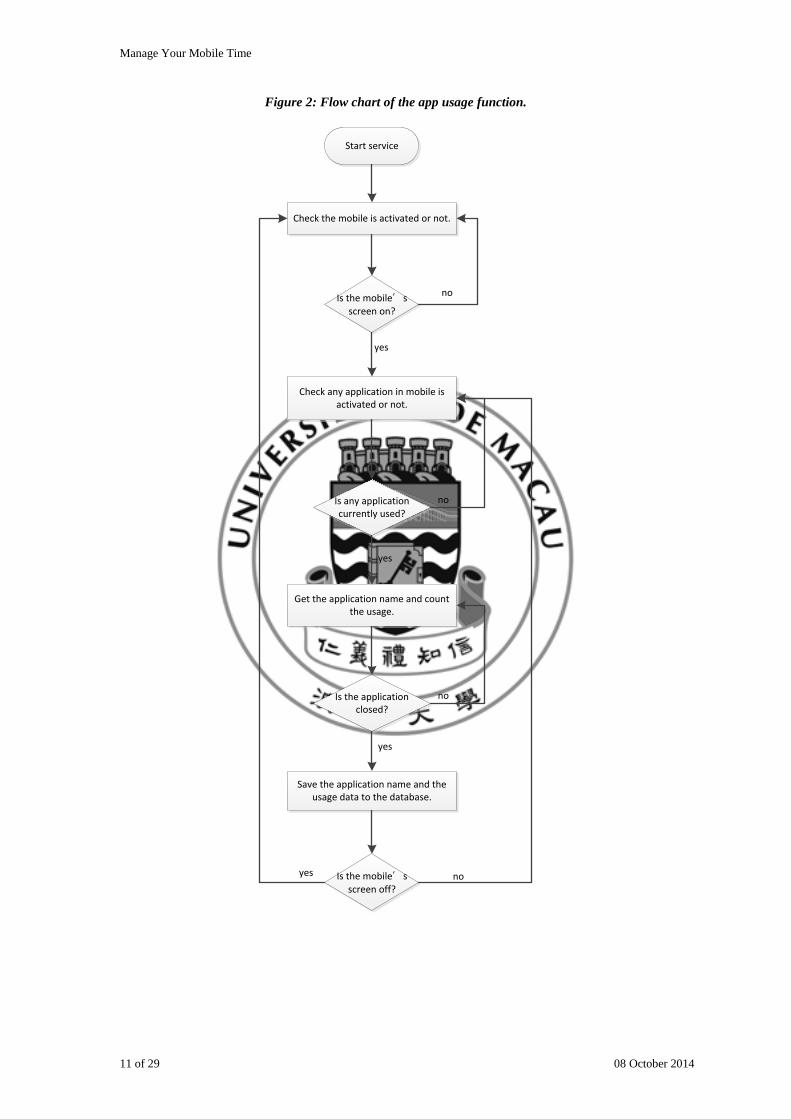
First I will introduce the work flow of the app usage (see Flow chart of the app usage
function.Figure 2). When the service is start, first it checks the mobile whether is
activated. If the mobile is not activated, it won’t start counting any usage, the service
is on standby. Once the mobile is activated, then the service goes to next step – to
check whether any application is ongoing. If one application is used, the service will
temperately save the application name in memory and start to count the usage. When
the application is finished used, the application name and the usage time save to the
database immediately. And then start to check the screen again until the service is
closed by user.
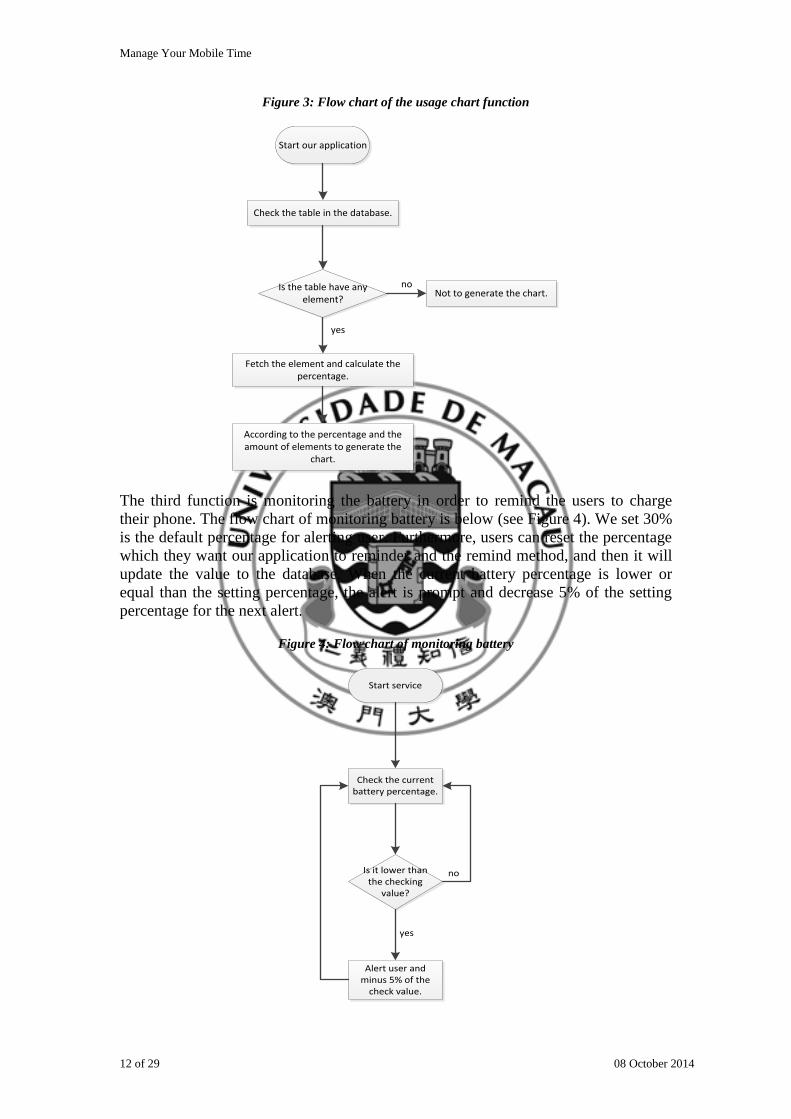
Other major function is the usage chart. The chart is according to the data that the
pervious function gets then is generated. To avoid the problem that does not prompt
an error to user, I make a condition to judge the table is empty or has elements. If the
table has no elements, then the page will not show the chart and no error shows to
user. The flow chart of the usage chart function is below (see Figure 3). This function
is only activated when users open our application, so it does not have a recursion in its
flow.
Manage Your Mobile Time
11 of 29 08 October 2014
Figure 2: Flow chart of the app usage function.
Check the mobile is activated or not.
Is the mobile’s screen on?
Start service
Check any application in mobile is activated or not.
Is any application currently used?
Get the application name and count the usage.
Is the application closed?
Save the application name and the usage data to the database.
Is the mobile’s screen off?
yes
no
yes
yes
yes
no
no
no
Manage Your Mobile Time
12 of 29 08 October 2014
Figure 3: Flow chart of the usage chart function
Start our application
Check the table in the database.
Is the table have any element?
Fetch the element and calculate the percentage.
According to the percentage and the amount of elements to generate the
chart.
Not to generate the chart.
yes
no
The third function is monitoring the battery in order to remind the users to charge
their phone. The flow chart of monitoring battery is below (see Figure 4). We set 30%
is the default percentage for alerting user. Furthermore, users can reset the percentage
which they want our application to reminder and the remind method, and then it will
update the value to the database. When the current battery percentage is lower or
equal than the setting percentage, the alert is prompt and decrease 5% of the setting
percentage for the next alert.
Figure 4: Flow chart of monitoring battery
Start service
Check the current battery percentage.
Is it lower than the checking
value?
Alert user and minus 5% of the
check value.
yes
no
Manage Your Mobile Time
13 of 29 08 October 2014
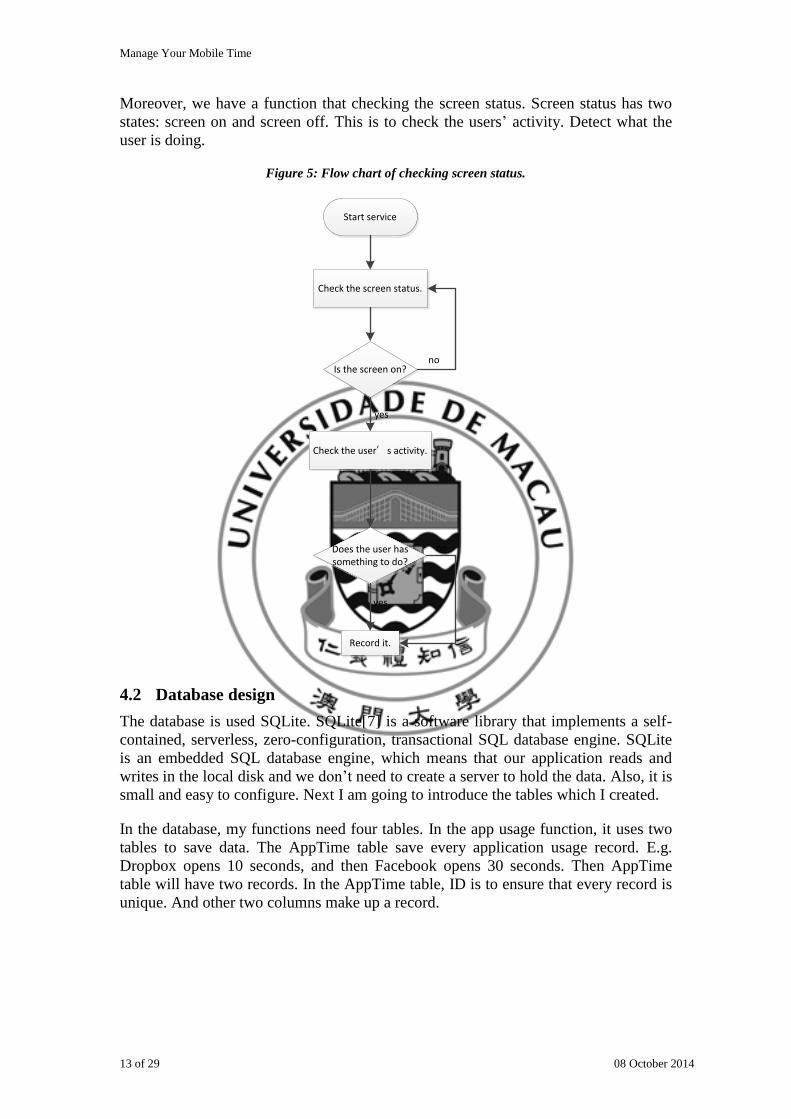
Moreover, we have a function that checking the screen status. Screen status has two
states: screen on and screen off. This is to check the users’ activity. Detect what the
user is doing.
Figure 5: Flow chart of checking screen status.
Start service
Check the screen status.
Is the screen on?
Check the user’s activity.
Does the user has something to do?
Record it.
yes
yes
no
no
4.2 Database design
The database is used SQLite. SQLite[7] is a software library that implements a self-
contained, serverless, zero-configuration, transactional SQL database engine. SQLite
is an embedded SQL database engine, which means that our application reads and
writes in the local disk and we don’t need to create a server to hold the data. Also, it is
small and easy to configure. Next I am going to introduce the tables which I created.
In the database, my functions need four tables. In the app usage function, it uses two
tables to save data. The AppTime table save every application usage record. E.g.
Dropbox opens 10 seconds, and then Facebook opens 30 seconds. Then AppTime
table will have two records. In the AppTime table, ID is to ensure that every record is
unique. And other two columns make up a record.

Manage Your Mobile Time
14 of 29 08 October 2014
Figure 6: the relationship between the table AppTime and TotalTable
AppTime
Id: IntegerApplabel: StringTime: Integer
TotalTable
Id: IntegerAppLabel: StringTotaltime: String
Users may want to know the total usage time of each app. So TotalTable contains the
total usage of each application. In this table, id and applabel is also unique. The
application only updates the Totaltime when the applabel is appeared. The figures
below shows an example for the record updates (see Figure 7 & Figure 8).
Figure 7: The new record of App A in AppTime Table
AppTime
ID Applabel Time1 App A 102 App B 53 App C 754 App A 30
Figure 8: Update the record of App A in TotalTable
TotalTable
ID Applabel Time1 App A 402 App B 53 App C 75
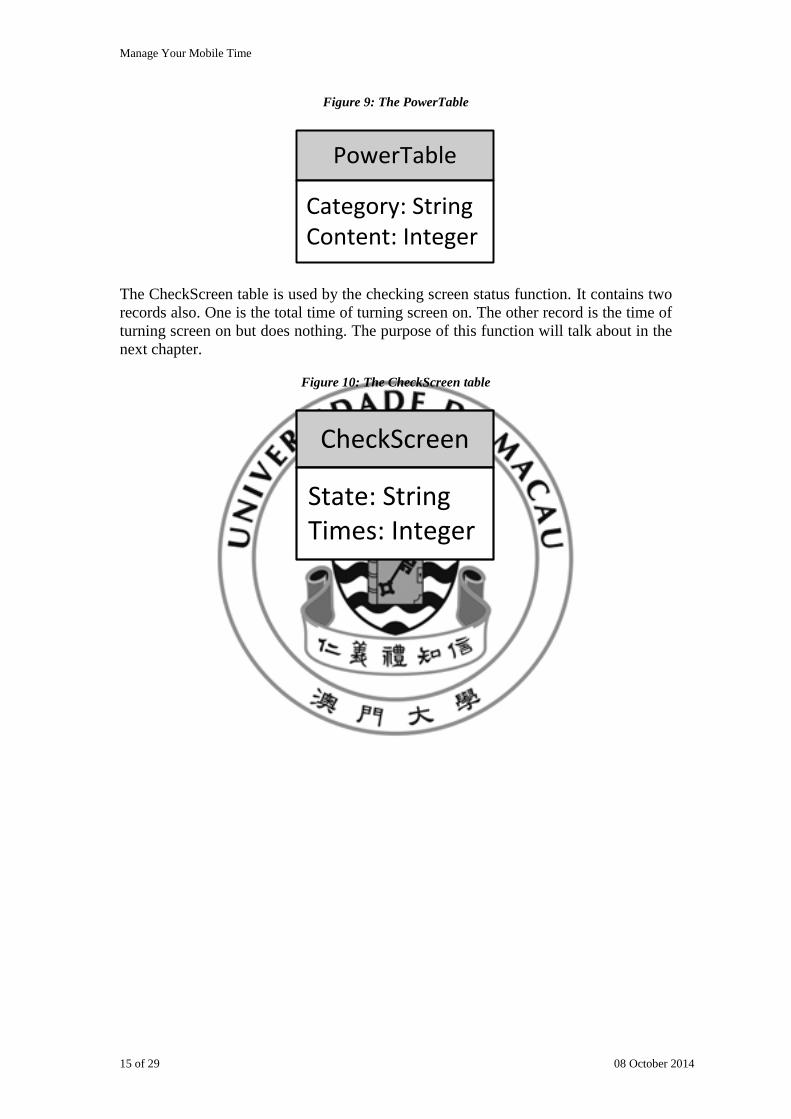
The PowerTable is used by monitoring battery function. It only contains two records.
One is the minimum percentage for checking. The other is the type of alert. Both are
use an integer value to save in the content column. To distinguish these two values,
one is named power and the other is named type in the category column.
Manage Your Mobile Time
15 of 29 08 October 2014
Figure 9: The PowerTable
PowerTable
Category: StringContent: Integer
The CheckScreen table is used by the checking screen status function. It contains two
records also. One is the total time of turning screen on. The other record is the time of
turning screen on but does nothing. The purpose of this function will talk about in the
next chapter.
Figure 10: The CheckScreen table
CheckScreen
State: StringTimes: Integer
Manage Your Mobile Time
16 of 29 08 October 2014
CHAPTER 5. IMPLEMENTATION NARRATIVE AND
DESCRIPTION
Since I am in charge of the App usage and usage chart two parts, so in this report I
will introduce the data structure and the function in these two parts.
5.1 Programming language
In the project we use java because it is the programming language of android
application development.
5.2 Software environment
The application needs to run in android 3.0 platform above. To have a good
performance, we suppose the phone have 2GB RAM. The minimum requirement is
1GB RAM.
5.3 Implementation narrative
5.3.1 Implementation
In this part is mainly talk about how I do the implementation step by step. The
implementation is following the design.
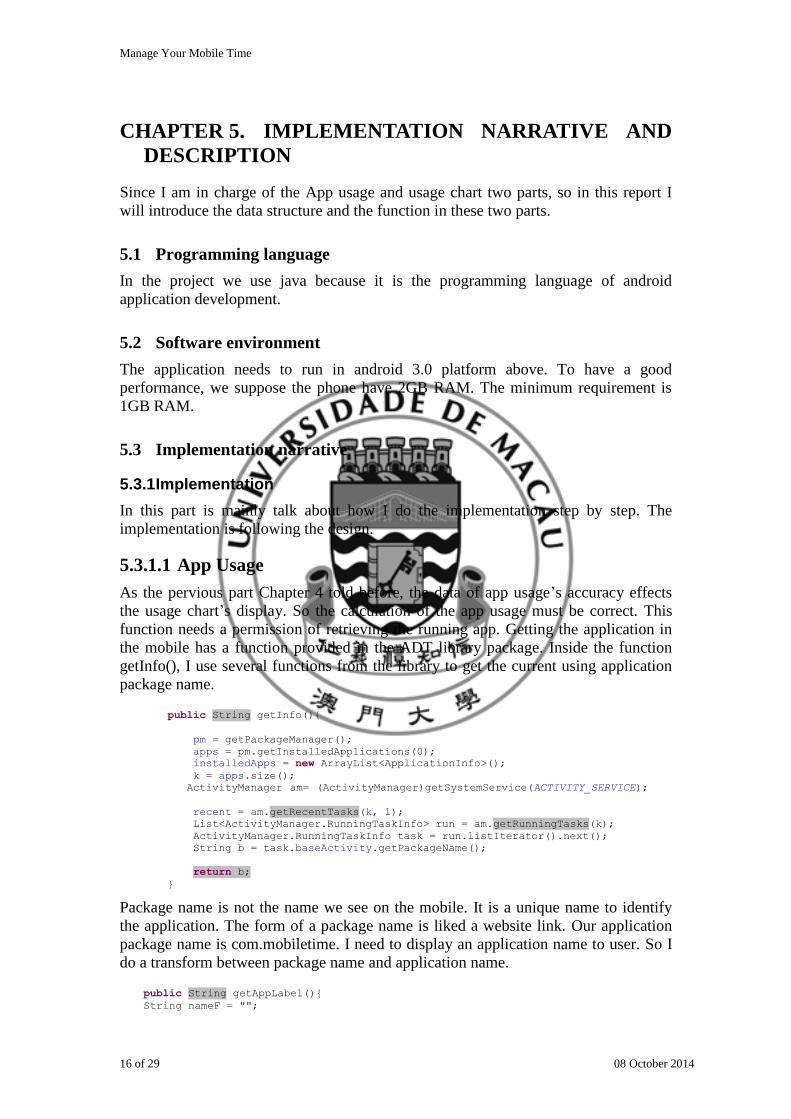
5.3.1.1 App Usage
As the pervious part Chapter 4 told before, the data of app usage’s accuracy effects
the usage chart’s display. So the calculation of the app usage must be correct. This
function needs a permission of retrieving the running app. Getting the application in
the mobile has a function provided in the ADT library package. Inside the function
getInfo(), I use several functions from the library to get the current using application
package name.
public String getInfo(){
pm = getPackageManager();
apps = pm.getInstalledApplications(0);
installedApps = new ArrayList<ApplicationInfo>();
k = apps.size();
ActivityManager am= (ActivityManager)getSystemService(ACTIVITY_SERVICE);
recent = am.getRecentTasks(k, 1);
List<ActivityManager.RunningTaskInfo> run = am.getRunningTasks(k);
ActivityManager.RunningTaskInfo task = run.listIterator().next();
String b = task.baseActivity.getPackageName();
return b;
}
Package name is not the name we see on the mobile. It is a unique name to identify
the application. The form of a package name is liked a website link. Our application
package name is com.mobiletime. I need to display an application name to user. So I
do a transform between package name and application name.
public String getAppLabel(){
String nameF = "";

Manage Your Mobile Time
17 of 29 08 October 2014
for (ActivityManager.RecentTaskInfo info : recent) {
Intent intent = info.baseIntent;
ResolveInfo ri = pm.resolveActivity(intent, 0);
String name = "";
if (ri != null){
name = ri.activityInfo.packageName;
}
String name2 = "";
String name3 = "";
ApplicationInfo a = null;
try {
name2 = pm.getPackageInfo(name, 0).packageName;
} catch (NameNotFoundException e) {
// TODO Auto-generated catch block
e.printStackTrace();
}
if (name.compareTo(name2) == 0){
name3 = (String) pm.getApplicationLabel(a);
nameF = name3;
break;
}
}
return nameF;
}
The method I use is first to get the recent running app and current time when the app
is in the first of the recent app’s list. Then when the app is closed or user open another
app, the system will get the current time again and do the subtractions of two times
we get before. Finally save the result to the database. This method reduces the
memory usage because it doesn’t do the calculation every second.
public Runnable work=new Runnable(){
public void run() {
PowerManager powerManager = (PowerManager)getSystemService(POWER_SERVICE);
boolean isScreenOn = powerManager.isScreenOn();
if (isScreenOn){
flag = true;
s1 = getInfo();
if(s1!=null&& s1!=""){
if (!s1.equals(s2)){
String appname = getAppLabel();
s2 = s1;
timenow = System.currentTimeMillis();
if (time2 == 0){
time1 = timenow;
time2 = time1;
Insertname = appname;
}
else{
time2 = timenow-time1;
time1 = timenow;
int time = (int) (time2 / 1000);
dh.Insert(Insertname, time);
Insertname = appname;
}
}
}
}else{
timenow = System.currentTimeMillis();
if (flag&&Insertname!=null&&Insertname!="")
{
time2 = timenow-time1;
time1 = timenow;
int time = (int) (time2 / 1000);
dh.Insert(Insertname, time);
Manage Your Mobile Time
18 of 29 08 October 2014
Insertname = appname;
}
flag = false;
screen = true;
}
handler.postDelayed(work, 1000);
}
};
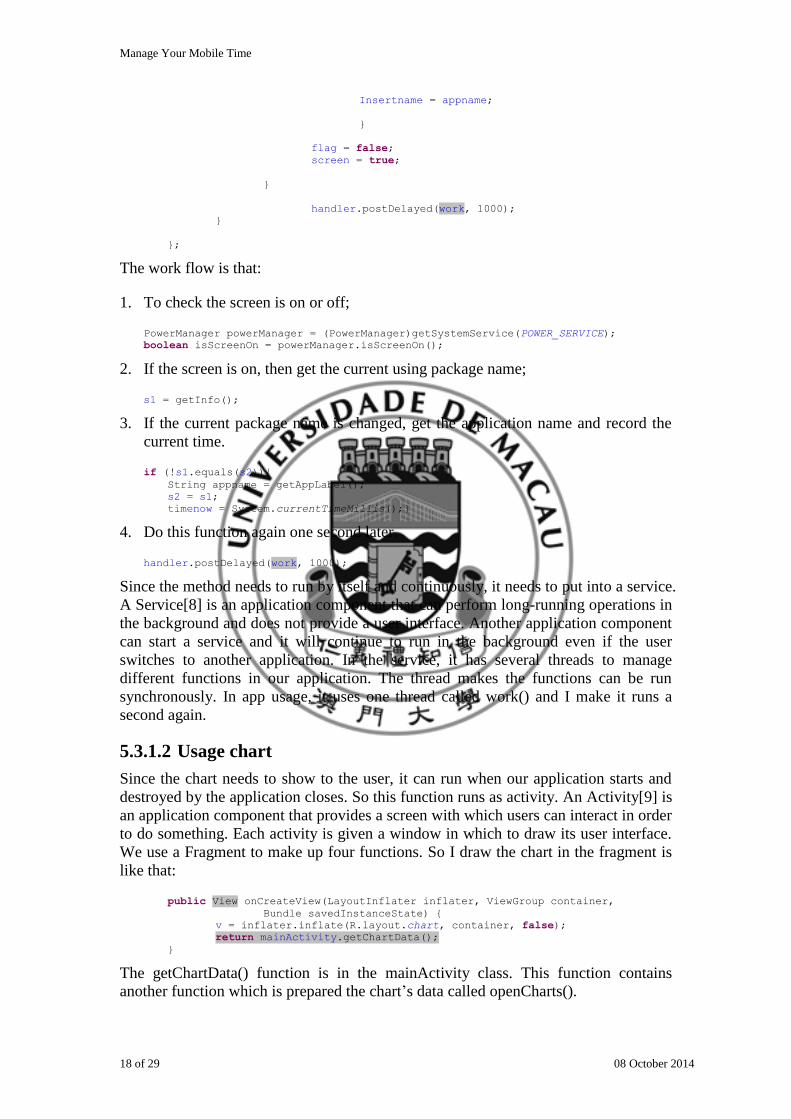
The work flow is that:
1. To check the screen is on or off;
PowerManager powerManager = (PowerManager)getSystemService(POWER_SERVICE);
boolean isScreenOn = powerManager.isScreenOn();
2. If the screen is on, then get the current using package name;
s1 = getInfo();
3. If the current package name is changed, get the application name and record the
current time.
if (!s1.equals(s2)){
String appname = getAppLabel();
s2 = s1;
timenow = System.currentTimeMillis();}
4. Do this function again one second later.
handler.postDelayed(work, 1000);
Since the method needs to run by itself and continuously, it needs to put into a service.
A Service[8] is an application component that can perform long-running operations in
the background and does not provide a user interface. Another application component
can start a service and it will continue to run in the background even if the user
switches to another application. In the service, it has several threads to manage
different functions in our application. The thread makes the functions can be run
synchronously. In app usage, it uses one thread called work() and I make it runs a
second again.
5.3.1.2 Usage chart
Since the chart needs to show to the user, it can run when our application starts and
destroyed by the application closes. So this function runs as activity. An Activity[9] is
an application component that provides a screen with which users can interact in order
to do something. Each activity is given a window in which to draw its user interface.
We use a Fragment to make up four functions. So I draw the chart in the fragment is
like that:
public View onCreateView(LayoutInflater inflater, ViewGroup container,
Bundle savedInstanceState) {
v = inflater.inflate(R.layout.chart, container, false);
return mainActivity.getChartData();
}
The getChartData() function is in the mainActivity class. This function contains
another function which is prepared the chart’s data called openCharts().
Manage Your Mobile Time
19 of 29 08 October 2014
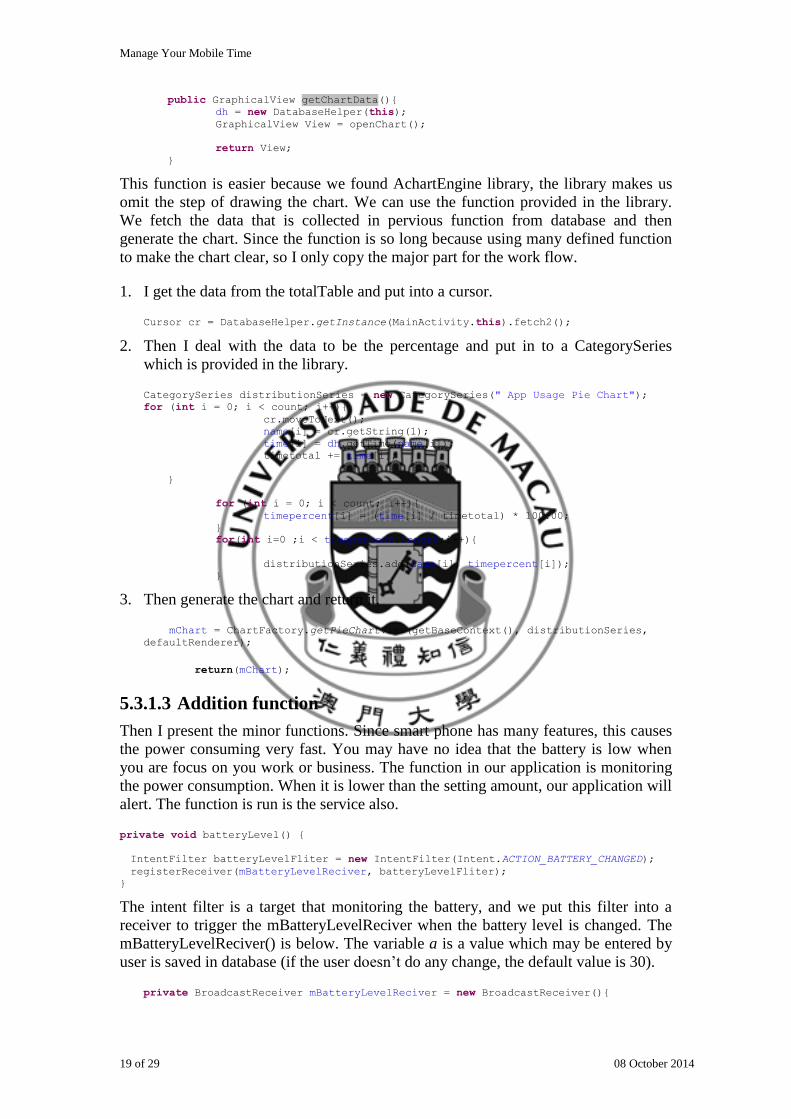
public GraphicalView getChartData(){
dh = new DatabaseHelper(this);
GraphicalView View = openChart();
return View;
}
This function is easier because we found AchartEngine library, the library makes us
omit the step of drawing the chart. We can use the function provided in the library.
We fetch the data that is collected in pervious function from database and then
generate the chart. Since the function is so long because using many defined function
to make the chart clear, so I only copy the major part for the work flow.
1. I get the data from the totalTable and put into a cursor.
Cursor cr = DatabaseHelper.getInstance(MainActivity.this).fetch2();
2. Then I deal with the data to be the percentage and put in to a CategorySeries
which is provided in the library.
CategorySeries distributionSeries = new CategorySeries(" App Usage Pie Chart");
for (int i = 0; i < count; i++){
cr.moveToNext();
name[i] = cr.getString(1);
time[i] = dh.getTime(name[i]);
timetotal += time[i];
}
for (int i = 0; i < count; i++){
timepercent[i] = (time[i] / timetotal) * 100.00;
}
for(int i=0 ;i < timepercent.length;i++){
distributionSeries.add(name[i], timepercent[i]);
}
3. Then generate the chart and return it.
mChart = ChartFactory.getPieChartView(getBaseContext(), distributionSeries,
defaultRenderer);
return(mChart);
5.3.1.3 Addition function
Then I present the minor functions. Since smart phone has many features, this causes
the power consuming very fast. You may have no idea that the battery is low when
you are focus on you work or business. The function in our application is monitoring
the power consumption. When it is lower than the setting amount, our application will
alert. The function is run is the service also.
private void batteryLevel() {
IntentFilter batteryLevelFliter = new IntentFilter(Intent.ACTION_BATTERY_CHANGED);
registerReceiver(mBatteryLevelReciver, batteryLevelFliter);
}
The intent filter is a target that monitoring the battery, and we put this filter into a
receiver to trigger the mBatteryLevelReciver when the battery level is changed. The
mBatteryLevelReciver() is below. The variable a is a value which may be entered by
user is saved in database (if the user doesn’t do any change, the default value is 30).
private BroadcastReceiver mBatteryLevelReciver = new BroadcastReceiver(){
Manage Your Mobile Time
20 of 29 08 October 2014
@Override
public void onReceive(Context context, Intent intent) {
dh = new DatabaseHelper(context);
int rawLevel = intent.getIntExtra(BatteryManager.EXTRA_LEVEL, -1);
int scale = intent.getIntExtra(BatteryManager.EXTRA_SCALE, -1);
int percent = -1;
if (rawLevel >= 0 && scale > 0) {
percent = (rawLevel * 100) / scale;
}
if (percent <= a){
if (dh.getType() == 1){
dialog(1);
}else if (dh.getType() == 2){
notifyBar();
}
a = a-5;
}
}
};
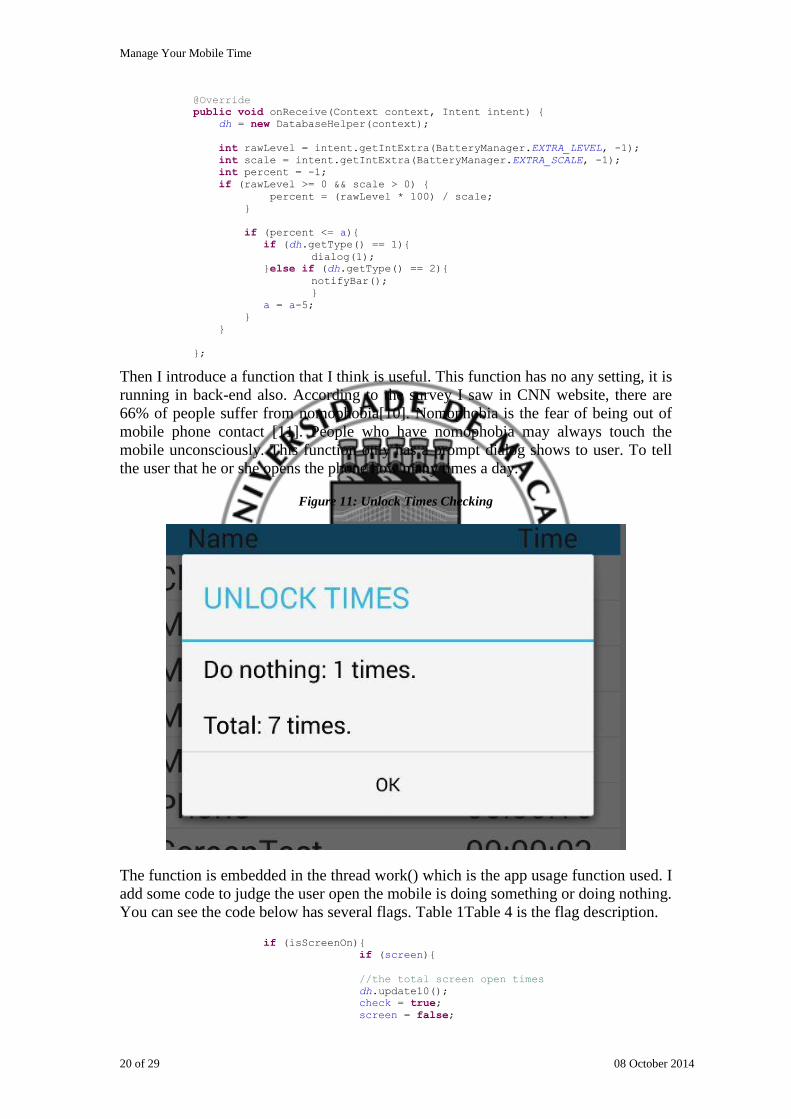
Then I introduce a function that I think is useful. This function has no any setting, it is
running in back-end also. According to the survey I saw in CNN website, there are
66% of people suffer from nomophobia[10]. Nomophobia is the fear of being out of
mobile phone contact [11]. People who have nomophobia may always touch the
mobile unconsciously. This function only has a prompt dialog shows to user. To tell
the user that he or she opens the phone how many times a day.
Figure 11: Unlock Times Checking
The function is embedded in the thread work() which is the app usage function used. I
add some code to judge the user open the mobile is doing something or doing nothing.
You can see the code below has several flags. Table 1Table 4 is the flag description.
if (isScreenOn){
if (screen){
//the total screen open times
dh.update10();
check = true;
screen = false;
Manage Your Mobile Time
21 of 29 08 October 2014
}
s1 = getInfo();
if (!s1.equals(s2)){
check = false;
//some code omitted
…
}
}else{
//some code omitted
…
if (check){
//do nothing
dh.update10a();
check = false;
}
screen = true;
}
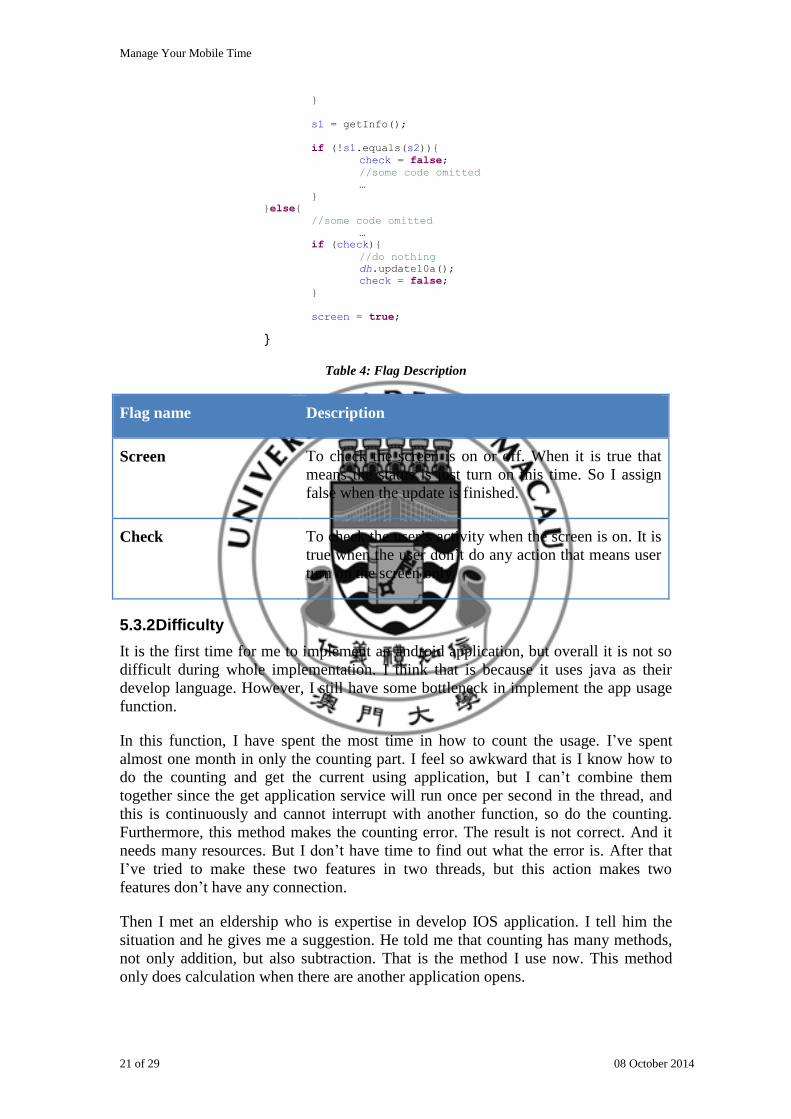
Table 4: Flag Description
Flag name Description
Screen To check the screen is on or off. When it is true that
means the status is just turn on this time. So I assign
false when the update is finished.
Check To check the user’s activity when the screen is on. It is
true when the user don’t do any action that means user
turn on the screen only.
5.3.2 Difficulty
It is the first time for me to implement an android application, but overall it is not so
difficult during whole implementation. I think that is because it uses java as their
develop language. However, I still have some bottleneck in implement the app usage
function.
In this function, I have spent the most time in how to count the usage. I’ve spent
almost one month in only the counting part. I feel so awkward that is I know how to
do the counting and get the current using application, but I can’t combine them
together since the get application service will run once per second in the thread, and
this is continuously and cannot interrupt with another function, so do the counting.
Furthermore, this method makes the counting error. The result is not correct. And it
needs many resources. But I don’t have time to find out what the error is. After that
I’ve tried to make these two features in two threads, but this action makes two
features don’t have any connection.
Then I met an eldership who is expertise in develop IOS application. I tell him the
situation and he gives me a suggestion. He told me that counting has many methods,
not only addition, but also subtraction. That is the method I use now. This method
only does calculation when there are another application opens.

Manage Your Mobile Time
22 of 29 08 October 2014
CHAPTER 6. EVALUATION
6.1 Testing
We use android mobile too. So we use our mobile for testing. The app has been tested
for two weeks. When all the function is getting finished, our supervisor gives us an
advice that is to put on the application store. Our application has released on Google
play for two weeks. There are eight users have downloaded our application, and we
keep to update it about once or twice a week according to the users' error report. So
our application has been tested for one month. We hope our application can not only
be used for many different mobile, but also will widely be used.
For the testing, we don’t have any test plan because every device is different. My
partner and me both use Samsung mobile. My friend use android mobile also but the
mobile is Sony’s product. The application released after we has tested already. It is no
problem on our mobile but my friend’s mobile cannot open our application. It is
difficult to judge the successful rate.
I think release the application on Google play is good. If we only use two mobiles for
testing, we only do a specification change. I realize when the application has released
on Google play. It is a platform for developers provide the application to user to
download and test. Because user can report me the error, and I can see the error report
on the Google play developer console.
6.2 Comparison
We have downloaded two similar applications in the project beginning, I do some
comparisons between them and our application. these two applications are called App
Time Mini 2[12] and AppUsage[13].
First is the size of storage. Our application is very small, only is about 2 MB(see
Figure 12). Other two applications’ size is 4.75 MB and 7.24 MB(see Figure 13). The
Figures is captured from my mobile.
Figure 12: MobileTime’s size
Manage Your Mobile Time
23 of 29 08 October 2014
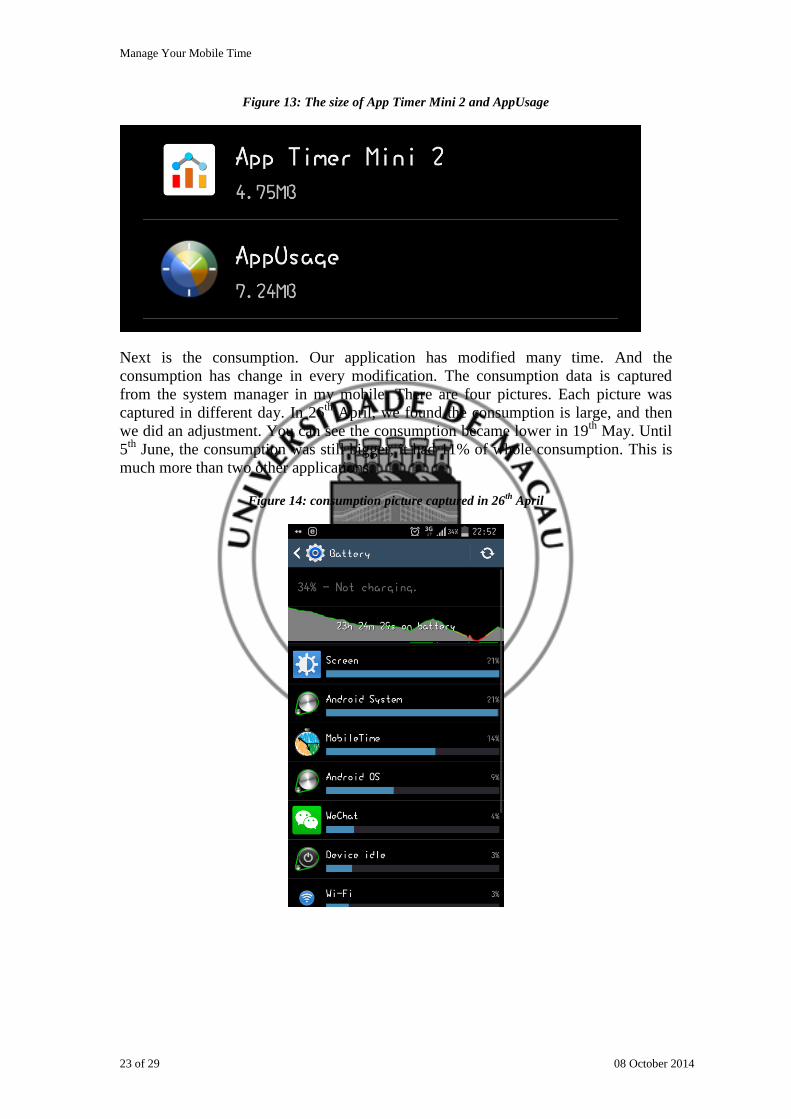
Figure 13: The size of App Timer Mini 2 and AppUsage
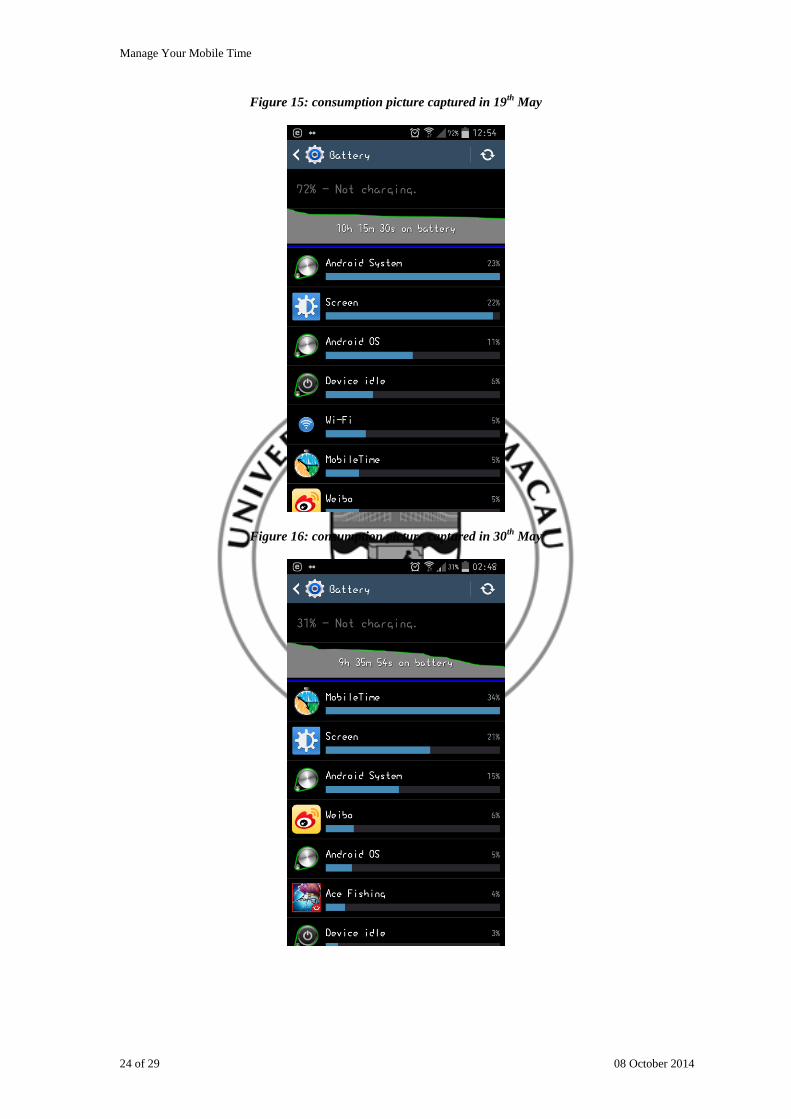
Next is the consumption. Our application has modified many time. And the
consumption has change in every modification. The consumption data is captured
from the system manager in my mobile. There are four pictures. Each picture was
captured in different day. In 26th
April, we found the consumption is large, and then
we did an adjustment. You can see the consumption became lower in 19th
May. Until
5th
June, the consumption was still bigger, it had 11% of whole consumption. This is
much more than two other applications.
Figure 14: consumption picture captured in 26th
April
Manage Your Mobile Time
24 of 29 08 October 2014
Figure 15: consumption picture captured in 19th
May
Figure 16: consumption picture captured in 30th
May
Manage Your Mobile Time
25 of 29 08 October 2014
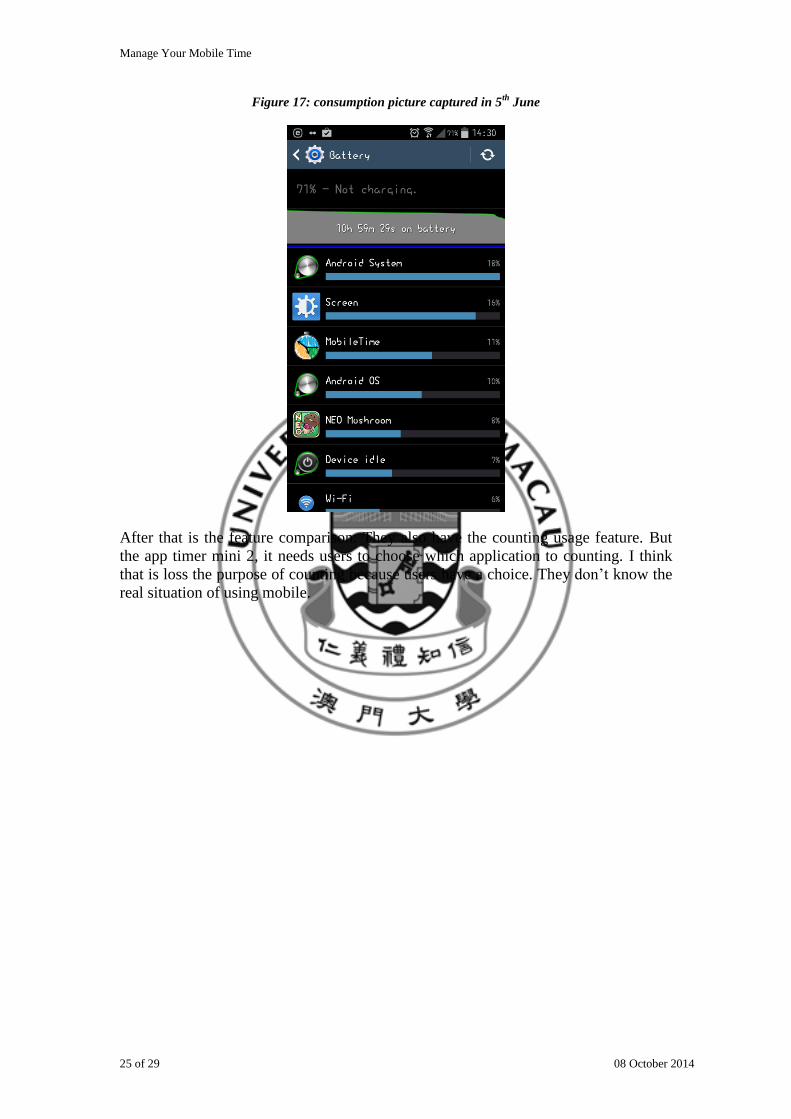
Figure 17: consumption picture captured in 5th
June
After that is the feature comparison. They also have the counting usage feature. But
the app timer mini 2, it needs users to choose which application to counting. I think
that is loss the purpose of counting because users have a choice. They don’t know the
real situation of using mobile.

Manage Your Mobile Time
26 of 29 08 October 2014
Figure 18: App Timer Mini 2 page
Furthermore, App Timer Mini 2 also has a reminder. But it only supports 10 alerts in
free version. Our application is free in every feature. Users can add more than 10
records in our application’s reminder.
Figure 19: App Timer Mini 2 Alert page
Manage Your Mobile Time
27 of 29 08 October 2014
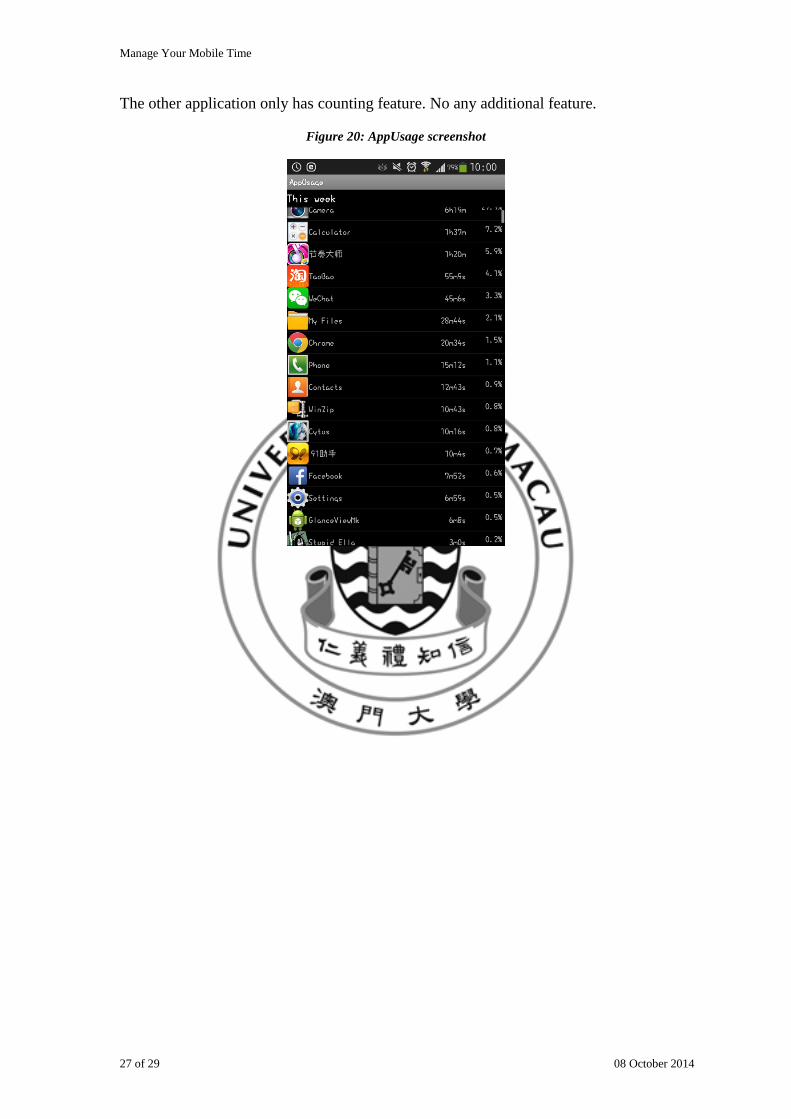
The other application only has counting feature. No any additional feature.
Figure 20: AppUsage screenshot
Manage Your Mobile Time
28 of 29 08 October 2014
CHAPTER 7. SUMMARY
7.1 Future work
We still have many ideas to implement in our application. Since we are still a novice
and we need time to study android system. If we have more time, I will implement the
application in more detail.
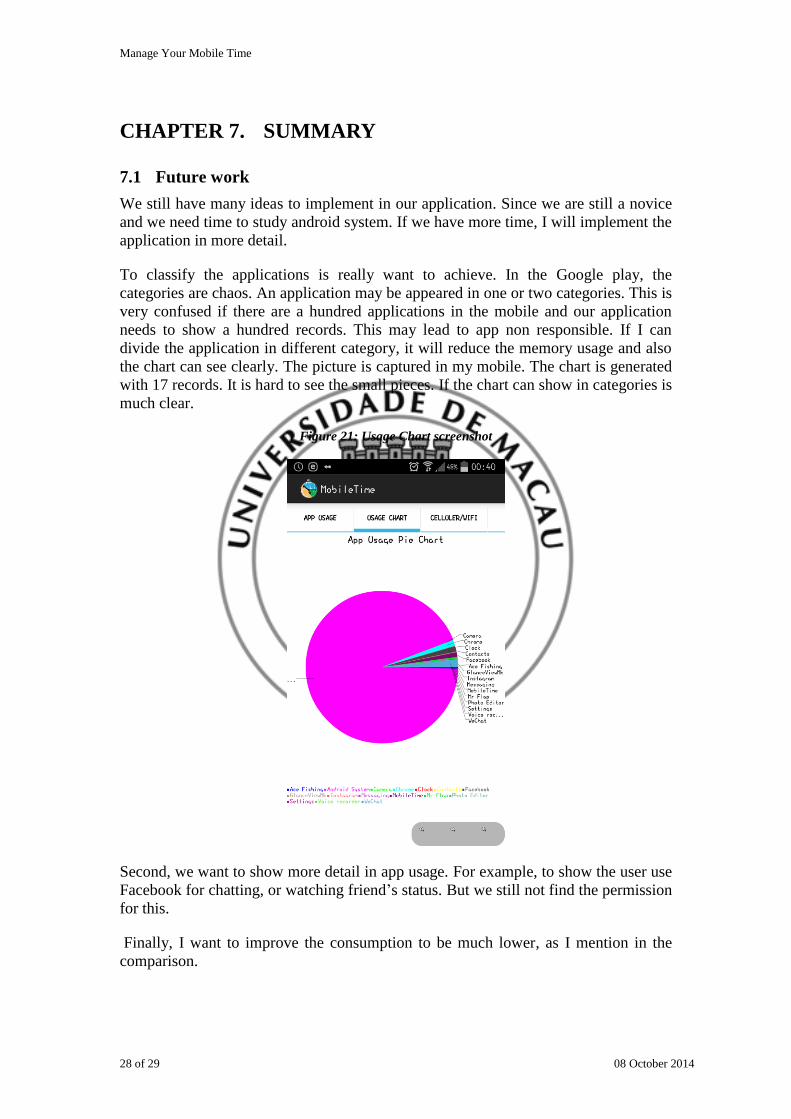
To classify the applications is really want to achieve. In the Google play, the
categories are chaos. An application may be appeared in one or two categories. This is
very confused if there are a hundred applications in the mobile and our application
needs to show a hundred records. This may lead to app non responsible. If I can
divide the application in different category, it will reduce the memory usage and also
the chart can see clearly. The picture is captured in my mobile. The chart is generated
with 17 records. It is hard to see the small pieces. If the chart can show in categories is
much clear.
Figure 21: Usage Chart screenshot
Second, we want to show more detail in app usage. For example, to show the user use
Facebook for chatting, or watching friend’s status. But we still not find the permission
for this.
Finally, I want to improve the consumption to be much lower, as I mention in the
comparison.
Manage Your Mobile Time
29 of 29 08 October 2014
7.2 Conclusion
In this project, I’ve learnt so much. I know that there is no such perfect application or
software in the world unless the developer keeps update. Each application needs
maintenance, there must be some bugs that the developer do not know. A perfect
application needs to be testing a thousand times or more to be complete.
We’ve successful to implement the application but there is still some inadequate. If
we have more time to check out the method, we can finish the future work above.
Then the application will be perfect.
Last but not least, I want to thank my partner doing this project with me. We usually
discuss for a long time. We studied how to implement an android application together.
Also, thanks my supervisor, Dr. Sofia Zhuang, she gives us many suggestions to help
us to think more in detail and improve the application’s feature.
Manage Your Mobile Time
30 of 29 08 October 2014
CHAPTER 8. REFERENCES
[1] Eclipse, “Eclipse - The Eclipse foundation open source community website”, [Online], Avaliable: https://www.eclipse.org/
[2]Android, “Android SDK | Android Developers”, [Online], Avaliable: http://developer.android.com/sdk/index.html
[3]Oracle, “Java SE | Oracle Technology Network | Oracle”, [Online], Avalicable: http://www.oracle.com/technetwork/java/javase/overview/index.html
[4]Android, “ADT Plugin | Android Developers”, [Online], Avaliable: http://developer.android.com/tools/sdk/eclipse-adt.html
[5]AChartEngine, “achatenine.org – News”, [Online], Avaliable: http://www.achartengine.org/index.html
[6]Genymotion, “Genymotion”, [Online], Avaliable: http://www.genymotion.com/
[7]SQLite, “SQLite Home Page”, [Online], Avaliable: http://www.sqlite.org/
[8]Android, “Services | Android Developers”, [Online], Avaliable: http://developer.android.com/guide/components/services.html
[9]Android, “Activities | Android Developers”, [Online], Avaliable: http://developer.android.com/guide/components/activities.html
[10]CNN, “Rise of ‘nomophobia’: More people fear loss of mobile contact”, [Online], Avaliable: http://edition.cnn.com/2012/03/06/tech/mobile/nomophobia-mobile-addiction/
[11]SecurEnvoy, “66% of the population suffer from Nomophobia the fear of being without their phone”, [Online], Avaliable: https://www.securenvoy.com/blog/2012/02/16/66-of-the-population-suffer-from-nomophobia-the-fear-of-being-without-their-phone/
[12]KF Software House, “App Timer Mini 2 – Android App on Google Play”, [Online]. Avaliable: https://play.google.com/store/apps/details?id=info.kfsoft.android.AppTimer2
[13]Smartapers.com, “AppUsage – Android App on Google Play”, [Online], Avaliable: https://play.google.com/store/apps/details?id=com.smartappers.appusage
[14] Ho Sin Nga, my partner