Embed Size (px)
Citation preview
BBAV - Semester
104 52
Directorate of Distance Education
MANAGEMENT ACCOUNTING
ALAGAPPA UNIVERSITY[Accredited with ‘A+’ Grade by NAAC (CGPA:3.64) in the Third Cycle
and Graded as Category–I University by MHRD-UGC]
(A State University Established by the Government of Tamil Nadu)
KARAIKUDI – 630 003
All rights reserved. No part of this publication which is material protected by this copyright notice may be reproduced or transmitted or utilized or stored in any form or by any means now known or hereinafter invented, electronic, digital or mechanical, including photocopying, scanning, recording or by any information storage or retrieval system, without prior written permission from the Alagappa University, Karaikudi, Tamil Nadu.
Information contained in this book has been published by VIKAS® Publishing House Pvt. Ltd. and has been obtained by its Authors from sources believed to be reliable and are correct to the best of their knowledge. However, the Alagappa University, Publisher and its Authors shall in no event be liable for any errors, omissions or damages arising out of use of this information and specifically disclaim any implied warranties or merchantability or fitness for any particular use.
Vikas® is the registered trademark of Vikas® Publishing House Pvt. Ltd.
VIKAS® PUBLISHING HOUSE PVT. LTD.E-28, Sector-8, Noida - 201301 (UP)Phone: 0120-4078900 • Fax: 0120-4078999Regd. Office: A-27, 2nd Floor, Mohan Co-operative Industrial Estate, New Delhi 1100 44• Website: www.vikaspublishing.com • Email: [email protected]
Work Order No.AU/DDE/DE12-27/Preparation and Printing of Course Materials/2020 Dated 12.08.2020 Copies 600
“The copyright shall be vested with Alagappa University”
AuthorsM A Sahaf, Professor, The Business School University of Kashmir, SrinagarUnits (1-13) Dr Bhavesh M Patel, Director, Post Graduate Institute of Management and Dean, Amrut Mody School of Management Ahmedabad University, Gujarat Unit (14)
Reviewer Dr. G. Nedumaran Professor of Commerce,
Alagappa University, Karaikudi, Tamil Nadu.
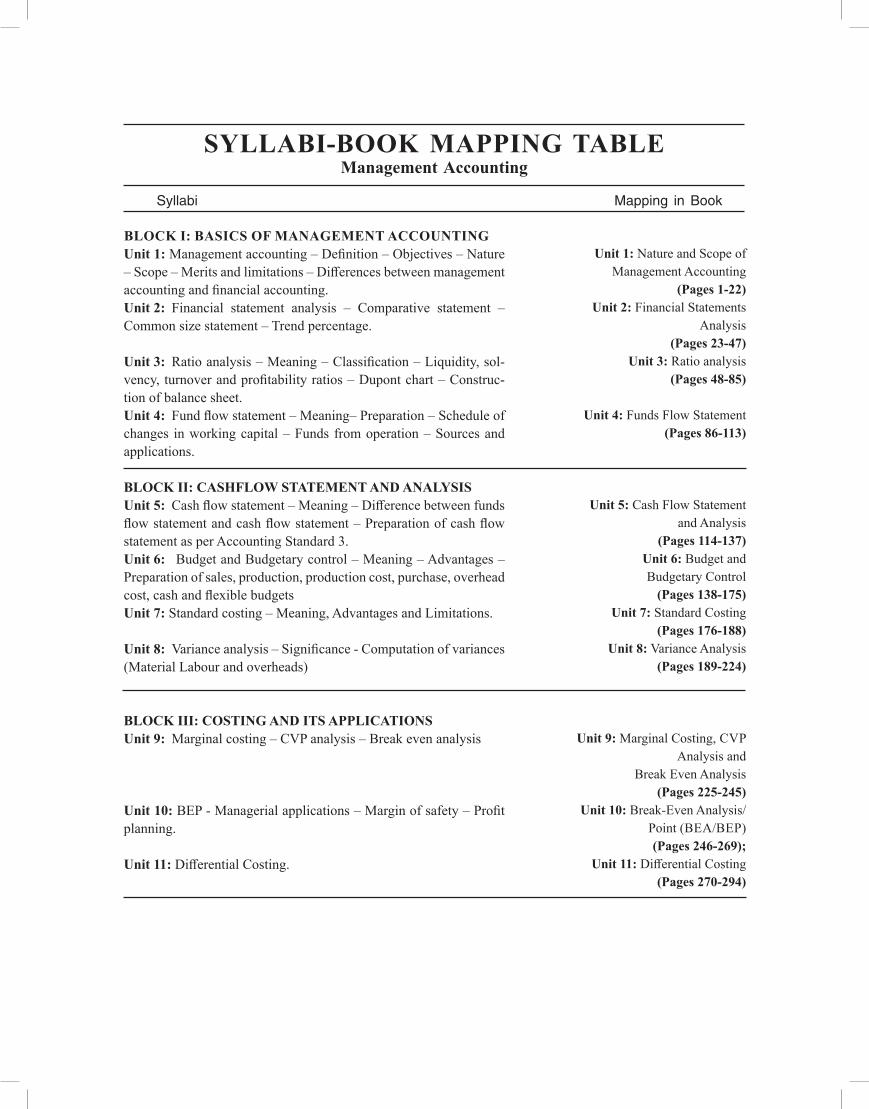
SYLLABI-BOOK MAPPING TABLE Management Accounting
BLOCK I: BASICS OF MANAGEMENT ACCOUNTINGUnit 1: Management accounting – Definition – Objectives – Nature – Scope – Merits and limitations – Differences between management accounting and financial accounting. Unit 2: Financial statement analysis – Comparative statement – Common size statement – Trend percentage.
Unit 3: Ratio analysis – Meaning – Classification – Liquidity, sol-vency, turnover and profitability ratios – Dupont chart – Construc-tion of balance sheet.Unit 4: Fund flow statement – Meaning– Preparation – Schedule of changes in working capital – Funds from operation – Sources and applications.
BLOCK II: CASHFLOW STATEMENT AND ANALYSISUnit 5: Cash flow statement – Meaning – Difference between funds flow statement and cash flow statement – Preparation of cash flow statement as per Accounting Standard 3.Unit 6: Budget and Budgetary control – Meaning – Advantages – Preparation of sales, production, production cost, purchase, overhead cost, cash and flexible budgets Unit 7: Standard costing – Meaning, Advantages and Limitations.
Unit 8: Variance analysis – Significance - Computation of variances (Material Labour and overheads)
BLOCK III: COSTING AND ITS APPLICATIONSUnit 9: Marginal costing – CVP analysis – Break even analysis
Unit 10: BEP - Managerial applications – Margin of safety – Profit planning.
Unit 11: Differential Costing.
Syllabi Mapping in Book
Unit 1: Nature and Scope of Management Accounting
(Pages 1-22)Unit 2: Financial Statements
Analysis (Pages 23-47)
Unit 3: Ratio analysis (Pages 48-85)
Unit 4: Funds Flow Statement (Pages 86-113)
Unit 5: Cash Flow Statement and Analysis
(Pages 114-137)Unit 6: Budget and Budgetary Control
(Pages 138-175)Unit 7: Standard Costing
(Pages 176-188)Unit 8: Variance Analysis
(Pages 189-224)
Unit 9: Marginal Costing, CVP
Analysis and Break Even Analysis
(Pages 225-245)Unit 10: Break-Even Analysis/
Point (BEA/BEP) (Pages 246-269);
Unit 11: Differential Costing (Pages 270-294)
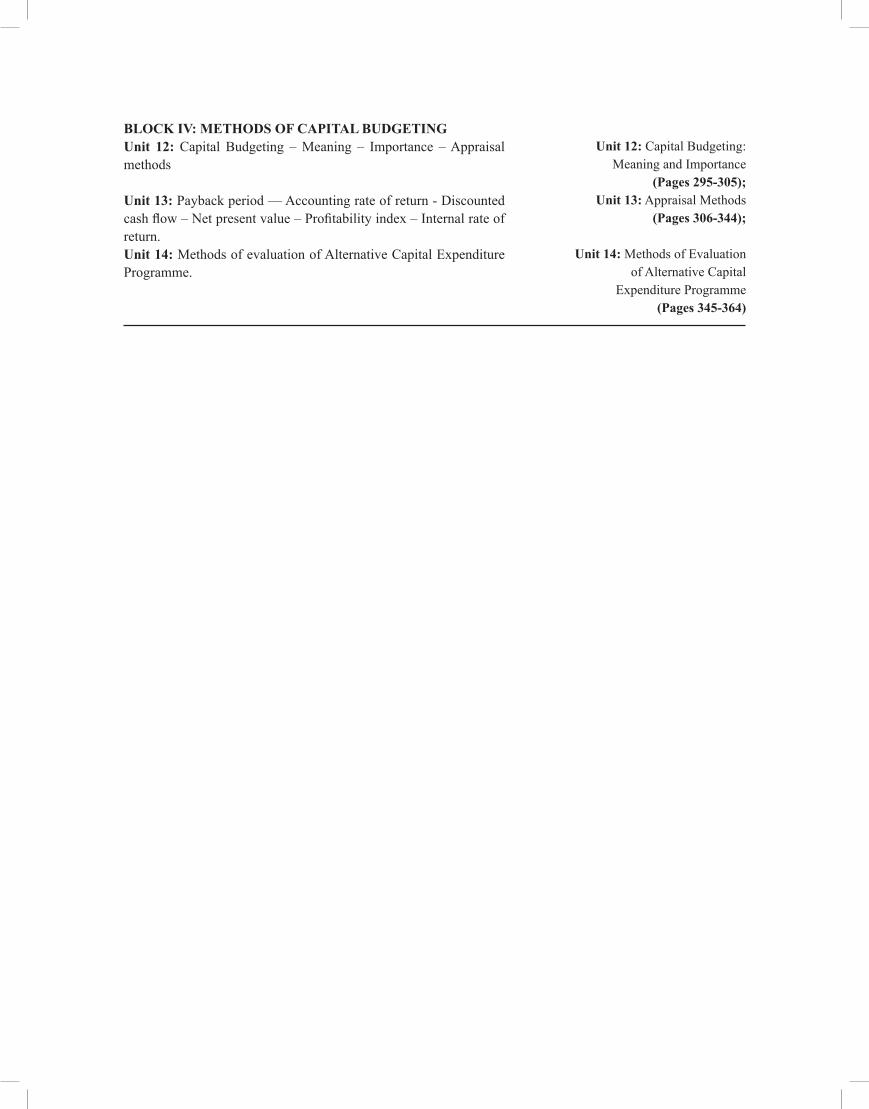
BLOCK IV: METHODS OF CAPITAL BUDGETINGUnit 12: Capital Budgeting – Meaning – Importance – Appraisal methods
Unit 13: Payback period –– Accounting rate of return - Discounted cash flow – Net present value – Profitability index – Internal rate of return.Unit 14: Methods of evaluation of Alternative Capital Expenditure Programme.
Unit 12: Capital Budgeting: Meaning and Importance
(Pages 295-305);Unit 13: Appraisal Methods
(Pages 306-344);
Unit 14: Methods of Evaluation of Alternative Capital
Expenditure Programme (Pages 345-364)
INTRODUCTION
BLOCK I: BASICS OF MANAGEMENT ACCOUNTING
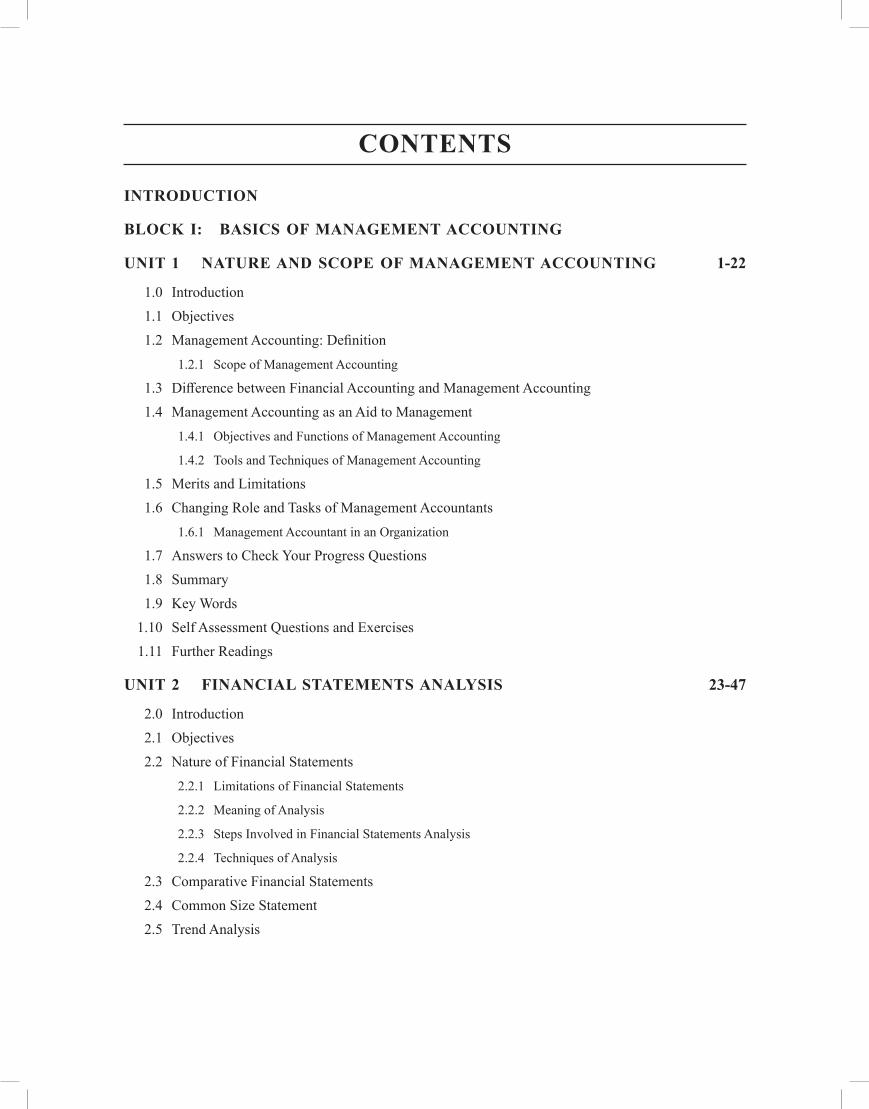
UNIT 1 NATURE AND SCOPE OF MANAGEMENT ACCOUNTING 1-22
1.0 Introduction 1.1 Objectives 1.2 Management Accounting: Definition
1.2.1 Scope of Management Accounting
1.3 Difference between Financial Accounting and Management Accounting 1.4 Management Accounting as an Aid to Management
1.4.1 Objectives and Functions of Management Accounting
1.4.2 Tools and Techniques of Management Accounting
1.5 Merits and Limitations 1.6 Changing Role and Tasks of Management Accountants
1.6.1 Management Accountant in an Organization
1.7 Answers to Check Your Progress Questions 1.8 Summary 1.9 Key Words 1.10 Self Assessment Questions and Exercises 1.11 Further Readings
UNIT 2 FINANCIAL STATEMENTS ANALYSIS 23-47
2.0 Introduction 2.1 Objectives 2.2 Nature of Financial Statements
2.2.1 Limitations of Financial Statements
2.2.2 Meaning of Analysis
2.2.3 Steps Involved in Financial Statements Analysis
2.2.4 Techniques of Analysis
2.3 Comparative Financial Statements 2.4 Common Size Statement 2.5 Trend Analysis
CONTENTS
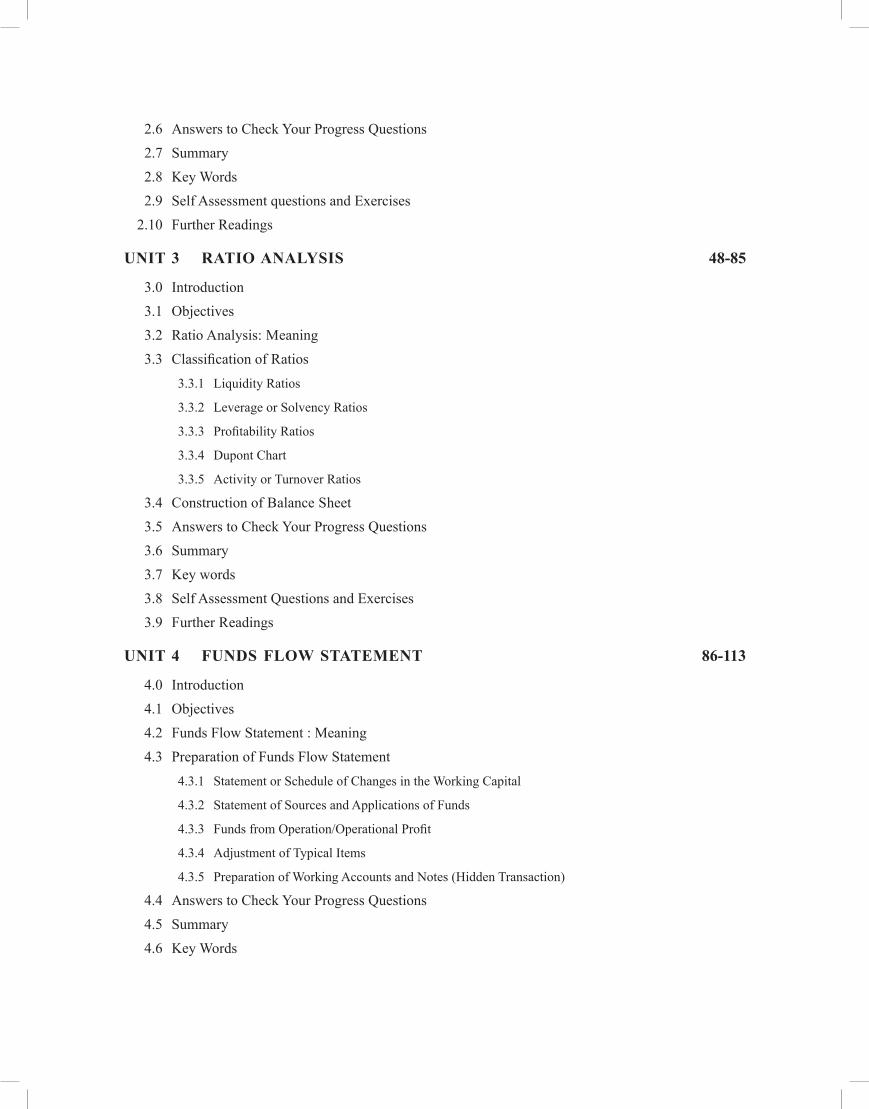
2.6 Answers to Check Your Progress Questions 2.7 Summary 2.8 Key Words 2.9 Self Assessment questions and Exercises 2.10 Further Readings
UNIT 3 RATIO ANALYSIS 48-85
3.0 Introduction 3.1 Objectives 3.2 Ratio Analysis: Meaning 3.3 Classification of Ratios
3.3.1 Liquidity Ratios
3.3.2 Leverage or Solvency Ratios
3.3.3 Profitability Ratios
3.3.4 Dupont Chart
3.3.5 Activity or Turnover Ratios
3.4 Construction of Balance Sheet 3.5 Answers to Check Your Progress Questions 3.6 Summary 3.7 Key words 3.8 Self Assessment Questions and Exercises 3.9 Further Readings
UNIT 4 FUNDS FLOW STATEMENT 86-113
4.0 Introduction 4.1 Objectives 4.2 Funds Flow Statement : Meaning 4.3 Preparation of Funds Flow Statement
4.3.1 Statement or Schedule of Changes in the Working Capital
4.3.2 Statement of Sources and Applications of Funds
4.3.3 Funds from Operation/Operational Profit
4.3.4 Adjustment of Typical Items
4.3.5 Preparation of Working Accounts and Notes (Hidden Transaction)
4.4 Answers to Check Your Progress Questions 4.5 Summary 4.6 Key Words
4.7 Self Assessment Question and Exercises 4.8 Further Readings
BLOCK II: CASH FLOW STATEMENT AND ANALYSIS
UNIT 5 CASH FLOW STATEMENT AND ANALYSIS 114-137
5.0 Introduction 5.1 Objectives 5.2 Meaning Of Cash Flow Statement
5.2.1 Difference between Cash Flow Statement and Fund Flow Statement
5.2.2 Concept of Cash Flow
5.2.3 Sources and Application of Cash
5.2.4 Calculation of Cash From Operations
5.2.5 Forms of Cash Flow Statement
5.3 Preparation Of Cash Flow Statement as per AS 3 5.4 Answers to Check Your Progress Questions 5.5 Summary 5.6 Key Words 5.7 Self Assessment Questions and Exercises 5.8 Further Readings
UNIT 6 BUDGET AND BUDGETARY CONTROL 138-175
6.0 Introduction 6.1 Objectives 6.2 Budget and Budgetary Control: Meaning
6.2.1 Advantages and Limitations of Budgetary Control
6.2.2 Essential Characteristics of a Good Budgetary Control
6.3 Classification and Preparation of Budgets 6.3.1 Sales Budget
6.3.2 Production Budget
6.3.3 Production Cost Purchase and Overheads Budget
6.3.4 Cash Budget
6.4 Answers to Check Your Progress Questions 6.5 Summary 6.6 Key Words
6.7 Self Assessment Questions and Exercises 6.8 Further Readings
UNIT 7 STANDARD COSTING 176-188
7.0 Introduction 7.1 Objectives 7.2 Meaning of Standard Costing
7.2.1 Advantages and Limitations of Standard Costing
7.3 The Standard Costing System 7.4 Answers to Check Your Progress Questions 7.5 Summary 7.6 Key Words 7.7 Self Assessment Questions and Exercises 7.8 Further Readings
UNIT 8 VARIANCE ANALYSIS 189-224
8.0 Introduction 8.1 Objectives 8.2 Variances Analysis : Meaning, Significance and Types 8.3 Direct Material Variance 8.4 Labour Variances 8.5 Overhead Variance 8.6 Practical Problems 8.7 Answers to Check Your Progress Questions 8.8 Summary 8.9 Key Words 8.10 Self Assessment questions and Exercise 8.11 Further Readings
BLOCK III: COSTING AND ITS APPLICATIONS
UNIT 9 MARGINAL COSTING, CVP ANALYSIS AND BREAK EVEN ANALYSIS 225-245
9.0 Introduction 9.1 Objectives 9.2 Concept of Marginal Costing
9.2.1 Advantages and Disadvantages of Marginal Costing
9.2.2 Contribution
9.2.3 Marginal Cost Equation
9.2.4 Profit/Volume Ratio (P/V Ratio)
9.3 Managerial Application of Marginal Costing 9.4 CVP Analysis And Break Even Analysis 9.5 Answers to Check Your Progress Questions 9.6 Summary 9.7 Key Words 9.8 Self Assessment Questions and Exercises 9.9 Further Readings
UNIT 10 BREAK-EVEN ANALYSIS/POINT (BEA/BEP) 246-269
10.0 Introduction 10.1 objectives 10.2 Concept of Break-Even Point/Analysis
10.2.1 Managerial Applications and Profit Planning
10.2.2 Assumptions, Advantages and Limitations
10.2.3 Margin of Safety
10.2.4 Angle of Incidence
10.2.5 Profit-Volume Graph
10.3 Answers to Check Your Progress 10.4 Summary 10.5 Key Words 10.6 Self Assessment Questions and Exercises 10.7 Further Readings
UNIT 11 DIFFERENTIAL COSTING 270-294
11.0 Introduction 11.1 Objectives 11.2 Nature and Scope of Differential Costing 11.3 Decision Making Process 11.4 Application of Differential Costing 11.5 Answers to Check Your Progress 11.6 Summary 11.7 Key Words
11.8 Self Assessment Questions and Exercises 11.9 Further Readings
BLOCK IV: METHODS OF CAPITAL BUDGETING
UNIT 12 CAPITAL BUDGETING: MEANING AND IMPORTANCE 295-305
12.0 Introduction 12.1 Objectives 12.2 Capital Budgeting: Meaning
12.2.1 Importance
12.2.2 Steps in Capital Budgeting Process
12.2.3 Objectives of Capital Budgeting Programmes
12.2.4 Kinds of Proposals
12.2.5 Appraisal Methods
12.3 Answers To Check Your Progress 12.4 Summary 12.5 Key Words 12.6 Self Assessment Questions and Exercises 12.7 Further Readings
UNIT 13 APPRAISAL METHODS 306-344
13.0 Introduction 13.1 Objectives 13.2 Methods of Evaluation or Appraisal 13.3 Non-discounted Cash Flow Method
13.3.1 Payback and Payback Reciprocal Method
13.3.2 Accounting Rate of Return
13.4 Discounted Cash Flow (Time-adjusted) Method 13.4.1 The Net Present Value Method
13.4.2 Internal Rate of Return (IRR) Method
13.4.3 Profitability Index
13.5 Practical Problems 13.6 Answers to Check Your Progress Questions 13.7 Summary 13.8 Key Words
13.9 Self Assesment Questions and Exercises 13.10 Further Readings
UNIT 14 METHODS OF EVALUATION OF ALTERNATIVE CAPITAL EXPENDITURE PROGRAMME 345-364
14.0 Introduction 14.1 Objectives 14.2 Economic Rate of Return (ERR): Economic Cost-Benefit Analysis 14.3 Social Rate of Return (SRR): Social Cost-Benefit Analysis 14.4 Capital Amortization Schedule (CAS) 14.5 Risk Adjusted Discount Rate (RADR)
14.5.1 Intuitive Approach
14.5.2 Constant Share Price Approach
14.5.3 CAPM Aapproach
14.5.4 Adjusted WACC approach
14.6 Answers to Check Your Progress Questions 14.7 Summary 14.8 Key Words 14.9 Self Assessment Questions and Exercises 14.10 Further Readings
Introduction
NOTES
Self-Instructional 12 Material
INTRODUCTION
Management accounting is a vast subject and encompasses all that accounting information which helps management in planning, controlling, decision making and performance measurement of business operations. CIMA has observed that management accounting combines accounting with finance and management with the leading edge techniques needed to drive successful business.
Management accountant plays a very important role in an organization. He analyses and interprets accounting information and meets the informational needs of management at different levels. In an organization, a management accountant generally performs a staff function, i.e., advisory role. But if he is permitted to participate in planning and decision-making, he is a part of the management team and thus becomes a part of the line function. It is very important that status of the management accountant in the organization is clearly defined so that the scope of his work and responsibilities are accordingly determined.
This book, Management Accounting, is written with the distance learning student in mind. It is presented in a user-friendly format using a clear, lucid language. Each unit contains an Introduction and a list of Objectives to prepare the student for what to expect in the text. At the end of each unit are a Summary and a list of Key Words, to aid in recollection of concepts learnt. All units contain Self-Assessment Questions and Exercises, and strategically placed Check Your Progress questions so the student can keep track of what has been discussed.
NOTES
Self-InstructionalMaterial 1
Nature and Scope of Management AccountingBLOCK - I
BASICS OF MANAGEMENT ACCOUNTING
UNIT 1 NATURE AND SCOPE OF MANAGEMENT ACCOUNTING
Structure 1.0 Introduction 1.1 Objectives 1.2 ManagementAccounting:Definition
1.2.1 Scope of Management Accounting 1.3 DifferencebetweenFinancialAccountingandManagementAccounting 1.4 Management Accounting as an Aid to Management
1.4.1 ObjectivesandFunctionsofManagementAccounting 1.4.2 ToolsandTechniquesofManagementAccounting
1.5 Merits and Limitations 1.6 ChangingRoleandTasksofManagementAccountants
1.6.1 Management Accountant in an Organization 1.7 AnswerstoCheckYourProgressQuestions 1.8 Summary 1.9 Key Words 1.10 SelfAssessmentQuestionsandExercises 1.11 FurtherReadings
1.0 INTRODUCTION
Accountingplaysacrucialroleinthefunctioningofanorganization.Itnotonlyhelpsinenhancingdecisionmakingcapabilities,butalsofacilitatestheefficientutilizationofresources.Organizationsacrosstheglobeoperateinahighlydynamicandcomplexbusinessenvironment,inwhichmanagersneedrelevantandcurrentinformationtoaidthemindecisionmaking.Accountingmust respond to the changing needs of the decision-makers in order tojustifyitsrelevanceincontemporarybusiness.Infact,thesignificanceoffinancialinformationhasalwaysbeenrecognized,butinthepresentbusinessscenario,suchinformationhasbecomearesourceparallelinimportancetofactorsofproduction.Consequently,accounting information isbecomingincreasinglycriticaltothecontinuingsuccessofanorganization.Withthegrowingimportanceofinformationasaresource,organizationshavefelttheneedforasystemthatiscapableofmanagingthisresourceefficiently.Thisis,perhaps,thebasicreasonforbusinessstudentstostudytheanatomyandoperationoftheaccountingsystem,whichprovidesinformationtomanagersfordecisionmaking.
Nature and Scope of Management Accounting
NOTES
Self-Instructional 2 Material
Modernaccountingasadynamicandgrowingfield isemergingasa strategicweapon that is helping to shape the direction and growth oforganizationsinthechangingbusinessenvironment.However,toexploreandutilizethefinancialinformationgeneratedbytheaccountingsystemofanorganizationforcompetitiveadvantage,managersmusthaveafairknowledgeofthetoolsandtechniquesthattheycanuseforanalyzingandinterpretingthe available information. Both the prerequisites of effective decisionmaking—financialinformationandanalyticaltechniques—arecoveredunderManagement Accounting, whichinvolvesthestudyofaccountinginformationandtechniquesthatmanagersuseinanalysingsuchinformation.
In this unit, youwill be introduced to the concept ofmanagementaccounting.
1.1 OBJECTIVES
Aftergoingthroughthisunit,youwillbeableto: •Discussthedefinition,objectives,natureandscopeofmanagement
accounting •Explainthedifferencesbetweenmanagementaccountingandfinancial
accounting •Describethemeritsandlimitationsofmanagementaccounting
1.2 MANAGEMENT ACCOUNTING: DEFINITION
Managementaccountingisasegmentofaccountingthatdealsspecificallywith the analysis and reportingof information tomanagement about theoperationsoftheorganizationwithanobjectivetofacilitatedecisionmaking.Ontheonehand,managementaccountingaimstoprovideadequatefinancialinformationtomanagersfordecisionmakingandontheother,itisorientedtowardsmanagerialcontrol.Managementfrequentlyrequirestimelyfinancialinformationconcerningdifferentaspectsoftheorganization,rangingfromspecialpurposereportofaspecificdepartment’soperatingperformancetothepreparationofannualbudgetsandforecasts,whichencompasstheentirebusiness.
Theterm‘managementaccounting’wasfirstformallymentionedin1950inareportentitled‘Management Accounting’,publishedbytheAnglo-AmericanCouncilofProductivityManagementAccountingTeamafteritsvisit totheUnitedStatesinthesameyear.Theteaminitsreportdefinedmanagement accounting as the presentation of accounting information in such a way as to assist management in the creation of policy and in the day-to-day operation of an undertaking.
NOTES
Self-InstructionalMaterial 3
Nature and Scope of Management Accounting
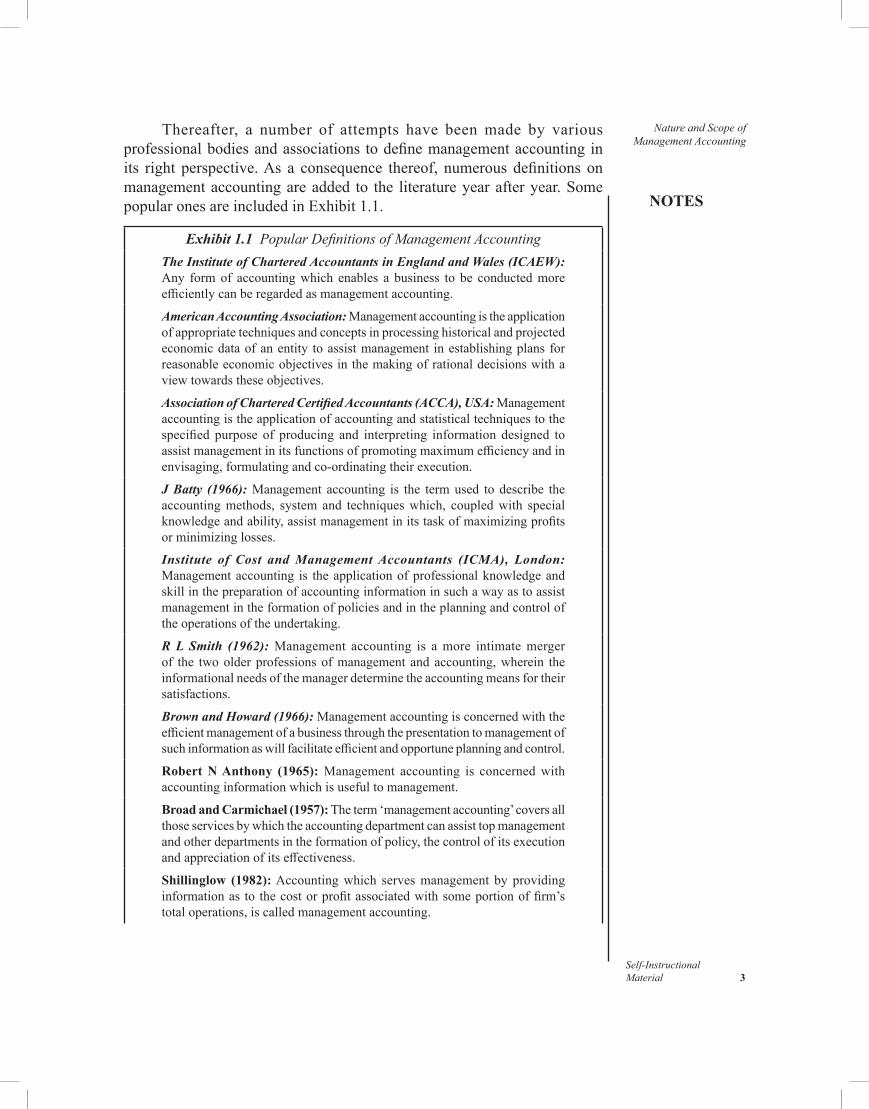
Thereafter, a number of attempts have beenmade by variousprofessionalbodiesandassociations todefinemanagementaccountinginits right perspective.As a consequence thereof, numerous definitions onmanagementaccountingareadded to the literatureyearafteryear.SomepopularonesareincludedinExhibit1.1.
Exhibit 1.1 Popular Definitions of Management AccountingThe Institute of Chartered Accountants in England and Wales (ICAEW): Any formof accountingwhich enables a business to be conductedmoreefficientlycanberegardedasmanagementaccounting.
American Accounting Association: Managementaccountingistheapplicationofappropriatetechniquesandconceptsinprocessinghistoricalandprojectedeconomicdataofanentity toassistmanagement inestablishingplansforreasonableeconomicobjectivesinthemakingofrationaldecisionswithaviewtowardstheseobjectives.
Association of Chartered Certified Accountants (ACCA), USA: Management accountingistheapplicationofaccountingandstatisticaltechniquestothespecified purpose of producing and interpreting information designed toassistmanagementinitsfunctionsofpromotingmaximumefficiencyandinenvisaging,formulatingandco-ordinatingtheirexecution.
J Batty (1966): Management accounting is the termused to describe theaccountingmethods, system and techniqueswhich, coupledwith specialknowledgeandability,assistmanagementinitstaskofmaximizingprofitsorminimizinglosses.
Institute of Cost and Management Accountants (ICMA), London: Managementaccounting is theapplicationofprofessionalknowledgeandskillinthepreparationofaccountinginformationinsuchawayastoassistmanagementintheformationofpoliciesandintheplanningandcontroloftheoperationsoftheundertaking.
R L Smith (1962): Management accounting is a more intimate merger of the twoolderprofessionsofmanagement andaccounting,wherein theinformationalneedsofthemanagerdeterminetheaccountingmeansfortheirsatisfactions.
Brown and Howard (1966): Managementaccountingisconcernedwiththeefficientmanagementofabusinessthroughthepresentationtomanagementofsuchinformationaswillfacilitateefficientandopportuneplanningandcontrol.
Robert N Anthony (1965):Management accounting is concernedwithaccountinginformationwhichisusefultomanagement.
Broad and Carmichael (1957):Theterm‘managementaccounting’coversallthoseservicesbywhichtheaccountingdepartmentcanassisttopmanagementandotherdepartmentsintheformationofpolicy,thecontrolofitsexecutionandappreciationofitseffectiveness.
Shillinglow (1982):Accountingwhich servesmanagement by providinginformationas to thecostorprofitassociatedwithsomeportionoffirm’stotaloperations,iscalledmanagementaccounting.
Nature and Scope of Management Accounting
NOTES
Self-Instructional 4 Material
T G Rose, (1957):Managementaccountingistheadaptationandanalysisofaccountinginformationanditsdiagnosisandexplanationinsuchawayasto assist management.
R H Garrison (1982):Managementaccountingisconcernedwithprovidinginformationtomanagers;thatis,tothosewhoareinsideanorganizationandwhoarechargedwithdirectingandcontrollingitsoperations.
All thesedefinitionsplace emphasis on the informationprocessinganddecisionmakingaspectsofaccounting.Theanalysisofthedefinitionsfurtherrevealsthatthesystemofmanagementaccountingisnotdesignedto appraise andmonitor the past performanceof individuals andgroupsbuttoassistmanagerialdecisionsaffectingthefuture.Thus,managementaccountingisasystemforgathering,summarizing,reportingandinterpretingaccountingdataandotherfinancial informationprimarilyfor the internalneedsofmanagement.Thus, management accounting is a system capable of generating accounting information that assists internal management in the efficient formulation, execution and appraisal of business plans that help the organizations to achieve their strategic objectives.
Thus,management accounting in addition to helpingmanagersin the decisionmaking process, facilitates them in intra-firm resourceallocations,fixationofresponsibilitiesandtheevaluationoffuturepoliciesandstrategies.Allthisbringstolightanimportantfact—thatmanagementaccountinghastoperformtwoseparate,distinctfunctionsoffinancialandmanagementreportingandthatthedataneedsforeachareoftendifferent.Fewintelligentfinancialandeconomicdecisionscanbemadeintheabsenceofthatinformationreservoir.Involvementwithbothtimedimensions,pastandfuture,placestheexecutivenearthecentreofthecontrolanddecisionmakingprocessesinanyorganization.
1.2.1 Scope of Management Accounting
Traditionally,thesubjectmatterofmanagementaccountingmainlyconsistedoffinancialstatementanalysisandcostingtheory.Asorganizationsbegantooperate in a highlydynamic and complexbusiness environment, theyrealized that the existing subjectmatter ofmanagement accountingwasinsufficienttomeetthechallengesofthechangingenvironment.Toaddressthe emerging challenges,management accounting enhanced its scopebyincluding in its ambitmany frameworks, tools and techniques borrowedfromotherdisciplinessuchaseconomics,finance,mathematics,statisticsandoperationsresearch.Thecontemporarysubjectmatterofmanagementaccountingissummarizedbelow:
Financial Accounting: Financialaccountingisaprerequisiteforanydiscussiononthesubjectofmanagementaccounting.Financialstatementsasgeneratedbyfinancialaccountingcontainenoughdatathatisconverted
NOTES
Self-InstructionalMaterial 5
Nature and Scope of Management Accounting
intoinformationbyorganizationsandusedintheirdecisionmaking.Infact,managementaccountingprovidesonlytoolsandtechniquesforinterpretationandanalysisandthemanagementaccountantsgetthedataforthepurposemainlyfromfinancialaccounting.Thus,managementaccountingcannotexistwithoutefficientfinancialaccountingsystem.
Cost Accounting: Althoughmanagers generally use financialinformationindecisionmaking,theyoftensupplementtheirdecisionswithcostinformationastheyhaverealizedthatanyactivityofanorganizationcanbedescribedbyitscost.Theymakeuseofvariouscostdatainmanagingorganizationseffectively.Infact,costaccountingisconsideredthebackboneofmanagementaccountingasitprovidestheanalyticaltoolssuchasbudgetarycontrol, standard costing,marginal costing, inventory control, operatingcosting,etc.,whichareusedbymanagementtodischargeitsresponsibilitiesefficiently.
Financial Statement Analysis: Managersfrequentlyuseinformationbasedonthedatacollectedfromfinancialstatements.Thisinformationcanbeobtainedeitherbyselectingindividualnumbersfromthestatementsorbydevelopingcertaintrendsandratios.Anyattemptinthisdirectionisreferredtoasfinancialstatementanalysis.Theanalysisandinterpretationofthedatacontainedinfinancialstatementscanprovideareadermeaningfulinsightsandconclusionsabouttheorganization.Overthepastfewdecades,numeroustechniqueshavebeendevelopedwhichareusefulfortheproperinterpretationandanalysisoffinancialstatements.
Budgeting: Budgeting, which lies at the heart ofmanagementaccounting,referstoasystematicplanfortheutilizationoforganizationalresources.Asamanagementtool,budgetingaimstocoordinateandintegratetheeffortsandactivitiesofvariousdepartmentswiththecooperationofthosewhoseektoachieveacommongoal.Infact,theorganizationsexercisetheiroperationalcontrolthroughthebudgetspreparedinadvanceforeverymajoractivityofthebusiness.
Inflation Accounting: Inflationaccountingattemptstoidentifycertaincharacteristicsofaccountingthattendtodistort thereportingoffinancialresultsduringperiodsofrapidlychangingprices.Itdevisesandimplementsappropriatemethodstoanalyseandinterprettheimpactofinflationonthebusiness transactions.
Management Reporting: Clear,informativeandtimelyreportshavealwaysbeenrecognizedasmanagerialtoolsinreachingdecisionsthatnotonlyhelptheorganizationstoimprovetheirperformancebutalsomakethebestuseoftheirresources.Thus,oneofthebasicresponsibilitiesofmanagementaccountingistokeepthemanagementwellinformedabouttheoperationsof the business.To discharge this responsibility efficiently,management
Nature and Scope of Management Accounting
NOTES
Self-Instructional 6 Material
accountingneedstopreparequarterly,half-yearlyandotherinterimreportsandsubmitthesametothemanagement.
Quantitative Techniques: Manymanagersrecognizethatthefinancialandeconomicdataavailableformanagerialdecisionscanbemoreusefulifanalysedwithhighlysophisticatedtechniquesofanalysisandevaluation.Suchtechniquesasthesubjectmatterofquantitativeanalysisallowmanagerstocreate information from theirfinancialdatabase that isnot,otherwise,available.Inadditiontothetechniquesliketimeseries,regressionanalysisandsamplingtechniques,themanagersalsomakeuseoflinearprogramming,gametheoryandqueuingtheoryforthispurpose.
Tax Accounting: Since taxation plays an important role in theprofitabilityofacommercialorganization,itisessentialforamanagementaccountanttohaveacompleteknowledgeofbusinesstaxation.Thebusinessprofitandthetaxthereonaretobeascertainedaspertheprovisionoftaxation.Thefilingoftaxreturnsandthepaymentoftaxinduetimeistheexclusiveresponsibilityofthemanagementaccountant.
Internal Audit: Internalauditasadisciplineofmanagementaccountingmakesarrangementsforperformanceappraisaloftheorganization’svariousdepartments.Thus,amanagementaccountantmustpossessknowledgeaboutthefixationofresponsibilitiesandmeasurementofresults.
Office Services: To discharge the responsibilities efficiently, amanagementaccountanthas todealwithdataprocessing,filing,copyingandduplicating.His area of responsibilities also included the evaluationandreportingabouttheutilityofdifferentofficeproceduresandmachines.
1.3 DIFFERENCE BETWEEN FINANCIAL ACCOUNTING AND MANAGEMENT ACCOUNTING
The compartmentalizationof accounting into various branches generallysoundssomewhatartificialandmisleadingasallthesebranchesareusuallydrawn from a commonpool of financial data used in preparing reportsforgroupswhoareoften involved inmakingavarietyof interdependentdecisions.Butacloseexaminationofthetwosystemsshowsthattheydifferinseveralwaysfromeachother.SomemajordifferencesbetweenthesetwoaccountingsystemsaresummarizedinExhibit1.2:
NOTES
Self-InstructionalMaterial 7
Nature and Scope of Management Accounting
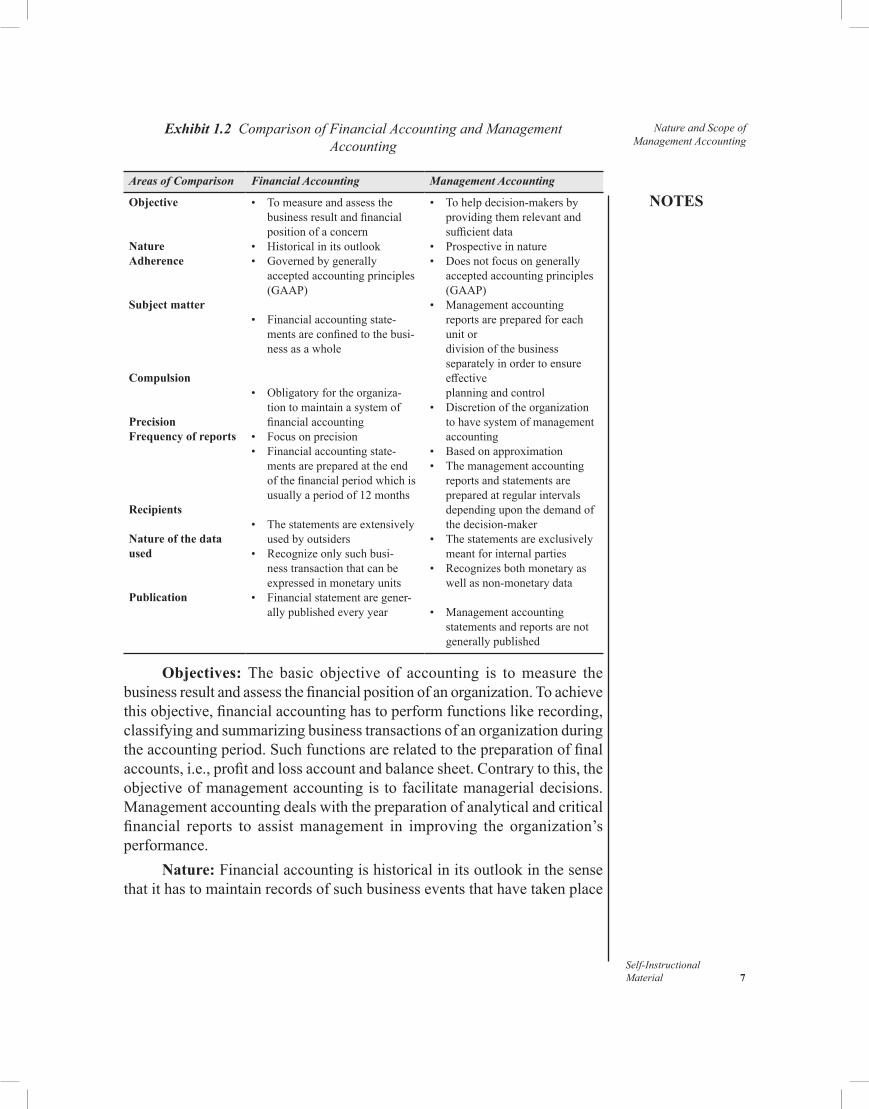
Exhibit 1.2 Comparison of Financial Accounting and Management Accounting
Areas of Comparison Financial Accounting Management Accounting
Objective
NatureAdherence
Subject matter
Compulsion
PrecisionFrequency of reports
Recipients
Nature of the data used
Publication
• Tomeasureandassessthe businessresultandfinancial position of a concern
• Historicalinitsoutlook• Governedbygenerally
acceptedaccountingprinciples(GAAP)
• Financialaccountingstate-mentsareconfinedtothebusi-nessasawhole
• Obligatoryfortheorganiza-tion to maintain a system of financialaccounting
• Focusonprecision• Financialaccountingstate-
mentsarepreparedattheendofthefinancialperiodwhichisusuallyaperiodof12months
• Thestatementsareextensivelyused by outsiders
• Recognizeonlysuchbusi-nesstransactionthatcanbeexpressedinmonetaryunits
• Financialstatementaregener-allypublishedeveryyear
• Tohelpdecision-makersby providingthemrelevantand sufficientdata
• Prospectiveinnature• Doesnotfocusongenerally
acceptedaccountingprinciples(GAAP)
• Managementaccountingreportsarepreparedforeachunit or divisionofthebusinessseparatelyinordertoensureeffective planningandcontrol
• Discretionoftheorganizationtohavesystemofmanagementaccounting
• Basedonapproximation• Themanagementaccounting
reports and statements are preparedatregularintervalsdependinguponthedemandofthedecision-maker
• Thestatementsareexclusivelymeantforinternalparties
• Recognizesbothmonetaryaswellasnon-monetarydata
• Managementaccounting statements and reports are not generallypublished
Objectives: The basic objective of accounting is tomeasure thebusinessresultandassessthefinancialpositionofanorganization.Toachievethisobjective,financialaccountinghastoperformfunctionslikerecording,classifyingandsummarizingbusinesstransactionsofanorganizationduringtheaccountingperiod.Suchfunctionsarerelatedtothepreparationoffinalaccounts,i.e.,profitandlossaccountandbalancesheet.Contrarytothis,theobjectiveofmanagementaccountingistofacilitatemanagerialdecisions.Managementaccountingdealswiththepreparationofanalyticalandcriticalfinancial reports to assistmanagement in improving the organization’sperformance.
Nature: Financialaccountingishistoricalinitsoutlookinthesensethatithastomaintainrecordsofsuchbusinesseventsthathavetakenplace
Nature and Scope of Management Accounting
NOTES
Self-Instructional 8 Material
duringtheaccountingperiod.Underfinancialaccountingsystematransactionisrecordedasandwhenittakesplace.Therefore,prospectivetransactionsarenotconsideredbeforetheirmaturityundersuchsystemofaccounting.Ontheotherhand,managementaccountingsystemisdevisedtohelpmanagersinshapingfutureoperationsofthebusiness.Itdealswithprojectionofdatatobeusedforplanninganddecisionmakingforthefuture.Thus,managementaccountinghasprospectivecharacter.
Adherence to Accounting Principles: Financialaccountingsystemisbasedonsomeaccountingprinciplesandconventionswhichafinancialaccountant has to strictly followwhile preparingfinancial accounts andstatements.Thefinancial accounting system can be result-oriented onlywhentheaccountingprinciplesandconventionshavebeenproperlyfollowedandapplied.Butmanagementaccountingisnotboundbytheconstraintsofgenerallyacceptedaccountingprinciplesandconventions.Thepreparationofreportsandstatementsundermanagementaccountingaregovernedbytherequirementsofthemanagement.Managementcanframeitsowngroundrulesandprinciplesregardingtheformandcontentofinformationrequiredforinternaluse.
Subject Matter: Financialaccountingconsidersthebusinessasoneentityandaccordinglyfinancialaccountingreportshavebeenconfinedtothebusinessoperationsasawhole.Suchstatementspresentthepositionandtheperformanceoftheentirebusiness.Whereasundermanagementaccountingsystemeachunit/department/division/costcentreofthebusinessistreatedasaseparateentityinordertoensureeffectiveplanningandcontrol.Therefore,profitabilityandperformancereportsarepreparedforeachunitordivisionofthebusinessseparately.
Compulsion: TheIndianCompaniesActhasmadeitobligatoryforthecompaniestomaintainasystemoffinancialaccounting.Atthesametime,thebenefitsasofferedbyafinancialaccountingsystemhavemadeitmoreorlesscompulsoryforthenon-companyorganization.Ontheotherhand,thesettingupofmanagementaccountingsystemisatthediscretionofthemanagement.
Precision: Financialaccountingpaysmoreemphasisonprecisionandconsidersonlyactualfiguresinthepreparationofitsstatements.Thereisnoscopeforapproximatefiguresinfinancialaccounting.Butthereportsandstatements as prepared under management accounting system contain more approximatefiguresthantheactualfigures.Thus,managementaccountingislesspreciseascomparedtofinancialaccounting.
Frequency of Reports: Thefinancial statements, the outcome offinancialaccounting,arepreparedattheendofthefinancialperiodwhichis
NOTES
Self-InstructionalMaterial 9
Nature and Scope of Management Accounting
usuallyaperiodof12months.Butthemanagementaccountingreportsandstatementsarepreparedatregularintervalssothatmanagementmaynotfaceanydifficultyindecisionmaking.Managementisconstantlyinformedaboutthebusinessperformancethroughthesereportsandstatements.Thus, thereportingfrequencyofmanagementaccountingismuchhigherascomparedtoreportingoffinancialaccounting.
Recipients: Financialstatementssuchasprofitandlossandbalancesheet, are extensively used by outsiders i.e., shareholders, creditors, taxauthorities, etc.On the other hand,management accounting reports areexclusivelymeantformanagement.Suchreportsarenoteasilyavailabletooutsiders.
Nature of Data Used: Thefinancial statements as preparedunderfinancial accounting contain only such transactions that are expressed inmonetaryterms.Thenon-monetaryeventssuchasnatureofcompetition,businessreputation,changeinfashion,arenotatallconsideredbyfinancialaccounting.Butmanagement accounting uses bothmonetary and non-monetary data.
Publication: Financialaccountingstatementsarepublishedbyalmosteverybusinessorganizationfortheinformationofthegeneralpublic.TheIndianCompaniesActhasmadeitcompulsoryforeverycompanytopublishitsfinalaccountsi.e.,profitandlossaccountandbalancesheet.Bycontrast,the publication ofmanagement accounting reports and statements is notmandatory.
Check Your Progress
1.Whatisinflationaccounting? 2.Statethefrequencyofreportstobepreparedunderfinancialand
management accounting.
1.4 MANAGEMENT ACCOUNTING AS AN AID TO MANAGEMENT
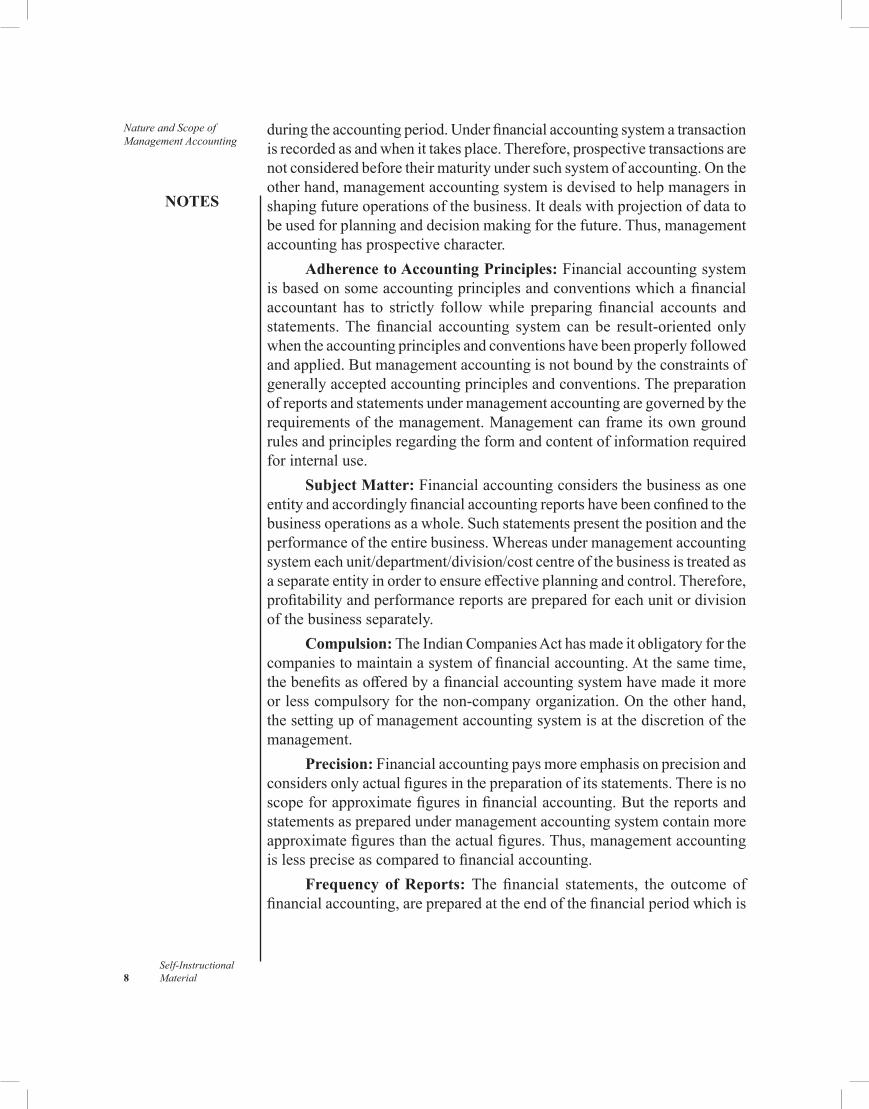
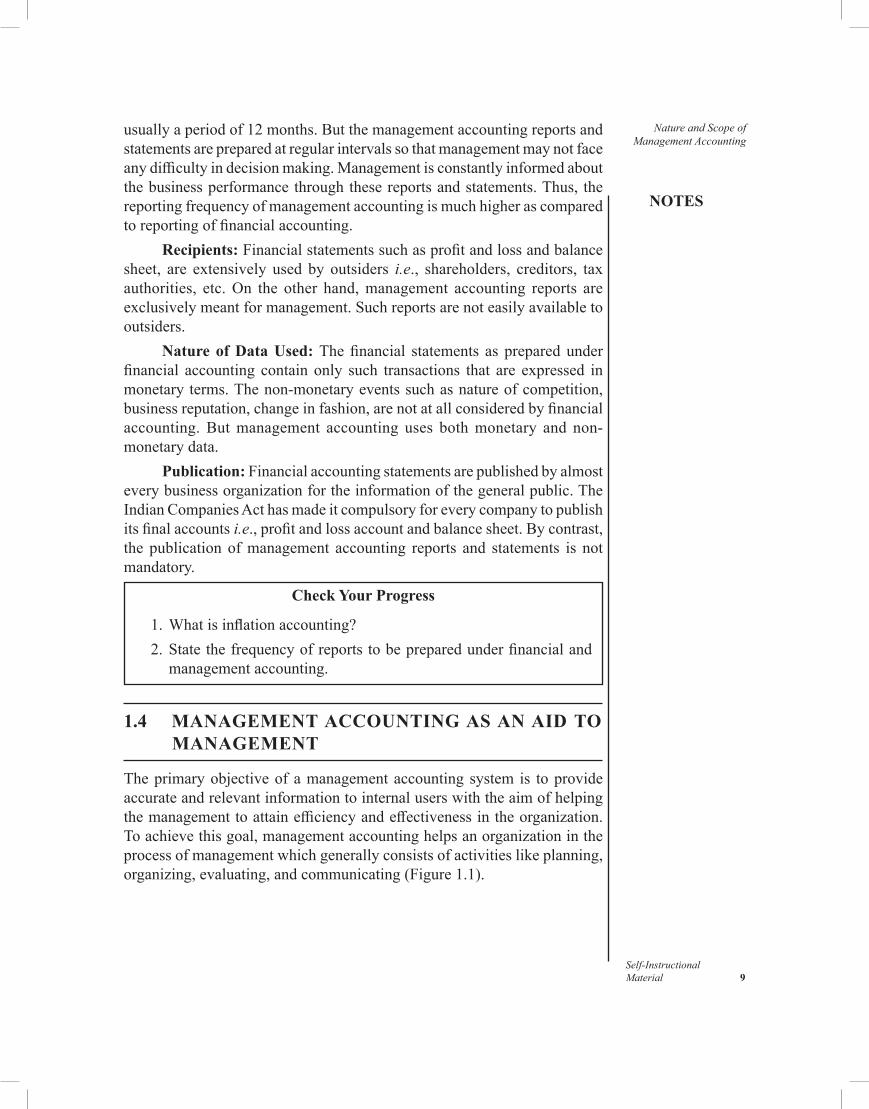
Theprimaryobjectiveofamanagementaccountingsystem is toprovideaccurateandrelevantinformationtointernaluserswiththeaimofhelpingthemanagementtoattainefficiencyandeffectivenessintheorganization.Toachievethisgoal,managementaccountinghelpsanorganizationintheprocessofmanagementwhichgenerallyconsistsofactivitieslikeplanning,organizing,evaluating,andcommunicating(Figure1.1).
Nature and Scope of Management Accounting
NOTES
Self-Instructional 10 Material
Fig. 1.1 Management Accounting as an Aid to the Management Process
Planning: Planning is an activity ofmanagement that requires theapplicationofnotonlyascientificapproachbutalsoasystemicapproachtodecisionmaking.Allorganizationsirrespectiveoftheirnatureofbusiness,needtoplanbothatstrategicandoperationallevelstoremaincompetitiveinthemarket.Sincethemostcrucialdimensionofplanningthatthemanagementofanorganizationmustfocusuponisstrategicinnature,oneofthebasicfunctionsofthemanagementaccountantistohelpmanagementnotonlyintheselectionofthecompany’sgoalsandformulationofpoliciesandstrategiesbutalsointheallocationofresourcestoachievethesegoals.Differentaccountingtechniquesareusedbythemanagementtodischargethefunctionofplanningefficiently. Important among themare cost-volume-profit analysis, directcosting,capitalbudgetingandcashbudgeting.
Organizing: Organizing,which basically involves grouping ofactivities,definingtheresponsibilityandgrantingauthoritytoemployees,aimstodevelopstructuralrelationshipamongpeopleandphysicalresourcestocarryoutplansandaccomplishtheorganization’sstatedobjectives.Sinceorganizing is prerequisite for the success of anyorganization, therefore,thisfunctionnotonlycallsforundividedattentionfromthemanagementofanorganizationbutalsocontinuousmonitoringandaudit toensure itseffectivenessandrelevanceinadynamicbusinessenvironment.Toattainthisobjective,managementaccountingassiststhemanagementofanorganizationinorganizingbyestablishingcostand/orcostcentres.
Evaluating: Evaluating,commonlyknownascontrolling,istheprocessofdeterminingwhethertheorganizationalperformanceisconsistentwiththeplans.Thisfunctionofmanagement,infact,involvesthecomparisonofactualperformancewiththestandardstoidentifythedeviationifanyforthepurposeofinitiatingandimplementingmeasurestoadjustorganizationalactivitiestowardgoalattainment.Managementaccountinghelpsthemanagementofanorganization tomonitorprogressandmakeappropriateadjustmentbygeneratingvarious feedback/performance reports.Aneffectiveevaluation
NOTES
Self-InstructionalMaterial 11
Nature and Scope of Management Accounting
systemcontributestotheefficiencyoforganizationwhichinturnincreasestheprofitabilityoftheconcern.
Communication:Communication,which involves transmissionofinformationtothestakeholders,hasbeenrecognizedasanessentialfunctionofmanagementaccounting.Infact,themanagementaccountantspendsthemaximumtimeincommunicatingwithvariouspartiesthatareinterestedintheaffairsofthebusiness.Inadditiontothepublicationofcompany’sannualreport,whichisconsideredthebasictaskofamanagementaccountant,itbecomesequallyimportantforhimtopreparevarioussupplementaryreportsrequiredbythemanagementtoaddressvariousproblemsandchallengesthatemergeduetochangingandcompetitivebusinessenvironment.
1.4.1 Objectives and Functions of Management Accounting
Thebasicroleofmanagementaccountingistoprovideaccurateandrelevantinformationtotheinternalpartiesofanorganizationfordecisionmaking.To discharge this responsibility effectively,management accounting hastoundertakecollection,processing,analysingandinterpretingofdata,aswellascommunicationoftheresultinginformationtosuchinternalpartieswhointendtousethesameintheirdecisionmakingprocess.Infact, thesaidactivitiescanberecognizedasthebasestoidentifyandexaminethefunctionsofmanagementaccountingandaccordinglythemajorfunctionsaresummarizedbelow:
Data Collection: Thefirst function ofmanagement accounting isto collect the requisite data from all possible resources. Since the datawas traditionally restricted only to economic andfinancial items/factors,managementaccountantswouldmakeuseofthefinancialstatementslikeprofit&lossaccountandbalancesheetforthepurpose.Overthepastfewyears,theactivitiesofmanagementaccountinghavecrossedalltraditionalboundariesbyconsideringnotonlymonetaryitemsandfactorsinitsstudiesbutalsonon-monetaryfactorslike.Suchparadigmshiftintheapproachofthemanagementaccountinghasmadeitsscopemuchwider.Tomeetthegrowingdemandsofthewiderscope,managementaccountingisboundtoutilizebothinternalaswellasexternalsourcesofdatacollection.
Data Processing: The data so collected and stored needs to beconvertedintoinformationthroughprocessing.Dataprocessingreferstotheseriesofactivitiesconsistingofcompilation,classification,tabulationandsummarizationthataimstomakedatainformation.
Analysis and Interpretation:Thedatacollectedfromvariousinternalaswellasexternalsourcesdoesnothaveinherentmeaningandinfact,itsmeaningisgenerally influencedbythenatureandscopeof the toolsandtechniquesusedforitsanalysis.Further,thedataassuchisnotofmuchuseforthemanagementbutitbecomessoonceitisanalysedandinterpretedin
Nature and Scope of Management Accounting
NOTES
Self-Instructional 12 Material
thecontextofthenatureofthedecisions.Thus,theprocessofanalysisandinterpretationmakesthedatasosignificantforthesuccessoftheorganizationthatitisbeingrecognizedasastrategicassetforthecompanyinacompetitivemarket.However,themanagementaccountanthastochoosetherelevantandmostappropriatetechniqueforproperinterpretationofthedataaftertakingintoconsiderationthenatureoftheconcernedproblem.
Communication as a crucial function ofmanagement calls for thetransmissionofinformationtotheconcernedpartiesforuse.Managementaccountingplaysaspecialroleinmanagingtheaffairsofthebusinessbyprovidingnotonly theconventional reports to thedecisionmakersofanorganizationsbutalso in takingnecessarymeasures toensure the supplyofadequateinformationatrighttimetoenablethedecision-makersoftheorganizationtoaddressthechallengesofthechangingenvironment.
Inadditiontobasicfunctionsdiscussedabove,managementaccountingisalsoresponsibletocarryoutsomesecondaryfunctionsthataresummarizedbelow:
Coordinating: Management accounting isoftenentrustedwith theresponsibilitytocoordinatethevariousactivitiesofabusiness.Organizationsgenerallyusetechniquessuchasbudgetingandfinancialreportingforthepurpose.
Special Studies: Contemporary business is operating in a dynamic environmentwhereevenaminorchangeinanyof itselementscanhaveasignificantimpactonthebusinessoutcomes.Therefore,managementisalwaysinterestedtoknowtheareasofbusinesswhichcancontributetothestabilityandprofitabilityoftheconcern.Tomeetthisobjective,managementaccountingcarriesoutvariousspecialstudiessuchassalesanalysis,economicforecasts,pricespreadanalysis,etc.
Tax Administration: In themodern business organizations, taxadministrationisbeingrecognizedasasignificantareaofstudythatfallswithin thescopeofmanagementaccounting.Taxadministrationinvolvestasks like the submission of necessary documents and return to the taxauthorities,includingthesupervisionofallmattersrelatingtotax.
1.4.2 Tools and Techniques of Management Accounting
Management accounting is an information system designed to communicate meaningfuleconomicandfinancialinformationtomanagers,sothattheymaydischargetheirfunctionsefficiently.Itmakesextensiveuseofanumberoftoolsandtechniquestomeettheincreasingneedsofbusiness.Importantamongthemare:
Financial Planning: Planning is necessary not only for betterorganizationalperformanceandprogress,butalso forefficientutilization
NOTES
Self-InstructionalMaterial 13
Nature and Scope of Management Accounting
ofavailableresources.Infact,itisrecognizedasaprerequisiteforfinancialfunctionswhereinfinanceplaysadecidingroleinexecutingthemeffectively.Financial planning is the process of deciding in advance the financialobjectives,policiesandprocedures.Anorganizationcanachievelong-term,aswellasshort-term,financialobjectivesbyemployingfinancialplanning.Intheshortterm,itcanhelpaconcerninmeetingitsobligationsbybalancingtheflowoffunds.Atthesametime,itsproperapplicationcanensureefficientutilizationofavailablefinancialresourcesinthelongterm.
Analysis of Financial Statement: Financialstatementanalysisisagrowingandeverchangingsetofsystemsandproceduresdesignedtoprovidedecisionmakerswith relevant informationderived frombasic sourcesofdata such as companyfinancial statements andgovernment and industrypublications.Overtheyears,anumberoftechniqueshavebeendevisedtoanalysefinancialstatementse.g.,comparativefinancialstatements,common-sizestatements,ratioanalysis,trendanalysisandfundflowstatement.
Cost Accounting: Costaccountingisavitalpartof theaccountingsystem.Itincludesrecording,classifying,analysisandreportingofallcostfacetsinacompany’sperformance.Costaccountingprocedureshavetobedesignedcarefullyaftertakingintoconsiderationthenatureandrequirementsofthebusinessandthedatarequiredatthedifferentlevelsofmanagementforeffectivecostcontrolandcostreduction.
Standard Costing: Anothermajor technique commonly used bythe organizations for exercising control is standard costing.Under thisarrangementstandardcostsareusedtocontrol themajoractivitiesof thebusiness.Standardcostsarepredeterminedtargetsagainstwhichactualresultsareevaluated.Thisisthebasisforasystemofmanagementcontrolforwhichthepropermonitoringofperformanceisakeyfactor.Thevariancesbetweenstandardandactualcostsarecomputedandreportedtomanagement.
Marginal Costing: Marginalcostingisamanagerialtechniquethatconsiders only variable cost in the decisions concerningwith additionaloutput.Itisareportingsystemthatvaluesinventoryandcostofsalesatitsmanufacturingvariablecost.Itisfrequentlyusedaninternalmanagementreporting system.
Budgetary Control: Budgetarycontrolreferstoasystemofbusinesscontrol that usesbudgets to control themajor activitiesofbusiness.Thebudgetsforallmajoractivitiesofthebusinessarepreparedinadvanceandtheactualoperationsarecarriedoutinaccordancewiththebudgetestimates.Generallythebudgetsarepreparedbyupdatingthepreviousyear’sfiguresinthelightofsomeforwardprojections.
Funds Flow Analysis: Fundsflowanalysisattemptstohighlightthecausesofchangeinthefinancialpositionofabusinessenterprisebetween
Nature and Scope of Management Accounting
NOTES
Self-Instructional 14 Material
twobalancesheetdates.Anystatementpreparedforthispurposereferstoasfundsflowstatement.Afundsflowstatementhelpsmanagersintheefficientmanagement of funds.
Management Reporting: Management reporting is considered as an essentialcomponentofawelldesignedplanningandcontrolsystem.Decisionmakersfrequentlyrequireinformationonvariousaspectsofbusiness.Thus,itistheresponsibilityofthemanagementaccountanttocommunicatetherequiredinformationtomanagementattherighttimeandinarightmanner.
Statistical Analysis: Accountantsfrequentlyconfrontmassesofdatafromwhichtheyhavetodrawsystematicandlogicalconclusions.Statisticalanalysisingeneralandsamplingtheoryinparticularprovidesthemascientificmethodtodrawreliableandvalidconclusionsaboutthepropertiesofanentirepopulationbystudyingonlyachosensampleofthepopulation.
1.5 MERITS AND LIMITATIONS
In this section, let’s discuss themerits and limitations ofmanagementaccounting.
Merits of Management Accounting
Managementaccountingoffersthefollowingbenefitstotheorganizations: • Itincreasestheefficiencyinbusinessactivities. • Itensuresefficientregulationofbusinessactivitiesbyestablishingan
efficientsystemofplanningandbudgeting. • Itmakespossibletheefficientutilizationoftheavailableresourcesand
therebyincreasethereturnoncapitalemployed. • It ensures effective control by comparing actual resultswith the
standards. • Ithelpsmaintaingoodrelationswiththepublicbyprovidingquality
servicetothecustomers. • Itprovidesthemeanstomotivatetheemployees. • It keepsmanagers informed about the ongoingoperations, thereby
enablingthemtosuggestremedialmeasuresincaseofdeviations. • It helps in evaluating the efficiency and effectiveness of the
organization’sbusinesspoliciesbyincorporatingmanagementaudit.
Limitations of Management Accounting
Despitethebenefitsmentionedabove,managementaccountingsuffersfromseveraldrawbacks: •Managementaccountingusesdata thatareavailable fromfinancial
statements.Thus,thevalidityofthedecisionslargelydependsonthe
NOTES
Self-InstructionalMaterial 15
Nature and Scope of Management Accounting
reliabilityofthehistoricaldataasobtainedfromconventionalfinancialstatements.Anydrawbackinsuchstatementsisboundtoaffecttheeffectivenessofthedecision.
•Theapplicationofmanagementaccountingtoolsandtechniquesrequiresknowledgeaboutvarioussubjectslikeaccounting,costing,economics,taxation,statisticsandmathematics,engineeringandmanagement.Tofindamanagerintheorganizationwithacomprehensiveknowledgeofallthesesubjectsisalmostimpossible.
•Thoughmanagementaccountingattemptstoanalysebothqualitativeandquantitativefactorsthatinfluenceadecision,theelementofintuitioninmanagerialdecisionhasnotbeencompletelyeliminated.Thereisatendencyamongbusinessexecutivestouseashort-cutapproachtomanagerialproblemsratherthanthelengthyprocessasrequiredbythescientificanalysisprescribedbymanagementaccounting.
•The installationofmanagementaccountingsystemrequiresahugeinvestmentbothintermsofmoneyandmanpower.Therefore,smallerconcernsmaynotbeabletoaffordit.
•Managementaccountingisintheprocessofevolutionandassuchitstillhastogothroughmanydevelopmentalprocessesbeforereachingafinalstage.Consequently,thetechniquesofmanagementaccountinglackthesharpnessandfluiditythatisrequiredofanefficientsystem.Eventheanalysisandinterpretationconsiderablydifferfromorganizationto organization.
•Themanagementsystemcannotbereplacedbyasystemofmanagementaccounting,asthelattersystemsimplyprovidesthenecessarydataforadecisionandnotthedecisionitself.
•Theprincipleofobjectivityisnotalwaysfollowedinitsrealspiritinmanagementaccountingasthecollectionandanalysisareconsiderablyinfluencedbythepersonalbiasofthemanagementaccountant.
1.6 CHANGING ROLE AND TASKS OF MANAGEMENT ACCOUNTANTS
Traditionally,theroleofthemanagementaccountanthasbeenofafacilitatorresponsibleforprovidingsufficientaccountinginformationtothedecision-makers in an organization.Therefore, themanagement accountantwasresponsible fordevisingandoperatinganaccounting informationsystemthatwascapableofcollecting,processing,interpretingandcommunicatingtheaccountinginformationforusewithintheorganizationwiththeaimofattaining organizational efficiency and effectiveness.Thus, traditionally,thejobofthemanagementaccountantinanorganizationasadvocatedby Williamson(2003),hasrevolvedaroundthefollowingmajoractivities:
Nature and Scope of Management Accounting
NOTES
Self-Instructional 16 Material
•Accountingforproductvaluationandpricing •Policyformulationandplanning •Decisionmaking •Costcontrol
Recent developments in information technology, accompanied bytheemergenceofknowledgemanagement,arapidlychangingcompetitiveenvironment and increasingglobalization of business have led corporatehouses to introduce strategic orientation in their planning process.Thechangeinorientationisboundtobringadrasticchangenotonlyinthenatureandscopeofmanagementaccountingbutalsointhetaskandroleof themanagementaccountantinbusinessorganizations.Realizingtheneedtobringchangesintheroleofmanagementaccountants,SiegelandSorensenstatethattheroleofaccountantsshouldcontinuallyevolvetoremainrelevantinthechangingbusinessenvironment.Thetraditionalroleofthemanagementaccountant,which has been restricted to the supplier of operational andfinancialinformationwithintheorganization,isnolongersufficienttomeetthegrowingdemandsofachangingbusinessenvironment.Therefore,themanagement accountnt needs to grow into a high-level decision supportspecialistwhowould help a company in strategicmanagement efforts.Thus,theemergingroleofamanagerialaccountantwillbequitedifferentfromhistraditionalroleinthesensethathehastobeanactiveparticipantinthedecisionmakingprocess,alongwiththefunctionalmanagersinanorganization.Suchparticipationwillnotonlymakehimamemberofafirm’sfunctional teamthat is responsibleforvaluecreationbutalsochange thenatureofhisjobfroma‘staff’toa‘businesspartner’.
Thenewroleofthemanagementaccountant,whichcallsforachangenotonlyinthetaskbutalsoinhisstatuswithinanorganization,hasbeencapturedbymanyscholarsas:
Management accountantswill get a number of opportunities to initiateand execute specific actions to address the changes in the global economicenvironment.The traditional roleofprovidingaccurate, timelyand relevantinformation of amanagement accountantwill be replaced by awider andvibrantrolewherehewillbeanactiveparticipantinthestrategicprocessofan organization.
Thebelow-mentionedcommentsofSiegelandKuleszaaboutthenewroleofmanagementaccountantarenotdifferentfromtheabove-mentionedviews:
Managementaccountantsarebusinesspartnerswiththeircustomers(managersinoperatingorserviceunits),internalconsultantsandorganizationaleducators.
These views are also supplemented by the remarks of Siegel andSorensen,whosaidthatthecharacterizationofmanagementaccountantsinleading-edgecompanieshasgonefrom‘beancounter’and‘corporatecop’on
NOTES
Self-InstructionalMaterial 17
Nature and Scope of Management Accounting
theperipheryofbusinessdecisionmaking,to‘businesspartner’and‘valuedteammember’attheverycentreofstrategicactivity.
Thus,theemergingroleofmanagerialaccountantwillbequitedifferentfromhistraditionalroleinthesensethathewillbeactiveparticipantinthedecisionmakingprocessalongwithfunctionalmanagersinanorganization.Suchparticipationwillnotonlymakehimamemberofafirm’sfunctionalteamthatisresponsibleforvaluecreationbutalsochangethenatureofhisjobfroma‘staff’ toa‘businesspartner’.Thechangeintheroleofmanagementaccountantontheonehandwillwidenthehorizonofhisjobandontheotherhandwillmakehisjobmoredemandingintermsofpotentialandskills.Thenewrole,infact,willprovidethemanagementaccountantmoreopportunitiestoexplorehispotentialinmeetingtheexpectationsofthestakeholdersinanorganization.However,toaddresstheemergingchallengesofthenewrole,themanagementaccountantmustbeadaptablewithsufficientknowledgeofarangeofrelevantdisciplinessoastobeabletoprovidetherightinformationattherighttime.
Tocompeteandgrowinahighlycompetitiveandcomplexbusinessenvironment of the future, organizations need to develop capacity andcompetence to create and deliver superior delivered value to customersanduse the same as a sustainable competitive advantage.Consequently,managementaccountantsareboundtohelptheirorganizationsnotonlyinmeasuringthecostofoperationaccuratelybutalsoinidentifyinganddevisingthemeansforeliminatingnon-valueaddedcostswhichtheywillbeabletodoonlyiftheypossessadequateknowledgeofthevalue-creatingprocessoftheirrespectiveorganizations.Whilecommentingontheopportunitiesofenhancingthevalueofafirm’soutput,Cooperstatesthatcostmanagement,likequality,hastobecomeadisciplinepractisedbyvirtuallyeverypersoninthefirm.Sincetheeffectiveuseofcostmanagementtechniquescallsfortheapplicationoftoolsandtechniquesnotonlyfrommanagementaccountingbutalsofromengineeringandotherfunctionalareasofmanagement, thetaskofmanagementaccountantshasbecomemultifaceted,whichdemandsknowledge of projectmanagement andmanufacturing processes.Thus,managementaccountantsneedtopossesssufficientknowledgeofthelatestcosting tools and techniques like target costing, activity-based costing,throughputcosting,strategiccostmanagement,kaizencostingandbalancedscorecard.
1.6.1 Management Accountant in an Organization
Thequestions that generally strike themindof a studentwhile studyingmanagementaccountingare(i)whoisamanagementaccountant?and(ii)whatishisstatusintheorganization?Amanagementaccountantoccupiesapivotalposition in theorganizationand is responsible fordevisingandoperatinganaccounting informationsystemthat iscapableofcollecting,
Nature and Scope of Management Accounting
NOTES
Self-Instructional 18 Material
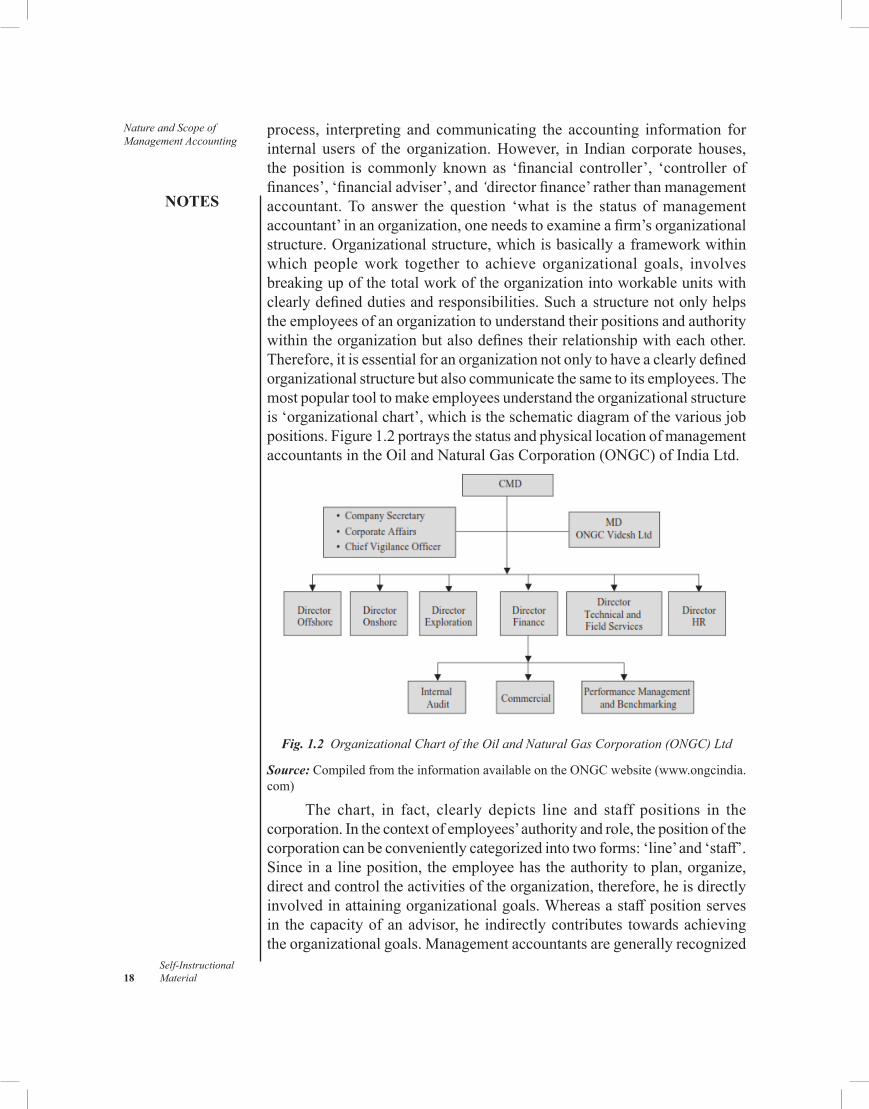
process, interpreting and communicating the accounting information forinternal users of the organization.However, in Indian corporate houses,the position is commonly known as ‘financial controller’, ‘controller offinances’,‘financialadviser’,and‘directorfinance’ratherthanmanagementaccountant.To answer the question ‘what is the status ofmanagementaccountant’inanorganization,oneneedstoexamineafirm’sorganizationalstructure.Organizationalstructure,whichisbasicallyaframeworkwithinwhich peoplework together to achieve organizational goals, involvesbreakingupofthetotalworkoftheorganizationintoworkableunitswithclearlydefineddutiesandresponsibilities.Suchastructurenotonlyhelpstheemployeesofanorganizationtounderstandtheirpositionsandauthoritywithintheorganizationbutalsodefinestheirrelationshipwitheachother.Therefore,itisessentialforanorganizationnotonlytohaveaclearlydefinedorganizationalstructurebutalsocommunicatethesametoitsemployees.Themostpopulartooltomakeemployeesunderstandtheorganizationalstructureis‘organizationalchart’,whichistheschematicdiagramofthevariousjobpositions.Figure1.2portraysthestatusandphysicallocationofmanagementaccountantsintheOilandNaturalGasCorporation(ONGC)ofIndiaLtd.
Fig. 1.2 Organizational Chart of the Oil and Natural Gas Corporation (ONGC) Ltd
Source: CompiledfromtheinformationavailableontheONGCwebsite(www.ongcindia.com)
The chart, in fact, clearly depicts line and staff positions in thecorporation.Inthecontextofemployees’authorityandrole,thepositionofthecorporationcanbeconvenientlycategorizedintotwoforms:‘line’and‘staff’.Sinceinalineposition,theemployeehastheauthoritytoplan,organize,directandcontroltheactivitiesoftheorganization,therefore,heisdirectlyinvolvedinattainingorganizationalgoals.Whereasastaffpositionservesin thecapacityofanadvisor,he indirectlycontributes towardsachievingtheorganizationalgoals.Managementaccountantsaregenerallyrecognized
NOTES
Self-InstructionalMaterial 19
Nature and Scope of Management Accounting
asstaffpositionsthataredevoidoftheformalrighttomakedecisionsandas suchhavenodirect responsibility for accomplishing theobjectivesofan organization.Therefore,management accountants aremeant to assistfunctionalmanagersincarryingoutthetasksthatarenecessaryforattainingthegoalsoftheorganization.However,theaccountantspossesstheauthorityovertheirstaffdeployedintheirrespectiveunits.
Itmust be understood thatmanagement accountants in India aregenerallymembersofstrategicteamsinlargeorganizations.Infact, theyhavetheresponsibilityofprovidingrelevantandtimelydatatotheteaminorderhelpitinplanningandcontrollingactivitiesoftheorganization.
Check Your Progress
3.What is the special role played bymanagement accounting inmanagingtheaffairsofthebusiness?
4.Howdoestheelementofintuitionaffectmanagementaccounting? 5.Mention the activities around which the traditional job of
managementaccountingrevolvedasperWilliamson.
1.7 ANSWERS TO CHECK YOUR PROGRESS QUESTIONS
1. Inflation accounting attempts to identify certain characteristics ofaccountingthattendtodistortthereportingoffinancialresultsduringperiodsofrapidlychangingprices.
2.Financialaccountingstatementsarepreparedattheendofthefinancialperiodwhichisusuallyaperiodof12monthswhereasmanagementaccounting reports and statements are prepared at regular intervalsdependinguponthedemandofthedecision-maker.
3.Managementaccountingplaysaspecialroleinmanagingtheaffairsof the business by providing not only the conventional reports tothedecisionmakersofanorganizationbutalsointakingnecessarymeasurestoensurethesupplyofadequateinformationatrighttimetoenablethedecision-makersoftheorganizationtoaddressthechallengesofthechangingenvironment.
4.Theelementofintuitionismanagerialdecisionhasnotbeencompletelyeliminated.Thereisatendencyamongbusinessexecutivestouseashort-cut approach tomanagerial problems rather than the lengthyprocessasrequiredbythescientificanalysisprescribedbymanagementaccounting.
Nature and Scope of Management Accounting
NOTES
Self-Instructional 20 Material
5.Traditionally,thejobofmanagementaccountantinanorganizationasadvocatedbyWilliamson(2003),hasevolvedaroundthefollowingmajor activities:• Accountingforproductvaluationandpricing• Policyformulationandplanning• Decisionmaking• Costcontrol
1.8 SUMMARY
•Management accounting is a segment of accounting that dealsspecificallywith the accounting and reporting of information tomanagementregardingthedetailedoperationsofthecompanyinorderfordecisionstobetakeninvariousareasofbusiness.
•Apersoncangainmeaningfulinsightsandconclusionsaboutthefirmwiththehelpofanalysisandinterpretationoftheinformationcontainedinfinancialstatements.
•Budgetingisameansofcoordinatingactivitieswiththeco-operationofthosewhoseektoachieveacommongoal.
• Inflation accounting attempts to identify certain characteristics ofaccountingthattendtodistortthereportingoffinancialresultsduringperiodsofrapidlychangingprices.
•Clear,informative,timelyreportsareessentialmanagementtoolsinreachingdecisionsthatmakethebestuseofacompany’sresources.
•Quantitativeanalysismethodsallowmanagerstodevelopinformationfromtheirfinancialdatabasethatisnot,otherwise,available.
•Taxationplaysanimportantroleintheprofitabilityofacommercialconcern.
• Internal audit as a discipline ofmanagement accountingmakesarrangements for performance appraisal of the company’s variousdepartments.
•Todischargetheresponsibilityeffectively,managementaccounting,therefore, has to carry out not only the activities like collection,processing,analysingandinterpretingofthedatabutalsocommunicatingtheresultinginformationtosuchinternalpartieswhointendtousethesameintheirdecisionmakingprocess.
•Management accounting helps an organization in the process ofmanagement,which generally consists of activities like planning,organizing,evaluatingandcommunicating.
NOTES
Self-InstructionalMaterial 21
Nature and Scope of Management Accounting
• Financialplanningistheprocessofdecidinginadvancethefinancialobjectives,policiesandprocedures.
•Financial statement analysis is a growing and ever changing setof systems and procedures designed to provide decisions-makerswith relevant information derived from the basic sources of datasuchascompanyfinancialstatementsandgovernmentandindustrypublications.
•Standardcostsarepredeterminedtargetsagainstwhichactualresultsareevaluated.
•Marginalcostingisamanagerialtechniquethatconsidersonlyvariablecostintheadditionaloutputdecisions.
•Budgetary control refers to a systemof business control that usesbudgetstocontrolthemajoractivitiesofbusiness.
•Fundsflowanalysisattemptstohighlightthecausesofchangeinthefinancialconditionofabusinessenterprisebetweentwodates.
•Managementreportingisconsideredanessentialcomponentofawell-designedplanningandcontrolsystem.
• In his new role, themanagement accountantwill providemoreopportunitiestoexplorehispotentialinmeetingtheexpectationsofthestakeholdersinanorganization.
•Amanagementaccountantisresponsiblefordevisingandoperatinganaccountinginformationsystemthatiscapableofcollecting,processing,interpretingandcommunicatingaccountinginformationforinternalusersoftheorganization.
1.9 KEY WORDS
•Management accounting: It is a segment of accounting thatdeals specificallywith the analysis and reportingof information tomanagementabouttheoperationsoftheorganizationwithanobjectivetofacilitatedecisionmaking.
•Financial accounting:Itisagrowingdisciplinewhichhelpstoregulateasystemthatiscapableofrecording,classifyingandsummarizingthemercantiletransactionsoccurringinanorganization.
•Budgeting: It refers to a systematic plan for the utilization oforganizationalresources.
•Data processing: It refers to the series of activities consisting ofcompilation,classification,tabulationandsummarizationthataimstomakedatainformation.
Nature and Scope of Management Accounting
NOTES
Self-Instructional 22 Material
1.10 SELF ASSESSMENT QUESTIONS AND EXERCISES
Short-Answer Questions
1.Whatismanagementaccounting?Howisitdifferentfromfinancialaccounting?
2.Brieflydiscussthescopeofmanagementaccounting. 3.Statetheobjectivesandlimitationsofmanagementaccounting.
Long-Answer Questions
1. ‘Managementaccountingisthepresentationofaccountinginformationin such away as to assist themanagement in decisionmaking.’Comment.
2.Discussindetailthefunctionsofmanagementaccounting. 3.Explainthetoolsofmanagementaccounting. 4. ‘Management accounting can be viewed asmanagement oriented
accounting.’Comment. 5. Identifyandexaminethechangingroleofthemanagementaccountant
in contemporary business.
1.11 FURTHER READINGS
Sahaf,M.A.2013.Management Accounting: Principles and Practice,3rdedition.NewDelhi:VikasPublishingHouse.
Arora,M.N.2012.A textbook of Cost and Management Accounting,10thedition.NewDelhi:VikasPublishingHouse.
Maheshwari,S.N.,SuneelK.andSharadK.2018.A Textbook of Accounting for Management,4thedition.NewDelhi:VikasPublishingHouse.
NOTES
Self-InstructionalMaterial 23
Financial Statements AnalysisUNIT 2 FINANCIAL STATEMENTS
ANALYSISStructure 2.0 Introduction 2.1 Objectives 2.2 NatureofFinancialStatements
2.2.1 LimitationsofFinancialStatements 2.2.2 MeaningofAnalysis 2.2.3 StepsInvolvedinFinancialStatementsAnalysis 2.2.4 TechniquesofAnalysis
2.3 ComparativeFinancialStatements 2.4 Common Size Statement 2.5 TrendAnalysis 2.6 AnswerstoCheckYourProgressQuestions 2.7 Summary 2.8 Key Words 2.9 SelfAssessmentquestionsandExercises 2.10 FurtherReadings
2.0 INTRODUCTION
Thefundamental,clearanddefiniteunderstandingoffinancialstatementsisrecognizedasaprerequisiteforanaccurate,completeandrelevantfinancialdecision.However,thisdoesnotmeanthatdecisionmakerslikeabusinessexecutive,commercialorinvestmentbanker,orinvestor,speculator,businesscounsellor, mercantile creditman, or financial analyst need tomasterthemselvesinthepreparationofthesestatements.Infact,qualifiedfinancialaccountants capable of preparing such statements are available almosteverywhere in theworld.But the unchallenged ability to interpret thesefinancialstatementsintelligentlyandaccuratelyareessentialtounderstandthefinancialstatusandperformanceofabusiness.
Inthisunit,youwilllearnaboutsometoolsoffinancialstatementanalysis.
2.1 OBJECTIVES
Aftergoingthroughthisunit,youwillbeableto: •Describethemeaning,limitations,stepsandtechniquesoffinancial
statementanalysis •Explaintheconceptofcomparativestatement •Discussthepreparationofcommonsizestatement •Examinethemethodoftrendpercentageasatooloffinancialstatement
analysis
Financial Statements Analysis
NOTES
Self-Instructional 24 Material
2.2 NATURE OF FINANCIAL STATEMENTS
Financialstatementsenableareadernotonlytomeasurebusinessresultsof an organization but also to assess its financial position; hence, theyare generally predictive by nature. Such statements contain not onlysufficientbutalsovaluableinformationabouttheorganizationthatwouldhelpmanagersindecisionmaking.ThenatureoffinancialstatementswasadmirablysummarizedontraditionalgroundsanumberofyearsagobytheAmericanInstituteofCertifiedPublicAccountants,1936 inthefollowinglines:Financial statements are prepared for the purposes of presenting a periodical review or report by the management and deal with the status of the investment in the business and the results achieved during the period under review.
Thus,financial statements are reporting instruments that provide asummaryoftheaccountingdataofanorganization’sbusinesspertainingtoaspecificaccountingperiod.Theobjectivesofsuchstatementsaresummarizedbelow:
• Tomeasureanorganization’sbusinessresultsandassessitsfinancialposition;
• Topresenttrueandfairviewofthebusiness;• Torevealimplicationsofoperatingprofitonthefinancialposition
of a concern;• Toprovidesufficientandrelevantfinancialinformationtovarious
partiesinterestedinfinancialstatementanalysis;and• Toserveasthebasisforfutureplanningandstrategy.Generally,financialstatementsrefertoatleasttwostatementswhichan
organizationpreparesattheendofagivenperiodoftime.Thesestatementsare:
• Profitandlossaccounts;and• BalancesheetInaddition to theabove-mentionedstatements,manyorganizations
prepare the following twofinancial statements inorder to strengthen theaccounting information system:
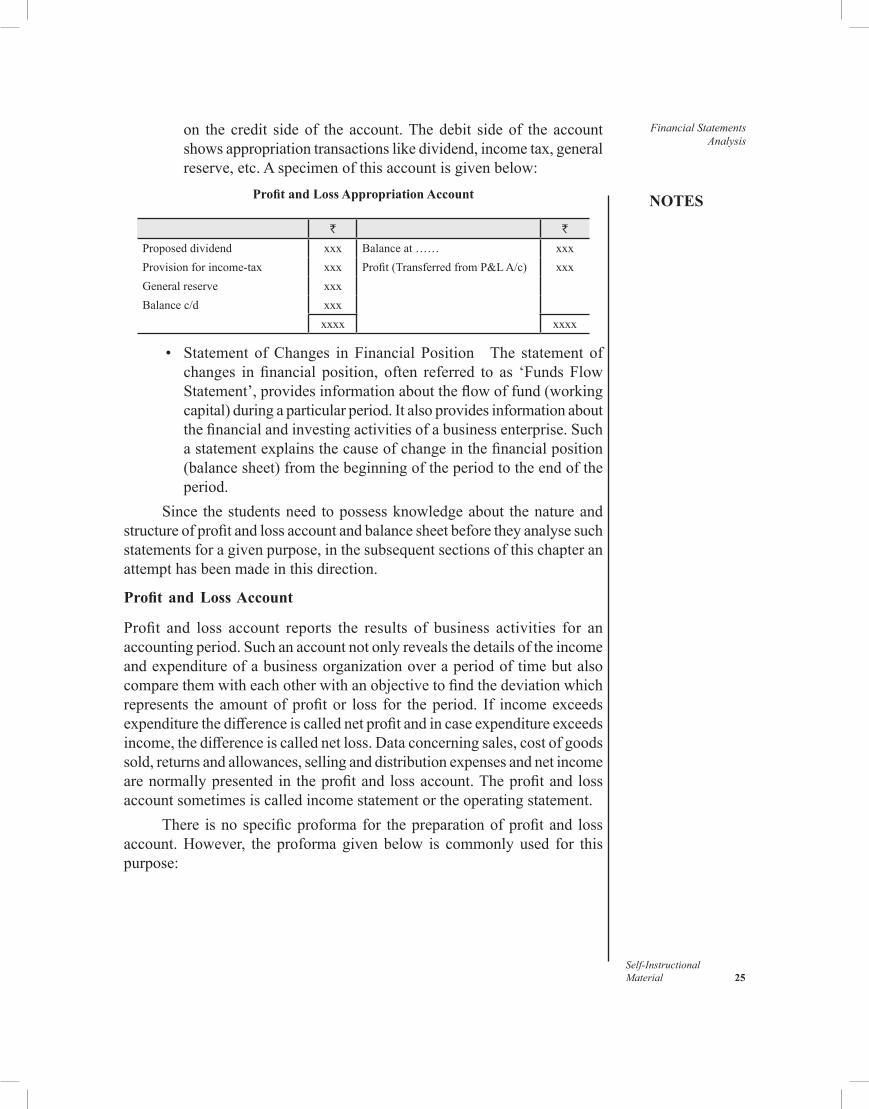
• Profit and Loss Appropriation Account: Anaccountthatshowsthedistributionofprofitisknownasprofitandlossappropriationaccount.Generallythisaccounthasthesameformat,i.e.,‘T’form,asisfollowedincaseofprofitandlossaccount.Thecurrentprofitof thebusiness(that is transferredfromprofitandlossaccount)alongwiththebalanceofprofit,ifany,ofthepreviousyearappear
NOTES
Self-InstructionalMaterial 25
Financial Statements Analysis
on the credit sideof the account.Thedebit sideof the accountshowsappropriationtransactionslikedividend,incometax,generalreserve,etc.Aspecimenofthisaccountisgivenbelow:
Profit and Loss Appropriation Account
` `
Proposeddividend xxx Balanceat…… xxxProvisionforincome-tax xxx Profit(TransferredfromP&LA/c) xxxGeneralreserve xxxBalancec/d xxx
xxxx xxxx
• Statement ofChanges inFinancial Position The statement ofchanges infinancial position, often referred to as ‘FundsFlowStatement’,providesinformationabouttheflowoffund(workingcapital)duringaparticularperiod.Italsoprovidesinformationaboutthefinancialandinvestingactivitiesofabusinessenterprise.Suchastatementexplainsthecauseofchangeinthefinancialposition(balancesheet)fromthebeginningoftheperiodtotheendoftheperiod.
Since thestudentsneed topossessknowledgeabout thenatureandstructureofprofitandlossaccountandbalancesheetbeforetheyanalysesuchstatementsforagivenpurpose,inthesubsequentsectionsofthischapteranattempthasbeenmadeinthisdirection.
Profit and Loss Account
Profit and loss account reports the results of business activities for anaccountingperiod.Suchanaccountnotonlyrevealsthedetailsoftheincomeandexpenditureofabusinessorganizationoveraperiodoftimebutalsocomparethemwitheachotherwithanobjectivetofindthedeviationwhichrepresents theamountofprofitor loss for theperiod. If incomeexceedsexpenditurethedifferenceiscallednetprofitandincaseexpenditureexceedsincome,thedifferenceiscallednetloss.Dataconcerningsales,costofgoodssold,returnsandallowances,sellinganddistributionexpensesandnetincomearenormallypresentedin theprofitandlossaccount.Theprofitandlossaccountsometimesiscalledincomestatementortheoperatingstatement.
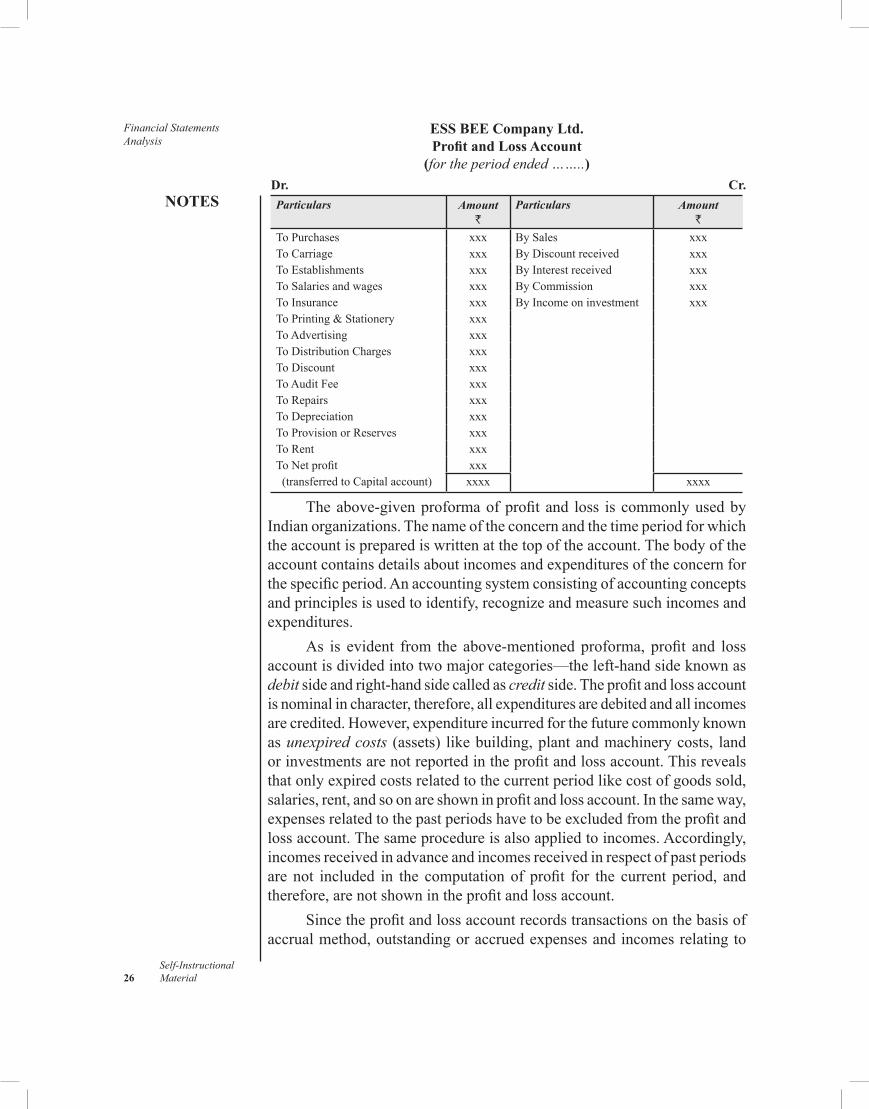
There isnospecificproformafor thepreparationofprofitand lossaccount.However, the proformagivenbelow is commonlyused for thispurpose:
Financial Statements Analysis
NOTES
Self-Instructional 26 Material
ESS BEE Company Ltd. Profit and Loss Account
(for the period ended ……..) Dr. Cr.
Particulars Amount`
Particulars Amount`
ToPurchases xxx BySales xxxTo Carriage xxx ByDiscountreceived xxxToEstablishments xxx ByInterestreceived xxxToSalariesandwages xxx ByCommission xxxTo Insurance xxx ByIncomeoninvestment xxxToPrinting&Stationery xxxTo Advertising xxxToDistributionCharges xxxTo Discount xxxToAuditFee xxxToRepairs xxxTo Depreciation xxxToProvisionorReserves xxxToRent xxxToNetprofit xxx (transferredtoCapitalaccount) xxxx xxxx
Theabove-givenproformaofprofitand loss iscommonlyusedbyIndianorganizations.Thenameoftheconcernandthetimeperiodforwhichtheaccountispreparediswrittenatthetopoftheaccount.Thebodyoftheaccountcontainsdetailsaboutincomesandexpendituresoftheconcernforthespecificperiod.Anaccountingsystemconsistingofaccountingconceptsandprinciplesisusedtoidentify,recognizeandmeasuresuchincomesandexpenditures.
As is evident from the above-mentionedproforma, profit and lossaccountisdividedintotwomajorcategories—theleft-handsideknownasdebit sideandright-handsidecalledascredit side.Theprofitandlossaccountisnominalincharacter,therefore,allexpendituresaredebitedandallincomesarecredited.However,expenditureincurredforthefuturecommonlyknownas unexpired costs (assets) likebuilding,plantandmachinerycosts, landorinvestmentsarenotreportedintheprofitandlossaccount.Thisrevealsthatonlyexpiredcostsrelatedtothecurrentperiodlikecostofgoodssold,salaries,rent,andsoonareshowninprofitandlossaccount.Inthesameway,expensesrelatedtothepastperiodshavetobeexcludedfromtheprofitandlossaccount.Thesameprocedureisalsoappliedtoincomes.Accordingly,incomes received in advance and incomes received in respect of past periods are not included in the computationof profit for the current period, andtherefore,arenotshownintheprofitandlossaccount.
Sincetheprofitandlossaccountrecordstransactionsonthebasisofaccrualmethod,outstandingoraccruedexpensesandincomesrelatingto
NOTES
Self-InstructionalMaterial 27
Financial Statements Analysis
thecurrentperiodbutnotyetpaidorreceivedaretobereportedinprofitandlossaccount.
Balance Sheet
Theprofitandlossaccountdiscussedabovedepictstheincomeandexpenditurefor a specificaccountingperiod,but it fails to indicate thepositionof theorganizationintermsofitsassetsandliabilities.Topresentsuchaninformation,anaccountingframeworkisrequiredwhichisknownasthebalance sheet. Thebalancesheetisastatementofthefinancialpositionofanenterpriseasatagivendatewhichexhibitsitsassets,liabilities,capital,reservesandotheraccountbalancesattheirrespectivebookvalues(ICAI,1983).
Thus,balancesheetisastatementwhichdisclosesthefinancialstatusofanorganizationconsistingofthevaluesassignedtoitsassets,liabilities,andowner’sequity,ataspecifictime.Itcontainstwosides,viz.,liabilitiesandassets.
Liabilities denote the amountwhich a business owes to others ondifferentaccounts.Itrepresentsclaimsofcreditorsandequityoftheowners.Theliabilitiesareusuallydividedintothreemajorcategories:
• Currentliabilitiesrepresentshort-termfinancialobligationswhichare expected to be paidwithin the coming year or the normaloperatingcycle.Sundrycreditors,billspayableandoutstandingexpensesarethebestexamplesofsuchliabilities.
• Long-termliabilitiesareliabilitiesthatarenotexpectedtoberepaidwithinthecomingyearbutareof thelong-termnature.Thus, itincludesdebtsnotfallingdueuntilmorethanayearfromthebalancesheetdate.
• Owner’sequityrepresentstheamountofliabilitiesforwhichownersofabusinesshaveclaim.Itincludessharecapitalandaccumulatedresources.
Assets arethematerialthingsorpossessionsorpropertiesofbusinessincludingtheamountduetoitfromothers.Assetsareusuallyclassifiedintothreemajorcategories:
• Currentassetsrepresentcashplusthoseassets thatareexpectedtobeconvertedintocashorconsumedduringtheyearornormaloperatingcycle,e.g.,stock,sundrydebtors,billsreceivable,etc.
• Fixed asssets are those assetswhich are to be used in businessoperationover a relatively longperiodof time.Such assets areincidental to production such as land and building, plant andmachinery,furnitureandfittings,etc.
• Intangibleassetsalsoknownasfictitiousassetsarenotrepresentedbyanytangiblepossessionorproperty.Theyaredebitbalancesofcertainaccountswhicharenotyetwrittenoffsuchaspreliminaryexpenses,patents,goodwill,etc.
Financial Statements Analysis
NOTES
Self-Instructional 28 Material
Thus,theliabilitiessideshowsourceswherefromfundswereobtainedwhileassetssidedescribesthewayinwhichthefundswereutilized.
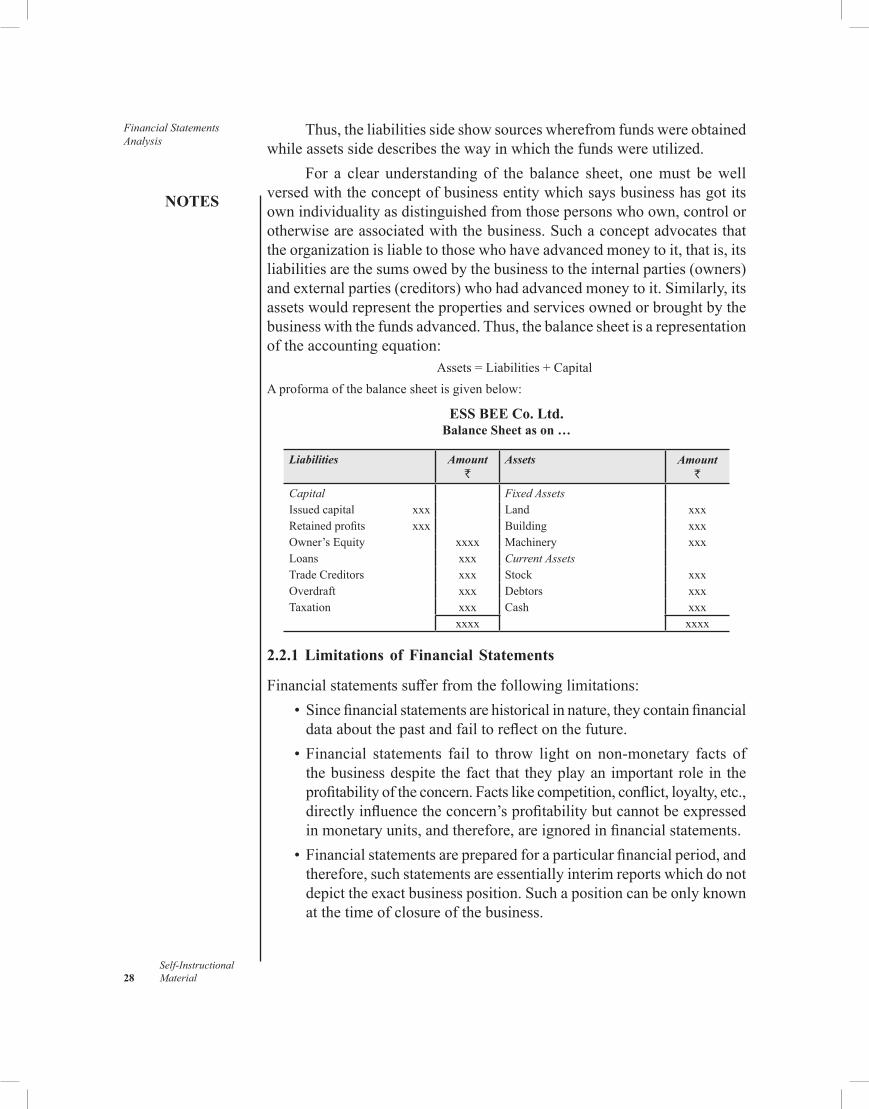
For a clear understanding of the balance sheet, onemust bewellversedwiththeconceptofbusinessentitywhichsaysbusinesshasgotitsownindividualityasdistinguishedfromthosepersonswhoown,controlorotherwiseareassociatedwiththebusiness.Suchaconceptadvocatesthattheorganizationisliabletothosewhohaveadvancedmoneytoit,thatis,itsliabilitiesarethesumsowedbythebusinesstotheinternalparties(owners)andexternalparties(creditors)whohadadvancedmoneytoit.Similarly,itsassetswouldrepresentthepropertiesandservicesownedorbroughtbythebusinesswiththefundsadvanced.Thus,thebalancesheetisarepresentationoftheaccountingequation:
Assets=Liabilities+CapitalAproformaofthebalancesheetisgivenbelow:
ESS BEE Co. Ltd.Balance Sheet as on …
Liabilities Amount`
Assets Amount`
Capital Fixed AssetsIssuedcapital xxx Land xxxRetainedprofits xxx Building xxxOwner’sEquity xxxx Machinery xxxLoans xxx Current AssetsTrade Creditors xxx Stock xxxOverdraft xxx Debtors xxxTaxation xxx Cash xxx
xxxx xxxx
2.2.1 Limitations of Financial Statements
Financialstatementssufferfromthefollowinglimitations: •Sincefinancialstatementsarehistoricalinnature,theycontainfinancial
dataaboutthepastandfailtoreflectonthefuture. •Financial statements fail to throw light on non-monetary facts of
thebusinessdespite thefact that theyplayanimportantrole in theprofitabilityoftheconcern.Factslikecompetition,conflict,loyalty,etc.,directlyinfluencetheconcern’sprofitabilitybutcannotbeexpressedinmonetaryunits,andtherefore,areignoredinfinancialstatements.
•Financialstatementsarepreparedforaparticularfinancialperiod,andtherefore,suchstatementsareessentiallyinterimreportswhichdonotdepicttheexactbusinessposition.Suchapositioncanbeonlyknownatthetimeofclosureofthebusiness.
NOTES
Self-InstructionalMaterial 29
Financial Statements Analysis
•Afinancialstatementisasnearlyastheaccountantcanmakeitso.Therefore,suchstatementsareinfluencedbyhispersonaljudgementswhichdefinitelyaffectthequalityandutilityofthestatements.
•Financialstatementsfailstoreflectthetrueandfairviewofthebusinessasthepreparationofthestatementsisgovernedbyvariousaccountingconcepts and conventionswhich suffer frommanydrawbacks. Forexample,assetsaretoberecordedatcostratherthantheirrealisablevaluewhichdefinitelyhidestherealpositionsoftheconcern.
2.2.2 Meaning of Analysis
Like lines in thepalmorhoroscope,financial statementscanbe studied,puzzledover,andscrutinized(Woelfel,1980).Theanalysisofsuchstatementsprovidevaluableinformationformanagerialdecisions.Financialstatementis—asnearlyasthefinancialexecutivecanmakeitso—simplyareportoffacts.Theutilityofthestatementdoesnotlieintheamountofinformationitcontainsbut intheexpertiseandtheskillof theanalyst toanalyseandinterprettheinformationinthestatementinordertogetthestorybehindthe facts—to readbetween the lines.Financial statement does not speakanythinginandof itself. Itmerelycontainsfinancialdataaboutbusinessevents.Theusergainsmeaningfulinsightsandconclusionsaboutthefirmonlythroughhisownanalysisandinterpretationoftheinformationinthestatements(Woelfel,1908).
Financial statement analysis involves a systematic and carefulexaminationoftheinformationcontainedinthefinancialstatementswithadefinitepurpose.Itisadetailedinquiryintofinancialdatatoevaluateanorganization’sperformance,futurerisksandpotential.Itattemptstodeterminethe significance andmeaningof thebusiness information as depictedbyfinancial statements so that prospects for future earnings, ability to payinterestanddebtmaturities(bothcurrentandlong-term)andprofitabilityofasounddividendpolicymaybeforecast.AccordingtoMyer,1969Financialstatement analysis is largelya study of relationships among the various financial factors in a business, as disclosed by a single set of statements and study of these factors as shown in a series of statements.
Thus,financialstatementanalysisisaprocessofanalysingthefinancialdatainordertojudgetheprofitabilityandfinancialpositionofanorganization.Itistheevaluationoftheeconomicandfinancialdatapresentedinthefinancialstatementsformakingdecisionsandmaintainingcontrol.
2.2.3 Steps Involved in Financial Statements Analysis
Theprocessoffinancialstatementanalysisconsistsofthefollowingsixsteps: • determinationofscopeandobjectivesofanalysis; • studyoffinancialstatements;
Financial Statements Analysis
NOTES
Self-Instructional 30 Material
• collectionofrelevantinformation; • rearrangementofthedata; • analysisofdatabyanalyticaltechniques;and • interpretation,presentationandpreparationofreports.
2.2.4 Techniques of Analysis
Overthepastfewdecadesanumberoftechniqueshavebeendevelopedfortheanalysisoffinancialstatements.Theselectionofappropriateanalyticaltechnique generally depends upon the purpose of the analysis.Usuallyanalystsprefertousesuchtechniquesincombinationtoensurebetterresults.Thecommonlyusedtechniquesare: • comparativefinancialstatement; • common-sizestatement; • trendanalysis; • ratioanalysis; • fundflowstatements;and • cashflowstatementsInthesubsequentsectionsofthisunit,anattemptismadetodiscussindetailthefirstthreetechniquesi.e.,comparativefinancialstatement,common-sizestatement,andtrendanalysis.However,thelastthreetechniquesi.e.,ratioanalysis,fundflowstatementandcashflowstatementhavebeendiscussedindetailinthesubsequentunits.
Check Your Progress
1.Mention the statements apart fromprofit and loss accounts andbalance sheetwhich are prepared to strengthen the accountinginformation system.
2.Statetheaccountingequationwhoserepresentationisthebalancesheet.
3.Mentionsomeofthefactorswhichinfluenceprofitabilitybutareignoredinfinancialstatements.
2.3 COMPARATIVE FINANCIAL STATEMENTS
Any financial statement that reports the comparison of data for two or more consecutive accounting periods is known as comparative financial statement. CommentingonthenatureofcomparativefinancialstatementsFoulke,1961statesthatsuchstatementswhichbasicallyrevealthefinancialpositionofthebusinessaredesignedinsuchaformastoprovidetimeprospectiveto
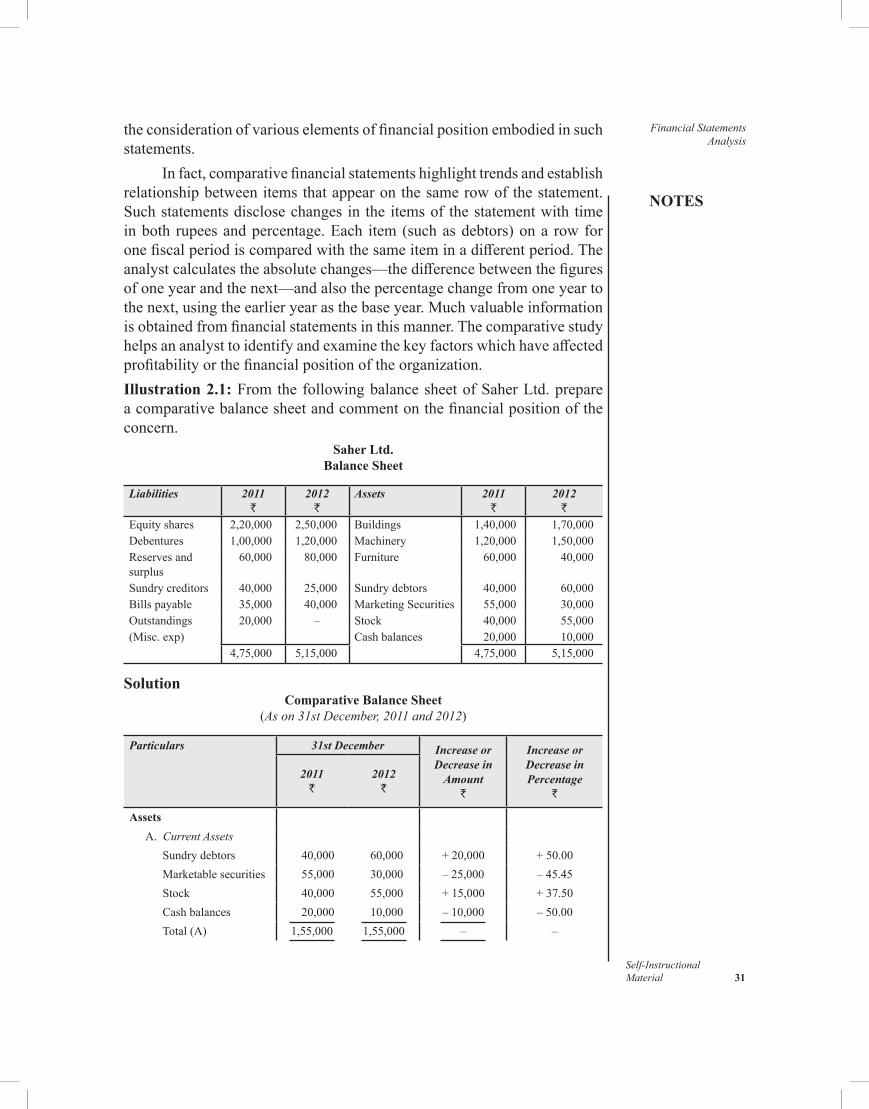
NOTES
Self-InstructionalMaterial 31
Financial Statements Analysis
theconsiderationofvariouselementsoffinancialpositionembodiedinsuchstatements.
Infact,comparativefinancialstatementshighlighttrendsandestablishrelationshipbetweenitemsthatappearonthesamerowofthestatement.Suchstatementsdisclosechangesin theitemsof thestatementwithtimeinboth rupeesandpercentage.Each item(suchasdebtors)ona rowforonefiscalperiodiscomparedwiththesameiteminadifferentperiod.Theanalystcalculatestheabsolutechanges—thedifferencebetweenthefiguresofoneyearandthenext—andalsothepercentagechangefromoneyeartothenext,usingtheearlieryearasthebaseyear.Muchvaluableinformationisobtainedfromfinancialstatementsinthismanner.Thecomparativestudyhelpsananalysttoidentifyandexaminethekeyfactorswhichhaveaffectedprofitabilityorthefinancialpositionoftheorganization.Illustration 2.1:FromthefollowingbalancesheetofSaherLtd.prepareacomparativebalancesheetandcommentonthefinancialpositionoftheconcern.
Saher Ltd.Balance Sheet
Liabilities 2011`
2012`
Assets 2011`
2012`
Equityshares 2,20,000 2,50,000 Buildings 1,40,000 1,70,000Debentures 1,00,000 1,20,000 Machinery 1,20,000 1,50,000Reservesandsurplus
60,000 80,000 Furniture 60,000 40,000
Sundry creditors 40,000 25,000 Sundry debtors 40,000 60,000Billspayable 35,000 40,000 MarketingSecurities 55,000 30,000Outstandings 20,000 – Stock 40,000 55,000(Misc.exp) Cashbalances 20,000 10,000
4,75,000 5,15,000 4,75,000 5,15,000
SolutionComparative Balance Sheet
(As on 31st December, 2011 and 2012)
Particulars 31st December Increase or Decrease in
Amount`
Increase or Decrease in Percentage
`
2011`
2012`
AssetsA. Current Assets
Sundry debtors 40,000 60,000 +20,000 +50.00Marketablesecurities 55,000 30,000 –25,000 – 45.45Stock 40,000 55,000 +15,000 +37.50Cashbalances 20,000 10,000 –10,000 – 50.00Total(A) 1,55,000 1,55,000 – –
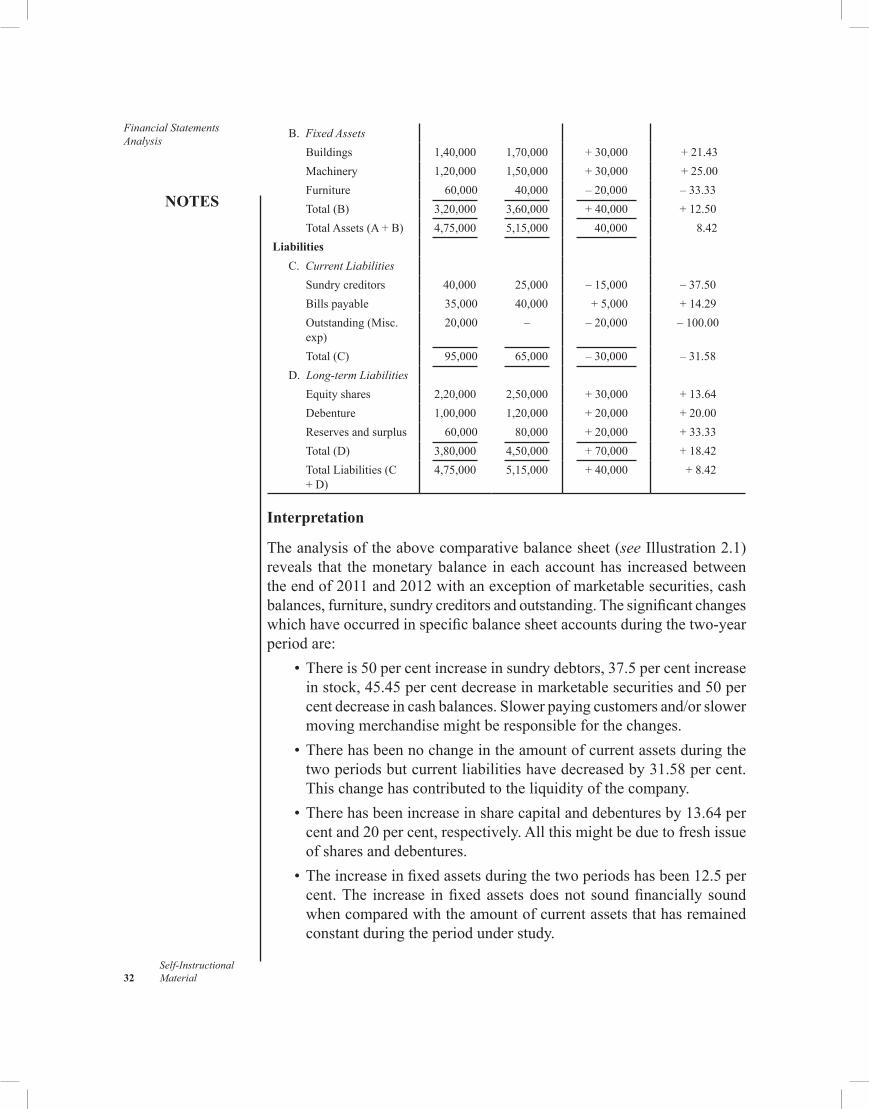
Financial Statements Analysis
NOTES
Self-Instructional 32 Material
B. Fixed AssetsBuildings 1,40,000 1,70,000 +30,000 +21.43Machinery 1,20,000 1,50,000 +30,000 +25.00Furniture 60,000 40,000 –20,000 – 33.33Total(B) 3,20,000 3,60,000 +40,000 +12.50TotalAssets(A+B) 4,75,000 5,15,000 40,000 8.42
LiabilitiesC. Current Liabilities
Sundry creditors 40,000 25,000 –15,000 – 37.50Billspayable 35,000 40,000 +5,000 +14.29Outstanding (Misc. exp)
20,000 – –20,000 – 100.00
Total(C) 95,000 65,000 –30,000 – 31.58D. Long-term Liabilities
Equityshares 2,20,000 2,50,000 +30,000 +13.64Debenture 1,00,000 1,20,000 +20,000 +20.00Reservesandsurplus 60,000 80,000 +20,000 +33.33Total(D) 3,80,000 4,50,000 +70,000 +18.42TotalLiabilities(C+D)
4,75,000 5,15,000 +40,000 +8.42
Interpretation
Theanalysisoftheabovecomparativebalancesheet(see Illustration2.1)reveals that themonetarybalance ineachaccounthas increasedbetweentheendof2011and2012withanexceptionofmarketablesecurities,cashbalances,furniture,sundrycreditorsandoutstanding.Thesignificantchangeswhichhaveoccurredinspecificbalancesheetaccountsduringthetwo-yearperiod are: •Thereis50percentincreaseinsundrydebtors,37.5percentincrease
instock,45.45percentdecreaseinmarketablesecuritiesand50percentdecreaseincashbalances.Slowerpayingcustomersand/orslowermovingmerchandisemightberesponsibleforthechanges.
•Therehasbeennochangeintheamountofcurrentassetsduringthetwoperiodsbutcurrentliabilitieshavedecreasedby31.58percent.Thischangehascontributedtotheliquidityofthecompany.
•Therehasbeenincreaseinsharecapitalanddebenturesby13.64percentand20percent,respectively.Allthismightbeduetofreshissueofsharesanddebentures.
•Theincreaseinfixedassetsduringthetwoperiodshasbeen12.5percent.The increase infixedassetsdoesnot soundfinancially soundwhencomparedwiththeamountofcurrentassetsthathasremainedconstantduringtheperiodunderstudy.
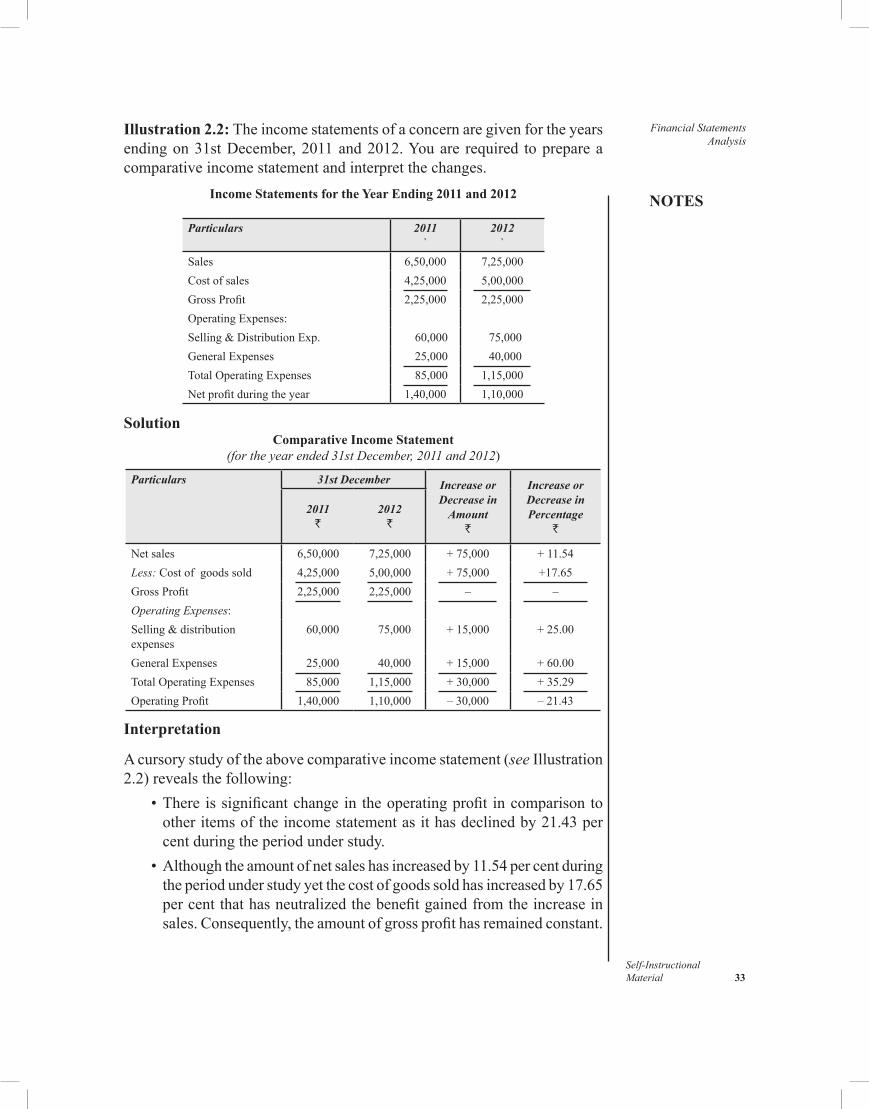
NOTES
Self-InstructionalMaterial 33
Financial Statements Analysis
Illustration 2.2: Theincomestatementsofaconcernaregivenfortheyearsendingon31stDecember,2011and2012.Youare required toprepareacomparativeincomestatementandinterpretthechanges.
Income Statements for the Year Ending 2011 and 2012
Particulars 2011`
2012`
Sales 6,50,000 7,25,000Costofsales 4,25,000 5,00,000GrossProfit 2,25,000 2,25,000OperatingExpenses:Selling&DistributionExp. 60,000 75,000GeneralExpenses 25,000 40,000TotalOperatingExpenses 85,000 1,15,000Netprofitduringtheyear 1,40,000 1,10,000
SolutionComparative Income Statement
(for the year ended 31st December, 2011 and 2012)
Particulars 31st December Increase or Decrease in
Amount`
Increase or Decrease in Percentage
`
2011`
2012`
Netsales 6,50,000 7,25,000 +75,000 +11.54Less:Costofgoodssold 4,25,000 5,00,000 +75,000 +17.65GrossProfit 2,25,000 2,25,000 – –Operating Expenses:Selling&distributionexpenses
60,000 75,000 +15,000 +25.00
GeneralExpenses 25,000 40,000 +15,000 +60.00TotalOperatingExpenses 85,000 1,15,000 +30,000 +35.29OperatingProfit 1,40,000 1,10,000 –30,000 – 21.43
Interpretation
Acursorystudyoftheabovecomparativeincomestatement(seeIllustration2.2)revealsthefollowing: •There issignificantchangein theoperatingprofit incomparisonto
otheritemsoftheincomestatementasithasdeclinedby21.43percentduringtheperiodunderstudy.
•Althoughtheamountofnetsaleshasincreasedby11.54percentduringtheperiodunderstudyyetthecostofgoodssoldhasincreasedby17.65percentthathasneutralizedthebenefitgainedfromtheincreaseinsales.Consequently,theamountofgrossprofithasremainedconstant.
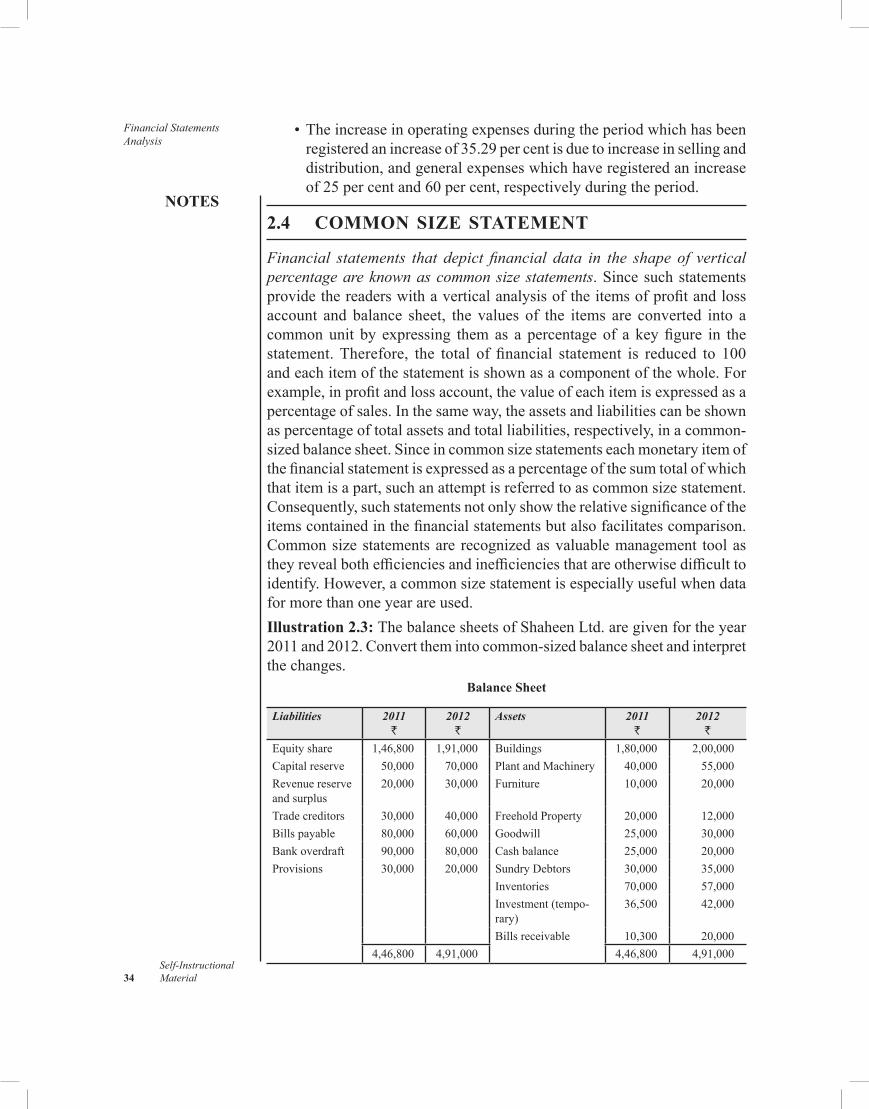
Financial Statements Analysis
NOTES
Self-Instructional 34 Material
•Theincreaseinoperatingexpensesduringtheperiodwhichhasbeenregisteredanincreaseof35.29percentisduetoincreaseinsellinganddistribution,andgeneralexpenseswhichhaveregisteredanincreaseof25percentand60percent,respectivelyduringtheperiod.
2.4 COMMON SIZE STATEMENT
Financial statements that depict financial data in the shape of vertical percentage are known as common size statements.Sincesuchstatementsprovidethereaderswithaverticalanalysisoftheitemsofprofitandlossaccount and balance sheet, the values of the items are converted into acommonunit by expressing themas a percentage of a keyfigure in thestatement.Therefore, the total of financial statement is reduced to 100andeachitemofthestatementisshownasacomponentofthewhole.Forexample,inprofitandlossaccount,thevalueofeachitemis expressedasapercentageofsales.Inthesameway,theassetsandliabilitiescanbeshownaspercentageoftotal assetsandtotalliabilities,respectively,inacommon-sizedbalancesheet.Sinceincommonsizestatementseachmonetaryitem of thefinancialstatementisexpressedasapercentageofthesumtotalofwhichthatitemisapart,suchanattemptisreferredtoascommonsizestatement.Consequently,suchstatementsnotonlyshowtherelativesignificance oftheitemscontainedinthefinancialstatementsbutalsofacilitatescomparison.Commonsizestatementsare recognizedasvaluablemanagement toolastheyrevealbothefficienciesand inefficienciesthatareotherwisedifficulttoidentify.However,acommonsize statementisespeciallyusefulwhendataformorethanoneyearareused.Illustration 2.3: ThebalancesheetsofShaheenLtd.aregivenfortheyear2011and2012.Convertthemintocommon-sizedbalancesheetandinterpretthechanges.
Balance Sheet
Liabilities 2011`
2012`
Assets 2011`
2012`
Equityshare 1,46,800 1,91,000 Buildings 1,80,000 2,00,000Capitalreserve 50,000 70,000 PlantandMachinery 40,000 55,000Revenuereserveandsurplus
20,000 30,000 Furniture 10,000 20,000
Trade creditors 30,000 40,000 FreeholdProperty 20,000 12,000Billspayable 80,000 60,000 Goodwill 25,000 30,000Bankoverdraft 90,000 80,000 Cashbalance 25,000 20,000Provisions 30,000 20,000 Sundry Debtors 30,000 35,000
Inventories 70,000 57,000Investment (tempo-rary)
36,500 42,000
Billsreceivable 10,300 20,0004,46,800 4,91,000 4,46,800 4,91,000
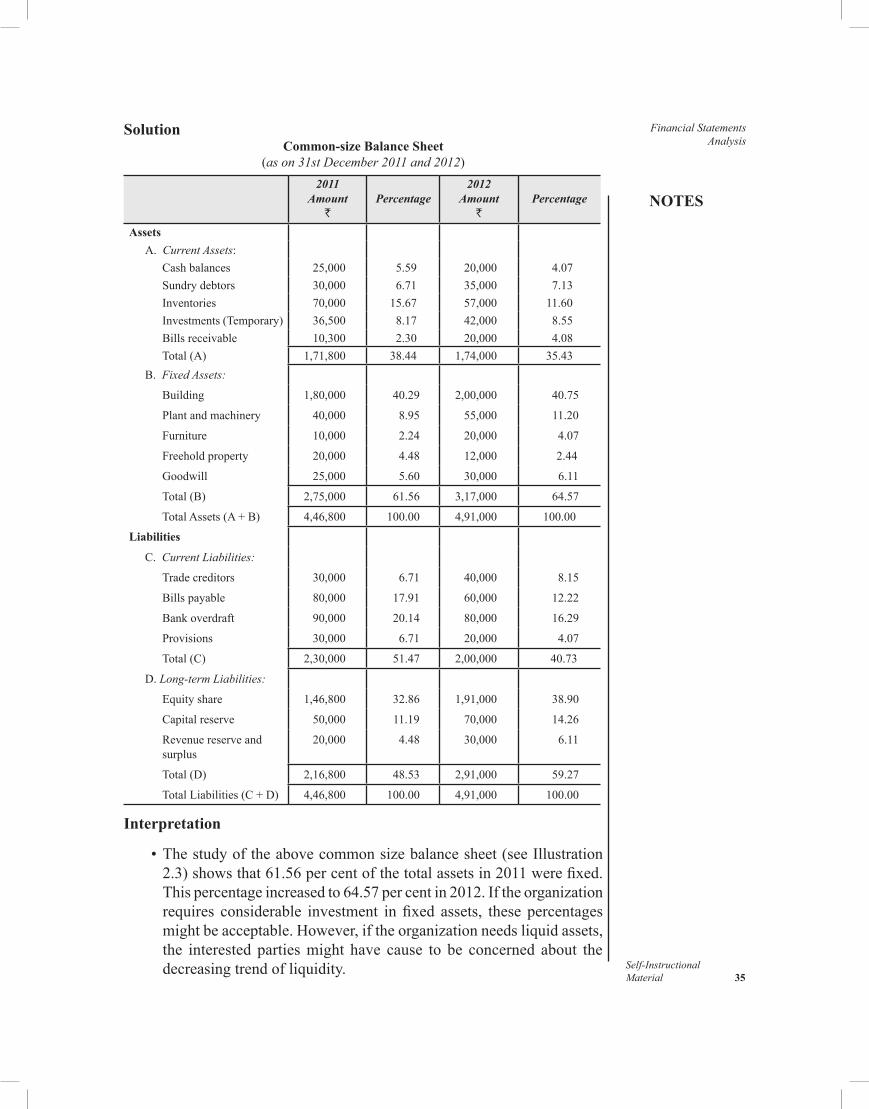
NOTES
Self-InstructionalMaterial 35
Financial Statements Analysis
SolutionCommon-size Balance Sheet
(as on 31st December 2011 and 2012)2011
Amount`
Percentage
2012Amount
`
Percentage
AssetsA. Current Assets:
Cash balances 25,000 5.59 20,000 4.07Sundry debtors 30,000 6.71 35,000 7.13Inventories 70,000 15.67 57,000 11.60Investments (Temporary) 36,500 8.17 42,000 8.55Bills receivable 10,300 2.30 20,000 4.08Total (A) 1,71,800 38.44 1,74,000 35.43
B. Fixed Assets:
Building 1,80,000 40.29 2,00,000 40.75
Plant and machinery 40,000 8.95 55,000 11.20
Furniture 10,000 2.24 20,000 4.07
Freehold property 20,000 4.48 12,000 2.44
Goodwill 25,000 5.60 30,000 6.11
Total (B) 2,75,000 61.56 3,17,000 64.57
Total Assets (A + B) 4,46,800 100.00 4,91,000 100.00
Liabilities
C. Current Liabilities:
Trade creditors 30,000 6.71 40,000 8.15
Bills payable 80,000 17.91 60,000 12.22
Bank overdraft 90,000 20.14 80,000 16.29
Provisions 30,000 6.71 20,000 4.07
Total (C) 2,30,000 51.47 2,00,000 40.73
D. Long-term Liabilities:
Equity share 1,46,800 32.86 1,91,000 38.90
Capital reserve 50,000 11.19 70,000 14.26
Revenue reserve and surplus
20,000 4.48 30,000 6.11
Total (D) 2,16,800 48.53 2,91,000 59.27
Total Liabilities (C + D) 4,46,800 100.00 4,91,000 100.00
Interpretation
•Thestudyoftheabovecommonsizebalancesheet(seeIllustration2.3)showsthat61.56percentofthetotalassetsin2011werefixed.Thispercentageincreasedto64.57percentin2012.Iftheorganizationrequires considerable investment infixed assets, these percentagesmightbeacceptable.However,iftheorganizationneedsliquidassets,the interested parties might have cause to be concerned about the decreasing trend of liquidity.
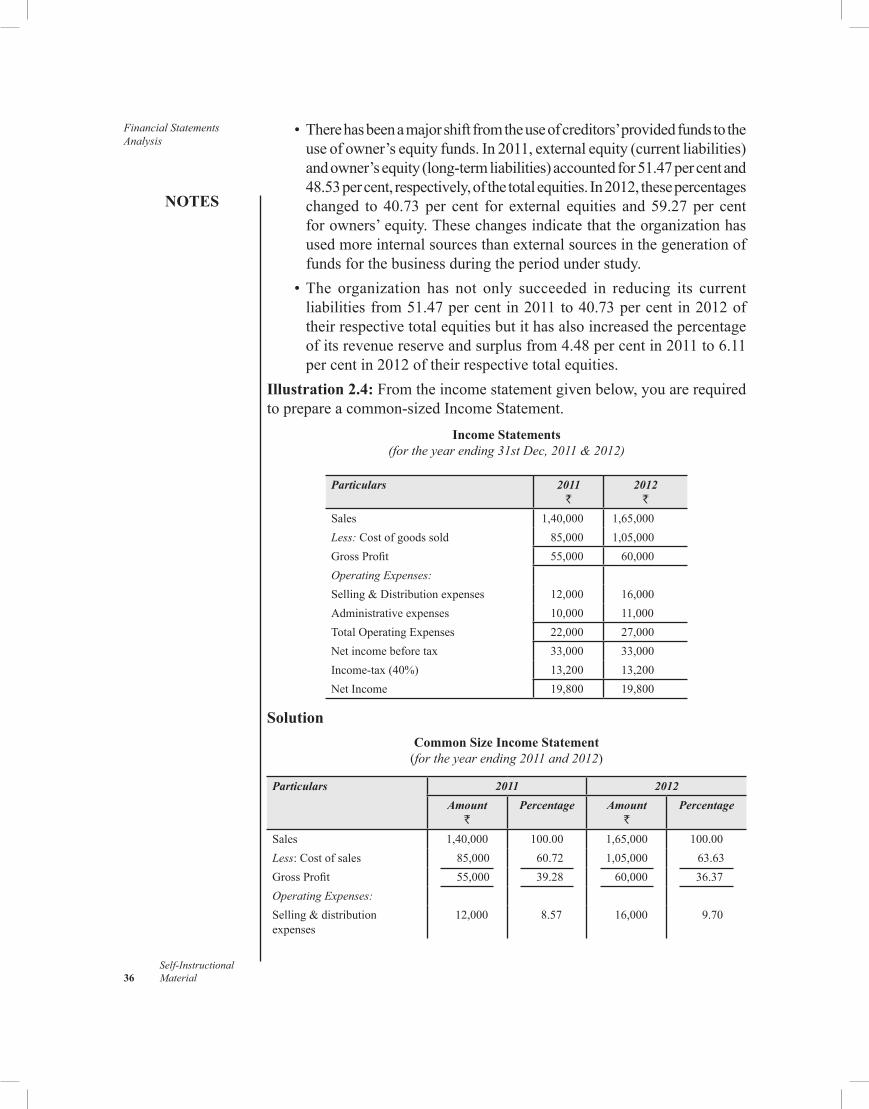
Financial Statements Analysis
NOTES
Self-Instructional 36 Material
•Therehasbeenamajorshiftfromtheuseofcreditors’providedfundstotheuseofowner’sequityfunds.In2011,externalequity(currentliabilities)andowner’sequity(long-termliabilities)accountedfor51.47percentand48.53 per cent, respectively, of the total equities. In 2012, these percentages changed to 40.73per cent for external equities and59.27per cent forowners’equity.Thesechangesindicatethattheorganizationhasusedmoreinternalsourcesthanexternalsourcesinthegenerationoffunds for the business during the period under study.
•The organization has not only succeeded in reducing its currentliabilities from 51.47 per cent in 2011 to 40.73 per cent in 2012 of their respective total equities but it has also increased the percentage of its revenue reserve and surplus from 4.48 per cent in 2011 to 6.11 per cent in 2012 of their respective total equities.
Illustration 2.4: From the income statement given below, you are required toprepareacommon-sizedIncomeStatement.
Income Statements (for the year ending 31st Dec, 2011 & 2012)
Particulars 2011`
2012`
Sales 1,40,000 1,65,000Less: Cost of goods sold 85,000 1,05,000GrossProfit 55,000 60,000Operating Expenses:Selling&Distributionexpenses 12,000 16,000Administrativeexpenses 10,000 11,000TotalOperatingExpenses 22,000 27,000Netincomebeforetax 33,000 33,000Income-tax(40%) 13,200 13,200Net Income 19,800 19,800
SolutionCommon Size Income Statement
(for the year ending 2011 and 2012)
Particulars 2011 2012Amount
`Percentage Amount
`Percentage
Sales 1,40,000 100.00 1,65,000 100.00Less: Cost of sales 85,000 60.72 1,05,000 63.63GrossProfit 55,000 39.28 60,000 36.37Operating Expenses:Selling & distribution expenses
12,000 8.57 16,000 9.70
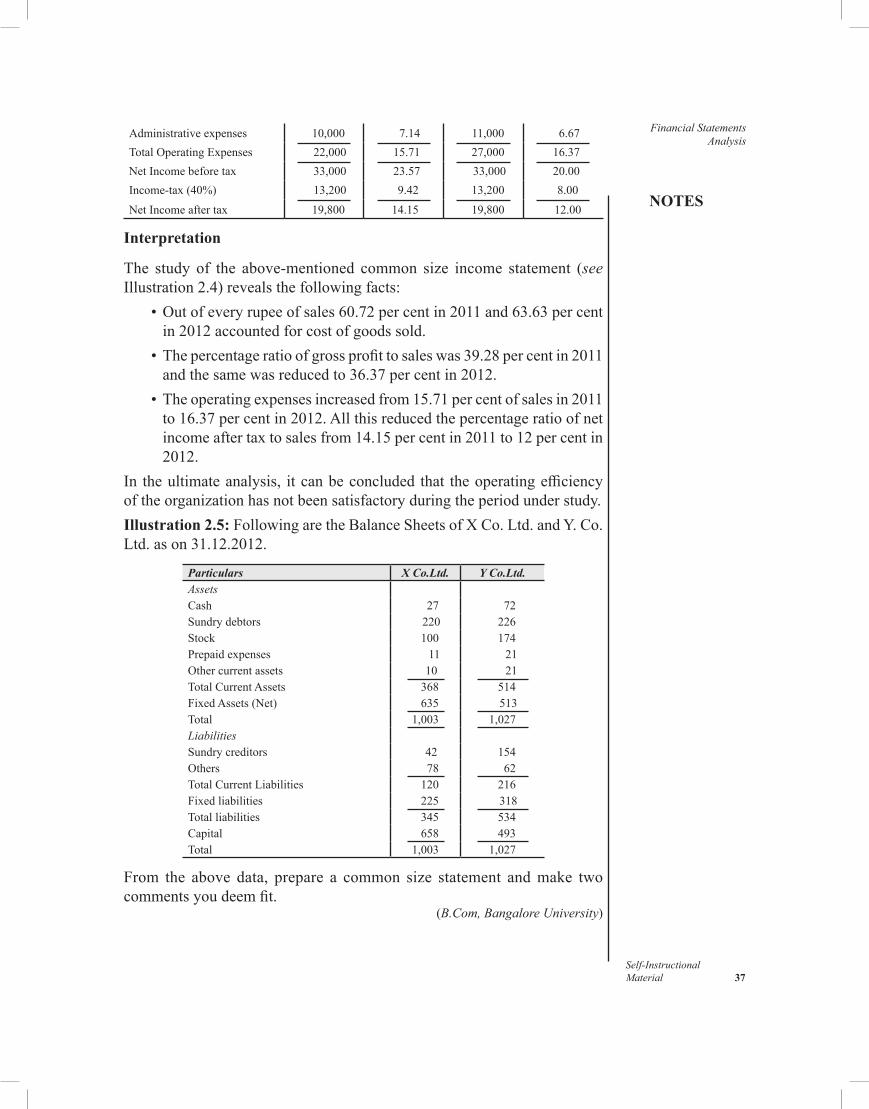
NOTES
Self-InstructionalMaterial 37
Financial Statements Analysis
Administrativeexpenses 10,000 7.14 11,000 6.67TotalOperatingExpenses 22,000 15.71 27,000 16.37NetIncomebeforetax 33,000 23.57 33,000 20.00Income-tax(40%) 13,200 9.42 13,200 8.00NetIncomeaftertax 19,800 14.15 19,800 12.00
Interpretation
The study of the above-mentioned common size income statement (see Illustration2.4)revealsthefollowingfacts: •Outofeveryrupeeofsales60.72percentin2011and63.63percent
in2012accountedforcostofgoodssold. •Thepercentageratioofgrossprofittosaleswas39.28percentin2011
andthesamewasreducedto36.37percentin2012. •Theoperatingexpensesincreasedfrom15.71percentofsalesin2011
to16.37percentin2012.Allthisreducedthepercentageratioofnetincomeaftertaxtosalesfrom14.15percentin2011to12percentin2012.
In theultimateanalysis, itcanbeconcluded that theoperatingefficiencyoftheorganizationhasnotbeensatisfactoryduringtheperiodunderstudy.Illustration 2.5: FollowingaretheBalanceSheetsofXCo.Ltd.andY.Co.Ltd. as on 31.12.2012.
Particulars X Co.Ltd. Y Co.Ltd.AssetsCash 27 72Sundry debtors 220 226Stock 100 174Prepaidexpenses 11 21Othercurrentassets 10 21TotalCurrentAssets 368 514FixedAssets(Net) 635 513Total 1,003 1,027LiabilitiesSundry creditors 42 154Others 78 62TotalCurrentLiabilities 120 216Fixedliabilities 225 318Totalliabilities 345 534Capital 658 493Total 1,003 1,027
From the above data, prepare a common size statement andmake twocommentsyoudeemfit.
(B.Com, Bangalore University)
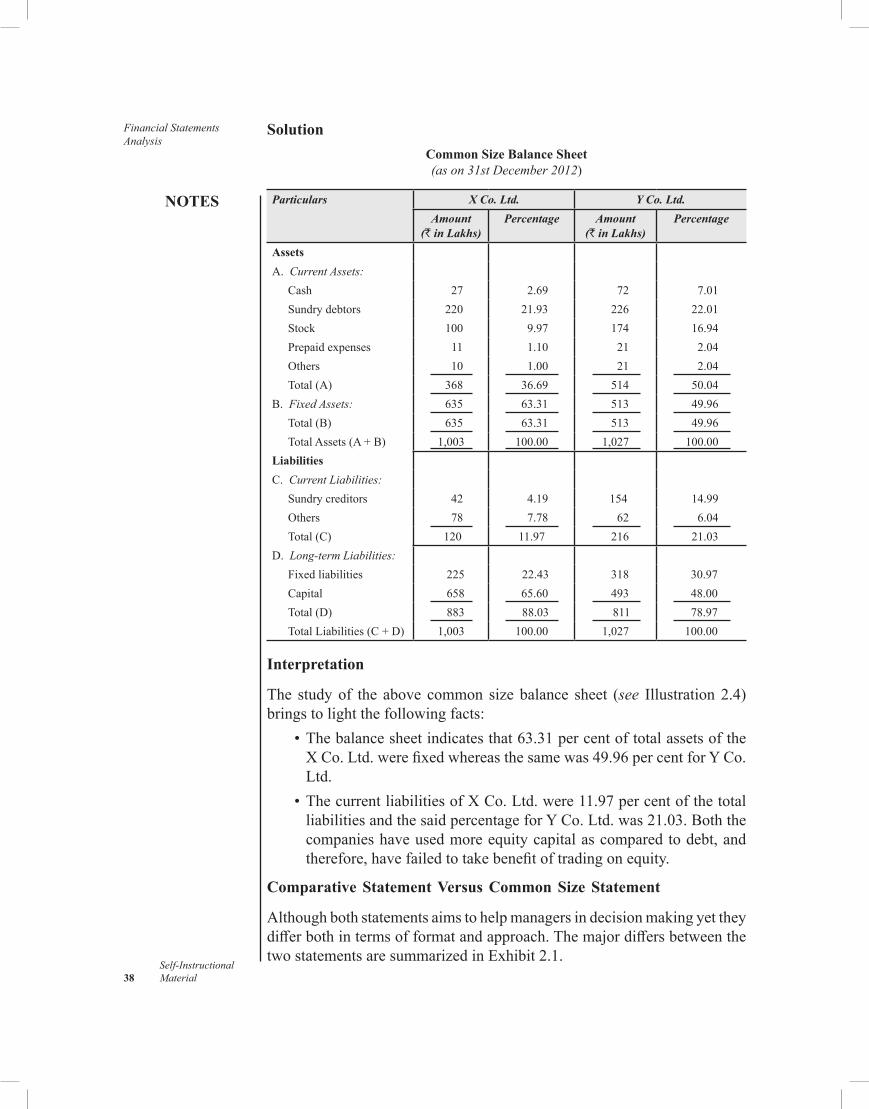
Financial Statements Analysis
NOTES
Self-Instructional 38 Material
SolutionCommon Size Balance Sheet (as on 31st December 2012)
Particulars X Co. Ltd. Y Co. Ltd.Amount
(` in Lakhs)Percentage Amount
(` in Lakhs)Percentage
AssetsA. Current Assets:
Cash 27 2.69 72 7.01Sundry debtors 220 21.93 226 22.01Stock 100 9.97 174 16.94Prepaidexpenses 11 1.10 21 2.04Others 10 1.00 21 2.04Total(A) 368 36.69 514 50.04
B. Fixed Assets: 635 63.31 513 49.96Total(B) 635 63.31 513 49.96TotalAssets(A+B) 1,003 100.00 1,027 100.00
LiabilitiesC. Current Liabilities:
Sundry creditors 42 4.19 154 14.99Others 78 7.78 62 6.04Total(C) 120 11.97 216 21.03
D. Long-term Liabilities:Fixedliabilities 225 22.43 318 30.97Capital 658 65.60 493 48.00Total(D) 883 88.03 811 78.97TotalLiabilities(C+D) 1,003 100.00 1,027 100.00
Interpretation
The studyof the above common sizebalance sheet (see Illustration2.4)bringstolightthefollowingfacts: •Thebalancesheetindicatesthat63.31percentoftotalassetsofthe
XCo.Ltd.werefixedwhereasthesamewas49.96percentforYCo.Ltd.
•ThecurrentliabilitiesofXCo.Ltd.were11.97percentofthetotalliabilitiesandthesaidpercentageforYCo.Ltd.was21.03.Boththecompanieshaveusedmoreequitycapitalascomparedtodebt,andtherefore,havefailedtotakebenefitoftradingonequity.
Comparative Statement Versus Common Size Statement
Althoughbothstatementsaimstohelpmanagersindecisionmakingyettheydifferbothintermsofformatandapproach.ThemajordiffersbetweenthetwostatementsaresummarizedinExhibit2.1.
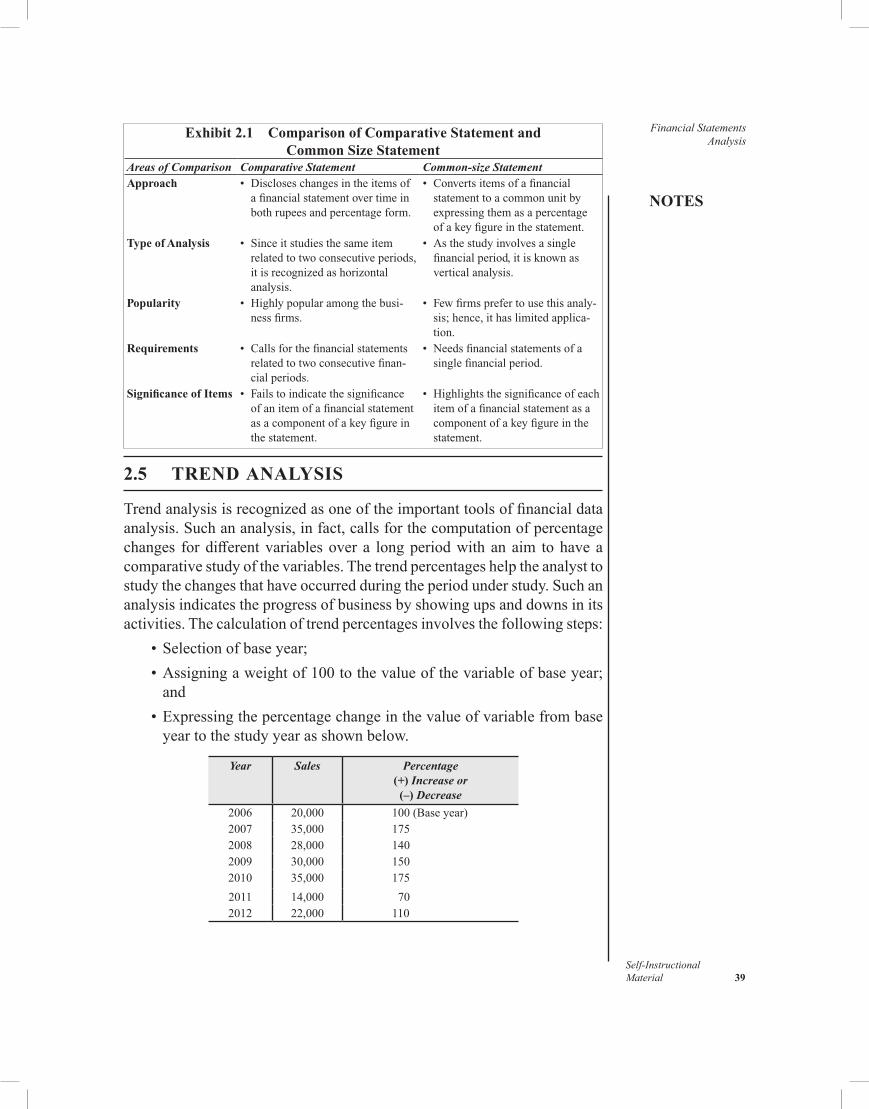
NOTES
Self-InstructionalMaterial 39
Financial Statements AnalysisExhibit 2.1 Comparison of Comparative Statement and
Common Size StatementAreas of Comparison Comparative Statement Common-size StatementApproach • Discloseschangesintheitemsof
afinancialstatementovertimeinbothrupeesandpercentageform.
• Convertsitemsofafinancialstatementtoacommonunitbyexpressingthemasapercentageofakeyfigureinthestatement.
Type of Analysis • Sinceitstudiesthesameitemrelatedtotwoconsecutiveperiods,itisrecognizedashorizontalanalysis.
• Asthestudyinvolvesasinglefinancialperiod,itisknownasverticalanalysis.
Popularity • Highlypopularamongthebusi-nessfirms.
• Fewfirmsprefertousethisanaly-sis;hence,ithaslimitedapplica-tion.
Requirements • Callsforthefinancialstatementsrelatedtotwoconsecutivefinan-cialperiods.
• Needsfinancialstatementsofasinglefinancialperiod.
Significance of Items • Failstoindicatethesignificanceofanitemofafinancialstatementasacomponentofakeyfigureinthestatement.
• Highlightsthesignificanceofeachitemofafinancialstatementasacomponentofakeyfigureinthestatement.
2.5 TREND ANALYSIS
Trendanalysisisrecognizedasoneoftheimportanttoolsoffinancialdataanalysis.Suchananalysis,infact,callsforthecomputationofpercentagechanges fordifferentvariablesover a longperiodwithanaim tohaveacomparativestudyofthevariables.Thetrendpercentageshelptheanalysttostudythechangesthathaveoccurredduringtheperiodunderstudy.Suchananalysisindicatestheprogressofbusinessbyshowingupsanddownsinitsactivities.Thecalculationoftrendpercentagesinvolvesthefollowingsteps: •Selectionofbaseyear; •Assigningaweightof100tothevalueofthevariableofbaseyear;
and •Expressingthepercentagechangeinthevalueofvariablefrombase
yeartothestudyyearasshownbelow.
Year Sales Percentage (+) Increase or (–) Decrease
2006 20,000 100(Baseyear)2007 35,000 1752008 28,000 1402009 30,000 1502010 35,000 1752011 14,000 702012 22,000 110
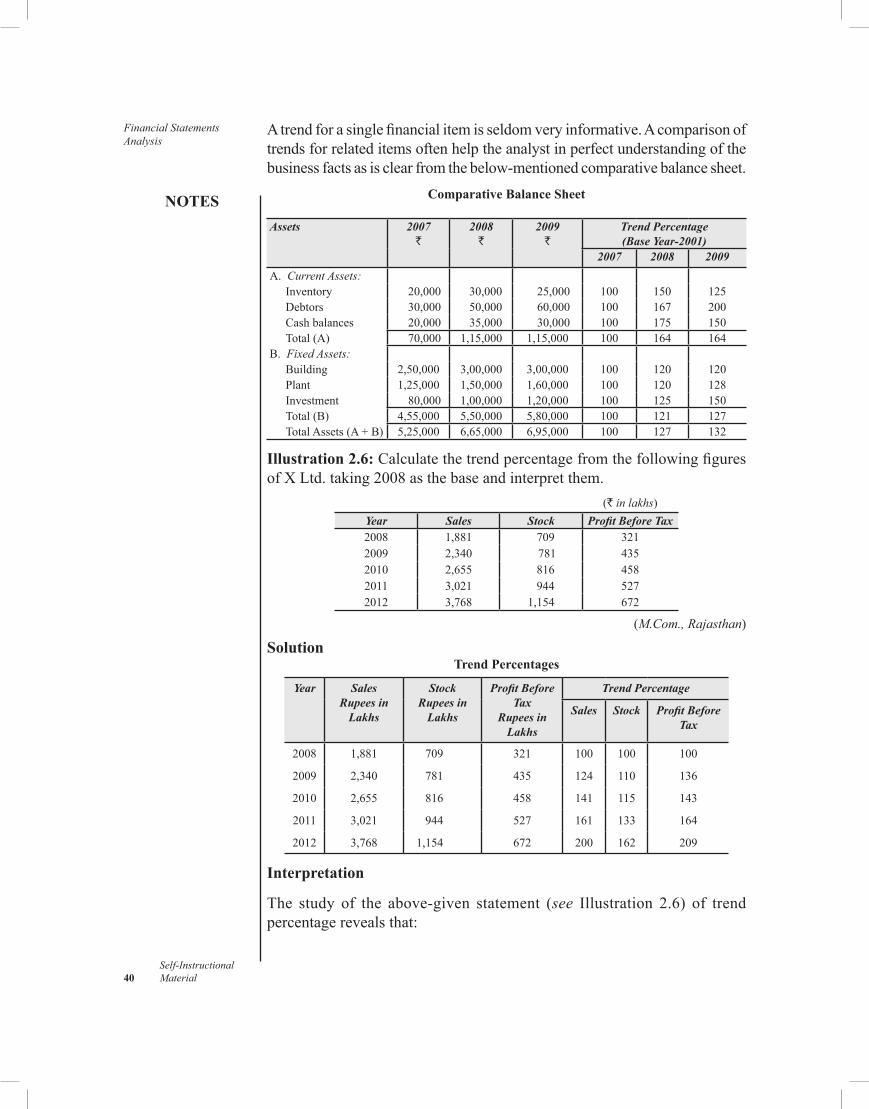
Financial Statements Analysis
NOTES
Self-Instructional 40 Material
Atrendforasinglefinancialitemisseldomveryinformative.Acomparisonoftrendsforrelateditemsoftenhelptheanalystinperfectunderstandingofthebusinessfactsasisclearfromthebelow-mentionedcomparativebalancesheet.
Comparative Balance Sheet
Assets 2007`
2008`
2009`
Trend Percentage(Base Year-2001)
2007 2008 2009A. Current Assets:
Inventory 20,000 30,000 25,000 100 150 125Debtors 30,000 50,000 60,000 100 167 200Cashbalances 20,000 35,000 30,000 100 175 150Total(A) 70,000 1,15,000 1,15,000 100 164 164
B. Fixed Assets:Building 2,50,000 3,00,000 3,00,000 100 120 120Plant 1,25,000 1,50,000 1,60,000 100 120 128Investment 80,000 1,00,000 1,20,000 100 125 150Total(B) 4,55,000 5,50,000 5,80,000 100 121 127TotalAssets(A+B) 5,25,000 6,65,000 6,95,000 100 127 132
Illustration 2.6: CalculatethetrendpercentagefromthefollowingfiguresofXLtd.taking2008asthebaseandinterpretthem.
(` in lakhs)Year Sales Stock Profit Before Tax2008 1,881 709 3212009 2,340 781 4352010 2,655 816 4582011 3,021 944 5272012 3,768 1,154 672
(M.Com., Rajasthan)
SolutionTrend Percentages
Year Sales Rupees in
Lakhs
Stock Rupees in
Lakhs
Profit Before Tax
Rupees in Lakhs
Trend Percentage
Sales Stock Profit Before Tax
2008 1,881 709 321 100 100 100
2009 2,340 781 435 124 110 136
2010 2,655 816 458 141 115 143
2011 3,021 944 527 161 133 164
2012 3,768 1,154 672 200 162 209
Interpretation
The study of the above-given statement (see Illustration 2.6) of trendpercentagerevealsthat:
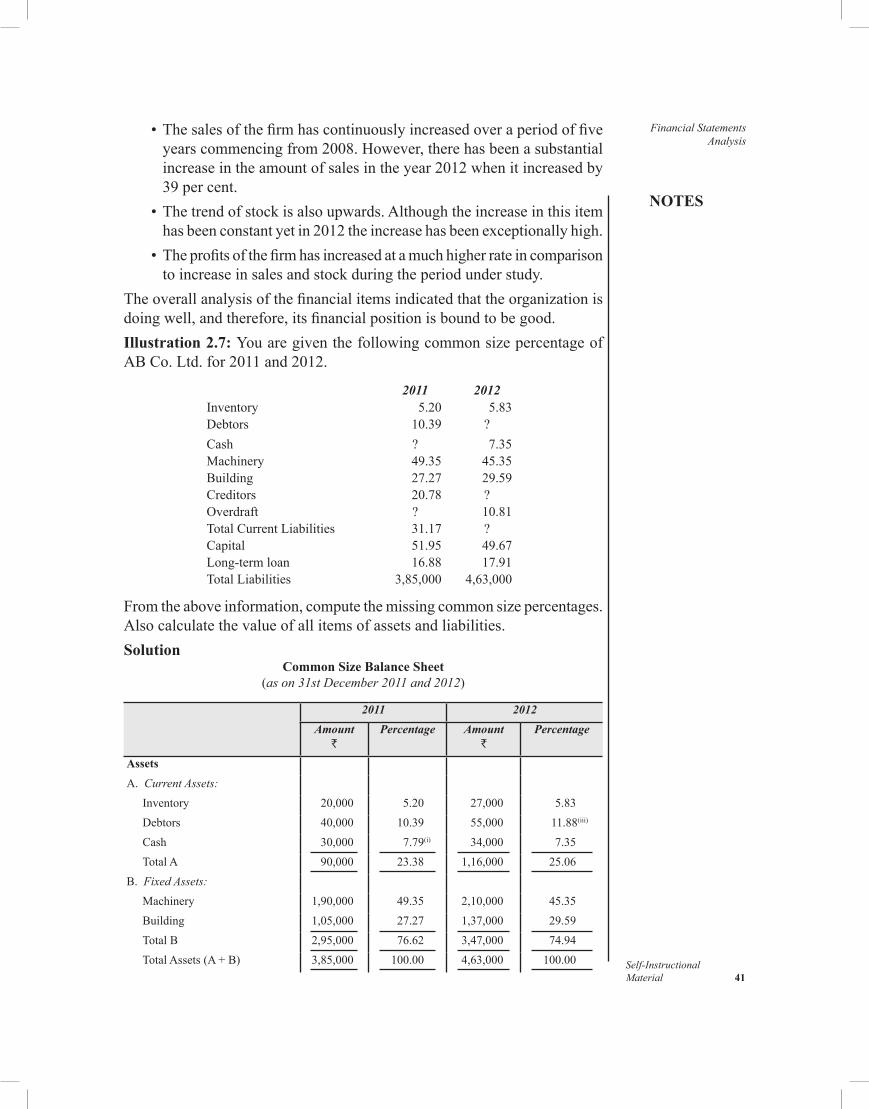
NOTES
Self-InstructionalMaterial 41
Financial Statements Analysis
•Thesalesofthefirmhascontinuouslyincreasedoveraperiodoffiveyearscommencingfrom2008.However,therehasbeenasubstantialincreaseintheamountofsalesintheyear2012whenitincreasedby39 per cent.
•Thetrendofstockisalsoupwards.Althoughtheincreaseinthisitemhasbeenconstantyetin2012theincreasehasbeenexceptionallyhigh.
•Theprofitsofthefirmhasincreasedatamuchhigherrateincomparisontoincreaseinsalesandstockduringtheperiodunderstudy.
Theoverallanalysisofthefinancialitemsindicatedthattheorganizationisdoingwell,andtherefore,itsfinancialpositionisboundtobegood.Illustration 2.7: YouaregiventhefollowingcommonsizepercentageofABCo.Ltd.for2011and2012.
2011 2012Inventory 5.20 5.83Debtors 10.39 ?Cash ? 7.35Machinery 49.35 45.35Building 27.27 29.59Creditors 20.78 ?Overdraft ? 10.81TotalCurrentLiabilities 31.17 ?Capital 51.95 49.67Long-termloan 16.88 17.91TotalLiabilities 3,85,000 4,63,000
Fromtheaboveinformation,computethemissingcommonsizepercentages.Alsocalculatethevalueofallitemsofassetsandliabilities.Solution
Common Size Balance Sheet (as on 31st December 2011 and 2012)
2011 2012Amount
`Percentage Amount
`Percentage
Assets
A. Current Assets:Inventory 20,000 5.20 27,000 5.83Debtors 40,000 10.39 55,000 11.88(iii)
Cash 30,000 7.79(i) 34,000 7.35TotalA 90,000 23.38 1,16,000 25.06
B. Fixed Assets:Machinery 1,90,000 49.35 2,10,000 45.35Building 1,05,000 27.27 1,37,000 29.59TotalB 2,95,000 76.62 3,47,000 74.94TotalAssets(A+B) 3,85,000 100.00 4,63,000 100.00
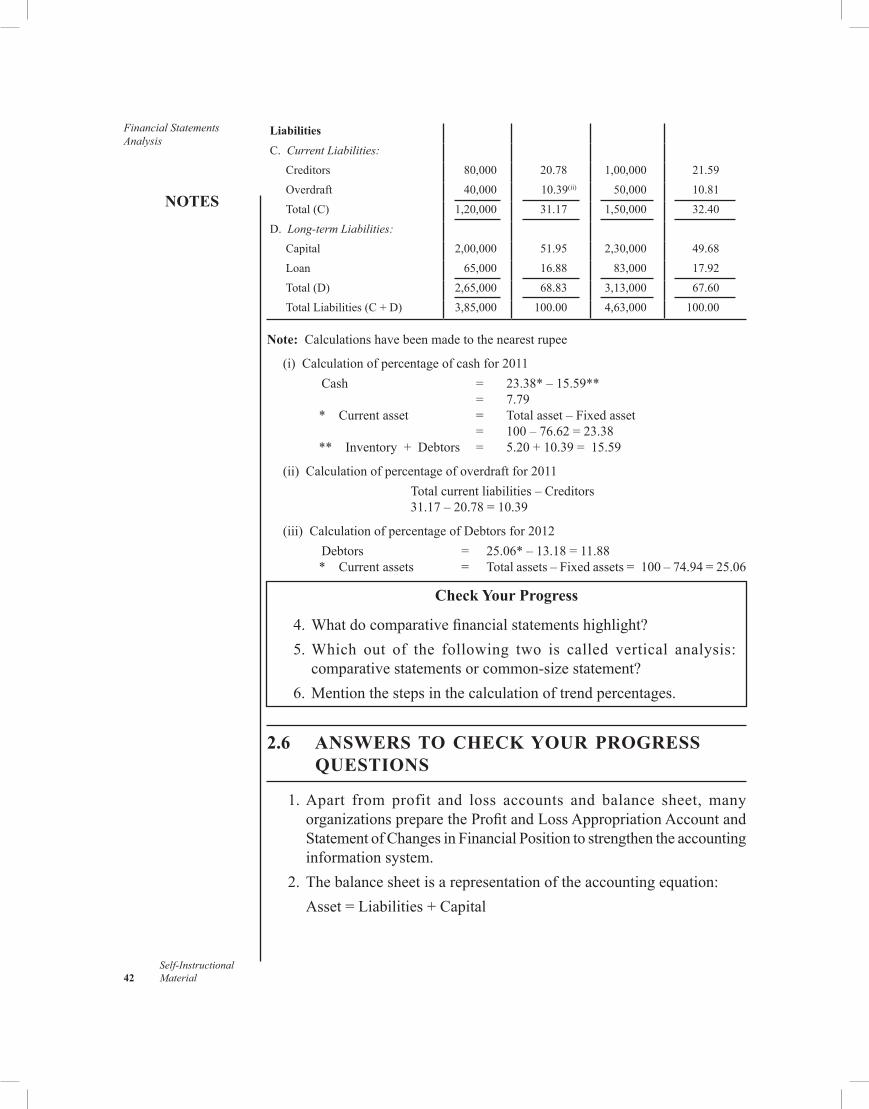
Financial Statements Analysis
NOTES
Self-Instructional 42 Material
Liabilities
C. Current Liabilities:Creditors 80,000 20.78 1,00,000 21.59Overdraft 40,000 10.39(ii) 50,000 10.81Total(C) 1,20,000 31.17 1,50,000 32.40
D. Long-term Liabilities:Capital 2,00,000 51.95 2,30,000 49.68Loan 65,000 16.88 83,000 17.92Total(D) 2,65,000 68.83 3,13,000 67.60TotalLiabilities(C+D) 3,85,000 100.00 4,63,000 100.00
Note: Calculationshavebeenmadetothenearestrupee
(i) Calculationofpercentageofcashfor2011Cash = 23.38*–15.59**
= 7.79* Currentasset = Totalasset–Fixedasset
= 100 – 76.62 = 23.38** Inventory+Debtors = 5.20+10.39=15.59
(ii) Calculationofpercentageofoverdraftfor2011Totalcurrentliabilities–Creditors31.17 – 20.78 = 10.39
(iii) CalculationofpercentageofDebtorsfor2012Debtors = 25.06*–13.18=11.88* Currentassets = Totalassets–Fixedassets= 100–74.94=25.06
Check Your Progress
4.Whatdocomparativefinancialstatementshighlight? 5.Which out of the following two is called vertical analysis:
comparativestatementsorcommon-sizestatement? 6.Mentionthestepsinthecalculationoftrendpercentages.
2.6 ANSWERS TO CHECK YOUR PROGRESS QUESTIONS
1.Apart from profit and loss accounts and balance sheet, manyorganizationspreparetheProfitandLossAppropriationAccountandStatementofChangesinFinancialPositiontostrengthentheaccountinginformation system.
2.Thebalancesheetisarepresentationoftheaccountingequation: Asset=Liabilities+Capital
NOTES
Self-InstructionalMaterial 43
Financial Statements Analysis
3.Facts like competition, conflict, loyalty, etc., directly influence theconcern’s profitability cannot be expressed inmonetary units, andtherefore,areignoredinfinancialstatements.
4.Comparative financial statements highlight trends and establishrelationshipbetweenitemsthatappearonthesameofthestatement.
5.Asthecommon-sizestatementinvolvesasinglefinancialperiod,itisknownasverticalanalysis.
6.Thecalculationoftrendpercentagesinvolvesthefollowingsteps:• Selectionofbaseyear• Assigningaweightof100tothevalueofthevariableofbaseyear,
and • Expressingthepercentagechangeinthevalueofvariablefrombase
yeartothestudyyear.
2.7 SUMMARY
•The fundamental, clear and definite understanding of financialstatementsisrecognizedasprerequisiteforanaccurate,completeandrelevantfinancialdecision.
•Financialstatementsaretheinstrumentalpanelsofabusinesswhichprovideasummaryoftheaccountsofabusinessorganization.
•Anaccountthatshowsthedistributionofprofitisknownasprofitandlossappropriationaccounts.
•Thestatementofchangesinfinancialpositionoftenreferredtoasthefundsflow statement, provides information about theflowof fund(workingcapital)duringaparticularperiod.
•Profitandlossaccountreportstheresultsofbusinessactivitiesforanaccounting period.
•Balancesheetisastatementwhichdisclosesthefinancialstatusoftheenterprise,consistingofthevaluesassignedtoitsassets,liabilitiesandowner’sequity,ataspecifictime.
•Liabilities denote the amountwhich a business owes to others ondifferentaccounts.
•Currentliabilitiesrepresentshort-termfinancialobligationswhichareexpectedtobepaidwithinthecomingyearorthenormaloperatingcycle.
•Long-termliabilitiesareliabilitiesthatarenotexpectedtoberepaidwithinthecomingyearbutarelongtermbynature.
•Owner’sequityrepresentstheamountofliabilitiesforwhichtheownersofabusinesshaveclaim.
Financial Statements Analysis
NOTES
Self-Instructional 44 Material
•Assets arematerial things or possessionsor properties of businessincludingtheamountduetoitfromothers.
•Currentassetsrepresentcashplusthoseassetsthatareexpectedtobeconvertedintocashorconsumedduringtheyearornormaloperatingcycle,e.g.,stock,sundrydebtors,billsreceivable,etc.
•Fixedassetsarethoseassetswhicharetobeusedinbusinessoperationoverarelativelylongperiodoftime.
• Intangibleassetsalsoknownasfictitiousassetsarenotrepresentedbyanytangiblepossessionorproperty.
•Financial statement analysis involves a systematic and carefulexaminationoftheinformationcontainedinthefinancialstatementswithaspecificpurpose.
•Comparativefinancialstatementreportscomparingdataoftwoormoreconsecutive accountingperiods is known as comparativefinancialstatement.
•Commonsizestatementsdepictingfinancialdataintheshapeofverticalpercentageareknownascommonsizestatements.
•Trendanalysiswhichisoneoftheimportanttoolsofanalysingfinancialdatacomputesthepercentagechangesfordifferentvariablesoveralongperiodandthenmakesacomparativestudyofthem.
2.8 KEY WORDS
•Financial statements: It refers to the reporting instruments thatprovideasummaryoftheaccountingdataofanorganization’sbusinesspertainingtoaspecificaccountingperiod.
•Financial statement analysis: It involvesasystematicandcarefulexaminationoftheinformationcontainedinthefinancialstatementswithadefinitepurpose.
•Comparative financial statement:Itreferstoanyfinancialstatementthat reports the comparison of data for two ormore consecutiveaccounting periods.
•Common size statements: It refers to thefinancialstatements thatdepictfinancialdataintheshapeofverticalpercentage.
•Trend analysis:Itisatooloffinancialstatementanalysiswhichcallsforthecomputationofpercentagechangesfordifferentvariablesoveralongperiodwithanaimtohaveacomparativestudyofthevariables.
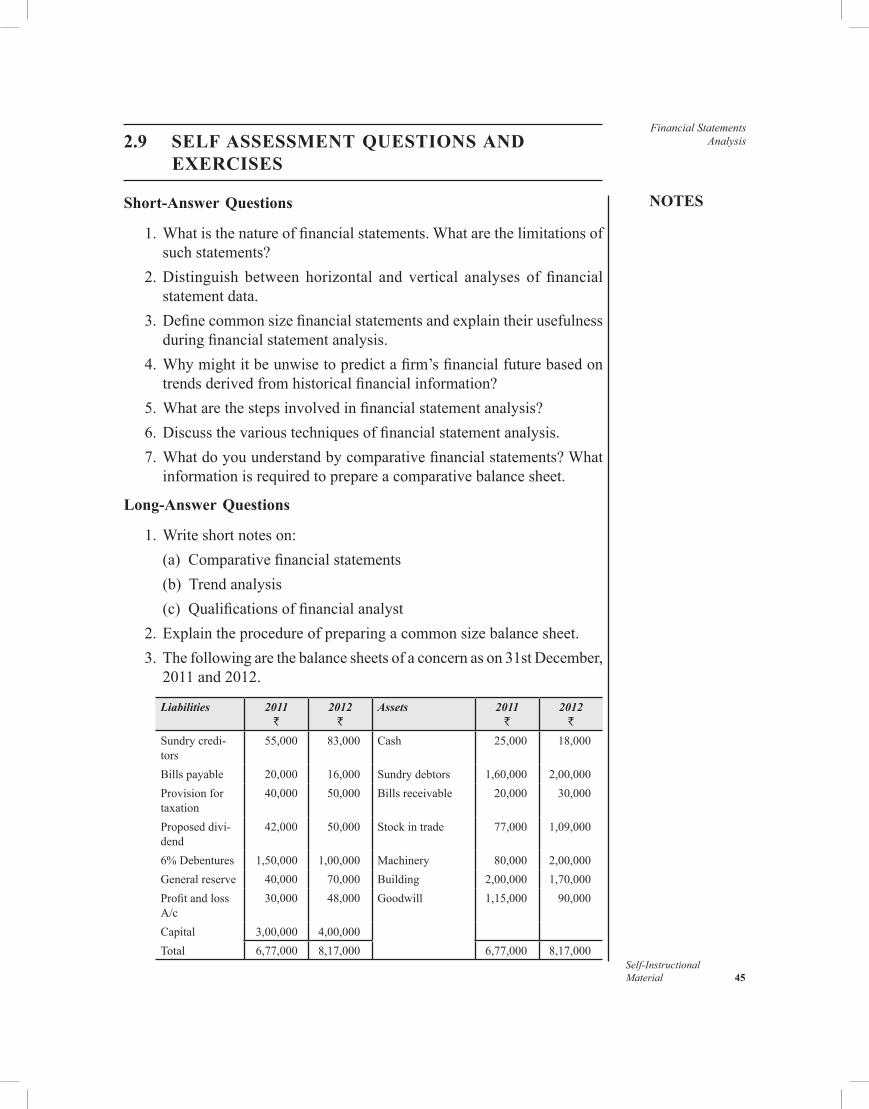
NOTES
Self-InstructionalMaterial 45
Financial Statements Analysis2.9 SELF ASSESSMENT QUESTIONS AND
EXERCISES
Short-Answer Questions
1.Whatisthenatureoffinancialstatements.Whatarethelimitationsofsuchstatements?
2.Distinguish between horizontal and vertical analyses of financialstatement data.
3.Definecommonsizefinancialstatementsandexplaintheirusefulnessduringfinancialstatementanalysis.
4.Whymightitbeunwisetopredictafirm’sfinancialfuturebasedontrendsderivedfromhistoricalfinancialinformation?
5.Whatarethestepsinvolvedinfinancialstatementanalysis? 6.Discussthevarioustechniquesoffinancialstatementanalysis. 7.Whatdoyouunderstandbycomparativefinancialstatements?What
informationisrequiredtoprepareacomparativebalancesheet.
Long-Answer Questions
1.Writeshortnoteson: (a) Comparativefinancialstatements (b) Trendanalysis (c) Qualificationsoffinancialanalyst 2.Explaintheprocedureofpreparingacommonsizebalancesheet. 3.Thefollowingarethebalancesheetsofaconcernason31stDecember,
2011 and 2012.
Liabilities 2011`
2012`
Assets 2011`
2012`
Sundry credi-tors
55,000 83,000 Cash 25,000 18,000
Billspayable 20,000 16,000 Sundry debtors 1,60,000 2,00,000Provisionfortaxation
40,000 50,000 Billsreceivable 20,000 30,000
Proposeddivi-dend
42,000 50,000 Stockintrade 77,000 1,09,000
6%Debentures 1,50,000 1,00,000 Machinery 80,000 2,00,000Generalreserve 40,000 70,000 Building 2,00,000 1,70,000ProfitandlossA/c
30,000 48,000 Goodwill 1,15,000 90,000
Capital 3,00,000 4,00,000Total 6,77,000 8,17,000 6,77,000 8,17,000
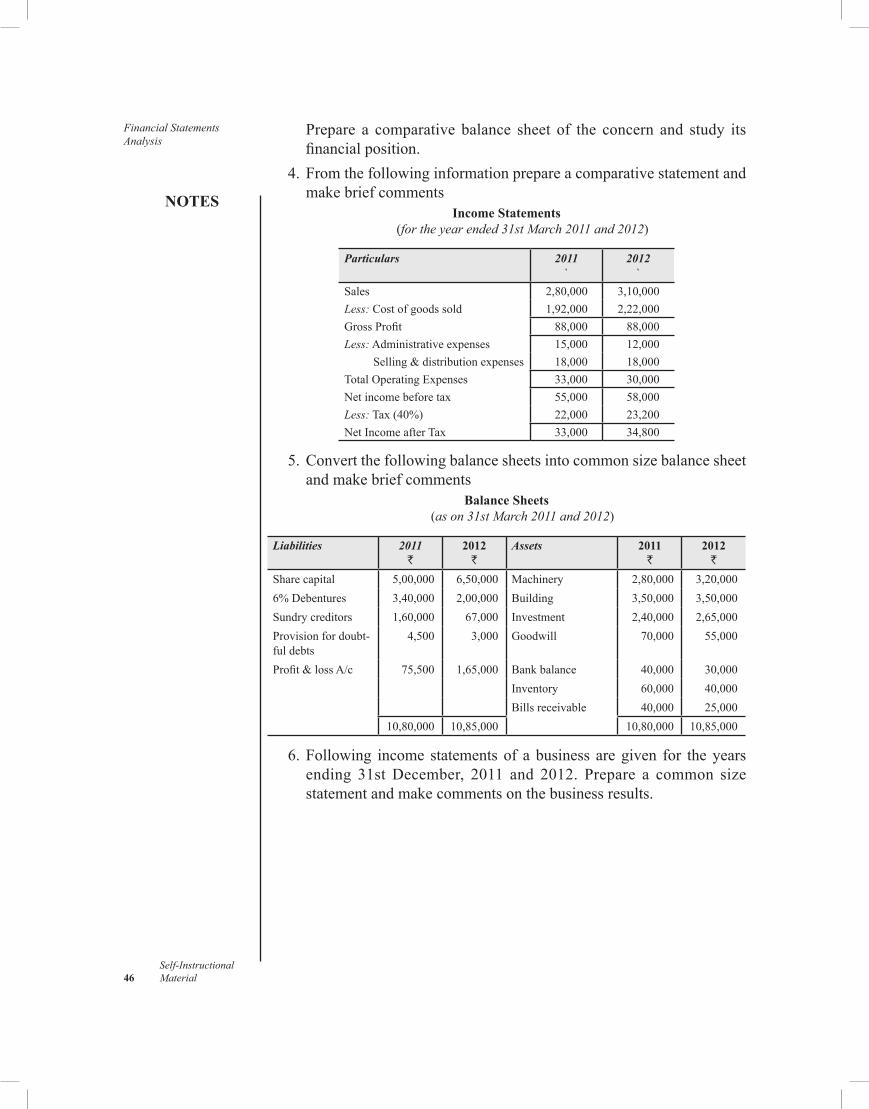
Financial Statements Analysis
NOTES
Self-Instructional 46 Material
Prepare a comparative balance sheet of the concern and study itsfinancialposition.
4.Fromthefollowinginformationprepareacomparativestatementandmakebriefcomments
Income Statements (for the year ended 31st March 2011 and 2012)
Particulars 2011`
2012`
Sales 2,80,000 3,10,000Less:Costofgoodssold 1,92,000 2,22,000GrossProfit 88,000 88,000Less:Administrativeexpenses 15,000 12,000 Selling&distributionexpenses 18,000 18,000TotalOperatingExpenses 33,000 30,000Netincomebeforetax 55,000 58,000Less:Tax(40%) 22,000 23,200NetIncomeafterTax 33,000 34,800
5.Convertthefollowingbalancesheetsintocommonsizebalancesheetandmakebriefcomments
Balance Sheets (as on 31st March 2011 and 2012)
Liabilities 2011`
2012`
Assets 2011`
2012`
Sharecapital 5,00,000 6,50,000 Machinery 2,80,000 3,20,0006%Debentures 3,40,000 2,00,000 Building 3,50,000 3,50,000Sundry creditors 1,60,000 67,000 Investment 2,40,000 2,65,000Provisionfordoubt-fuldebts
4,500 3,000 Goodwill 70,000 55,000
Profit&lossA/c 75,500 1,65,000 Bankbalance 40,000 30,000Inventory 60,000 40,000Billsreceivable 40,000 25,000
10,80,000 10,85,000 10,80,000 10,85,000
6.Following income statementsof abusiness aregiven for theyearsending 31stDecember, 2011 and 2012. Prepare a common sizestatementandmakecommentsonthebusinessresults.
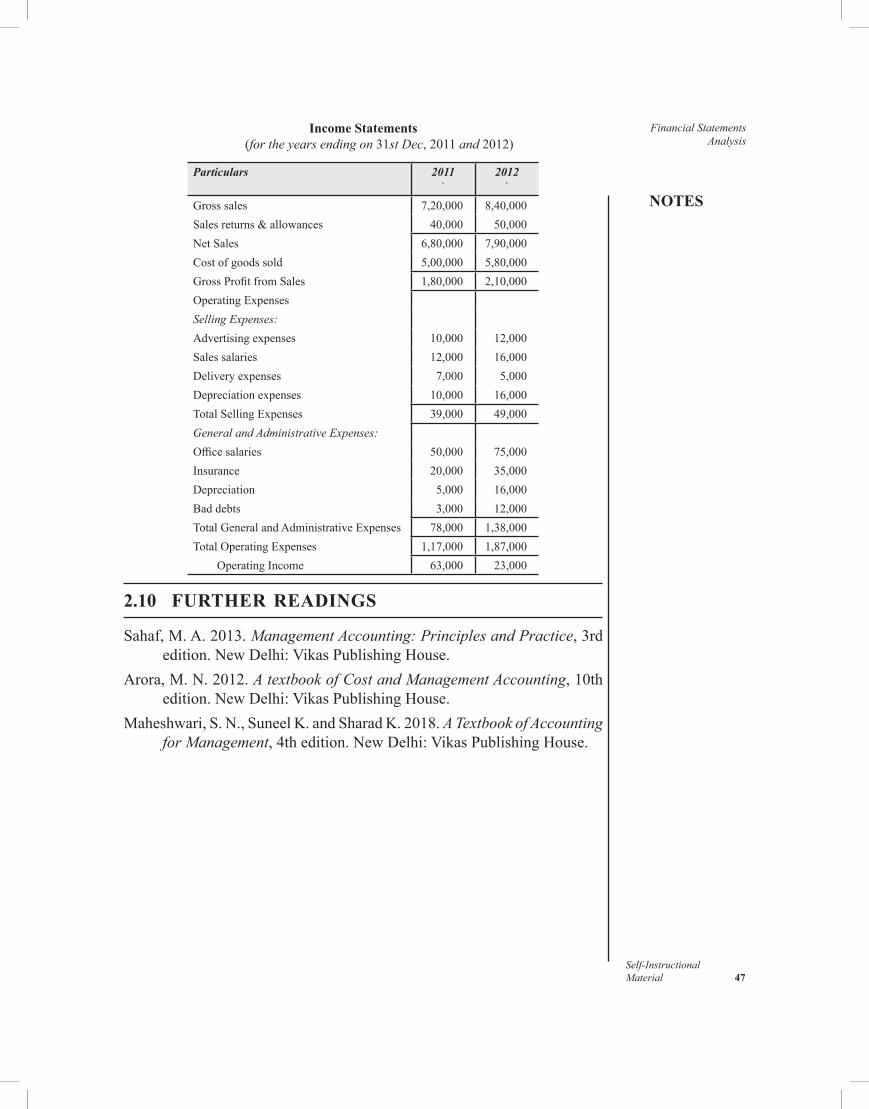
NOTES
Self-InstructionalMaterial 47
Financial Statements Analysis
Income Statements (for the years ending on 31st Dec,2011and2012)
Particulars 2011`
2012`
Grosssales 7,20,000 8,40,000Salesreturns&allowances 40,000 50,000NetSales 6,80,000 7,90,000Costofgoodssold 5,00,000 5,80,000GrossProfitfromSales 1,80,000 2,10,000OperatingExpensesSelling Expenses:Advertisingexpenses 10,000 12,000Salessalaries 12,000 16,000Deliveryexpenses 7,000 5,000Depreciationexpenses 10,000 16,000TotalSellingExpenses 39,000 49,000General and Administrative Expenses:Officesalaries 50,000 75,000Insurance 20,000 35,000Depreciation 5,000 16,000Baddebts 3,000 12,000TotalGeneralandAdministrativeExpenses 78,000 1,38,000TotalOperatingExpenses 1,17,000 1,87,000 Operating Income 63,000 23,000
2.10 FURTHER READINGS
Sahaf,M.A.2013.Management Accounting: Principles and Practice,3rdedition.NewDelhi:VikasPublishingHouse.
Arora,M.N.2012.A textbook of Cost and Management Accounting,10thedition.NewDelhi:VikasPublishingHouse.
Maheshwari,S.N.,SuneelK.andSharadK.2018.A Textbook of Accounting for Management,4thedition.NewDelhi:VikasPublishingHouse.
Ratio Analysis
NOTES
Self-Instructional 48 Material
UNIT 3 RATIO ANALYSISStructure 3.0 Introduction 3.1 Objectives 3.2 RatioAnalysis:Meaning 3.3 ClassificationofRatios
3.3.1 LiquidityRatios 3.3.2 LeverageorSolvencyRatios 3.3.3 ProfitabilityRatios 3.3.4 DupontChart 3.3.5 ActivityorTurnoverRatios
3.4 Construction of BalanceSheet 3.5 AnswerstoCheckYourProgressQuestions 3.6 Summary 3.7 Keywords 3.8 SelfAssessmentQuestionsandExercises 3.9 FurtherReadings
3.0 INTRODUCTION
Thepreceding chapter examinednot only the nature and significanceoffinancialstatementsinmeasuringfinancialperformanceofanorganizationbutalsotheapplicationofthedatacontainedinthestatementsformanagerialdecisions.Thischaptercontinuesfinancialstatementanalysisbyfocusingonfinancial ratios.Ratioanalysis isoneof thepopular toolsoffinancialstatementanalysis.Suchananalysisaimstoreducethelargenumberofitemsinvolvedtoarelativelysmallsetofreadilycomprehendedandeconomicallymeaningfulindicators.However,giventhelargenumberofratiosavailable,it isdifficult todiscern the inter-relationshipsamong themrequiredforacomprehensiveunderstandingoftheentitybeinganalyzed.Whatisrequiredisanintegratedsystemoffinancialratioswhichwillincorporatetheessentialratiosandhighlighttheinter-relationshipsamongthem.
3.1 OBJECTIVES
Aftergoingthroughthisunit,youwillbeableto: •Explainthemeaningofratioanalysis •Discusstheclassificationofratios •Describe the liquidity, solvency, turnover, profitability ratios and
Dupontchart •Examinetheconstructionofbalancesheetfromratios
NOTES
Self-InstructionalMaterial 49
Ratio Analysis3.2 RATIO ANALYSIS: MEANING
Insimplewords,aratioisthequotientformedwhenonemagnitudeisdividedbyanothermeasured in thesameunit.Aratio isdefinedas the indicated quotient of two mathematical expressions and as the relationship between two or more things.Usuallytheratioisstatedasapercentage,i.e., distribution expensesmightbestatedas20percentofsales.Often,however,theratioisexpressedinunits,thussalesmightbeexpressedas20timesinventory.Thus,theratioisapurequantityornumber,independentofthemeasurementunits being used.
Afinancial ratio isdefinedasarelationship between two variables taken from financial statements of a concern.Itisamathematicalyardstickwhichmeasurestherelationshipbetweentwofinancialfigures.Itinvolvesthebreakdownoftheexaminedfinancialreportintocomponentpartswhicharethenevaluatedinrelationtoeachotherandtoexogenousstandards.
As the ratio representsa relationshipbetweenfigures, anumberofratioscanbeformedbytakinganytwofiguresfromthefinancialstatements.However,suchanapproachwouldnotfulfillanypurposeunlessthefigureschosenaresignificantlycorrelatedwitheachother.Furthermore,manyoftheratiostendtodealwithdifferentaspectsofthesamerelationship,andthereislittlepointincalculatingseveralratiosinordertoinvestigatethesamepoint.Expertshaveidentifiedsomeratiosassignificantandimportantsincetheythrowconsiderablelightonthefinancialpositionofaconcern.
Interpretation of Ratio
Oneofthemostdifficultproblemsconfrontingtheanalystistheinterpretationand analysis of financial ratios.An adequatefinancial analysis involvesmore than an understanding and interpretation of each of the individualratios. Furthermore, the analyst requires an insight into themeaning ofinter-relationships among the ratios andfinancial data in the statements.Gainingsuchaninsightandunderstandingrequiresconsiderableexperiencein theanalysisand interpretationoffinancial statements.Moreover,evenexperienced analyst cannot apply their skill equallywell to analyse andinterpretthefinancialstatementsofdifferentorganizations.Thecharacteristicsmaydifferfromindustrytoindustryandfromfirmtofirmwithinthesameindustry.Aratiothatishighforonefirmatonetimemaybelowforanotherfirmorforthesamefirmatadifferenttime.Therefore,theanalystmustbefamiliarwiththecharacteristicsofthefirmofwhichheisinterpretingthefinalratios.
The analystmust not undertake the interpretation and analysis offinancialratiosinisolationfromotherinformation.Thefollowingfactorsmustbeconsideredwhileanalysingthefinancialratios:
Ratio Analysis
NOTES
Self-Instructional 50 Material
•Generaleconomicconditionofthefirm •Riskacceptance •Futureexpectations •Futureopportunities •Accountingsystemoftheindustry •Analysingandinterpretationsystemusedbyotherfirmsintheindustry.
Theanalysisandinterpretationoffinancialratiosinthelightoftheabove-listed factorscanbeusefulbut theanalystmust still relyonskill,insight, andeven intention inorder to interpret the ratiosandarriveat adecision.Theinterpretationoftheratioscanbemadebycomparingthemwith: •Previousfigures–trendanalysis; • Similarfirms–inter-firmcomparisons; •Targets–individualratiosettomeettheobjective. •Trend Analysis The analyst usually use historical standards for
evaluating the performance of the firm.The historical standardsrepresentthefinancialratioscomputedoveraperiodoftimewhichsets the trend.Trendanalysisprovides enoughclues to the analystforproperevaluationofthefinancialratios.However,thechangesinfirm’spoliciesovertheperiodmustbeconsideredwhileinterpretingratiosfromcomparisonovertime.Further,theaverageoftheratiosforseveralyearscanalsobeusedforthispurpose.
• Inter-firm Comparisons Inter-firmcomparisonsmayadvocatethecomparisonsofsimilarratiosforanumberofdifferentfirmsinthesameindustry.Suchanattemptwouldfacilitatethecomparativestudyoffinancialpositionandperformanceofthefirmsintheindustry.Thepublishedratiosoftradeassociationsorfinancialinstitutionscanbeofgreathelptotheanalystininterpretingthefinancialratios.However,thevariationsinaccountingsystemandchangesinthepoliciesandproceduresofthefirmincomparisonwiththeindustryhavetobetakencareofwhilemakinguseofinter-firmcomparisons.
•Targets Underthismethod,theinterpretationoftheratioismadebycomparingitwiththestandardsetforthispurpose.Suchastandardratio,baseduponwell-provenconventionsservesasameasuringscalefortheevaluationoftheratios.Thebestexampleofsuchstandardisthe1:1ratio,whichistobeconsideredasagoodratioforanalysingtheacid-testratio.Generallyspeaking,theuseofsinglestandardratiofortheinterpretation
ofratiosisnotmuchuseful.Theaccountingexpertsusuallyrecommendtheuseofgroupsofstandardratiosfortheevaluationoffinancialratios.
NOTES
Self-InstructionalMaterial 51
Ratio AnalysisAdvantages of Ratio Analysis
Ratioanalysishelpsthemanagementtoidentifyspecificareasthatreflectimprovementordeterioration,aswellasdetectthetroublespotsthatmaypreventtheattainmentofobjectives.Theinterestedpartiesundertakefrequentexamination of different areas of business to evaluate themanagement’sabilitytomaintainasatisfactorybalanceamongthem,andtoappraisetheefficiencyandeffectivenesswithwhichthemanagementdirectsthefirm’soperations.Thus,thepurposeofratioanalysisistohelpthereaderoffinancialstatementstounderstandtheinformationshownbyhighlightinganumberofkeyrelationships.However,thefollowingaretheprincipaladvantagesclaimedbyratioanalysis: • It guidesmanagement in formulating futurefinancial planning and
policies. • Itthrowslightontheefficiencyofthebusinessorganization. • Itpermitscomparisonofthefirm’sfigureswithdataforsimilarfirms,
andpossiblywith industry-wise data. It also allows the data to bemeasured against yardsticks of performance or of soundfinancialcondition.
• Itensureseffectivecostcontrol. • Itprovidesgreaterclarity,perspective,ormeaningtothedata,andit
bringsoutinformationnototherwiseapparent. • Itmeasuresprofitabilityandsolvencyofaconcern. • Itpermitsmonetaryfiguresofmanydigitstobecondensedtotwoor
threedigitsandthereforeenhancesmanagerialefficiency. • Ithelpsininvestmentdecisions.
Limitations of Ratio Analysis
Inusingratios,theanalystmustkeepafewgenerallimitationsinmind.Themainlimitationsattachedtoitare: • Itlacksstandardvaluesfortheratio,therefore,scientificanalysisis
notpossible. •Astherearenostandardsofcomparison,itfailstothrowlightonthe
efficiencyofanyactivityofthebusiness. • Itgivesonlytherelationshipbetweendifferentvariablesandtheactual
magnitudesarenotknownthroughratios. •Ratiosarederivedfromfinancialstatementsandnaturallyreflecttheir
drawbacks. • Itfailstoindicateimmediatelywherethemistakeorerrorlies. • Itdoesnottakeintoconsiderationthemarketandotherchanges.
Ratio Analysis
NOTES
Self-Instructional 52 Material
Check Your Progress
1.Mentiontheelementsofcomparisonsintheinterpretationoftheratios. 2.Statethepurposeofratioanalysis.
3.3 CLASSIFICATION OF RATIOS
Ratioshavebeenclassifiedbydifferentexpertsdifferentlybasedontheirpeculiar characteristics. Some authorities classify ratios on the basis ofthefinancialstatementsorstatementsfromwhichthefinancialfiguresareselected.Accordingly,thefollowingclassificationofratioscanbeformed: •Profit and Loss Ratios: These ratios indicate the relationship
betweentwosuchvariableswhichhavebeentakenfromtheprofitandlossaccount.Basically,therearetwotypesofsuchratios,viz.,thoseshowingthecurrentyear’sfiguresasapercentageoflastyear,thusfacilitatingcomparisonofthechangesinthevariousprofitandlossitems;andthoseexpressingrelationshipamongdifferentitemsofthecurrentyear,forexample,thepercentageofdistributionexpensestosales.
•Balance Sheet Ratios: Topmanagementwill probablywant toviewthefinancialstructureofthecompanyintermsofbasicratiosofassetorliabilitycategoriestototalassets.Thissetofratiosattemptstoexpresstherelationshipbetweentwobalancesheetitems,e.g.,theratioofstocktodebtors,ortheratioofowner’sequitytototalequity.
• Inter-statement Ratios/Mixed Ratios: The components forcomputationof theseratiosaredrawnfrombothbalancesheetandprofitandlossaccount.Theseratiosdealwiththerelationshipbetweenoperatingandbalancesheet items.Theexamplesofsuchratiosaredebtors’ turnover ratio,fixed assets turnover ratio,working capitalturnoverratio,andstockturnoverratio.
Someauthoritiesclassifytheratiosonthebasisoftimetowhichtheratioscomputedbelong.Onthisbasis,theratiocanbedividedintofollowingtwomajorgroups:
•Structural Ratios: Structuralratiosexhibittherelationbetweentwosuchitemswhichrelatetothesamefinancialperiod.Thus,theabove-mentionedclassificationofratios,i.e.,profitandlossratios,balancesheetratiosandmixedratiosarecoveredunderstructuralratiosifthecomponentsforthecomputationoftheseratiosaredrawnfromthefinancialstatementthatrelatetothesameperiod.
•Trend Ratios: Theseratiosdealwiththerelationshipbetweenitemsoveraperiodoftime.Trendratiosindicatethebehaviourofratiosfor
NOTES
Self-InstructionalMaterial 53
Ratio Analysistheperiodunderstudyandthusprovideenoughscopefortheproperevaluationofthebusiness.Anotherclassificationofratiosasdevelopedbyfinancialexpertsison
thebasisofsignificanceofratios.Someratiosareconsideredmoreimportantthanotherswhenratiosareevaluatedinthelightof theobjectivesof thebusiness.Accordingly,thefollowingtwomaingroupsofratiosarecoveredunderthisclassification: •Primary Ratios: Everycommercialconcernconsidersprofitasits
primeobjective,andtherefore,anyratiothatrelatestosuchobjectiveistreatedasaprimaryratio.Theratioscoveredbythiscategoryarereturnoncapital,grossmargintosales,etc.
•Secondary Ratios: Ratiosotherthanprimaryratiosareknownassecondary ratios.Such ratiosare treatedas supporting ratios to theprimaryratiosbecausetheseratiosattempttoexplaintheprimaryratios.Ratiossuchasturnoverratios,expensesratios,earningspershareareconsidered as secondary ratios.Ratiosarealsoclassifiedaccordingtothefinancialcharacteristicsthey
describe.Accordingly,thefollowingclassificationofratiosismade: •LiquidityRatios; •LeverageRatios; •ProfitabilityRatios;and •ActivityRatios.
Theclassificationonthebasisofcharacteristicsissimpletocalculateandeasytounderstandascomparedtootherclassificationsdiscussedabove.Therefore,thisclassificationisalwayspreferredbythefinancialanalysttoevaluatethebusinessperformance.Accordingly,adetaileddiscussionfollowsontheclassificationofratiosbasedontheirfinancialcharacteristics.
3.3.1 Liquidity Ratios
Theliquidityratiosindicatetheliquidityofacompany.They,infact,measuretheabilityofacompanytomeetsitscurrentliabilitiesastheyfalldue.Ifthecompanyhasinsufficientcurrentassetsinrelationtoitscurrentliabilities,itmightbeunabletomeetitscommitments,andbeforcedintoliquidation.Thus,ratioscomparingtherelationshipbetweenvariousgroupsofcurrentassetsandcurrentliabilitiesarecomputedtomeasuretheliquiditypositionofthecompany.Suchratioshelpinascertainingtheeffectivenessoftheworkingcapitalmanagement.To gain an insight, analysts also use the variablesotherthanthosecoveredbythetermworkingcapital.Thefollowingaretheimportantliquidityratios: •Current Ratio: Thisisafundamentalmeasureofafirm’sfinancial
positionintheshortrun,namely,itsabilitytomeetnormaloperating
Ratio Analysis
NOTES
Self-Instructional 54 Material
obligationsduringonefinancialyear.Thecurrentratiocomparesthetotalcurrentassetswiththetotalcurrentliabilitiestofindoutwhetherthenetassetsaresufficienttomeettheshort-termobligationofthebusiness.Itiscomputedbydividingcurrentassetsbycurrentliabilities.Current assets include cash, stock,work-in-progress,marketablesecurities and accounts receivable. On the other hand, currentliabilitiesincludeaccountspayable,sundrycreditors,accruedincometaxes,proposeddividend,borrowingsfromfinancialinstitutionsandoutstandingexpenses.Usuallycurrentratioisusedbytradecreditorstoestimatethecompany’sabilitytorepayitscredit.Thecurrentratioiscalculatedas:
CurrentRatio =Current Assets
Current Liabilities
A high current ratio indicates a large proportion of current assetsareavailabletomeetcurrentliabilities.Usuallythehighertheratio,thebetterisacompany’scurrentfinancialpositionandnormallythebetteritcanmeetcurrentobligations.Butatthesametime,ahighercurrentratiowouldalsomeanthatthecompanymayhaveanexcessiveinvestmentincurrentassetsthatdoesnotproduceasignificantreturn.Ontheotherhand,alowcurrentratiowouldindicatethatsufficientcashisnotavailabletopaycurrentliabilities.Afrequentlyusedguidelinetoevaluate theadequacyof thecurrent ratio is2:1or2.However,thereseemstobeverylittlejustificationforsuchastandard.Forsomebusinesses,thismaybeanadequatecurrentratio,forothersitmaybetoohighortoolow.Therefore,thestandardforthisratiowillvaryfromindustriestoindustries.Infact,manyrenewedcompanieshavemuchlowercurrentratio,aslowas1:1.Inevaluatingtheappropriatenessofcurrentratios,muchdependsonthenatureofthebusiness,compositionofafirm’scurrentassets,andturnoverof thefirm’scertaincurrentassets.
•Acid-test Ratio: Itprovidesanevenmorecriticallookattheabilityofthecompanytomeetitsday-to-dayobligations.Itsignifiesaveryshort-termliquidityofabusinessconcernandis,therefore,alsocalled‘liquidratio’.Ifitisdesiredtoapplyastillstifferandrigoroustestforevaluatingafirm’sfinancialpositionintheshortperiod,theapplicationofacid-testratioisrecommended.Theacid-testratioiscomputedbydividingcurrentassetsinliquidformbycurrentliabilities.Thus,stocksandsimilaritemsareexcludedfromcurrentassets,leavingitemssuchas debtors, bills receivable,marketable securities, and cash,whicharealreadyinliquidform,ormayeasilybeconvertedintocashbydiscountingorfactoring.Theacid-testratioassumesthatstockmaynotberealizedimmediatelyand,therefore,thisitemisexcludedinthecomputationofthisratio.Someexpertsadvocatethatthebankoverdraft
NOTES
Self-InstructionalMaterial 55
Ratio Analysisshouldalsobeexcludedfromcurrentliabilitieswhilecalculatingacid-testratio.Thelogicfortheexclusionofbankoverdraftisbasedonthefactthatbankoverdraftisgenerallyapermanentwayoffinancing.Theacid-testratioisexpressedasfollows:
Acid - TestRatio =CurrentAssets(Stock)Current Liabilities
Toolowaratiosuggestsnotonlyinabilitytomeetcurrentclaimsbutalsoinabilitytotakeadvantageofcashdiscountsandotherrewardsforpromptpayment(suchaslowerinterestratesonborrowings).Further,acompanywithalowquickratiomaybeforcedtoobtainashort-termloanplusinterestcharges,orimplementsomeothermeasurestoobtaintherequiredcash.Ontheotherhand,anexcessiveamountofquickassetscouldindicatethattheseassetsshouldbeputtomoreproductiveorprofitableuseelsewhereintheenterprise.Anacid-testratioof1:1isusuallyconsideredidealandsatisfactory.However,thisisaruleofthumbandshouldbeappliedwithcare.Theadvocacyofratiosdependsontheindustryinwhichthefirmoperates.
•Receivables Turnover: Anothermeasureofliquidityisreceivableturnover,which indicates the number of times that the averageoutstanding net receivables is turned over or converted into cashthrough collections during each year.Receivables turnover is theamount of period required for one complete cycle: From the timereceivablesarerecordedthroughcollectiontothetimenewreceivablesare recorded.The faster the cycle is completed, themore quicklyreceivablesareconvertedintocash.Whenthecustomers’accountsarecollectedpromptlywithlittlelossorcollectionexpense,thefirmfindsiteasiertomeetitsobligationswhentheybecomedue.Ontheotherhand,alongcreditperiodgrantedtocreditorswouldadverselyaffectthefirms’liquidityposition.Thereceivablesturnoveristheratioofsalestonetaccountsreceivable.Thisratioisexpressedasunder:
NetSalesReceivableTurnoverAverage Receivables*
=
Someexpertsbelievethattheuseofbeginningandendingbalancesofreceivablestocalculateaveragesfailtogiveaccurateresultsbecauseyear-endbalancesmaynotrepresentaccountbalancesmostofthetimeduringtheyearduetoseasonalvariationinbusinessvolume.Therefore,itisadvisabletousecurrentyear’smonthlyorquarterlydatainsteadofbeginningandendingbalancesforcalculatingaveragereceivables.
*Receivablesincludebothdebtorsandbillsreceivableandaveragereceivablesiscalculatedas:
Ratio Analysis
NOTES
Self-Instructional 56 Material
It is important to note thatwhile calculating receivables turnover,onlycreditsalesshouldbeused.However,thisinformationoftenisnotavailableinthefinancialstatements,andtherefore,thenetsalesisusedforthepurpose.
Sometimes the receivable turnover is expressed as the ‘collectionperiod’,viz.,howmanydays(ontheaverage)ittakestocollecteachrupeedue.Fortheperiodinquestion(week,month,quarter,year,etc.),thecollectionperiodiscalculatedas:
AverageReceivableDay's salesinReceivable=AvarageDailySales*(credit)
Ahighratioofreceivablestosalessuggestsover-exposuretocreditlossesandexcessivecostsintermsofinterestonthecapitalrequiredtoextendcredittocustomers.Whereasalowratiosuggestsinsufficientextensionofcreditandtherefore,lostsalesandlostprofits.
• Inventory Turnover:Theliquidityofinventoriesismeasuredbythenumberoftimesperyearthatinventoryisconvertedintocostofgoodssold.Hence,itisadevicetomeasuretheefficiencyoftheinventorymanagement.However,initszealtoshowahighratio,inventoriesarenotallowedtodropdownbelowthedangerlevel.Thisratioisworkedout as under:
Sometimesitisconsideredmorehelpfultoexpresstherelationshipbetweeninventoryandcostofgoodssoldasthe‘numberofdays’supplyofinventory’;inotherwords,thenumberofdaystheinventorysupplycouldlast.Fortheperiodinquestion,thenumberofdays’supplyofinventoryiscalculatedas:
Average InventoryDay's supply ofInventory =Average day's costofgoodssold**
Theaverageday’ssupplyofinventorycanalsobecomputedwiththehelpofthefollowingformula:
*Total credit sales
*Average daily sales360 (or 365days)
=
Thecollectionperiodcanalsobecalculatedwiththehelpofthefollowingformula:
Note: Weuse360(or365)daysrepresentingayearinthecalculationofaveragedailysales.SuchdayscanbemoreorlessinafinancialyeardependingonnumberofSundaysandholidayswhichhavetobeexcluded.
**
NOTES
Self-InstructionalMaterial 57
Ratio Analysis Inventory turnover rates vary tremendously by the nature of thebusiness.Itisusuallydesirabletocompareafirm’sinventoryturnoverwith the turnover experience by comparable companies. It is notunusualforretailersofperishablecommoditiestoexperienceahigherinventoryturnoverthanthoseretailerswhodealindurablegoods.Attheotherextreme,retailersofjewelleryfrequentlyreflectalowyearlyinventoryturnover.Ahighturnovercompensatesforalowermarginoneachitem,producinganormalprofitforthebusiness.Ontheotherhand,abusinessthatsellsslow-movinggoodsmustmakeupforthelowturnoverbyahigherprofitmarginoneachitemsold.Ofgreatimportance, however, is the need to evaluate the trend in thefirmunderreview.Whetherthetrendisdesirablewouldrequiredetailedinvestigationintosuchaspectsaschangesinmanufacturingtechniques,labourslowdowns,orinventorystockpilinginanticipationofpriceincreases.
Illustration 3.1: FromthefollowingBalanceSheetofLilyLtd.,youarerequiredtocalculatetheliquidityratiosandgiveyourcomments:
Lily Ltd.Balance Sheet
(as on 31st Dec., 2012)
Liabilities ` Assets `
ShareCapital:60,000shares@`10each6%DebenturesReservesBillspayableTrade creditorsIncometaxpayableOutstandingexpensesBankoverdraft
6,00,0002,50,0001,10,00060,00040,00025,00040,00030,000
11,55,000
MachineryBuildingFurnitureandfittingsInvestment(shareinXYCo.Ltd.)InventoriesBillsreceivableTrade debtorsShort-terminvestmentCashatbankCashinhand
2,40,0002,50,0001,10,0001,00,0001,20,00045,00060,00065,000
1,10,00055,000
11,55,000
Solution
1.
2.
Ratio Analysis
NOTES
Self-Instructional 58 Material
Usingthetraditionalguidelines,onewouldconcludethatLilyLtd.hasadequateliquidity.Thevalueofthecurrentratioindicatesthatthecompanyhascurrentassetsof`2.33 topayacurrent liabilityof`1.At thesametime,acid-testratioofthecompanyindicatesthatforeverycurrentliabilityof ` 1 the companyhas thequick assets of` 1.72.Dependingupon thecircumstances,thismaybeenoughtoassuretheliquidityofthecompany.Illustration 3.2: M/sSunlightLtd.submitsthefollowinginformationfortheyearending31st December 2012:
SalesduringtheyearCash 3,00,000Credit 1,60,000Stock:OpeningClosingGrossprofitfortheyearTrade debtors:1-1-201231-12-2012Billsreceivable:1-1-201231-12-2012
`4,60,000
`40,000`60,000`1,60,000
`10,000`14,000
`9,000`7,000
You are required to calculate InventoryTurnover andReceivableTurnoverratiofromtheabovegiveninformation.Solution
1. InventoryTurnoverRatio = 6 times
2.ReceivableTurnoverRatio
= 8 timesWorkings:
1.Costofgoodssold=Sales–GrossProfit = `4,60,000–`1,60,000 = `3,00,000
2. Average Inventory
= `50,000
3.AverageReceivable*=
= `20,000
*Receivablesincludebothreceivableaswellastradedebtors.
NOTES
Self-InstructionalMaterial 59
Ratio Analysis3.3.2 Leverage or Solvency Ratios
Leverageisareflectionoftheuseofborrowedfundsbyacompanytoincreasethereturnonowner’sequity.Leverageratiosmeasurethecontributionoffinancingbyownerscomparedwithfinancingprovidedbythefirm’screditors.Astheliquiditytestmeasurestheabilityofafirmtomeetitscurrentfinancialobligations,leverageratios,whichgaugeafirm’ssolvency,attempttomonitortheabilityofafirmtopayallofitsdebts—currentaswellasnon-current,astheybecomedue.Thecapitalstructureofalmosteverycompanyconsistsoftwomajorcomponents,viz., •Equitycapital—capitalthatbelongstoowners-investors •Debtcapital—amountthatbelongstocreditors
Theproportionofdebtcapitaltothetotalcapitalofafirmisusuallyreferredtoas‘leverage’ or trading on the equity.Thefundamentaleconomicprinciple underlying leverage is thatwhenever funds are borrowed at a lowerrateof interest thantheborrowercanearnonthosefunds, therateofreturnofowner’sequityisincreased overwhatitotherwisewouldhavebeen had the borrowed funds been provided by the owners (Hobbs andMoore1,1979).Borrowingtoo heavily,however,caninvitefinancialdifficultyprimarilybecauseinterestpaymentsandprincipalrepayments arecontractualobligationsthatmustbehonoured.Theabilitytoobtainandtorepayalong-term debt often dependsonafirm’sabilitytoobtaincapitalfromshareholders.Therefore,therelationshipbetweenshareholders’ equityandcreditors’equityisevaluated.Theleverageratioscommonlyusedarediscussedbelow. •Debt–Equity Ratio:Itdevelopstherelationshipbetweenownedfunds
andtheborrowedfunds.Thisreflectstheextenttowhichborrowedcapitalisusedinplaceofequitycapital.Businessfirmsacquireassetsbothwithowners’andcreditors’funds.Thelargertheportionoffundsprovidedbyowners,thelessriskisassumedbycreditors.Thedebt-equityratioisworkedoutas:
Theratiorepresentstheproportionofexternalequitytointernalequityinthecapitalstructureofthefirm.Theexternalequity*representstheamountofdebts/liabilitiestooutsiders.Itincludesbothshort-termaswellaslong-termliabilities.Ontheotherhand,ownersequity**includesallsuchliabilitiesthatbelongtotheshareholders,e.g.,sharecapital(bothpreferential aswell as equity), reservesand surpluses.However, the
*Somefinancialanalystsareoftheopinionthatexternalequity(debt)includesonlylong-termdebtinsteadoftotaldebtcomprisingbothshort-termaswellaslong-termdebts.
**Fewexpertsonthesubjectprefertoconsideronlyequityshareholdersinthecalculationofowners’equityand exclude preferential shareholders in the calculation.The plea to exclude preferential shareholders in thecalculationofowners’equity isbasedon the fact thatsuchsharesareentitled toafixedrateofdividendandthereforetheyfallwithinthescopeoffixedinterestbearingsecurities.
Ratio Analysis
NOTES
Self-Instructional 60 Material
accumulatedlossesanddeferredexpensesaretobedeductedfromtheowner’sequityinthecalculationofdebt–equityratio.
Eithertoohighortoolowaratiomaybedisadvantageous.Toohighsuggeststhatmanagementisnottakingadvantagesofopportunitiestomaximizeprofitsthroughborrowing.Toolowsuggestsundueexposuretorisksofbankruptcyandtoafixedburdenofinterestexpensesintheeventofaperiodofrelativelylowprofit(whentherateofreturnontotalcapitalislessthantheinterestrateonborrowedcapital).Asaruleofthumb,debt–equityratiooflessthan2:1istakenasacceptable,butthisisnotbasedonanyscientificanalysis.However,manyfinancialanalystsprefertoconsider1:1assafe.Astheratioincreases,theamountof risk assumedby creditors increases, because the ratio indicatesdecreasingsolvency.Infact,theacceptablelevelofratiowillvaryfromfirmtofirm.Forexample,bankinginstitutionswillhavemuchhigherdebt–equityratioascomparedtomanufacturingortradingconcerns.
•Equity Ratio/Proprietary Ratio: Avarianttothedebt–equityratioistheproprietaryratiowhichindicatestherelationshipbetweenowner’sequityandtotalassets.Itmeasurestheproportionofacompany’sassetsthatareprovidedorclaimedbytheowners.Theratioofowners’equitytototalassetsisameasureofthefinancialstrengthorweaknessoftheenterprise.Recallthattheowners’equityistheresidualinterestinafirm’sassetsafterallowancehasbeenmadefortheclaimsofcreditorsagainsttheassets.Iftheowners’equityisasmallproportionofthetotalassets,theenterprisemaybeconsideredfinanciallyweak,becausetheownershavearelativelysmallinvestmentinthefirmascomparedtothecreditors.Ontheotherhand,alowproprietaryratiowouldindicatea relatively largerdegreeofsecurity for thecompany.This ratio isworkedoutasfollows:
Thecomponentsoftheproprietaryratioareowners’equityandtotal
assets.The owners’ equity includes share capital both preferentialandequity,undistributedprofits,reservesandsurplus.Theamountofowners’equitymustbedeductedbytheamountofaccumulatedloss,ifany.Ontheotherhand,thetotalassetsrepresentthetotalresourcesofthecompany.However,someexpertsareoftheopinionthatthetotalassetsofacompanyforthepurposeofproprietaryratioshouldincludeonlytangibleassets.Consequently,theamountofgoodwillshallbeexcludedfromthetotalassetsinthecomputationofowners’equitytototalassets.
•Ratio of External Equities to Total Assets (Solvency Ratio): Thisisavariantoftheproprietaryratio.Thisratiomeasurestheproportion
NOTES
Self-InstructionalMaterial 61
Ratio Analysisofafirm’sassetsthatarefinancedbycreditors.Tothecreditor,alowratiowouldensuregreatersecurityforextendingcredit to thefirm.However,atoolowratiosuggeststhatmanagementisnotusingitscreditmostadvantageously.Thisratioisexpressedasunder:
Thetermexternalequitiesrepresentalldebts,bothlong-termaswell
asshort-term.Ontheotherhand,totalassetsrefertototalresourcesoftheconcern.
•Fixed Assets to Net Worth Ratio (Ratio of Fixed Assets to Proprietor’s Funds):Thisratioindicatesthepercentagecontributedbyownerstothevalueoffixedassets.Itcanbeworkedoutasfollows:
Fixedassetsrepresentcostofacquisitionofthefixedassetsdeductedbytheamountofdepreciationthereonuptotheperiod.Thenetworthrepresents the amount due to the shareholders, i.e., share capital,reserves and surpluses.Financial experts areof theopinion that inmanufacturingconcerns,investmentinplantsshouldbemadeoutofequityratherthanborrowedcapital,therefore,aratioofatleast1:1isconsidereddesirable.Ontheotherhand,alowerratiosuggestsanundueburdenofdebtontheenterprisethattendstoincreasetheinternalrateatwhichanenterprisecanborrow.
•Current Assets to Net Worth Ratio: This ratio signifies therelationshipbetweenthecurrentassetsandnetworth.Inotherwords,itisacorrelationbetweencurrentassetsandnetworth.Wecanputthisas under:
Thisratioindicatestheextenttowhichshareholders’fundshavegoneintothefinancingofthecurrentassets.Itisadvisabletostudytheratioofcurrentassetstonetworthwiththeratiooffixedassetstonetworth.
• Interest Coverage Ratio A company is considered solvent if itsrevenueismorethanits interestandotherexpenses.Consequently,thecompanythathasrevenuesufficienttomeetonlytheexpensesandleavingnothingasnetincomeisconsideredlesssolvent.Againstthisbackground,oneoftheapproachestotestsolvencyoftheenterpriseisinterestcoverageratio.Thisratiomeasureshowmanytimesacompanycouldpay its interestexpenses.This ratio iscalculatedbydividinginterest expenses into earnings available for payment of interestexpense.Wecanputthisasunder:
Ratio Analysis
NOTES
Self-Instructional 62 Material
Interestcoverage ratiomeasures theabilityofafirm toprotect theinterestsoflong-termcreditors.Itisoftenstatedthatinordertoensureadequateprotectiontolong-termcreditors,thisratioshouldbe2ormore.
Illustration 3.3: From the followingbalance sheet you are required tocalculateleverageratios:
BalanceSheet
Liabilities ` Assets (`)3,000Equityshares@` 100 each7%DebenturesReservesandSurplusSundry creditorsBillspayable
3,00,0001,50,00080,00030,00050,000
6,10,000
BuildingFurnitureMachineryStockDebtorsCashbalances
2,50,00040,000
2,10,00060,000
30,00020,000
6,10,000
Solution
=0.61(approx.)
=0.62(approx.)
=0.38(approx.)
=0.29(approx.)
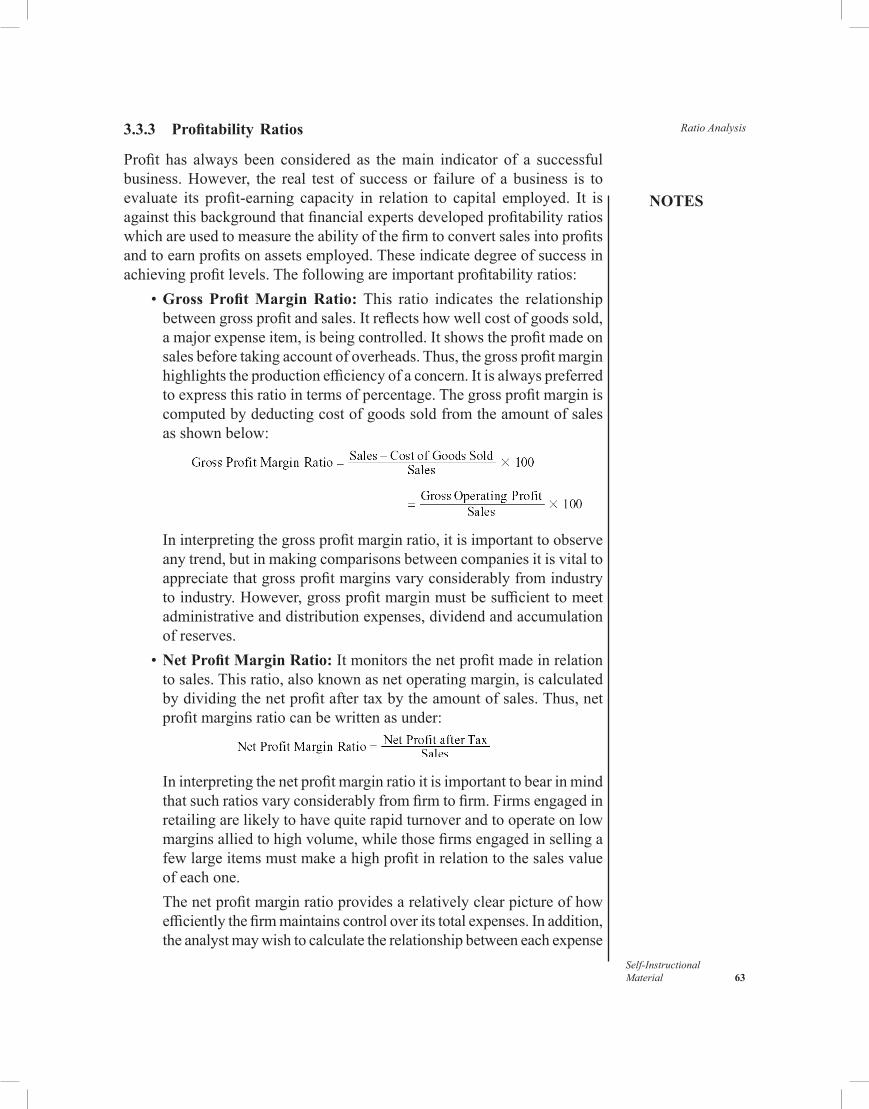
NOTES
Self-InstructionalMaterial 63
Ratio Analysis3.3.3 Profitability Ratios
Profit has always been considered as themain indicator of a successfulbusiness.However, the real test of success or failure of a business is toevaluate its profit-earning capacity in relation to capital employed. It isagainstthisbackgroundthatfinancialexpertsdevelopedprofitabilityratioswhichareusedtomeasuretheabilityofthefirmtoconvertsalesintoprofitsandtoearnprofitsonassetsemployed.Theseindicatedegreeofsuccessinachievingprofitlevels.Thefollowingareimportantprofitabilityratios: •Gross Profit Margin Ratio:This ratio indicates the relationship
betweengrossprofitandsales.Itreflectshowwellcostofgoodssold,amajorexpenseitem,isbeingcontrolled.Itshowstheprofitmadeonsalesbeforetakingaccountofoverheads.Thus,thegrossprofitmarginhighlightstheproductionefficiencyofaconcern.Itisalwayspreferredtoexpressthisratiointermsofpercentage.Thegrossprofitmarginiscomputedbydeductingcostofgoodssoldfromtheamountofsalesasshownbelow:
Ininterpretingthegrossprofitmarginratio,itisimportanttoobserve
anytrend,butinmakingcomparisonsbetweencompaniesitisvitaltoappreciatethatgrossprofitmarginsvaryconsiderablyfromindustrytoindustry.However,grossprofitmarginmustbesufficienttomeetadministrativeanddistributionexpenses,dividendandaccumulationof reserves.
•Net Profit Margin Ratio:Itmonitorsthenetprofitmadeinrelationtosales.Thisratio,alsoknownasnetoperatingmargin,iscalculatedbydividingthenetprofitaftertaxbytheamountofsales.Thus,netprofitmarginsratiocanbewrittenasunder:
Ininterpretingthenetprofitmarginratioitisimportanttobearinmindthatsuchratiosvaryconsiderablyfromfirmtofirm.Firmsengagedinretailingarelikelytohavequiterapidturnoverandtooperateonlowmarginsalliedtohighvolume,whilethosefirmsengagedinsellingafewlargeitemsmustmakeahighprofitinrelationtothesalesvalueofeachone.
Thenetprofitmarginratioprovidesarelativelyclearpictureofhowefficientlythefirmmaintainscontroloveritstotalexpenses.Inaddition,theanalystmaywishtocalculatetherelationshipbetweeneachexpense
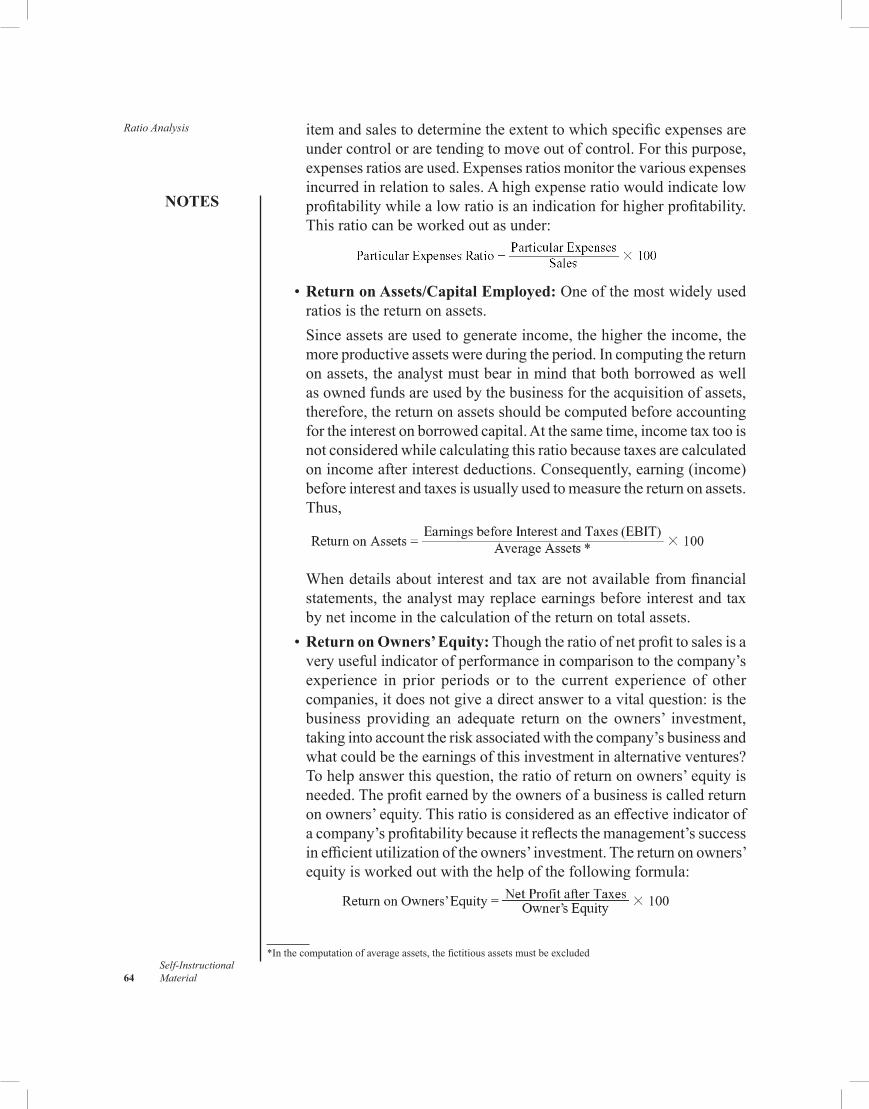
Ratio Analysis
NOTES
Self-Instructional 64 Material
itemandsalestodeterminetheextenttowhichspecificexpensesareundercontroloraretendingtomoveoutofcontrol.Forthispurpose,expensesratiosareused.Expensesratiosmonitorthevariousexpensesincurredinrelationtosales.Ahighexpenseratiowouldindicatelowprofitabilitywhilealowratioisanindicationforhigherprofitability.Thisratiocanbeworkedoutasunder:
•Return on Assets/Capital Employed:Oneofthemostwidelyusedratiosisthereturnonassets.
Sinceassetsareusedtogenerateincome,thehighertheincome,themoreproductiveassetswereduringtheperiod.Incomputingthereturnonassets,theanalystmustbearinmindthatbothborrowedaswellasownedfundsareusedbythebusinessfortheacquisitionofassets,therefore,thereturnonassetsshouldbecomputedbeforeaccountingfortheinterestonborrowedcapital.Atthesametime,incometaxtooisnotconsideredwhilecalculatingthisratiobecausetaxesarecalculatedonincomeafterinterestdeductions.Consequently,earning(income)beforeinterestandtaxesisusuallyusedtomeasurethereturnonassets.Thus,
Whendetailsaboutinterestandtaxarenotavailablefromfinancialstatements,theanalystmayreplaceearningsbeforeinterestandtaxbynetincomeinthecalculationofthereturnontotalassets.
•Return on Owners’ Equity:Thoughtheratioofnetprofittosalesisaveryusefulindicatorofperformanceincomparisontothecompany’sexperience in prior periods or to the current experience of othercompanies,itdoesnotgiveadirectanswertoavitalquestion:isthebusiness providing an adequate return on the owners’ investment,takingintoaccounttheriskassociatedwiththecompany’sbusinessandwhatcouldbetheearningsofthisinvestmentinalternativeventures?Tohelpanswerthisquestion,theratioofreturnonowners’equityisneeded.Theprofitearnedbytheownersofabusinessiscalledreturnonowners’equity.Thisratioisconsideredasaneffectiveindicatorofacompany’sprofitabilitybecauseitreflectsthemanagement’ssuccessinefficientutilizationoftheowners’investment.Thereturnonowners’equityisworkedoutwiththehelpofthefollowingformula:
*Inthecomputationofaverageassets,thefictitiousassetsmustbeexcluded
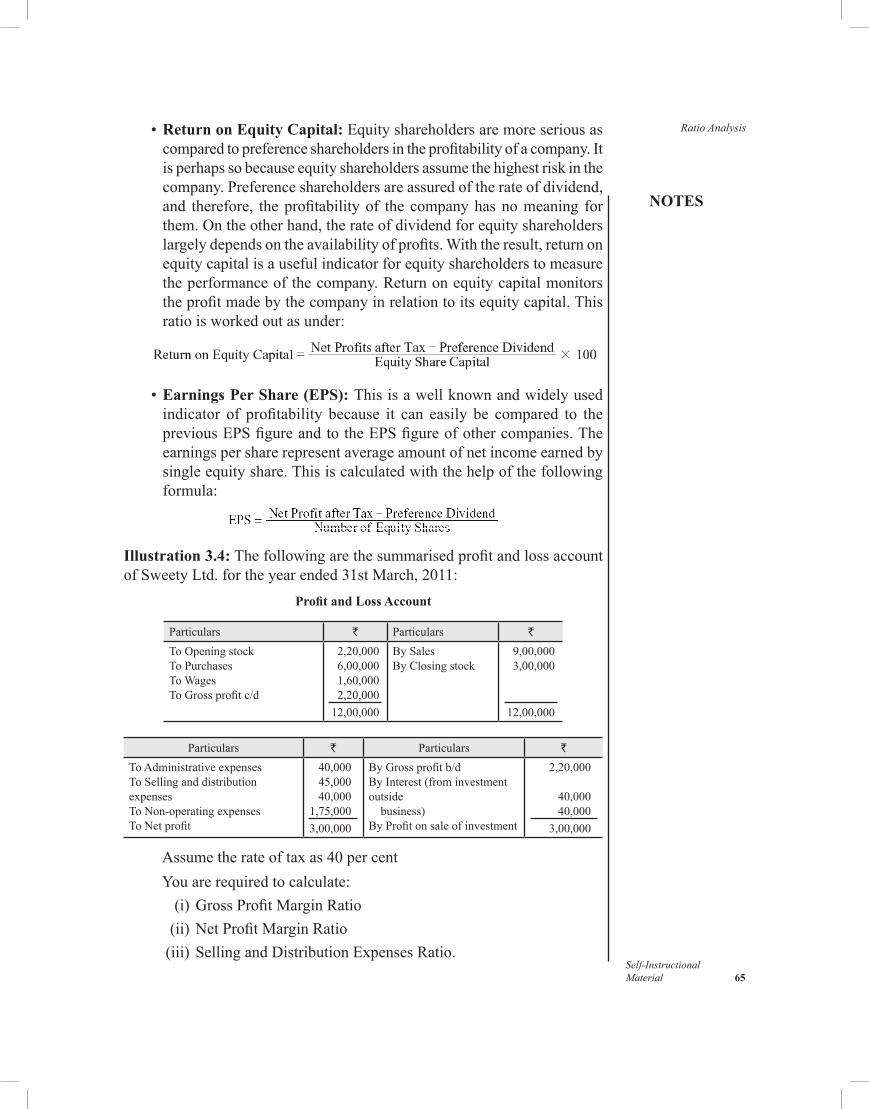
NOTES
Self-InstructionalMaterial 65
Ratio Analysis •Return on Equity Capital: Equityshareholdersaremoreseriousascomparedtopreferenceshareholdersintheprofitabilityofacompany.Itisperhapssobecauseequityshareholdersassumethehighestriskinthecompany.Preferenceshareholdersareassuredoftherateofdividend,and therefore, theprofitabilityof the companyhasnomeaning forthem.Ontheotherhand,therateofdividendforequityshareholderslargelydependsontheavailabilityofprofits.Withtheresult,returnonequitycapitalisausefulindicatorforequityshareholderstomeasuretheperformanceofthecompany.Returnonequitycapitalmonitorstheprofitmadebythecompanyinrelationtoitsequitycapital.Thisratioisworkedoutasunder:
• Earnings Per Share (EPS): Thisisawellknownandwidelyusedindicator of profitability because it can easily be compared to thepreviousEPSfigureandtotheEPSfigureofothercompanies.Theearningspersharerepresentaverageamountofnetincomeearnedbysingleequityshare.Thisiscalculatedwiththehelpofthefollowingformula:
Illustration 3.4:ThefollowingarethesummarisedprofitandlossaccountofSweetyLtd.fortheyearended31stMarch,2011:
Profit and Loss Account
Particulars ` Particulars `
ToOpeningstockToPurchasesTo WagesToGrossprofitc/d
2,20,0006,00,0001,60,0002,20,00012,00,000
BySalesByClosingstock
9,00,0003,00,000
12,00,000
Particulars ` Particulars `
ToAdministrativeexpensesToSellinganddistributionexpensesToNon-operatingexpensesToNetprofit
40,00045,00040,000
1,75,0003,00,000
ByGrossprofitb/dByInterest(frominvestmentoutside business)ByProfitonsaleofinvestment
2,20,000
40,00040,000
3,00,000
Assumetherateoftaxas40percentYouarerequiredtocalculate:
(i)GrossProfitMarginRatio (ii)NetProfitMarginRatio (iii)SellingandDistributionExpensesRatio.
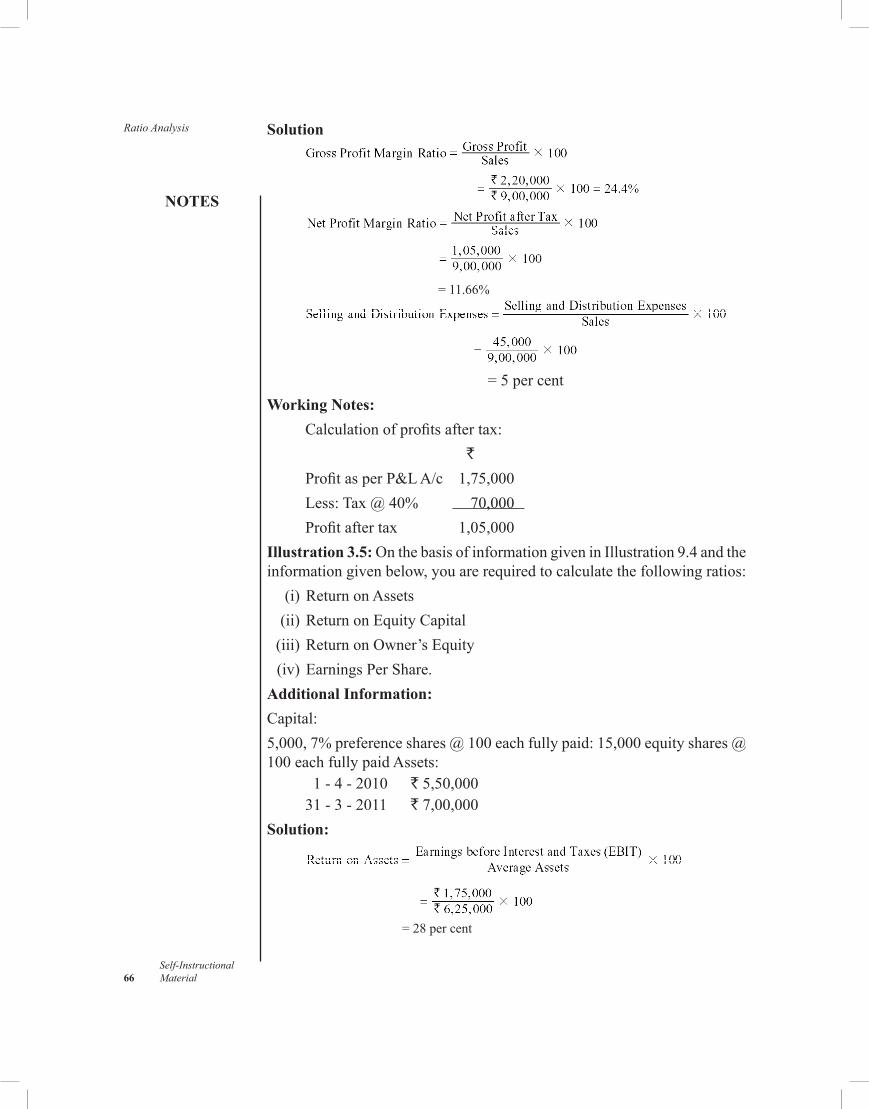
Ratio Analysis
NOTES
Self-Instructional 66 Material
Solution
=11.66%
= 5 per centWorking Notes:
Calculationofprofitsaftertax: `ProfitasperP&LA/c 1,75,000Less:Tax@40% 70,000Profitaftertax 1,05,000
Illustration 3.5:OnthebasisofinformationgiveninIllustration9.4andtheinformationgivenbelow,youarerequiredtocalculatethefollowingratios: (i)ReturnonAssets (ii)ReturnonEquityCapital (iii)ReturnonOwner’sEquity (iv)EarningsPerShare.Additional Information:Capital:5,000,7%preferenceshares@100eachfullypaid:15,000equityshares@100eachfullypaidAssets:
1-4-2010 `5,50,00031-3-2011 `7,00,000
Solution:
= 28 per cent
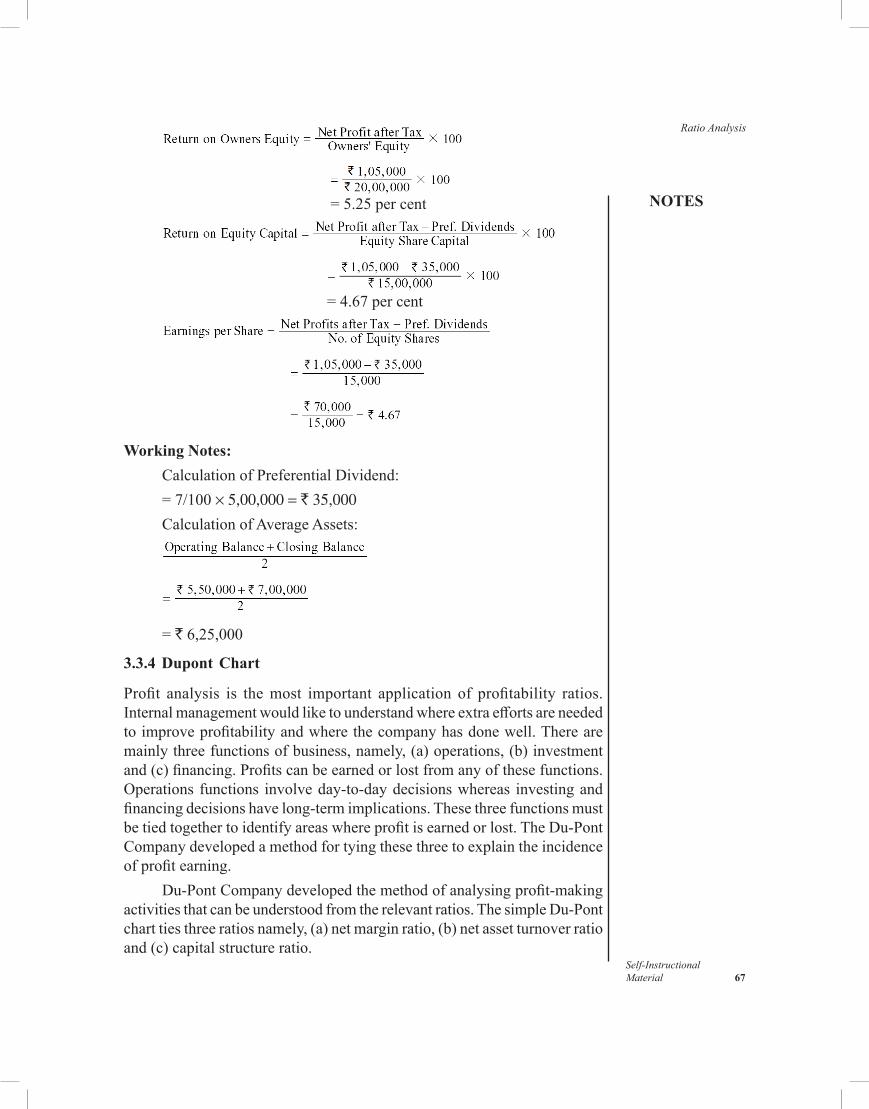
NOTES
Self-InstructionalMaterial 67
Ratio Analysis
= 5.25 per cent
= 4.67 per cent
Working Notes:
CalculationofPreferentialDividend:=7/100× 5,00,000 = ` 35,000CalculationofAverageAssets:
= `6,25,000
3.3.4 Dupont Chart
Profit analysis is themost important application of profitability ratios.Internalmanagementwouldliketounderstandwhereextraeffortsareneededtoimproveprofitabilityandwherethecompanyhasdonewell.Therearemainlythreefunctionsofbusiness,namely,(a)operations,(b)investmentand(c)financing.Profitscanbeearnedorlostfromanyofthesefunctions.Operations functions involveday-to-daydecisionswhereas investingandfinancingdecisionshavelong-termimplications.Thesethreefunctionsmustbetiedtogethertoidentifyareaswhereprofitisearnedorlost.TheDu-PontCompanydevelopedamethodfortyingthesethreetoexplaintheincidenceofprofitearning.
Du-PontCompanydevelopedthemethodofanalysingprofit-makingactivitiesthatcanbeunderstoodfromtherelevantratios.ThesimpleDu-Pontcharttiesthreeratiosnamely,(a)netmarginratio,(b)netassetturnoverratioand(c)capitalstructureratio.
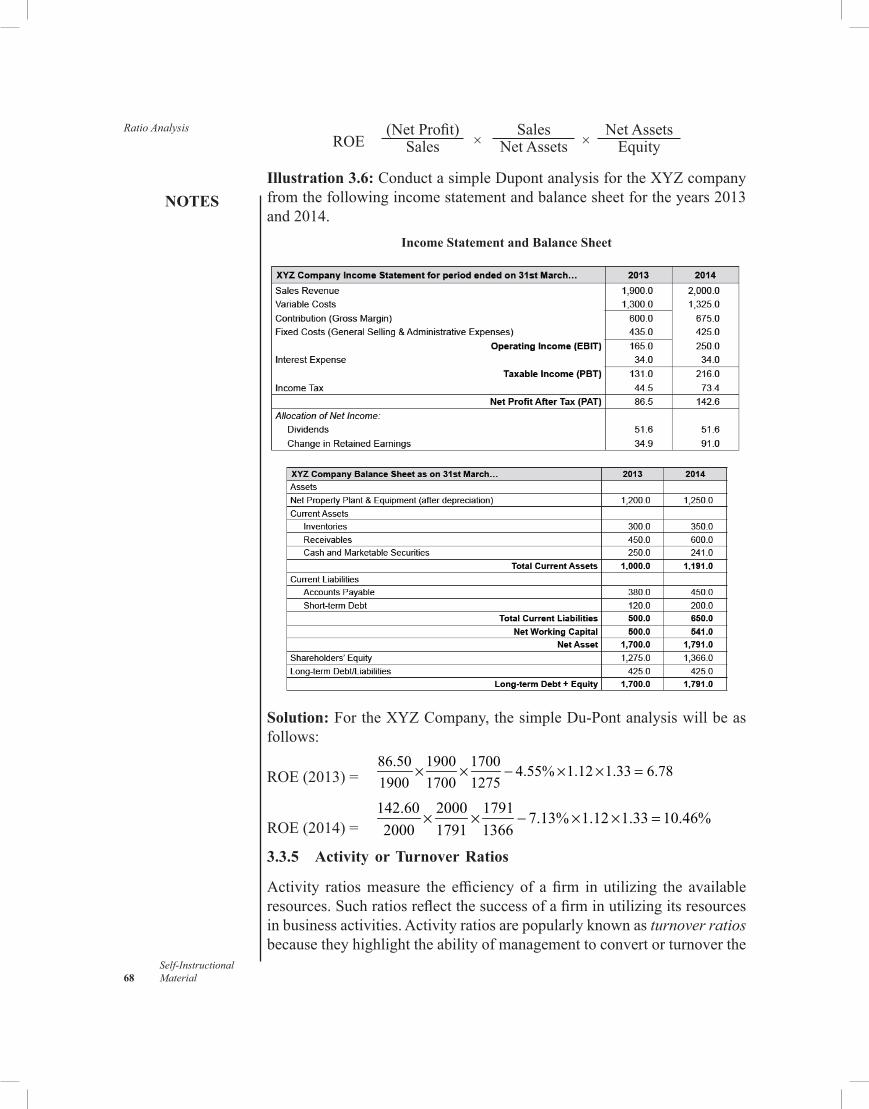
Ratio Analysis
NOTES
Self-Instructional 68 Material
(NetProfit)Sales
SalesNetAssets
NetAssetsEquity× ×ROE
Illustration 3.6:ConductasimpleDupontanalysisfortheXYZcompanyfromthefollowingincomestatementandbalancesheetfortheyears2013and 2014.
Income Statement and Balance Sheet
Solution:FortheXYZCompany,thesimpleDu-Pontanalysiswillbeasfollows:
ROE(2013)=86.50 1900 1700 4.55% 1.12 1.33 6.781900 1700 1275
× × − × × =
ROE(2014)=142.60 2000 1791 7.13% 1.12 1.33 10.46%2000 1791 1366
× × − × × =
3.3.5 Activity or Turnover Ratios
Activity ratiosmeasure the efficiencyof afirm inutilizing the availableresources.Suchratiosreflectthesuccessofafirminutilizingitsresourcesinbusinessactivities.Activityratiosarepopularlyknownasturnover ratios becausetheyhighlighttheabilityofmanagementtoconvertorturnoverthe
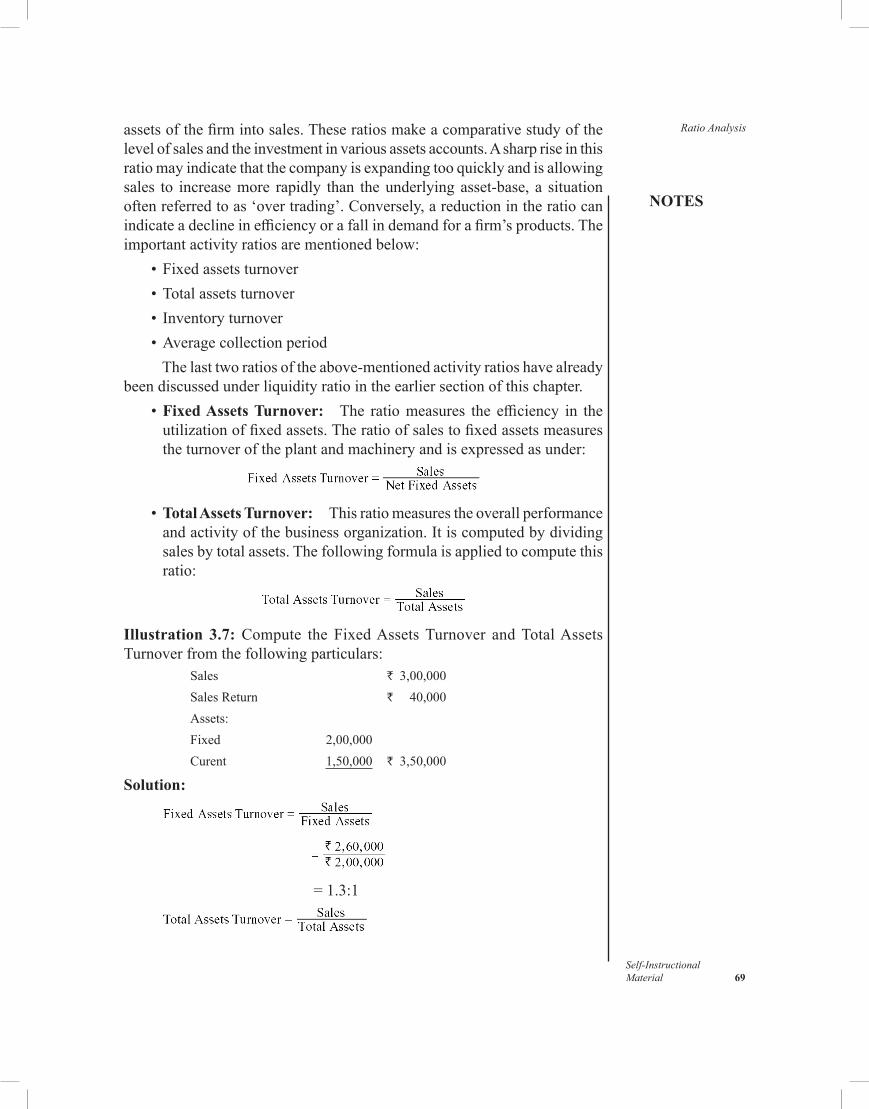
NOTES
Self-InstructionalMaterial 69
Ratio Analysisassetsofthefirmintosales.Theseratiosmakeacomparativestudyofthelevelofsalesandtheinvestmentinvariousassetsaccounts.Asharpriseinthisratiomayindicatethatthecompanyisexpandingtooquicklyandisallowingsales to increasemore rapidly than theunderlyingasset-base, a situationoftenreferredtoas‘overtrading’.Conversely,areductionintheratiocanindicateadeclineinefficiencyorafallindemandforafirm’sproducts.Theimportantactivityratiosarementionedbelow: • Fixedassetsturnover • Totalassetsturnover • Inventory turnover • Averagecollectionperiod
Thelasttworatiosoftheabove-mentionedactivityratioshavealreadybeendiscussedunderliquidityratiointheearliersectionofthischapter. • Fixed Assets Turnover: The ratiomeasures the efficiency in the
utilizationoffixedassets.Theratioofsalestofixedassetsmeasurestheturnoveroftheplantandmachineryandisexpressedasunder:
• Total Assets Turnover: Thisratiomeasurestheoverallperformanceandactivityofthebusinessorganization.Itiscomputedbydividingsalesbytotalassets.Thefollowingformulaisappliedtocomputethisratio:
Illustration 3.7: Compute the FixedAssetsTurnover andTotalAssetsTurnoverfromthefollowingparticulars:
Sales ` 3,00,000 SalesReturn ` 40,000 Assets: Fixed 2,00,000 Curent 1,50,000 ` 3,50,000
Solution:
= 1.3:1
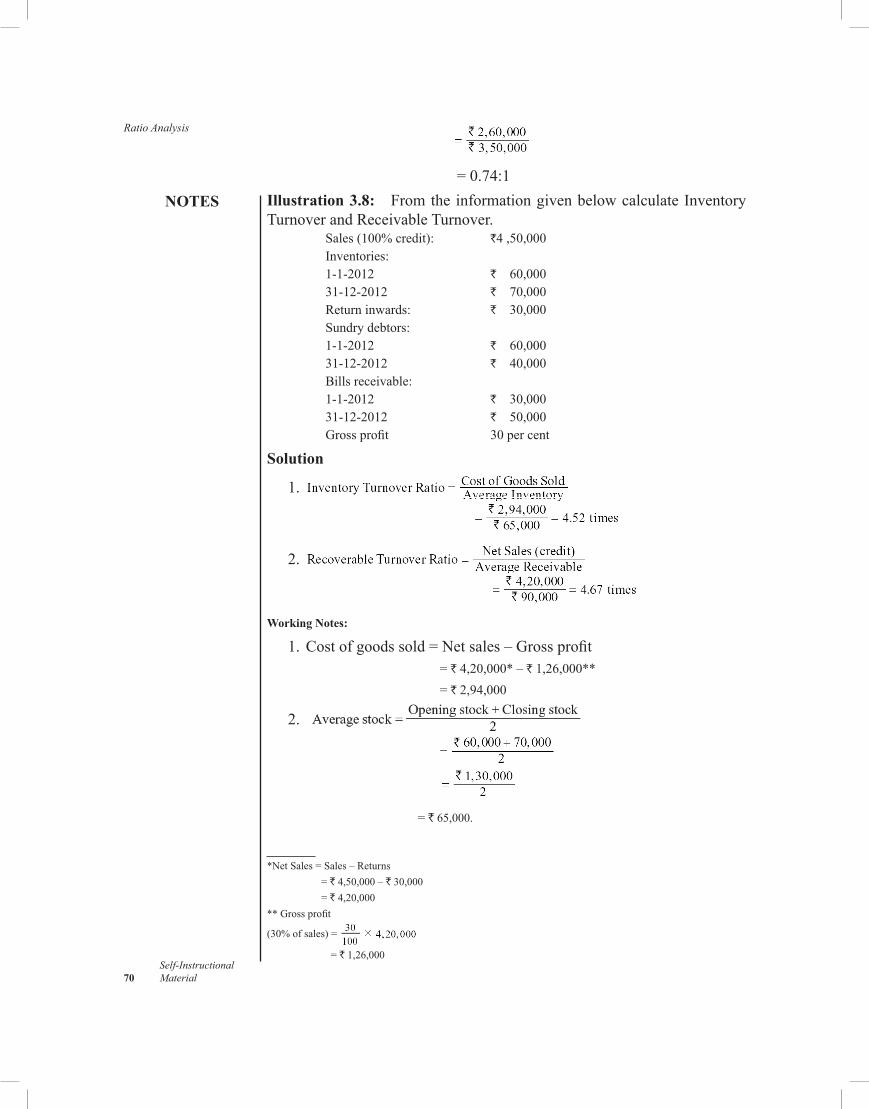
Ratio Analysis
NOTES
Self-Instructional 70 Material
= 0.74:1
Illustration 3.8: FromtheinformationgivenbelowcalculateInventoryTurnoverandReceivableTurnover.
Sales(100%credit): `4,50,000 Inventories: 1-1-2012 `60,000 31-12-2012 `70,000 Returninwards: `30,000 Sundry debtors: 1-1-2012 `60,000 31-12-2012 `40,000 Billsreceivable: 1-1-2012 `30,000 31-12-2012 `50,000 Grossprofit 30percent
Solution
1.
2.
Working Notes:
1.Costofgoodssold=Netsales–Grossprofit = `4,20,000*–`1,26,000** = `2,94,000
2.
= `65,000.
*NetSales=Sales–Returns
=`4,50,000–`30,000
=`4,20,000
**Grossprofit
(30%ofsales)=
=`1,26,000
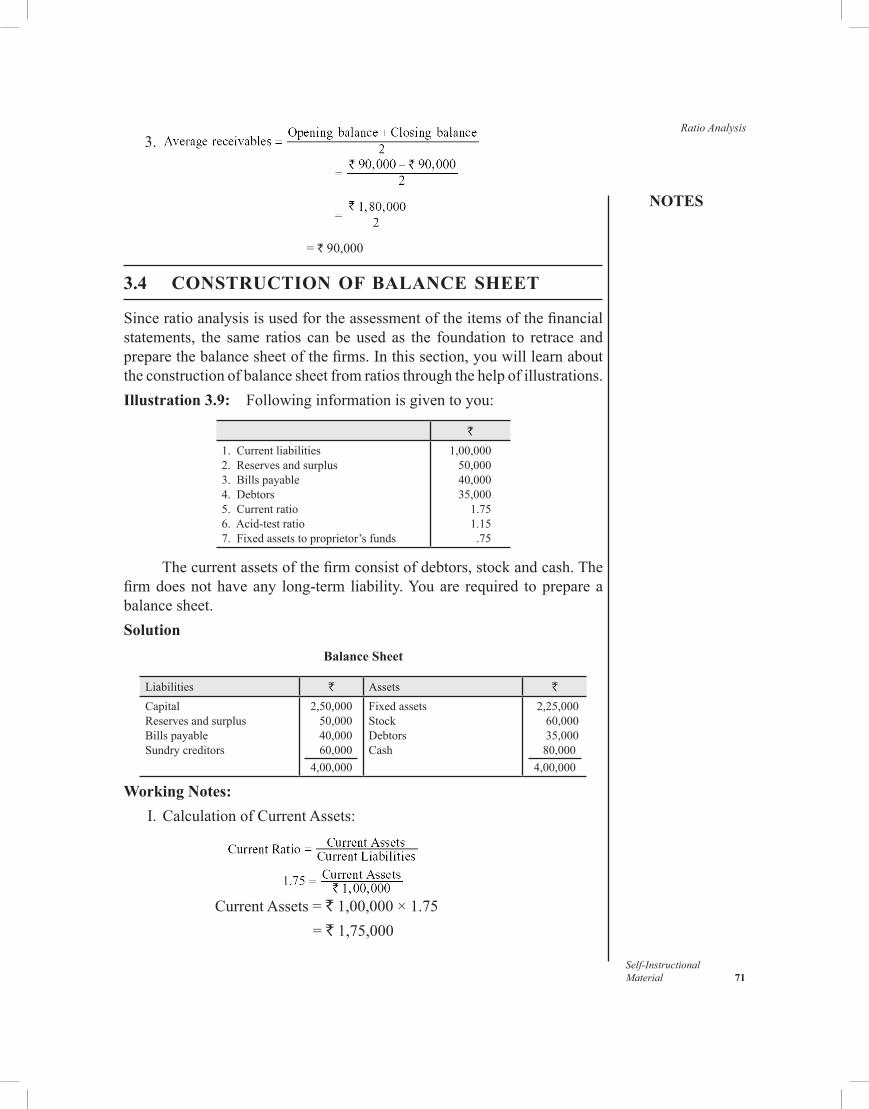
NOTES
Self-InstructionalMaterial 71
Ratio Analysis 3.
= `90,000
3.4 CONSTRUCTION OF BALANCE SHEET
Sinceratioanalysisisusedfortheassessmentoftheitemsofthefinancialstatements, the same ratios canbeused as the foundation to retrace andpreparethebalancesheetofthefirms.Inthissection,youwilllearnabouttheconstructionofbalancesheetfromratiosthroughthehelpofillustrations.Illustration 3.9: Followinginformationisgiventoyou:
`
1. Currentliabilities2. Reservesandsurplus3. Billspayable4. Debtors5. Current ratio6. Acid-testratio7. Fixedassetstoproprietor’sfunds
1,00,00050,00040,00035,000 1.75 1.15 .75
Thecurrentassetsofthefirmconsistofdebtors,stockandcash.Thefirmdoesnothaveany long-term liability.Youare required toprepareabalancesheet.Solution
Balance Sheet
Liabilities ` Assets `
CapitalReservesandsurplusBillspayableSundry creditors
2,50,00050,00040,00060,0004,00,000
FixedassetsStockDebtorsCash
2,25,00060,00035,00080,0004,00,000
Working Notes: I.CalculationofCurrentAssets:
Current Assets = `1,00,000×1.75 = `1,75,000
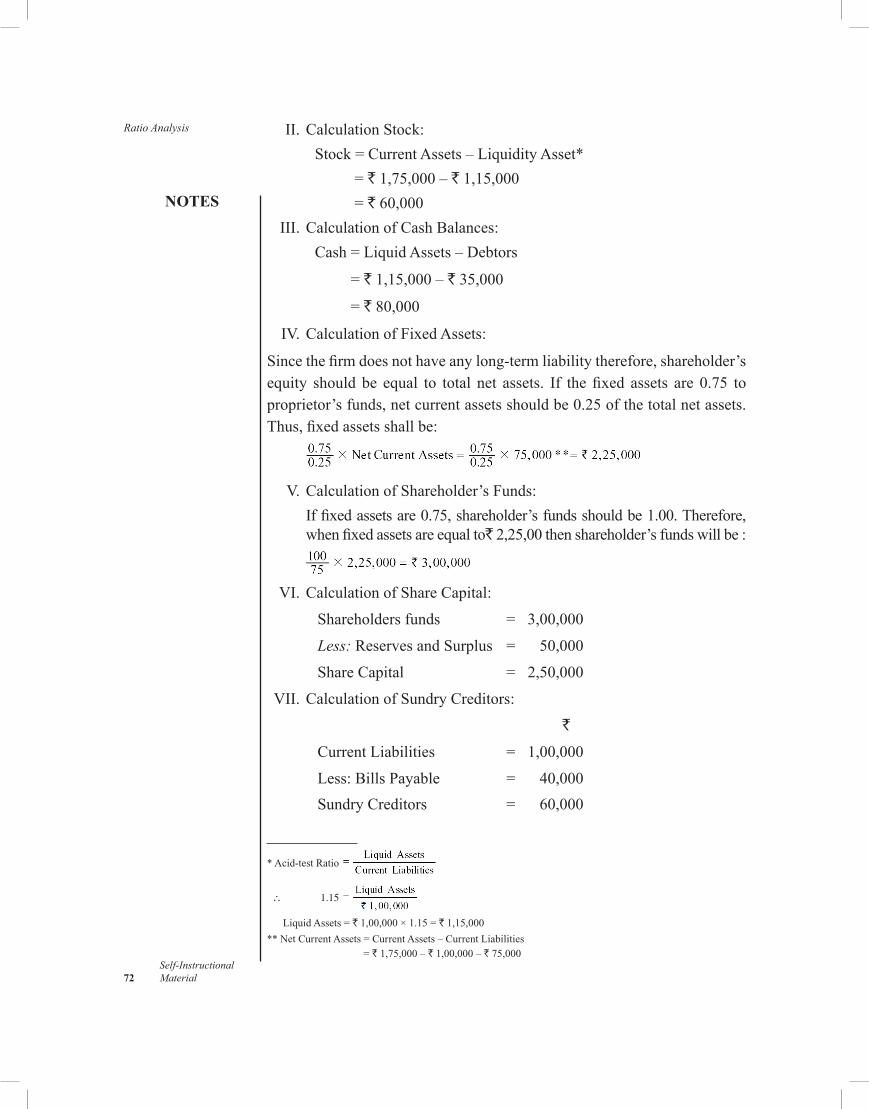
Ratio Analysis
NOTES
Self-Instructional 72 Material
II.CalculationStock: Stock=CurrentAssets–LiquidityAsset* = `1,75,000–`1,15,000 = `60,000
III.CalculationofCashBalances: Cash=LiquidAssets–Debtors
= `1,15,000–`35,000
= `80,000
IV.CalculationofFixedAssets:
Sincethefirmdoesnothaveanylong-termliabilitytherefore,shareholder’sequity should be equal to total net assets. If thefixed assets are 0.75 toproprietor’sfunds,netcurrentassetsshouldbe0.25ofthetotalnetassets.Thus,fixedassetsshallbe:
V.CalculationofShareholder’sFunds: Iffixedassetsare0.75,shareholder’sfundsshouldbe1.00.Therefore,
whenfixedassetsareequalto`2,25,00thenshareholder’sfundswillbe:
VI.CalculationofShareCapital:
Shareholdersfunds = 3,00,000
Less: ReservesandSurplus = 50,000
ShareCapital = 2,50,000
VII.CalculationofSundryCreditors:
`
CurrentLiabilities = 1,00,000
Less:BillsPayable = 40,000 SundryCreditors = 60,000
*Acid-testRatio
∴ 1.15
LiquidAssets=`1,00,000×1.15=`1,15,000
**NetCurrentAssets=CurrentAssets–CurrentLiabilities
=`1,75,000–`1,00,000–`75,000
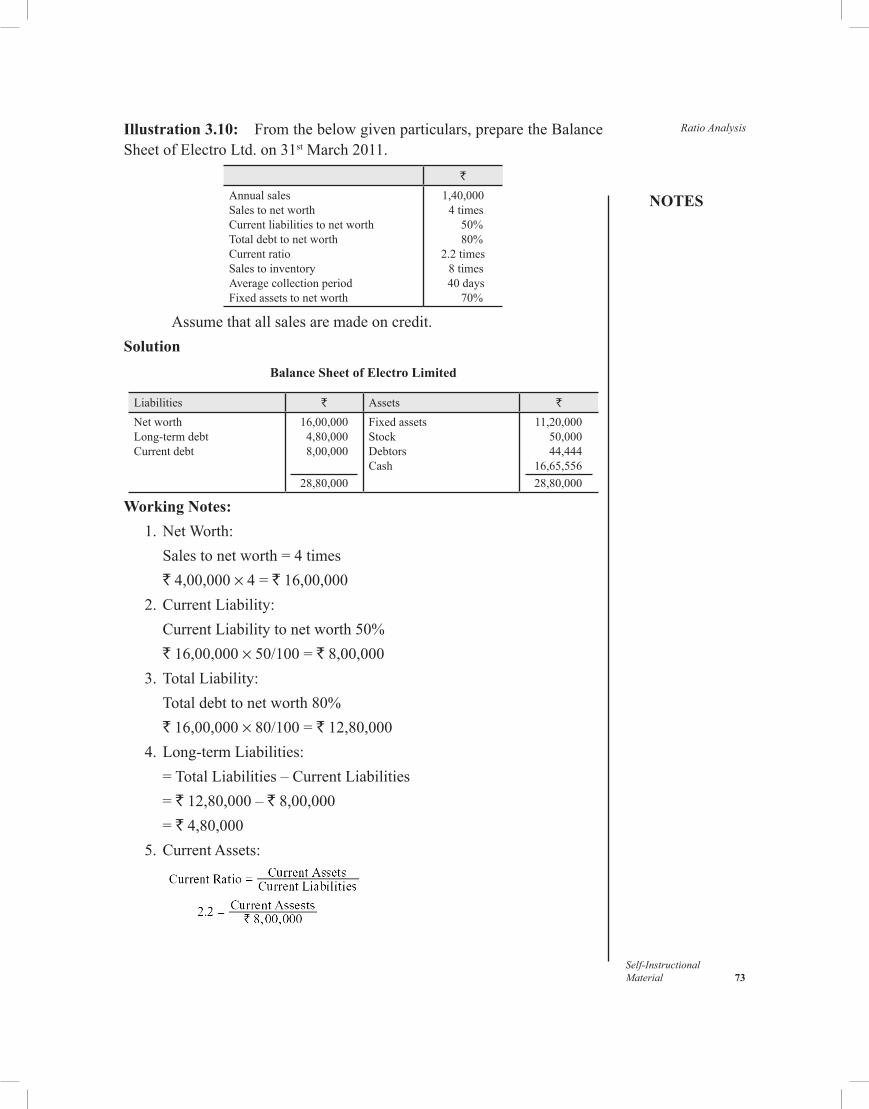
NOTES
Self-InstructionalMaterial 73
Ratio AnalysisIllustration 3.10: Fromthebelowgivenparticulars,preparetheBalanceSheetofElectroLtd. on 31stMarch2011.
`
AnnualsalesSalestonetworthCurrentliabilitiestonetworthTotaldebttonetworthCurrent ratioSalestoinventoryAveragecollectionperiodFixedassetstonetworth
1,40,000 4 times50%80%2.2 times 8 times 40 days70%
Assumethatallsalesaremadeoncredit.Solution
Balance Sheet of Electro Limited
Liabilities ` Assets `
NetworthLong-termdebtCurrent debt
16,00,0004,80,0008,00,000
28,80,000
FixedassetsStockDebtorsCash
11,20,00050,00044,444
16,65,55628,80,000
Working Notes: 1.NetWorth: Salestonetworth=4times `4,00,000× 4 = `16,00,000 2.CurrentLiability: CurrentLiabilitytonetworth50% `16,00,000×50/100=`8,00,000 3.TotalLiability: Totaldebttonetworth80% `16,00,000×80/100=`12,80,000 4.Long-termLiabilities: =TotalLiabilities–CurrentLiabilities = `12,80,000–`8,00,000 = `4,80,000 5. Current Assets:
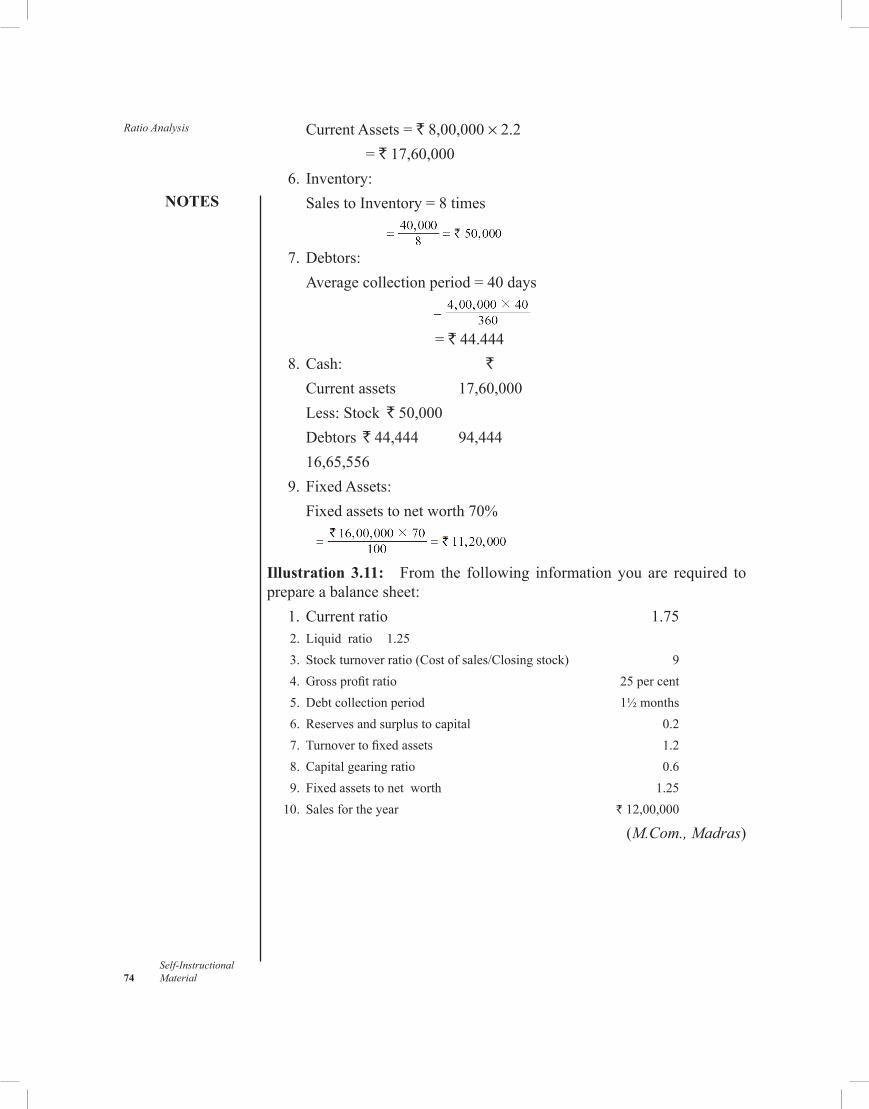
Ratio Analysis
NOTES
Self-Instructional 74 Material
Current Assets = `8,00,000× 2.2= `17,60,000
6. Inventory: SalestoInventory=8times
7. Debtors: Averagecollectionperiod=40days
= ` 44.444 8.Cash: `
Currentassets 17,60,000 Less:Stock `50,000 Debtors `44,444 94,444 16,65,556 9.FixedAssets: Fixedassetstonetworth70%
Illustration 3.11: From the following informationyou are required toprepareabalancesheet: 1. Current ratio 1.75 2. Liquidratio 1.25 3. Stockturnoverratio(Costofsales/Closingstock) 9 4. Grossprofitratio 25percent 5. Debtcollectionperiod 1½months 6. Reservesandsurplustocapital 0.2 7. Turnovertofixedassets 1.2 8. Capitalgearingratio 0.6 9. Fixedassetstonetworth 1.25 10. Salesfortheyear ` 12,00,000
(M.Com., Madras)
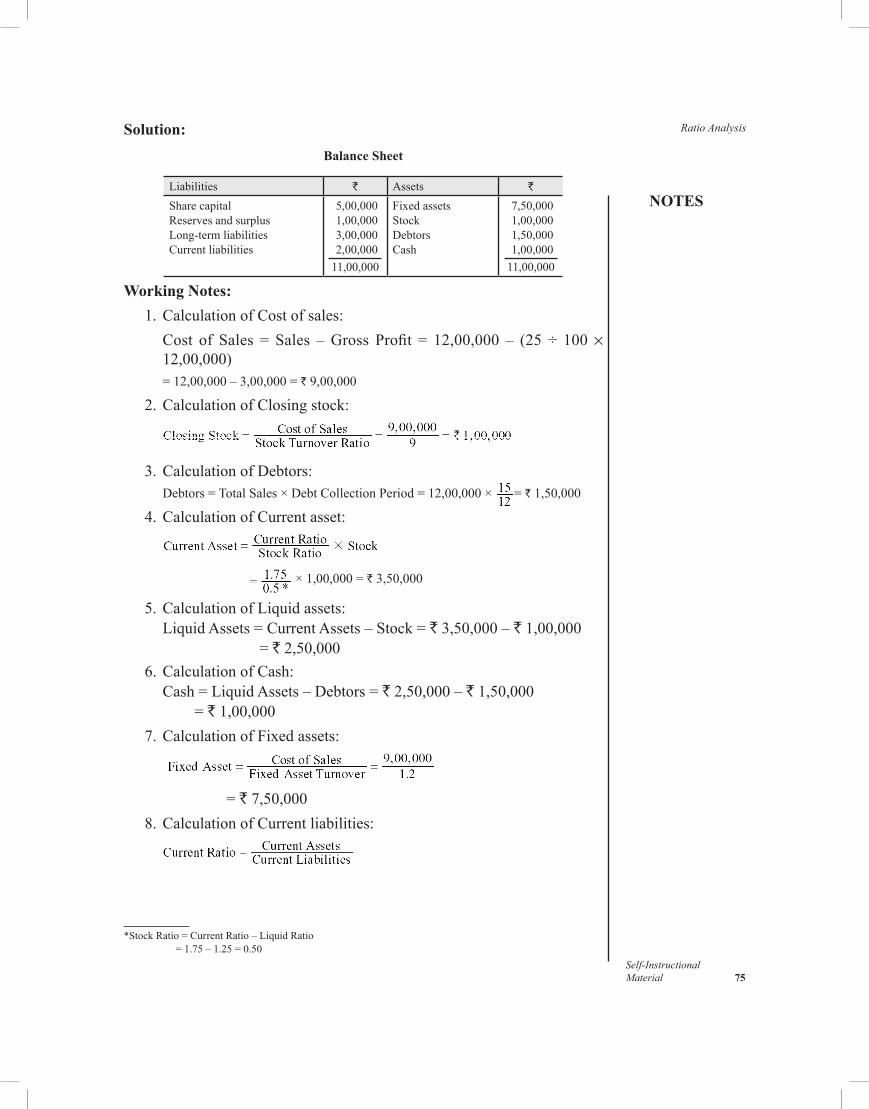
NOTES
Self-InstructionalMaterial 75
Ratio AnalysisSolution:Balance Sheet
Liabilities ` Assets `
SharecapitalReservesandsurplusLong-termliabilitiesCurrentliabilities
5,00,0001,00,0003,00,0002,00,00011,00,000
FixedassetsStockDebtorsCash
7,50,0001,00,0001,50,0001,00,00011,00,000
Working Notes: 1.CalculationofCostofsales: Cost of Sales = Sales –Gross Profit = 12,00,000 – (25 ÷ 100×
12,00,000) =12,00,000–3,00,000=`9,00,000
2.CalculationofClosingstock:
3.CalculationofDebtors: Debtors=TotalSales×DebtCollectionPeriod=12,00,000× = `1,50,000
4.CalculationofCurrentasset:
×1,00,000=`3,50,000
5.CalculationofLiquidassets: LiquidAssets=CurrentAssets–Stock=`3,50,000–`1,00,000 = `2,50,000 6.CalculationofCash: Cash=LiquidAssets–Debtors=`2,50,000–`1,50,000 = `1,00,000 7.CalculationofFixedassets:
= `7,50,000 8.CalculationofCurrentliabilities:
*StockRatio=CurrentRatio–LiquidRatio =1.75–1.25=0.50
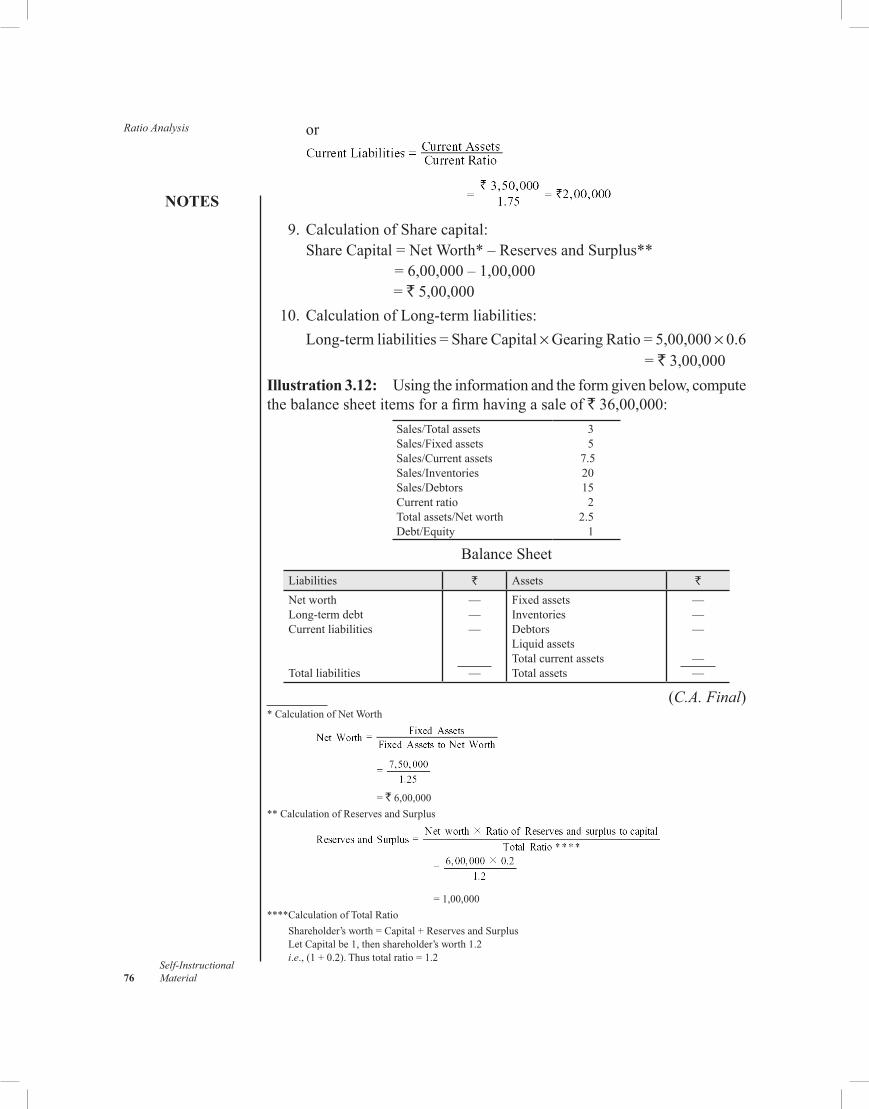
Ratio Analysis
NOTES
Self-Instructional 76 Material
or
9. CalculationofSharecapital: ShareCapital=NetWorth*–ReservesandSurplus** =6,00,000–1,00,000 = `5,00,000 10.CalculationofLong-termliabilities: Long-termliabilities=ShareCapital×GearingRatio=5,00,000× 0.6 = `3,00,000Illustration 3.12: Usingtheinformationandtheformgivenbelow,computethebalancesheetitemsforafirmhavingasaleof`36,00,000:
Sales/TotalassetsSales/FixedassetsSales/CurrentassetsSales/InventoriesSales/DebtorsCurrent ratioTotalassets/NetworthDebt/Equity
3 5 7.5 20 15 22.5 1
BalanceSheetLiabilities ` Assets `
NetworthLong-termdebtCurrentliabilities
Totalliabilities
———
—
FixedassetsInventoriesDebtorsLiquidassetsTotalcurrentassetsTotalassets
———
——
(C.A. Final)*CalculationofNetWorth
=`6,00,000**CalculationofReservesandSurplus
=1,00,000
****CalculationofTotalRatio
Shareholder’sworth=Capital+ReservesandSurplusLetCapitalbe1,thenshareholder’sworth1.2i.e.,(1+0.2).Thustotalratio=1.2
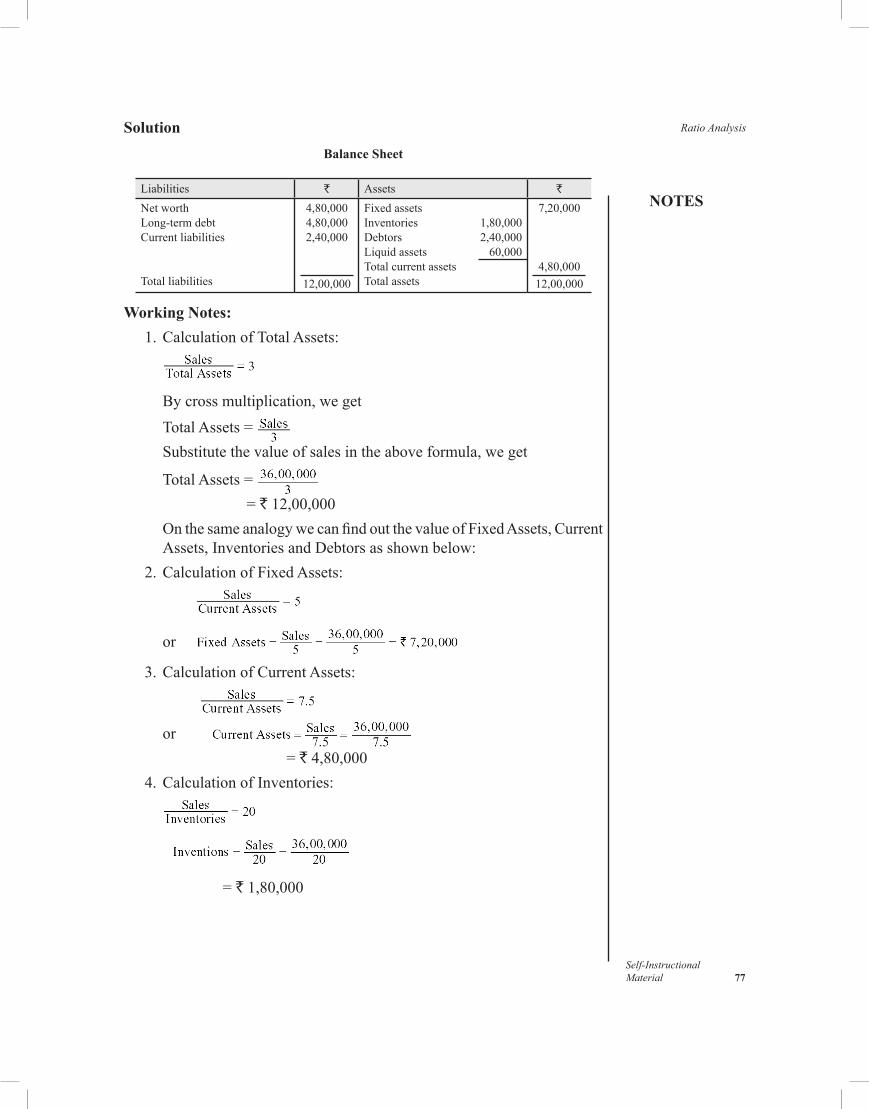
NOTES
Self-InstructionalMaterial 77
Ratio AnalysisSolutionBalance Sheet
Liabilities ` Assets `
NetworthLong-termdebtCurrentliabilities
Totalliabilities
4,80,0004,80,0002,40,000
12,00,000
FixedassetsInventories 1,80,000Debtors 2,40,000Liquidassets 60,000TotalcurrentassetsTotalassets
7,20,000
4,80,00012,00,000
Working Notes: 1.CalculationofTotalAssets:
Bycrossmultiplication,weget TotalAssets= Substitutethevalueofsalesintheaboveformula,weget
TotalAssets= = `12,00,000 OnthesameanalogywecanfindoutthevalueofFixedAssets,Current
Assets,InventoriesandDebtorsasshownbelow: 2.CalculationofFixedAssets:
or
3.CalculationofCurrentAssets:
or = `4,80,000 4.CalculationofInventories:
= `1,80,000
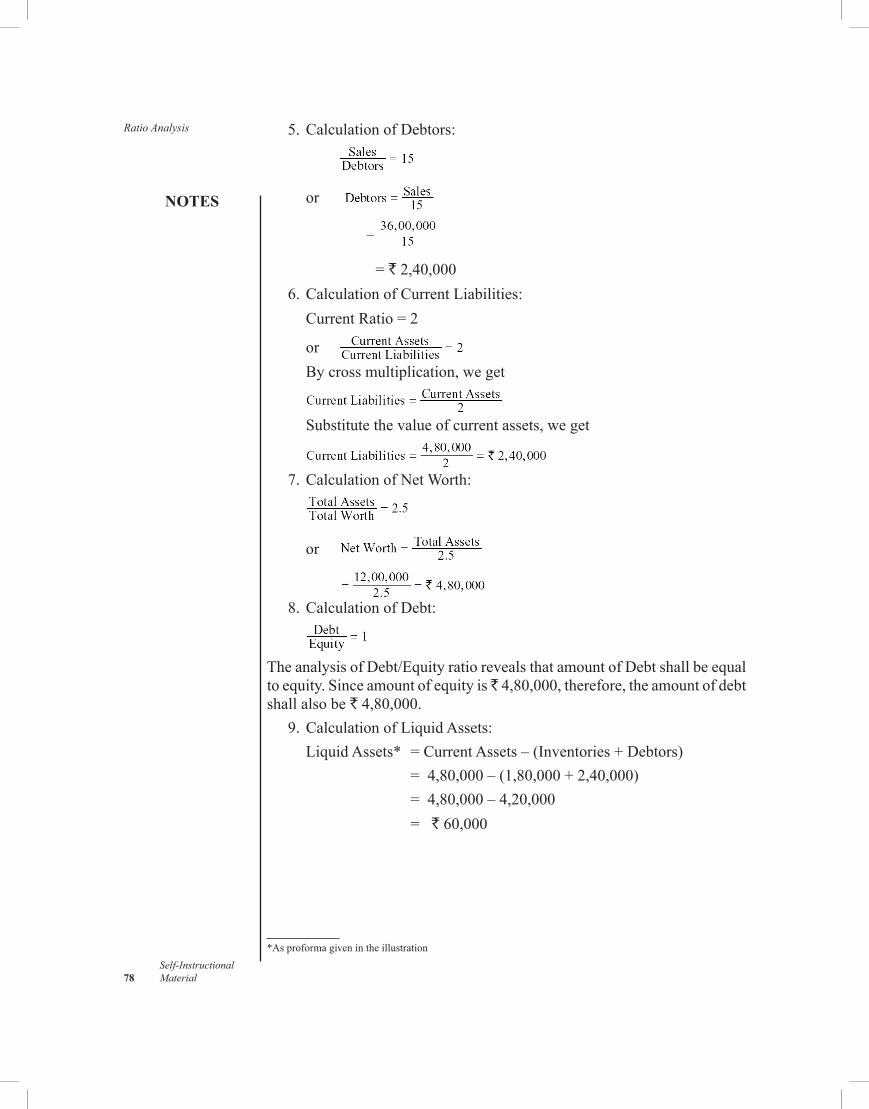
Ratio Analysis
NOTES
Self-Instructional 78 Material
5.CalculationofDebtors:
or
= `2,40,000 6.CalculationofCurrentLiabilities: CurrentRatio=2
or Bycrossmultiplication,weget
Substitutethevalueofcurrentassets,weget
7.CalculationofNetWorth:
or
8.CalculationofDebt:
TheanalysisofDebt/EquityratiorevealsthatamountofDebtshallbeequaltoequity.Sinceamountofequityis 4,80,000,therefore,theamountofdebtshallalsobe`4,80,000. 9.CalculationofLiquidAssets: LiquidAssets* =CurrentAssets–(Inventories+Debtors) =4,80,000–(1,80,000+2,40,000) =4,80,000–4,20,000 = `60,000
*Asproformagivenintheillustration
NOTES
Self-InstructionalMaterial 79
Ratio AnalysisCheck Your Progress
3.Howareratiosclassifiedonthebasisoftime? 4.Mentionsomeexamplesofsecondaryratios. 5.Name the ratiowhich signifies a very short-term liquidity of a
business concern. 6.Whatdoesalowproprietaryratioindicate? 7.Whyisreturnonowner’sequityconsideredaneffectiveindicator
ofacompany’sprofitability?
3.5 ANSWERS TO CHECK YOUR PROGRESS QUESTIONS
1.Theinterpretationofratioscanbemadebycomparingthemwith: • Previousfigures—trendanalysis; • Similarfirms—inter-firmcomparisons; • Targets—individualratiosettomeettheobjective. 2.Thepurposeofratioanalysisistohelpthereaderoffinancialstatements
tounderstandtheinformationshownbyhighlightinganumberofkeyrelationships.
3.Onthebasisoftimetowhichtheratioscomputedbelong,theratiocanbedividedintostructuralratiosandtrendratios.
4.Examplesofsecondaryratiosincludeturnoverratios,expensesratios,earningspershare,etc.
5.Acidtestratiosignifiesaveryshort-termliquidityofabusinessconcern. 6.Alowproprietaryratiowould indicatearelatively largerdegreeof
securityforthecompany. 7.Thereturnonowner’sequityisconsideredasaneffectiveindicatorof
acompany’sprofitabilitybecauseitreflectsthemanagement’ssuccessinefficientutilizationoftheowner’sinvestment.
3.6 SUMMARY
•Ratioanalysisisoneofthepopulartoolsoffinancialstatementanalysis. •A ratio is defined as the indicated quotient of twomathematical
expressionsandthereforeexpressestherelationshipbetweentwoormorethings.
Ratio Analysis
NOTES
Self-Instructional 80 Material
•Financialratioexpeditestheanalysisbyreducingthelargenumberofitemsinvolvedtoarelativelysmallsetofreadilycomprehendedandeconomicallymeaningfulindicators.
•The trendanalysisprovides enoughclues to the analyst forproperevaluationofthefinancialratios.
• Inter-firmcomparisonsmayclaimthecomparisonsofsimilarratiosforanumberofdifferentfirmsinthesameindustry.
•Profit and loss ratios indicate the relationship between two suchvariableswhichhavebeentakenfromtheprofitandlossaccount.
•Balancesheetratiosattemptstoexpresstherelationshipbetweentwobalancesheetitemse.g.,theratioofstocktodebtors,ortheratioofowner’sequitytototalequity.
• Inter-statementratiosdealwiththerelationshipbetweenoperatingandbalancesheetitems.
•Structuralratiosexhibit therelationbetweentwosuchitemswhichrelatetothesamefinancialperiod.
•Trendratiosdealwiththerelationshipbetweenitemsoveraperiodoftime.
•Primaryratiosrefertoanyratiothatrelatestosuchobjectiveistreatedas primary ratio.
•Secondaryratiosrepresentsuchratiosotherthantheprimaryratio. •Theliquidityratiosindicatetheliquiditypositionofacompany. •Thecurrentratiocomparesthetotalcurrentassetswiththetotalcurrent
liabilities. •Acid-testratioprovidesanevenmorecriticallookattheabilityofthe
companytomeetitsday-to-dayobligations. •Receivablesturnoveristheamountofperiodrequiredforonecomplete
cycle:Fromthetimereceivablesarerecordedthroughcollectiontothetimenewreceivablesarerecorded.
•Leverage ratiosmeasure the contribution of financing by ownerscomparedwithfinancingprovidedbythefirm’screditors.
•Debt-equityratiodevelopsrelationshipbetweenownedfundsandtheborrowedfunds.
•Equity Ratio/Proprietary Ratiomeasures the proportion of thecompany’sassetsthatareprovidedorclaimedbytheowners.
•Ratioofexternalequitiestototalassetsratiomeasurestheproportionofthefirm’sassetsthatarefinancedbycreditors.
•Fixedassetstonetworthratioindicatesthepercentagecontributedbyownerstothevalueofthefixedassets.
NOTES
Self-InstructionalMaterial 81
Ratio Analysis •Theratioofcurrentassetstonetworthsignifiestherelationshipbetweenthecurrentassetsandnetworth.
• Interestcoverageratiomeasureshowmanytimesacompanycouldpayitsinterestexpenseswhichiscalculatedbydividinginterestexpensesintoearningsavailableforpaymentofinterestexpense.
•Profitabilityratiosareusedtomeasuretheabilityofthefirmtoconvertsalesintoprofitsandtoearnprofitsonassetsemployed.
•Grossprofitmarginratioindicatestherelationshipbetweengrossprofitandsales.
•Thenetprofitmarginratiomonitorsthenetprofitmadeinrelationtosales.
•ReturnonAssets/CapitalEmployedmeasures relationship earningbeforeinterestandtaxesandafirm’saverageassets.
•Returnonowner’sequityratioisconsideredaneffectiveindicatorofthecompany’sprofitabilitybecauseitreflectsthesuccessofmanagementintheefficientutilizationoftheowner’sinvestment.
•Returnonequitycapitalmonitorstheprofitmadebythecompanyinrelationtoitsequitycapital.
•Theearningspersharerepresentaverageamountofnetincomeearnedbysingleequityshare.
•Activity ratiosmeasure the efficiency of a firm in employing theavailableresources.
•Fixedassetsturnoverratiomeasurestheefficiencyintheutilizationoffixedassets.
•TotalAssets turnover ratiomeasures the overall performance andactivityofthebusinessorganization.
3.7 KEY WORDS
•Ratio: It is defined as the indicated quotient of twomathematicalexpressionsandastherelationshipbetweentwoormorethings.
•Ratio analysis:Ithelpsthemanagementtoidentifyspecificareasthatreflectimprovementordeterioration,aswellasdetectthetroublespotsthatmaypreventtheattainmentofobjectives.
•Liquidity ratios:Theseratiosmeasuretheabilityofacompanytomeetitscurrentliabilitiesastheyfalldue.
•Leverage ratios:Theymeasurethecontributionoffinancingbyownerscomparedwithfinancingprovidedbythefirm’screditors.
•Profitability ratios:Thesemeasuretheabilityofthefirmtoconvertsalesintoprofitsandtoearnprofitsonassetsemployed.
Ratio Analysis
NOTES
Self-Instructional 82 Material
•Turnover ratios:Theyhighlighttheabilityofmanagementtoconvertorturnovertheassetsofthefirmintosales.
3.8 SELF ASSESSMENT QUESTIONS AND EXERCISES
Short-Answer Questions
1.WhataretheusesandlimitationofAccountingRatios? 2.Describethevariousprofitabilityratios.Howaretheyworkedout? 3. “ThereturnonCapitalEmployedisoftentakenasmeasureofefficiency
of an organization”. Comment. 4.Whatdoestherateofreturnonassetsemployedtellaboutmanagement? 5.Acompanyhasa2to1currentratio.Listseveralreasonswhythis
ratiomaynotbeadequate.
Long-Answer Questions
1.WhatdoyouunderstandbyAccountingRatios?Howdoestheratioanalysistechniquehelpinthefinancialanalysis?
2.Statethesignificanceofeachofthefollowingratiosandturnoversandtellhoweachiscalculated:
(i) CurrentRatio (ii) ReceivableTurnover (iii) SolvencyRatio (iv) InventoryTurnover (v) ReturnonAssets 3.Discusstheusefulnessofthefollowingratios: (a) Acid-TestRatio (b) Debt-EquityRatio (c) NetWorthtoFixedAssets (d) InventoryTurnover. 4.What do you understand by Liquidity Ratio, Leverage Ratio,
ProfitabilityRatioandActivityRatio? 5.Discusstheratiosthatdeterminetheliquidityofabusiness. 6.ThefollowingisthebalancesheetofSHELtd.ason31stDecember,
2012:
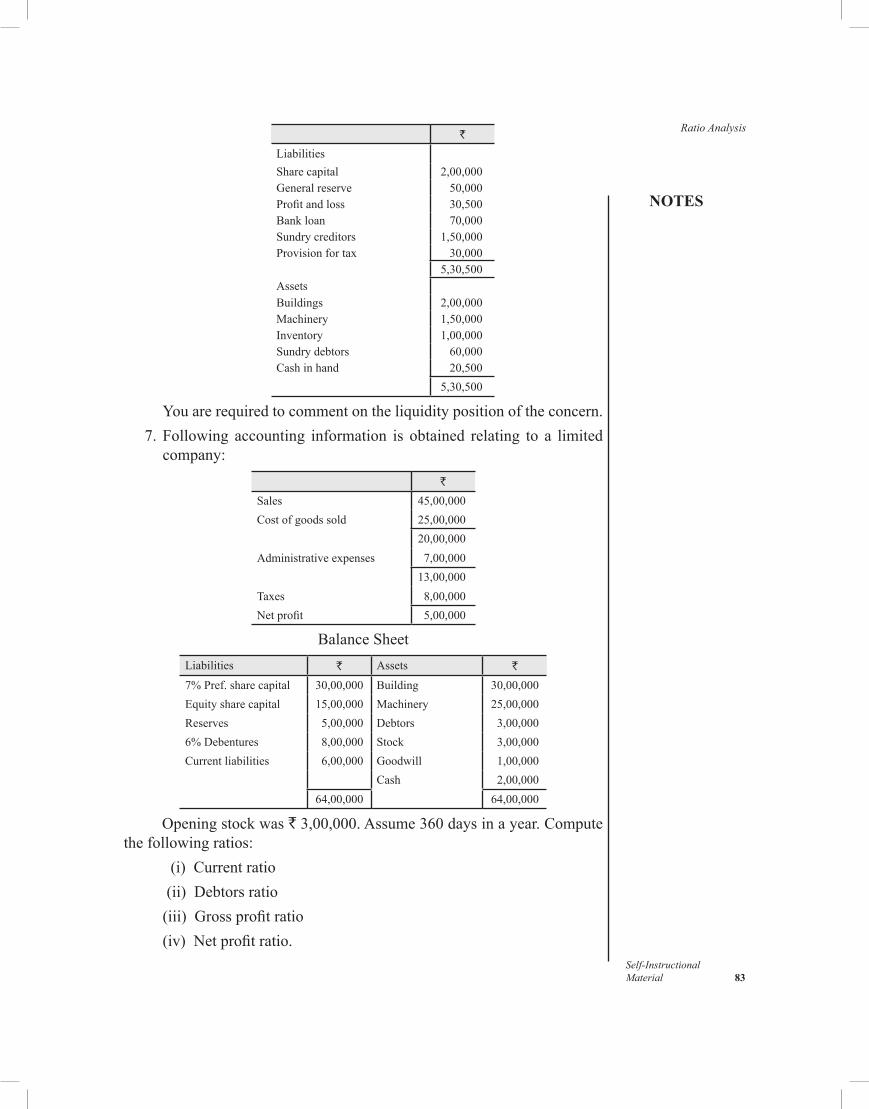
NOTES
Self-InstructionalMaterial 83
Ratio Analysis`
LiabilitiesSharecapital 2,00,000Generalreserve 50,000Profitandloss 30,500Bankloan 70,000Sundry creditors 1,50,000Provisionfortax 30,000
5,30,500AssetsBuildings 2,00,000Machinery 1,50,000Inventory 1,00,000Sundry debtors 60,000Cashinhand 20,500
5,30,500
Youarerequiredtocommentontheliquiditypositionoftheconcern. 7.Following accounting information is obtained relating to a limited
company:`
Sales 45,00,000Costofgoodssold 25,00,000
20,00,000Administrativeexpenses 7,00,000
13,00,000Taxes 8,00,000Netprofit 5,00,000
BalanceSheetLiabilities ` Assets `
7%Pref.sharecapital 30,00,000 Building 30,00,000Equitysharecapital 15,00,000 Machinery 25,00,000Reserves 5,00,000 Debtors 3,00,0006%Debentures 8,00,000 Stock 3,00,000Currentliabilities 6,00,000 Goodwill 1,00,000
Cash 2,00,00064,00,000 64,00,000
Openingstockwas`3,00,000.Assume360daysinayear.Computethefollowingratios: (i) Currentratio (ii) Debtorsratio (iii) Grossprofitratio (iv) Netprofitratio.
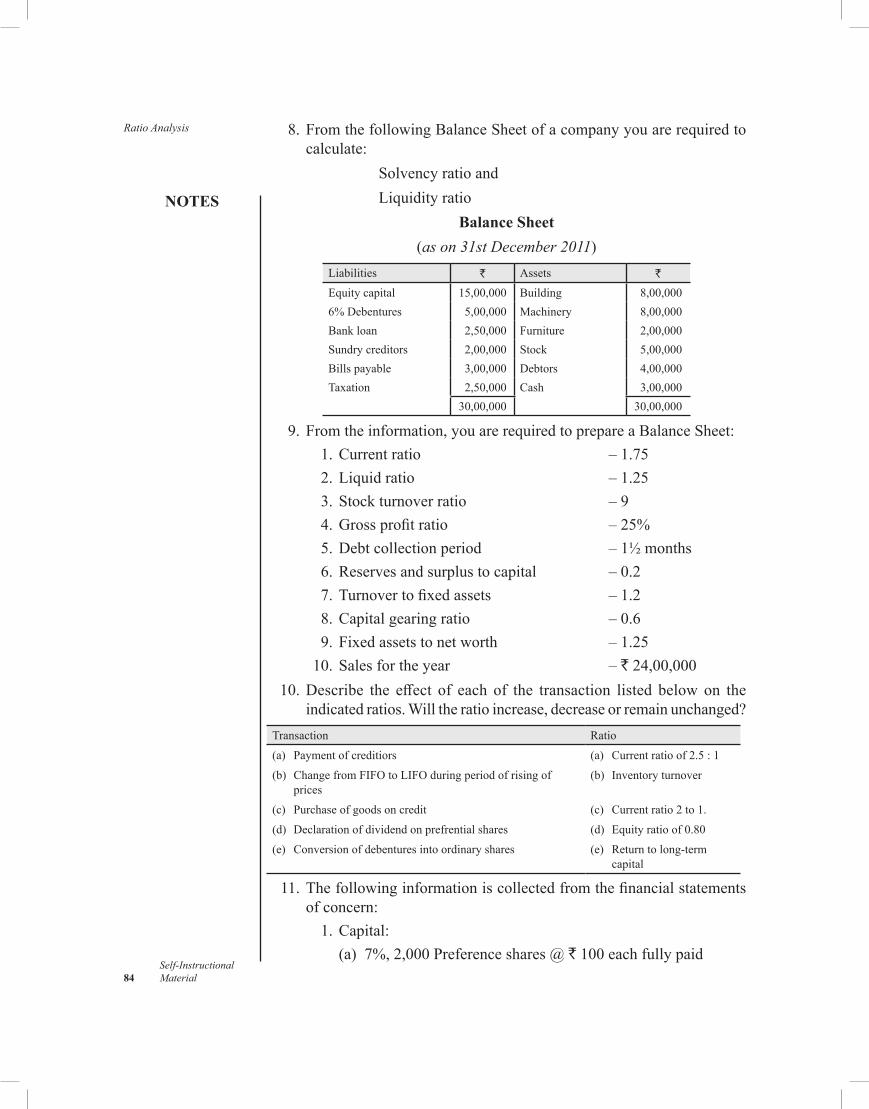
Ratio Analysis
NOTES
Self-Instructional 84 Material
8.FromthefollowingBalanceSheetofacompanyyouarerequiredtocalculate: Solvencyratioand Liquidityratio
Balance Sheet(as on 31st December 2011)
Liabilities ` Assets `
Equitycapital 15,00,000 Building 8,00,0006%Debentures 5,00,000 Machinery 8,00,000Bankloan 2,50,000 Furniture 2,00,000Sundry creditors 2,00,000 Stock 5,00,000Billspayable 3,00,000 Debtors 4,00,000Taxation 2,50,000 Cash 3,00,000
30,00,000 30,00,000
9.Fromtheinformation,youarerequiredtoprepareaBalanceSheet: 1. Current ratio – 1.75 2.Liquidratio –1.25 3.Stockturnoverratio –9 4.Grossprofitratio –25% 5.Debtcollectionperiod –1½months 6.Reservesandsurplustocapital –0.2 7.Turnovertofixedassets –1.2 8.Capitalgearingratio –0.6 9.Fixedassetstonetworth –1.25 10.Salesfortheyear –`24,00,000 10.Describe the effect of each of the transaction listed belowon the
indicatedratios.Willtheratioincrease,decreaseorremainunchanged?Transaction Ratio
(a) Paymentofcreditiors (a) Current ratio of 2.5 : 1
(b) ChangefromFIFOtoLIFOduringperiodofrisingofprices
(b) Inventory turnover
(c) Purchaseofgoodsoncredit (c) Current ratio 2 to 1.
(d) Declarationofdividendonprefrentialshares (d) Equityratioof0.80(e) Conversionofdebenturesintoordinaryshares (e) Returntolong-term
capital
11.Thefollowinginformationiscollectedfromthefinancialstatementsof concern:
1.Capital: (a) 7%,2,000Preferenceshares@`100eachfullypaid
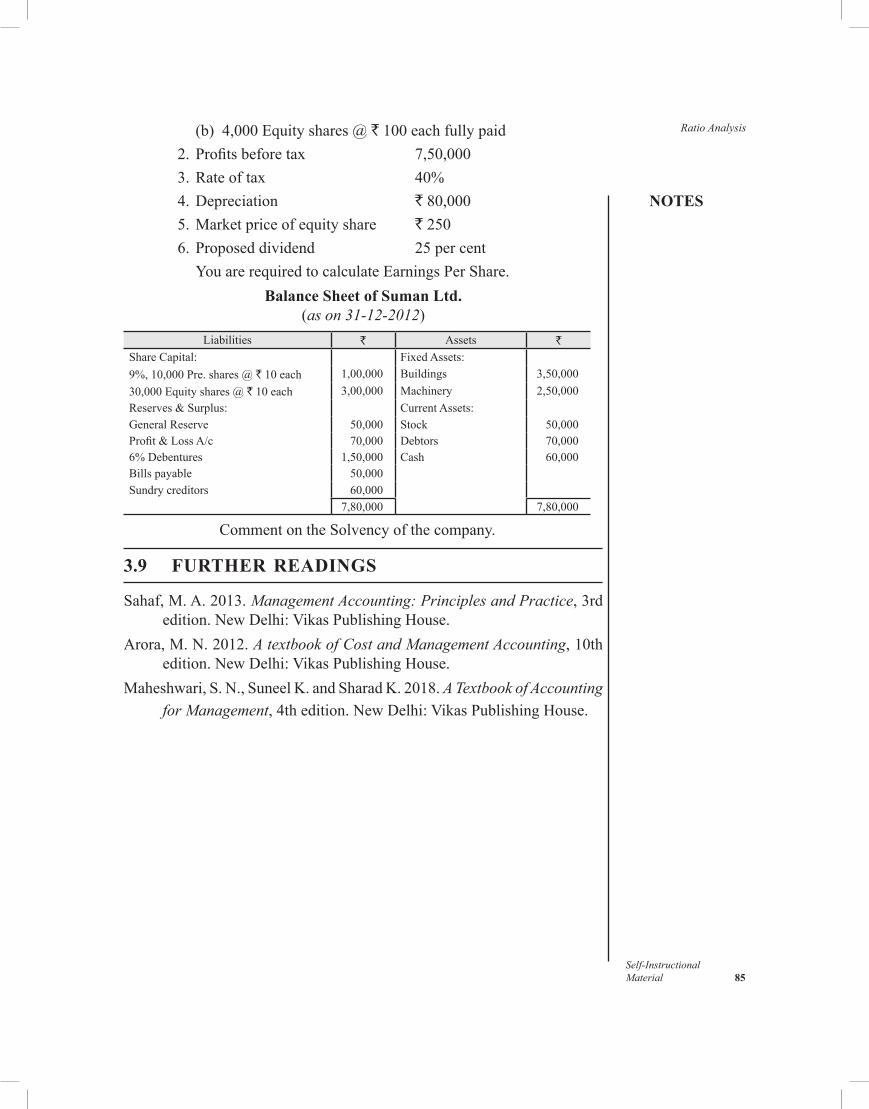
NOTES
Self-InstructionalMaterial 85
Ratio Analysis (b) 4,000Equityshares@`100eachfullypaid 2.Profitsbeforetax 7,50,000 3.Rateoftax 40% 4. Depreciation `80,000 5.Marketpriceofequityshare ` 250 6.Proposeddividend 25percent YouarerequiredtocalculateEarningsPerShare.
Balance Sheet of Suman Ltd. (as on 31-12-2012)
Liabilities ` Assets `ShareCapital: FixedAssets:9%,10,000Pre.shares@`10each 1,00,000 Buildings 3,50,00030,000Equityshares@`10each 3,00,000 Machinery 2,50,000Reserves&Surplus: Current Assets:GeneralReserve 50,000 Stock 50,000Profit&LossA/c 70,000 Debtors 70,0006%Debentures 1,50,000 Cash 60,000Billspayable 50,000Sundry creditors 60,000
7,80,000 7,80,000
CommentontheSolvencyofthecompany.
3.9 FURTHER READINGS
Sahaf,M.A.2013.Management Accounting: Principles and Practice,3rdedition.NewDelhi:VikasPublishingHouse.
Arora,M.N.2012.A textbook of Cost and Management Accounting,10thedition.NewDelhi:VikasPublishingHouse.
Maheshwari,S.N.,SuneelK.andSharadK.2018.A Textbook of Accounting for Management,4thedition.NewDelhi:VikasPublishingHouse.
Funds Flow Statement
NOTES
Self-Instructional 86 Material
UNIT 4 FUNDS FLOW STATEMENTStructure 4.0 Introduction 4.1 Objectives 4.2 FundsFlowStatement:Meaning 4.3 PreparationofFundsFlowStatement
4.3.1 StatementorScheduleofChangesintheWorkingCapital 4.3.2 StatementofSourcesandApplicationsofFunds 4.3.3 FundsfromOperation/OperationalProfit 4.3.4 AdjustmentofTypicalItems 4.3.5 PreparationofWorkingAccountsandNotes(HiddenTransaction)
4.4 AnswerstoCheckYourProgressQuestions 4.5 Summary 4.6 Key Words 4.7 SelfAssessmentQuestionandExercises 4.8 FurtherReadings
4.0 INTRODUCTION
Thetraditionalbalancesheetrevealsthefinancialpositionofanorganizationbymentioningnotonlythesourcesofitsresourcesbutalsothedeploymentofitsresources.However,suchastatementfailstoidentifythefactorsthatareresponsibleforthechangeinthefinancialpositionoftheorganizationbetweentwofinancialperiods.Theidentificationandanalysisofthesaidfactorsareessentialastheyhaveadirectimpactontheworkingcapital.Itispertinenttomentionhere that themanagementofworkingcapitalhas alwaysbeenrecognizedasaprerequisiteforthesmoothfunctioningoftheorganization.Therefore,themanagementalwayspreferstohaveastudythatwouldhelpittoidentifyandanalysethefactorsthatresultinthechangeofworkingcapital.Infact,suchchangesgenerallytakeplaceeitherduetoaninfloworoutflowoffundwhichisnotrevealedbythetraditionalbalancesheet.Themostpopularframeworkusedforthispurposeisstatement of change in financial position. Thesaidstatementaimstodescribethechangesinthefinancialpositionofaconcernduringaparticularperiod.Infact,suchastatementprovidesthebasisforpolicyformulationbyactingasafinancialreportingmedia.Thestatementofchangesinfinancialpositionisalsoknownasfunds flow statement, where got were gone statement, management funds statement,etc.However,wemayusethetermfunds flow statementinthisbook.
4.1 OBJECTIVES
Aftergoingthroughthisunit,youwillbeableto: • Explainthemeaningandpreparationoffundflowstatement • Describethescheduleofchangesinworkingcapital
NOTES
Self-InstructionalMaterial 87
Funds Flow Statement • Examinethefundsfromoperation • Discussthesourcesandapplications
4.2 FUNDS FLOW STATEMENT : MEANING
Foraclearunderstandingofthefundsflowanalysis,themeaningofthetermsfund and flowmustbeclearinone’smind.
Fund
Theterm fundcanbeusedboth inbroaderandnarrowsense. Inbroadersense,itrepresentstheworkingcapital(currentassets—currentliabilities)ofaconcernwhileinnarrowsenseitrepresentsonlycashbalancesofafirm.Accordinglytwostatementscanbeprepared,viz., • Funds flow statement: Astatementpreparedonthebasisofnetcurrent
assets/working capitalwhich is calculated by subtracting currentliabilitiesfromcurrentassets.
• Cash flow statement: Astatementthatisgovernedbythenarrowsenseoffund,i.e.,cashbalances,andtherefore,considersonlyreceiptsandpaymentsofcashandtransactionsaffectingcashpositioninitspreparation.
Flow
Flowoffundreferstoabusinesstransactionthatcausesachangeintheamountoffund(workingcapital)thatexistsbeforethematurityofthetransaction.Theflowoffundisrecognizedfromthedegreeofchangeintheamountofworkingcapital.Ifatransactionincreasestheamountofworkingcapital,itisreferredtoas source of fund (inflow)whereasthetransactionthatdecreasestheamountofworkingcapitalresultsintheapplication of fund (outflow).Ifatransactionfailstocauseachangeintheamountofworkingcapital,itdoesnotamounttoflowoffund.Supposeacompanyhasafund(Currentassets–Currentliabilities)of`1,20,000on31December2019.On1January2020,itpurchasedacomputercosting `10,000thatbringsdeclineintheamountofcashtotheextentof ` 10,000which in turn decreases the amount ofworking by` 10,000.Accordingly,theamountoffundisreducedto`1,10,000(1,20,000–10,000).Thepurchaseofcomputeristreatedasflowoffund(outflow)becauseitbroughtachangeintheamountofworkingcapital(fund)from 1,20,000to 1,10,000.
After analysing the above example, it is clear that a change in theamountofworkingcapitalfrom 1,20,000to 1,10,000istheresultofchangeinthetwoitemsofthecompany.Firstly,theamountofcash(acurrentitem)is reduced by 10,000,andsecondly,theamountoffixedasset(non-currentitem)isincreasedbythesameamount.Fromthisfact,wecanconcludethat: • theflowoffund(changeinworkingcapital)occurswhenasimilar
changeisobservedsimultaneouslyinonecurrentandonenon-currentaccountasaresultofasingletransaction;
Funds Flow Statement
NOTES
Self-Instructional 88 Material
• thetransactionthatinvolvesonlycurrentaccountsoronlynon-currentaccountsdoesnotamounttoflowoffund(changeinworkingcapital);and
• theflowoffund,i.e.,changeinworkingcapitalhasasimilarimpactbothoncurrentandnon-currentaccounts.Symbolically,thiscanbeexpressedas ∑∆WC = ∑∆ CA = ∑∆ NAwhere, ∑∆ =aggregatechangein WC=workingcapital CA = current accounts NA=non-currentaccountsThus,theaggregatechangeintheworkingcapitalofaconcernduringa
particularperiodcanbecomputedbyconsideringallchangeswhichoccurredeitherinthecurrentaccountsorinthenon-currentaccounts.Thechangeswhichoccurredinthecurrentaccountsasaresultofflowoffundarereflectedinastatementknownasschedule of changes in working capital,whereassimilarchangesinthenon-currentaccountsareshowninthestatement of changes in financial position alsoknownasfunds flow statement.
In the aboveparagraphswe saw that theflowof fund is identifiedbyanalysingchangesincurrentitemsandnon-currentitems.Therefore,itbecomesimperativetohaveadetailedlistofcurrentandnon-currentaccounts.
Current Accounts
Currentaccountsconsistofcurrentassetsandcurrentliabilities,like: • Current assets:
• inventories • billsreceivable• cashandbankbalances• investments• sundry debtors • prepaidexpenses(temporary)
•Currentliabilities:• billspayable• sundry creditors • outstandingexpensesanddues• proposed dividend • provisionfortaxation
NOTES
Self-InstructionalMaterial 89
Funds Flow Statement• bankoverdraft• provision against current assets
Non-Current AccountsNon-currentaccountscomprisefixedassetsandlong-termliabilitieslike: •Fixedassets:
• landandbuilding• plantandmachinery• furniture• long-terminvestment• goodwill• preliminaryexpenses• trademarks• patentrights• deferredexpenses• discountonissueofshares/debentures• debitbalancesofprofitandlossaccount
•Long-termliabilities:• sharecapital(equityandpreferential)• sharepremiumaccount• shareforfeitedaccount• capitalredemptionreserve• capitalreserves• loans(long-term)• debentures• generalreserves• provisionfordepreciationonfixedassets• bankloan• creditbalancesofprofitsandlossaccount
Illustration 4.1: Explaintheeffectofthebelow-mentionedtransactionsonfund(workingcapital): (i)Purchase6,000sharesat`10each(temporary). (ii)Furthercapitalof`12,000investedduringtheyear. (iii)Saleofunusedplant(completelydepreciated)for`40,000. (iv)Paidcashtosundrycreditors`30,000. (v)PurchaseofInsurancePolicy(5years)of`65,000.
Funds Flow Statement
NOTES
Self-Instructional 90 Material
Solution (i)This transactionwill not affect theworking capital (fund) because
of its temporary nature. On one hand, current assets will beincreased by temporary investment in shares to the extent of `60,000,andontheotherhand,cashwillgooutofthebusinesswhichwillreducethecurrentassetbythesameamount.Hence,currentassetswillnotbeaffected.
(ii)Theadditionalcapitalof`12,000will increasethesharecapital,anon-currentitem,andatthesametime,itwillalsoincreasecash,acurrentitem.Thusitwillresultintheinflowoffund(source).
(iii)Ontheonehand,saleofunusedplantwilldecreasethenon-currentasset (plant), andon theotherhand, itwill increase theamountofcurrentasset(cash)by`40,000.Therefore,ittheamountoffundwillincrease.
(iv)Thetransactionswillchangeonlycurrentaccount,viz.,cashandsundrycreditors,leavingfundunaffected.
(v)Purchaseof insurancepolicywill affectcurrentasset (cash)on theonehandandnon-currentasset(insurancepolicy)ontheotherhand.Thus,thetransactionwillresultintheoutflowoffundtotheextentof`65,000.
Funds Flow Statement
Fundsflowstatementindicatestheamountofchangeinvariousbalancesheetitemsbetweentwoaccountingdates.Itshowsthesourcesandusesoffundsduring an accounting period. A funds statement is prepared in summary form toindicatechanges(andtrendsifpreparedregularly)occurringinitemsoffinancialconditionsbetweentwodifferentbalancesheetdates.AccordingtoAnthany,1970:
The funds flow statement describes the sources from which additional funds were derived and the use to which these sources were put.
Foulke,1976definesfundsflowstatementas:A statement of sources and application of funds is a technical device designed to analyse the changes in the financial condition of a business enterprise between two dates.
Totheauthorofthisbook,fundsflowstatement is a technique used to summarize the financial operations of an organization by studying the sources and application of funds during the accounting period.Suchastatementhelps to identify thechangeswhichhave takenplaceand todemonstratetheirimpactupontheliquidresourcesofthebusiness. Itprovidedaclearindicationofthechangeswhichhavetakenplaceinthefinancialpositionoftheenterprise, particularlyforthepeoplewhoarenotwellversedinreadingbalancesheets.
NOTES
Self-InstructionalMaterial 91
Funds Flow StatementUses of Funds Flow Statement
Fundsflowstatementplaysasignificant role in theevaluationofoverallperformance. Such a statement provides insights into the financial andinvestingoperationsofabusiness.Itthrowslightonthefinancialstrategyofafirmandguidesfinancialexpertsintheinterpretationandpredictionsofthesame.TheNationalAssociationofAccountants,1971 intheirbulletinlistthefollowingusesofthisstatement: • estimatingtheamountoffundsneededforthegrowth; • improving rate of income on assets; • planningtemporaryinvestmentsofsurplusfundsandplanningforthe
workingcapital; • securingadditionalfundswhenneeded;and • planningthepaymentofdividends.Further,aneffectivefundsflowanalysiscanofferthefollowingbenefitstoabusinessfirm: • It helps themanagement in operating and investment decisionsby
providingacompletepictureofsourcesandapplicationsoffunds. • Itguidesexpertsintheformulationoffuturefinancialpoliciesasit
disclosesthefinancialdeficienciesofaspecifiedperiod. • Itcanmakepossibletheefficientandeconomicalutilizationoffuture
financialresources. • Itprovidesadditionalandsignificantdatafordecisionmakingwhich
isnotpresentedbyhistoricalstatements. • Ithighlightstherelationshipbetweentheworkingcapitalandthenet
income. • Itevaluatespastfinancialperformancebydisclosingthemeansand
uses of resources. • Itprovesameaningfultechniqueforeconomicanalysis.
Limitations of Funds Flow Statement
Despiteitsnumberofuses,thefundsflowstatementsuffersfromnumberoflimitationswhicharelistedbelow: • It fails to cover as sufficient information as disclosed by income
statementorbalancesheetandassuchcannotreplacesuchstatements. • It is of secondary nature as it is preparedwith the information as
suppliedbyfinancialstatements. •The statement ignores the changes inworking capital items, and
therefore,failstothrowlightonthefinancialpositionoftheconcern.
Funds Flow Statement
NOTES
Self-Instructional 92 Material
•As this statement is simply re-arrangement of data as supplied byfinancialstatement,theaccuracyofthestatementisdoubtful.
• Itisacrudedevicecomparedtofinancialstatementbecauseitdoesnottouchnon-funditems.
• Itfailstorevealcontinuouschanges.
Check Your Progress
1.What is thecategoryunderwhich trademarksandcopyrightarefound?
2.Why is fundsflow statement called a crudedevice compared tofinancialstatement?
4.3 PREPARATION OF FUNDS FLOW STATEMENT
Thepreparationof fundsflowstatement involvesdecisions regarding thefollowingtwoimportantfacts: • sources of information; and • proceduralframework.
Sources of Information
Forthepreparationoffundsflowstatement,thefollowinginformationshouldbeavailable: •Twocomparativebalancesheets—oneatthebeginningandtheother
attheendoftheperiod. •Summarized income statement comprising non-fund* and non-
operating**itemsrequiredforcomputingfundsfromoperation(Referpage259).
•Statementofretainedearningstoidentifyhiddeninformation. •Supplementary information regarding change in the non-current
accountslikeplantandmachinery,building,sharecapital,debentures,etc.
This is theminimum information required for the purpose.Anyinformation,inadditiontothatmentionedaboveshallmakethefundsflowanalysismoreeffective.
*Non-funditemsarethetransactionsthatmaycausechange(increaseordecrease)inthereportednetprofitbutdonotactuallychangetheamountoffund(workingcapital).Thebestexampleofsuchanitemcanbedepreciationonfixedassets.
**Non-operatingitemsrefertotransactionsincidentaltothebusiness.Forexample,saleoffixedassets,profitsfromsaleofassets,etc.
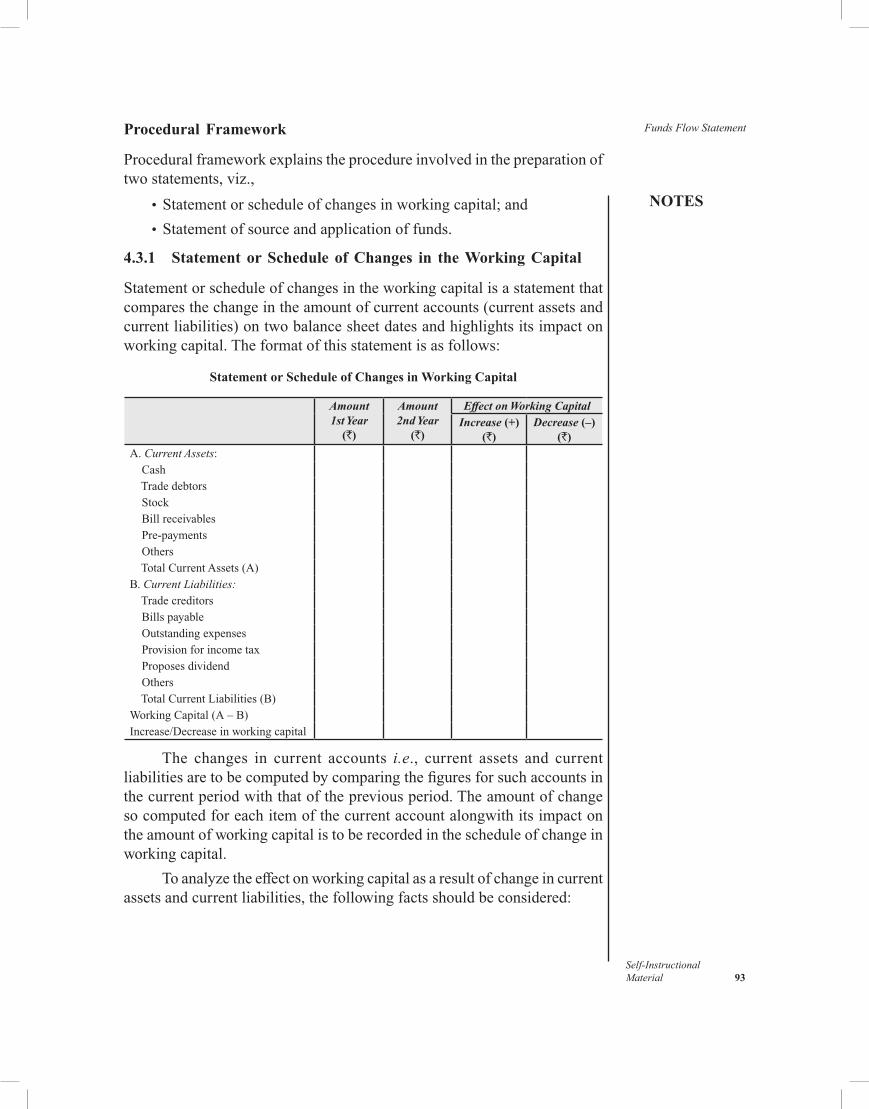
NOTES
Self-InstructionalMaterial 93
Funds Flow StatementProcedural Framework
Proceduralframeworkexplainstheprocedureinvolvedinthepreparationoftwostatements,viz., •Statementorscheduleofchangesinworkingcapital;and •Statementofsourceandapplicationoffunds.
4.3.1 Statement or Schedule of Changes in the Working Capital
Statementorscheduleofchangesintheworkingcapitalisastatementthatcomparesthechangeintheamountofcurrentaccounts(currentassetsandcurrentliabilities)ontwobalancesheetdatesandhighlightsitsimpactonworkingcapital.Theformatofthisstatementisasfollows:
Statement or Schedule of Changes in Working Capital
Amount1st Year
(`)
Amount2nd Year
(`)
Effect on Working Capital
Increase (+)(`)
Decrease (–)(`)
A.Current Assets: Cash Tradedebtors Stock Billreceivables Pre-payments Others TotalCurrentAssets(A)B.Current Liabilities:
Tradecreditors Billspayable Outstandingexpenses Provisionforincometax Proposesdividend Others TotalCurrentLiabilities(B)WorkingCapital(A–B)Increase/Decreaseinworkingcapital
The changes in current accounts i.e., current assets and currentliabilitiesaretobecomputedbycomparingthefiguresforsuchaccountsinthecurrentperiodwiththatofthepreviousperiod.Theamountofchangesocomputedforeachitemofthecurrentaccountalongwithitsimpactontheamountofworkingcapitalistoberecordedinthescheduleofchangeinworkingcapital.
Toanalyzetheeffectonworkingcapitalasaresultofchangeincurrentassetsandcurrentliabilities,thefollowingfactsshouldbeconsidered:
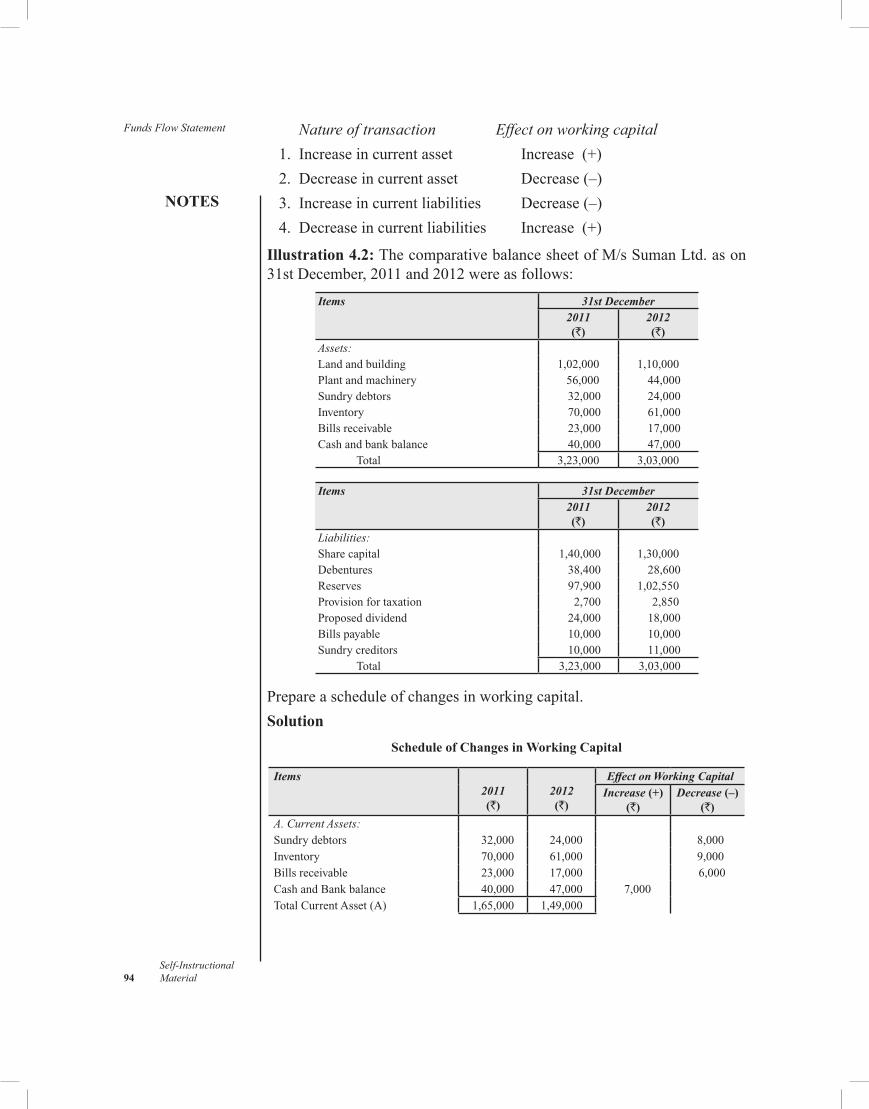
Funds Flow Statement
NOTES
Self-Instructional 94 Material
Nature of transaction Effect on working capital 1. Increaseincurrentasset Increase(+) 2. Decreaseincurrentasset Decrease(–) 3. Increaseincurrentliabilities Decrease(–) 4. Decreaseincurrentliabilities Increase(+)
Illustration 4.2:ThecomparativebalancesheetofM/sSumanLtd.ason31stDecember,2011and2012wereasfollows:
Items 31st December2011(`)
2012(`)
Assets:Landandbuilding 1,02,000 1,10,000Plantandmachinery 56,000 44,000Sundrydebtors 32,000 24,000Inventory 70,000 61,000Billsreceivable 23,000 17,000Cashandbankbalance 40,000 47,000
Total 3,23,000 3,03,000
Items 31st December2011(`)
2012(`)
Liabilities:Sharecapital 1,40,000 1,30,000Debentures 38,400 28,600Reserves 97,900 1,02,550Provisionfortaxation 2,700 2,850Proposeddividend 24,000 18,000Billspayable 10,000 10,000Sundrycreditors 10,000 11,000
Total 3,23,000 3,03,000
Prepareascheduleofchangesinworkingcapital.Solution
Schedule of Changes in Working Capital
Items2011(`)
2012(`)
Effect on Working Capital
Increase (+)(`)
Decrease (–)(`)
A. Current Assets:
Sundrydebtors 32,000 24,000 8,000Inventory 70,000 61,000 9,000Billsreceivable 23,000 17,000 6,000CashandBankbalance 40,000 47,000 7,000TotalCurrentAsset(A) 1,65,000 1,49,000
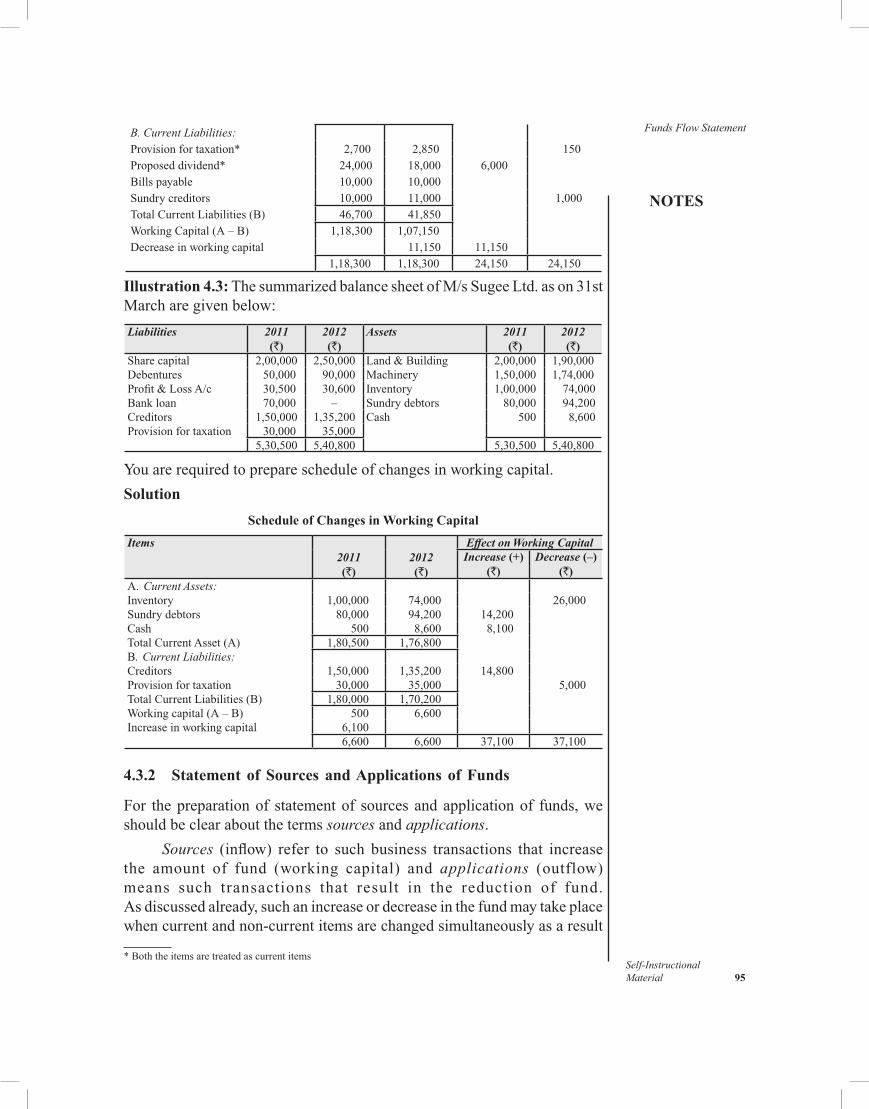
NOTES
Self-InstructionalMaterial 95
Funds Flow Statement
*Boththeitemsaretreatedascurrentitems
B. Current Liabilities:
Provisionfortaxation* 2,700 2,850 150Proposeddividend* 24,000 18,000 6,000Billspayable 10,000 10,000Sundrycreditors 10,000 11,000 1,000TotalCurrentLiabilities(B) 46,700 41,850WorkingCapital(A–B) 1,18,300 1,07,150Decreaseinworkingcapital 11,150 11,150
1,18,300 1,18,300 24,150 24,150
Illustration 4.3:ThesummarizedbalancesheetofM/sSugeeLtd.ason31stMarcharegivenbelow:Liabilities 2011
(`)2012(`)
Assets 2011(`)
2012(`)
Sharecapital 2,00,000 2,50,000 Land&Building 2,00,000 1,90,000Debentures 50,000 90,000 Machinery 1,50,000 1,74,000Profit&LossA/c 30,500 30,600 Inventory 1,00,000 74,000Bankloan 70,000 – Sundrydebtors 80,000 94,200Creditors 1,50,000 1,35,200 Cash 500 8,600Provisionfortaxation 30,000 35,000
5,30,500 5,40,800 5,30,500 5,40,800
Youarerequiredtopreparescheduleofchangesinworkingcapital.
SolutionSchedule of Changes in Working Capital
Items2011(`)
2012(`)
Effect on Working CapitalIncrease (+)
(`)Decrease (–)
(`)A. Current Assets:Inventory 1,00,000 74,000 26,000Sundrydebtors 80,000 94,200 14,200Cash 500 8,600 8,100TotalCurrentAsset(A) 1,80,500 1,76,800B.Current Liabilities:Creditors 1,50,000 1,35,200 14,800Provisionfortaxation 30,000 35,000 5,000TotalCurrentLiabilities(B) 1,80,000 1,70,200Workingcapital(A–B) 500 6,600Increaseinworkingcapital 6,100
6,600 6,600 37,100 37,100
4.3.2 Statement of Sources and Applications of Funds
For thepreparationof statementof sourcesandapplicationof funds,weshouldbeclearaboutthetermssources and applications.
Sources (inflow) refer to such business transactions that increasethe amount of fund (working capital) and applications (outflow)means such transactions that result in the reduction of fund.Asdiscussedalready,suchanincreaseordecreaseinthefundmaytakeplacewhencurrentandnon-currentitemsarechangedsimultaneouslyasaresult
Funds Flow Statement
NOTES
Self-Instructional 96 Material
ofatransaction.The increase inthefund(source)isrecordedasacredit andthedecrease inthefund(application)isrecordedasadebit.Therefore,creditsrepresentsourcesoffundanddebitsrepresentapplicationoffund.Forbetterunderstandingoftheconceptoffund,importantsourcesandusesoffundsaresummarizedbelow:
Sources of Funds •Operationalprofitsorfundsfromoperation; • Issueofsharecapitalordebentures; •Saleoffixedassetsandlong-terminvestments(actualamountrealized); • Incomefrominvestments(dividendreceived);and •Long-termloans.
Applications of Funds
•Repaymentofcapital(includingredemptionofpreferentialshares); •Redemptionofdebentures; •Paymentoflong-termloans; •Purchaseofinvestments; •Purchaseoffixedassets; •Paymentoftaxation/proposeddividend*;and •Operationalloss
Thus,fromtheabovediscussion,wemayconcludethat:
• Increaseinnon-currentassets=Applicationsoffunds •Decreaseinnon-currentassets=Sourcesoffunds • Increaseinnon-currentliabilities=Sourcesoffunds •Decreaseinnon-currentliabilities=Applicationsoffunds
Thedual-aspect concept of accounting suggests that the total amount ofsourcesof fundsmust reconcilewith the total amountof applicationsoffunds.Thisprincipalissimilartothatofthebalancesheetprincipalwheretotalassetsareequaltototalliabilities.Therefore,
•Sourcesoffunds=Applicationsoffunds • Increaseinliabilities+Decreaseinassets=Decreaseinliabilities+
Increase in assets.
Format of Funds Flow Statement
Differentformatsareusedforthispurposedependingupontheobjectiveofanalysis.However,thecommonlyusedformatis‘accountform’(asgiven*Iftreatedasnon-currentitems
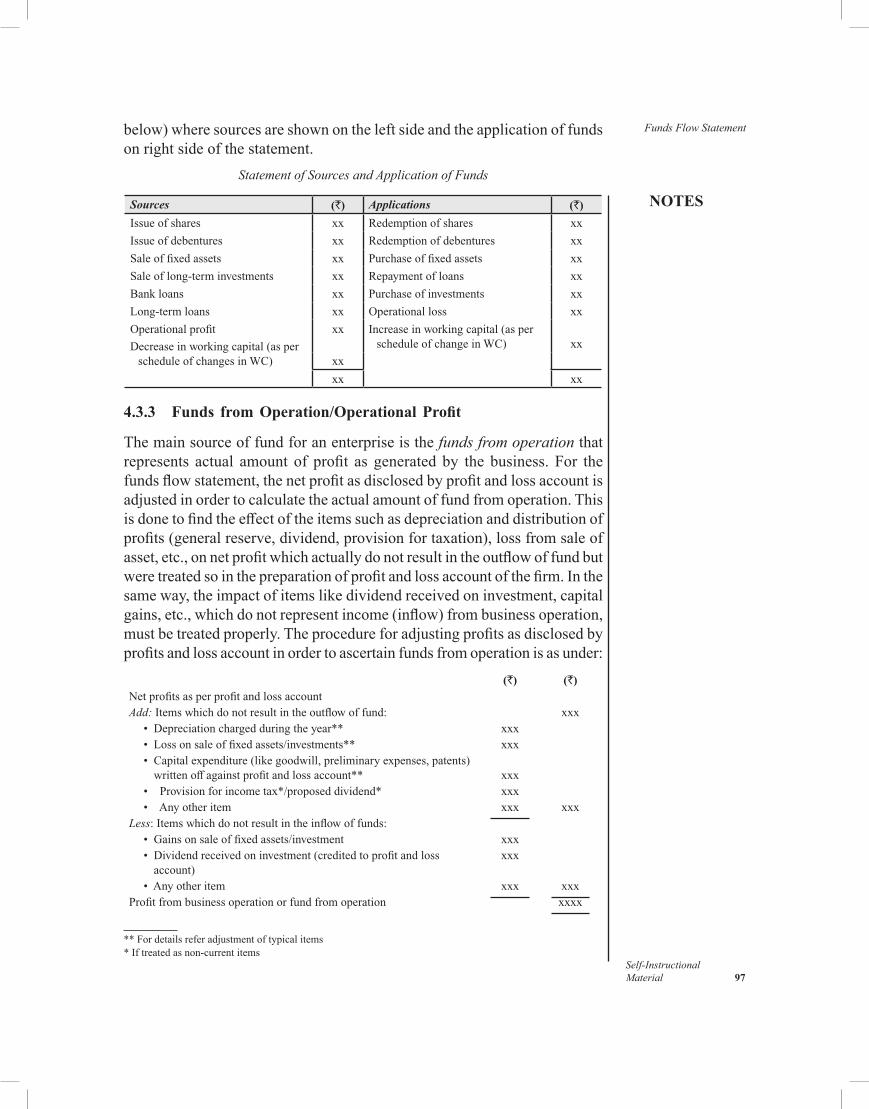
NOTES
Self-InstructionalMaterial 97
Funds Flow Statement
**Fordetailsreferadjustmentoftypicalitems*Iftreatedasnon-currentitems
below)wheresourcesareshownontheleftsideandtheapplicationoffundsonrightsideofthestatement.
Statement of Sources and Application of Funds
Sources (`) Applications (`)
Issueofshares xx Redemptionofshares xx
Issueofdebentures xx Redemptionofdebentures xx
Saleoffixedassets xx Purchaseoffixedassets xx
Saleoflong-terminvestments xx Repaymentofloans xx
Bankloans xx Purchaseofinvestments xx
Long-termloans xx Operationalloss xx
Operationalprofit
Decreaseinworkingcapital(asperscheduleofchangesinWC)
xx
xx
Increaseinworkingcapital(asperscheduleofchangeinWC)
xx
xx xx
4.3.3 Funds from Operation/Operational Profit
Themainsourceoffundforanenterpriseisthefunds from operation thatrepresents actual amount of profit as generatedby the business. For thefundsflowstatement,thenetprofitasdisclosedbyprofitandlossaccountisadjustedinordertocalculatetheactualamountoffundfromoperation.Thisisdonetofindtheeffectoftheitemssuchasdepreciationanddistributionofprofits(generalreserve,dividend,provisionfortaxation),lossfromsaleofasset,etc.,onnetprofitwhichactuallydonotresultintheoutflowoffundbutweretreatedsointhepreparationofprofitandlossaccountofthefirm.Inthesameway,theimpactofitemslikedividendreceivedoninvestment,capitalgains,etc.,whichdonotrepresentincome(inflow)frombusinessoperation,mustbetreatedproperly.Theprocedureforadjustingprofitsasdisclosedbyprofitsandlossaccountinordertoascertainfundsfromoperationisasunder:
(`) (`)NetprofitsasperprofitandlossaccountAdd: Itemswhichdonotresultintheoutflowoffund: xxx • Depreciationchargedduringtheyear** xxx • Lossonsaleoffixedassets/investments** xxx • Capitalexpenditure(likegoodwill,preliminaryexpenses,patents)
writtenoffagainstprofitandlossaccount**
xxx • Provisionforincometax*/proposeddividend* xxx • Anyotheritem xxx xxxLess:Itemswhichdonotresultintheinflowoffunds: • Gainsonsaleoffixedassets/investment xxx • Dividendreceivedoninvestment(creditedtoprofitandloss
account)xxx
• Anyotheritem xxx xxxProfitfrombusinessoperationorfundfromoperation xxxx
Funds Flow Statement
NOTES
Self-Instructional 98 Material
4.3.4 Adjustment of Typical Items
Beforeattemptingapracticalproblem,wemustbefamiliarwiththetreatmentofsometypicaltransactions.Accordingly,thediscussionthatfollowsdealswithadjustmentprocedureoftypicaltransactionsinfundflowanalysis. • Provision for Taxation: Therearetwoapproachestoadjusttheitem
ofprovisionfortaxation,viz.,• As a current item: Underthisapproach,theitemofprovisionfor
taxationistreatedascurrentliabilityandaccordinglyitisadjustedinthescheduleofchangesintheworkingcapital.However,whileattemptingapracticalproblemonfundflowanalysis,theitemoftax(ifany)givenoutsidethetrialbalanceshouldbeomittedunderthisapproach.Thelogicbehindtheomissionisthatsuchanadjustmentitem(actualpaymentoftax)willaffecttwocurrentaccounts,i.e.,cashandprovisionfortaxation.Therefore,thetransactionwillnotresultintheflowoffund(application).
• As a non-current item: Underthisapproach,itisconsideredasanappropriationofprofitsandthusanon-currentliability.Accordingly,theamountofcurrentprovisionfortaxationistobeadjustedinthefundsfromoperationandtheactualpaymentoftaxappearsinthefundsflowstatementasanapplication.
Note: Studentsmaynotethatitisdesirabletotreattheitemofprovisionfortaxationascurrentliabilityasgenerallyitistheimmediateobligationoftheconcerntopaytaxtothegovernment.Assuch,itseemssomewhatirrationaltotreatprovisionoftaxasanappropriationofprofit.
• Proposed Dividend:Ithasthesametreatmentasthatofprovisionfortaxation.
• Interim Dividend: It is the dividendpaid in between twobalancesheetdates.Itisanon-operatingitemandassuchisadjustedinthecalculationofprofitsfromoperation.
• Depreciation: Thedepreciationisanon-funditemthatdoesnotresultin theflowofcash. It involvessimplyabookentrywithoutactualpaymentofcash.Thisentryinthebookaccountwhichdebitsprofitandlossaccountandcreditsthefixedassetaccount,reducestheamountofprofitandthebookvalueofthefixedassets.Assuch,depreciationdoesnotaffecttheamountoffund(workingcapital).Thus,theamountofdepreciationisadjustedinthecomputationofprofitsfromoperation.
• Preliminary Expenses: Preliminary expenses like depreciation isanon-fund itemwhichsimply involvesabookentry.Everyyearaportionofsuchexpensesiswrittenoffbydebitingthemtoprofitandlossaccount.However,thistreatmenttopreliminaryexpensesneitherresultsintheflowoffundnoritisconsideredasanoperatingcharge.Thus,theamountofpreliminaryexpenseswrittenoffduringthecurrent
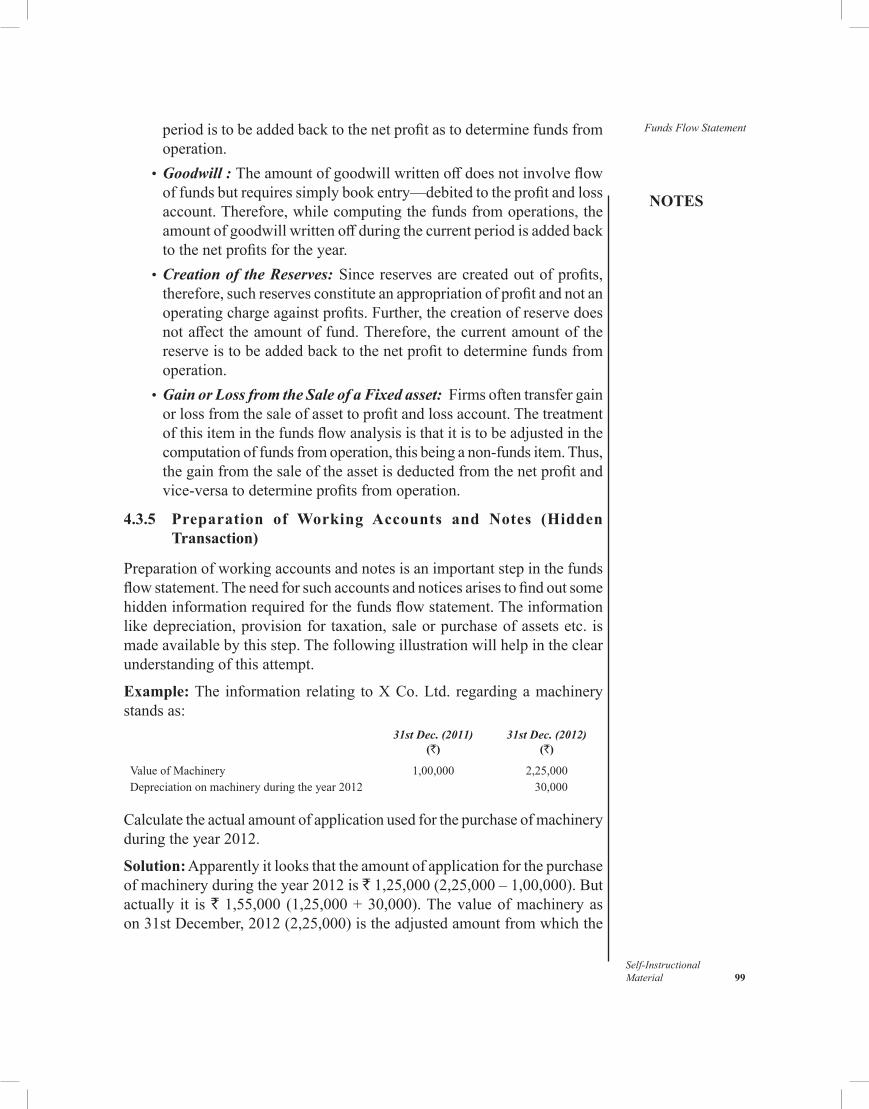
NOTES
Self-InstructionalMaterial 99
Funds Flow Statementperiodistobeaddedbacktothenetprofitastodeterminefundsfromoperation.
• Goodwill : Theamountofgoodwillwrittenoffdoesnotinvolveflowoffundsbutrequiressimplybookentry—debitedtotheprofitandlossaccount.Therefore,whilecomputingthefundsfromoperations,theamountofgoodwillwrittenoffduringthecurrentperiodisaddedbacktothenetprofitsfortheyear.
• Creation of the Reserves: Sincereservesarecreatedoutofprofits,therefore,suchreservesconstituteanappropriationofprofitandnotanoperatingchargeagainstprofits.Further,thecreationofreservedoesnotaffecttheamountoffund.Therefore,thecurrentamountofthereserveistobeaddedbacktothenetprofittodeterminefundsfromoperation.
• Gain or Loss from the Sale of a Fixed asset: Firmsoftentransfergainorlossfromthesaleofassettoprofitandlossaccount.Thetreatmentofthisiteminthefundsflowanalysisisthatitistobeadjustedinthecomputationoffundsfromoperation,thisbeinganon-fundsitem.Thus,thegainfromthesaleoftheassetisdeductedfromthenetprofitandvice-versatodetermineprofitsfromoperation.
4.3.5 Preparation of Working Accounts and Notes (Hidden Transaction)
Preparationofworkingaccountsandnotesisanimportantstepinthefundsflowstatement.Theneedforsuchaccountsandnoticesarisestofindoutsomehiddeninformationrequiredforthefundsflowstatement.Theinformationlikedepreciation,provisionfor taxation,saleorpurchaseofassetsetc. ismadeavailablebythisstep.Thefollowingillustrationwillhelpintheclearunderstandingofthisattempt.
Example:The information relating toXCo.Ltd. regardingamachinerystands as:
31st Dec. (2011)(`)
31st Dec. (2012)(`)
ValueofMachinery 1,00,000 2,25,000Depreciationonmachineryduringtheyear2012 30,000
Calculatetheactualamountofapplicationusedforthepurchaseofmachineryduringtheyear2012.
Solution:Apparentlyitlooksthattheamountofapplicationforthepurchaseofmachineryduringtheyear2012is`1,25,000(2,25,000–1,00,000).Butactually it is`1,55,000 (1,25,000+30,000).Thevalueofmachineryason31stDecember,2012(2,25,000)istheadjustedamountfromwhichthe
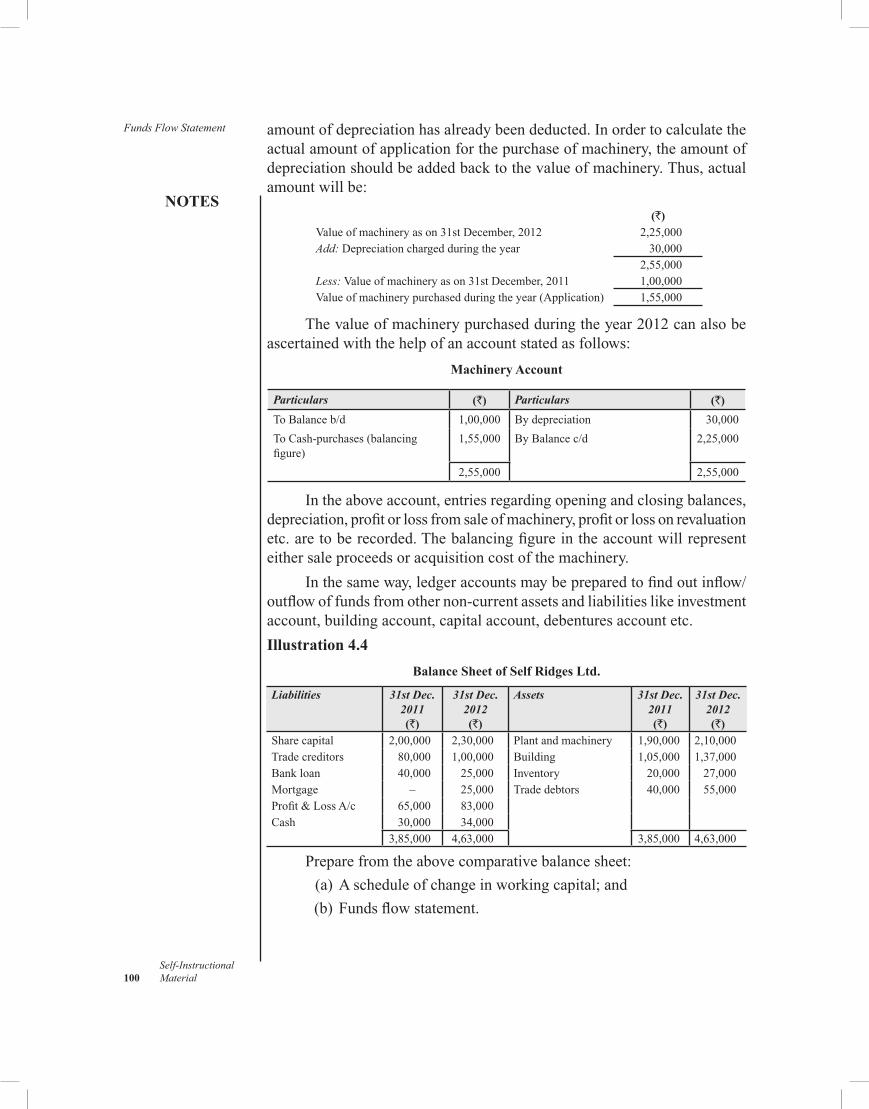
Funds Flow Statement
NOTES
Self-Instructional 100 Material
amountofdepreciationhasalreadybeendeducted.Inordertocalculatetheactualamountofapplicationforthepurchaseofmachinery,theamountofdepreciationshouldbeaddedbacktothevalueofmachinery.Thus,actualamountwillbe:
(`)Valueofmachineryason31stDecember,2012 2,25,000Add:Depreciationchargedduringtheyear 30,000
2,55,000Less:Valueofmachineryason31stDecember,2011 1,00,000Valueofmachinerypurchasedduringtheyear(Application) 1,55,000
Thevalueofmachinerypurchasedduringtheyear2012canalsobeascertainedwiththehelpofanaccountstatedasfollows:
Machinery Account
Particulars (`) Particulars (`)
ToBalanceb/d 1,00,000 Bydepreciation 30,000
ToCash-purchases(balancingfigure)
1,55,000 ByBalancec/d 2,25,000
2,55,000 2,55,000
Intheaboveaccount,entriesregardingopeningandclosingbalances,depreciation,profitorlossfromsaleofmachinery,profitorlossonrevaluationetc.aretoberecorded.Thebalancingfigureintheaccountwillrepresenteithersaleproceedsoracquisitioncostofthemachinery.
Inthesameway,ledgeraccountsmaybepreparedtofindoutinflow/outflowoffundsfromothernon-currentassetsandliabilitieslikeinvestmentaccount,buildingaccount,capitalaccount,debenturesaccountetc.
Illustration 4.4Balance Sheet of Self Ridges Ltd.
Liabilities 31st Dec.2011(`)
31st Dec.2012(`)
Assets 31st Dec.2011(`)
31st Dec.2012(`)
Sharecapital 2,00,000 2,30,000 Plantandmachinery 1,90,000 2,10,000Tradecreditors 80,000 1,00,000 Building 1,05,000 1,37,000Bankloan 40,000 25,000 Inventory 20,000 27,000Mortgage – 25,000 Tradedebtors 40,000 55,000Profit&LossA/c 65,000 83,000Cash 30,000 34,000
3,85,000 4,63,000 3,85,000 4,63,000
Preparefromtheabovecomparativebalancesheet: (a)Ascheduleofchangeinworkingcapital;and (b)Fundsflowstatement.
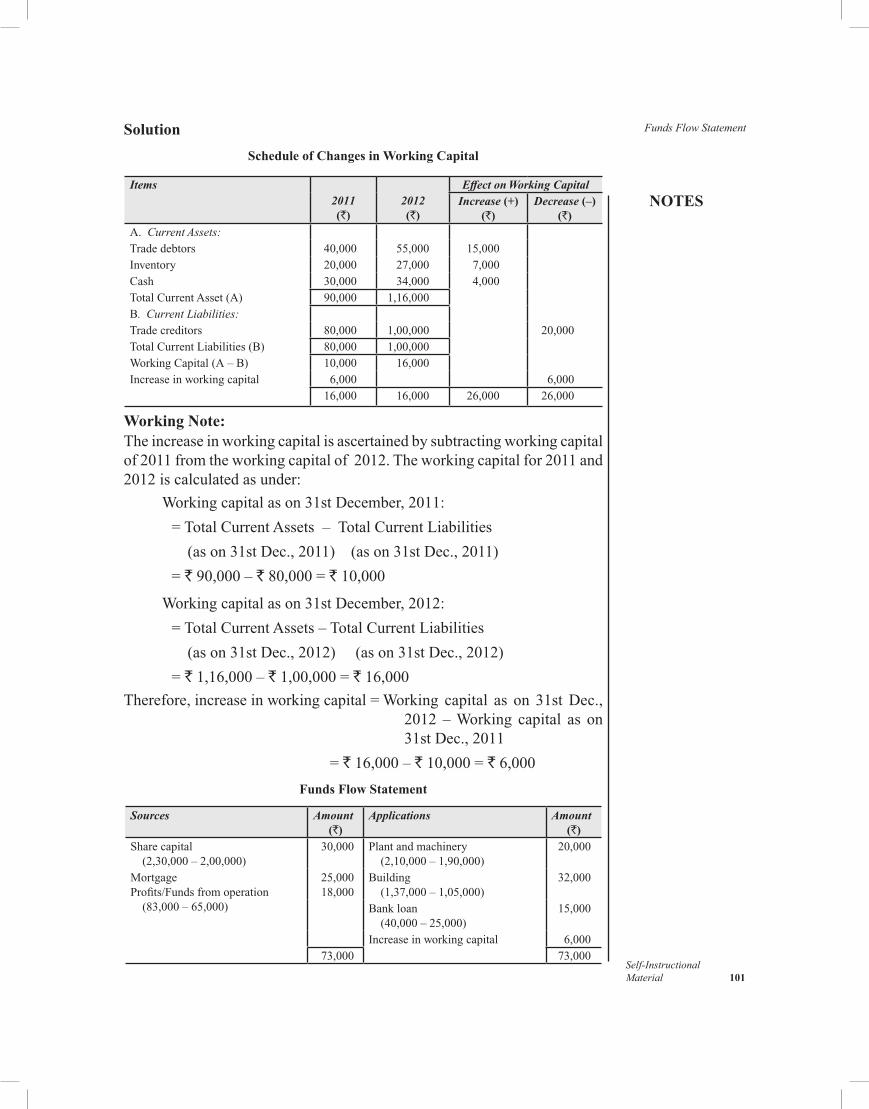
NOTES
Self-InstructionalMaterial 101
Funds Flow StatementSolutionSchedule of Changes in Working Capital
Items2011(`)
2012(`)
Effect on Working Capital
Increase (+)(`)
Decrease (–)(`)
A. Current Assets:
Tradedebtors 40,000 55,000 15,000Inventory 20,000 27,000 7,000Cash 30,000 34,000 4,000TotalCurrentAsset(A) 90,000 1,16,000B. Current Liabilities:
Tradecreditors 80,000 1,00,000 20,000TotalCurrentLiabilities(B) 80,000 1,00,000WorkingCapital(A–B) 10,000 16,000Increaseinworkingcapital 6,000 6,000
16,000 16,000 26,000 26,000
Working Note:Theincreaseinworkingcapitalisascertainedbysubtractingworkingcapitalof2011fromtheworkingcapitalof 2012.Theworkingcapitalfor2011 and 2012iscalculatedasunder:
Workingcapitalason31stDecember,2011:
=TotalCurrentAssets – TotalCurrentLiabilities (ason31stDec.,2011) (ason31stDec.,2011) = `90,000–`80,000=`10,000
Workingcapitalason31stDecember,2012:
=TotalCurrentAssets–TotalCurrentLiabilities (ason31stDec.,2012) (ason31stDec.,2012) = `1,16,000–`1,00,000=`16,000Therefore,increaseinworkingcapital=Working capital as on 31stDec.,
2012 –Working capital as on31stDec.,2011
= `16,000–`10,000=`6,000Funds Flow Statement
Sources Amount(`)
Applications Amount(`)
Sharecapital (2,30,000–2,00,000)
30,000 Plantandmachinery (2,10,000–1,90,000)
20,000
MortgageProfits/Fundsfromoperation (83,000–65,000)
25,00018,000
Building (1,37,000–1,05,000)
32,000
Bankloan (40,000–25,000)
15,000
Increaseinworkingcapital 6,00073,000 73,000
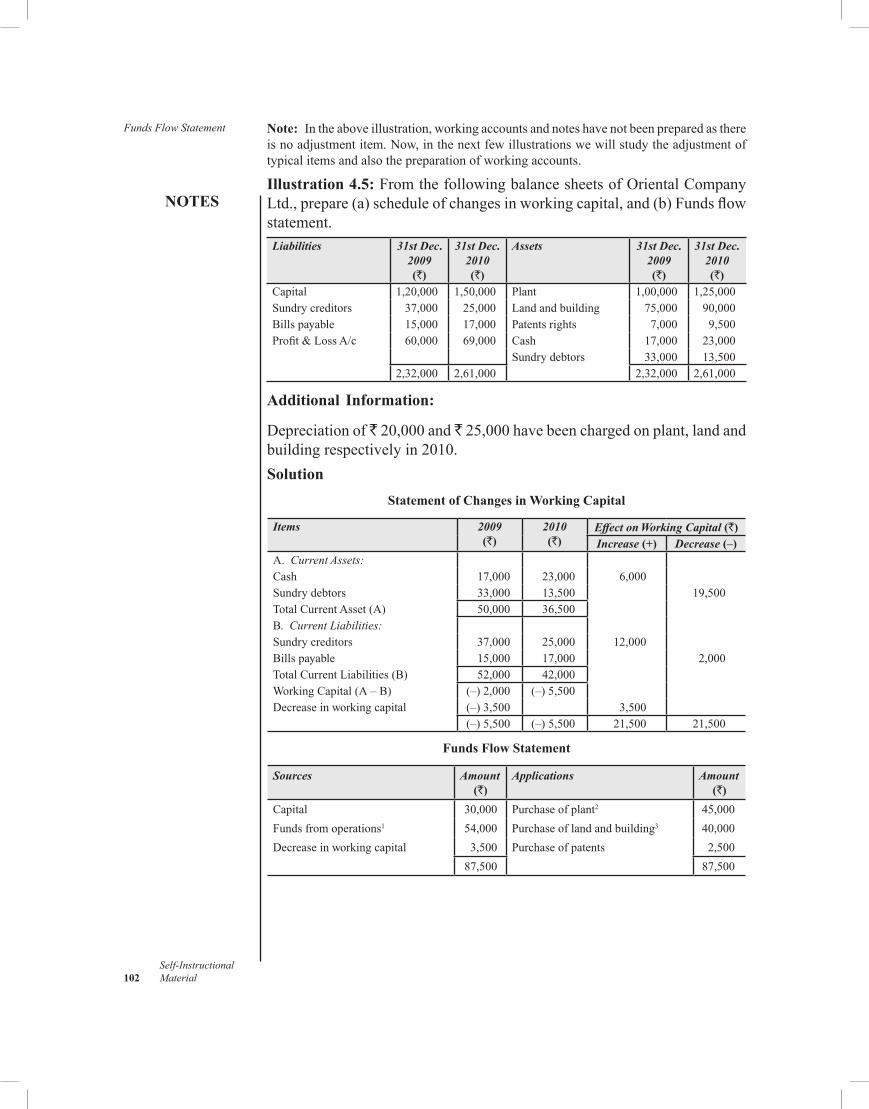
Funds Flow Statement
NOTES
Self-Instructional 102 Material
Note: Intheaboveillustration,workingaccountsandnoteshavenotbeenpreparedasthereisnoadjustmentitem.Now,inthenextfewillustrationswewillstudytheadjustmentoftypicalitemsandalsothepreparationofworkingaccounts.
Illustration 4.5:FromthefollowingbalancesheetsofOrientalCompanyLtd.,prepare(a)scheduleofchangesinworkingcapital,and(b)Fundsflowstatement.Liabilities 31st Dec.
2009(`)
31st Dec.2010(`)
Assets 31st Dec.2009(`)
31st Dec.2010(`)
Capital 1,20,000 1,50,000 Plant 1,00,000 1,25,000Sundrycreditors 37,000 25,000 Landandbuilding 75,000 90,000Billspayable 15,000 17,000 Patentsrights 7,000 9,500Profit&LossA/c 60,000 69,000 Cash 17,000 23,000
Sundrydebtors 33,000 13,5002,32,000 2,61,000 2,32,000 2,61,000
Additional Information:
Depreciation of 20,000and 25,000havebeenchargedonplant,landandbuildingrespectivelyin2010.Solution
Statement of Changes in Working Capital
Items 2009(`)
2010(`)
Effect on Working Capital (`)Increase (+) Decrease (–)
A. Current Assets:
Cash 17,000 23,000 6,000Sundrydebtors 33,000 13,500 19,500TotalCurrentAsset(A) 50,000 36,500B. Current Liabilities:
Sundrycreditors 37,000 25,000 12,000Billspayable 15,000 17,000 2,000TotalCurrentLiabilities(B) 52,000 42,000WorkingCapital(A–B) (–)2,000 (–)5,500Decreaseinworkingcapital (–)3,500 3,500
(–)5,500 (–)5,500 21,500 21,500
Funds Flow Statement
Sources Amount(`)
Applications Amount(`)
Capital 30,000 Purchaseofplant2 45,000
Fundsfromoperations1 54,000 Purchaseoflandandbuilding3 40,000
Decreaseinworkingcapital 3,500 Purchaseofpatents 2,500
87,500 87,500
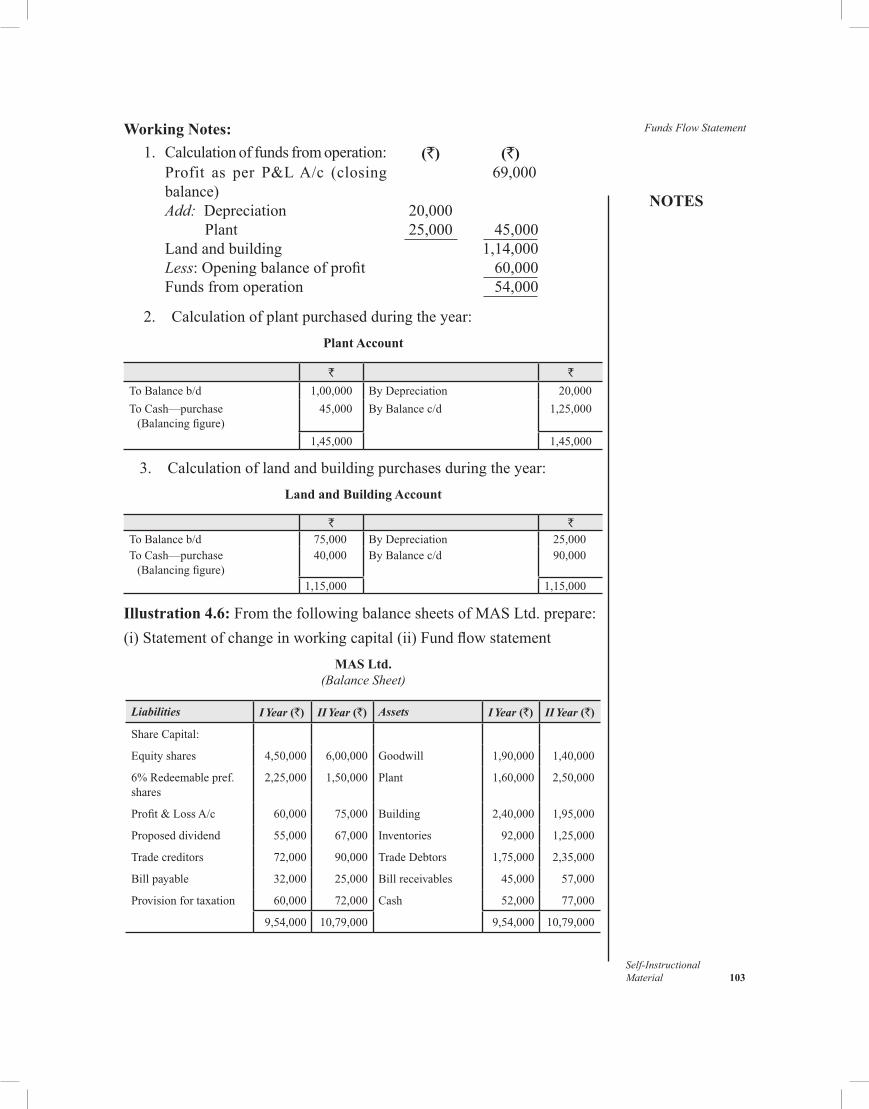
NOTES
Self-InstructionalMaterial 103
Funds Flow StatementWorking Notes: 1. Calculationoffundsfromoperation: (`) (`)
Profit as per P&LA/c (closingbalance)
69,000
Add: Depreciation 20,000 Plant 25,000 45,000Landandbuilding 1,14,000Less:Openingbalanceofprofit 60,000Fundsfromoperation 54,000
2. Calculationofplantpurchasedduringtheyear:Plant Account
` `
ToBalanceb/d 1,00,000 ByDepreciation 20,000
ToCash—purchase(Balancingfigure)
45,000 ByBalancec/d 1,25,000
1,45,000 1,45,000
3. Calculationoflandandbuildingpurchasesduringtheyear:Land and Building Account
` `ToBalanceb/d 75,000 ByDepreciation 25,000ToCash—purchase(Balancingfigure)
40,000 ByBalancec/d 90,000
1,15,000 1,15,000
Illustration 4.6: FromthefollowingbalancesheetsofMASLtd.prepare:(i)Statementofchangeinworkingcapital(ii)Fundflowstatement
MAS Ltd. (Balance Sheet)
Liabilities I Year (`) II Year (`) Assets I Year (`) II Year (`)
ShareCapital:
Equityshares 4,50,000 6,00,000 Goodwill 1,90,000 1,40,000
6%Redeemablepref.shares
2,25,000 1,50,000 Plant 1,60,000 2,50,000
Profit&LossA/c 60,000 75,000 Building 2,40,000 1,95,000
Proposeddividend 55,000 67,000 Inventories 92,000 1,25,000
Tradecreditors 72,000 90,000 TradeDebtors 1,75,000 2,35,000
Billpayable 32,000 25,000 Billreceivables 45,000 57,000
Provisionfortaxation 60,000 72,000 Cash 52,000 77,000
9,54,000 10,79,000 9,54,000 10,79,000
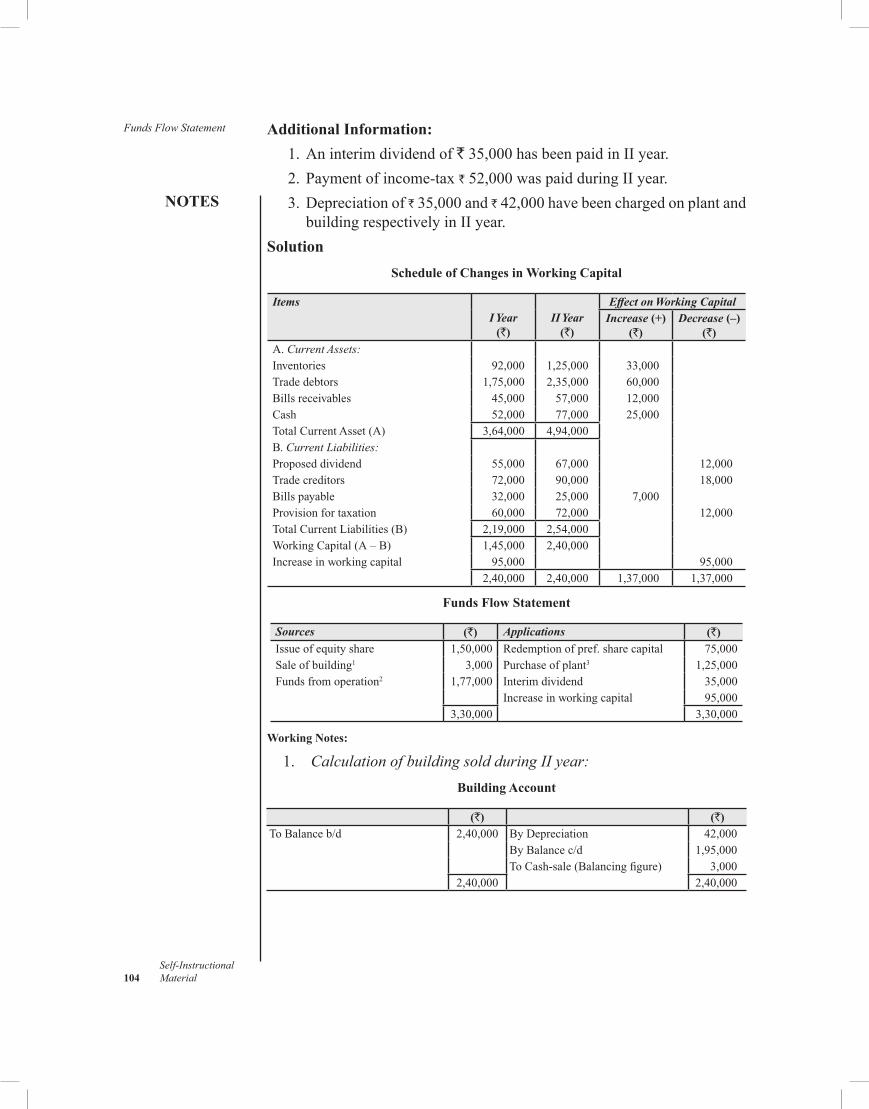
Funds Flow Statement
NOTES
Self-Instructional 104 Material
Additional Information: 1. An interim dividend of `35,000hasbeenpaidinIIyear. 2.Paymentofincome-tax`52,000waspaidduringIIyear. 3. Depreciation of 35,000and 42,000havebeenchargedonplantand
buildingrespectivelyinIIyear.Solution
Schedule of Changes in Working Capital
ItemsI Year
(`)II Year
(`)
Effect on Working Capital
Increase (+)(`)
Decrease (–)(`)
A.Current Assets:
Inventories 92,000 1,25,000 33,000Tradedebtors 1,75,000 2,35,000 60,000Billsreceivables 45,000 57,000 12,000Cash 52,000 77,000 25,000TotalCurrentAsset(A) 3,64,000 4,94,000B.Current Liabilities:
Proposeddividend 55,000 67,000 12,000Tradecreditors 72,000 90,000 18,000Billspayable 32,000 25,000 7,000Provisionfortaxation 60,000 72,000 12,000TotalCurrentLiabilities(B) 2,19,000 2,54,000WorkingCapital(A–B) 1,45,000 2,40,000Increaseinworkingcapital 95,000 95,000
2,40,000 2,40,000 1,37,000 1,37,000
Funds Flow Statement
Sources (`) Applications (`)Issueofequityshare 1,50,000 Redemptionofpref.sharecapital 75,000Saleofbuilding1 3,000 Purchaseofplant3 1,25,000Fundsfromoperation2 1,77,000 Interimdividend 35,000
Increaseinworkingcapital 95,0003,30,000 3,30,000
Working Notes:
1. Calculation of building sold during II year:Building Account
(`) (`)ToBalanceb/d 2,40,000 ByDepreciation 42,000
ByBalancec/d 1,95,000ToCash-sale(Balancingfigure) 3,000
2,40,000 2,40,000
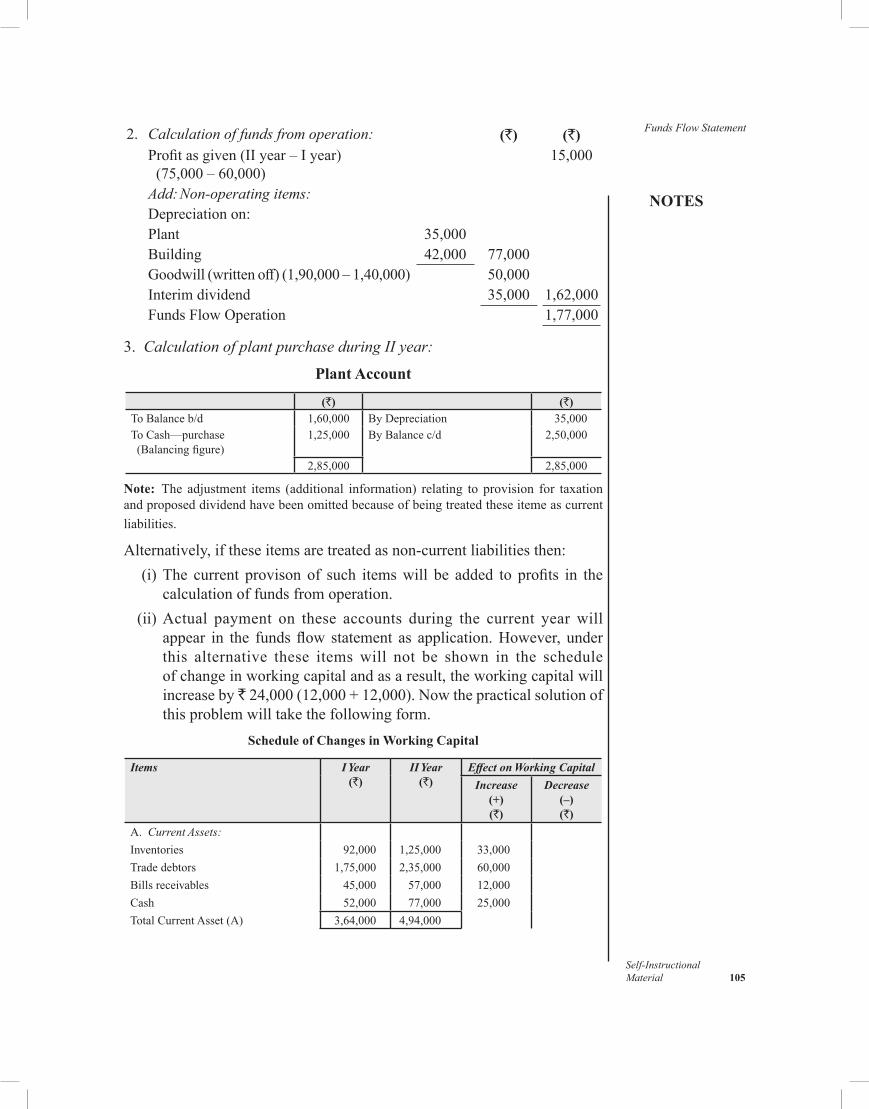
NOTES
Self-InstructionalMaterial 105
Funds Flow Statement2. Calculation of funds from operation: (`) (`)Profitasgiven(IIyear–Iyear) (75,000–60,000)
15,000
Add: Non-operating items:Depreciation on:Plant 35,000Building 42,000 77,000Goodwill(writtenoff)(1,90,000–1,40,000) 50,000Interim dividend 35,000 1,62,000FundsFlowOperation 1,77,000
3. Calculation of plant purchase during II year:
Plant Account
(`) (`)ToBalanceb/d 1,60,000 ByDepreciation 35,000ToCash—purchase(Balancingfigure)
1,25,000 ByBalancec/d 2,50,000
2,85,000 2,85,000
Note: The adjustment items (additional information) relating to provision for taxationandproposeddividendhavebeenomittedbecauseofbeingtreatedtheseitemeascurrentliabilities.
Alternatively,iftheseitemsaretreatedasnon-currentliabilitiesthen: (i)The current provison of such itemswill be added to profits in the
calculationoffundsfromoperation. (ii)Actual payment on these accounts during the current yearwill
appear in the fundsflow statement as application.However, underthis alternative these itemswill not be shown in the schedule ofchangeinworkingcapitalandasaresult,theworkingcapitalwillincrease by `24,000(12,000+12,000).Nowthepracticalsolutionofthisproblemwilltakethefollowingform.
Schedule of Changes in Working Capital
Items I Year (`)
II Year (`)
Effect on Working Capital
Increase (+)(`)
Decrease (–)(`)
A. Current Assets:
Inventories 92,000 1,25,000 33,000
Tradedebtors 1,75,000 2,35,000 60,000
Billsreceivables 45,000 57,000 12,000
Cash 52,000 77,000 25,000
TotalCurrentAsset(A) 3,64,000 4,94,000
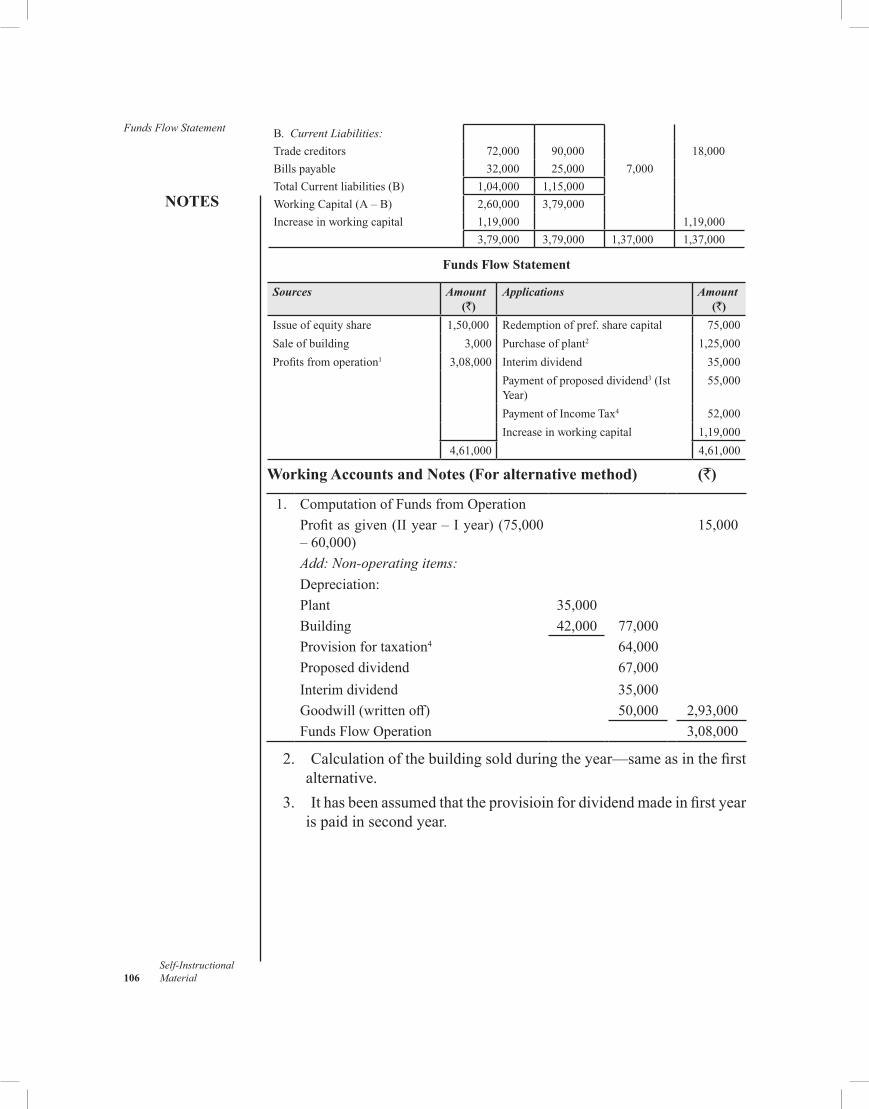
Funds Flow Statement
NOTES
Self-Instructional 106 Material
B. Current Liabilities:
Tradecreditors 72,000 90,000 18,000
Billspayable 32,000 25,000 7,000
TotalCurrentliabilities(B) 1,04,000 1,15,000
WorkingCapital(A–B) 2,60,000 3,79,000
Increaseinworkingcapital 1,19,000 1,19,000
3,79,000 3,79,000 1,37,000 1,37,000
Funds Flow Statement
Sources Amount(`)
Applications Amount(`)
Issueofequityshare 1,50,000 Redemptionofpref.sharecapital 75,000
Saleofbuilding 3,000 Purchaseofplant2 1,25,000
Profitsfromoperation1 3,08,000 Interimdividend 35,000
Paymentofproposeddividend3(IstYear)
55,000
PaymentofIncomeTax4 52,000
Increaseinworkingcapital 1,19,000
4,61,000 4,61,000
Working Accounts and Notes (For alternative method) (`)
1. ComputationofFundsfromOperationProfitasgiven(IIyear–Iyear)(75,000–60,000)
15,000
Add: Non-operating items:Depreciation:Plant 35,000Building 42,000 77,000Provisionfortaxation4 64,000Proposeddividend 67,000Interim dividend 35,000Goodwill(writtenoff) 50,000 2,93,000FundsFlowOperation 3,08,000
2. Calculationofthebuildingsoldduringtheyear—sameasinthefirstalternative.
3. Ithasbeenassumedthattheprovisioinfordividendmadeinfirstyearis paid in second year.
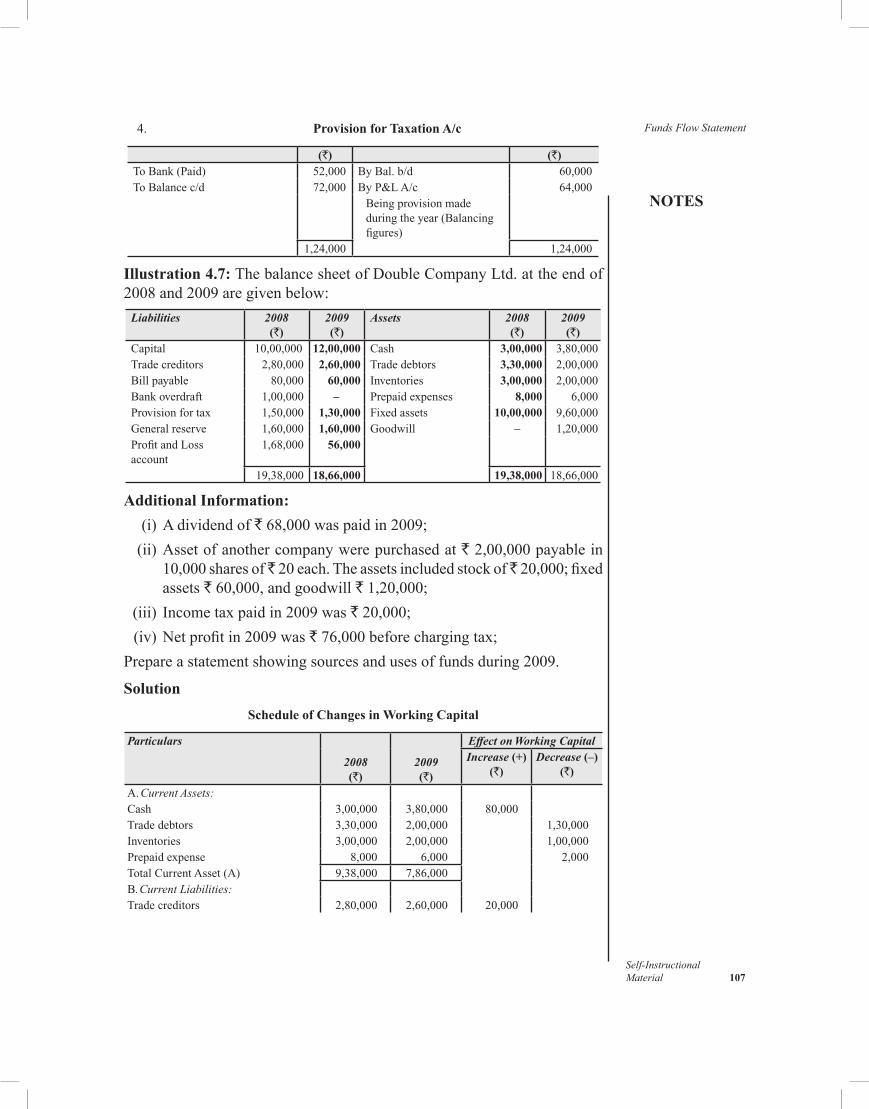
NOTES
Self-InstructionalMaterial 107
Funds Flow Statement 4. Provision for Taxation A/c
(`) (`)ToBank(Paid) 52,000 ByBal.b/d 60,000ToBalancec/d 72,000 ByP&LA/c 64,000
Beingprovisionmadeduringtheyear(Balancingfigures)
1,24,000 1,24,000
Illustration 4.7:ThebalancesheetofDoubleCompanyLtd.attheendof2008and2009aregivenbelow:
Liabilities 2008(`)
2009(`)
Assets 2008(`)
2009(`)
Capital 10,00,000 12,00,000 Cash 3,00,000 3,80,000Tradecreditors 2,80,000 2,60,000 Tradedebtors 3,30,000 2,00,000Billpayable 80,000 60,000 Inventories 3,00,000 2,00,000Bankoverdraft 1,00,000 – Prepaidexpenses 8,000 6,000Provisionfortax 1,50,000 1,30,000 Fixedassets 10,00,000 9,60,000Generalreserve 1,60,000 1,60,000 Goodwill – 1,20,000ProfitandLossaccount
1,68,000 56,000
19,38,000 18,66,000 19,38,000 18,66,000
Additional Information: (i)Adividendof`68,000waspaidin2009; (ii)Assetofanothercompanywerepurchasedat`2,00,000payablein
10,000sharesof 20each.Theassetsincludedstockof 20,000;fixedassets `60,000,andgoodwill`1,20,000;
(iii) Incometaxpaidin2009was`20,000; (iv)Netprofitin2009was`76,000beforechargingtax;Prepareastatementshowingsourcesandusesoffundsduring2009.
SolutionSchedule of Changes in Working Capital
Particulars
2008 (`)
2009 (`)
Effect on Working CapitalIncrease (+)
(`)Decrease (–)
(`)
A.Current Assets:Cash 3,00,000 3,80,000 80,000Tradedebtors 3,30,000 2,00,000 1,30,000Inventories 3,00,000 2,00,000 1,00,000Prepaidexpense 8,000 6,000 2,000TotalCurrentAsset(A) 9,38,000 7,86,000B.Current Liabilities:Tradecreditors 2,80,000 2,60,000 20,000
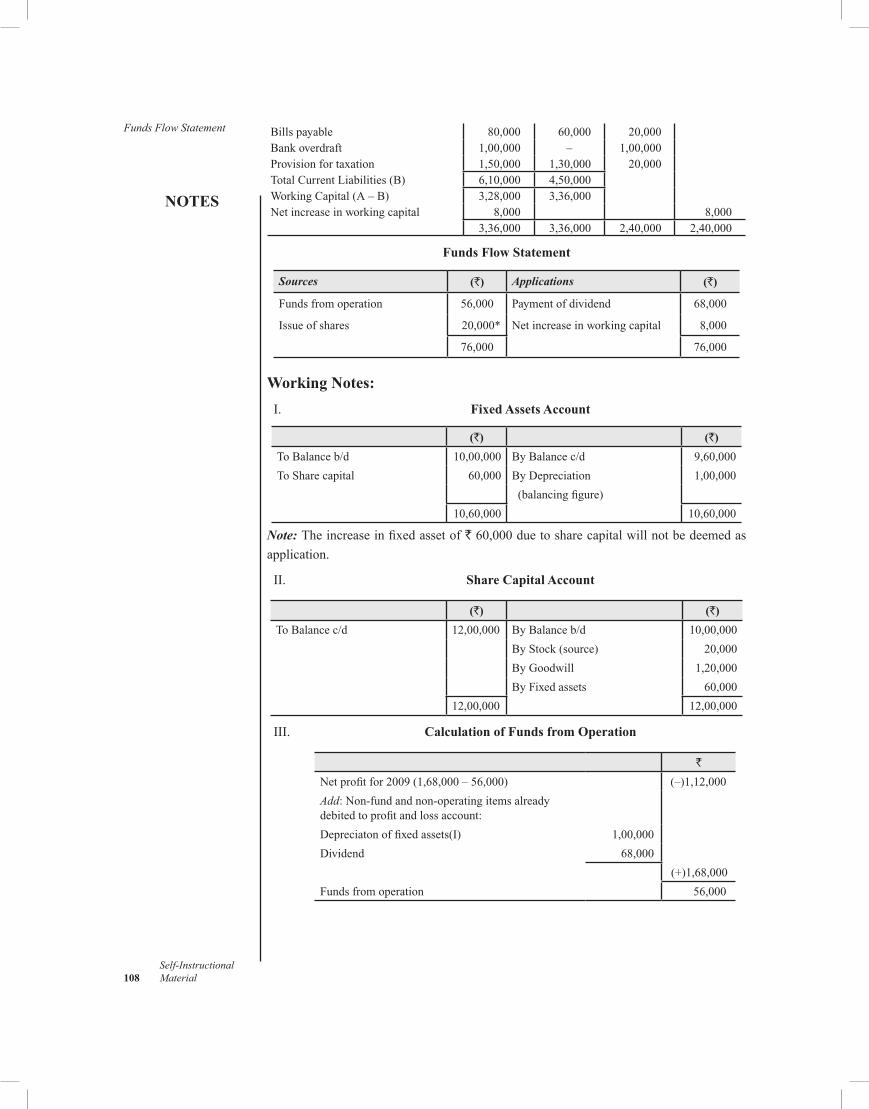
Funds Flow Statement
NOTES
Self-Instructional 108 Material
Billspayable 80,000 60,000 20,000Bankoverdraft 1,00,000 – 1,00,000Provisionfortaxation 1,50,000 1,30,000 20,000TotalCurrentLiabilities(B) 6,10,000 4,50,000WorkingCapital(A–B) 3,28,000 3,36,000Netincreaseinworkingcapital 8,000 8,000
3,36,000 3,36,000 2,40,000 2,40,000
Funds Flow Statement
Sources (`) Applications (`)
Fundsfromoperation 56,000 Paymentofdividend 68,000
Issueofshares 20,000* Netincreaseinworkingcapital 8,000
76,000 76,000
Working Notes: I. Fixed Assets Account
(`) (`)
ToBalanceb/d 10,00,000 ByBalancec/d 9,60,000
ToSharecapital 60,000 ByDepreciation 1,00,000
(balancingfigure)
10,60,000 10,60,000
Note: Theincreaseinfixedassetof`60,000duetosharecapitalwillnotbedeemedasapplication.
II. Share Capital Account
(`) (`)
ToBalancec/d 12,00,000 ByBalanceb/d 10,00,000
ByStock(source) 20,000
ByGoodwill 1,20,000
ByFixedassets 60,000
12,00,000 12,00,000
III. Calculation of Funds from Operation
`
Netprofitfor2009(1,68,000–56,000) (–)1,12,000
Add:Non-fundandnon-operatingitemsalreadydebitedtoprofitandlossaccount:
Depreciatonoffixedassets(I) 1,00,000
Dividend 68,000
(+)1,68,000
Fundsfromoperation 56,000
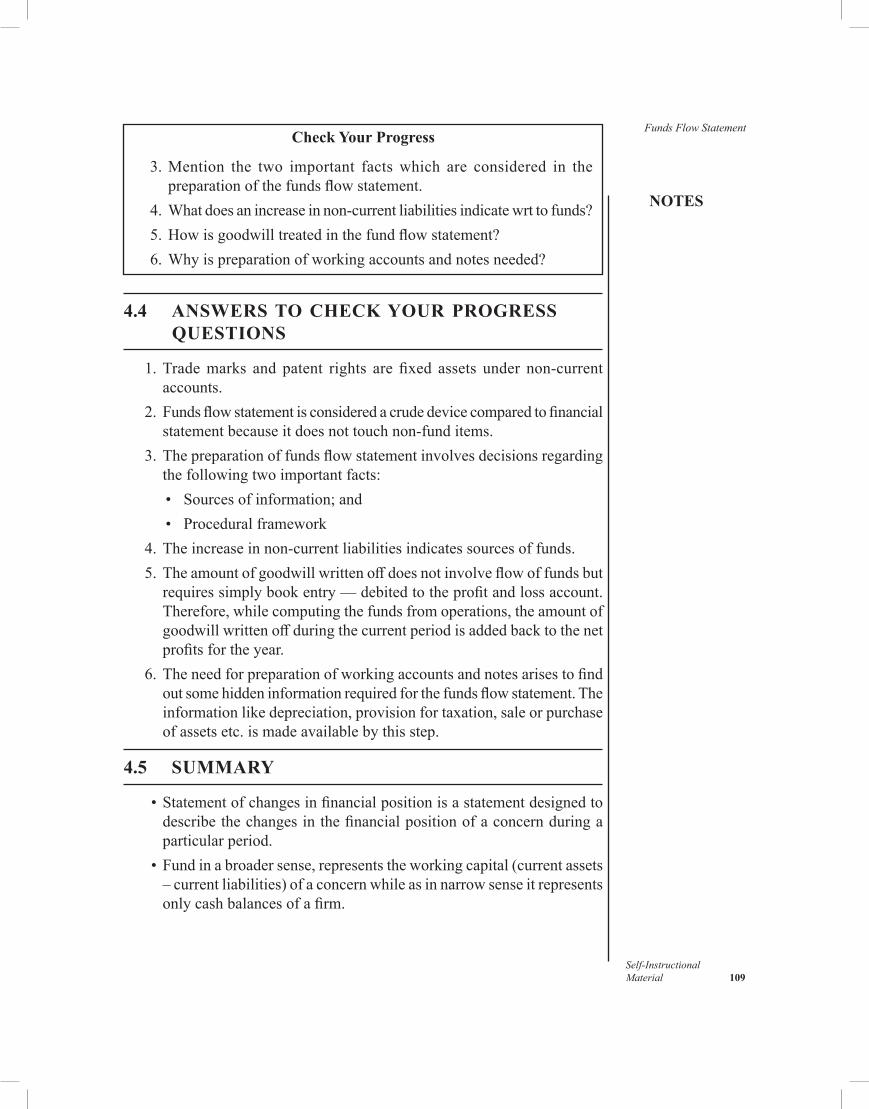
NOTES
Self-InstructionalMaterial 109
Funds Flow StatementCheck Your Progress
3.Mention the two important factswhich are considered in thepreparationofthefundsflowstatement.
4.Whatdoesanincreaseinnon-currentliabilitiesindicatewrttofunds? 5.Howisgoodwilltreatedinthefundflowstatement? 6.Whyispreparationofworkingaccountsandnotesneeded?
4.4 ANSWERS TO CHECK YOUR PROGRESS QUESTIONS
1.Trademarks and patent rights are fixed assets under non-currentaccounts.
2.Fundsflowstatementisconsideredacrudedevicecomparedtofinancialstatementbecauseitdoesnottouchnon-funditems.
3.Thepreparationoffundsflowstatementinvolvesdecisionsregardingthefollowingtwoimportantfacts:• Sourcesofinformation;and• Proceduralframework
4.Theincreaseinnon-currentliabilitiesindicatessourcesoffunds. 5.Theamountofgoodwillwrittenoffdoesnotinvolveflowoffundsbut
requiressimplybookentry—debitedtotheprofitandlossaccount.Therefore,whilecomputingthefundsfromoperations,theamountofgoodwillwrittenoffduringthecurrentperiodisaddedbacktothenetprofitsfortheyear.
6.Theneedforpreparationofworkingaccountsandnotesarisestofindoutsomehiddeninformationrequiredforthefundsflowstatement.Theinformationlikedepreciation,provisionfortaxation,saleorpurchaseofassetsetc.ismadeavailablebythisstep.
4.5 SUMMARY
• Statementofchangesinfinancialpositionisastatementdesignedtodescribethechangesinthefinancialpositionofaconcernduringaparticularperiod.
•Fundinabroadersense,representstheworkingcapital(currentassets–currentliabilities)ofaconcernwhileasinnarrowsenseitrepresentsonlycashbalancesofafirm.
Funds Flow Statement
NOTES
Self-Instructional 110 Material
• Flowoffundwouldmeanwhenabusinesstransactioncausesachangeintheamountoffund(workingcapital)thatexistsbeforethematurityofthetransaction.
•FundsFlowStatementisatechniqueusedtosummarizethefinancialoperationsofaconcernbystudyingthesourcesandapplicationfundsduringtheaccountingperiod.
•StatementorScheduleofchangesinworkingcapitalisastatementthatcomparesthechangeintheamountofcurrentaccounts,currentassets and current.
• Sourcesrefertoasituationwhenatransactionincreasestheamountoffund(workingcapital).
•Applicationmeansatransactionthatresultsinthereductionoffund. •Thedual-aspectconceptofaccountingsuggeststhatthetotalamount
ofsourcesoffundsmustreconcilewiththetotalamountofapplicationof funds.
4.6 KEY WORDS
• Flow of fund: Itreferstoabusinesstransactionthatcausesachangeintheamountofund(workingcapital)thatexistsbeforethematurityofthetransaction.
• Funds flow statement: Itisastatementpreparedonthebasisofnetcurrentassets/workingcapitalwhichiscalculatedbysubtractingcurrentliabilitiesfromcurrentassets.
• Schedule of changes in working capital: It is a statementwhichreflectsthechangeswhichhaveoccurredinthecurrentaccountsasaresultofflowoffunds.
4.7 SELF ASSESSMENT QUESTION AND EXERCISES
Short-Answer Questions
1.WhatisaFundsFlowStatement?Listitsmanagerialuses. 2.Explaintheterms: (i)Funds (ii)FlowofFunds (iii)FundsFlowStatement 3.Mentionthemajorsourcesandapplicationsofworkingcapital. 4.Whatinformationwouldyourequiretoprepareastatementofsources
andapplication?
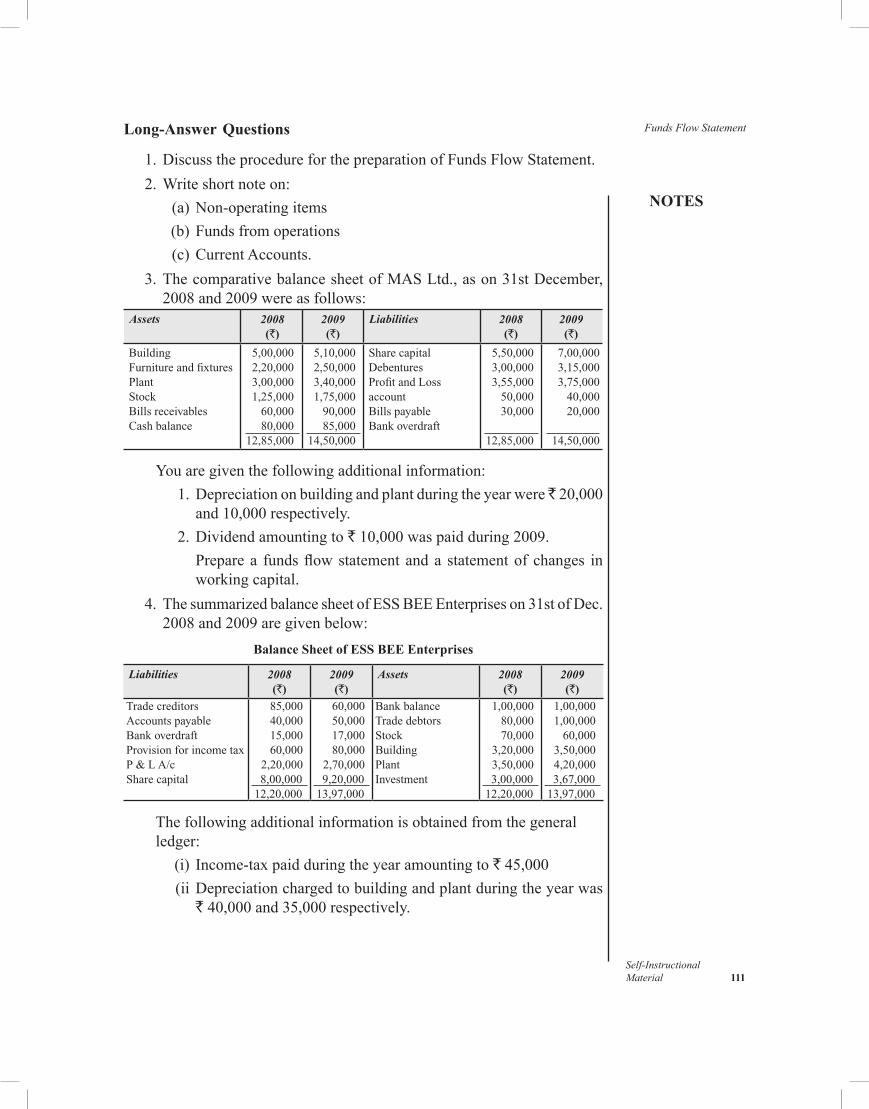
NOTES
Self-InstructionalMaterial 111
Funds Flow StatementLong-Answer Questions
1.DiscusstheprocedureforthepreparationofFundsFlowStatement. 2.Writeshortnoteon: (a)Non-operatingitems (b)Fundsfromoperations (c)CurrentAccounts. 3.ThecomparativebalancesheetofMASLtd.,ason31stDecember,
2008and2009wereasfollows:Assets 2008
(`)2009 (`)
Liabilities 2008 (`)
2009 (`)
BuildingFurnitureandfixturesPlantStockBillsreceivablesCashbalance
5,00,0002,20,0003,00,0001,25,00060,00080,000
12,85,000
5,10,0002,50,0003,40,0001,75,00090,00085,000
14,50,000
SharecapitalDebenturesProfitandLossaccountBillspayableBankoverdraft
5,50,0003,00,0003,55,00050,00030,000
12,85,000
7,00,0003,15,0003,75,00040,00020,000
14,50,000
Youaregiventhefollowingadditionalinformation: 1.Depreciationonbuildingandplantduringtheyearwere 20,000
and10,000respectively. 2. Dividend amounting to `10,000waspaidduring2009. Preparea fundsflowstatementanda statementof changes in
workingcapital. 4.ThesummarizedbalancesheetofESSBEEEnterpriseson31stofDec.
2008and2009aregivenbelow:Balance Sheet of ESS BEE Enterprises
Liabilities 2008 (`)
2009 (`)
Assets 2008 (`)
2009 (`)
TradecreditorsAccountspayableBankoverdraftProvisionforincometaxP&LA/cSharecapital
85,00040,00015,00060,000
2,20,0008,00,00012,20,000
60,00050,00017,00080,000
2,70,0009,20,00013,97,000
BankbalanceTradedebtorsStockBuildingPlantInvestment
1,00,00080,00070,000
3,20,0003,50,0003,00,00012,20,000
1,00,0001,00,00060,000
3,50,0004,20,0003,67,00013,97,000
Thefollowingadditionalinformationisobtainedfromthegeneralledger:
(i) Income-taxpaidduringtheyearamountingto`45,000 (ii Depreciationchargedtobuildingandplantduringtheyearwas
`40,000and35,000respectively.
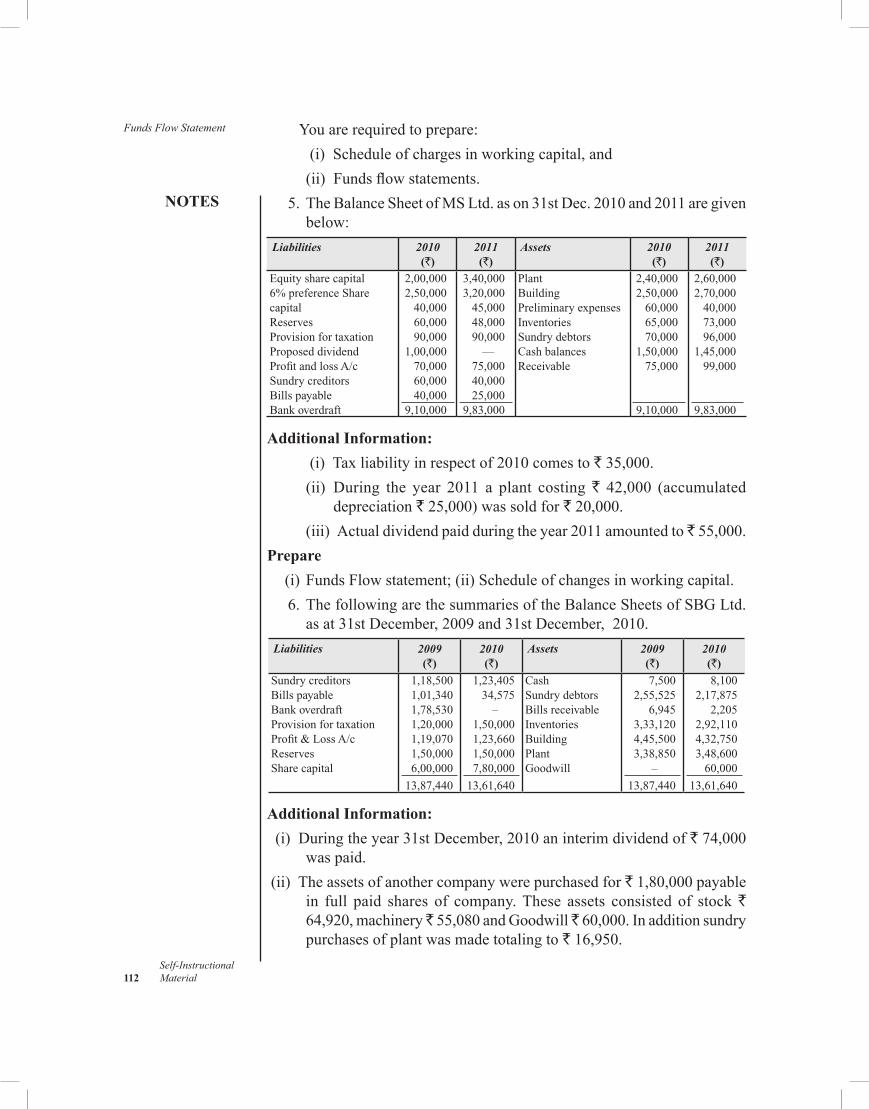
Funds Flow Statement
NOTES
Self-Instructional 112 Material
Youarerequiredtoprepare: (i) Scheduleofchargesinworkingcapital,and (ii) Fundsflowstatements. 5.TheBalanceSheetofMSLtd.ason31stDec.2010and2011aregiven
below:Liabilities 2010
(`)2011 (`)
Assets 2010 (`)
2011 (`)
Equitysharecapital6%preferenceSharecapitalReservesProvisionfortaxationProposeddividendProfitandlossA/cSundrycreditorsBillspayableBankoverdraft
2,00,0002,50,00040,00060,00090,000
1,00,00070,00060,00040,000
9,10,000
3,40,0003,20,00045,00048,00090,000—75,00040,00025,000
9,83,000
PlantBuildingPreliminaryexpensesInventoriesSundrydebtorsCashbalancesReceivable
2,40,0002,50,00060,00065,00070,000
1,50,00075,000
9,10,000
2,60,0002,70,00040,00073,00096,000
1,45,00099,000
9,83,000
Additional Information: (i) Taxliabilityinrespectof2010comesto`35,000. (ii) During the year 2011 a plant costing` 42,000 (accumulated
depreciation `25,000)wassoldfor`20,000. (iii) Actualdividendpaidduringtheyear2011amountedto 55,000.Prepare (i)FundsFlowstatement;(ii)Scheduleofchangesinworkingcapital. 6.ThefollowingarethesummariesoftheBalanceSheetsofSBGLtd.
asat31stDecember,2009and31stDecember,2010.Liabilities 2009
(`)2010 (`)
Assets 2009 (`)
2010 (`)
SundrycreditorsBillspayableBankoverdraftProvisionfortaxationProfit&LossA/cReservesSharecapital
1,18,5001,01,3401,78,5301,20,0001,19,0701,50,0006,00,000
13,87,440
1,23,40534,575–
1,50,0001,23,6601,50,0007,80,000
13,61,640
CashSundrydebtorsBillsreceivableInventoriesBuildingPlantGoodwill
7,5002,55,525
6,9453,33,1204,45,5003,38,850–
13,87,440
8,1002,17,875
2,2052,92,1104,32,7503,48,60060,000
13,61,640
Additional Information:(i) Duringtheyear31stDecember,2010aninterimdividendof`74,000
waspaid.(ii) Theassetsofanothercompanywerepurchasedfor`1,80,000payable
in full paid shares of company.These assets consisted of stock` 64,920,machinery 55,080andGoodwill 60,000.Inadditionsundrypurchasesofplantwasmadetotalingto`16,950.
NOTES
Self-InstructionalMaterial 113
Funds Flow Statement (iii) Incometaxpaidduringtheyearamountingto`75,000. (iv)Thenetprofitfortheyearbeforetaxwas`1,87,590.Youarerequiredtoprepare: (i)Scheduleofchangesinworkingcapital;and (ii)Statementshowingthesourcesandapplicationoffundsfortheyear
2010.
4.8 FURTHER READINGS
Sahaf,M.A.2013.Management Accounting: Principles and Practice,3rdedition.NewDelhi:VikasPublishingHouse.
Arora,M.N.2012.A textbook of Cost and Management Accounting,10thedition.NewDelhi:VikasPublishingHouse.
Maheshwari,S.N.,SuneelK.andSharadK.2018.A Textbook of Accounting for Management,4thedition.NewDelhi:VikasPublishingHouse.
Cash Flow Statement and Analysis
NOTES
Self-Instructional 114 Material
BLOCK II CASH FLOW STATEMENT AND ANALYSIS
UNIT 5 CASH FLOW STATEMENT AND ANALYSIS
Structure 5.0 Introduction 5.1 Objectives 5.2 MeaningOfCashFlowStatement
5.2.1 DifferencebetweenCashFlowStatementandFundFlowStatement 5.2.2 ConceptofCashFlow 5.2.3 SourcesandApplicationofCash 5.2.4 CalculationofCashFromOperations 5.2.5 FormsofCashFlowStatement
5.3 PreparationOfCashFlowStatementasperAS3 5.4 AnswerstoCheckYourProgressQuestions 5.5 Summary 5.6 Key Words 5.7 SelfAssessmentQuestionsandExercises 5.8 FurtherReadings
5.0 INTRODUCTION
Cashflowhasrightlybeenrecognizedaslifestreamofasuccessfulbusinessasthereishardlyanybusinesstransactionthatdoesnotinvolvecash.Manyresearchstudieshaverevealedthatprofitableventureshavefailedbecauseofinsufficientcashandunprofitableoneshavecontinuedforlongperiodsbecause sufficient cashwas somewhat pumped into thebusiness system.Consequently,managementofcashhasemergedasastrategicareaforthegrowth andprosperity offirms in contemporary business, and therefore,hasreceivedconsiderableattentionofbothacademiciansandpractitioners.Recognizing the significance ofmanagement of cash in contemporarybusinessasastrategicresource,businessfirmsneedtocontrolandmonitorcashflowsefficientlyandeffectivelysothatadequatecashisavailabletomeettherequirementsofthebusiness.Toattainthisobjective,businessfirmsmakeuseofcash flow statement whichprovidesthemthedetailsaboutcashreceivedandspentonvariousactivitiesduringtheperiodunderstudy.
5.1 OBJECTIVES
Aftergoingthroughthisunit,youwillbeableto: • ExplainthemeaningofCashflowstatement
NOTES
Self-InstructionalMaterial 115
Cash Flow Statement and Analysis
• Discuss thedifferencebetweenfundsflowstatementandcashflowstatement
• Describe thepreparationof cashflowstatement asperAccountingStandard 3
5.2 MEANING OF CASH FLOW STATEMENT
Cashflowstatementattemptstomeasuretheinflowsandoutflowsofcashthatresultfromvariousbusinessactivitiesduringaparticularaccountingperiod.Incashflowanalysis,attemptsaremadetoexplainthecausesofchangeinthecashpositionofaconcernduringtheperiod.Suchananalysishelpthebusinessfirmsinidentifyingtheareasofbusinessthateitherhavesurplusordeficitcashandaccordinglyhelptheminthecreationandutilizationofcasheffectively.Thus,cashflowstatementisatoolthatmanagersutilizetoevaluatetheirabilitytomanagecashefficientlyandeffectively.Therefore,acashflowstatementfocusesoncashratherthanonworkingcapitalasadvocatedbyafundflowstatement.TheInstituteofCostandWorksAccountantsofIndia,2000 definescashflowstatementas‘a statement setting out the flow of cash under distinct heads of sources of funds and their utilization to determine the requirements of cash during the given period and to prepare for its adequate provision’.
Totheauthorofthisbook,a cash flow statement is a statement which provides a detailed explanation for the change in a firm’s cash during a particular period by indicating the firm’s sources and uses of cash during that period.Suchastatementisonlyusefulformanagementanddoesnothaveanyutilityforexternalusers.
5.2.1 Difference between Cash Flow Statement and Fund Flow Statement
In fact, cashflow statement and fundflow statement donot differmuchwitheachotherasboththestatementsdepictthesamepicture—transactionswhichresultinthechangeoffinancialpositionduringaparticularaccountingperiod.CommentingonthedifferencebetweenthesetwostatementsMyer2,1961 isoftheopinionthatthough‘thesestatementscontainingessentiallythesamestoryoffinancialevents’havecertaindifferencesbetweenthemassummarizedbelow: •Afundflowstatementgivesabroadperspectivebyindicatingchanges
inworkingcapitalwhereasacashflowstatementindicatesspecificallytheinflowandoutflowofcashwhichistheoneofthecomponentsofworkingcapitalasusedinafundflowstatement.Therefore,cashflowisanarrowtermascomparedtofundflow.
•Fundflowanalysisisgovernedbythemercantilesystemofaccounting,i.e.,accrualbasis.Ontheotherhand,cashsystemofaccountingisusedforthepreparationofcashflowstatement.
Cash Flow Statement and Analysis
NOTES
Self-Instructional 116 Material
•The amount of information as containedby a fundflow statementprovidessufficientbasisforlong-rangeplanning.Incontrast,acashflowstatementtendstobemoreusefulinshort-runanalysis.
•Afundflowstatementattemptstoidentifytheinflowsandoutflowsoffundswhilecashflowstatementispreparedwithapurposetorecognizetheinflowsandoutflowsofcash.
•Underfundflowanalysis, thechangesinworkingcapital itemsareshown in a separate statement known as ‘schedule of changes inworkingcapital’because fundflowstatement fails to indicate suchchanges.Incontrast,incashflowanalysischangesinbothcurrentandnon-currentaccountsappearinthecashflowstatement.Therefore,thepreparationofaseparatestatementtoindicatethechangesinworkingcapitalcomponentsdoesnotariseincashflowanalysis.
5.2.2 Concept of Cash Flow
Thebasicobjectiveofcashflowanalysisistoidentifythebusinesstransactionstechnicallyknownascashflowthatcausethechangeinthefirms’cashandcashequivalents.Infact,cashflowcanresulteitherininfloworoutflowofcashandcashequivalent.Cashinflowreferstoabusinesstransactionthatgeneratescash,andtherefore,technicallyitisreferredtoassource.Inthesameway,cashoutflowreferstoabusinesstransactionthatutilizescashandtherefore,technicallyitisknownasapplication.Infact,suchcashflowscanresultfromthefollowingthreemajoractivitiesofanenterprise: •Operatingactivitiesincludesuchactivitiesthathavedirectimpacton
theenterprise’sbusinessresults.Therefore,suchactivitieseitherresultinoperatingincomesoroperatingexpenses;
• Investment activities refers to such activities that result in eitherpurchaseorsaleoflong-termassets;
•Financialactivitiesincludeactivitiesthatareresponsibleforthechangeinthecompany’scapitalstructureandthereforeareconcernedwiththecapitalanddebtofthebusiness.Tomeet the above-mentionedobjective of cashflowanalysis, one
hastousethesameapproachthatwasdevisedtoanalysefundsflow(networkingcapital)inUnit4.However,suchanapproachwouldcallforslightmodificationtomakeitappropriatefortheanalysisofcashflows.Incashflowanalysis,thenon-currentaccounts,i.e.,fixedassetsandlong-termliabilitiesaregiventhesametreatmentasisrecommendedforsuchitemsinfundflowanalysis.However,thechangesincurrentaccounts(exceptcash)whichwerereflectedinthescheduleofchangesinworkingcapitalincaseoffundflowanalysisarenowreflected incashflowstatementalongwith thechangesinnon-currentaccounts.Thecashflowcanbedeterminedsymbolicallyas:
NOTES
Self-InstructionalMaterial 117
Cash Flow Statement and Analysis
∆C=∆A−∆Lwhere ∆=Changein C=Cash
A=Totalassetsexceptcash L=TotalliabilitiesTheaboveequationclearlyrevealsthatchangeincashcanbecomputed
byanalysingthechangesthatoccurredinallnon-currentandcurrentaccountsexceptcash.Theimpactoncashpositionofaconcernbythechangeinbalancesheetitemsisgivenbelow:
Change in balance sheet items Impact on cash–Increaseincurrentassetsotherthancash Outflowofcash–Decreaseincurrentassetsotherthancash Inflowofcash–Increaseinnon-currentassets Outflowofcash–Decreaseinnon-currentassets Inflowofcash–Increaseincurrentliabilities Inflowofcash–Decreaseincurrentliabilities Outflowofcash–Increaseinlong-termliabilities Inflowofcash–Decreaseinlong-termliabilities Outflowofcash
5.2.3 Sources and Application of Cash
Themajorsourcesandusesofcasharementionedbelow:
Sources of Cash
• Issueofcapital • Issueoflong-termdebtssuchasdebentures •Saleofassets •Cashfromoperation •Decreaseincurrentassets • Increaseincurrentliabilities
Application of Cash
•Redemptionofcapital •Purchaseoffixedassets •Repaymentoflong-termdebt •Cashlostinoperation • Increaseincurrentassets • Increaseincurrentliabilities
Cash Flow Statement and Analysis
NOTES
Self-Instructional 118 Material
5.2.4 Calculation of Cash From Operations
Themajorsourceofcash forabusiness iscash from tradingoperations.Whentheaccountingsystemisbasedoncashsystem,thenetprofitasshownbyprofitandlossrepresentsthecashfromoperations.However,inactualpractice,commercialorganizationsmaintainmercantilesystemofaccounting.With the result the profit as disclosed by profit and loss account is notconsideredtheactualcashfromoperationasitincludesmanytransactionsofnotionalcash.Thus,netprofitasshowninprofitandlossaccountistobeadjustedastoarriveatactualcashfromoperation.Thenon-cashtransactionslikeoutstandingincomes/expenses,prepaidexpenses,etc.,shouldbeadjusted.Furtherallnon-funditemssuchasdepreciation,preliminaryexpenseswrittenoff,etc.,arealsotobeadjustedasisdoneincaseoffundflowstatement.Adetailedproformaof the statement showingcomputationof cash fromoperationsisgivenbelow:
Statement Showing Computation of Cash from Operations
Particulars Amount(`)
Netprofit(asgiveninP&LA/c)Add:(a) Decrease in Current Assets:
Sundry debtorsBillreceivablePrepaidexpensesAccrued income
(b) Increase in Current Liabilities:Sundry creditorsBillspayableOutstandingexpensesIncome received in advance
(c) Non-fund items debited to Profit and Loss Account:DepreciationGoodwillwrittenoffLossonsaleofassetsPreliminaryexpenseswrittenoff
Less:(a) Increase in Current Assets:
Sundry debtorsBillreceivablePrepaidexpensesAccrued income
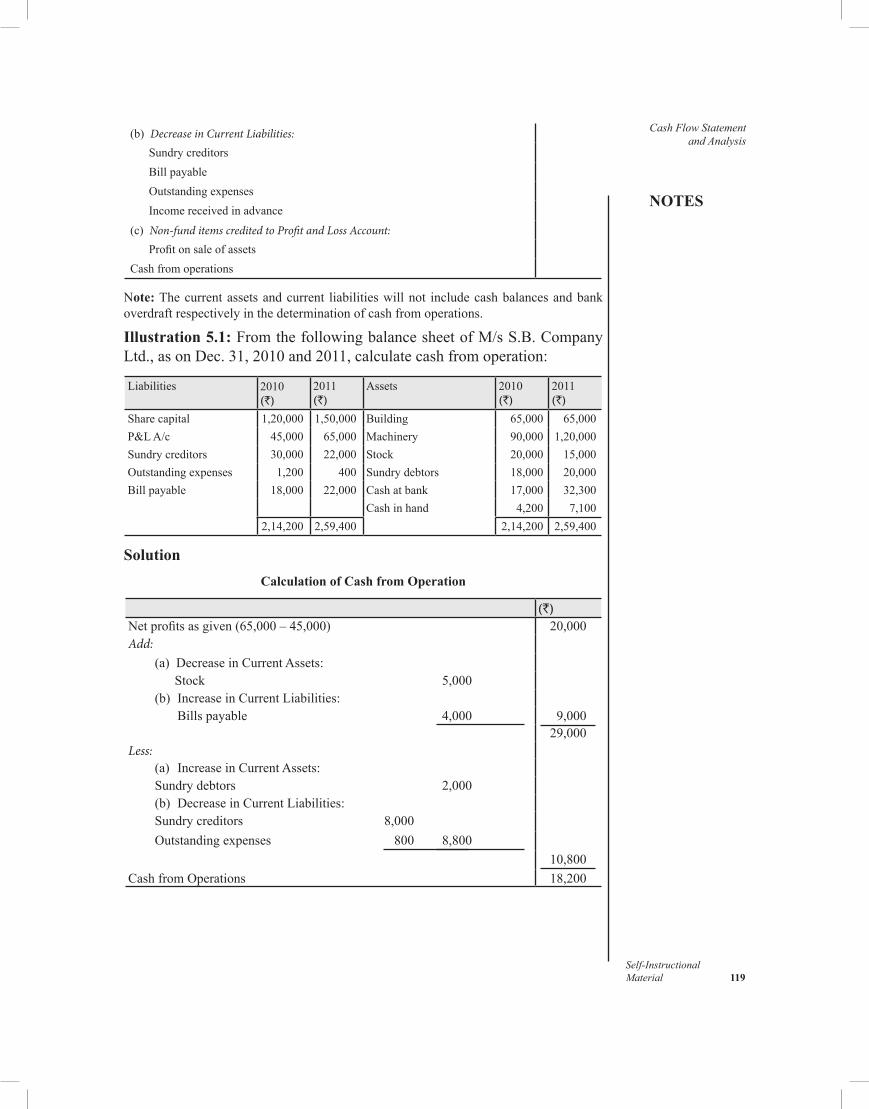
NOTES
Self-InstructionalMaterial 119
Cash Flow Statement and Analysis(b) Decrease in Current Liabilities:
Sundry creditorsBillpayableOutstandingexpensesIncome received in advance
(c) Non-fund items credited to Profit and Loss Account:Profitonsaleofassets
Cashfromoperations
Note:Thecurrentassetsandcurrent liabilitieswillnot includecashbalancesandbankoverdraftrespectivelyinthedeterminationofcashfromoperations.
Illustration 5.1:FromthefollowingbalancesheetofM/sS.B.CompanyLtd.,asonDec.31,2010and2011,calculatecashfromoperation:
Liabilities 2010(`)
2011(`)
Assets 2010(`)
2011(`)
Sharecapital 1,20,000 1,50,000 Building 65,000 65,000P&LA/c 45,000 65,000 Machinery 90,000 1,20,000Sundry creditors 30,000 22,000 Stock 20,000 15,000Outstandingexpenses 1,200 400 Sundry debtors 18,000 20,000Billpayable 18,000 22,000 Cashatbank 17,000 32,300
Cashinhand 4,200 7,1002,14,200 2,59,400 2,14,200 2,59,400
SolutionCalculation of Cash from Operation
(`)Netprofitsasgiven(65,000–45,000) 20,000Add: (a) DecreaseinCurrentAssets: Stock 5,000 (b) IncreaseinCurrentLiabilities: Billspayable 4,000 9,000 29,000Less: (a) IncreaseinCurrentAssets: Sundrydebtors 2,000 (b) DecreaseinCurrentLiabilities: Sundrycreditors 8,000 Outstandingexpenses 800 8,800
10,800CashfromOperations 18,200
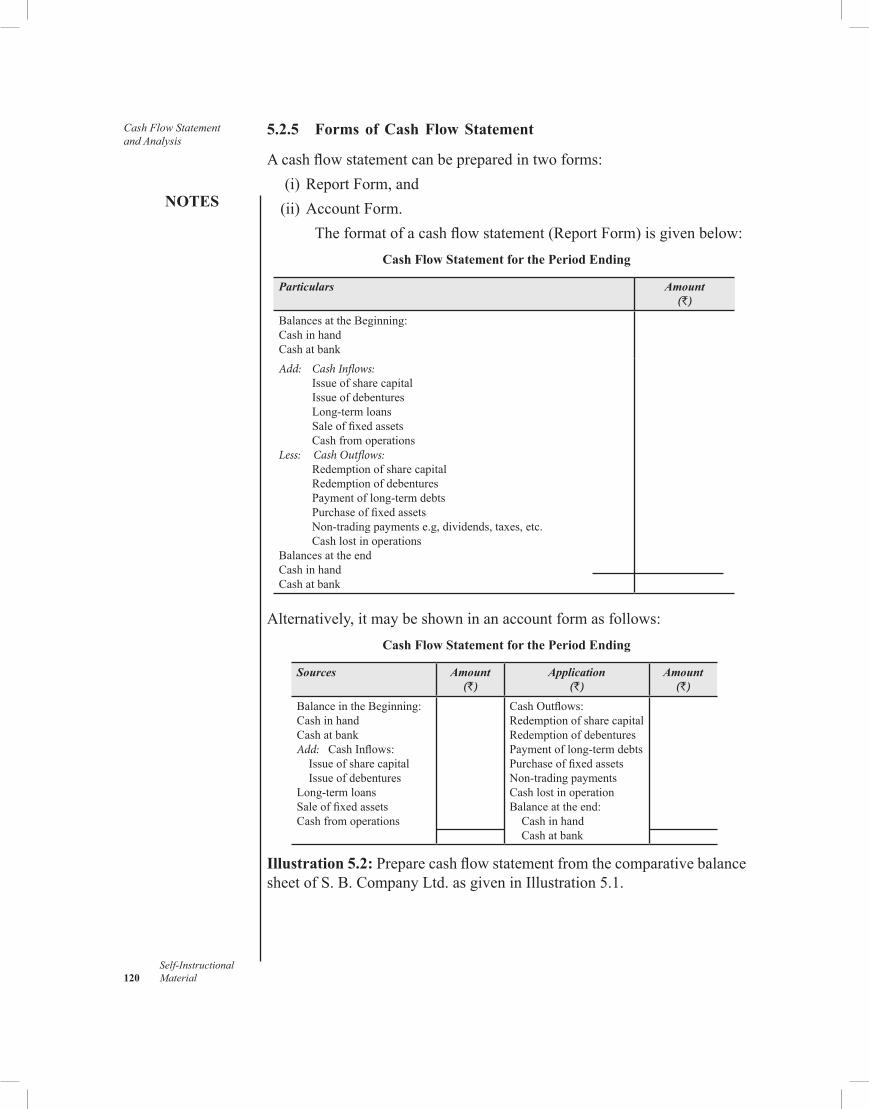
Cash Flow Statement and Analysis
NOTES
Self-Instructional 120 Material
5.2.5 Forms of Cash Flow Statement
Acashflowstatementcanbepreparedintwoforms: (i)ReportForm,and (ii)AccountForm.
Theformatofacashflowstatement(ReportForm)isgivenbelow:Cash Flow Statement for the Period Ending
Particulars Amount (`)
BalancesattheBeginning:CashinhandCashatbankAdd: Cash Inflows:
IssueofsharecapitalIssue of debenturesLong-termloansSaleoffixedassetsCashfromoperations
Less: Cash Outflows:RedemptionofsharecapitalRedemptionofdebenturesPaymentoflong-termdebtsPurchaseoffixedassetsNon-tradingpaymentse.g,dividends,taxes,etc.Cashlostinoperations
BalancesattheendCashinhandCashatbank
Alternatively,itmaybeshowninanaccountformasfollows:Cash Flow Statement for the Period Ending
Sources Amount (`)
Application (`)
Amount (`)
BalanceintheBeginning:CashinhandCashatbankAdd: CashInflows:IssueofsharecapitalIssue of debentures
Long-termloansSaleoffixedassetsCashfromoperations
CashOutflows:RedemptionofsharecapitalRedemptionofdebenturesPaymentoflong-termdebtsPurchaseoffixedassetsNon-tradingpaymentsCashlostinoperationBalanceattheend:CashinhandCashatbank
Illustration 5.2:PreparecashflowstatementfromthecomparativebalancesheetofS.B.CompanyLtd.asgiveninIllustration5.1.
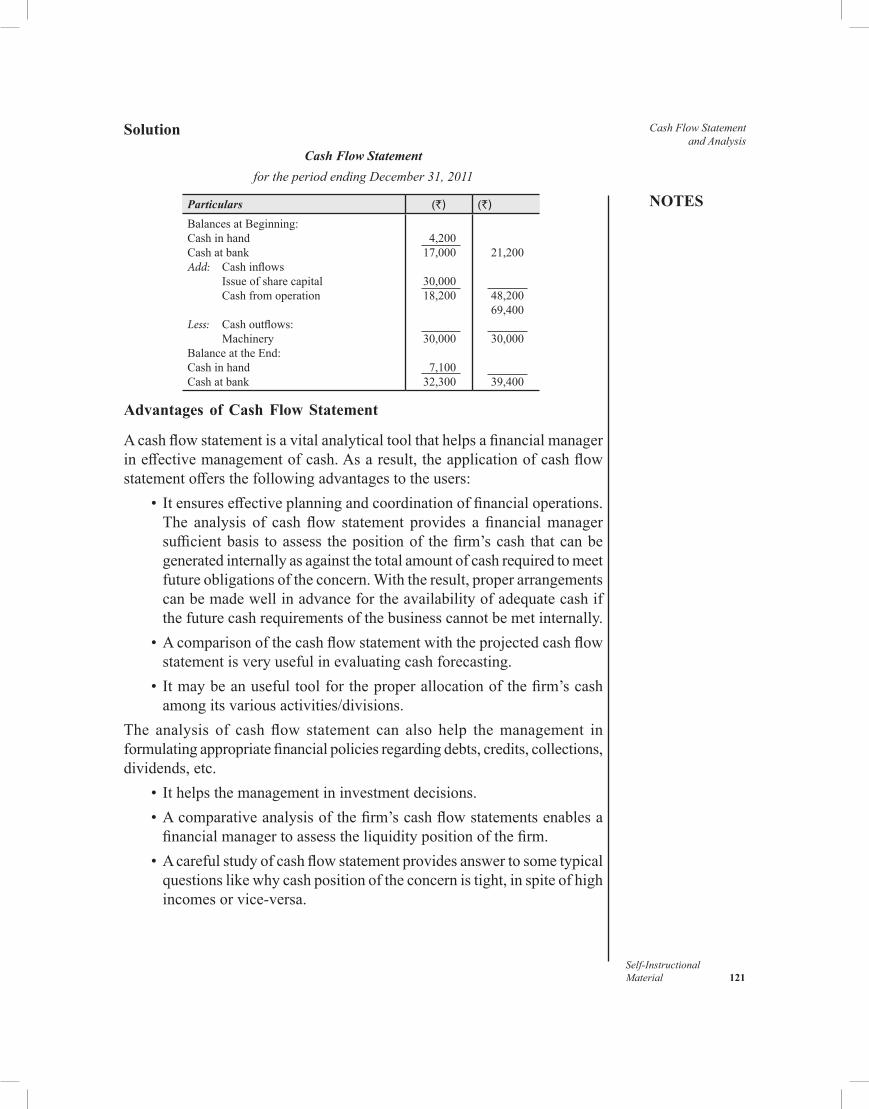
NOTES
Self-InstructionalMaterial 121
Cash Flow Statement and Analysis
SolutionCash Flow Statement
for the period ending December 31, 2011
Particulars (`) (`)
BalancesatBeginning:CashinhandCashatbankAdd: Cashinflows
IssueofsharecapitalCashfromoperation
Less: Cashoutflows:Machinery
BalanceattheEnd:CashinhandCashatbank
4,20017,000
30,00018,200
30,000
7,10032,300
21,200
48,20069,400
30,000
39,400
Advantages of Cash Flow Statement
Acashflowstatementisavitalanalyticaltoolthathelpsafinancialmanagerineffectivemanagementofcash.Asaresult,theapplicationofcashflowstatementoffersthefollowingadvantagestotheusers: • Itensureseffectiveplanningandcoordinationoffinancialoperations.
The analysis of cashflow statement provides a financialmanagersufficientbasis toassess thepositionof thefirm’scash thatcanbegeneratedinternallyasagainstthetotalamountofcashrequiredtomeetfutureobligationsoftheconcern.Withtheresult,properarrangementscanbemadewellinadvancefortheavailabilityofadequatecashifthefuturecashrequirementsofthebusinesscannotbemetinternally.
•Acomparisonofthecashflowstatementwiththeprojectedcashflowstatementisveryusefulinevaluatingcashforecasting.
• Itmaybeanusefultoolfortheproperallocationofthefirm’scashamongitsvariousactivities/divisions.
The analysis of cash flow statement can also help themanagement informulatingappropriatefinancialpoliciesregardingdebts,credits,collections,dividends,etc. • Ithelpsthemanagementininvestmentdecisions. •Acomparativeanalysisofthefirm’scashflowstatementsenablesa
financialmanagertoassesstheliquiditypositionofthefirm. •Acarefulstudyofcashflowstatementprovidesanswertosometypical
questionslikewhycashpositionoftheconcernistight,inspiteofhighincomesorvice-versa.
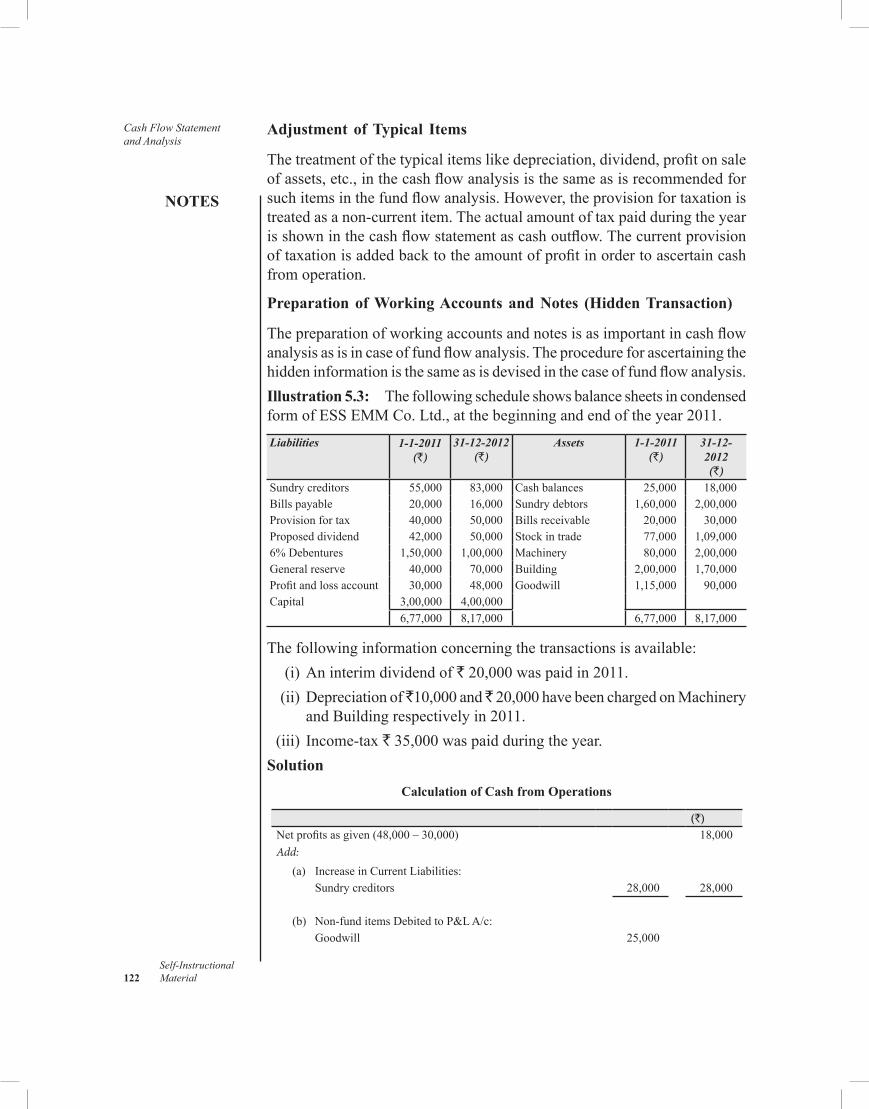
Cash Flow Statement and Analysis
NOTES
Self-Instructional 122 Material
Adjustment of Typical Items
Thetreatmentofthetypicalitemslikedepreciation,dividend,profitonsaleofassets,etc.,inthecashflowanalysisisthesameasisrecommendedforsuchitemsinthefundflowanalysis.However,theprovisionfortaxationistreatedasanon-currentitem.Theactualamountoftaxpaidduringtheyearisshowninthecashflowstatementascashoutflow.Thecurrentprovisionoftaxationisaddedbacktotheamountofprofitinordertoascertaincashfrom operation.
Preparation of Working Accounts and Notes (Hidden Transaction)
Thepreparationofworkingaccountsandnotesisasimportantincashflowanalysisasisincaseoffundflowanalysis.Theprocedureforascertainingthehiddeninformationisthesameasisdevisedinthecaseoffundflowanalysis.Illustration 5.3: ThefollowingscheduleshowsbalancesheetsincondensedformofESSEMMCo.Ltd.,atthebeginningandendoftheyear2011.Liabilities 1-1-2011
(`)31-12-2012
(`)Assets 1-1-2011
(`)31-12-2012(`)
Sundry creditors 55,000 83,000 Cashbalances 25,000 18,000Billspayable 20,000 16,000 Sundry debtors 1,60,000 2,00,000Provisionfortax 40,000 50,000 Billsreceivable 20,000 30,000Proposeddividend 42,000 50,000 Stockintrade 77,000 1,09,0006%Debentures 1,50,000 1,00,000 Machinery 80,000 2,00,000Generalreserve 40,000 70,000 Building 2,00,000 1,70,000Profitandlossaccount 30,000 48,000 Goodwill 1,15,000 90,000Capital 3,00,000 4,00,000
6,77,000 8,17,000 6,77,000 8,17,000
Thefollowinginformationconcerningthetransactionsisavailable: (i)Aninterimdividendof`20,000waspaidin2011. (ii)Depreciationof 10,000and 20,000havebeenchargedonMachinery
andBuildingrespectivelyin2011. (iii) Income-tax`35,000waspaidduringtheyear.Solution
Calculation of Cash from Operations
(`)Netprofitsasgiven(48,000–30,000) 18,000Add:
(a) IncreaseinCurrentLiabilities:Sundry creditors 28,000 28,000
(b) Non-funditemsDebitedtoP&LA/c:Goodwill 25,000
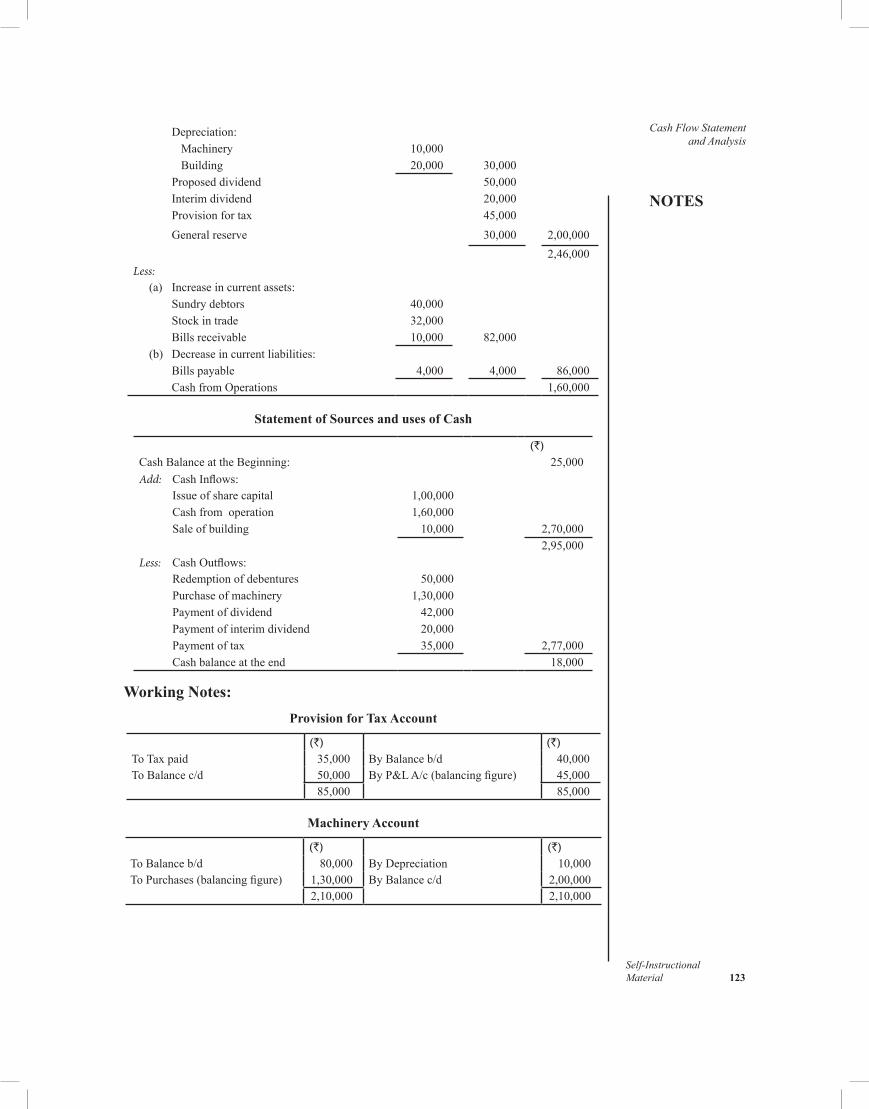
NOTES
Self-InstructionalMaterial 123
Cash Flow Statement and Analysis
Depreciation:Machinery 10,000Building 20,000 30,000
Proposeddividend 50,000Interim dividend 20,000Provisionfortax 45,000Generalreserve 30,000 2,00,000
2,46,000Less:
(a) Increaseincurrentassets:Sundry debtors 40,000Stockintrade 32,000Billsreceivable 10,000 82,000
(b) Decreaseincurrentliabilities:Billspayable 4,000 4,000 86,000CashfromOperations 1,60,000
Statement of Sources and uses of Cash
(`)CashBalanceattheBeginning: 25,000Add: CashInflows:
Issueofsharecapital 1,00,000Cashfromoperation 1,60,000Saleofbuilding 10,000 2,70,000
2,95,000Less: CashOutflows:
Redemptionofdebentures 50,000Purchaseofmachinery 1,30,000Paymentofdividend 42,000Paymentofinterimdividend 20,000Paymentoftax 35,000 2,77,000Cashbalanceattheend 18,000
Working Notes:Provision for Tax Account
(`) (`)ToTaxpaid 35,000 ByBalanceb/d 40,000ToBalancec/d 50,000 ByP&LA/c(balancingfigure) 45,000
85,000 85,000
Machinery Account
(`) (`)ToBalanceb/d 80,000 ByDepreciation 10,000ToPurchases(balancingfigure) 1,30,000 ByBalancec/d 2,00,000
2,10,000 2,10,000
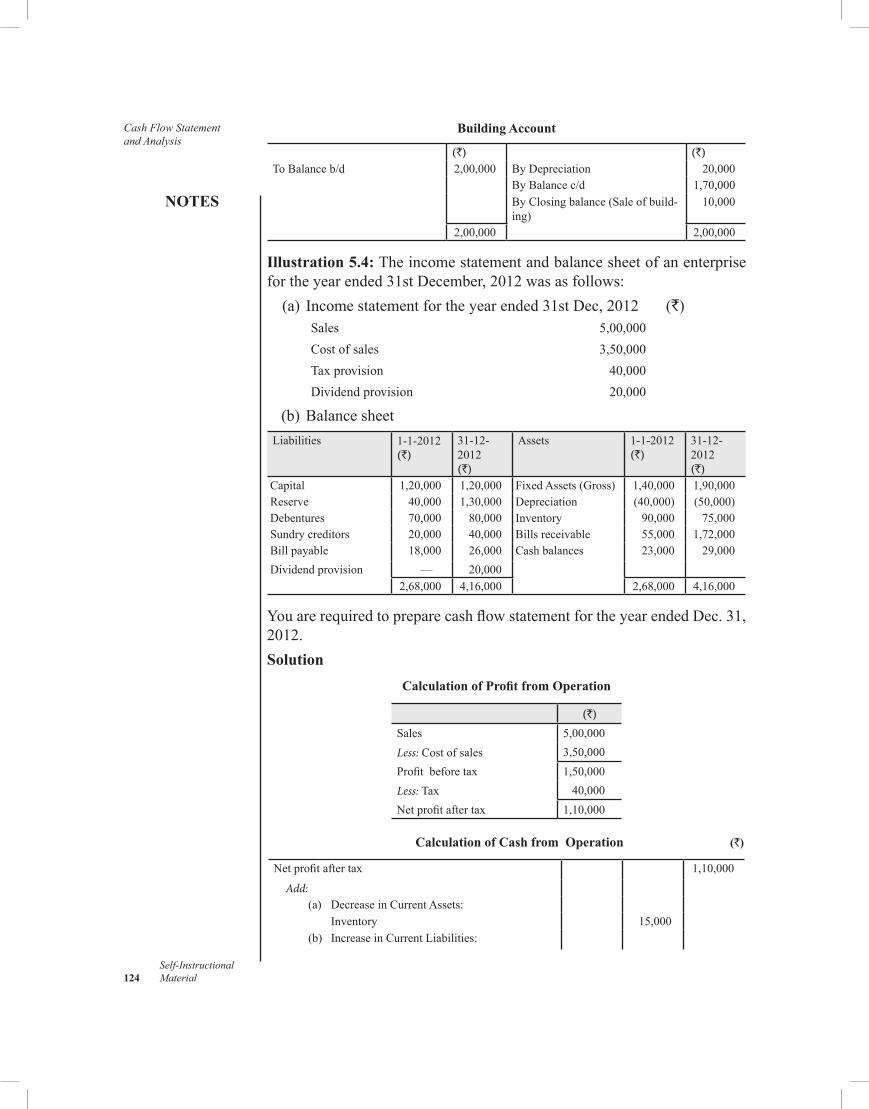
Cash Flow Statement and Analysis
NOTES
Self-Instructional 124 Material
Building Account
(`) (`)ToBalanceb/d 2,00,000 ByDepreciation 20,000
ByBalancec/d 1,70,000ByClosingbalance(Saleofbuild-ing)
10,000
2,00,000 2,00,000
Illustration 5.4:Theincomestatementandbalancesheetofanenterprisefortheyearended31stDecember,2012wasasfollows: (a) Incomestatementfortheyearended31stDec,2012 (`) Sales 5,00,000
Costofsales 3,50,000
Taxprovision 40,000
Dividendprovision 20,000
(b)BalancesheetLiabilities 1-1-2012
(`)31-12-2012(`)
Assets 1-1-2012(`)
31-12-2012(`)
Capital 1,20,000 1,20,000 FixedAssets(Gross) 1,40,000 1,90,000Reserve 40,000 1,30,000 Depreciation (40,000) (50,000)Debentures 70,000 80,000 Inventory 90,000 75,000Sundry creditors 20,000 40,000 Billsreceivable 55,000 1,72,000Billpayable 18,000 26,000 Cashbalances 23,000 29,000Dividend provision — 20,000
2,68,000 4,16,000 2,68,000 4,16,000
YouarerequiredtopreparecashflowstatementfortheyearendedDec.31,2012.Solution
Calculation of Profit from Operation
(`)Sales 5,00,000Less:Costofsales 3,50,000Profitbeforetax 1,50,000Less:Tax 40,000Netprofitaftertax 1,10,000
Calculation of Cash from Operation (`)
Netprofitaftertax 1,10,000
Add:(a) DecreaseinCurrentAssets:
Inventory 15,000(b) IncreaseinCurrentLiabilities:
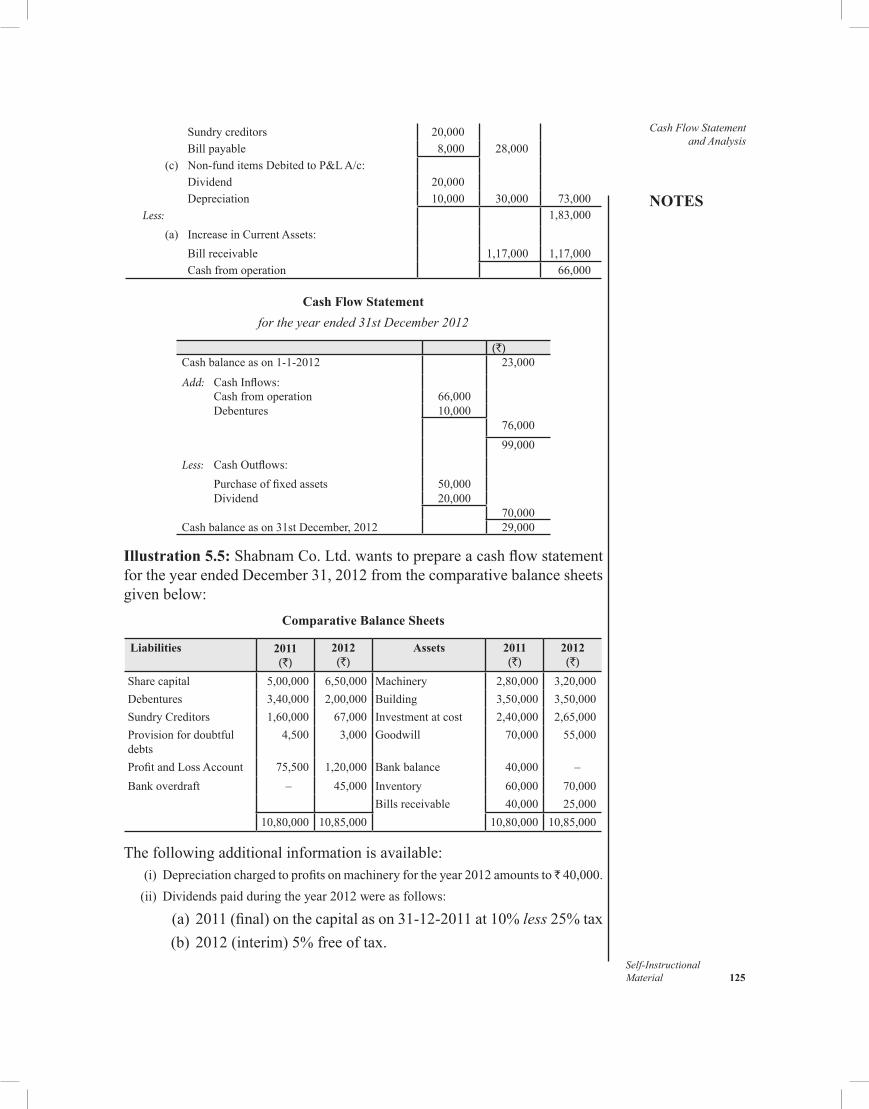
NOTES
Self-InstructionalMaterial 125
Cash Flow Statement and Analysis
Sundry creditors 20,000Billpayable 8,000 28,000
(c) Non-funditemsDebitedtoP&LA/c:Dividend 20,000Depreciation 10,000 30,000 73,000
Less: 1,83,000(a) IncreaseinCurrentAssets:
Billreceivable 1,17,000 1,17,000Cashfromoperation 66,000
Cash Flow Statement for the year ended 31st December 2012
(`)Cashbalanceason1-1-2012 23,000
Add: CashInflows:Cashfromoperation 66,000Debentures 10,000
76,00099,000
Less: CashOutflows:Purchaseoffixedassets 50,000Dividend 20,000
70,000Cashbalanceason31stDecember,2012 29,000
Illustration 5.5: ShabnamCo.Ltd.wantstoprepareacashflowstatementfortheyearendedDecember31,2012fromthecomparativebalancesheetsgivenbelow:
Comparative Balance Sheets
Liabilities 2011(`)
2012(`)
Assets 2011(`)
2012(`)
Sharecapital 5,00,000 6,50,000 Machinery 2,80,000 3,20,000Debentures 3,40,000 2,00,000 Building 3,50,000 3,50,000Sundry Creditors 1,60,000 67,000 Investment at cost 2,40,000 2,65,000Provisionfordoubtfuldebts
4,500 3,000 Goodwill 70,000 55,000
ProfitandLossAccount 75,500 1,20,000 Bankbalance 40,000 –Bankoverdraft – 45,000 Inventory 60,000 70,000
Billsreceivable 40,000 25,00010,80,000 10,85,000 10,80,000 10,85,000
Thefollowingadditionalinformationisavailable: (i) Depreciationchargedtoprofitsonmachineryfortheyear2012amountsto 40,000.
(ii) Dividendspaidduringtheyear2012wereasfollows:
(a) 2011(final)onthecapitalason31-12-2011at10%less 25%tax (b) 2012(interim)5%freeoftax.
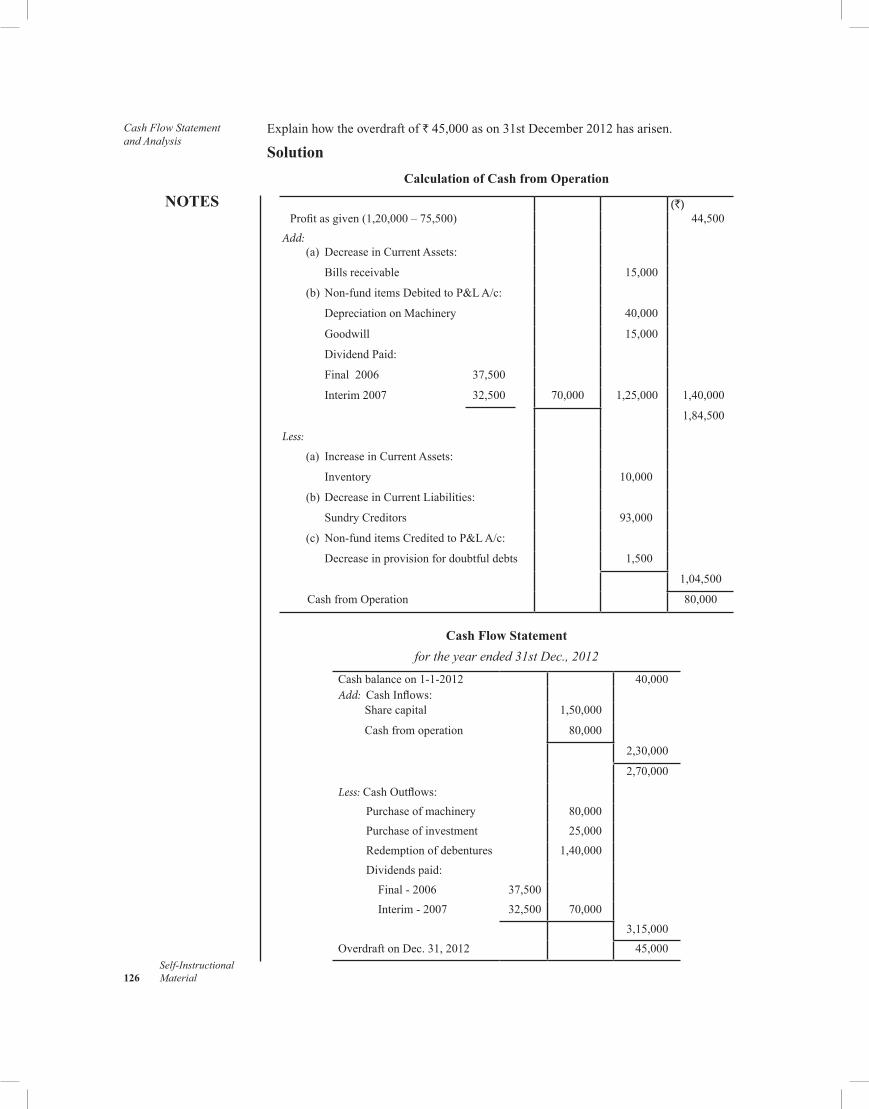
Cash Flow Statement and Analysis
NOTES
Self-Instructional 126 Material
Explainhowtheoverdraftof`45,000ason31stDecember2012hasarisen.
SolutionCalculation of Cash from Operation
(`)Profitasgiven(1,20,000–75,500) 44,500
Add:(a) DecreaseinCurrentAssets:
Billsreceivable 15,000
(b)Non-funditemsDebitedtoP&LA/c:
DepreciationonMachinery 40,000
Goodwill 15,000
DividendPaid:
Final2006 37,500
Interim2007 32,500 70,000 1,25,000 1,40,000
1,84,500
Less:
(a) IncreaseinCurrentAssets:
Inventory 10,000
(b)DecreaseinCurrentLiabilities:
Sundry Creditors 93,000
(c) Non-funditemsCreditedtoP&LA/c:
Decreaseinprovisionfordoubtfuldebts 1,500
1,04,500
CashfromOperation 80,000
Cash Flow Statementfor the year ended 31st Dec., 2012
Cashbalanceon1-1-2012 40,000Add: CashInflows:
Sharecapital 1,50,000
Cashfromoperation 80,000
2,30,000
2,70,000
Less:CashOutflows:Purchaseofmachinery 80,000Purchaseofinvestment 25,000Redemptionofdebentures 1,40,000Dividends paid:Final-2006 37,500Interim-2007 32,500 70,000
3,15,000OverdraftonDec.31,2012 45,000
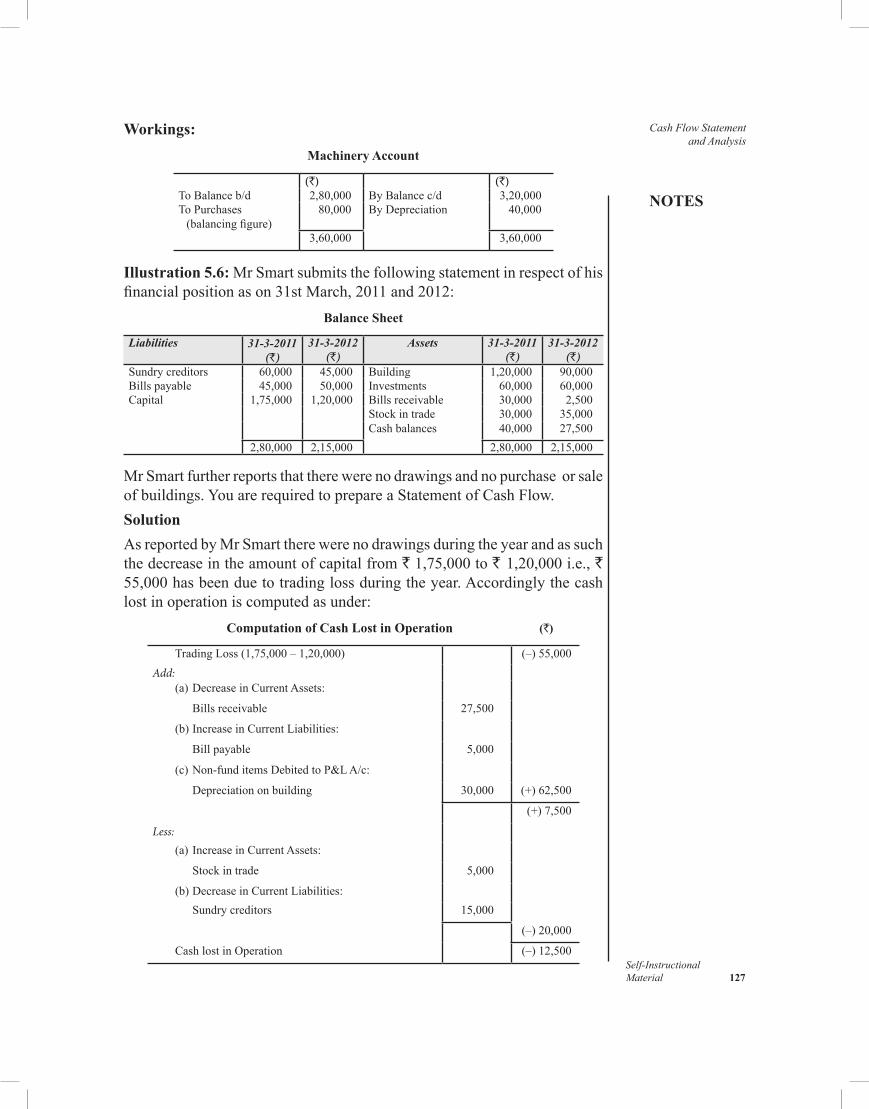
NOTES
Self-InstructionalMaterial 127
Cash Flow Statement and Analysis
Workings:Machinery Account
(`) (`)ToBalanceb/d 2,80,000 ByBalancec/d 3,20,000ToPurchases(balancingfigure)
80,000 ByDepreciation 40,000
3,60,000 3,60,000
Illustration 5.6:MrSmartsubmitsthefollowingstatementinrespectofhisfinancialpositionason31stMarch,2011and2012:
Balance Sheet
Liabilities 31-3-2011(`)
31-3-2012(`)
Assets 31-3-2011(`)
31-3-2012(`)
Sundry creditors 60,000 45,000 Building 1,20,000 90,000Billspayable 45,000 50,000 Investments 60,000 60,000Capital 1,75,000 1,20,000 Billsreceivable 30,000 2,500
Stockintrade 30,000 35,000Cashbalances 40,000 27,500
2,80,000 2,15,000 2,80,000 2,15,000
MrSmartfurtherreportsthattherewerenodrawingsandnopurchaseorsaleofbuildings.YouarerequiredtoprepareaStatementofCashFlow.SolutionAsreportedbyMrSmarttherewerenodrawingsduringtheyearandassuchthedecreaseintheamountofcapitalfrom`1,75,000to` 1,20,000i.e.,` 55,000hasbeenduetotradinglossduringtheyear.Accordinglythecashlostinoperationiscomputedasunder:
Computation of Cash Lost in Operation (`)
TradingLoss(1,75,000–1,20,000) (–)55,000Add:
(a)DecreaseinCurrentAssets:
Billsreceivable 27,500
(b)IncreaseinCurrentLiabilities:
Billpayable 5,000
(c)Non-funditemsDebitedtoP&LA/c:
Depreciationonbuilding 30,000 (+)62,500
(+)7,500
Less:(a)IncreaseinCurrentAssets:
Stockintrade 5,000
(b)DecreaseinCurrentLiabilities:Sundry creditors 15,000
(–)20,000
CashlostinOperation (–)12,500
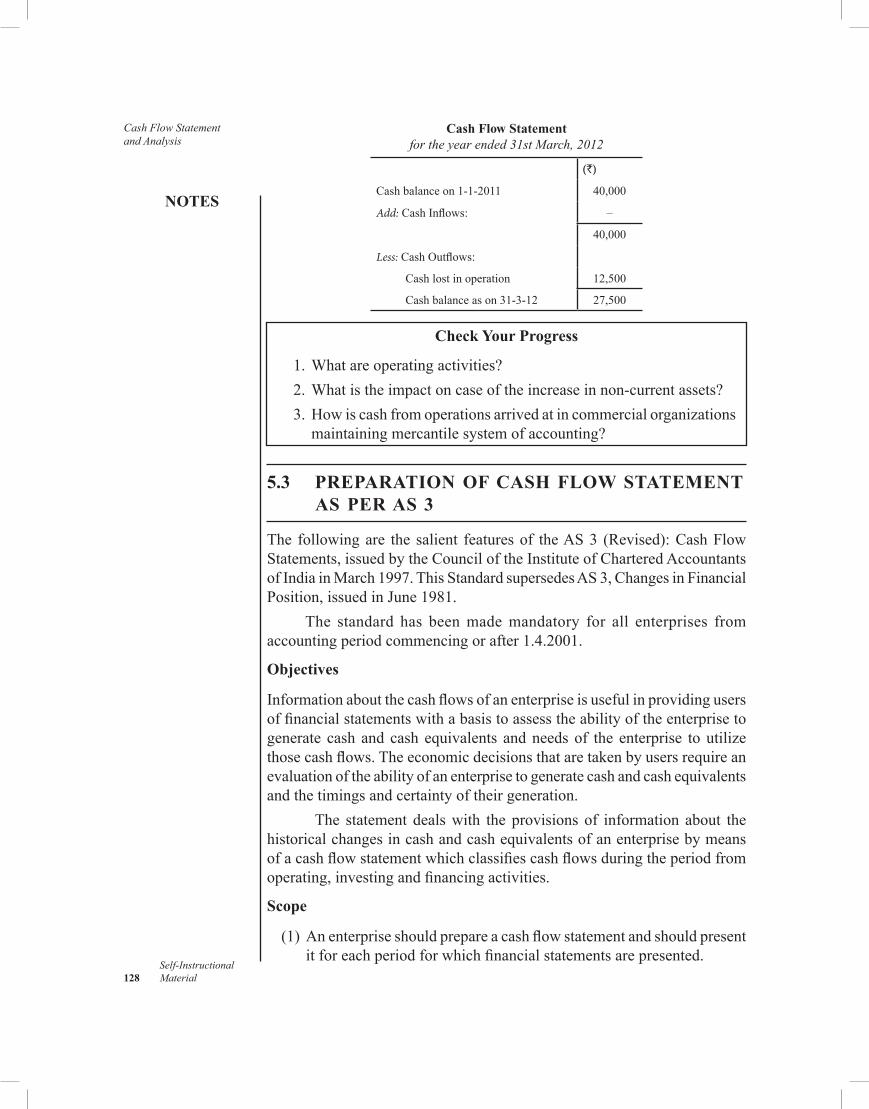
Cash Flow Statement and Analysis
NOTES
Self-Instructional 128 Material
Cash Flow Statement for the year ended 31st March, 2012
(`)
Cashbalanceon1-1-2011 40,000
Add:CashInflows: –
40,000
Less:CashOutflows:
Cashlostinoperation 12,500
Cashbalanceason31-3-12 27,500
Check Your Progress
1.Whatareoperatingactivities? 2.Whatistheimpactoncaseoftheincreaseinnon-currentassets? 3.Howiscashfromoperationsarrivedatincommercialorganizations
maintainingmercantilesystemofaccounting?
5.3 PREPARATION OF CASH FLOW STATEMENT AS PER AS 3
The followingare the salient featuresof theAS3 (Revised):CashFlowStatements,issuedbytheCounciloftheInstituteofCharteredAccountantsofIndiainMarch1997.ThisStandardsupersedesAS3,ChangesinFinancialPosition,issuedinJune1981.
The standard has beenmademandatory for all enterprises fromaccounting period commencing or after 1.4.2001.
Objectives
Informationaboutthecashflowsofanenterpriseisusefulinprovidingusersoffinancialstatementswithabasistoassesstheabilityoftheenterprisetogenerate cash and cash equivalents andneedsof the enterprise toutilizethosecashflows.Theeconomicdecisionsthataretakenbyusersrequireanevaluationoftheabilityofanenterprisetogeneratecashandcashequivalentsandthetimingsandcertaintyoftheirgeneration.
The statement dealswith the provisionsof information about thehistoricalchangesincashandcashequivalentsofanenterprisebymeansofacashflowstatementwhichclassifiescashflowsduringtheperiodfromoperating,investingandfinancingactivities.
Scope
(1)Anenterpriseshouldprepareacashflowstatementandshouldpresentitforeachperiodforwhichfinancialstatementsarepresented.
NOTES
Self-InstructionalMaterial 129
Cash Flow Statement and Analysis
(2)Usersofanenterprise’sfinancialstatementsareinterestedinhowtheenterprisegeneratesandusescashandcashequivalents.Thisisthecaseregardlessofthenatureoftheenterprise’sactivitiesandirrespectiveofwhethercashcanbeviewedastheproductoftheenterprise,asmaybethecasewithafinancialenterprise.Enterprisesneedcashforessentiallythesamereasons,howeverdifferenttheirprincipalrevenue-producingactivitiesmightbe.Theyneedcashtoconducttheiroperations,topaytheirobligations,andtoprovidereturnstotheirinvestors.
Benefits of Cash Flow Information
(1)Acashflowstatement,whenusedinconjunctionwiththeotherfinancialstatements, provides information that enables users to evaluate thechangesinnetassetsofanenterprise,itsfinancialstructure(includingitsliquidityandsolvency),anditsabilitytoaffecttheamountsandtimingofcashflowsinordertoadapttochangingcircumstancesandopportunities.Cashflowinformationisusefulinassessingtheabilityof theenterprise togeneratecashandcashequivalentsandenablesuserstodevelopmodelstoassessandcomparethepresentvalueofthefuturecashflowsofdifferententerprises.
(2) It also enhances the comparability of the reporting of operatingperformancebydifferententerprisesbecauseiteliminatestheeffectsofusingdifferentaccountingtreatmentsforthesametransactionsandevents.
(3)Historicalcashflowinformationisoftenusedasanindicatoroftheamount,timingandcertaintyoffuturecashflows.Itisalsousefulincheckingtheaccuracyofpastassessmentsoffuturecashflowsandinexaminingtherelationshipbetweenprofitabilityandnetcashflowandtheimpactofchangingprices.
Definitions
Thefollowingtermsareusedinthisstatementwiththemeaningsspecified: (1)Cashcomprisescashonhandanddemanddepositswithbanks. (2)Cash equivalents are short term,highly liquid investments that are
readilyconvertibleintoknownamountsofcashandwhicharesubjecttoaninsignificantriskofchangesinvalue.
(3)Cash flowsareinflowsandoutflowsofcashandcashequivalents. (4)Operating activitiesaretheprincipalrevenue-producingactivitiesof
theenterpriseandotheractivitiesthatarenotinvestingorfinancingactivities.
(5) Investing activitiesaretheacquisitionanddisposaloflong-termassetsandotherinvestmentsnotincludedincashequivalents.
Cash Flow Statement and Analysis
NOTES
Self-Instructional 130 Material
(6)Financing activitiesareactivitiesthatresultinchangesinthesizeandcompositionoftheowner’scapital(includingpreferencesharecapitalinthecaseofacompany)andborrowingsoftheenterprise.
Presentation of a Cash Flow Statement
Thecashflowstatementshouldreportcashflowsduringtheperiodclassifiedbyoperatinginvestingandfinancingactivities.(1) Operating activities Cashflowsfromoperatingactivitiesareprimarilyderived from theprincipal revenue-producingactivitiesof theenterprise.Therefore,theygenerallyresultfromthetransactionsandothereventsthatenter into thedeterminationofnetprofitor loss.Examplesofcashflowsfrom operating activities are: (a) cashreceiptsfromthesaleofgoodsandtherenderingofservices (b) cashreceiptsfromroyalties,fees,commissions,andotherrevenue (c) cashpaymentstosuppliersforgoodsandservices (d) cashpaymentstoandonbehalfofemployees (e)Cash receipts and cash payments of an insurance enterprise for
premiumsandclaims,annuitiesandotherpolicybenefits (f) cashpaymentsorrefundsofincometaxesunlesstheycanbespecifically
identifiedwithfinancingandinvestingactivities (g) cash receipts and payments relating to futures contracts, forward
contracts,optioncontractsandswapcontractswhenthecontractsareheldfordealingortradingpurposes.
Modes of reporting cash flows from operating activities
Anenterprisemayreportcashflowsfromoperatingactivitiesusingeitheranyofthefollowingmethods: (a)Direct Method: In caseof thismethodmajor classesofgross cash
receiptsandgrosscashpaymentsaredisclosed;or (b) Indirect Method:Incaseofthismethodnetprofitorlossisadjusted
fortheeffectsoftransactionsofanon-cashnature,anydeferralsoraccrualsofpastor futureoperatingcash receiptsorpayments, anditemsofincomeorexpenseassociatedwithinvestingorfinancingcashflows.
(2) Investing activities Examples of cash flows arising from investingactivities are: (a) cashpaymentstoacquirefixedassets(includingintangibles).These
paymentsincludethoserelatingtocapitalizedresearchanddevelopmentcostsandself-constructedfixedassets
(b) cashreceiptsfromdisposaloffixedassets(includingintangibles)
NOTES
Self-InstructionalMaterial 131
Cash Flow Statement and Analysis
(c) cash payments to acquire shares,warrants, or debt instruments ofotherenterprisesandinterestsinjointventures(otherthanpaymentsforthoseinstrumentsconsideredtobecashequivalentsandthoseheldfordealingortradingpurposes)
(d) cashreceiptsfromdisposalofshares,warrants,ordebtinstrumentsofotherenterprisesandinterestsinjointventures(otherthanreceiptsfromthoseinstrumentsconsideredtobecashequivalentsandthoseheldfordealingortradingpurposes)
(e) cashadvancesandloansmadetothirdparties(otherthanadvancesandloansmadebyfinancialenterprise)
(f) cashreceiptsfromtherepaymentofadvancesandloansmadetothirdparties(otherthatthanadvancesandloansofafinancialenterprise)
(g) cashpaymentsforfuturescontracts,forwardcontracts,optioncontracts,andswapcontractexceptwhenthecontractsareheldfordealingortradingpurposes,orthepaymentsandclassifiedasfinancingactivities
(h) cashreceiptsfromfuturescontracts,forwardcontracts,optioncontracts,andswapcontractsexceptwhenthecontractsareheldfordealingortradingpurposes,orthereceiptsareclassifiedasfinancingactivities
(3) Financing activities Examples of cashflows arising fromfinancingactivities are: (a) cashproceedsfromissuingsharesorothersimilarinstruments (b) cashproceedsfromissuingdebentures,loans,notes,bonds,andother
short-orlong-termborrowings (c) cashrepaymentsofamountsborrowed
Reporting Cash Flows from Investing and Financing Activities
Anenterpriseshouldreportseparatelymajorclassesofgrosscashreceiptsandgrosscashpaymentsarisingfrominvestingandfinancingactivities,excepttotheextentthatcashflowsdescribedinparagraph6arereportedonanetbasis.
Reporting Cash Flows on a Net Basis
(1)Cashflowsarisingfromthefollowingoperating,investingorfinancingactivities may reported on a net basis:
(i)Cashreceiptsandpaymentsonbehalfofcustomerswhenthecashflowsreflecttheactivitiesofthecustomerratherthanthoseoftheenterprise.
Examplesofcashreceiptsandpaymentsreferredaboveareasfollows:
(a) theacceptanceandrepaymentofdemanddepositsbyabank; (b) fundshelpforcustomersbyaninvestmententerprise;and
Cash Flow Statement and Analysis
NOTES
Self-Instructional 132 Material
(c) rentscollectedonbehalfof,andpaidoverto,theownersofproperties.
(ii)Cashreceiptsandpaymentsforitemsinwhichtheturnoverisquick,theamountslarge,andthematuritiesareshort.
Examples of cash receipts and payments referred above areadvancesmadefor,andtherepaymentsof:
(a) Principalamountsrelatingtocreditcardcustomers; (b) thepurchaseandsaleofinvestments;and (c) othershort-termborrowings,forexample,thosewhichhave
amaturityperiodofthreemonthsorless. (2)Cashflowsarisingfromeachofthefollowingactivitiesofafinancial
enterprise may be reported on a net basis: (a)Cashreceiptsandpaymentsfortheacceptanceandrepaymentof
depositswithafixedmaturitydate; (b)Theplacementofdepositswithandwithdrawalofdepositsfrom
otherfinancialenterprises;and (c)Cashadvancesandloansmadetocustomersandtherepayment
ofthoseadvancesandloans.
Disclosure
(1) Components of cash and cash equivalentsAn enterprise shoulddisclose the components of cash and cash equivalents and shouldpresentareconciliationoftheamountsinitscashflowstatementwiththeequivalentitemsreportedinthebalancesheet.
(2) Other disclosuresAn enterprise should disclose, togetherwith acommentarybymanagement,theamountofsignificantcashandcashequivalentbalancesheldbytheenterprisethatarenotavailableforuse by it.
Check Your Progress
4.Howare cash fromoperating activities to be reportedunder theindirectmethodasperAS3?
5.WhatarethedisclosurestobepresentedaspertheAS3?
5.4 ANSWERS TO CHECK YOUR PROGRESS QUESTIONS
1.Operatingactivitiesincludesuchactivitiesthathavedirectimpactontheenterprises’businessresults.Therefore,suchactivitieseitherresultinoperatingincomesoroperatingexpenses.
NOTES
Self-InstructionalMaterial 133
Cash Flow Statement and Analysis
2.Theincreaseinnon-currentassetsresultsinoutflowofcash. 3.Undermercantilesystemofaccounting,theprofitasdisclosedbythe
profitandlossaccountisnotconsideredtheactualcashfromoperationsasitincludesmanytransactionsofnotionalcash.Thus,netprofitasshowninprofitandlossaccountistobeadjustedastoarriveatactualcashfromoperationsincludingnon-cashandnon-funditems.
4.AsperAS3,inthecaseofindirectmethodnetprofitorlossisadjustedfortheeffectsoftransactionsofanon-cashnature,anydeferralsoraccrualsofpastor futureoperatingcash receiptsorpayments, anditemsofincomeorexpenseassociatedwithinvestingorfinancingcashflows.
5.ThefollowingarethedisclosurestobepresentedasperAS3: (i)ComponentsofcashandcashequivalentsAnenterpriseshould
disclosethecomponentsofcashandcashequivalentsandshouldpresentareconciliationoftheamountsinitscashflowstatementwiththeequivalentitemsreportedinthebalancesheet.
(ii)OtherdisclosuresAnenterpriseshoulddisclose, togetherwithacommentarybymanagement, theamountofsignificantcashandcashequivalentbalancesheldbytheenterprisethatarenotavailableforusebyit.
5.5 SUMMARY
•A cash flow statement is a statementwhich provides a detailedexplanationforthechangeinafirm’scashduringaparticularperiodbyindicatingthefirm’ssourcesandusesofcashduringthatperiod.
•Cashflowstatementisgovernedbythecashsystemofaccounting. •Thebasicaimofcashflowanalysisistodeterminewhattransactions
causedthecashbalancetochangeduringaparticularperiod. •Cashflowstatementisgovernedbythecashsystemofaccounting. •Todeterminecashflow,thenon-currentaccountsi.e.,fixedassetsand
long term liabilitiesareanalyzedasbefore,andchanges incurrentaccountsexceptcasharealsoanalyzed.
•Thechangeincashcanbecomputedbyanalyzingchangethatoccurredinallnon-currentandcurrentaccountsexceptcash.
•Themajorsourceofcashforabusinessiscashfromtradingoperations. •Acashflowstatementisavitalanalyticaltoolinthehandoffinancial
managerthathelpshiminthepropermanagementofcash. •Acomparativeanalysisofthefirm’scashflowstatementsenablesa
financialmanagertoassesstheliquiditypositionofthefirm.
Cash Flow Statement and Analysis
NOTES
Self-Instructional 134 Material
•Acarefulstudyofcashflowstatementprovidesanswertosometypicalquestionslikewhycashpositionoftheconcernistight,inspiteofhighincomesorvice-versa.
5.6 KEY WORDS
•Cash flow statement: It is a statementwhich provides a detailedexplanationforthechangeinafirm’scashduringaparticularperiodbyindicatingthefirm’ssourcesandusesofcashduringthatperiod.
•Cash inflow:Itreferstoabusinesstransactionthatgeneratescash. •Cash outflow:Itreferstoabusinesstransactionthatutilizescash. •Mercantile system of accounting:Alsoknownasaccrual system,
under this system, the transactions (revenuesandexpenditures)arerecordedwhentheyoccurortakeplaceratherthanwhentheactualcashareexchanged.
5.7 SELF ASSESSMENT QUESTIONS AND EXERCISES
Short-Answer Questions
1.Whatis“CashFlow”?Discusstheobjectivesofcashflowanalysis. 2.Statethedifferencebetweenfundsflowandcashflowstatement. 3.Explaintheprocedureofpreparingacashflowstatement. 4.Mentionthemajorsourcesandapplicationofcashwithexamples. 5.Whatistheutilityofpreparingcashflowstatement?
Long-Answer Questions
1.Writeshortnoteson: (a)Notionalcashand (b)Non-cashitems. 2.Discusstheproceduresofascertainingcashfromoperationasrequired
forthepreparationofacashflowstatement. 3.FollowingarethecomparativebalancesheetsofIQRALtd.
Liabilities 2011(`)
2012(`)
Assets 2011(`)
2012(`)
Sharecapital 1,80,000 1,90,000 Cash 60,000 40,000Sundrycreditors 64,000 76,000 Sundrydebtors 1,55,000 1,90,000ProfitandlossA/c 29,000 35,600 Landandbuilding 50,000 62,000
Patentrights 8,000 9,0002,73,000 3,01,000 2,73,000 3,01,000
PrepareaCashFlowStatement.
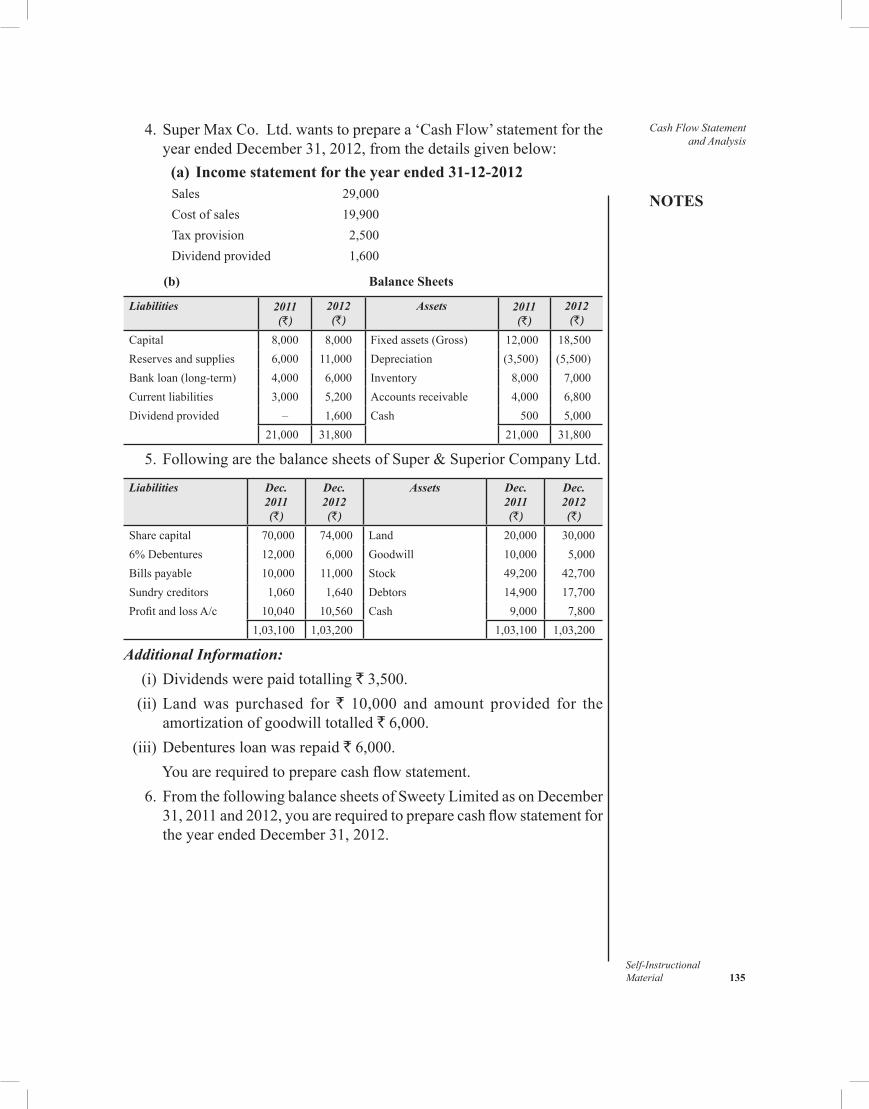
NOTES
Self-InstructionalMaterial 135
Cash Flow Statement and Analysis
4.SuperMaxCo.Ltd.wantstopreparea‘CashFlow’statementfortheyearendedDecember31,2012,fromthedetailsgivenbelow:
(a) Income statement for the year ended 31-12-2012Sales 29,000
Cost of sales 19,900
Tax provision 2,500
Dividend provided 1,600
(b) Balance Sheets
Liabilities 2011(`)
2012(`)
Assets 2011(`)
2012(`)
Capital 8,000 8,000 Fixedassets(Gross) 12,000 18,500Reservesandsupplies 6,000 11,000 Depreciation (3,500) (5,500)Bankloan(long-term) 4,000 6,000 Inventory 8,000 7,000Currentliabilities 3,000 5,200 Accountsreceivable 4,000 6,800Dividendprovided – 1,600 Cash 500 5,000
21,000 31,800 21,000 31,800
5.FollowingarethebalancesheetsofSuper&SuperiorCompanyLtd.
Liabilities Dec. 2011(`)
Dec. 2012(`)
Assets Dec. 2011(`)
Dec. 2012(`)
Sharecapital 70,000 74,000 Land 20,000 30,0006%Debentures 12,000 6,000 Goodwill 10,000 5,000Billspayable 10,000 11,000 Stock 49,200 42,700Sundrycreditors 1,060 1,640 Debtors 14,900 17,700ProfitandlossA/c 10,040 10,560 Cash 9,000 7,800
1,03,100 1,03,200 1,03,100 1,03,200
Additional Information: (i)Dividendswerepaidtotalling`3,500. (ii)Landwas purchased for` 10,000 and amount provided for the
amortizationofgoodwilltotalled`6,000. (iii)Debenturesloanwasrepaid`6,000.
Youarerequiredtopreparecashflowstatement. 6.FromthefollowingbalancesheetsofSweetyLimitedasonDecember
31,2011and2012,youarerequiredtopreparecashflowstatementfortheyearendedDecember31,2012.
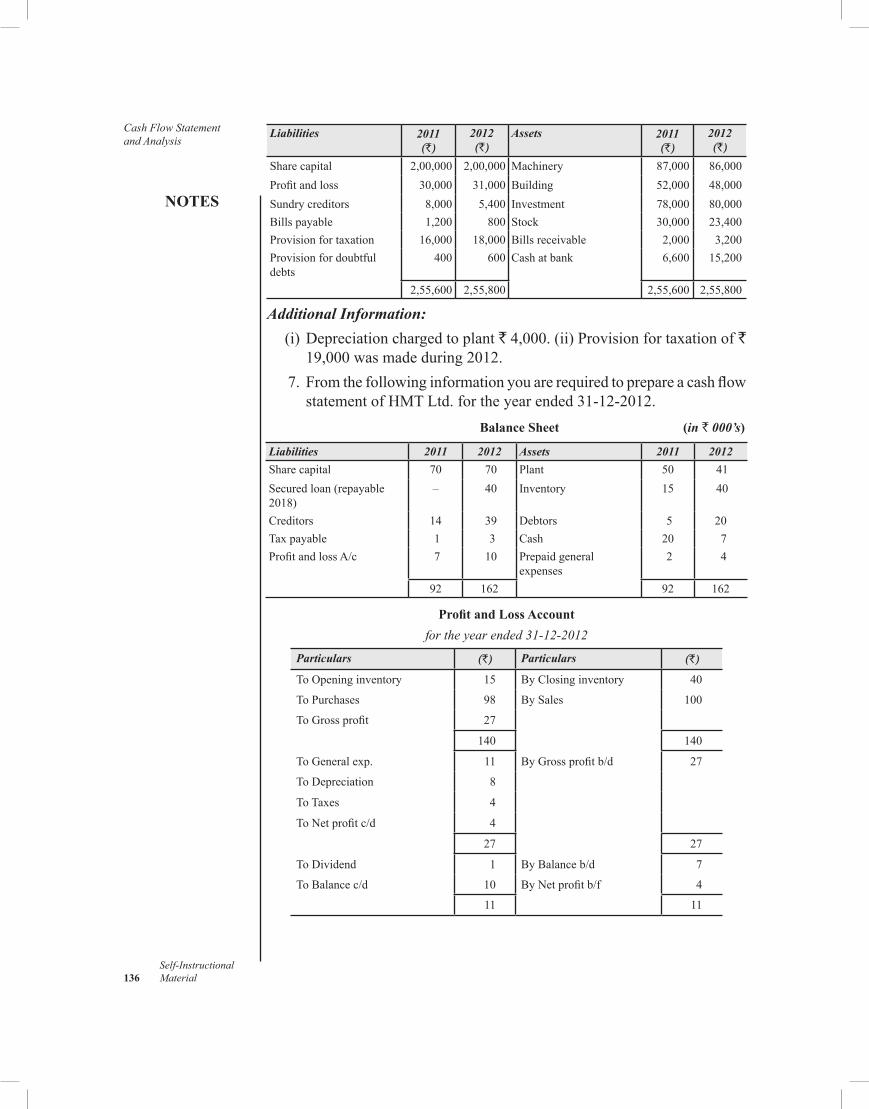
Cash Flow Statement and Analysis
NOTES
Self-Instructional 136 Material
Liabilities 2011(`)
2012(`)
Assets 2011(`)
2012(`)
Sharecapital 2,00,000 2,00,000 Machinery 87,000 86,000Profitandloss 30,000 31,000 Building 52,000 48,000Sundry creditors 8,000 5,400 Investment 78,000 80,000Billspayable 1,200 800 Stock 30,000 23,400Provisionfortaxation 16,000 18,000 Billsreceivable 2,000 3,200Provisionfordoubtfuldebts
400 600 Cashatbank 6,600 15,200
2,55,600 2,55,800 2,55,600 2,55,800
Additional Information: (i)Depreciationchargedtoplant`4,000.(ii)Provisionfortaxationof`
19,000wasmadeduring2012. 7.Fromthefollowinginformationyouarerequiredtoprepareacashflow
statementofHMTLtd.fortheyearended31-12-2012. Balance Sheet (in ` 000’s)
Liabilities 2011 2012 Assets 2011 2012Sharecapital 70 70 Plant 50 41Securedloan(repayable2018)
– 40 Inventory 15 40
Creditors 14 39 Debtors 5 20Taxpayable 1 3 Cash 20 7ProfitandlossA/c 7 10 Prepaidgeneral
expenses 2 4
92 162 92 162
Profit and Loss Accountfor the year ended 31-12-2012
Particulars (`) Particulars (`)
To Opening inventory 15 ByClosinginventory 40
ToPurchases 98 BySales 100
ToGrossprofit 27
140 140
ToGeneralexp. 11 ByGrossprofitb/d 27
To Depreciation 8
ToTaxes 4
ToNetprofitc/d 4
27 27
To Dividend 1 ByBalanceb/d 7
ToBalancec/d 10 ByNetprofitb/f 4
11 11
NOTES
Self-InstructionalMaterial 137
Cash Flow Statement and Analysis5.8 FURTHER READINGS
Sahaf,M.A.2013.Management Accounting: Principles and Practice,3rdedition.NewDelhi:VikasPublishingHouse.
Arora,M.N.2012.A textbook of Cost and Management Accounting,10thedition.NewDelhi:VikasPublishingHouse.
Maheshwari,S.N.,SuneelK.andSharadK.2018.A Textbook of Accounting for Management,4thedition.NewDelhi:VikasPublishingHouse.
Budget and Budgetary Control
NOTES
Self-Instructional 138 Material
UNIT 6 BUDGET AND BUDGETARY CONTROL
Structure 6.0 Introduction 6.1 Objectives 6.2 BudgetandBudgetaryControl:Meaning
6.2.1 AdvantagesandLimitationsofBudgetaryControl 6.2.2 EssentialCharacteristicsofaGoodBudgetaryControl
6.3 ClassificationandPreparationofBudgets 6.3.1 SalesBudget 6.3.2 ProductionBudget 6.3.3 ProductionCostPurchaseandOverheadsBudget 6.3.4 CashBudget
6.4 AnswerstoCheckYourProgressQuestions 6.5 Summary 6.6 Key Words 6.7 SelfAssessmentQuestionsandExercises 6.8 FurtherReadings
6.0 INTRODUCTION
Budgetarycontrolplaysasignificantroleinsustainingtheefficiencyofafirmasithelpsittoachieveitsgoalsataminimumcost.Budgetarycontrolas an effectivemanagement tool for planning and coordinating variousbusinessactivitieshelpsexecutivestoanticipatetheinfluenceandimpactofagivensetofeventsonthefirms’businessandtheirresources.Toserveasaneffectivetoolformanagerialcontrol,budgetarycontrolatthesametimeprovidesaproperyardstickfortheevaluationofactualperformance.Someauthorsbelievethatbudgetsservemoreeffectivelyasaplanningtoolthanacontrollingdevice.However,firmsneedtobringflexibilityintheirbudgetstomakethemworkasacontroldevice.Infact,budgetshelporganizationstoattaintheirobjectivesbyprovidingthefeedbacknecessaryformakingchangesintheplansinachangingbusinessenvironment.
6.1 OBJECTIVES
Aftergoingthroughthisunit,youwillbeableto: • ExplainthemeaningofBudget • DiscussthemeaningandadvantagesofBudgetarycontrol • Describethepreparationofsales,production,productioncost,purchase,
overheadcost,cashandflexiblebudgets
NOTES
Self-InstructionalMaterial 139
Budget and Budgetary Control6.2 BUDGET AND BUDGETARY CONTROL:
MEANING
Budget is generally recognized as a plan of action to be pursued by anorganizationduringadefinedperiodoftimeinordertoachieveitsobjectives.Itisastatementofanticipatedresultsexpressedeitherinfinancialornon-financialterms.AccordingtoWilliamson(2003)A budget is a formal plan of action expressed in monetary and other quantitative terms.GordonandShillinglow(1974)state,Budget is a pre-determined detailed plan of action developed and distributed as a guide to current operations and as a partial basis for the subsequent evaluation of performance.
CIMA(1991)defines A budget is a financial or quantitative statement prepared prior to a definite period of time of the policy to be pursued during that for the purpose of attaining a given objective.
Sizer (1979) explains Budgets are financial and/or quantitative statements prepared and approved prior to a defined period of time of the policy to be pursued during that period for the purpose of attaining given objective.
To the author of this book,a budget is a detailed schedule of the proposed combinations of the various factors of production which the management deems to be the most profitable for the defined period. It may be a forecast of sales, production costs, distribution costs, and administrative and financial expenses–and, therefore, of profit or loss. It serves as a road mapforexecutivesandmakesthemawarewhenthecompanyisstrayingfromitsplannedroute.
Concept Of Budgetary Control
Commercialorganizationsalwaysaimtoattainthehighestvolumeofsalesattheminimumcostinordertomaximizetheirprofits.Toattainthisobjective,organizationsneedtorealizethatplanningandcontrolofactivitiesbecomeessential absolutely. It is, in fact, the systemof budgetary control thatprovidestheorganizationswiththeframeworkwhichhelpsthemtoachievethisobjective.
Budgetarycontrolisasystematicprocessdesignedtoplanandcontrolthemajoractivitiesofafirm’sbusinessthroughbudgetspreparedinadvancewithanobjectivetoensureeffectiveuseofresources.InthewordsofBatty(1978),Budgetary control is a system which uses budgets as a means of planning and controlling all aspects of producing and/or selling commodities or services.AccordingtoScott(1970),it is the system of management control and accounting in which all operations are precasted and so far as possible planned ahead and the actual results compared with the forecasted and planned ones.
Budget and Budgetary Control
NOTES
Self-Instructional 140 Material
CIMA(1991) definesbudgetarycontrolas,theestablishmentofbudgetsrelatingtotheresponsibilitiesofexecutivestotherequirementsofapolicyand the continuous comparisonof actualwithbudgeted results, either tosecurebyindividualactiontheobjectiveofthatpolicyortoprovideabasisfor its revision.
In theopinionofBrownandHoward (1975),Budgetary control is a system of controlling costs which includes the preparation of budgets, coordinating the departments and establishing responsibilities, comparing actual performance with the budgeted and acting upon results to achieve maximum profitability.
Totheauthorofthisbook,budgetary control is a process of managing an organization in accordance with an approved budget in order to keep total expenditure within authorized limits. It is designed to assist the management in deciding the future course of action and to develop the basis for evaluating the efficiency of operations.Thus,a budgetarycontrolconsistsof: •Preparationofbudgetsformajoractivitiesofthebusiness; •Measurementandcomparisonofactualresultswithbudgetedtargets; •Computationofdeviation,ifany;and •Revisionofbudget,ifrequired.
Thus, budgetary control requires preparation and designing of thebudgets revealing clearly the financial responsibilities of executives inrelationtotherequirementsoftheoverallpolicyofthecompanyfollowedbyacontinuouscomparisonofactualbusinessresultswithbudgetedresultstosecuretheobjectivesofthepolicy.Iftheprinciplesofbudgetingarecarriedoutinapropermanner,thecompanycanbeassuredthatitwillefficientlyuseallofitsresourcesandachievethemostfavourableresultspossibleinthelongrun.
Objectives of Budgetary Control
Themainobjectivesofbudgetarycontrolareasunder: •Toprovideuseful,accurateandreliableinformationtoenablemanagers
formulatefuturebusinesspolicies •Tohelptheorganizationsinexercisingcontrolovercostsbypreparing
separatebudgetsforeachdepartmentToevaluatetheresultsofvariouspoliciesandfacilitatesupervisionoverthevariousfactorsofproduction
•Toeliminatethedangerofovercapitalizationandundercapitalizationbydeterminingthetotalcapitalrequirementsofabusinessfirmwiththehelpofproductionbudgetandworkingcapitalestimates
•To locate deficiencies in production systemby preparing separateproductioncapableofascertainingtheefficiencyofproduction
NOTES
Self-InstructionalMaterial 141
Budget and Budgetary Control
•Topromoteresearchanddevelopmentactivitiesofanorganizationasbudgetarycontrolpoliciesandprogrammesareusuallybasedonpastexperience
6.2.1 Advantages and Limitations of Budgetary Control
Budgetarycontrolisperhapsthemostusefultoolusedbythemanagementforplanningandcontrollingmajoractivitiesofthebusiness.However,thesystemofbudgetarycontrolinitselfdoesnotensuregoodplanningorcontrolbutithelpsexecutivestoplanaheadandexercisecontroloverpeopleandoperatingevents.Infact,suchasystemnotonlyprovidesinformationonprobable future business results but also the resources likemoney,men,materialsandfacilitiesrequiredtoachievesuchresults.Themostnotablebenefitsderivedfromthesystemofbudgetarycontrolareasfollows: •Through itsdisciplinedapproach, itcoordinates theplanningofall
functionalexecutivestowardsthecommonprofitmakinggoal. •Motivates executives to think ahead by impressing upon them to
formalizetheirplanningefforts. •Providesmanagersanopportunityforself-evaluationbyofferingthem
goalsandobjectivesagainstwhichtheycanevaluatetheirperformancewithoutanydifficulty.Suchanarrangementmakeseachmemberofthe organization clear about his role and contribution in attainingorganizationalgoals.
•Enables an organization to predetermine the benefits and costs ofthe projects under various alternativeoperating conditions.Such acomparativeanalysishelpsittoevaluatethemostappropriateallocationof resources.
• Providesaframework thatspecifiesmeasurableperiodicobjectivesforeachphaseofplanning.
•Helpsmanagerstoidentifyexpectedoperationproblemsfrombusinessactivitiesbutalsoprovidesthemthebasisforsolvingtheseproblemsoravoidingthembeforetheyoccur.
•Makeemployeesoftheorganizationconsciousoftheneedstoconservebusiness resources.
•Maximizebenefitsofdecentralization. •Makesitobligatoryfortheenterprisetomaintainadequatefinancial
recordsthatcanbeassociatedwiththebudget. •Servesasanexcellentvehicleandeffectivecommunicationsystemfor
theexchangeofideasandcoordinationofplansamongvariouslevelsof management.
•Revealsbudgetspreparedforefficientandeffectiveuseofresources.
Budget and Budgetary Control
NOTES
Self-Instructional 142 Material
• Increasesparticipationofemployeesinthepreparationandexecutionofbudgets therebyboosting themoraleamong themwhich in turncontributestotheoutput.
•Helpsacompanymeetmarketcompetitionefficientlybykeepingthecostattheminimumlevel.
Limitations of Budgetary Control
Despitethebenefitsmentionedearlier,budgetarycontrolsuffersfromseriouslimitations.Managementmustkeepsuchlimitationsinmindwhileusingthetoolofbudgetarycontrol.Themajorlimitationsofbudgetarycontrolsystemaresummarizedbelow: •Since budget estimates are based on approximations and personal
judgements,therefore,theyarealwaysdoubtful.Infact,thequalityofbudgetsisalwaysassociatedwiththeintelligence,skillsandexperienceofthebudgetpersons.
•Thepremisesofthebudgetarycontrolsystemchangerapidlywiththechangeinbusinessconditions.Asaresult,businessexecutivesfacealotofdifficultiesintheexecutionofbudgets.
•Thesuccessofbudgetarycontrollargelydependsonitsexecutionwhichinturndependsonthecooperationandparticipationofalllevelsofmanagement.Everymemberoftheorganizationmustdirecthiseffortstoachievetheobjectivesofthebudget.Anylapseintheircoordinationorcooperationmayresultinpoorperformance.
•The installation of budgetary control system is a costly affair, andtherefore,smallorganizationsmaynotaffordit.Evenfinanciallysoundenterprisesmustadoptthissystemonlyafteranalysingproperlyitscostandbenefits.
•Budget targets sometimes are considered as pressure tacticswhichlowerthemoraleoftheemployees.
•Theformulationofthebudgetsisatime-consumingprocessasagoodamountoftimeiswastedintheirpreparation,evaluationandrevision.
•There isanoldsaying to theeffect that ‘aman isusuallydownorwhatheisn’tupon’.Oftenexecutivesdonotrealizetheutilityofthebudgetarycontrolsystem.
•Underbudgetarycontrolsystemeverybudgetcentretriestoachieveitsobjectiveswithouttakingintoconsiderationtheobjectivesofotherbudgetcentresandoverallobjectivesofthebudgetarycontrolsystem.Thiscreatesconflictamongvariousunitsoftheorganizationwhichultimatelyinterruptstheefficiencyofthesystem.
NOTES
Self-InstructionalMaterial 143
Budget and Budgetary Control
6.2.2 Essential Characteristics of a Good Budgetary Control
Agoodbudgetarycontrolmustpossessthefollowingcharacteristics: •Theremustbeacommonauthoritytoenjoytherightsandprivilegesas
wellastofulfiltheobligation.Actualusersmustbeconsultedbeforeactuallyallocatingdifferentresources.
•Thesupervisorystaffmustbeheldresponsibleforallthefunctionsofthebusinessandproperutilizationofalltheresourcesofthebusiness.
• Independenceofactionmustbeensuredfortheadministrationinthosemattersforwhichtheyareaccountable.Insuchmatters,theymustbeconsultedandtheirviewsshouldbegivendueweightage.
•Onewhogivesordersmustalsoprovidefacilitiesfortheexecutionofthoseorders.
•Theremustbetestcheckingoftheworkatregularintervalsandtheresultsmust be comparedwith the targets. Shortcomingsmust beascertainedandmeasuresshouldbesuggestedtoovercomethem.
•Theremustbesomesystemforrewardingbetterresultsandpenalizingpoorresults.Incentivesforbetterworkmustbeprovided.Inefficiencymust not be condoned.
Requirements for Budgetary Control
Theprerequisites for goodbudgetary control are essentially the same asforsoundbusinessmanagement.Foreffectivebudgetarycontrol,thefirmsneed to: • developthestatementofobjectivesandpoliciestoguidemanagement
inreachingitsbusinessgoals; • build up a sound plan for the organizationwith clearly defined
responsibilitiesandauthoritiesforeachmanagementandsupervisoryposition;
• establish a clear understandingof cost behaviour andproduct coststructure;
• developaplanofoperationsoveragivenperiodoftimetoachieveobjectivesefficientlyandeffectively;
• provideformeasurementofperformancethroughtimelycomparativecontrolreports;
• takenecessaryactionintheexecutionofplanstosetrightunsatisfactoryperformance;
• revisethebudgetswhenrequired.
Budget and Budgetary Control
NOTES
Self-Instructional 144 Material
Theconceptofbudgetarycontrolformalizestheprocessimpliedintheserequirementsbyincorporatingtheabovestepsintoacomprehensivefinancialplanorbudget.Itshouldbeobviousthatthefinancialplanorbudgetisnotjustaforecastorasummaryofthebusinessresultsayearahead.Itisinsteadaplanofoperation.Theplanmustbebasedongoodoperatingpracticesandsoundlyconceivedmanagementstrategy.Itshouldhaveacertainextentofflexibility,a‘stretch’init.Thismeansthatoperatingmenshouldincorporateinthebudgetperformance,goalsthatareattainablebyhardworkanddedicatedeffort.Aneasytestofwhetherornotabusinessbudgethasbeenbuiltongoodplanningandcontrolconceptistocheckthesepoints: •Sales and production requirements should be defined in terms of
quantitiesbyproducts. •The variable and total costs of producing each product should be
identifiedonapredeterminedbasisinthebudget. •Budgetedcostsandexpensesshouldbestatedforeachresponsibility
centre. •Thedegreeofcapacityutilizationofmajorequipmentsandfacilities
shouldbeclearlydefinedinthebudgetplan. •Alldepartmentalbudgets shouldbebasedon thesamevolumesof
productandservicerequirementsandshouldmeetanacceptableprofitgoal.Ifanorganization’sbudgetarycontrolsystemdoesnotmeetthesetests,
functionalexecutiveneedtodiscussthelapseswiththebudgetpersonneltoseekimprovementsinthesystem.
Check Your Progress
1.How does budgetary control eliminate the danger of overcapitalizationandundercapitalization?
2.Whyisitsaidthatbudgetarycontrolsystemmayultimatelyinterrupttheefficiencyofthesystem?
6.3 CLASSIFICATION AND PREPARATION OF BUDGETS
Differentauthoritieshavegivendifferentclassificationsofbudgets.Someclassify themon the basis of functions involved, period covered, natureof transactionswhile others classify them according to activity levels.Accordingly,thefollowingclassificationsaregiven:Budgetsaccordingtoactivitylevels: •Fixedbudget •Flexiblebudget
NOTES
Self-InstructionalMaterial 145
Budget and Budgetary Control
Classificationonthebasisofnatureoftransactions: •Operatingbudget •CapitalbudgetPeriodclassification: •Long-termbudget •Short-termbudgetFunctionalclassification: •Masterbudget •Subsidiarybudget
However,classificationonthebasisoffunctionsismorepopularandcommonalmostineverybusinessconcern.
Fixed Budget
Althoughthisapproachtobudgetingisnotpopularamongthefirmsyetafewfirmsdousefixedbudget in certain areasof expensesmanagement.Generallyfixedbudgetisreferredtoaspredeterminedcostsprojectedataparticularcapacitylevel.Thatis,oncecapacityisprojectedataparticularlevel,theindividualdepartmentgathersandclassifiestheircostsatthatlevel.Thebudgetthuspreparedisknownasafixedbudget.Suchbudgetsassumethattheamountofrupeesshowninthebudgetistriggeredbythepassageof time irrespective of production levels or the volume of activity.TheCIMA(1991)definedfixedbudgetasabudgetwhichisdesignedtoremainunchangedirrespectiveofthelevelofactivityactuallyattained.InthewordsofWilson(1975) a fixed budget is one that is compiled for a given set of assumed operating conditions and for a clearly specified but estimated level of activity, and which management proposes to leave unchanged during the period to which it relates—regardless of changes in the actual level of activity experienced or in the conditions facing the company during that period.Thus,fixedbudgetisaplanthatexpressesonlyonelevelofestimatedactivityorvolume.Suchabudgetisalsoknownasstaticbudget.Theterm‘fixedbudget’isprobablyamisnomerbecausethisbudgetreallyisneverfixed.Businessandeconomicconditionsconstantlychangeandthemanagementhastoreviewandchangethebudgetsinthelightofthosechanges.
Flexible Budget
Firmsthatrecognizethetendencyoffixedoverheadtovarywithsubstantialchangesinproductionprefertouseaflexiblebudget.Thisissimplyaseriesof fixed budgets that apply to varying levels of production.AccordingtoCIMA(1991),aflexiblebudget isa budget which, by recognizing the difference between fixed, semi-fixed and variable costs, is designed to change in relation to the level of activity attained.Thus,aflexiblebudgetisaseries
Budget and Budgetary Control
NOTES
Self-Instructional 146 Material
ofcostbudgets,eachpreparedforadifferentlevelofcapacity.Thecapacitylevelsaresetatpercentagesofcapacityorattheproductionofaspecifiednumberofunitsatsetlevelsofcapacity.Infact,costsarebrokendownintofixed,variable,andsemi-variableundervariouslevelsofcapacity.Althoughflexible budgets generally donot distinguish betweenvariable andfixedoverheadyettheyprovideasinglerateforbothtypesofoverheads.Thisrateisestablishedbydividingestimatedoverheadatthenormalproductionlevelbythenormalvolumeofproduction.
Flexible budgeting can be incorporated in one of twoways—step budget,whereinbudgetsaredevelopedfordifferentlevelsofoperation,orvariable budget,wherebudgetsarepreparedonavariablecostbasisprovidingprogressivelygreaterbudgetallowancesasthevolumeofactivityincreases.Businessexecutivespreferthetechniqueofflexiblebudgetingasitcanbeeasilyunderstoodby thesupervisorsatall levelsandwithalldegreesofeducationbecauseoftherealisticwayinwhichsuchbudgetsaccommodateactualoperatingconditionsintheplant.Themajorsignificanceofflexiblebudgetingisthatitprovidescompletelyrealisticbudgetamounts.Thereareverylesschancesforvariances,whichtoocanbetheresultof inefficientcontrolorchangesinoperatingconditions.Illustration 6.1: ThecostdetailsobtainedfromfinancialrecordsofSafaLtd.,forproductionof500unitsaregivenbelow:
Particulars Per Unit (`)
Material 40Labour 30Variableoverhead 12Sellinganddistributionexpenses(20percentfixed) 10Administrativeexpenses(40percentvariable) 15Fixedoverheads(`7,500) 15Sellingcostperunit 122
Youarerequiredtoprepareabudgetforproductionof:(i) 700units;and (ii) 900units.
SolutionSafa Ltd.
Flexible Budget
OUTPUT500 Units 700 Units 900 Units
PerUnit
Amount(`)
PerUnit
Amount(`)
PerUnit
Amount(`)
Material 40 20,000 10 28,000 40 36,000Labour 30 15,000 30 21,000 30 27,000Variableoverhead 12 6,000 12 8,400 12 10,800Selling&distribution
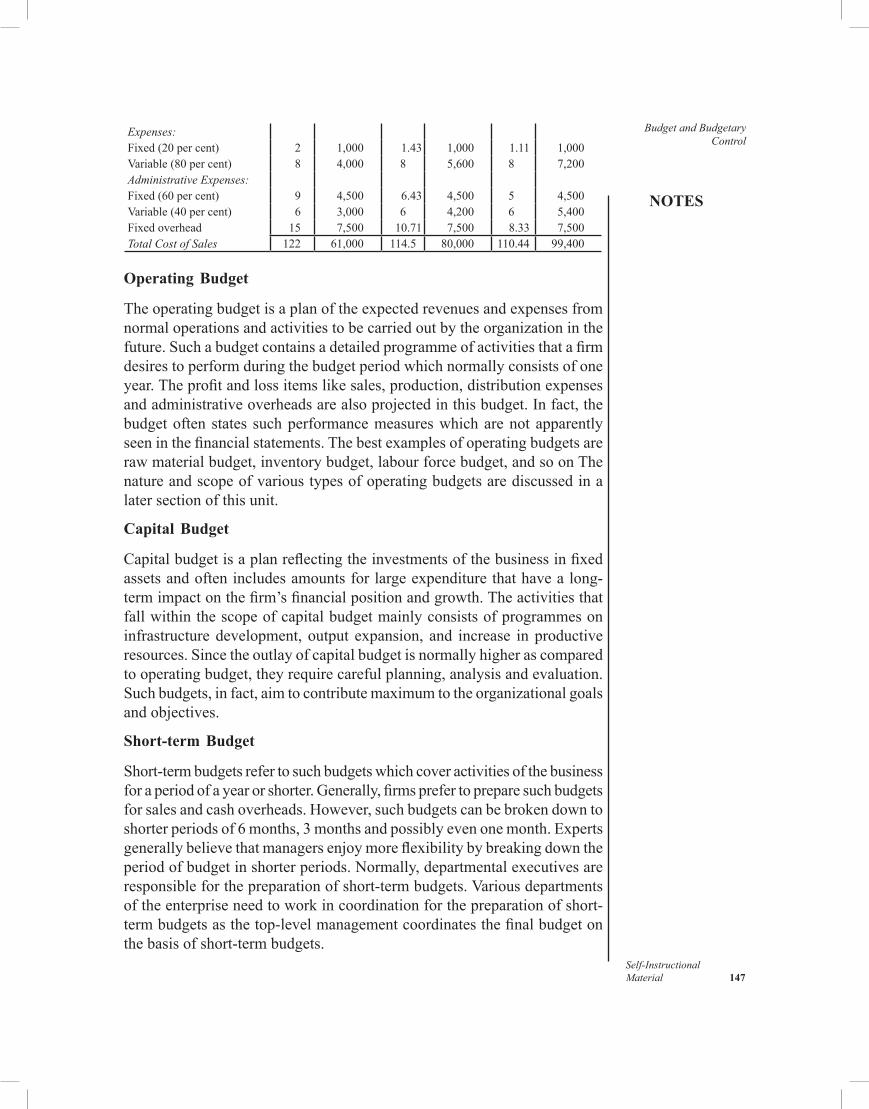
NOTES
Self-InstructionalMaterial 147
Budget and Budgetary Control
Expenses:Fixed(20percent) 2 1,000 1.43 1,000 1.11 1,000Variable(80percent) 8 4,000 8 5,600 8 7,200Administrative Expenses:Fixed(60percent) 9 4,500 6.43 4,500 5 4,500Variable(40percent) 6 3,000 6 4,200 6 5,400Fixedoverhead 15 7,500 10.71 7,500 8.33 7,500Total Cost of Sales 122 61,000 114.5 80,000 110.44 99,400
Operating Budget
Theoperatingbudgetisaplanoftheexpectedrevenuesandexpensesfromnormaloperationsandactivitiestobecarriedoutbytheorganizationinthefuture.Suchabudgetcontainsadetailedprogrammeofactivitiesthatafirmdesirestoperformduringthebudgetperiodwhichnormallyconsistsofoneyear.Theprofitandlossitemslikesales,production,distributionexpensesandadministrativeoverheadsarealsoprojectedinthisbudget.Infact,thebudgetoften states suchperformancemeasureswhicharenotapparentlyseeninthefinancialstatements.Thebestexamplesofoperatingbudgetsarerawmaterialbudget,inventorybudget,labourforcebudget,andsoonThenature and scope of various types of operating budgets are discussed in a latersectionofthisunit.
Capital Budget
Capitalbudgetisaplanreflectingtheinvestmentsofthebusinessinfixedassetsandoftenincludesamountsforlargeexpenditurethathavealong-termimpactonthefirm’sfinancialpositionandgrowth.Theactivitiesthatfallwithinthescopeofcapitalbudgetmainlyconsistsofprogrammesoninfrastructuredevelopment, output expansion, and increase inproductiveresources.Sincetheoutlayofcapitalbudgetisnormallyhigherascomparedtooperatingbudget,theyrequirecarefulplanning,analysisandevaluation.Suchbudgets,infact,aimtocontributemaximumtotheorganizationalgoalsand objectives.
Short-term Budget
Short-termbudgetsrefertosuchbudgetswhichcoveractivitiesofthebusinessforaperiodofayearorshorter.Generally,firmsprefertopreparesuchbudgetsforsalesandcashoverheads.However,suchbudgetscanbebrokendowntoshorterperiodsof6months,3monthsandpossiblyevenonemonth.Expertsgenerallybelievethatmanagersenjoymoreflexibilitybybreakingdowntheperiodofbudgetinshorterperiods.Normally,departmentalexecutivesareresponsibleforthepreparationofshort-termbudgets.Variousdepartmentsoftheenterpriseneedtoworkincoordinationforthepreparationofshort-termbudgetsasthetop-levelmanagementcoordinatesthefinalbudgetonthebasisofshort-termbudgets.
Budget and Budgetary Control
NOTES
Self-Instructional 148 Material
Long-term Budget
Tomeetthedemandsofgrowingbusinessandcompetition,firmsneedtomovebeyond theshort-rangeplan to lookaheadformore thanoneyear.Long-termbudgetsmaycoverperiodsof one, three,five and evenmoreyearsdependinguponthenatureofthebusiness.AccordingtotheNationalAssociationofAccountants,America,along-termbudgetisa systematic and formalized process for purposeful directing and controlling future operations towards a desired objective for periods extending beyond one year.Theresponsibilityforthepreparationoflong-termbudgetsgenerallyrestswithtop-levelmanagement.Thetop-levelmanagementisgenerallyresponsibleforstrategicdecisionsconcernedwithgrowthandprosperityofbusiness.Sincethepreparationofsuchabudgetdemandsthestudyofbothinternalfactorsaswellasexternalfactorslikeindustrycompetition,economicgrowth,socialandculturalchange,and technologicaldevelopment, it calls for strategiccapabilitiesonthepartofmanagement.
Master Budget
Themasterbudgetsetsoutafirm’splanfortheoperationsandresourcesexpressedinfinancialtermsforagivenperiod.Itisasummaryofthebudgetschedulesincapsuleformmadeforthepurposeofpresentinginonereportthehighlightsof thebudgetperiod.TheCIMA(1991), defines itas,The summary budget, incorporating its component functional budgets which is finally approved, adopted and employed.
Davidsonandothers state,The master budget, sometimes called the comprehensive budget is a complete blueprint of the planned operations of the firm for a period.
Thus,themasterbudgetisanoverallbudgetofafirmwhichincludesall other small departmental budgets. It is network consisting ofmanyseparatebudgetsthatareinterdependent.Infact,themasterbudgetcontainsconsolidated summary of all the budgets prepared by the organization.Suchabudgetcoordinatesvariousactivitiesofthebusiness,directingthemtowardsacommongoal.Fewtopexecutivesofthebusinessaresuppliedwithcopiesofmasterbudgets.Suchabudgetisofnousetodepartmentalexecutives.Itdrawstheattentionofthemanagementtothoseissueswhichmustrequireimmediateattentionorwhichmustbeavoidedwithoutanydelaysintheinterestofthebusiness.Preparation of a Master Budget: Itisacomplexprocessthatrequiresmuchtimeandeffortbythemanagementatalllevels.Itincludesthepreparationofaprojectedprofitandlossaccount(incomestatement)andprojectedbalancesheet.Thepreparationofmasterbudgetinvolvesthepreparationof: • salesbudget; • productioncostbudget;
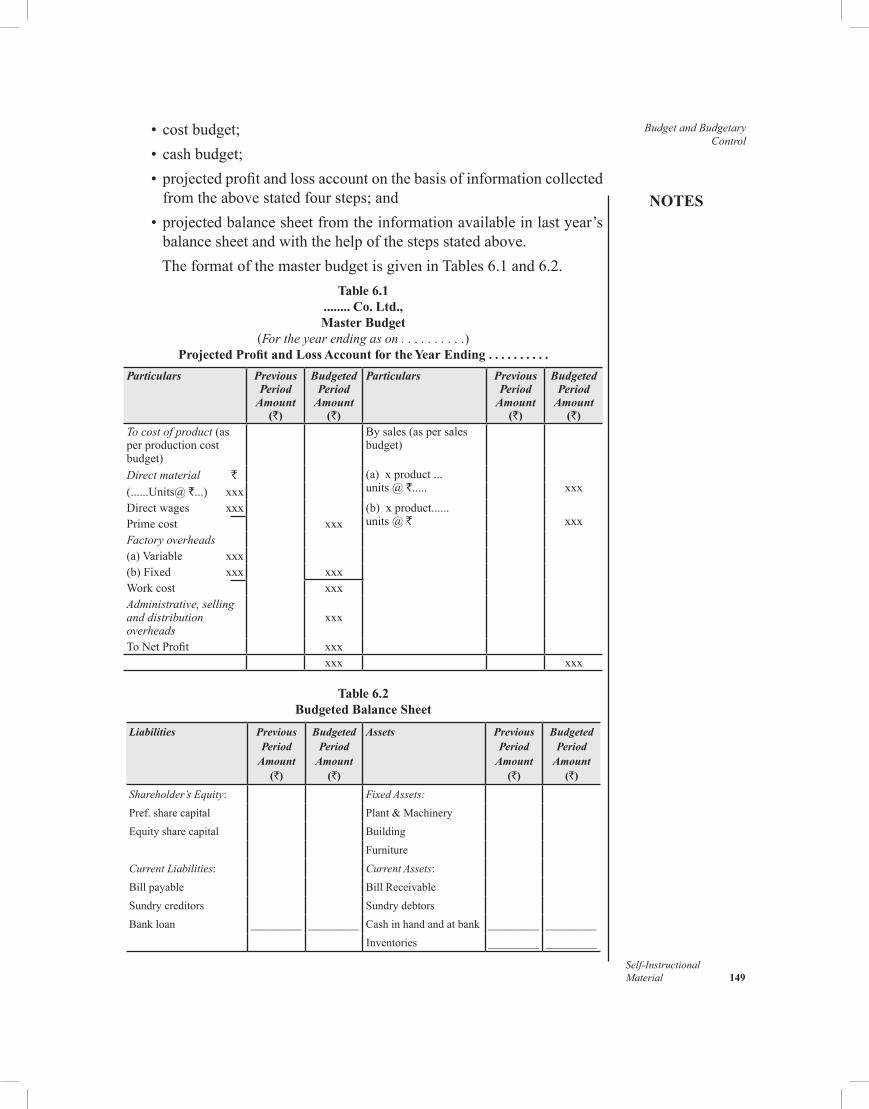
NOTES
Self-InstructionalMaterial 149
Budget and Budgetary Control
• costbudget; • cashbudget; • projectedprofitandlossaccountonthebasisofinformationcollected
fromtheabovestatedfoursteps;and • projectedbalancesheetfromtheinformationavailableinlastyear’s
balancesheetandwiththehelpofthestepsstatedabove.TheformatofthemasterbudgetisgiveninTables6.1and6.2.
Table 6.1........ Co. Ltd.,Master Budget
(For the year ending as on . . . . . . . . . .)Projected Profit and Loss Account for the Year Ending . . . . . . . . . .
Particulars Previous Period
Amount (`)
Budgeted Period
Amount (`)
Particulars Previous Period
Amount (`)
Budgeted Period
Amount (`)
To cost of product (as per production cost budget)
Bysales(aspersalesbudget)
Direct material ` (a) xproduct...units@`.....
xxx(......Units@`...) xxx
Directwages xxx (b) xproduct......units@`
xxxPrimecost xxx
Factory overheads(a)Variable xxx(b)Fixed xxx xxxWorkcost xxxAdministrative, selling and distribution overheads
xxx
ToNetProfit xxxxxx xxx
Table 6.2Budgeted Balance Sheet
Liabilities Previous Period
Amount (`)
Budgeted Period
Amount (`)
Assets Previous Period
Amount (`)
Budgeted Period
Amount (`)
Shareholder’s Equity: Fixed Assets:
Pref.sharecapital Plant&MachineryEquitysharecapital Building
FurnitureCurrent Liabilities: Current Assets:Billpayable BillReceivableSundry creditors Sundry debtorsBankloan _________ _________ Cashinhandandatbank _________ _________
Inventories _________ _________
Budget and Budgetary Control
NOTES
Self-Instructional 150 Material
Subsidiary Budget
Subsidiarybudgetsare thosebudgetswhichshowincomeorexpenditureappropriatetoortheresponsibilityofaparticularactivityofthebusiness.Theyarepreparedonthebasisoftheguidelinesframedbythemasterbudget.Theremaybedifferentkindsofsubsidiarybudgetsdependingonthesize,natureandpolicyoftheconcernbutthefollowingarefrequentlyprepared: • salesbudget • productionbudget • productioncostbudget •materialsbudget • labourbudget •manufacturingoverheadbudget • expensesbudget • plantbudget • cashbudget.
6.3.1 Sales Budget
Itisanestimateoffuturesalesexpressedinquantitiesand/ormoney.Suchabudget,infact,callsforprojectionofafirm’ssalesonaperiodicbasis.Thepreparationofaneffectivesalesbudgetdemandsthestudyofbothinternalandexternalfactors.Theinternalfactorstobeconsideredforthepurposearepastactivity,presentandprojectedplantcapacity,proposedmanagementpolicies,financialposition, sales force size, availabilityofmaterials, andpromotionalcampaign.Theexternalfactorsthatmustbeanalysedtoenablemanagerspreparesalesbudgetincludeextentofcompetition,governmentpoliciesandregulations,economicconditionsofthecountryandgeneraltradeprospectus.Themanagementshouldconstantlyreviewtheabove-mentionedfactorsinordertofindoutthequantumofchangeinthemanditsimpactonproduct demand.
Generally,salesbudgetisrecognizedasthekeybudgetthatleadstothepreparationofallotherfunctionalbudgets.Thesuccessofanycommercialenterpriselargelydependsuponthequickturnoverofitsproduction.Againstthisbackground,everycompanywantstomaximizeitssales.However,themaximizationofsaleshasalwaysremainedacomplexproblemthatrequiresproperattentionfromthemanagement.Everyeffortmustbemadetoachievesalestargets.Thesalesbudgetcanbebrokendownby: • productlines • geographicterritories • timespan • typesofcustomers.
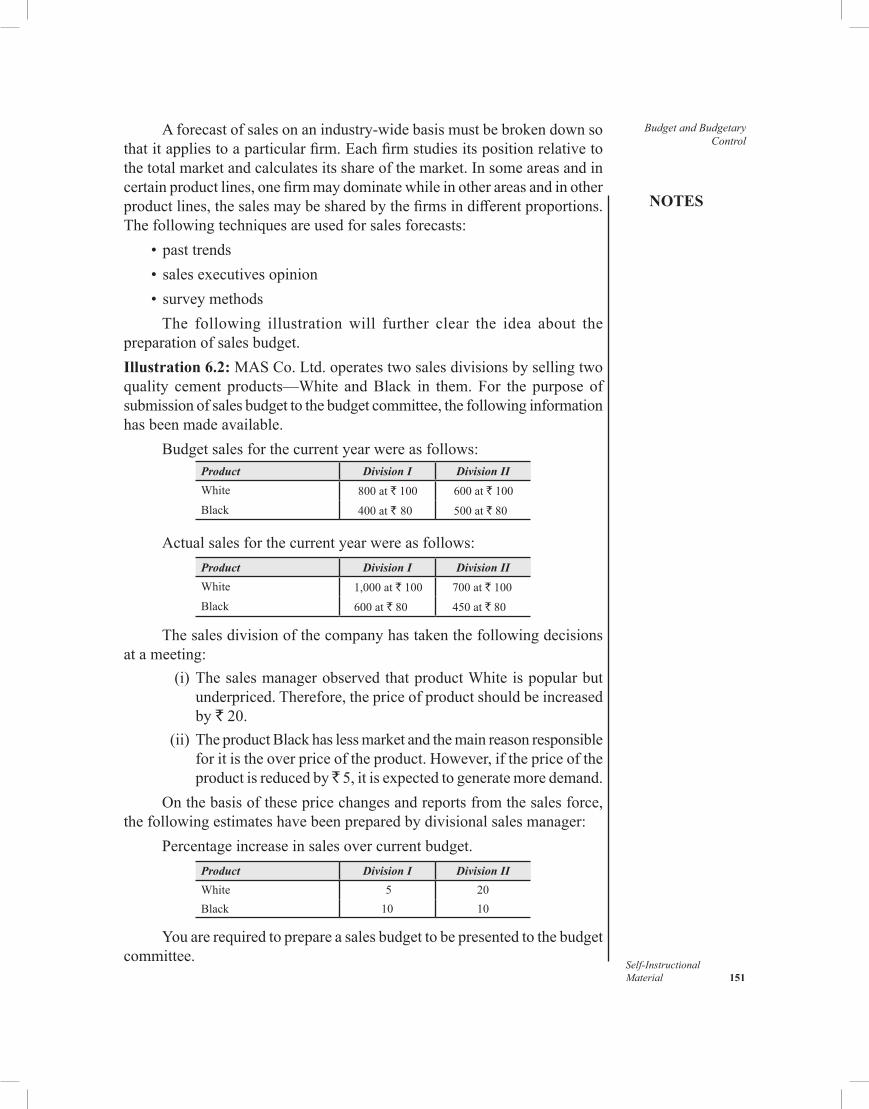
NOTES
Self-InstructionalMaterial 151
Budget and Budgetary Control
Aforecastofsalesonanindustry-widebasismustbebrokendownsothatitappliestoaparticularfirm.Eachfirmstudiesitspositionrelativetothetotalmarketandcalculatesitsshareofthemarket.Insomeareasandincertainproductlines,onefirmmaydominatewhileinotherareasandinotherproductlines,thesalesmaybesharedbythefirmsindifferentproportions.Thefollowingtechniquesareusedforsalesforecasts: • pasttrends • salesexecutivesopinion • surveymethods
The following illustrationwill further clear the idea about thepreparationofsalesbudget.Illustration 6.2:MASCo.Ltd.operatestwosalesdivisionsbysellingtwoquality cement products—White andBlack in them.For the purpose ofsubmissionofsalesbudgettothebudgetcommittee,thefollowinginformationhasbeenmadeavailable.
Budgetsalesforthecurrentyearwereasfollows:Product Division I Division II
White 800 at ` 100 600 at ` 100Black 400 at ` 80 500 at ` 80
Actualsalesforthecurrentyearwereasfollows:Product Division I Division II
White 1,000at` 100 700 at ` 100Black 600 at ` 80 450 at ` 80
Thesalesdivisionofthecompanyhastakenthefollowingdecisionsat a meeting: (i)ThesalesmanagerobservedthatproductWhiteispopularbut
underpriced.Therefore,thepriceofproductshouldbeincreasedby ` 20.
(ii)TheproductBlackhaslessmarketandthemainreasonresponsibleforitistheoverpriceoftheproduct.However,ifthepriceoftheproduct is reduced by 5,itisexpectedtogeneratemoredemand.
Onthebasisofthesepricechangesandreportsfromthesalesforce,thefollowingestimateshavebeenpreparedbydivisionalsalesmanager:
Percentageincreaseinsalesovercurrentbudget.Product Division I Division II
White 5 20Black 10 10
Youarerequiredtoprepareasalesbudgettobepresentedtothebudgetcommittee.
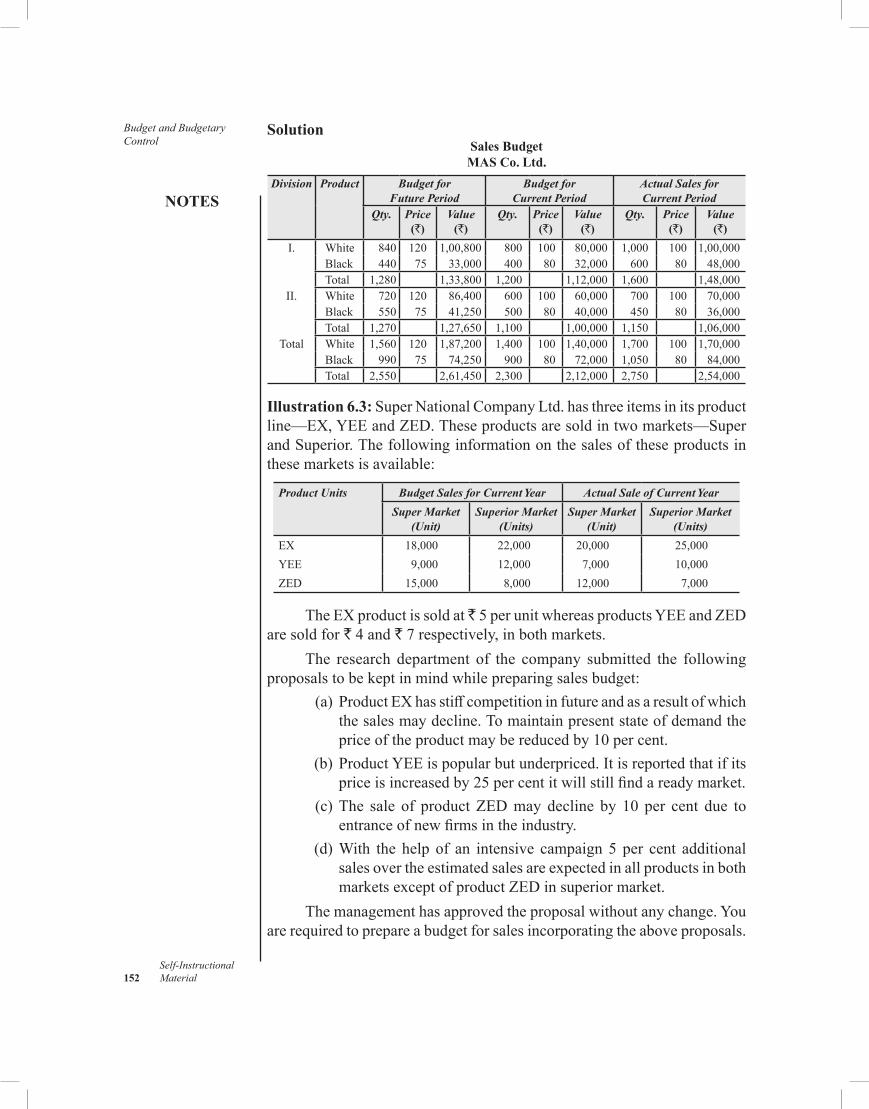
Budget and Budgetary Control
NOTES
Self-Instructional 152 Material
SolutionSales BudgetMAS Co. Ltd.
Division Product Budget for Future Period
Budget for Current Period
Actual Sales for Current Period
Qty. Price(`)
Value(`)
Qty. Price(`)
Value(`)
Qty. Price(`)
Value(`)
I. White 840 120 1,00,800 800 100 80,000 1,000 100 1,00,000Black 440 75 33,000 400 80 32,000 600 80 48,000Total 1,280 1,33,800 1,200 1,12,000 1,600 1,48,000
II. White 720 120 86,400 600 100 60,000 700 100 70,000Black 550 75 41,250 500 80 40,000 450 80 36,000Total 1,270 1,27,650 1,100 1,00,000 1,150 1,06,000
Total White 1,560 120 1,87,200 1,400 100 1,40,000 1,700 100 1,70,000Black 990 75 74,250 900 80 72,000 1,050 80 84,000Total 2,550 2,61,450 2,300 2,12,000 2,750 2,54,000
Illustration 6.3:SuperNationalCompanyLtd.hasthreeitemsinitsproductline—EX,YEEandZED.Theseproductsaresoldintwomarkets—SuperandSuperior.Thefollowinginformationonthesalesoftheseproductsinthesemarketsisavailable:
Product Units Budget Sales for Current Year Actual Sale of Current Year
Super Market (Unit)
Superior Market (Units)
Super Market (Unit)
Superior Market (Units)
EX 18,000 22,000 20,000 25,000YEE 9,000 12,000 7,000 10,000ZED 15,000 8,000 12,000 7,000
TheEXproductissoldat 5perunitwhereasproductsYEEandZEDaresoldfor` 4 and `7respectively,inbothmarkets.
The research department of the company submitted the followingproposalstobekeptinmindwhilepreparingsalesbudget: (a)ProductEXhasstiffcompetitioninfutureandasaresultofwhich
thesalesmaydecline.Tomaintainpresentstateofdemandthepriceoftheproductmaybereducedby10percent.
(b)ProductYEEispopularbutunderpriced.Itisreportedthatifitspriceisincreasedby25percentitwillstillfindareadymarket.
(c)The sale of productZEDmaydecline by 10 per cent due toentranceofnewfirmsintheindustry.
(d)With the help of an intensive campaign5 per cent additionalsalesovertheestimatedsalesareexpectedinallproductsinbothmarketsexceptofproductZEDinsuperiormarket.
Themanagementhasapprovedtheproposalwithoutanychange.Youarerequiredtoprepareabudgetforsalesincorporatingtheaboveproposals.
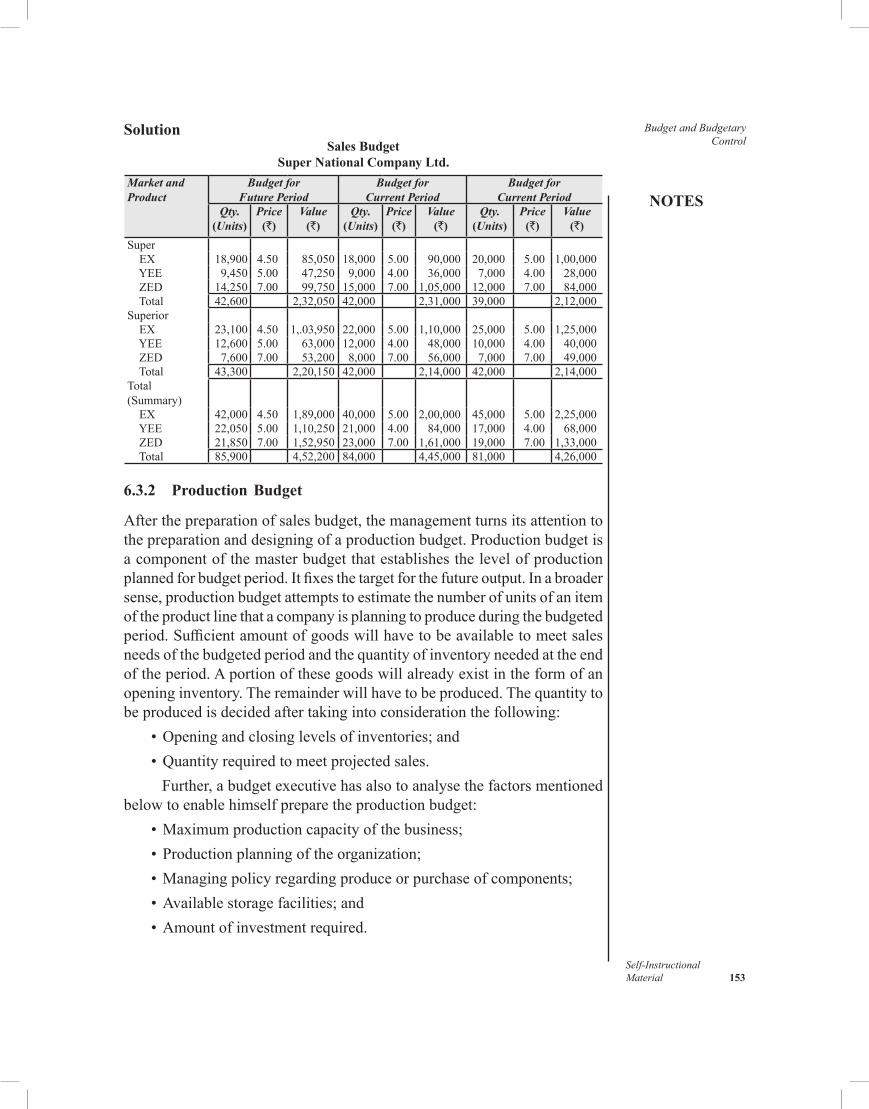
NOTES
Self-InstructionalMaterial 153
Budget and Budgetary Control
SolutionSales Budget
Super National Company Ltd.
Market and Product
Budget for Future Period
Budget for Current Period
Budget for Current Period
Qty. (Units)
Price(`)
Value(`)
Qty. (Units)
Price(`)
Value(`)
Qty. (Units)
Price(`)
Value(`)
Super EX 18,900 4.50 85,050 18,000 5.00 90,000 20,000 5.00 1,00,000 YEE 9,450 5.00 47,250 9,000 4.00 36,000 7,000 4.00 28,000 ZED 14,250 7.00 99,750 15,000 7.00 1,05,000 12,000 7.00 84,000 Total 42,600 2,32,050 42,000 2,31,000 39,000 2,12,000Superior EX 23,100 4.50 1,.03,950 22,000 5.00 1,10,000 25,000 5.00 1,25,000 YEE 12,600 5.00 63,000 12,000 4.00 48,000 10,000 4.00 40,000 ZED 7,600 7.00 53,200 8,000 7.00 56,000 7,000 7.00 49,000 Total 43,300 2,20,150 42,000 2,14,000 42,000 2,14,000Total(Summary) EX 42,000 4.50 1,89,000 40,000 5.00 2,00,000 45,000 5.00 2,25,000 YEE 22,050 5.00 1,10,250 21,000 4.00 84,000 17,000 4.00 68,000 ZED 21,850 7.00 1,52,950 23,000 7.00 1,61,000 19,000 7.00 1,33,000 Total 85,900 4,52,200 84,000 4,45,000 81,000 4,26,000
6.3.2 Production Budget
Afterthepreparationofsalesbudget,themanagementturnsitsattentiontothepreparationanddesigningofaproductionbudget.Productionbudgetisacomponentofthemasterbudgetthatestablishesthelevelofproductionplannedforbudgetperiod.Itfixesthetargetforthefutureoutput.Inabroadersense,productionbudgetattemptstoestimatethenumberofunitsofanitemoftheproductlinethatacompanyisplanningtoproduceduringthebudgetedperiod.Sufficientamountofgoodswillhavetobeavailabletomeetsalesneedsofthebudgetedperiodandthequantityofinventoryneededattheendoftheperiod.Aportionofthesegoodswillalreadyexistintheformofanopeninginventory.Theremainderwillhavetobeproduced.Thequantitytobeproducedisdecidedaftertakingintoconsiderationthefollowing: •Openingandclosinglevelsofinventories;and •Quantityrequiredtomeetprojectedsales.
Further,abudgetexecutivehasalsotoanalysethefactorsmentionedbelowtoenablehimselfpreparetheproductionbudget: •Maximumproductioncapacityofthebusiness; •Productionplanningoftheorganization; •Managingpolicyregardingproduceorpurchaseofcomponents; •Availablestoragefacilities;and •Amountofinvestmentrequired.
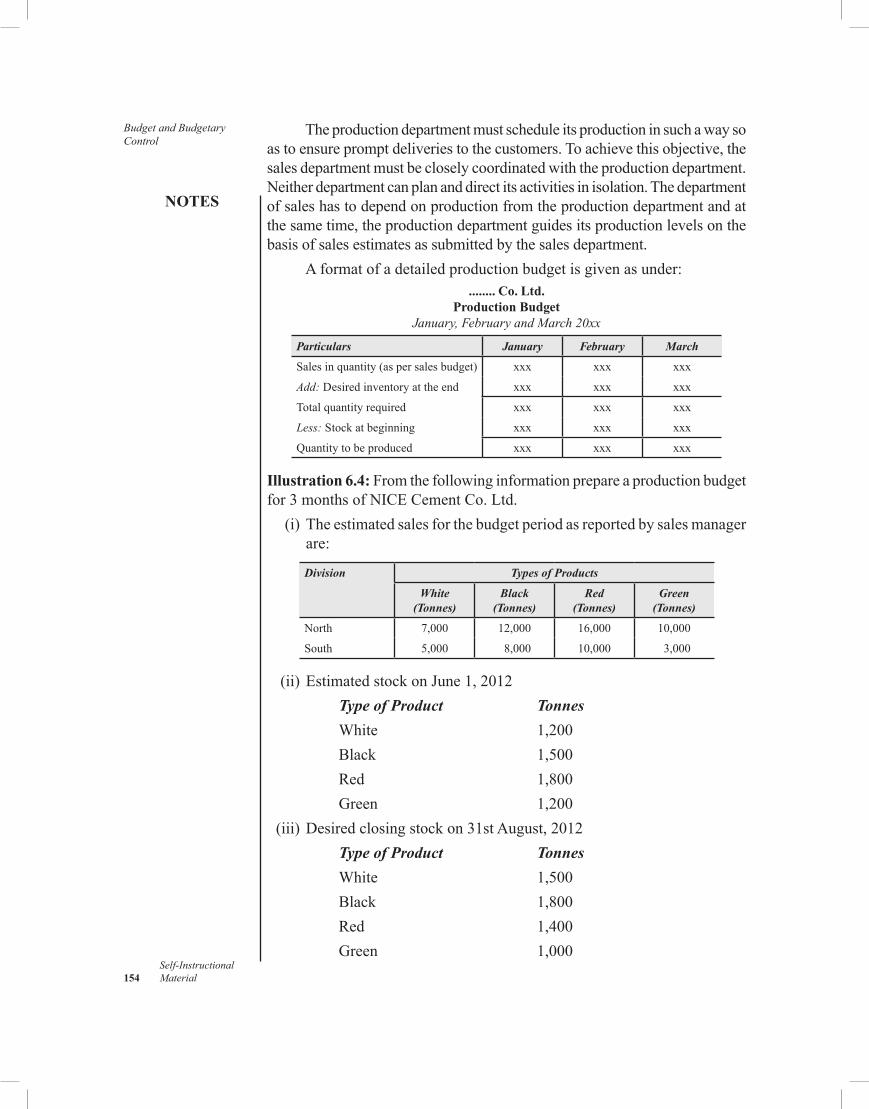
Budget and Budgetary Control
NOTES
Self-Instructional 154 Material
Theproductiondepartmentmustscheduleitsproductioninsuchawaysoastoensurepromptdeliveriestothecustomers.Toachievethisobjective,thesalesdepartmentmustbecloselycoordinatedwiththeproductiondepartment.Neitherdepartmentcanplananddirectitsactivitiesinisolation.Thedepartmentofsaleshastodependonproductionfromtheproductiondepartmentandatthesametime,theproductiondepartmentguidesitsproductionlevelsonthebasisofsalesestimatesassubmittedbythesalesdepartment.
Aformatofadetailedproductionbudgetisgivenasunder:........ Co. Ltd.
Production BudgetJanuary, February and March 20xx
Particulars January February March
Salesinquantity(aspersalesbudget) xxx xxx xxx
Add: Desiredinventoryattheend xxx xxx xxx
Totalquantityrequired xxx xxx xxx
Less: Stockatbeginning xxx xxx xxx
Quantitytobeproduced xxx xxx xxx
Illustration 6.4: Fromthefollowinginformationprepareaproductionbudgetfor3monthsofNICECementCo.Ltd. (i)Theestimatedsalesforthebudgetperiodasreportedbysalesmanager
are:
Division Types of Products
White(Tonnes)
Black(Tonnes)
Red(Tonnes)
Green(Tonnes)
North 7,000 12,000 16,000 10,000
South 5,000 8,000 10,000 3,000
(ii)EstimatedstockonJune1,2012 Type of Product Tonnes
White 1,200 Black 1,500 Red 1,800 Green 1,200 (iii)Desiredclosingstockon31stAugust,2012 Type of Product Tonnes
White 1,500 Black 1,800 Red 1,400 Green 1,000
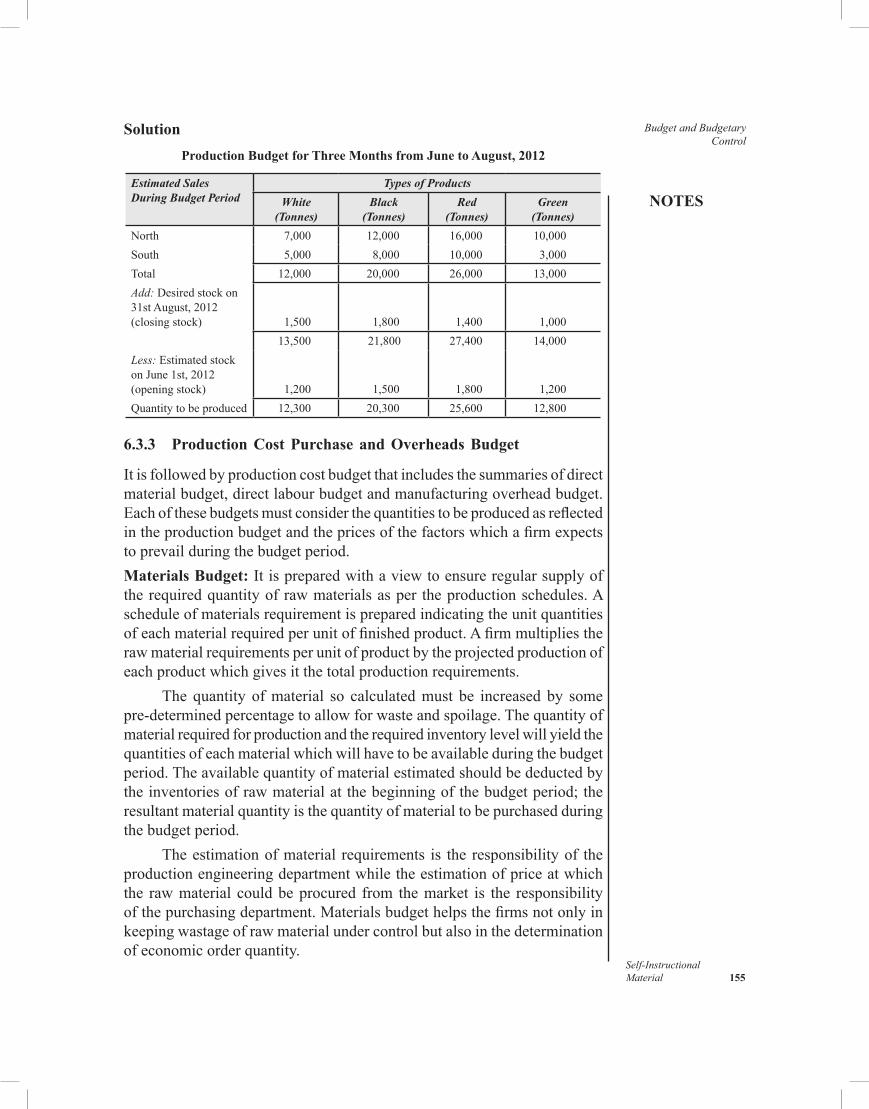
NOTES
Self-InstructionalMaterial 155
Budget and Budgetary Control
SolutionProduction Budget for Three Months from June to August, 2012
Estimated Sales During Budget Period
Types of Products
White(Tonnes)
Black(Tonnes)
Red(Tonnes)
Green(Tonnes)
North 7,000 12,000 16,000 10,000South 5,000 8,000 10,000 3,000Total 12,000 20,000 26,000 13,000Add:Desiredstockon31stAugust,2012(closingstock)
1,500
1,800
1,400
1,00013,500 21,800 27,400 14,000
Less:EstimatedstockonJune1st,2012(openingstock)
1,200
1,500
1,800
1,200Quantitytobeproduced 12,300 20,300 25,600 12,800
6.3.3 Production Cost Purchase and Overheads Budget
Itisfollowedbyproductioncostbudgetthatincludesthesummariesofdirectmaterialbudget,directlabourbudgetandmanufacturingoverheadbudget.Eachofthesebudgetsmustconsiderthequantitiestobeproducedasreflectedintheproductionbudgetandthepricesofthefactorswhichafirmexpectstoprevailduringthebudgetperiod.Materials Budget: Itispreparedwithaviewtoensureregularsupplyoftherequiredquantityofrawmaterialsasper theproductionschedules.Ascheduleofmaterialsrequirementispreparedindicatingtheunitquantitiesofeachmaterialrequiredperunitoffinishedproduct.Afirmmultipliestherawmaterialrequirementsperunitofproductbytheprojectedproductionofeachproductwhichgivesitthetotalproductionrequirements.
The quantity ofmaterial so calculatedmust be increased by somepre-determinedpercentagetoallowforwasteandspoilage.Thequantityofmaterialrequiredforproductionandtherequiredinventorylevelwillyieldthequantitiesofeachmaterialwhichwillhavetobeavailableduringthebudgetperiod.Theavailablequantityofmaterialestimatedshouldbedeductedbytheinventoriesofrawmaterialatthebeginningofthebudgetperiod;theresultantmaterialquantityisthequantityofmaterialtobepurchasedduringthebudgetperiod.
Theestimationofmaterial requirements is the responsibilityof theproductionengineeringdepartmentwhiletheestimationofpriceatwhichthe rawmaterial couldbeprocured from themarket is the responsibilityofthepurchasingdepartment.Materialsbudgethelpsthefirmsnotonlyinkeepingwastageofrawmaterialundercontrolbutalsointhedeterminationofeconomicorderquantity.
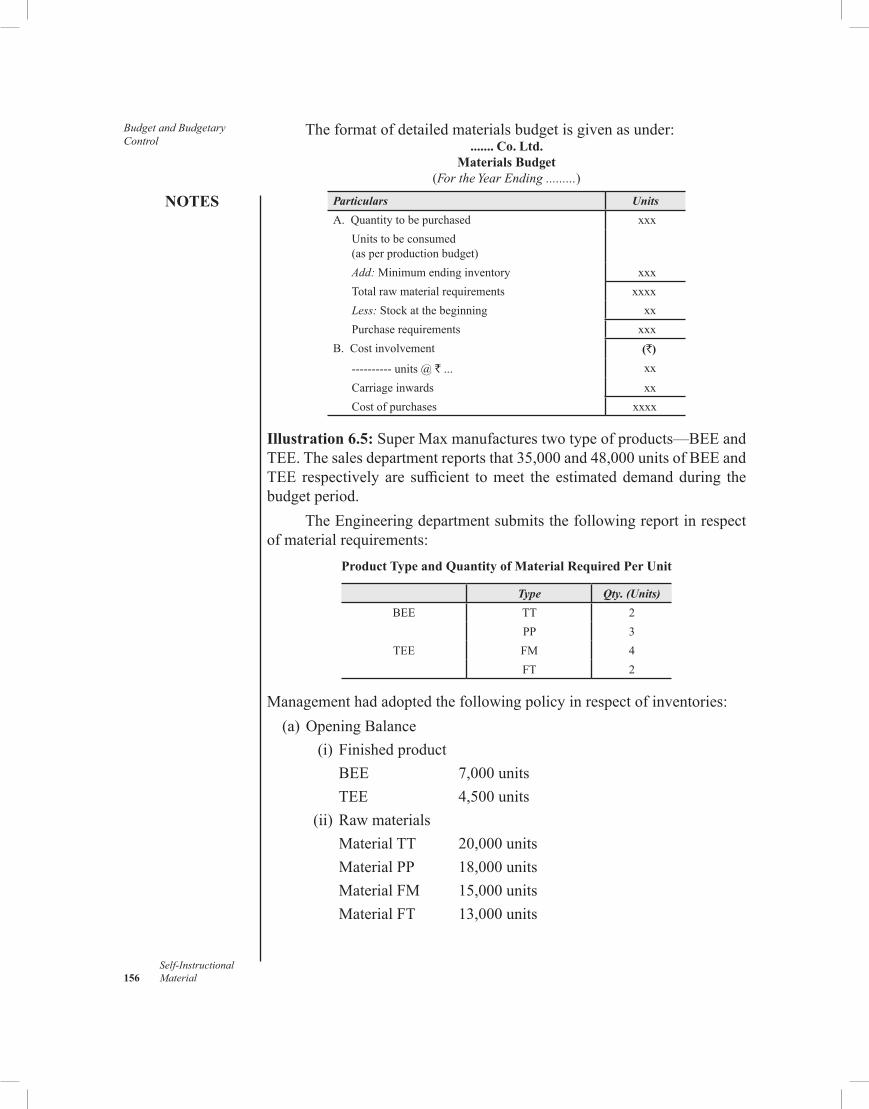
Budget and Budgetary Control
NOTES
Self-Instructional 156 Material
Theformatofdetailedmaterialsbudgetisgivenasunder:....... Co. Ltd.
Materials Budget(For the Year Ending .........)
Particulars Units
A. Quantitytobepurchased xxxUnitstobeconsumed(asperproductionbudget)Add: Minimum ending inventory xxxTotalrawmaterialrequirements xxxxLess:Stockatthebeginning xxPurchaserequirements xxx
B. Costinvolvement (`)
----------units@` ... xxCarriageinwards xxCostofpurchases xxxx
Illustration 6.5: SuperMaxmanufacturestwotypeofproducts—BEEandTEE.Thesalesdepartmentreportsthat35,000and48,000unitsofBEEandTEE respectively are sufficient tomeet the estimateddemandduring thebudget period.
TheEngineeringdepartmentsubmitsthefollowingreportinrespectofmaterialrequirements:
Product Type and Quantity of Material Required Per Unit
Type Qty. (Units)
BEE TT 2PP 3
TEE FM 4FT 2
Managementhadadoptedthefollowingpolicyinrespectofinventories: (a)OpeningBalance (i)Finishedproduct BEE 7,000units TEE 4,500units (ii)Rawmaterials MaterialTT 20,000units MaterialPP 18,000units MaterialFM 15,000units MaterialFT 13,000units
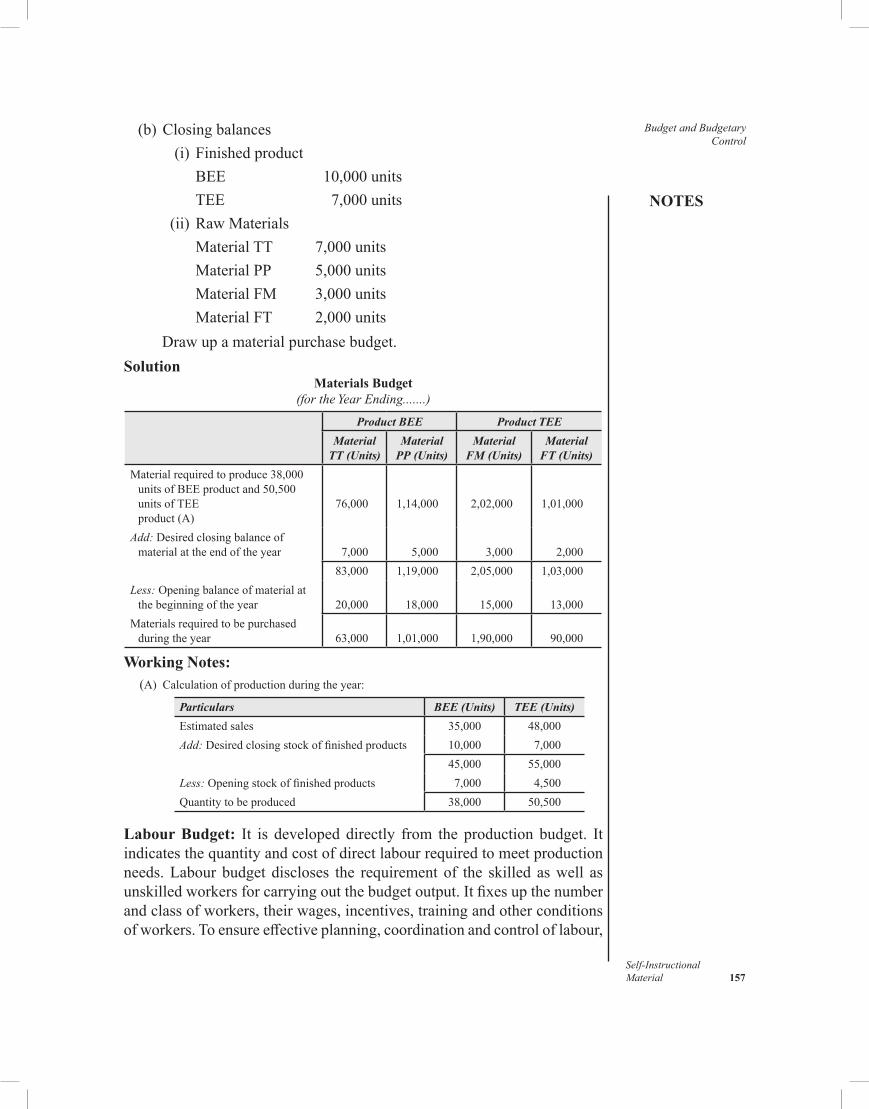
NOTES
Self-InstructionalMaterial 157
Budget and Budgetary Control
(b)Closingbalances (i)Finishedproduct BEE 10,000units TEE 7,000units (ii)RawMaterials MaterialTT 7,000units MaterialPP 5,000units MaterialFM 3,000units MaterialFT 2,000units
Drawupamaterialpurchasebudget.Solution
Materials Budget(for the Year Ending.......)
Product BEE Product TEE
Material TT (Units)
Material PP (Units)
Material FM (Units)
Material FT (Units)
Materialrequiredtoproduce38,000unitsofBEEproductand50,500unitsofTEE product(A)
76,000
1,14,000
2,02,000
1,01,000
Add:Desiredclosingbalanceofmaterialattheendoftheyear 7,000 5,000 3,000 2,000
83,000 1,19,000 2,05,000 1,03,000Less:Openingbalanceofmaterialatthebeginningoftheyear 20,000 18,000 15,000 13,000
Materialsrequiredtobepurchasedduringtheyear 63,000 1,01,000 1,90,000 90,000
Working Notes: (A) Calculationofproductionduringtheyear:
Particulars BEE (Units) TEE (Units)
Estimatedsales 35,000 48,000Add:Desiredclosingstockoffinishedproducts 10,000 7,000
45,000 55,000Less:Openingstockoffinishedproducts 7,000 4,500Quantitytobeproduced 38,000 50,500
Labour Budget: It is developeddirectly from the production budget. Itindicatesthequantityandcostofdirectlabourrequiredtomeetproductionneeds.Labourbudget discloses the requirementof the skilled aswell asunskilledworkersforcarryingoutthebudgetoutput.Itfixesupthenumberandclassofworkers,theirwages,incentives,trainingandotherconditionsofworkers.Toensureeffectiveplanning,coordinationandcontroloflabour,
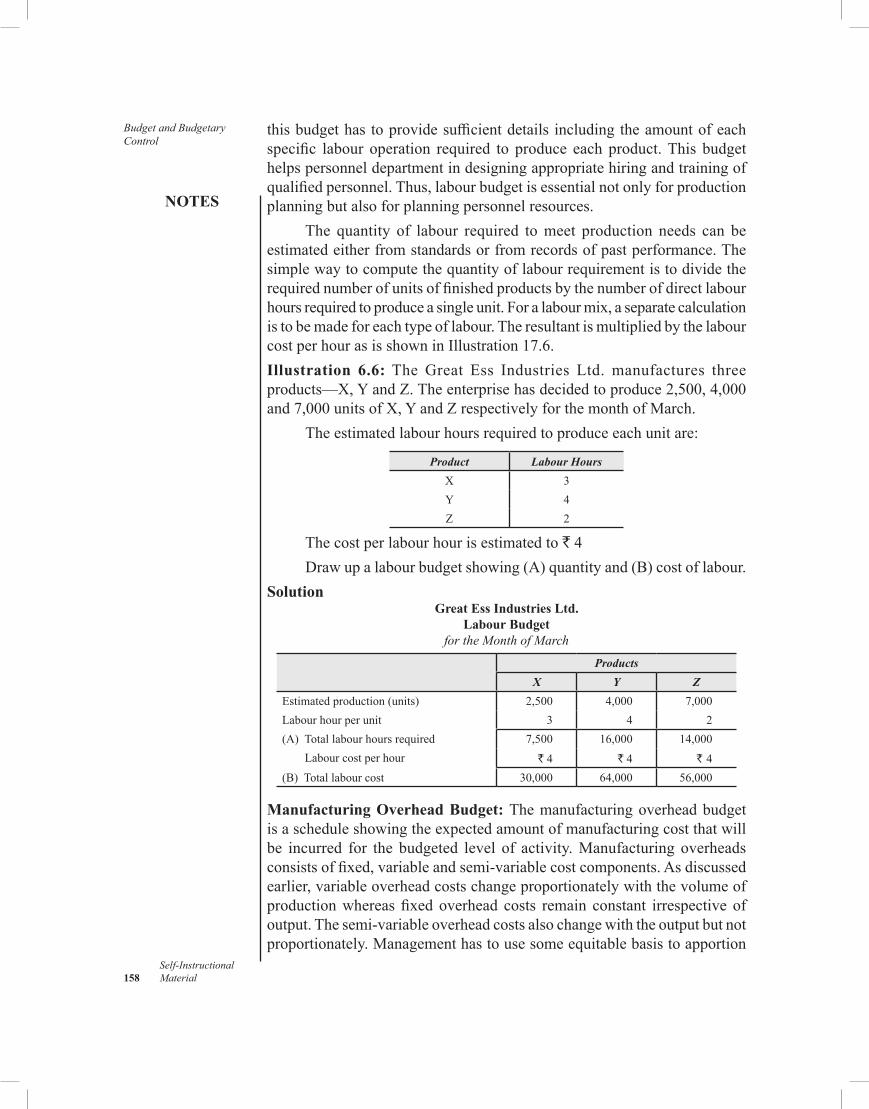
Budget and Budgetary Control
NOTES
Self-Instructional 158 Material
thisbudgethastoprovidesufficientdetails includingtheamountofeachspecific labour operation required to produce each product.This budgethelpspersonneldepartmentindesigningappropriatehiringandtrainingofqualifiedpersonnel.Thus,labourbudgetisessentialnotonlyforproductionplanningbutalsoforplanningpersonnelresources.
The quantity of labour required tomeet production needs can beestimatedeitherfromstandardsorfromrecordsofpastperformance.Thesimplewaytocomputethequantityoflabourrequirementistodividetherequirednumberofunitsoffinishedproductsbythenumberofdirectlabourhoursrequiredtoproduceasingleunit.Foralabourmix,aseparatecalculationistobemadeforeachtypeoflabour.TheresultantismultipliedbythelabourcostperhourasisshowninIllustration17.6.Illustration 6.6: TheGreat Ess Industries Ltd. manufactures threeproducts—X,YandZ.Theenterprisehasdecidedtoproduce2,500,4,000and7,000unitsofX,YandZrespectivelyforthemonthofMarch.
Theestimatedlabourhoursrequiredtoproduceeachunitare:
Product Labour Hours
X 3Y 4Z 2
Thecostperlabourhourisestimatedto` 4Drawupalabourbudgetshowing(A)quantityand(B)costoflabour.
SolutionGreat Ess Industries Ltd.
Labour Budgetfor the Month of March
Products
X Y Z
Estimatedproduction(units) 2,500 4,000 7,000Labourhourperunit 3 4 2(A) Totallabourhoursrequired 7,500 16,000 14,000
Labourcostperhour ` 4 ` 4 ` 4(B) Totallabourcost 30,000 64,000 56,000
Manufacturing Overhead Budget: Themanufacturingoverheadbudgetisascheduleshowingtheexpectedamountofmanufacturingcostthatwillbe incurred for the budgeted level of activity.Manufacturing overheadsconsistsoffixed,variableandsemi-variablecostcomponents.Asdiscussedearlier,variableoverheadcostschangeproportionatelywiththevolumeofproductionwhereasfixedoverhead costs remain constant irrespective ofoutput.Thesemi-variableoverheadcostsalsochangewiththeoutputbutnotproportionately.Managementhastousesomeequitablebasistoapportion

NOTES
Self-InstructionalMaterial 159
Budget and Budgetary Control
thefixedoverheadsandthefixedelementsofthesemi-variableoverheadstothevariousbudgetcentres.Therefore,thepreparationofthemanufacturingoverheadbudgetrequiresexperience,knowledge,expertiseandintelligenceonthepartofthosepreparingthebudget.Expenses Budget: Once the production plans have been designed, theoverheadsneed to be determined to produce the products.Departmentalmanagers ordinarily prepare their own budgets for indirect labour andoverhead factors.Expenses budget consists of several sections, namely,factory overheads, administration expenses, and sales and distributionexpenses.These budgets are prepared on the basis of figures of incomestatementsofthepreviousyears.Aproperdistinctionofrecurringandnon-recurringismadewhilepreparingthesebudgets.
Theexpensesbudgetformatisgivenasunder:
...... Co. Ltd.Expenses budget (For the Year Ending .......)
(`) (`)
Factory overheads:
Fuelandpower xxxWater xxxDepreciation xxxSupervisor’ssalary xxx xxxxAdministration expenses:
Salaries xxxPrintingandstationery xxxRentandrates xxxLighting xxxGeneralexpenses xxx xxxxSales and distribution expenses:
Salesmen’ssalaries xxxSalesmen’scommission xxxAdvertising xxxEntertainmentandcarexpenses xxxShopdisplay xxxDisplay xxx xxxxTotalexpenses xxxx
Plant Budget:Inlarge-scaleindustrieswhereproductioniscarriedonwiththehelpofcostlymachines,plantbudgetispreparedtoensuremaximumutilizationofavailablemachines.
6.3.4 Cash Budget
Theavailabilityofcashinadequatequantityatpropertimeatareasonablecostisessentialforsmoothoperationofabusiness.Thecashbudgetattemptstoestimatecashrequirementsofabusinesswellaheadoftime.Accordingto
Budget and Budgetary Control
NOTES
Self-Instructional 160 Material
Soloman,(1968)‘thecashbudgetisananalysisofflowofcashinabusinessoverafuture,shortorlongperiodoftime.Itisaforecastofexpectedcashintakeandoutlay’.Thecashbudgetconvertsallplannedactionsintocashinflowsandcashoutflows.Thus,itshowstheanticipatedflowofcashandthetimingofreceiptsanddisbursementsbaseduponprojectedrevenuesandexpenses.Thisbudgetissignificantbecauseithelpsmanagementinplanningto avoid unnecessary idle cash balances on the one hand and avoidableexpensiveborrowingsontheother.Itindicatesnotonlythetotalamountoffinancingrequiredbutitstimingaswell.Thecashbudgetgenerallyconsistsofthefollowingtwomajorsections,viz.,receiptsectionandpaymentsection.
Normally,themajorsourceofcashreceiptsforanybusinessissales.Forcreditsales,accountsreceivableareeventuallyconvertedintocashasdebtorspaytheiraccounts.However,inthisconnection,managementhastoestimateproperlythetimetakentocollectoutstandingaccounts.Atthesametime,provisionsmustbemadefordiscounts,returns,allowancegrantedanduncollectibleaccounts.Fromastudyofpastrecordsandrecentexperienceintherateofcollection,itshouldbepossibletopredictapproximatereceiptson accounts.
Specialitemssuchasincreaseincashfromsaleofequipment,issuanceofshares,borrowing,andsoonmustbeconsideredintheestimationofcashreceipts.Thus,cashreceiptsareexpectedtobegeneratedfromthefollowingsources: • cashsales; • collectionfromdebtors, • non-operatingincomeslikedividend,commission, interests,andso
on, • saleproceedingsfromcapitalassets; • sharecapitalanddebentures;and • loansandoverdrafts.
Thepaymentsectionofthecashbudgetconsistsofallcashpaymentsthatareplannedforthebudgetperiod.Thesepaymentswillincludepaymentsformerchandiseandoverheadacquiredorincurredforthecurrentbudgetperiodaswellasforpayablesonthepastbudgetperiod.Paymentsonvariousaccountsarenotmadesimultaneouslywiththecost incurredormaterialsand services used.The expenditure onvarious items like insurance, rentand advertising are often paid in advancewhile payments formaterials,labourandothercostsofoperationfrequentlyfollowacquisitionanduse.Capitalexpendituresforexpansionandreplacementinadditiontomandatoryexpenditures for a variety of other purposes such as taxes, donations,repaymentsofloans,dividends,andsoonmustbetakenintoaccount.Themajor items of payments are:
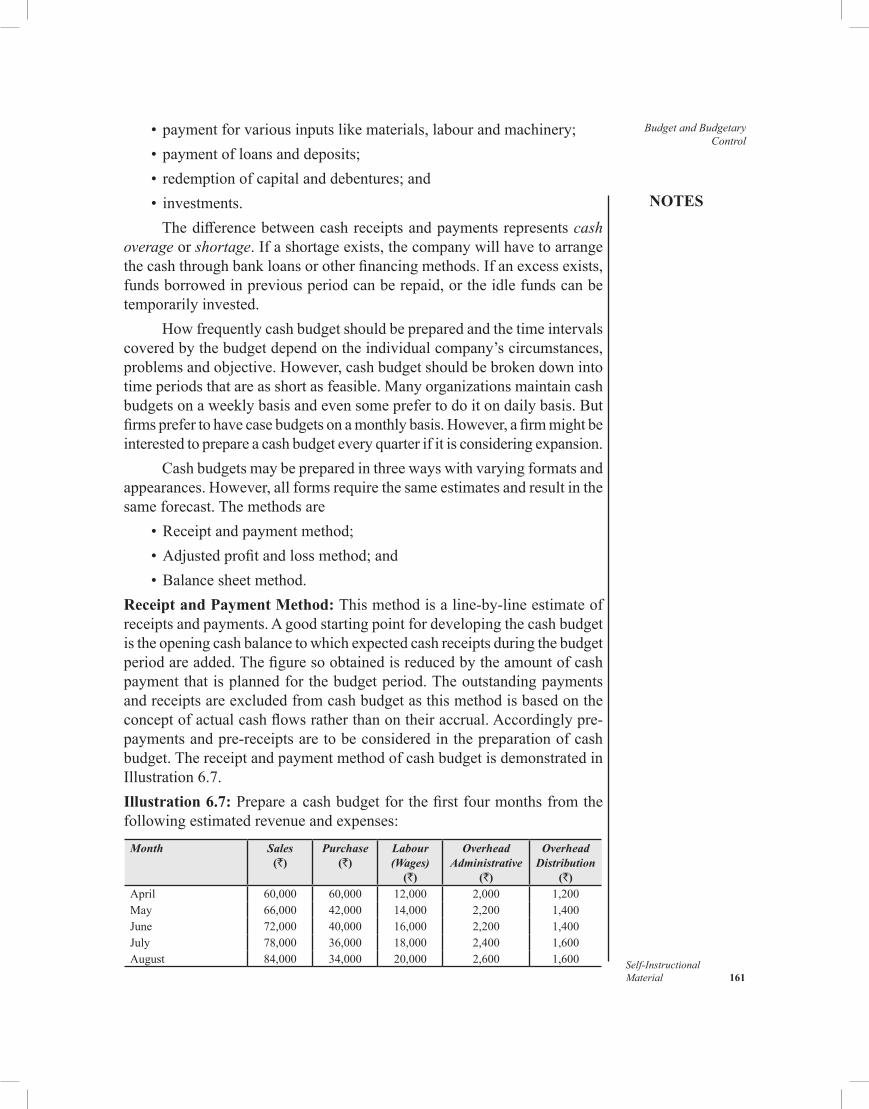
NOTES
Self-InstructionalMaterial 161
Budget and Budgetary Control
• paymentforvariousinputslikematerials,labourandmachinery; • paymentofloansanddeposits; • redemptionofcapitalanddebentures;and • investments.
Thedifferencebetweencashreceiptsandpaymentsrepresentscash overage or shortage.Ifashortageexists,thecompanywillhavetoarrangethecashthroughbankloansorotherfinancingmethods.Ifanexcessexists,fundsborrowedinpreviousperiodcanberepaid,ortheidlefundscanbetemporarilyinvested.
Howfrequentlycashbudgetshouldbepreparedandthetimeintervalscoveredbythebudgetdependontheindividualcompany’scircumstances,problemsandobjective.However,cashbudgetshouldbebrokendownintotimeperiodsthatareasshortasfeasible.Manyorganizationsmaintaincashbudgetsonaweeklybasisandevensomeprefertodoitondailybasis.Butfirmsprefertohavecasebudgetsonamonthlybasis.However,afirmmightbeinterestedtoprepareacashbudgeteveryquarterifitisconsideringexpansion.
Cashbudgetsmaybepreparedinthreewayswithvaryingformatsandappearances.However,allformsrequirethesameestimatesandresultinthesameforecast.Themethodsare •Receiptandpaymentmethod; •Adjustedprofitandlossmethod;and •Balancesheetmethod.Receipt and Payment Method: Thismethodisaline-by-lineestimateofreceiptsandpayments.Agoodstartingpointfordevelopingthecashbudgetistheopeningcashbalancetowhichexpectedcashreceiptsduringthebudgetperiodareadded.Thefiguresoobtainedisreducedbytheamountofcashpaymentthatisplannedforthebudgetperiod.Theoutstandingpaymentsandreceiptsareexcludedfromcashbudgetasthismethodisbasedontheconceptofactualcashflowsratherthanontheiraccrual.Accordinglypre-paymentsandpre-receiptsaretobeconsideredinthepreparationofcashbudget.ThereceiptandpaymentmethodofcashbudgetisdemonstratedinIllustration6.7.Illustration 6.7: Prepareacashbudgetforthefirstfourmonthsfromthefollowingestimatedrevenueandexpenses:
Month Sales(`)
Purchase(`)
Labour(Wages)
(`)
OverheadAdministrative
(`)
Overhead Distribution
(`)April 60,000 60,000 12,000 2,000 1,200May 66,000 42,000 14,000 2,200 1,400June 72,000 40,000 16,000 2,200 1,400July 78,000 36,000 18,000 2,400 1,600August 84,000 34,000 20,000 2,600 1,600
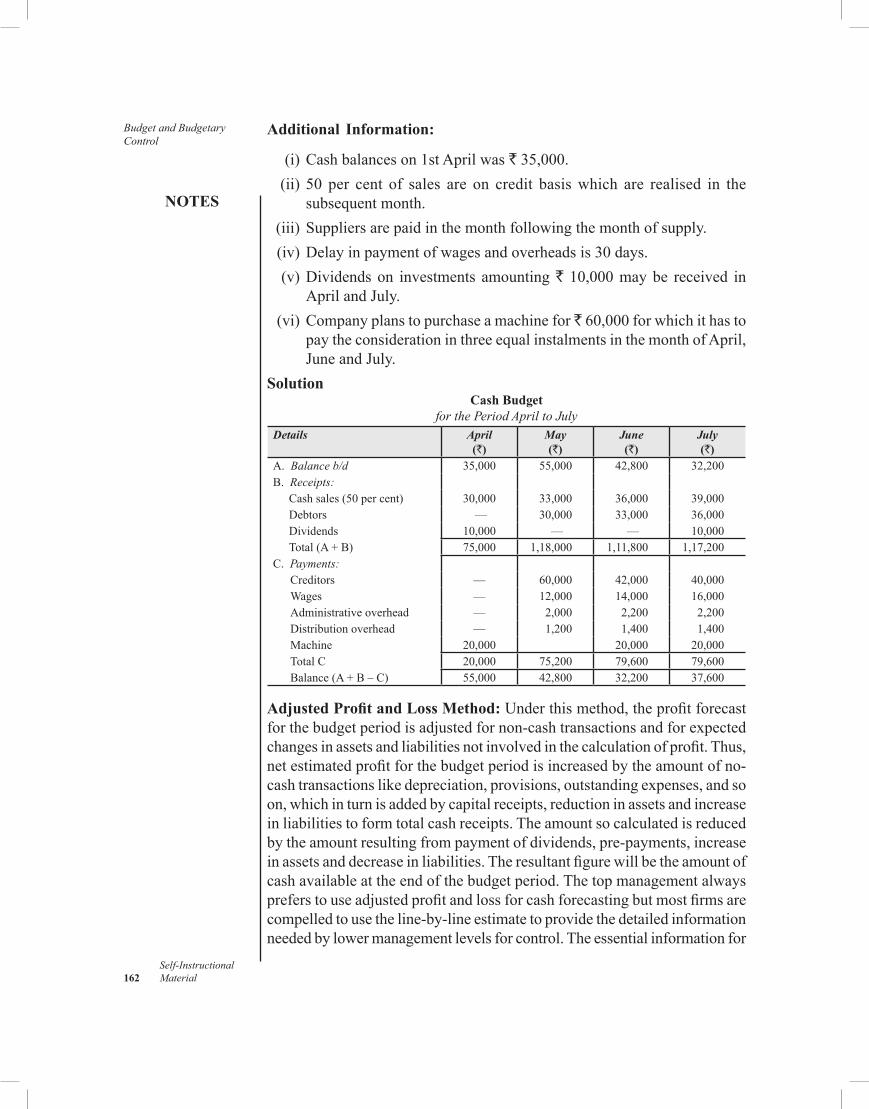
Budget and Budgetary Control
NOTES
Self-Instructional 162 Material
Additional Information:
(i)Cashbalanceson1stAprilwas`35,000. (ii) 50 per cent of sales are on credit basiswhich are realised in the
subsequentmonth. (iii)Suppliersarepaidinthemonthfollowingthemonthofsupply. (iv)Delayinpaymentofwagesandoverheadsis30days. (v)Dividendson investments amounting` 10,000maybe received in
AprilandJuly. (vi)Companyplanstopurchaseamachinefor 60,000forwhichithasto
paytheconsiderationinthreeequalinstalmentsinthemonthofApril,JuneandJuly.
SolutionCash Budget
for the Period April to July
Details April(`)
May(`)
June(`)
July(`)
A. Balance b/d 35,000 55,000 42,800 32,200B. Receipts:
Cashsales(50percent) 30,000 33,000 36,000 39,000Debtors — 30,000 33,000 36,000Dividends 10,000 — — 10,000Total(A+B) 75,000 1,18,000 1,11,800 1,17,200
C. Payments:
Creditors — 60,000 42,000 40,000Wages — 12,000 14,000 16,000Administrativeoverhead — 2,000 2,200 2,200Distributionoverhead — 1,200 1,400 1,400Machine 20,000 20,000 20,000TotalC 20,000 75,200 79,600 79,600Balance(A+B–C) 55,000 42,800 32,200 37,600
Adjusted Profit and Loss Method: Underthismethod,theprofitforecastforthebudgetperiodisadjustedfornon-cashtransactionsandforexpectedchangesinassetsandliabilitiesnotinvolvedinthecalculationofprofit.Thus,netestimatedprofitforthebudgetperiodisincreasedbytheamountofno-cashtransactionslikedepreciation,provisions,outstandingexpenses,andsoon,whichinturnisaddedbycapitalreceipts,reductioninassetsandincreaseinliabilitiestoformtotalcashreceipts.Theamountsocalculatedisreducedbytheamountresultingfrompaymentofdividends,pre-payments,increaseinassetsanddecreaseinliabilities.Theresultantfigurewillbetheamountofcashavailableattheendofthebudgetperiod.Thetopmanagementalwayspreferstouseadjustedprofitandlossforcashforecastingbutmostfirmsarecompelledtousetheline-by-lineestimatetoprovidethedetailedinformationneededbylowermanagementlevelsforcontrol.Theessentialinformationfor
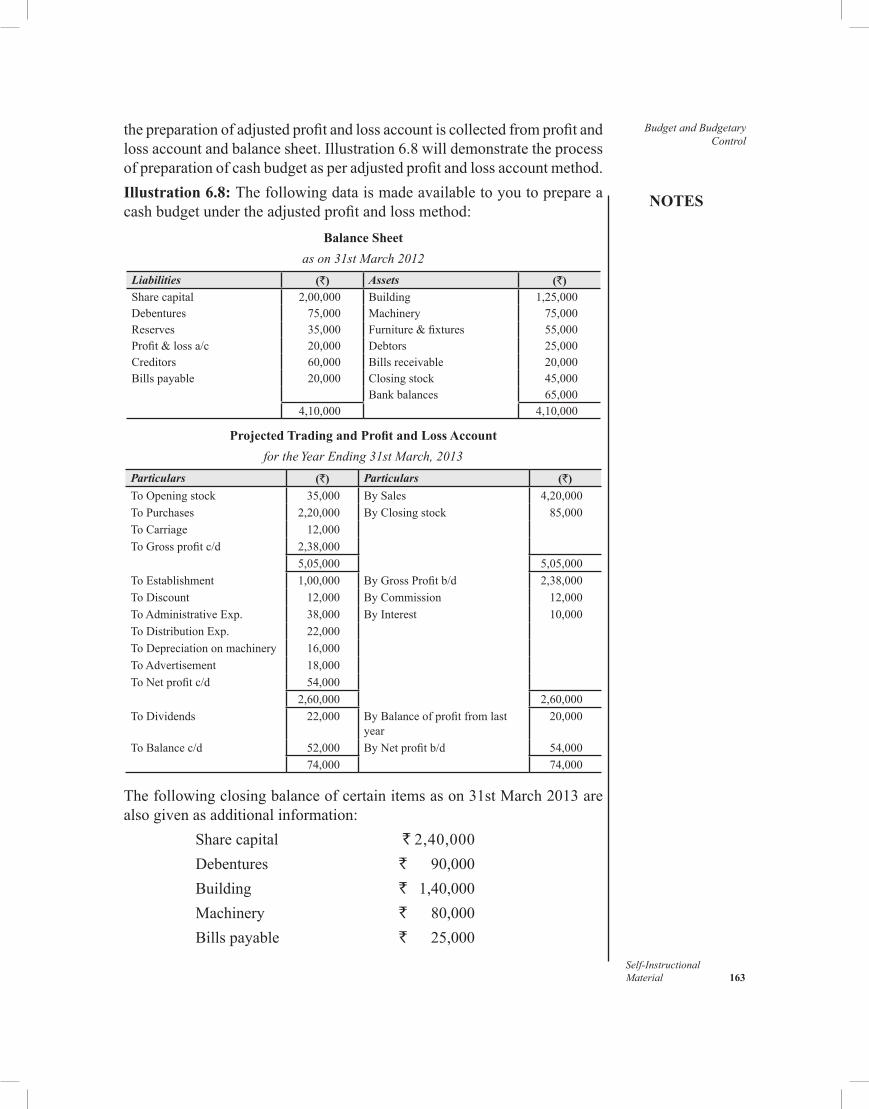
NOTES
Self-InstructionalMaterial 163
Budget and Budgetary Control
thepreparationofadjustedprofitandlossaccountiscollectedfromprofitandlossaccountandbalancesheet.Illustration6.8willdemonstratetheprocessofpreparationofcashbudgetasperadjustedprofitandlossaccountmethod.Illustration 6.8: Thefollowingdataismadeavailabletoyoutoprepareacashbudgetundertheadjustedprofitandlossmethod:
Balance Sheet
as on 31st March 2012
Liabilities (`) Assets (`)Sharecapital 2,00,000 Building 1,25,000Debentures 75,000 Machinery 75,000Reserves 35,000 Furniture&fixtures 55,000Profit&lossa/c 20,000 Debtors 25,000Creditors 60,000 Billsreceivable 20,000Billspayable 20,000 Closingstock 45,000
Bankbalances 65,0004,10,000 4,10,000
Projected Trading and Profit and Loss Accountfor the Year Ending 31st March, 2013
Particulars (`) Particulars (`)
ToOpeningstock 35,000 BySales 4,20,000ToPurchases 2,20,000 ByClosingstock 85,000To Carriage 12,000ToGrossprofitc/d 2,38,000
5,05,000 5,05,000ToEstablishment 1,00,000 ByGrossProfitb/d 2,38,000To Discount 12,000 ByCommission 12,000ToAdministrativeExp. 38,000 ByInterest 10,000ToDistributionExp. 22,000ToDepreciationonmachinery 16,000To Advertisement 18,000ToNetprofitc/d 54,000
2,60,000 2,60,000To Dividends 22,000 ByBalanceofprofitfromlast
year20,000
ToBalancec/d 52,000 ByNetprofitb/d 54,00074,000 74,000
Thefollowingclosingbalanceofcertainitemsason31stMarch2013arealsogivenasadditionalinformation: Sharecapital `2,40,000 Debentures `90,000 Building `1,40,000 Machinery `80,000 Billspayable `25,000
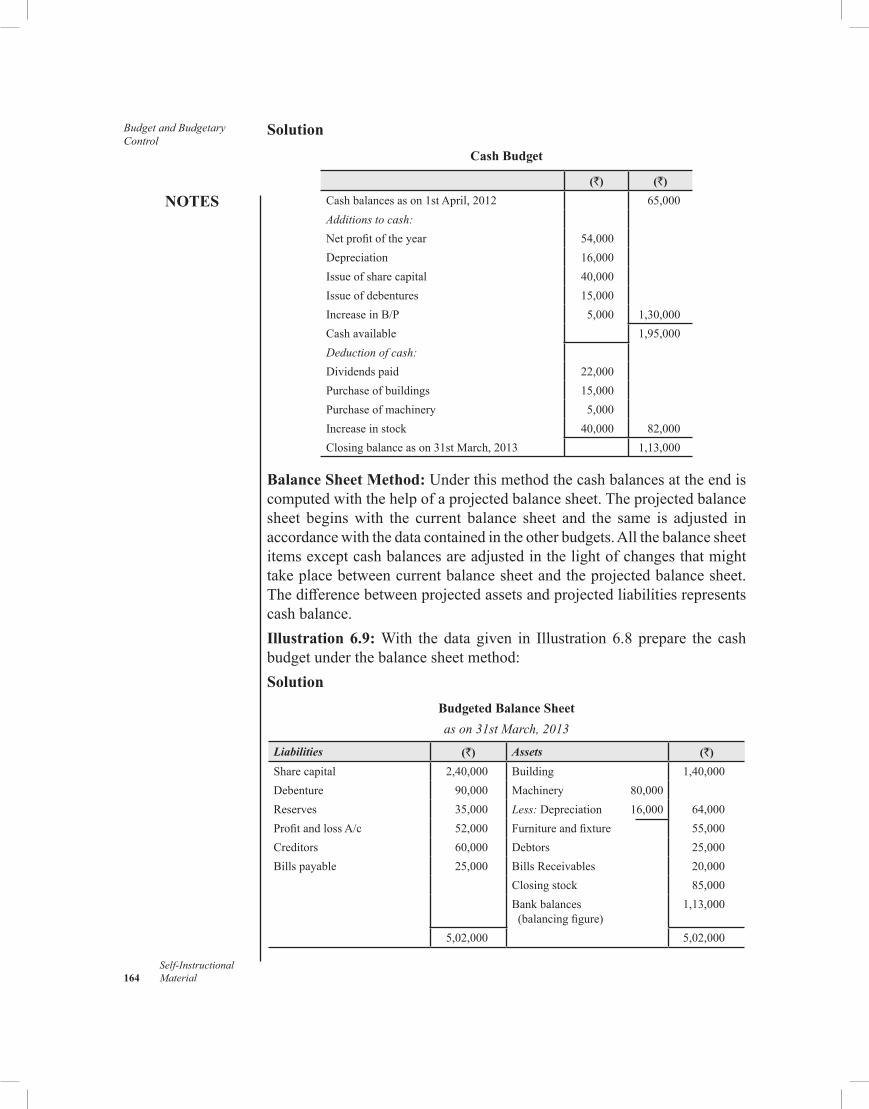
Budget and Budgetary Control
NOTES
Self-Instructional 164 Material
Solution
Cash Budget
(`) (`)
Cashbalancesason1stApril,2012 65,000Additions to cash:
Netprofitoftheyear 54,000Depreciation 16,000Issueofsharecapital 40,000Issue of debentures 15,000IncreaseinB/P 5,000 1,30,000Cashavailable 1,95,000Deduction of cash:
Dividends paid 22,000Purchaseofbuildings 15,000Purchaseofmachinery 5,000Increaseinstock 40,000 82,000Closingbalanceason31stMarch,2013 1,13,000
Balance Sheet Method: Underthismethodthecashbalancesattheendiscomputedwiththehelpofaprojectedbalancesheet.Theprojectedbalancesheet beginswith the current balance sheet and the same is adjusted inaccordancewiththedatacontainedintheotherbudgets.Allthebalancesheetitemsexceptcashbalancesareadjustedinthelightofchangesthatmighttakeplacebetweencurrentbalancesheetandtheprojectedbalancesheet.Thedifferencebetweenprojectedassetsandprojectedliabilitiesrepresentscashbalance.Illustration 6.9:With the data given in Illustration 6.8 prepare the cashbudgetunderthebalancesheetmethod:Solution
Budgeted Balance Sheet
as on 31st March, 2013
Liabilities (`) Assets (`)
Sharecapital 2,40,000 Building 1,40,000Debenture 90,000 Machinery 80,000Reserves 35,000 Less: Depreciation 16,000 64,000ProfitandlossA/c 52,000 Furnitureandfixture 55,000Creditors 60,000 Debtors 25,000Billspayable 25,000 BillsReceivables 20,000
Closingstock 85,000Bankbalances (balancingfigure)
1,13,000
5,02,000 5,02,000
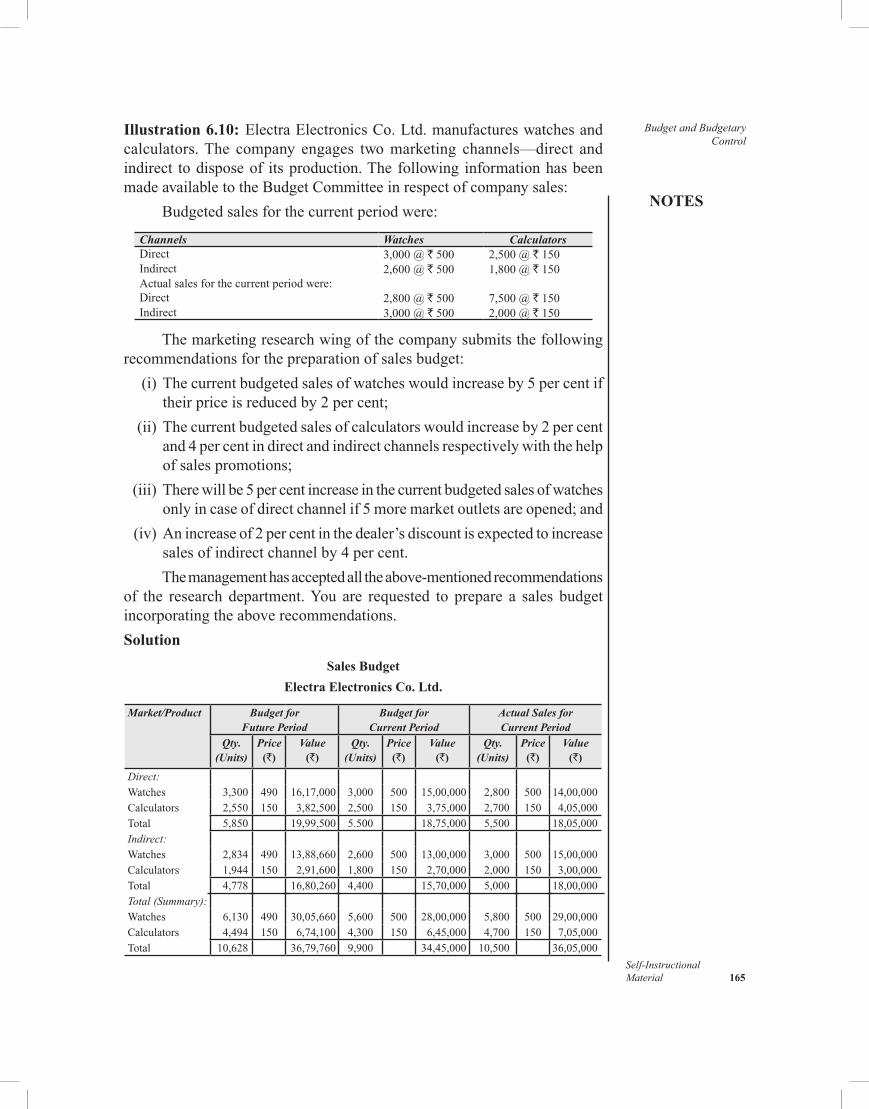
NOTES
Self-InstructionalMaterial 165
Budget and Budgetary Control
Illustration 6.10: ElectraElectronicsCo.Ltd.manufactureswatchesandcalculators.The company engages twomarketing channels—direct andindirect todisposeof itsproduction.Thefollowing informationhasbeenmadeavailabletotheBudgetCommitteeinrespectofcompanysales:
Budgetedsalesforthecurrentperiodwere:
Channels Watches CalculatorsDirect 3,000@`500 2,500@`150Indirect 2,600@`500 1,800@`150Actualsalesforthecurrentperiodwere:Direct 2,800@`500 7,500@`150Indirect 3,000@`500 2,000@`150
Themarketingresearchwingofthecompanysubmitsthefollowingrecommendationsforthepreparationofsalesbudget: (i)Thecurrentbudgetedsalesofwatcheswouldincreaseby5percentif
theirpriceisreducedby2percent; (ii)Thecurrentbudgetedsalesofcalculatorswouldincreaseby2percent
and4percentindirectandindirectchannelsrespectivelywiththehelpofsalespromotions;
(iii)Therewillbe5percentincreaseinthecurrentbudgetedsalesofwatchesonlyincaseofdirectchannelif5moremarketoutletsareopened;and
(iv)Anincreaseof2percentinthedealer’sdiscountisexpectedtoincreasesalesofindirectchannelby4percent.Themanagementhasacceptedalltheabove-mentionedrecommendations
of the research department.You are requested to prepare a sales budgetincorporatingtheaboverecommendations.Solution
Sales BudgetElectra Electronics Co. Ltd.
Market/Product Budget for Future Period
Budget for Current Period
Actual Sales for Current Period
Qty.(Units)
Price(`)
Value(`)
Qty.(Units)
Price(`)
Value(`)
Qty.(Units)
Price(`)
Value(`)
Direct:
Watches 3,300 490 16,17,000 3,000 500 15,00,000 2,800 500 14,00,000
Calculators 2,550 150 3,82,500 2,500 150 3,75,000 2,700 150 4,05,000
Total 5,850 19,99,500 5.500 18,75,000 5,500 18,05,000
Indirect:
Watches 2,834 490 13,88,660 2,600 500 13,00,000 3,000 500 15,00,000
Calculators 1,944 150 2,91,600 1,800 150 2,70,000 2,000 150 3,00,000
Total 4,778 16,80,260 4,400 15,70,000 5,000 18,00,000
Total (Summary):
Watches 6,130 490 30,05,660 5,600 500 28,00,000 5,800 500 29,00,000
Calculators 4,494 150 6,74,100 4,300 150 6,45,000 4,700 150 7,05,000
Total 10,628 36,79,760 9,900 34,45,000 10,500 36,05,000
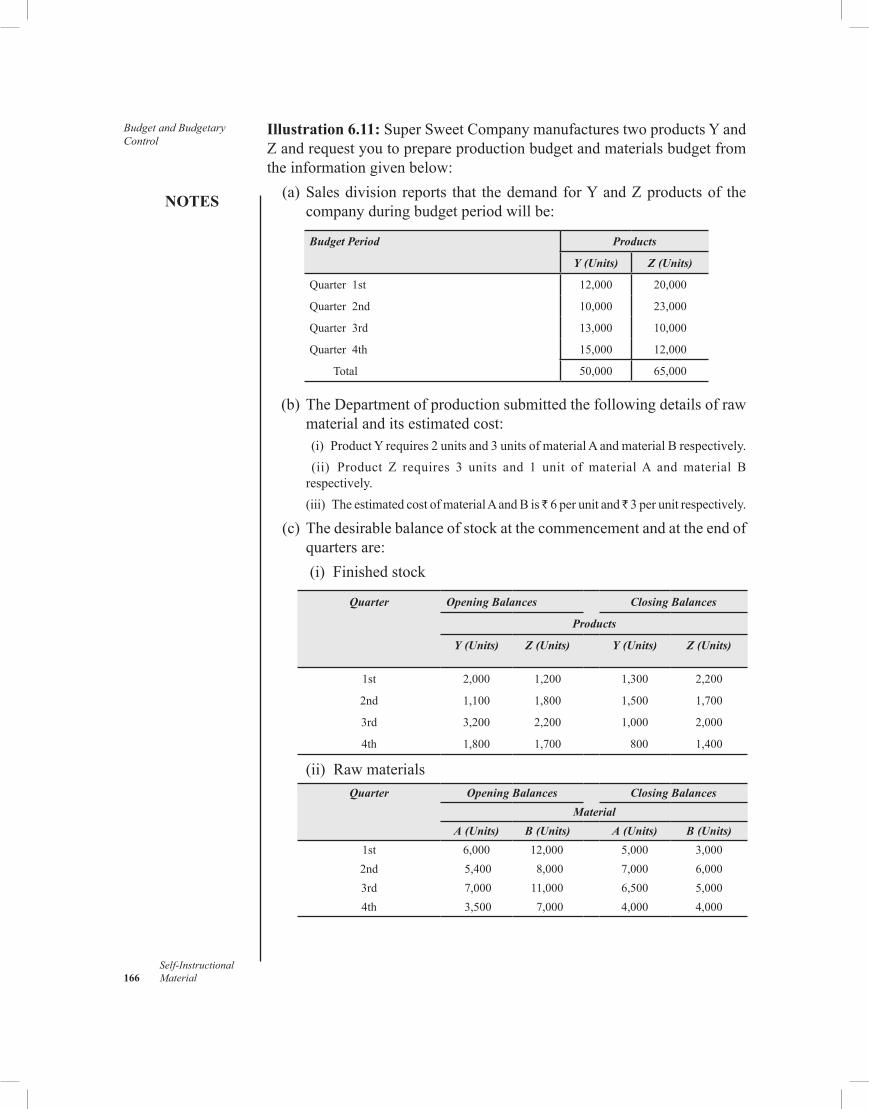
Budget and Budgetary Control
NOTES
Self-Instructional 166 Material
Illustration 6.11: SuperSweetCompanymanufacturestwoproductsYandZandrequestyoutoprepareproductionbudgetandmaterialsbudgetfromtheinformationgivenbelow: (a)Salesdivisionreports that thedemandforYandZproductsof the
companyduringbudgetperiodwillbe:
Budget Period Products
Y (Units) Z (Units)
Quarter 1st 12,000 20,000
Quarter 2nd 10,000 23,000
Quarter 3rd 13,000 10,000
Quarter 4th 15,000 12,000
Total 50,000 65,000
(b)TheDepartmentofproductionsubmittedthefollowingdetailsofrawmaterialanditsestimatedcost:
(i) ProductYrequires2unitsand3unitsofmaterialAandmaterialBrespectively. (ii) Product Z requires 3 units and 1 unit of materialA andmaterial B
respectively. (iii) TheestimatedcostofmaterialAandBis 6 per unit and 3perunitrespectively.
(c)Thedesirablebalanceofstockatthecommencementandattheendofquartersare:
(i) Finishedstock
Quarter Opening Balances Closing Balances
Products
Y (Units) Z (Units) Y (Units) Z (Units)
1st 2,000 1,200 1,300 2,200
2nd 1,100 1,800 1,500 1,700
3rd 3,200 2,200 1,000 2,000
4th 1,800 1,700 800 1,400
(ii) RawmaterialsQuarter Opening Balances Closing Balances
Material
A (Units) B (Units) A (Units) B (Units)
1st 6,000 12,000 5,000 3,0002nd 5,400 8,000 7,000 6,0003rd 7,000 11,000 6,500 5,0004th 3,500 7,000 4,000 4,000
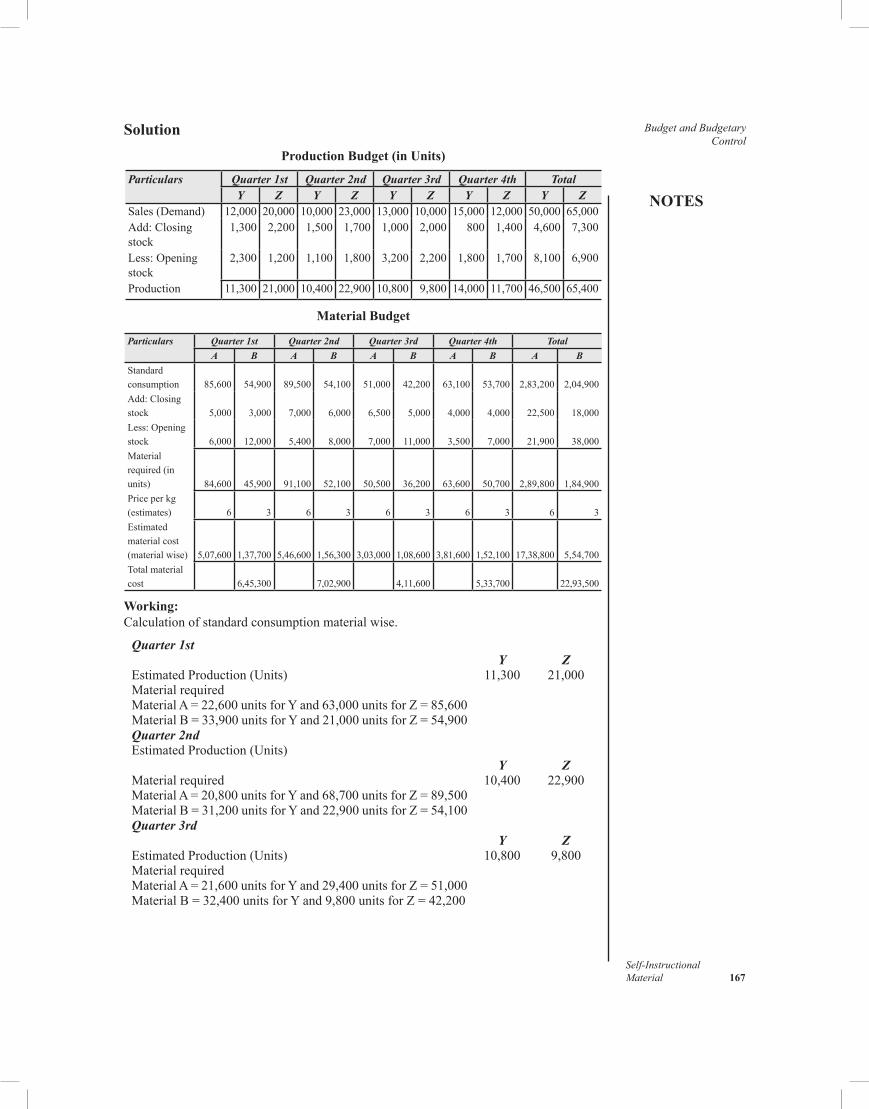
NOTES
Self-InstructionalMaterial 167
Budget and Budgetary Control
Solution
Production Budget (in Units)
Particulars Quarter 1st Quarter 2nd Quarter 3rd Quarter 4th TotalY Z Y Z Y Z Y Z Y Z
Sales(Demand) 12,000 20,000 10,000 23,000 13,000 10,000 15,000 12,000 50,000 65,000Add:Closingstock
1,300 2,200 1,500 1,700 1,000 2,000 800 1,400 4,600 7,300
Less: Opening stock
2,300 1,200 1,100 1,800 3,200 2,200 1,800 1,700 8,100 6,900
Production 11,300 21,000 10,400 22,900 10,800 9,800 14,000 11,700 46,500 65,400
Material Budget
Particulars Quarter 1st Quarter 2nd Quarter 3rd Quarter 4th Total
A B A B A B A B A B
Standard consumption 85,600 54,900 89,500 54,100 51,000 42,200 63,100 53,700 2,83,200 2,04,900Add:Closingstock 5,000 3,000 7,000 6,000 6,500 5,000 4,000 4,000 22,500 18,000Less: Opening stock 6,000 12,000 5,400 8,000 7,000 11,000 3,500 7,000 21,900 38,000Materialrequired(inunits) 84,600 45,900 91,100 52,100 50,500 36,200 63,600 50,700 2,89,800 1,84,900Priceperkg(estimates) 6 3 6 3 6 3 6 3 6 3Estimatedmaterialcost(materialwise) 5,07,600 1,37,700 5,46,600 1,56,300 3,03,000 1,08,600 3,81,600 1,52,100 17,38,800 5,54,700Totalmaterialcost 6,45,300 7,02,900 4,11,600 5,33,700 22,93,500
Working:Calculationofstandardconsumptionmaterialwise.
Quarter 1stY Z
EstimatedProduction(Units) 11,300 21,000MaterialrequiredMaterialA=22,600unitsforYand63,000unitsforZ=85,600MaterialB=33,900unitsforYand21,000unitsforZ=54,900Quarter 2ndEstimatedProduction(Units)
Y ZMaterialrequired 10,400 22,900MaterialA=20,800unitsforYand68,700unitsforZ=89,500MaterialB=31,200unitsforYand22,900unitsforZ=54,100Quarter 3rd
Y ZEstimatedProduction(Units) 10,800 9,800MaterialrequiredMaterialA=21,600unitsforYand29,400unitsforZ=51,000MaterialB=32,400unitsforYand9,800unitsforZ=42,200
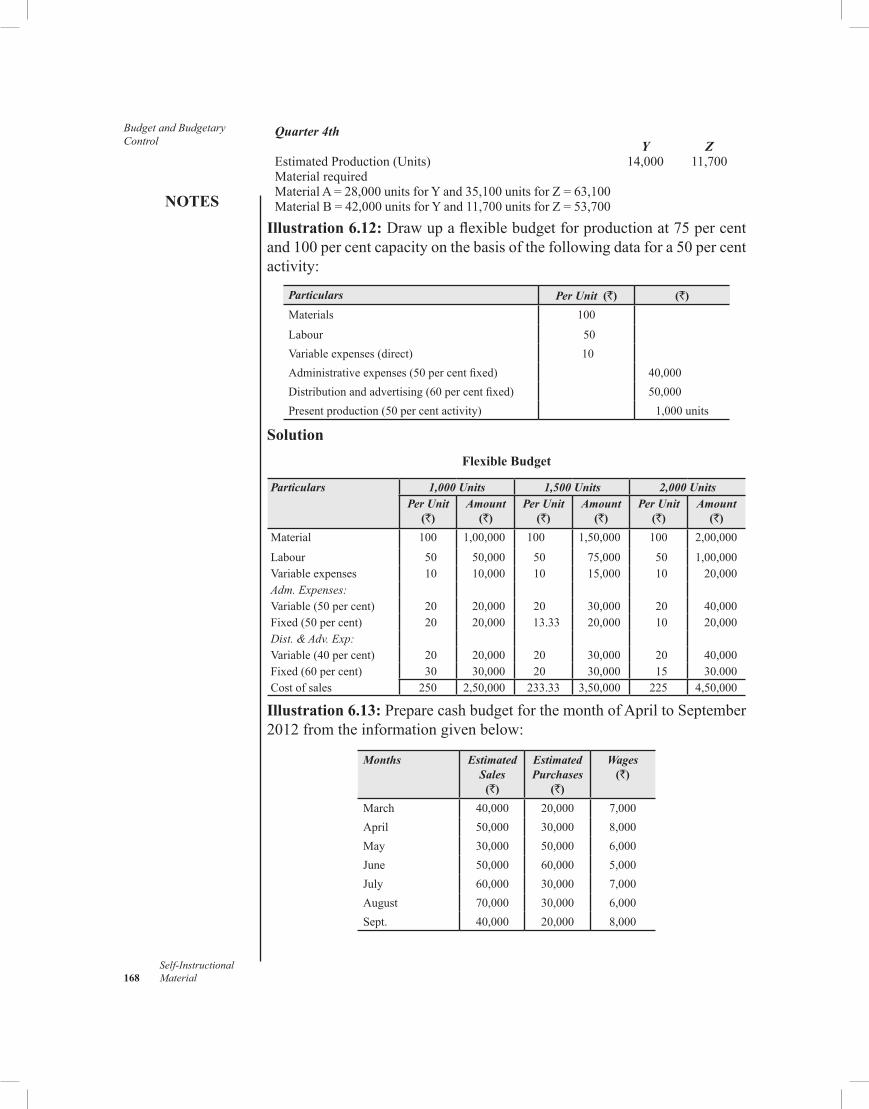
Budget and Budgetary Control
NOTES
Self-Instructional 168 Material
Quarter 4thY Z
EstimatedProduction(Units) 14,000 11,700MaterialrequiredMaterialA=28,000unitsforYand35,100unitsforZ=63,100MaterialB=42,000unitsforYand11,700unitsforZ=53,700
Illustration 6.12: Drawupaflexiblebudgetforproductionat75percentand100percentcapacityonthebasisofthefollowingdatafora50percentactivity:
Particulars Per Unit (`) (`)
Materials 100
Labour 50Variableexpenses(direct) 10Administrativeexpenses(50percentfixed) 40,000Distributionandadvertising(60percentfixed) 50,000Presentproduction(50percentactivity) 1,000units
SolutionFlexible Budget
Particulars 1,000 Units 1,500 Units 2,000 Units
Per Unit (`)
Amount(`)
Per Unit (`)
Amount(`)
Per Unit (`)
Amount(`)
Material 100 1,00,000 100 1,50,000 100 2,00,000
Labour 50 50,000 50 75,000 50 1,00,000Variableexpenses 10 10,000 10 15,000 10 20,000Adm. Expenses:
Variable(50percent) 20 20,000 20 30,000 20 40,000Fixed(50percent) 20 20,000 13.33 20,000 10 20,000Dist. & Adv. Exp:
Variable(40percent) 20 20,000 20 30,000 20 40,000Fixed(60percent) 30 30,000 20 30,000 15 30.000Costofsales 250 2,50,000 233.33 3,50,000 225 4,50,000
Illustration 6.13: PreparecashbudgetforthemonthofApriltoSeptember2012fromtheinformationgivenbelow:
Months EstimatedSales
(`)
EstimatedPurchases
(`)
Wages (`)
March 40,000 20,000 7,000April 50,000 30,000 8,000May 30,000 50,000 6,000June 50,000 60,000 5,000July 60,000 30,000 7,000August 70,000 30,000 6,000Sept. 40,000 20,000 8,000
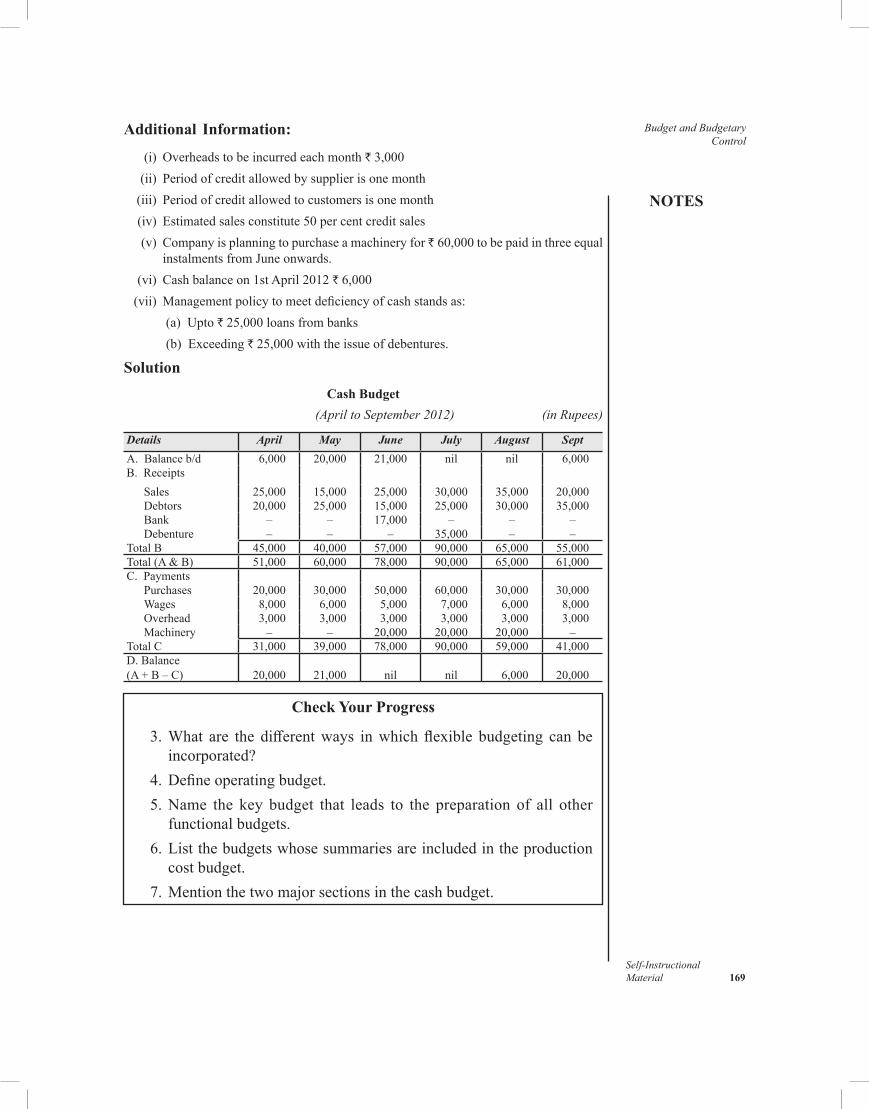
NOTES
Self-InstructionalMaterial 169
Budget and Budgetary Control
Additional Information:
(i) Overheadstobeincurredeachmonth`3,000 (ii) Periodofcreditallowedbysupplierisonemonth (iii) Periodofcreditallowedtocustomersisonemonth (iv) Estimatedsalesconstitute50percentcreditsales (v) Companyisplanningtopurchaseamachineryfor` 60,000tobepaidinthreeequal
instalmentsfromJuneonwards. (vi) Cashbalanceon1stApril2012`6,000 (vii) Managementpolicytomeetdeficiencyofcashstandsas: (a) Upto`25,000loansfrombanks (b) Exceeding`25,000withtheissueofdebentures.
Solution
Cash Budget (April to September 2012) (in Rupees)
Details April May June July August Sept
A. Balanceb/d 6,000 20,000 21,000 nil nil 6,000B. Receipts
Sales 25,000 15,000 25,000 30,000 35,000 20,000Debtors 20,000 25,000 15,000 25,000 30,000 35,000Bank – – 17,000 – – –Debenture – – – 35,000 – –
TotalB 45,000 40,000 57,000 90,000 65,000 55,000Total(A&B) 51,000 60,000 78,000 90,000 65,000 61,000C. Payments
Purchases 20,000 30,000 50,000 60,000 30,000 30,000Wages 8,000 6,000 5,000 7,000 6,000 8,000Overhead 3,000 3,000 3,000 3,000 3,000 3,000Machinery – – 20,000 20,000 20,000 –
TotalC 31,000 39,000 78,000 90,000 59,000 41,000D.Balance(A+B–C)
20,000
21,000
nil
nil
6,000
20,000
Check Your Progress
3.What are the differentways inwhichflexible budgeting can beincorporated?
4.Defineoperatingbudget. 5.Name the key budget that leads to the preparation of all other
functionalbudgets. 6.Listthebudgetswhosesummariesareincludedintheproduction
cost budget. 7.Mentionthetwomajorsectionsinthecashbudget.
Budget and Budgetary Control
NOTES
Self-Instructional 170 Material
6.4 ANSWERS TO CHECK YOUR PROGRESS QUESTIONS
1.Toeliminatethedangerofovercapitalizationandundercapitalization,budgetarycontrolhelpsbydeterminingthetotalcapitalrequirementsofabusinessfirmwith thehelpofproductionbudgetandworkingcapitalestimates.
2.Underbudgetarycontrolsystem,everybudgetcentretriestoachieveitsobjectiveswithouttakingintoconsiderationtheobjectivesofotherbudgetcentresandoverallobjectivesofthebudgetarycontrolsystem.Thiscreatesconflictamongvariousunitsoftheorganizationwhichultimatelyinterruptstheefficiencyofthesystem.
3.Flexiblebudgetingcanbeincorporatedinoneoftwoways—stepbudget,whereinbudgetsaredevelopedfordifferentlevelsofoperation,orvariablebudget,wherebudgetsarepreparedonavariablecostbasisprovidingprogressivelygreaterbudgetallowancesasthevolumeofactivity increases.
4.Theoperatingbudgetisaplanoftheexpectedrevenuesandexpensesfromnormaloperationsandactivitiesthatafirmdesirestoperformduringthebudgetperiodwhichnormallyconsistsofoneyear.
5.Generally,salesbudgetisrecognizedasthekeybudgetthatleadstothepreparationofallotherfunctionalbudgets.
6. Itistheproductioncostbudgetthatincludesthesummariesofdirectmaterial budget, direct labour budget andmanufacturing overheadbudget.
7.Thecashbudgetgenerallyconsistsofthefollowingtwomajorsections,viz.,receiptsectionandpaymentsection.
6.5 SUMMARY
•Budgetarycontrolplaysasignificantroleintheprofitabilityofafirmasithelpsittoachieveproductionandmarketinggoalsataminimumcost.
•Budgetaryplanningandcontrolisaneffectivemanagementtoolforplanning,coordinatingandcontrollingthevariousbusinessactivities.
•Abudgetisadetailedscheduleoftheproposedcombinationsofthevariousfactorsofproductionwhichthemanagementdeemstobethemostprofitablefortheensuringperiod.
•Budgetary control is a process ofmanaging an organization inaccordancewithanapprovedbudgetinordertokeeptotalexpenditure
NOTES
Self-InstructionalMaterial 171
Budget and Budgetary Control
withauthorizedlimits.Itisdesignedtoassistmanagementindecidingthe future course of action and to developbasis for evaluating theefficiencyofoperations.
•Thetime-spanforbudgetingwillvaryfromorganizationtoorganizationdependingonnumberoffactorssuchasnatureofbusiness,thedegreeofriskanduncertainty,financialresources,economicconditionsetc.
•Fixedbudgetisaplanthatexpressesonlyonelevelofestimatedactivityorvolume.
•Aflexible budget is a budgetwhich, by recognizing thedifferencebetweenfixed,semi-fixedandvariablecosts,isdesignedtochangeinrelationtothelevelofactivityattained.
•Theoperatingbudgetisaplanoftheexpectedrevenuesandexpensesformnormaloperationsandactivities.
•Capitalbudgetisaplanoffutureinvestmentsinfixedassetsandoftenincludesamountsforlargeexpenditurethathavealongtermimpactonthefinancialpositionandgrowthofthefirm.
•Short termbudgetscoverabudgetperiodofyearorshorter.Firmsprefertoprepareshorttermbudgetsinthesales,cashoverheadsetc
•Longtermbudgetsisasystematicandformalizedprocessforpurposefuldirectingandcontrollingfutureoperationstowardsadesiredobjectiveforperiodsextendingbeyondoneyear.
•Masterbudgetisanoverallbudgetofthefirmwhichincludesallothersmalldepartmentalbudgets.
•Subsidiary budgets are those budgets which show income orexpenditureappropriatetoortheresponsibilityofaparticularactivityofthebusiness.
•Asalesbudgetisanestimateoffuturesalesexpressedandincorporatedinquantitiesand/ormoney.
•Productionbudgetisacomponentofthemasterbudgetthatestablishesthelevelofproductionplannedforbudgetperiod.
•Materialsbudgetispreparedwithaviewtoensureregularsupplyofrawmaterialoftherequiredquantityaccordingtotherequirementsofproductionschedules.
•The labour budget indicates the quantity and cost of direct labourrequiredtomeetproductionneeds.
•Themanufacturingoverheadbudgetisascheduleshowingtheexpectedamountofmanufacturingcostthatwillbeincurredforthebudgetedlevelofactivity.
Budget and Budgetary Control
NOTES
Self-Instructional 172 Material
6.6 KEY WORDS
• Budget: Itisgenerallyrecognizedasaplanofactiontobepursuedbyanorganizationduringadefinedperiodoftimeinordertoachieveit objectives.
• Budgetary control:Itisasystematicprocessdesignedtoplanandcontrol themajor activities of a firm’s business through budgetsprepared in advancewith an objective to ensure effective use ofresources.
• Flexible budget: Itis‘abudgetwhich,byrecognizingthedifferencebetweenfixed,semi-fixedandvariablecosts,isdesignedtochangeinrelationtothelevelofactivityattained.
• Master budget:Itisasummaryofthebudgetschedulesincapsuleformsmadeforthepurposeofpresentinginonereportthehighlightsofthebudgetperiod.
6.7 SELF ASSESSMENT QUESTIONS AND EXERCISES
Short-Answer Questions
1.ExplaintheconceptofBudgetingandBudgetaryControl.Discusstheimportanceandobjectivesofbudgetarycontrol.
2.Listthecharacteristicsofabudget.Wheredoestheresponsibilityforthebudgetprocessnormallyrest?
3.DefineMasterBudget.Explainitssignificanceinindustrialenterprise. 4.Mentiontheessentialsofaneffectivebudgetarycontrolsystem. 5.Discusstheobjectivesandlimitationsofbudgetarycontrol. 6.Definetheproductionbudget.Whataretheprincipalconsiderations
involvedinbudgetingproduction? 7.Whatisaflexiblebudget?Howdoesitdifferfromfixedbudget?
Long-Answer Questions
1.Explainvarioustypesofbudgetsthatthemanagementofacommercialenterprisewouldnormallyprepare.
2.Discusstheprocedureforpreparingthefollowingbudgets: (a)Cashbudget (b)Productionbudget (c)Salesbudget
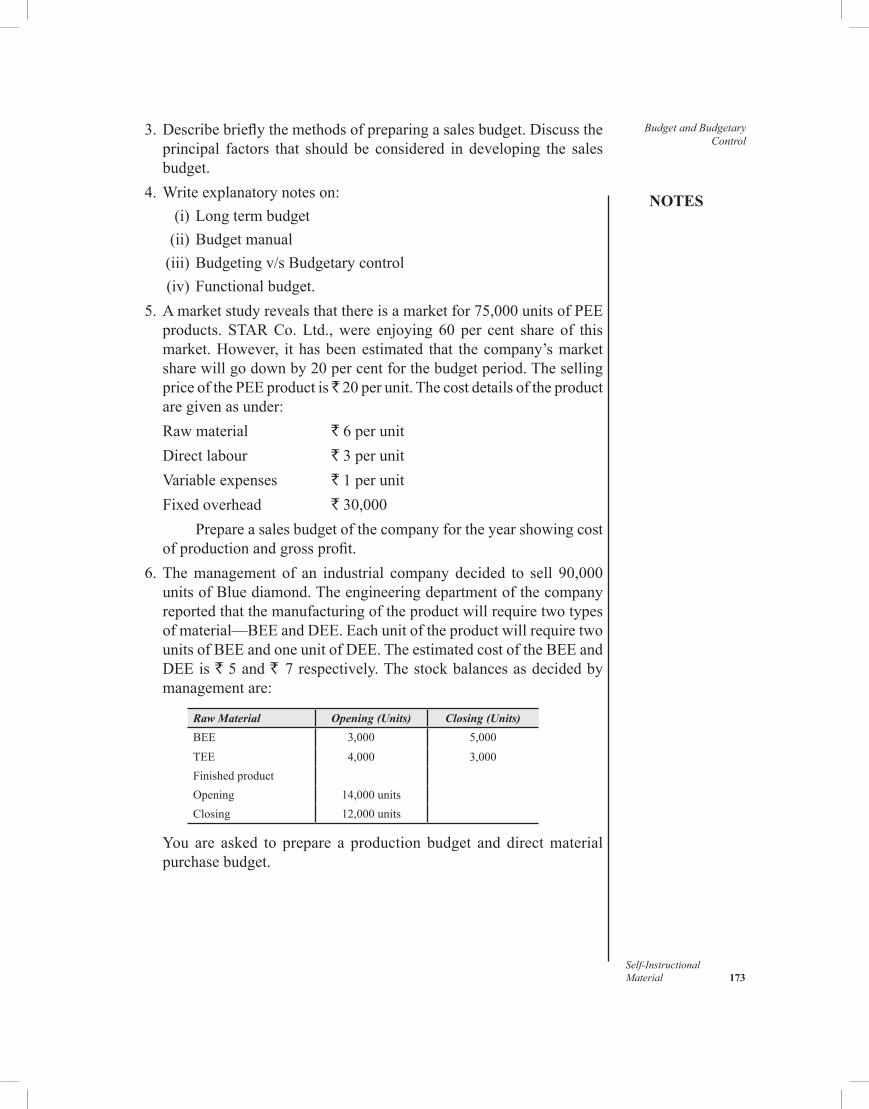
NOTES
Self-InstructionalMaterial 173
Budget and Budgetary Control
3.Describebrieflythemethodsofpreparingasalesbudget.Discusstheprincipal factors that shouldbe considered in developing the salesbudget.
4.Writeexplanatorynoteson: (i)Longtermbudget (ii)Budgetmanual (iii)Budgetingv/sBudgetarycontrol (iv)Functionalbudget. 5.Amarketstudyrevealsthatthereisamarketfor75,000unitsofPEE
products. STARCo.Ltd.,were enjoying 60 per cent share of thismarket.However, ithasbeenestimated that thecompany’smarketsharewillgodownby20percentforthebudgetperiod.ThesellingpriceofthePEEproductis 20perunit.Thecostdetailsoftheproductare given as under:
Rawmaterial ` 6 per unit Directlabour ` 3 per unit Variableexpenses ` 1 per unit Fixedoverhead `30,000 Prepareasalesbudgetofthecompanyfortheyearshowingcost
ofproductionandgrossprofit. 6.Themanagement of an industrial companydecided to sell 90,000
unitsofBluediamond.Theengineeringdepartmentofthecompanyreportedthatthemanufacturingoftheproductwillrequiretwotypesofmaterial—BEEandDEE.EachunitoftheproductwillrequiretwounitsofBEEandoneunitofDEE.TheestimatedcostoftheBEEandDEEis` 5 and ` 7respectively.Thestockbalancesasdecidedbymanagement are:
Raw Material Opening (Units) Closing (Units)
BEE 3,000 5,000TEE 4,000 3,000FinishedproductOpening 14,000unitsClosing 12,000units
You are asked to prepare a production budget and directmaterialpurchasebudget.
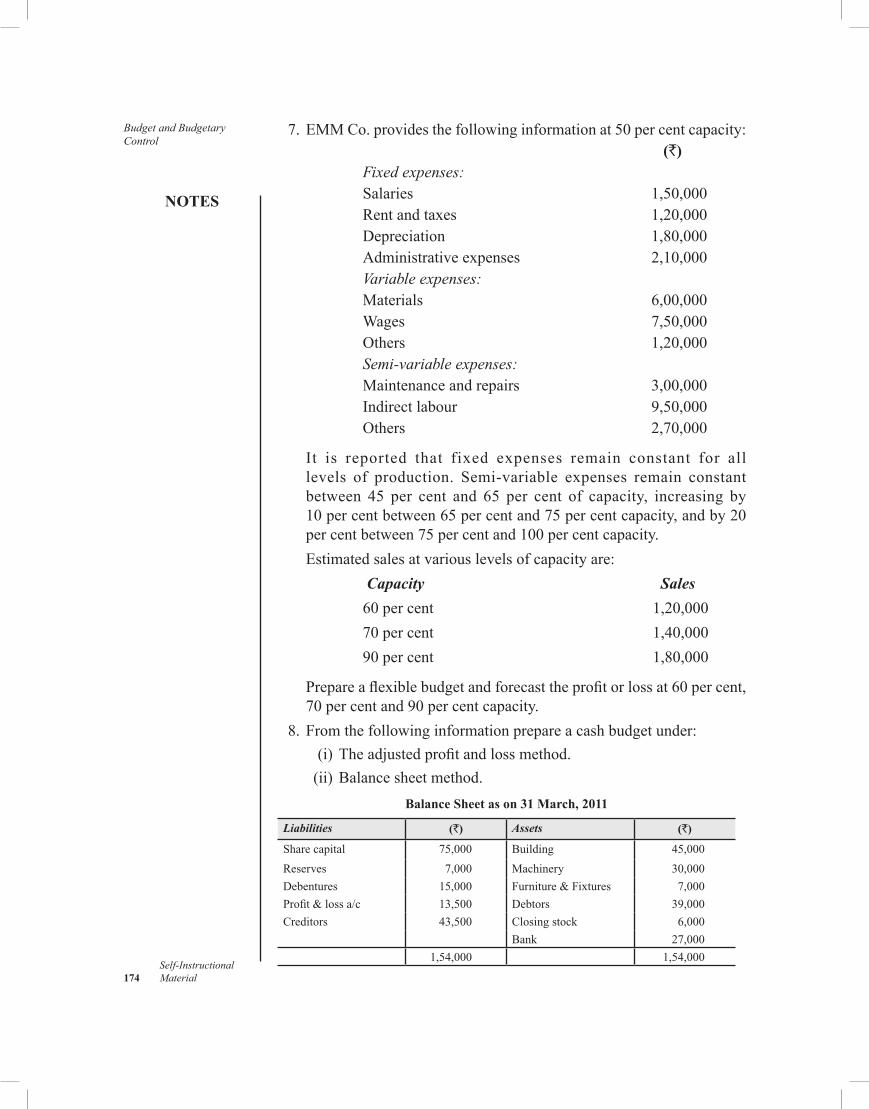
Budget and Budgetary Control
NOTES
Self-Instructional 174 Material
7.EMMCo.providesthefollowinginformationat50percentcapacity: (`)
Fixed expenses:Salaries 1,50,000Rentandtaxes 1,20,000Depreciation 1,80,000Administrativeexpenses 2,10,000Variable expenses:Materials 6,00,000Wages 7,50,000Others 1,20,000Semi-variable expenses:Maintenanceandrepairs 3,00,000Indirectlabour 9,50,000Others 2,70,000
It is reported that fixed expenses remain constant for alllevels of production. Semi-variable expenses remain constantbetween 45 per cent and 65 per cent of capacity, increasing by 10percentbetween65percentand75percentcapacity,andby20percentbetween75percentand100percentcapacity.
Estimatedsalesatvariouslevelsofcapacityare: Capacity Sales
60percent 1,20,00070percent 1,40,00090percent 1,80,000
Prepareaflexiblebudgetandforecasttheprofitorlossat60percent,70 per cent and 90 per cent capacity.
8.Fromthefollowinginformationprepareacashbudgetunder: (i)Theadjustedprofitandlossmethod. (ii)Balancesheetmethod.
Balance Sheet as on 31 March, 2011
Liabilities (`) Assets (`)
Sharecapital 75,000 Building 45,000
Reserves 7,000 Machinery 30,000
Debentures 15,000 Furniture&Fixtures 7,000
Profit&lossa/c 13,500 Debtors 39,000
Creditors 43,500 Closingstock 6,000
Bank 27,000
1,54,000 1,54,000
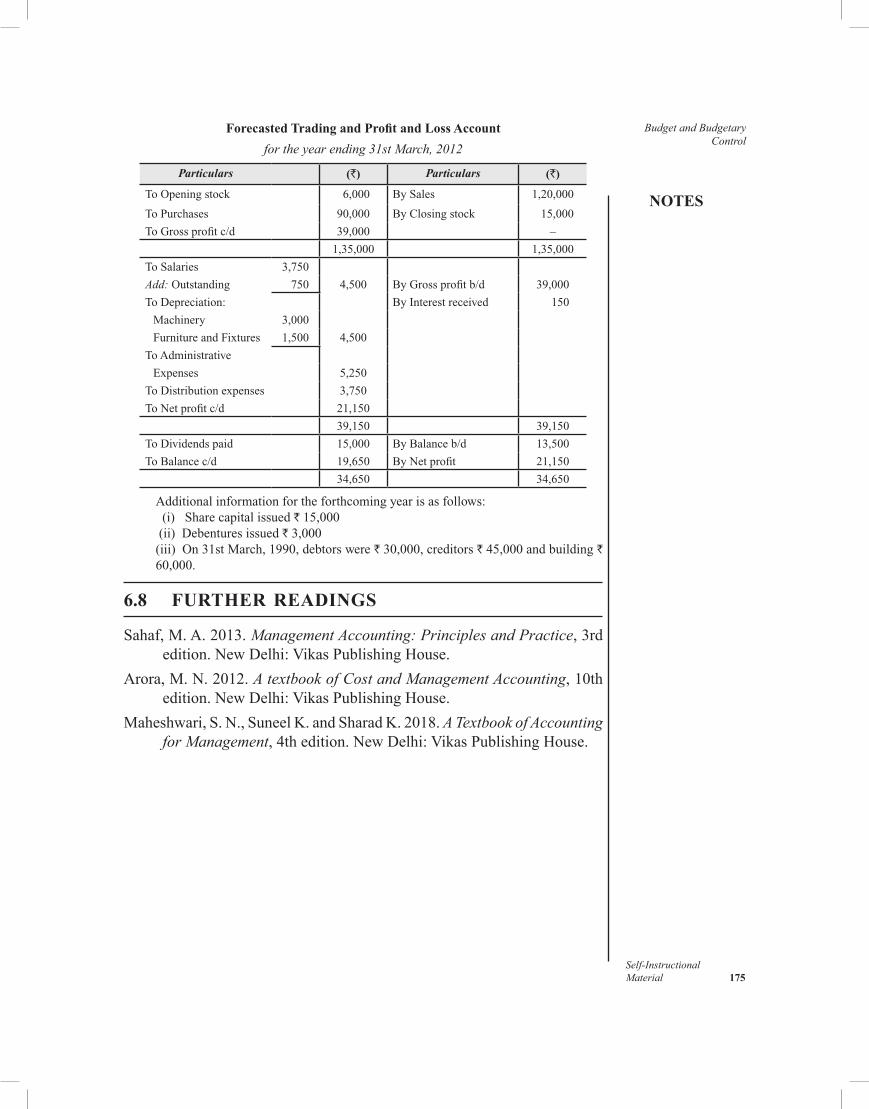
NOTES
Self-InstructionalMaterial 175
Budget and Budgetary Control
Forecasted Trading and Profit and Loss Account for the year ending 31st March, 2012
Particulars (`) Particulars (`)
ToOpeningstock 6,000 BySales 1,20,000
ToPurchases 90,000 ByClosingstock 15,000
ToGrossprofitc/d 39,000 –
1,35,000 1,35,000
ToSalaries 3,750
Add:Outstanding 750 4,500 ByGrossprofitb/d 39,000
ToDepreciation: ByInterestreceived 150
Machinery 3,000
FurnitureandFixtures 1,500 4,500
ToAdministrative
Expenses 5,250
ToDistributionexpenses 3,750
ToNetprofitc/d 21,150
39,150 39,150
ToDividendspaid 15,000 ByBalanceb/d 13,500
ToBalancec/d 19,650 ByNetprofit 21,150
34,650 34,650
Additionalinformationfortheforthcomingyearisasfollows: (i) Sharecapitalissued`15,000 (ii) Debenturesissued`3,000 (iii) On31stMarch,1990,debtorswere`30,000,creditors`45,000andbuilding`
60,000.
6.8 FURTHER READINGS
Sahaf,M.A.2013.Management Accounting: Principles and Practice,3rdedition.NewDelhi:VikasPublishingHouse.
Arora,M.N.2012.A textbook of Cost and Management Accounting,10thedition.NewDelhi:VikasPublishingHouse.
Maheshwari,S.N.,SuneelK.andSharadK.2018.A Textbook of Accounting for Management,4thedition.NewDelhi:VikasPublishingHouse.
Standard Cosing
NOTES
Self-Instructional 176 Material
UNIT 7 STANDARD COSTINGStructure 7.0 Introduction 7.1 Objectives 7.2 Meaning of Standard Costing
7.2.1 Advantages and Limitations of Standard Costing 7.3 TheStandardCostingSystem 7.4 AnswerstoCheckYourProgressQuestions 7.5 Summary 7.6 Key Words 7.7SelfAssessmentQuestionsandExercises 7.8 FurtherReadings
7.0 INTRODUCTION
Tomeet the growing demands of competition, firmsmust continuouslysearchforwaystoattainmaximumoperatingefficiency.Theycanattainthisobjectivebymakingoptimumuseoftheiravailableresources.Consequently,managerialactionsneedtobedirectedtowardsdeficienciesandareasforimprovementthatcanhavethegreatestimpactonthefirms’operatingresults.This requires that themanagementmust not only have appropriate andtimelyinformationonwhattheresultsarebutmostimportantlymustalsoknowhowtheseresultssoundincomparisontothepotentialcapabilitiesoftheoperation.Itiswithinthiscontextthatthestandardcostingandvarianceanalysisbecomeanessentialpartofanyusefulsystemofcontrol.
Inordinarylanguage,thestandard formsayardstickthatisusedtomeasureweight,quantity,qualityandvalue.Itisameasureofacceptablecostperformanceofagivenactivityundercontrolledconditions.Acontrolled conditionreferstoasituationwhereeveryactivityofthetaskisperformedasperpredeterminedwayandprocedure.Thus,astandardcostisascientificpredeterminationofwhataunitofproductshouldcost.
7.1 OBJECTIVES
Aftergoingthroughthisunit,youwillbeableto •Discussthemethodofstandard,estimatedcostsandstandardcosting •Differentiatebetweenstandardcosting,budgetarycontrolandhistorical
costing •Explaintheadvantagesandlimitationsofstandardcosting •Describethestandardcostingsystem
NOTES
Self-InstructionalMaterial 177
Standard Cosing7.2 MEANING OF STANDARD COSTING
Althoughitmightappear thatstandardandestimatedcostsare thesame,somedissimilarityexists.Anestimated cost isdeterminedonbasisoftheaveragepastperformanceand,therefore,canberegardedasareasonable assessmentofwhatacost‘willbe’.Ontheotherhand,standard cost isthecostthatwouldbeincurredunder themostefficientoperatingconditionsandisforecastbeforethemanufacturingprocessbegins.Thus,itis acarefullypredeterminedcostusedasaperformancecriteria—ameasurewhatacostshouldbe.Abudgeted cost isviewedasfuturecost(prediction,estimate,forecast)thatisformallycombinedintoanintegratedplanofaction.
Itisthestandardcostperunitofthebudgetedquantitytobeproducedduringaparticularperiod.
Concept of Standard Costing
Standardcostingisanimportantaccounting-orientedtoolwhichattemptstokeepthecostataminimumlevelbyplanningandcontrollingcostsofeachunitproduced.Underthissystem,thecostofeachunitispredeterminedonsomescientificbasisandarrangementsaremadeforcostsnottoexceedthepredetermined standard.
InthewordsofBigg(1975)standardcostingisasystemofcostingwherea comparison is made of the actual cost with a pre-arranged standard and the cost of any deviations (called variances) is analysed by causes. This method permits management to investigate the reasons for these variances and to take suitable corrective action. It is, therefore, a system of cost control as well as cost ascertainment.
According to theChartered Institute ofManagementAccountants,London,Standard costing is the preparation and use of standard costs, their comparison with actual costs and the analysis of variances to their causes and points of incidence.
Brown andHoward state,Standard costing is a technique of cost accounting which compares the ‘standard cost’ of each product or service with the actual cost, to determine the efficiency of the operation, so that any remedial action may be taken immediately.
Totheauthorofthisbook,standardcostingis a system which attempts to predetermine costs with an aim to measure the efficiency of production. It calls for the determination of standard costs and their application to managerial problems particularly those problems relating to product costs and departmental cost control.Thus,understandard costing system predeterminedcostsarecarefullycomputedwhicharethencomparedwithactual cost to aid in cost control.Accordingly, standard costing systeminvolvesthefollowingsteps:
Standard Cosing
NOTES
Self-Instructional 178 Material
• Determinationofstandardcost foreachelementofcost—directmaterial,directlabourandoverhead;
• Recordingofbothstandardandactualcostsinappropriatebooksof accounts;
• Computationofvariancebetweenstandardcostandactualcost;• Analysisandinvestigationofthevariances;and• Feedcorrectionandsuggestedmodificationswhererequired.Thestandardcostofaproductconsistsof:• Quantitativefacts:Standardquantityofthegivenmaterial,standard
labourhoursforspecifiedoperationsandstandardmachinehoursforthestatedmachinestobeused;
•Price factors: Standard cost per rupee and per hour bywhich thestandardquantitiesareconvertedtothestandardproductcost.The quantitative factors are based on engineered specifications
temperedbyexperience,andviceversa,whereaspricesusedaretypicallythosewhichareexpectedtoberepresentativeofactualpricesduringtheperiodforwhichthestandardsareestablished.
For control purposes, various actual activities of a period such asquantityofeachtypeofmaterialused,labourhoursworkedandmachinehoursinvolved,aswellasunitsofgoodsproducedaremultipliedbyappropriateunitstandardcosttoestablishstandardcosttotalsforworkperformancebyjoborprocessandbydepartment.Theactualcostsoftheseactivitiesarethencomparedwiththestandardcostsandtheresultingvariancesareexaminedso as to:
• aidtheinterpretationoffinancialresultsfortheperiod;• fixtheresponsibilityfornon-standardperformance;and• focus attention on areas inwhich cost improvement should be
sought.
Standard Costing Vs. Historical Costing
Standardcostingdiffers fromhistorical costingonanumberofgrounds.However,themaindifferencesareasunder: •Standard costing acts as a controlling device that does not only
determinethecostofthegivenactivityinadvancebutalsoaimstokeepactualcostswithinthepredeterminedstandardwhereashistoricalcostingfailstoexerciseanycontrolovercosts,asunderthissystem,costsaretheactualcosts.
•Standardcostingisaforward-lookingtoolwhereashistoricalcostingisabackward-lookingdeviceasitrelatestothepastbyanalysingthealreadyincurredcosts.
NOTES
Self-InstructionalMaterial 179
Standard Cosing •The scopeof standard costing startswell before the start of actualproductionwhereastheapplicationofhistoricalcostingbeginsaftertheproductiontakesplace.
• Installation of the standard costing system requires intelligence,technicalskillandexpertiseonthepartofthemanagementwhereasthehistoricalcostingsystemcanbeinstalledwithordinarycapabilities.
•Standardcostingsystemcannotoperateeffectivelywithoutabudgetarycontrolsystemwhichisnottrueincaseofhistoricalcosting.
Standard Costing Vs. Budgetary Control
Althoughinboththesystemsstandardsarepredeterminedwithwhichactualresultsarecomparedtomeasurethebusinessperformance,yettheydifferwitheachotheronmanyissues.Themaindifferencesaresummarizedbelow: •Budgetarycontroliswiderinscopeascomparedtostandardcosting.
Budgetary control covers all aspects of the business, for example,production,purchase,sales,finance,incomes,expenditure,etc.Ontheotherhand,standardcostingtechniqueislimitedonlytoproductionand production cost.
•Budgetarycontrolsisemployedtoformulatebusinesspolicieswhereasstandardcostinghelpsmanagementincostascertainmentandfixationof sellingprice and at the same time attempts to keep the costs atminimumlevel.
•Thepartialintroductionofbudgetarycontrolinanyorganizationcaneasilybedone.Forexample,themanagementwouldbeinterestedtoapply thebudgeting system in the important areasofbusiness likecapitalprojects,researchanddevelopment,etc.Itcandoitwithoutmuchdifficulty,however,partialinstallationofthestandardcostingsystemwillnotbeofanyusetothebusiness.
•Thepreparationofbudgetsaremostlygovernedbypastexperienceandatthemostbytheprojectionofthefinancialinformationasdisclosedbyvariousfinancialcosting.Standardcostingsystemisbasedontechnicalestimates.
•Thebudgetingsystemislessrigidascomparedtothesystemofstandardcosting.Budgetsfixlimitswhereastargetsarefixedinstandardcosting.
•Standardcostingcannotexistwithouteffectivebudgetingsystembutabudgetarycontrolcanbeoperationalwithoutstandardcostingsystem.
•Under standard costing system, the analysis of variances ismadeaccording to their originating causeswhich is not true in case ofvarianceanalysisinbudgetarycontrol.
•An effective standard costing system involves standardization ofproductswhichisnotnecessarilyrequiredforbudgetarycontrol.
Standard Cosing
NOTES
Self-Instructional 180 Material
7.2.1 Advantages and Limitations of Standard Costing
Thestandardcostingtechnique, ifproperly implemented,wouldresult inthefollowingbenefits: •Pricescanbedeterminedinanticipationoftheactualproductionas
standardcostsforvariousinputsarealreadyavailable. •Thestandardcostingsystemmakespossibletodetermineandcompare
theefficiencyofvariousoperations. • Iteliminateswastagesbydetectingvariancesandsuggestingcorrective
measuresforthem. • Itensuresbettercontrolastheperformancecriteriaisknowntoworkers,
andnaturally,theytakemoreinterestinworktoachievethestandard. • Itbringsaboutanimprovementinproductionmethodsasitrequires
acontinuousdetailedexaminationofall important functionsof theconcern.Italsoresultsinreductionofcosts.
• It provides continual incentives formanagement to keep costs andperformanceintunewithpredeterminedobjective.Thecomparisonbetween actual costs and predetermined standards ismuchmoreeffectivethanacomparisonbetweencurrentactualcostsandactualcosts of prior period.
•Understandardcostingsystem,variancesaredeterminednormallyattheendofthemonth,orevenonweeklybasistoallowformoretimelyactionincorrectinginefficiencies.
•Standardcostingsysteminvolveslessclericaleffortsthanothercostingsystemsbecauseactualcostsarerecordedandaccumulatedbycostcentreratherthanbyjob.
•Standardcostingsystemmakespossibleforthemanagementtopaymore attention toweak areas that require control as it follows theprincipleofmanagementbyexception.
Limitations of Standard Costing
Thefollowingarethelimitationsattachedtostandardcosting: •Fixationofstandardisnotpossibleforeverytypeofworkoroperation. •Wrongstandardsmayresultinwastageoftime,moneyandenergy. •Fixationofstandardsisatime-consumingprocessasthestandardsfixed
needtobereviewedfromtimetotime;otherwisetheyloseimportanceforthepurpose.
•Determinationof actual cost is necessary for certain purposes, forexample,preparationofcashbudget,reconciliationofcostandfinancialaccounts,etc.
NOTES
Self-InstructionalMaterial 181
Standard Cosing •Despitetheabovelimitations,astandardcostingsystemisabsolutelyessentialforefficientcontrol.Standardsmustbefixedandimplementedproperly.
Check Your Progress
1.Comparethescopeofbudgetarycontrolandstandardcosting. 2.Mentiontheprinciplefollowedinstandardcostingwhichmakesit
possibleforthemanagementtopaymoreattentiontoweakareasthatrequirecontrol.
7.3 THE STANDARD COSTING SYSTEM
The standard costing system is designed to furnishmanagementwith ameasure thatwill help it inmakingdecisions regarding the efficiencyofoperations.Asoundstandardcostingsystemconsistsofsixmainactivities,viz., •Establishmentofcostcentre; •Determinationofthequalityofstandard; •Organizationofstandardcosting; •Settingofstandards; •Actualcostaccumulation;and •Analysisofvariance.
Establishment of Cost Centre
Thestandardcostingsystembeginswiththeestablishmentofthecostcentrewhichisusuallyaprocess,oranoperation,oranitemofequipment.Itisaunitofactivitywithinthefactorytowhichcostsmaybepracticallyandequitablyassigned.Performanceisassessedbycomparingtheactualcostwiththeperformancestandardwhichshowsthecoststhecentreshouldhaveincurredgiventheiractualactivity.
Determination of Quality of Standard
Standardsmaybebroadlyclassifiedintofourtypes:ideal,normal,basisandattainable.
Ideal Standards: Theyaresetat the levelofmaximumefficiency,representingconditionsthatcanseldombeattained.Suchastandardfailstopayanyattentiontonormalmaterialsspoilageandidlelabourtime.Thistypeofstandardcanbeusedasthestandardofperfectionratherthanastandardforthemeasurementofpracticalresultsbecauseconditionsthatsatisfyidealstandardsareextremelyrare.Overanyextendedperiodoftime,itwouldbeimpossiblefortheactualactivitiestoequaltheidealstandard.Onthis
Standard Cosing
NOTES
Self-Instructional 182 Material
pleasuchstandardsarealsocalledtheoreticalstandards.Thesettingofsuchstandardsmaymotivateemployeestoincreasetheiroutputtothemaximumbut if the standards are still not attained theirmoralemay be seriouslyaffected.However,idealstandardsaremoreeffectivefordirectmaterialcostsandusage.Theapplicationofidealstandardmakesvarianceaccountslesssignificantforcontrolpurposes.
Normal Standards: Theycanbeachievedbyefficientworkingandmanagement.Theyallowfornormalworkersperforminginnormalsettings.Suchstandardsaresetaftertakingintoconsiderationtheconditionsthatareexpectedtoprevailoveralongperiodoftimesufficienttoreflecttheeffectsofseasonalandcyclicalfluctuations.Thesestandardsareofgreatsignificanceformanufacturingoverheadexpenses.
Basic Standards: Alsocalled long-rangestandards, theyprovideameasuringscaleforperformanceoveralongperiodoftime.Suchstandardsarenot influencedbyanychangeinmaterialpricesandlabourratesand,therefore,remainunchangedforanumberofyears.Basicstandardsareusefulforsuchitemsofexpenditurethatarefixedinnature.Inthepresentdynamicbusinesssuchstandardsareofnopracticalutility.
Attainable Standards: Theyarebasedonpastperformanceandcanbeachievedwithreasonableeffort.Perhapsthestandardsshouldbesomewhatlowerthanwhatcanbeachievedbyearnesteffort.Suchstandardsaresetascloselyaspossibletothatlevelwhichrepresentsanticipatedconditions.Theyallowforusualproductionproblemssuchasdowntimeformaintenance,employee errors, or occasional inventory shortages.These standards aremore realistic and satisfactory and thus represent desirable performance.Attainable standards are particularly useful in settingprice standards formaterialandlabour.
Organization of Standard Costing
Thepracticesofstandardsettingvaryfromfirmtofirm.Managementshouldtakesufficientcareinsettingstandardsbecausetheefficiencyofastandardcosting system largely depends upon the accuracy and reliability of thestandards.Inthepast,thejobofstandardsettingwastheresponsibilityofthecostaccountant.However,keepinginviewthedynamicconditionsofthepresentbusiness,itrequiresthecombinedthinkingandexpertiseofallpersonswhoareresponsibleforfixingpricesandquantitiesofinputs.Againstthisbackground,almostineverybigorganization,atpresent,thisfunctionisdischargedbyastandard committee consisting of representatives from various concerneddepartmentsoftheorganization.Thesaidcommitteeestablishesandmonitorsstandardsforvariouscostsandactivitiesandisalsoresponsiblefor changing and updating the standardswhen required. In determiningthereliablestandards,thecommitteemustanalyseandinvestigateallsuchvariablesandfactorsthathavedirectbearingontheworkers’performance.
NOTES
Self-InstructionalMaterial 183
Standard CosingThe important among them are: • employee’sattitude; • organizationalstructure; • governmentregulations; • performancefeedback;and • labour–managementrelations.
Setting of Standards
Oneoftheimportantcomponentsofthestandardcostingsystemisthesettingofstandardstheevaluationofactualresults.Itincludesdetailedestimatesofmaterialquantitiesandprices,labourquantitiesandprices,andoverheadquantities and rates.These details serve as the benchmarks of efficiencyagainstwhich actual quantities and costs are compared.Accordingly,standardsareneededtobefixedforeachandeveryelementofcost,viz., • directmaterial; • directlabour;and • overheads.Direct Material Standard: Itrepresentstheamountofmaterialcosttobeincurredforproducingaunitofoutput.Thematerialcostisalwaysaffectedbythepriceandquantityofmaterial.Accordingly,themanagementhastosetstandardsbothformaterialquantityandformaterialprice.
Thequantityofrawmaterialitemsrequiredtomanufactureaunitofoutputisthematerial quantity standard.Thus,itisaprocessthatdeterminesthe quantity ofmaterial that should be priced to produce each unit it ismanufactured. In calculating the rawmaterial required to be included inthe standard,considerationmustbegiventomanufacturingscrap,normalmaterialwastage,spoilage,etc. Material price standard ispre-determinedpricetobepaidforobtainingtherawmaterialfortheoutput. Astandardpriceissetforeachclassofmaterialtobepurchased.Thesestandardsshouldtakeinto consideration economicorder quantities, volumediscounts, inboundtransportationandexpectedshortrangepricingtrends.
Direct Labour Standards: Just as it is necessary to set standardsformaterialtofixuponaunitcostthatmaybeusedinallcases,regardlessoffluctuationsbothinpricesandintheamountofmaterialused,itisalsoessentialtofixdirectlabourstandardstodetermineaunitlabourcostwhichwillremainfixedinspiteofdifferentratesofpayanddifferentperiodsoftimerequiredtodothetask.
Direct labour standard represents the amount of labour cost to bechargedtototaloutputcost.Itiscomputedbymultiplyingstandardlabourratebystandardlabourtime.Thus,directlabourstandardrequiressettingoftwostandards,viz.,labour time standardandlabour rate standard.
Standard Cosing
NOTES
Self-Instructional 184 Material
Thestandardtimerequiredtoperformeachlabouroperationthatentersintoproductionforproducingaproductisknownaslabour time standard.Suchstandardsareoftenestablished fromworkmeasurementsand time-and-motionstudies.Dueconsiderationshouldalsobegiventotheincentivesofferedtothelaboursinsettingthesestandards.Thesettingoflabourtimestandardrequiresaconsiderableamountofprofessionalmeasurement.Basedonacertainamountofsubjectivity,thesestandardsareoftenlesscertainandmoresensitivetovariationthanmaterialstandards.
Labour rate standard isthepredeterminedlabourratetobechargedtotheoutputcostforservicesrenderedbyalabourontheoutputjob.Thefixationofsuchastandardrequirescarefulattentiontothecompany’swagepaymentmethod.Standard labour rates are often the result of collectivebargainingagreementandunioncontracts.Themanagementhastoidentifytheclassoflabourssuitableforeachoperationandaccordinglyhastofixratesforeachgroup.Thus,thestandardwagerateisusuallyacompositeofmanywageratesassumingaspecificmixofemployeeskills.
Overhead Standards: Overheadstandardsaresetforvariableandfixedoverheads.AccordingtotheCharteredInstituteofManagementAccountants,London, a variable overhead is a costwhich tends to vary directlywiththevolumeofoutputwhereasfixedoverheadisacostwhichtends tobeunaffectedbyvariance in volumeof output.Such standards are set aftercarefulstudyofcost–volumeanalysis.Theseparationoffactoryoverheadcostsintofixedandvariablecomponentsallowsnotonlythepredictionofcostsbutalsoadetailedexaminationofhowcostsbehaverelativetovolume.Thisprovidesanopportunitytomanagementtostudythecoststructureinrelationtovolumesofoutput.
Actual Cost Accumulation
Theestablishmentofstandardsisfollowedbytheaccumulationofactualcostswhicharethencomparedwithstandardsinperformancereports.Foraccumulatingactualmanufacturingcost,firmsuseeitherajobordersystemor a process cost system.The applicationof standard costinggetsmuchinformationfromthecostdatathanispossiblewithjustactualcosts.Asoundsystemofstandardcostingwillhelpthemanagementdeterminethetypeofrequiredcostdataandreportsuchdata.
Analysis of Variances
A variance represents the difference between an actual cost and itscorrespondingstandardcostsofmaterial,labourandoverheads.Thevarianceisthemeasureofinefficienciesorefficiencies.Theobjectivesofvarianceanalysisareto:
NOTES
Self-InstructionalMaterial 185
Standard Cosing • indicatewhethercostsarebeingkeptundercontrol. • locateanyapparentdeficiencyincostcontrolefforts. • facilitatetheidentificationoftheprobablecausesofdeviationfrom
standard. • assignresponsibilityfordeviationsthatmayhaveoccurred.
Revision of Standards
Aseriousproblemfacedbythefirmsistodeterminewhenstandardsshouldberevised.Thesettingupofstandardforcostingisanoperationthatrequirescareful investigation and calculation. Consequently standards are notalteredexceptwhenconditionsonwhichsuchstandardsarebasedundergoconsiderable change.Usually changes in product specification, apparentpermanentchangesinmaterialprices,changesinmethodsofusinglabour,changesinlabourrates,etc.aresituationsthatrequirerevisionofstandards.Thuschangeinstandardsissubjecttoachangeintheconditionsuponwhichtheyarebased.However,someexpertsfeelthatrevisionofstandardsshouldbeacontinuousprocess.Accordingto themtheunrevisedstandardsmayfailtoevaluateperformanceproperly.Therefore,managementmustrevisestandardswhenever quantity or price changes significantly so that theycorrespond to current conditions.
Typically,changesinpricestandardsaremorepronouncedinpresent-daybusinessthanchangesinquantitystandards.Atpresent,almosteverybusinessfirmbearstheconsequencesofinflation,therefore,thepricestandardmustbeadjustedaccordingly.Suchadjustmentsshouldbemadebyusingpriceindexnumber.
Quantitystandardsmustberevisedwheneverthereareimprovementsorchangesinproductionprocedureand/ormixes.Accordingly,it isquiteusualforfirmstofreezequantitystandardsforlongerperiods.
Oftenthestandardsarenotenteredintheaccountingrecordsbutareusedasstatisticalsupplementsinarrivingatinformationforcontrolpurposes.However,whenastandardcostsystemistiedinwiththeaccountingsystem,anychangeinthestandarddemandsre-costingoffinishedgoodsinventoryandwork-in-progressinventory.
Check Your Progress
3.Listthefactorsthathaveadirectbearingontheworkers’performance. 4.Whatarethetwostandardsrequireforthesettingofdirectlabour
standard? 5.Mentiontheactivitywhichcomesaftertheestablishmentofstandards
in a standard costing system.
Standard Cosing
NOTES
Self-Instructional 186 Material
7.4 ANSWERS TO CHECK YOUR PROGRESS QUESTIONS
1.Budgetarycontroliswiderinscopeascomparedtostandardcosting.Budgetary control covers all aspects of the business, for example,production,purchase,sales,finance,incomes,expenditure,etc.Ontheotherhand,standardcostingtechniqueislimitedonlytoproductionand production cost.
2.Standard costing systemmakes it possible for themanagement topaymoreattentiontoweakareasthatrequirecontrolasitfollowstheprincipleofmanagementbyexception.
3.The important factors that have a direct bearing on theworkers’performanceinclude:• Employee’sattitude;• Organizationstructure;• Governmentregulations;• Performancefeedback;and• Labour-managementrelations.
4.Directlabourstandardrequiressettingoftwostandards,viz.,labourtimestandardandlabourratestandard.
5.Theestablishmentof standards is followedby theaccumulationofactualcostswhicharethencomparedwithstandardsinperformancereports. For accumulatingmanufacturing cost, firmsuse either joborder system or a process cost system.
7.5 SUMMARY
•Thestandardformsayardstickthatisusedtomeasureweight,quantity,qualityandvalue.
•Anestimatedcostisdeterminedonbasisoftheaveragepastperformanceand,therefore,canberegardedasareasonableassessmentofwhatacost“willbe”.
•Standardcostisthecostthatwouldbeincurredunderthemostefficientoperatingconditionsandisforecastbeforethemanufacturingprocessbegins
•A budgeted cost is viewed as future cost (prediction, estimate,forecast) thatisformallycombinedintoanintegratedplanofaction.
•Standardcostingisaprocedureunderwhichpredeterminedcostsareusedtomeasuretheefficiencyofproduction.
NOTES
Self-InstructionalMaterial 187
Standard Cosing •The standard costing systembeginswith the establishment of thecostcentrewhichisusuallyaprocess,oranoperationoranitemofequipmentetc.Itisaunitofactivitywithinthefactorytowhichcostsmaybepracticallyandequitablyassigned.
• Idealstandardsaresetatthelevelofmaximumefficiency,representingconditionsthatcanseldomifeverybeattainable.
•Normalstandardsarethestandardsthatcanbeachievedbyefficientworkingandefficientmanagement.Theyallowfornormalworkersperformanceinnormalsettings.
•Basicstandardsprovideameasuringscaleforperformanceoveralongperiod of time.
•Attainablestandardsbasedonpastperformance,canbeachievedwithreasonableeffort.
•Directmaterialstandardsrepresenttheamountofmaterialcosttobeincurred for producing a unit of output.
•DirectLabourStandard represents theamountof labourcost tobechargedtototaloutputcost.
•LabourRateStandardisthepre-establishedlabourratetobechargedtotheoutputcostfortheservicesrenderedbyalabouronaoutputjob.
•Overheadstandardisacostwhichtendstovarydirectlywiththevolumeof output.
• Fixedoverheadisacostwhichtendstobeunaffectedbyvarianceinvolumeofoutput.
•Avariance represents thedifferencebetweenanactualcostand itscorrespondingstandardcostsofmaterial,labourandoverheads.
7.6 KEY WORDS
•Estimated cost:Itisacostdeterminedonthebasisoftheaveragepastperformance.
•Budgeted cost:Itisviewedasfuturecostthatisformallycombinedintoanintegratedplanofaction.
•Standard costing:Itisasystemwhichattemptstopredeterminecostswithanaimtomeasuretheefficiencyofproduction.
•Cost centre:Itisaunitofactivitywithinthefactorytowhichcostsmaybepracticallyandequitablyassigned.
•Variance: It represents thedifferentbetweenanactualcostand itscorrespondingstandardcostsofmaterial,labourandoverheads.
Standard Cosing
NOTES
Self-Instructional 188 Material
7.7 SELF ASSESSMENT QUESTIONS AND EXERCISES
Short-Answer Questions
1.Mentionthestepsinthestandardcostingsystem. 2.Whatdoesthestandardcostofaproductconsistof? 3.Brieflydescribethedifferenttypesofstandards.
Long-Answer Questions
1.Differentiatebetweenstandardcosting,historicalcostingandbudgetarycontrol.
2.Explaintheadvantagesandlimitationsofstandardcosting. 3.Describethemainactivitiesofasoundstandardcostingsystem.
7.8 FURTHER READINGS
Sahaf,M.A.2013.Management Accounting: Principles and Practice,3rdedition.NewDelhi:VikasPublishingHouse.
Arora,M.N.2012.A textbook of Cost and Management Accounting,10thedition.NewDelhi:VikasPublishingHouse.
Maheshwari,S.N.,SuneelK.andSharadK.2018.A Textbook of Accounting for Management,4thedition.NewDelhi:VikasPublishingHouse.
NOTES
Self-InstructionalMaterial 189
Variance Analysis
UNIT 8 VARIANCE ANALYSISStructure 8.0 Introduction 8.1 Objectives 8.2 VariancesAnalysis:Meaning,SignificanceandTypes 8.3 DirectMaterialVariance 8.4 LabourVariances 8.5 OverheadVariance 8.6 PracticalProblems 8.7 AnswerstoCheckYourProgressQuestions 8.8 Summary 8.9 Key Words 8.10 SelfAssessmentquestionsandExercise 8.11 FurtherReadings
8.0 INTRODUCTION
Inthepreviousunit,youwereintroducedtothestepsinvolvedinthestandardcostingprocess.Oncethestandardsareestablishedandthecostsaccumulated,theanalysisofvarianceisdone.Varianceanalysisistheprocessofanalysingvariancesbysub-dividingthetotalvarianceinsuchawaythatmanagementcan assign responsibility for anyoff standardperformance.According toCIMA,London,Terminology,varianceanalysisistheprocessofcomputingtheamountofvarianceandisolatingthecausesofvariancebetweenactualandstandard.Animportantaspectofvarianceanalysisistheneedtoseparatecontrollablefromuncontrollablevariances.Adetailedanalysisofcontrollablevarianceswillhelpthemanagementtoidentifythepersonsresponsibleforitsoccurrencesothatcorrectiveactioncanbetaken.Inthisunit,youwilllearnaboutthemeaning,significanceandtypesofvarianceanalysis.
8.1 OBJECTIVES
Aftergoingthroughthisunit,youwillbeableto: • Describethemeaning,significanceandtypesofvarianceanalysis • Explainthecomputationsofmaterial,labourandoverheadsvariances
8.2 VARIANCES ANALYSIS : MEANING, SIGNIFICANCE AND TYPES
Varianceisthedifferencebetweenactualcostsandstandardcostsduringanaccountingperiod.Itreferstovariationofactualresultswithplannedresults.Varianceanalysisisasystematicprocesswhichanalysesandinterpretsthevariances. It refers to thebreakingdownof total variances intodifferentcomponents.Normally,variancescantaketwoforms,viz.,
Variance Analysis
NOTES
Self-Instructional 190 Material
•Favourable variances—whenactualcostsarelessthanthestandardcosts; and
•Unfavourable variances—whenactualcostsexceedthestandardcosts.Sometimesactualresultsarejustequaltoplannedresults;thesituation
isknownaszero variance.Asystematicanalysisofvarianceswouldhelpmanagerstoimprove
performancebycontinuingactivitiesthatresultinfavourablevariancesandmodifyingotheractivitiestoeliminateorreduceunfavourablevariances.
Thus,ithelpsinmonitoringandimprovingafirm’sperformance.Inmakingvarianceevaluation,themanagementoftenemploystheprinciplesofexception.Themanagementpays lessattentiononsuchvariances thatindicateinsignificantdeviationsandconcentratesuponthosethatdemanddetailedinvestigationandcorrectiveaction.
Significance
Thefollowingarethesomeofthepointsreflectingthesignificanceofvarianceanalysis: • Itisbeneficialformakingcomparisonsbetweenbudgetedandactuals
thereforehelpsinfutureplanningandsettingbusinessgoals. • Ithelpsinidentifyingreasonsforvarianceandthereforehelpsintaking
corrective action. • Difference sub-divisions helps infindingout detailed relationships
betweenvariances. • Ithelpsinassigningresponsibilityforeveryvariance. • Itisbeneficialforthecostcontrolandcostreductionprocess. • Itrevealsthedegreeofinefficiency. • It helps in communicating the unfavourable variances to the
management. • Itassistswithproperprofitplanning. • Ithelps increatingacost-consciousenvironment foremployees to
workaccordingly.
Types of Variances
Variancesarecomputedforallthethreebasiccostelementsofmanufacturing—directmaterial,directlabourandmanufacturingoverheads.Thus,therearethreetypesofvariances,viz.,: • directmaterialvariance; • directorlabourvariance;and • overheadvariance.
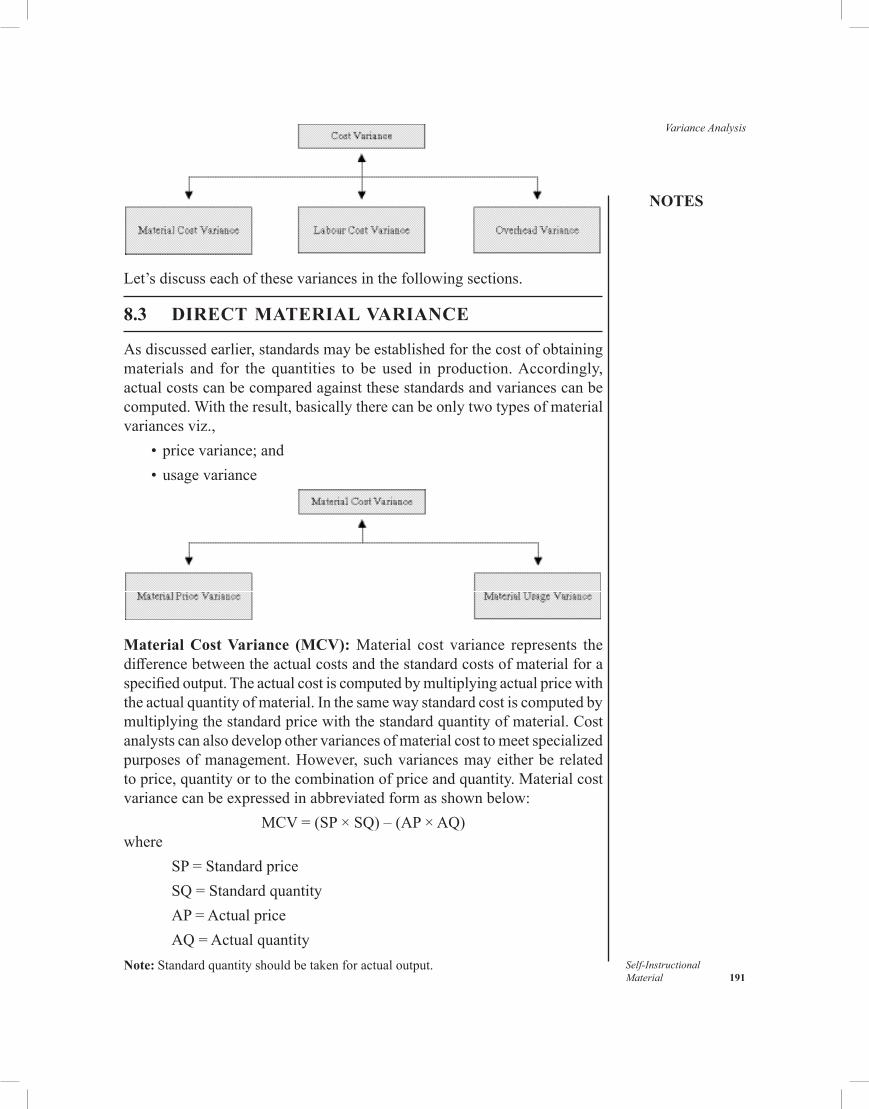
NOTES
Self-InstructionalMaterial 191
Variance Analysis
Let’s discuss each of these variances in the following sections.
8.3 DIRECT MATERIAL VARIANCE
As discussed earlier, standards may be established for the cost of obtaining materials and for the quantities to be used in production. Accordingly, actual costs can be compared against these standards and variances can be computed. With the result, basically there can be only two types of material variances viz., • pricevariance;and • usagevariance
Material Cost Variance (MCV): Material cost variance represents the differencebetweentheactualcostsandthestandardcostsofmaterialforaspecifiedoutput.Theactualcostiscomputedbymultiplyingactualpricewiththe actual quantity of material. In the same way standard cost is computed by multiplying the standard price with the standard quantity of material. Cost analysts can also develop other variances of material cost to meet specialized purposes of management. However, such variances may either be related to price, quantity or to the combination of price and quantity. Material cost variance can be expressed in abbreviated form as shown below:
MCV = (SP × SQ) – (AP × AQ)where
SP = Standard price SQ = Standard quantity AP = Actual price AQ = Actual quantity
Note: Standard quantity should be taken for actual output.
Variance Analysis
NOTES
Self-Instructional 192 Material
Illustration 8.1: Compute material cost variance for a output of 200 units from the information given below:
Standard quantity = 3 kg. per unit of outputStandard price = ` 2 per kg.Actual quantity consumed = 550 kg.Actual price = ` 3 per kg.
SolutionMaterialcostvariance=(Totalstandardcost–Totalactualcost) MCV = (SP × SQ) – (AP × AQ) = (2 × 600) – (3 × 550) = 1,200 – 1,650 = ` 450 unfavourable.
Material Price Variance (MPV):Thematerialpricevarianceattemptstomeasure the variance between the actual cost of material and the standard costexpectedtobepaidforthematerial.Itreflectstheactualunitofmaterialabove or below the standard unit cost, multiplied by the actual quantity of material used. Management sets price for each class of material. A systematic andscientificpurchasingfunctionwillattainthestandardprice.Thepaymentof lower prices by the purchasing department for a given quantity would result in a favourable material price variance and thereby maintain the required standard;whereaspurchasingdepartmentwillfailtomeetthestandardifitpayshigherpricesthatwillreflectanunfavourablematerialpricevariance.Thematerialpricevarianceiscomputedasfollows:Material price variance = (Standard price – Actual price) × Actual quantityor MPV = (SP – AP) × AQIllustration 8.2: Calculate material price variance from the information as given in Illustration 8.1SolutionMaterial price variance = (Standard price – Actual price) × Actual quantity MPV = (2 – 3) × 550 = 1 × 550 = ` 550 unfavourable.Material Usage Variance (MUV): Material usage variance is the deviation causedduetodifferenceinthestandardandactualquantitiesused.Itindicatesthe actual quantity of direct material used above or below the standard price. Thematerialusagevarianceiscomputedwiththehelpoffollowingformula:
NOTES
Self-InstructionalMaterial 193
Variance AnalysisMaterial usage variance = (Standard quantity –Actual quantity) × Standard price
or MUV=(SQ–AQ)×SPThisvariancecanalsobecalculatedasfollows:Material usage variance = (Standard price of standard quantity
–Standardpriceofactualquantity)or MUV=(SPSQ–SPAQ)
Illustration 8.3:With the help of information given in Illustration 8.1,calculatematerialusagevariance.Solution
Material usage variance = (Standard quantity –Actual quantity) × Standard price
MUV =(600–550)×2 = 50 × 2 = `100favourableor MUV =(Standardpriceofstandardquantity –Standardpriceofactualquantity) =1,200–1,100 = `100favourable
Illustration 8.4:Suba,anengineering industrialenterprisemanufactured100 itemsof product ‘EXX’.Computematerial cost variances from theinformationgivenbelow:
Standardquantity 2kgperitem Standard price `5perkg Actualquantity 3kgperitem Actualprice `4perkg
Solution Material Cost Variance = (Standard cost – Actual cost) MCV = (SQ × SP) – (AQ × AP) = (200 × 5) – (300 × 4) = 1,000 – 1,200 = – ` 200 unfavourableMaterial price variance = (Standard price – Actual price) × Actual quantity MPV = (5 – 4) × 300 = 1 × 300 = ` 300 favourable Materialusagevariance = (Standardquantity –Actual quantity) × Standard price MUV =(200–300)×5=100×5 = `500unfavourable
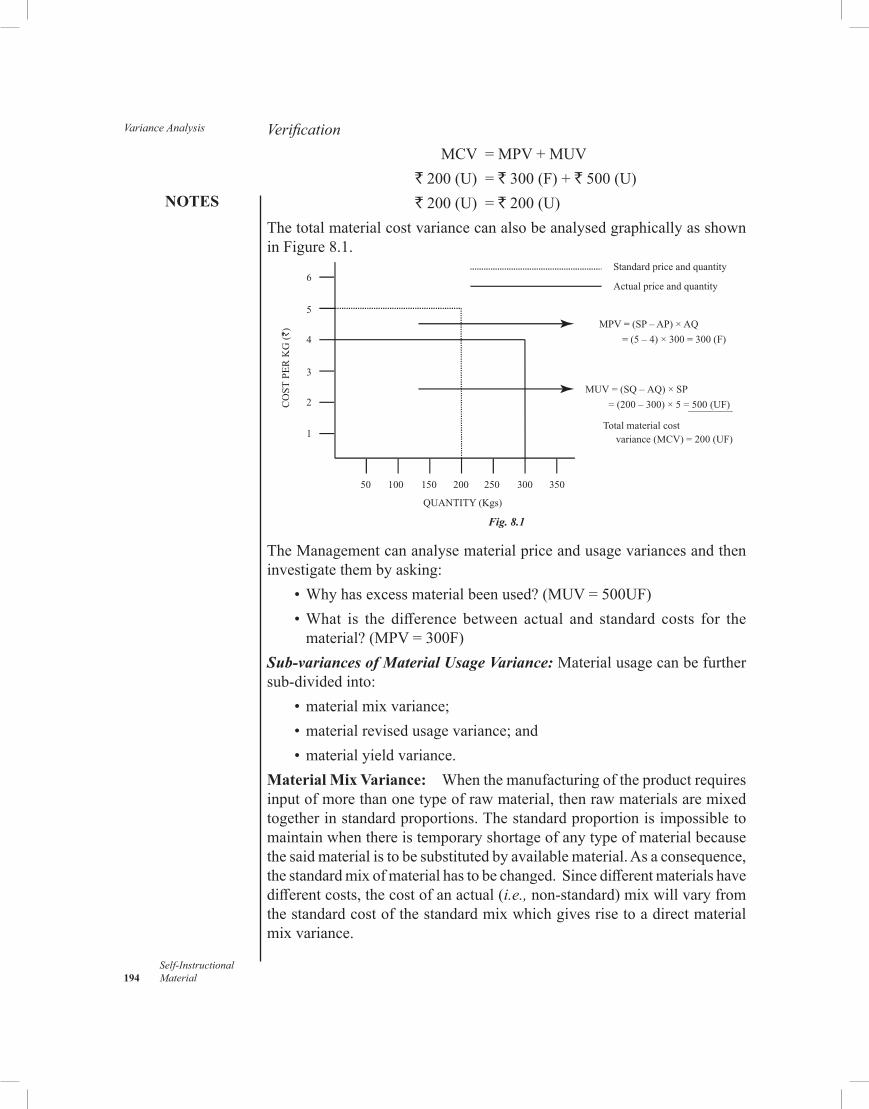
Variance Analysis
NOTES
Self-Instructional 194 Material
Verification MCV =MPV+MUV `200(U) =`300(F)+`500(U) `200(U) =`200(U)ThetotalmaterialcostvariancecanalsobeanalysedgraphicallyasshowninFigure8.1.
50 100 150 200 250
QUANTITY (Kgs)
Standard price and quantity
CO
ST P
ER
KG
(`)
Actual price and quantity
300 350
Total material cost variance (MCV) = 200 (UF)
6
5
4
3
2
1
MPV = (SP – AP) × AQ
= (5 – 4) × 300 = 300 (F)
MUV = (SQ – AQ) × SP
= (200 – 300) × 5 = 500 (UF)
Fig. 8.1
TheManagementcananalysematerialpriceandusagevariancesandtheninvestigatethembyasking: •Whyhasexcessmaterialbeenused?(MUV=500UF) •What is the difference between actual and standard costs for the
material?(MPV=300F)Sub-variances of Material Usage Variance: Materialusagecanbefurthersub-dividedinto: •materialmixvariance; •materialrevisedusagevariance;and •materialyieldvariance.Material Mix Variance: Whenthemanufacturingoftheproductrequiresinputofmorethanonetypeofrawmaterial,thenrawmaterialsaremixedtogetherinstandardproportions.Thestandardproportionisimpossibletomaintainwhenthereistemporaryshortageofanytypeofmaterialbecausethesaidmaterialistobesubstitutedbyavailablematerial.Asaconsequence,thestandardmixofmaterialhastobechanged.Sincedifferentmaterialshavedifferentcosts,thecostofanactual(i.e.,non-standard)mixwillvaryfromthestandardcostofthestandardmixwhichgivesrisetoadirectmaterialmixvariance.
NOTES
Self-InstructionalMaterial 195
Variance AnalysisAccording to theChartered Institute ofManagementAccountants,London,materialmixvarianceisthat portion of the direct material usage variance which is due to the difference between the standard and actual composition of the mixture.Thisvariancecanbeexpressedbythefollowingformulas: •Materialmixvariance=(standardcostofstandardmix–standardcost
ofactualmix*) •Materialmixvariance=(revisedstandardmixofactualinput–actual
mix)×Standardprice •The revised standardmix is computedwith the help of following
formula:
Note: Iftotalweightofstandardmixandtotalweightofactualmixissame,theRevisedstandardquantitymixisnotrequiredtobecalculated.
Illustration 8.5:Computematerialmixvariancefromtheinformationgivenbelow:
Material Standard Actual
Quantity (kg)
Price (`)
Value (`)
Quantity (kg)
Price (`)
Value (`)
X 60 4 240 50 3 150Y 40 2 80 40 3 120Z 30 3 90 40 4 160
130 410 130 430
Solution Thecomputationofmaterialmixvariancerequires,revisedstandardquantitywhichiscalculatedasunder:
Theaboveresultsclearlyrevealthattherevisedstandardmixisequaltothestandardmix.Undersuchasituationformulaforthecalculationofmaterialmixisthesameasforcalculatingmaterialusagevariance.
*Standardcostofstandardmixandactualmixistobecalculatedforactualquantityofoutput.
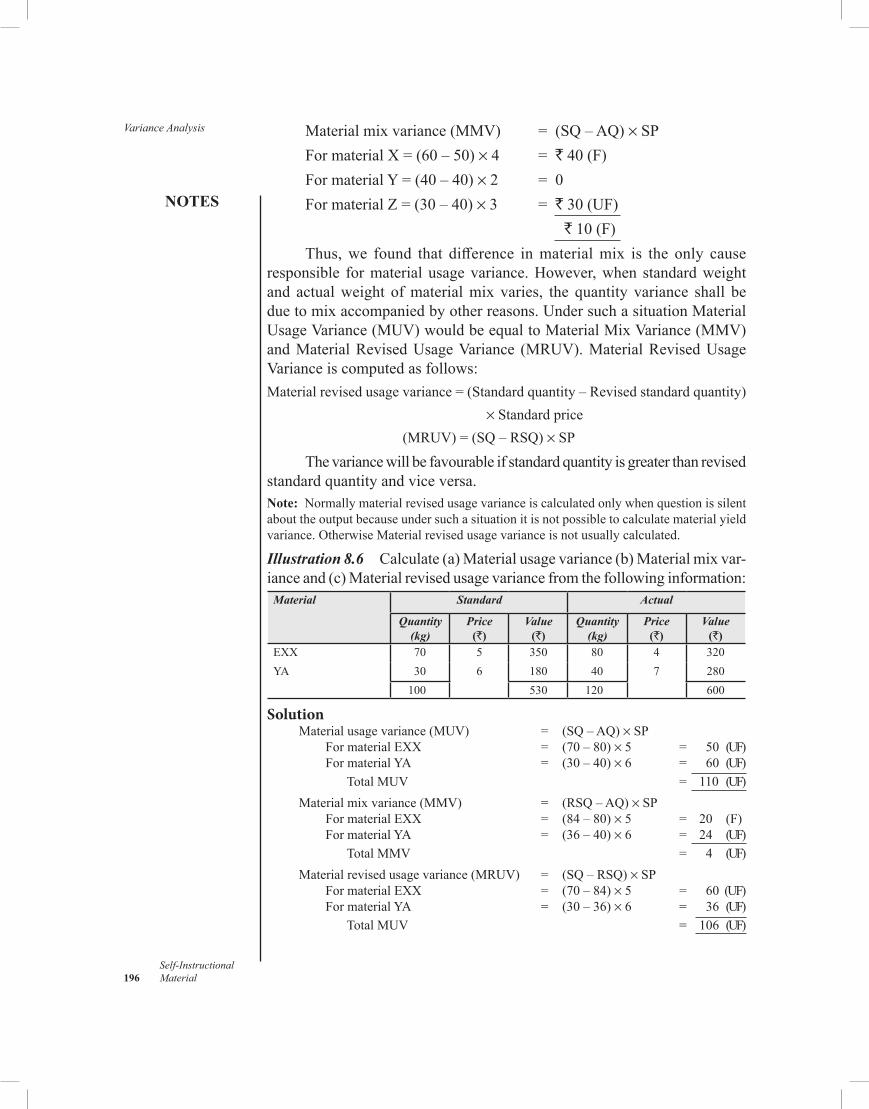
Variance Analysis
NOTES
Self-Instructional 196 Material
Materialmixvariance(MMV) = (SQ–AQ)×SPFormaterialX=(60–50)× 4 = `40(F)FormaterialY=(40–40)× 2 = 0FormaterialZ=(30–40)× 3 = `30(UF) 10(F)Thus,we found that difference inmaterialmix is the only cause
responsible formaterial usagevariance.However,when standardweightand actualweight ofmaterialmix varies, the quantity variance shall beduetomixaccompaniedbyotherreasons.UndersuchasituationMaterialUsageVariance(MUV)wouldbeequaltoMaterialMixVariance(MMV)andMaterialRevisedUsageVariance (MRUV).MaterialRevisedUsageVarianceiscomputedasfollows:Materialrevisedusagevariance=(Standardquantity–Revisedstandardquantity) × Standard price (MRUV)=(SQ–RSQ)×SP
Thevariancewillbefavourableifstandardquantityisgreaterthanrevisedstandardquantityandviceversa.Note: Normallymaterialrevisedusagevarianceiscalculatedonlywhenquestionissilentabouttheoutputbecauseundersuchasituationitisnotpossibletocalculatematerialyieldvariance.OtherwiseMaterialrevisedusagevarianceisnotusuallycalculated.
Illustration 8.6 Calculate(a)Materialusagevariance(b)Materialmixvar-ianceand(c)Materialrevisedusagevariancefromthefollowinginformation:
Material Standard Actual
Quantity (kg)
Price (`)
Value (`)
Quantity (kg)
Price (`)
Value (`)
EXX 70 5 350 80 4 320YA 30 6 180 40 7 280
100 530 120 600
Solution Materialusagevariance(MUV) = (SQ–AQ)×SP FormaterialEXX = (70–80)×5 = 50 (UF) FormaterialYA = (30–40)×6 = 60 (UF) TotalMUV = 110 (UF) Materialmixvariance(MMV) = (RSQ–AQ)×SP FormaterialEXX = (84–80)×5 = 20 (F) FormaterialYA = (36–40)×6 = 24 (UF) TotalMMV = 4 (UF) Materialrevisedusagevariance(MRUV) = (SQ–RSQ)×SP FormaterialEXX = (70–84)×5 = 60 (UF) FormaterialYA = (30–36)×6 = 36 (UF) TotalMUV = 106 (UF)
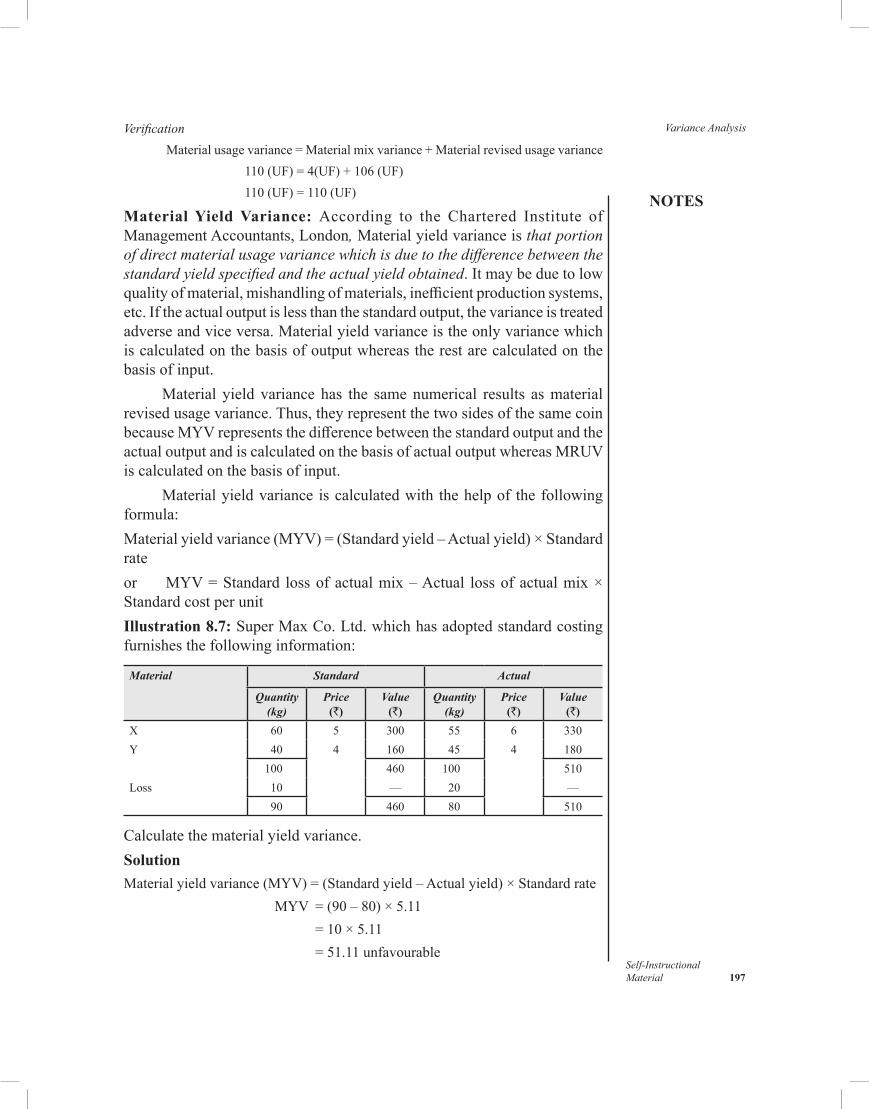
NOTES
Self-InstructionalMaterial 197
Variance AnalysisVerification
Materialusagevariance=Materialmixvariance+Materialrevisedusagevariance 110(UF)=4(UF)+106(UF) 110(UF)=110(UF)
Material Yield Variance: According to the Chartered Institute ofManagementAccountants,London, Materialyieldvarianceisthat portion of direct material usage variance which is due to the difference between the standard yield specified and the actual yield obtained.Itmaybeduetolowqualityofmaterial,mishandlingofmaterials,inefficientproductionsystems,etc.Iftheactualoutputislessthanthestandardoutput,thevarianceistreatedadverseandviceversa.Materialyieldvarianceistheonlyvariancewhichiscalculatedonthebasisofoutputwhereastherestarecalculatedonthebasis of input.
Material yield variance has the samenumerical results asmaterialrevisedusagevariance.Thus,theyrepresentthetwosidesofthesamecoinbecauseMYVrepresentsthedifferencebetweenthestandardoutputandtheactualoutputandiscalculatedonthebasisofactualoutputwhereasMRUViscalculatedonthebasisofinput.
Materialyieldvariance iscalculatedwith thehelpof thefollowingformula:Materialyieldvariance(MYV)=(Standardyield–Actualyield)×Standardrateor MYV=Standard lossofactualmix–Actual lossofactualmix × Standard cost per unitIllustration 8.7:SuperMaxCo.Ltd.whichhasadoptedstandardcostingfurnishesthefollowinginformation:
Material Standard Actual
Quantity (kg)
Price (`)
Value (`)
Quantity (kg)
Price (`)
Value (`)
X 60 5 300 55 6 330Y 40 4 160 45 4 180
100 460 100 510Loss 10 — 20 —
90 460 80 510
Calculatethematerialyieldvariance.SolutionMaterialyieldvariance(MYV)=(Standardyield–Actualyield)×Standardrate MYV=(90–80)×5.11 = 10 × 5.11 =51.11unfavourable
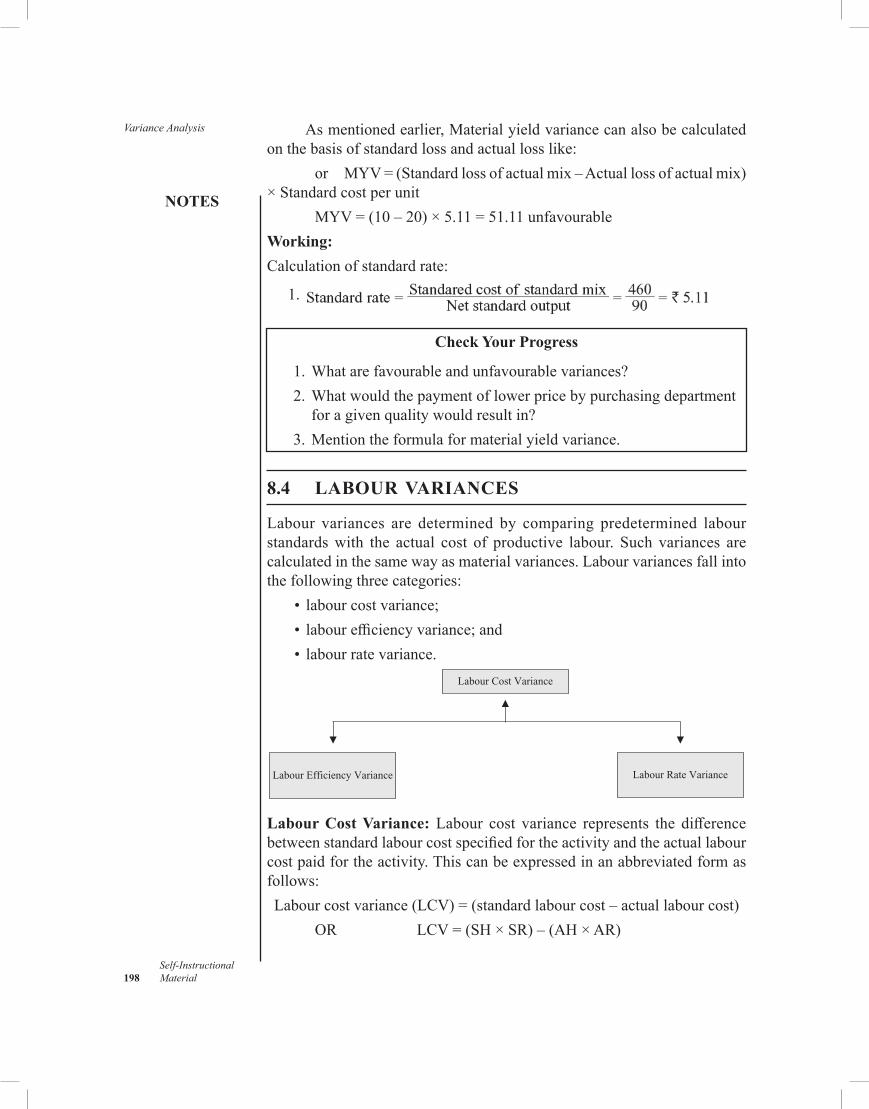
Variance Analysis
NOTES
Self-Instructional 198 Material
Asmentionedearlier,Materialyieldvariancecanalsobecalculatedonthebasisofstandardlossandactuallosslike:
or MYV=(Standardlossofactualmix–Actuallossofactualmix)× Standard cost per unit
MYV=(10–20)×5.11=51.11unfavourableWorking:Calculationofstandardrate:
1.
Check Your Progress
1.Whatarefavourableandunfavourablevariances? 2.Whatwouldthepaymentoflowerpricebypurchasingdepartment
foragivenqualitywouldresultin? 3.Mentiontheformulaformaterialyieldvariance.
8.4 LABOUR VARIANCES
Labour variances are determined by comparing predetermined labourstandardswith the actual cost of productive labour. Such variances arecalculatedinthesamewayasmaterialvariances.Labourvariancesfallintothefollowingthreecategories: • labourcostvariance; • labourefficiencyvariance;and • labourratevariance.
Labour Cost Variance
Labour Efficiency Variance Labour Rate Variance
Labour Cost Variance: Labour cost variance represents the differencebetweenstandardlabourcostspecifiedfortheactivityandtheactuallabourcostpaidfortheactivity.Thiscanbeexpressedinanabbreviatedformasfollows:Labourcostvariance(LCV)=(standardlabourcost–actuallabourcost) OR LCV=(SH×SR)–(AH×AR)
NOTES
Self-InstructionalMaterial 199
Variance Analysiswhere,SH=standardhourSR=standardrateAH=actualhourAR=actualrate
Illustration 8.8: EXYAengaged75workersatanaveragerateof` 3 per day.Theworkwascompletedwithin4days.Thestandardcostsetforthespecifiedworkamountsto`850.Computelabourcostvariance.Solution
Labourcostvariance(LCV) =(850)–(75×4×3) =(850–900) = `50unfavourable
Labour Efficiency Variance:Labourefficiencyhasdirecteffectonlabourcost.Labourefficiencyvarianceindicatesthenumberofactualdirectlabour(intermsofhours)workedaboveorbelowthestandardfortheactuallevelofproductionatstandardprice.Thelabourquantityvarianceismeasuredinmuchthesamewayasthematerialquantityvariance.Suchavarianceiscausedbyusingmoreorlesslabourthanthestandardfortheoutputproduced.Iftimeconsumedonactualworkislessthanstandard,labourhasbeenusedefficientlyandaccordinglylabourefficiencyvarianceisfavourable.Inthesameway, labour efficiency variance is unfavourablewhen actual timeconsumedismorethanthestandardlabourtime.Labourefficiencyvariancecanbedeterminedbyapplyingthefollowingformula:
Labourefficiencyvariance(LEV)=(Standardhours–Actualhours)×StandardrateperhourIllustration 8.9: EXXCompanysets30hoursatawagerateof`4perhourforagiventask.Thegiventaskwascompletedwithin7dayswith4hoursofdailywork.Computelabourefficiencyvariance.Solution
Labourefficiencyvariance =(30–28)×4 = 2 × 4 = `8favourable
Labour Rate Variance:Labourratevariancerepresentstheaverageoftheactualhourlyratepaidaboveorbelowthestandardhourlyrate,multipliedbytheactualnumberofhoursworked.Suchvarianceisoftencreatedbytransferringworkerswithhighpayratestojobsthatcallforlowstandardratesorbyauthorizingovertimeworkatpremiumpay.Thelabourratevariancemaybeexpressedasaformula:
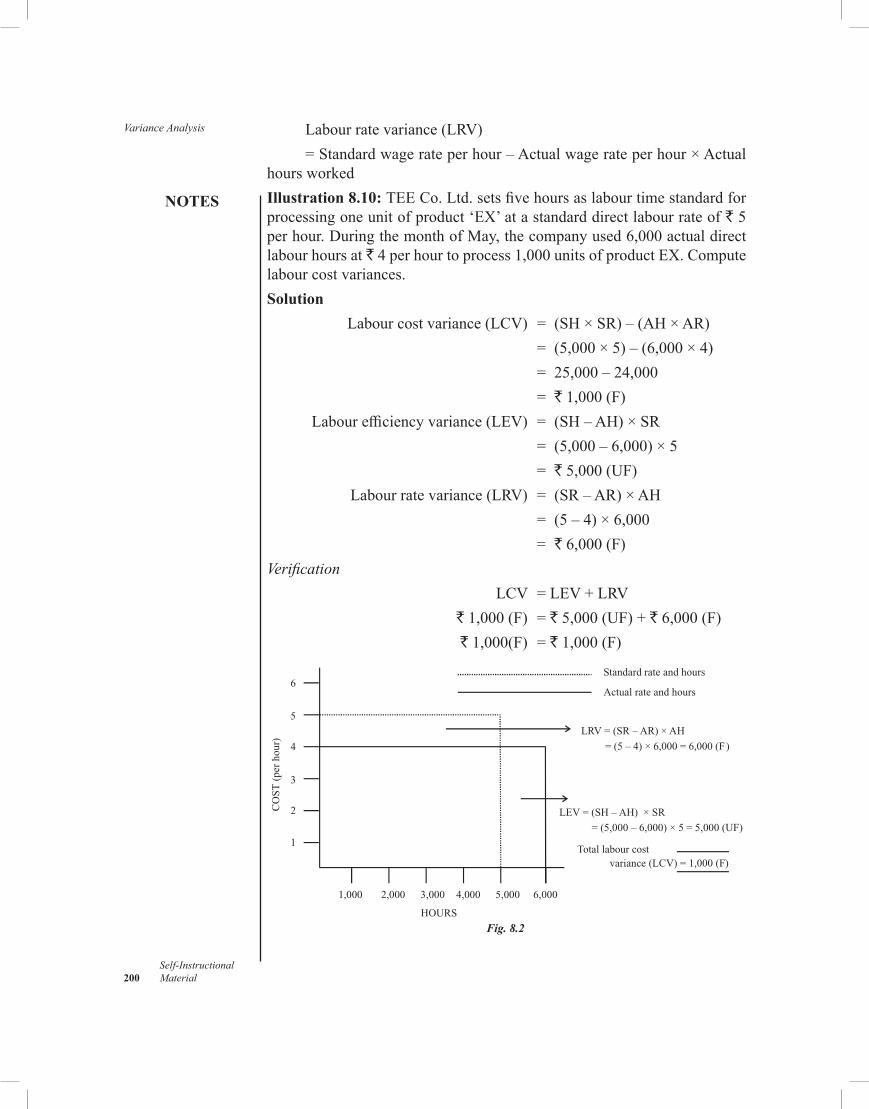
Variance Analysis
NOTES
Self-Instructional 200 Material
Labourratevariance(LRV)=Standardwagerateperhour–Actualwagerateperhour×Actual
hoursworkedIllustration 8.10: TEECo.Ltd.setsfivehoursaslabourtimestandardforprocessingoneunitofproduct‘EX’atastandarddirectlabourrateof` 5 perhour.DuringthemonthofMay,thecompanyused6,000actualdirectlabourhoursat`4perhourtoprocess1,000unitsofproductEX.Computelabourcostvariances.Solution
Labourcostvariance(LCV)= (SH×SR)–(AH×AR) = (5,000×5)–(6,000×4) = 25,000–24,000 = `1,000(F) Labourefficiencyvariance(LEV) = (SH–AH)×SR = (5,000–6,000)×5 = `5,000(UF) Labourratevariance(LRV)= (SR–AR)×AH = (5–4)×6,000 = `6,000(F)
Verification
LCV=LEV+LRV `1,000(F) =`5,000(UF)+`6,000(F) `1,000(F) =`1,000(F)
1,000 2,000 3,000 4,000 5,000
HOURS
Standard rate and hours
Actual rate and hours
6,000
Total labour cost variance (LCV) = 1,000 (F)
6
5
4
3
2
1
LRV = (SR – AR) × AH
= (5 – 4) × 6,000 = 6,000 (F)
LEV = (SH – AH) × SR
= (5,000 – 6,000) × 5 = 5,000 (UF)
CO
ST (
per
hour
)
Fig. 8.2
NOTES
Self-InstructionalMaterial 201
Variance AnalysisTheabovelabourcostvariancecanbeanalysedgraphicallyasshowninFigure8.2.Idle Time Variance:Managementmustconsideridletimewhilecalculatinglabourcostvariance.Idletimerepresentstheamountofperiodforwhichworkers would not work due to abnormal happenings likemachinebreakdowns,powerfailure,lockouts,etc.Idletimemustbeseparatedfromactualworking hours otherwiseworkersmaybe blamed for an adverseefficiencyvariancewhichhas,infact,nothingtodowiththem.Thus,idletimevarianceshouldbesegregatedfromlabourefficiencyvariance.Idletimevariance is computed as under:
Idletimevariance=Idlehours×StandardhourlyrateExample: IfinIllustration8.10,6,000actualhoursinclude500hoursofidletimethenanadverseidlevariancewouldariseandiscalculatedasfollows:
Idletimevariance =Idlehours×Standardhourlyrate = 500 × 5 = `2,500adverseThiswouldincreasetheefficiencyvariancebyasimilaramount,i.e.,
from5,000(UF)to2,500(UF)becausetheefficiencyvarianceshallnotbecalculatedonthebasisof5,500hours,i.e.,theactualtimeworkedonthejob.
Labourefficiencyvariance=(5,000–5,500)×5 = `2,500(UF)Undersuchasituationlabourcostvariancewouldbeequaltolabour
ratevariance,labourefficiencyvarianceandlabouridletimevariance.Thus: LCV =LRV+LEV+LITV =6,000(F)+2,500(UF)+2,500(UF) = `1,000(F)
Labour Mix Variance (LMV):Likematerialmix variance, labourmixvarianceispossiblewheremorethanonetypeoflabourisusedforthejob.Labourmixvariancerepresentsthevarianceduetothechangeinstandardandactual labour forcecomposition.Thisvariance iscalculatedwith thehelpoffollowingformula: Labourmixvariance= (Revised standard hours –Actual hours) × Standard rate LMV=(RSH–AH)×SR
Thus,labourmixvariancecomparesactualhourswithrevisedstandardhoursandiscalculatedasunder:
Variance Analysis
NOTES
Self-Instructional 202 Material
Likematerialmixvariance,ifactualandstandardhoursofthelabourmixaresame,thenlabourefficiencyvariancecanbetheresultofdifferenceinlabourmixonly.However,whenstandardandactualhoursoflabourmixvary,labourefficiencyvarianceshallbeduetomixaswellasduetoreasonsotherthanmix.Theformulausedforcalculatinglabourmixvariancewhenstandardandactualhoursforthelabourmixaresame,isasunder:
Labourmixvariance=(Standardcostofstandardlabourmix –Standardcostofactuallabourmix)
Illustration 8.11:CalculateLabourmixvariancefromthefollowing:
Material Standard Actual
Hours Rate (`)
Amount (`)
Hours Rate (`)
Amount (`)
Men 600 3 1,800 550 4 2,200Women 800 2 1,600 850 1.50 1,275
1,400 3,400 1,400 3,475
SolutionInthisillustrationtotalstandardandactualhoursarethesame,therefore,forthecalculationofLabourmixvariance,thefollowingformulawillbemore appropriate:
Labourmixvariance=Standardcostofstandardmix–StandardcostofactualmixThus,
LMV = (SR×SH)–(SR×AH) Formen = (3×600)–(3×550) = 1,800–1,650 = `150(F) Forwomen = (2×800)–(2×850) = 1,600–1,700 = `100(A) LMV = 150(F)+100(A) = `50(F)Thus,fromtheaboveresults, it isclear that labourmixvariance is
onlyduetochangeinmix,therefore,labourmixvarianceisalsoequaltolabourefficiencyvarianceinthisillustrationwhichalsoamountsto50(F)ascalculatedunder:
Labourefficiencyvariance(LEV) =(SH–AH)×SR Formen =(600–550)×3=150(F) Forwomen =(800–850)×2=100(UF) LEV =50(F)
NOTES
Self-InstructionalMaterial 203
Variance AnalysisIllustration 8.12: ComputeLabourmixvariancefromtheinformationgivenbelow:
Material Standard Actual
Hours Rate (`)
Amount (`)
Hours Rate (`)
Amount (`)
Skilled 75 4 300 80 5 400Unskilled 50 3 150 70 2 140
125 450 150 540
SolutionIn this illustration, standard and actual labourmixdiffers, therefore, thestandardlabourmixistoberevisedinthecomputationoflabourmixvarianceandaccordinglythefollowingformulawillbeusedforthepurpose:Labourmixvariance=(Revisedlabourhours–Actualhours)× Standard rate Forskilledworkers = (90*–80)× 4 = 10 × 4 = `40(F) Forunskilledworkers = (60*–70)× 3 = 10 × 3 = `30(UF) TotalLMV = `40(F)+`30(UF) = `10(F)*Calculation of revised standard hours
Forskilledworkers =75/125×150=90hoursForunskilledworkers =50/25× 150 = 60 hoursLabourefficiencyvarianceintheaboveproblemistheresultoflabour
mixvarianceandlabourrevisedefficiencyvariance.Inordertoverifythesame,wehave tocalculate labourefficiencyvarianceand labour revisedefficiencyvariancefromit.Butbeforewemaydoso,letushavefirstsomediscussiononlabourrevisedefficiencyvariance.Labour Revised Efficiency Variance (LREV):Labourrevisedefficiencyvariancerepresentsthedeviationbetweenthestandardlabourhoursspecifiedfortheactivityachievedandthelabourtimespentforthesame.Theformulaforsuchavariancewillbe:Labour revised efficiencyvariance= (Standardhour –Revised standard hours)×Standardrate
Labourrevisedefficiencyvarianceisfavourableiftherevisedstandardhours(RSH)arelessthanstandardhours(SH)andviceversa.
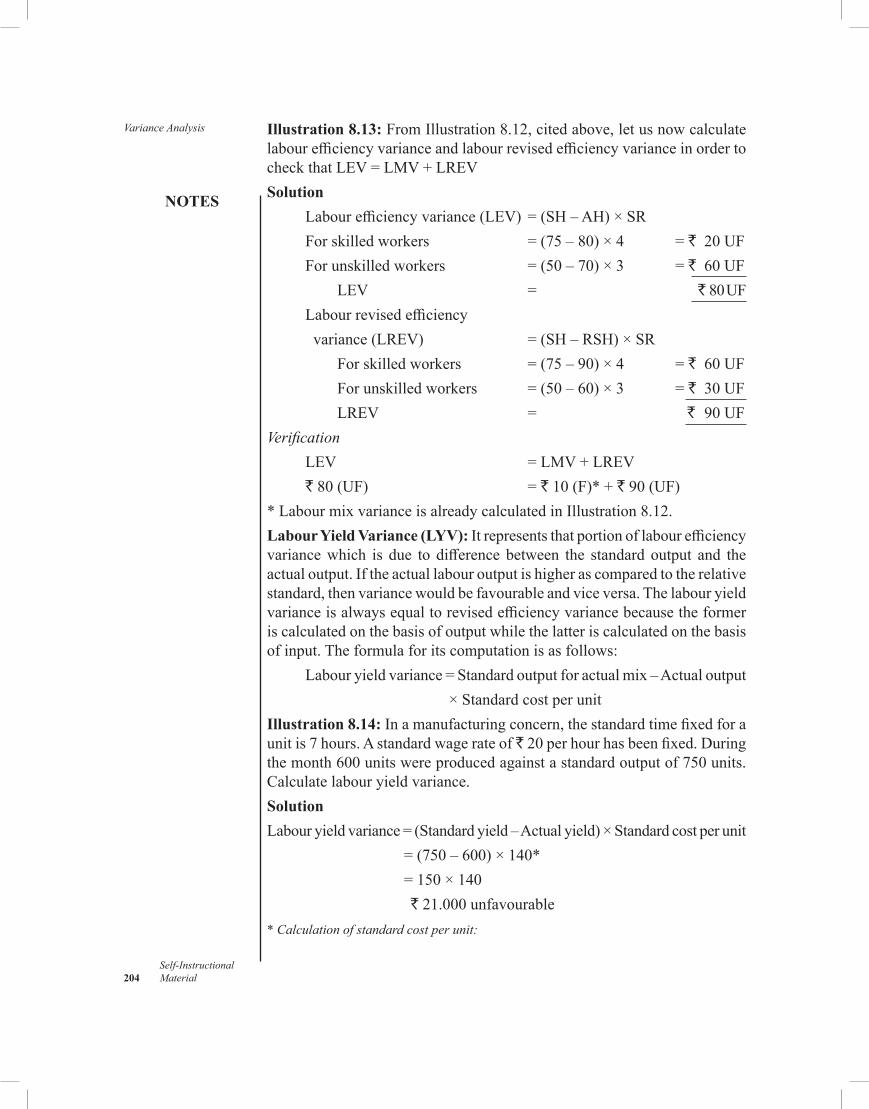
Variance Analysis
NOTES
Self-Instructional 204 Material
Illustration 8.13:FromIllustration8.12,citedabove,letusnowcalculatelabourefficiencyvarianceandlabourrevisedefficiencyvarianceinordertocheckthatLEV=LMV+LREVSolution
Labourefficiencyvariance(LEV)=(SH–AH)×SRForskilledworkers =(75–80)×4 =`20UFForunskilledworkers =(50–70)×3 =`60UF LEV = `80UFLabourrevisedefficiency variance(LREV) =(SH–RSH)×SR Forskilledworkers =(75–90)×4 =`60UF Forunskilledworkers =(50–60)×3 =`30UF LREV = ` 90UF
Verification
LEV =LMV+LREV`80(UF) =`10(F)*+`90(UF)
*LabourmixvarianceisalreadycalculatedinIllustration8.12.Labour Yield Variance (LYV):Itrepresentsthatportionoflabourefficiencyvariancewhich is due to difference between the standardoutput and theactualoutput.Iftheactuallabouroutputishigherascomparedtotherelativestandard,thenvariancewouldbefavourableandviceversa.Thelabouryieldvarianceisalwaysequaltorevisedefficiencyvariancebecausetheformeriscalculatedonthebasisofoutputwhilethelatteriscalculatedonthebasisofinput.Theformulaforitscomputationisasfollows:
Labouryieldvariance=Standardoutputforactualmix–Actualoutput × Standard cost per unit
Illustration 8.14: Inamanufacturingconcern,thestandardtimefixedforaunitis7hours.Astandardwagerateof`20perhourhasbeenfixed.Duringthemonth600unitswereproducedagainstastandardoutputof750units.Calculatelabouryieldvariance.SolutionLabouryieldvariance=(Standardyield–Actualyield)×Standardcostperunit =(750–600)×140* = 150 × 140 21.000unfavourable* Calculation of standard cost per unit:
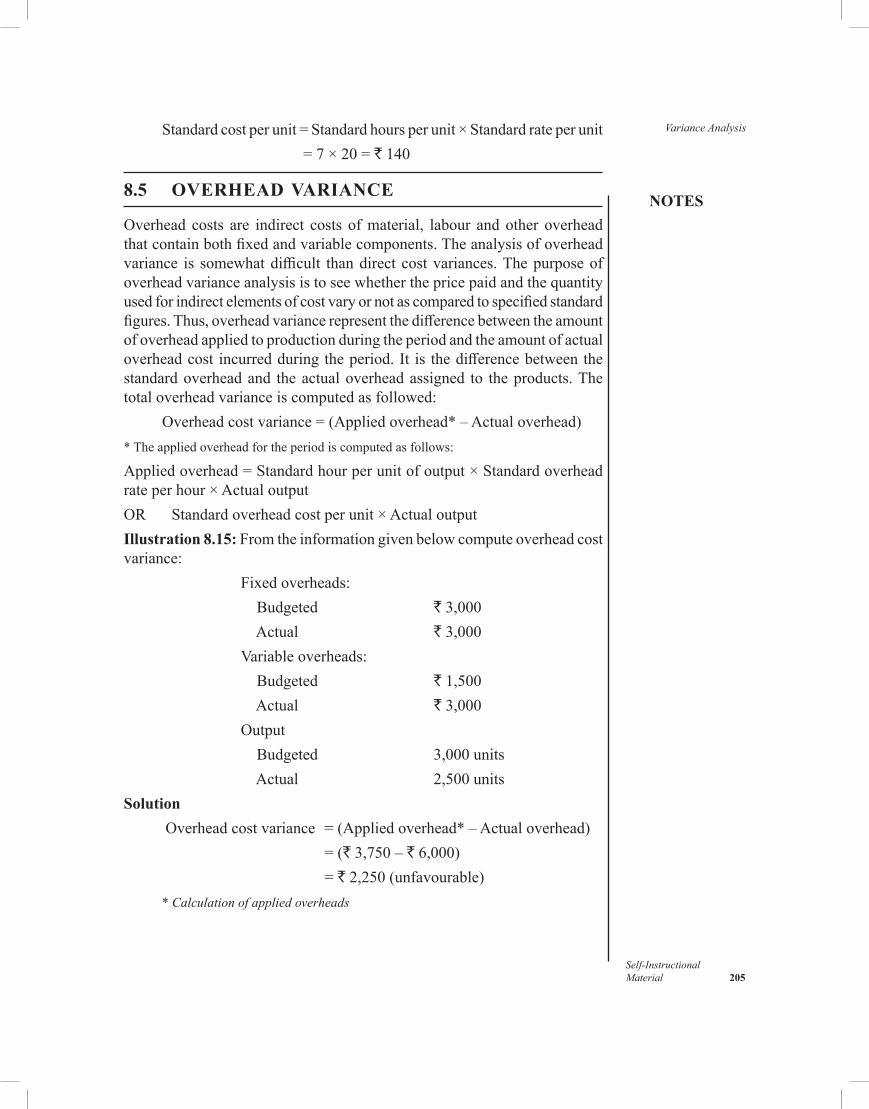
NOTES
Self-InstructionalMaterial 205
Variance AnalysisStandardcostperunit=Standardhoursperunit×Standardrateperunit = 7 × 20 = ` 140
8.5 OVERHEAD VARIANCE
Overhead costs are indirect costs ofmaterial, labour andother overheadthatcontainbothfixedandvariablecomponents.Theanalysisofoverheadvariance is somewhatdifficult thandirect costvariances.Thepurposeofoverheadvarianceanalysisistoseewhetherthepricepaidandthequantityusedforindirectelementsofcostvaryornotascomparedtospecifiedstandardfigures.Thus,overheadvariancerepresentthedifferencebetweentheamountofoverheadappliedtoproductionduringtheperiodandtheamountofactualoverheadcost incurredduringtheperiod.It is thedifferencebetweenthestandardoverheadand theactualoverheadassigned to theproducts.Thetotaloverheadvarianceiscomputedasfollowed:
Overheadcostvariance=(Appliedoverhead*–Actualoverhead)*Theappliedoverheadfortheperiodiscomputedasfollows:
Appliedoverhead=Standardhourperunitofoutput×Standardoverheadrateperhour×ActualoutputOR Standardoverheadcostperunit×ActualoutputIllustration 8.15: Fromtheinformationgivenbelowcomputeoverheadcostvariance:
Fixedoverheads: Budgeted `3,000 Actual `3,000 Variableoverheads: Budgeted `1,500 Actual `3,000 Output Budgeted 3,000units Actual 2,500units
SolutionOverheadcostvariance=(Appliedoverhead*–Actualoverhead) = (`3,750–`6,000) = `2,250(unfavourable)*Calculation of applied overheads
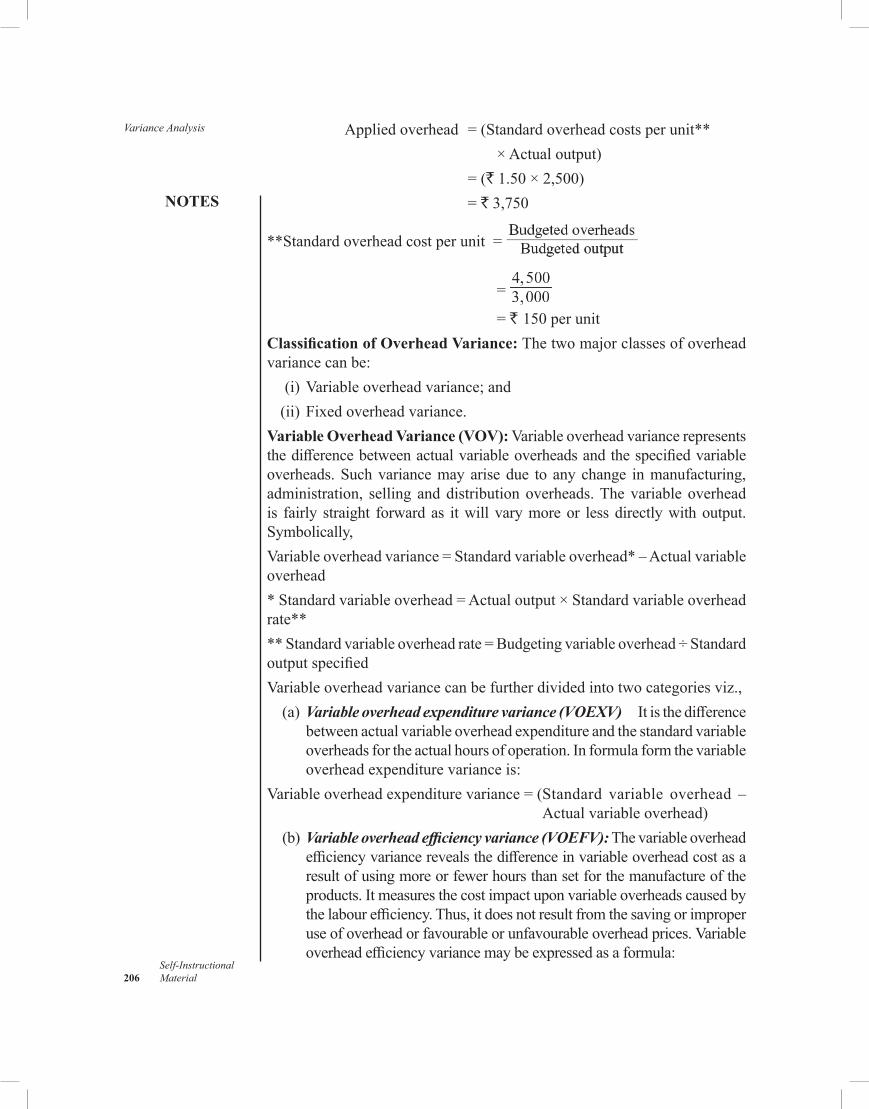
Variance Analysis
NOTES
Self-Instructional 206 Material
Appliedoverhead=(Standardoverheadcostsperunit** ×Actualoutput) = (`1.50×2,500) = `3,750
**Standardoverheadcostperunit=
=
= ` 150 per unitClassification of Overhead Variance:Thetwomajorclassesofoverheadvariance can be: (i)Variableoverheadvariance;and (ii)Fixedoverheadvariance.Variable Overhead Variance (VOV):Variableoverheadvariancerepresentsthedifferencebetweenactualvariableoverheadsandthespecifiedvariableoverheads.Suchvariancemayarisedue to anychange inmanufacturing,administration, selling anddistributionoverheads.Thevariableoverheadis fairly straight forwardas itwill varymoreor lessdirectlywithoutput.Symbolically,Variableoverheadvariance=Standardvariableoverhead*–Actualvariableoverhead*Standardvariableoverhead=Actualoutput×Standardvariableoverheadrate****Standardvariableoverheadrate=Budgetingvariableoverhead÷StandardoutputspecifiedVariableoverheadvariancecanbefurtherdividedintotwocategoriesviz., (a)Variable overhead expenditure variance (VOEXV) Itisthedifference
betweenactualvariableoverheadexpenditureandthestandardvariableoverheadsfortheactualhoursofoperation.Informulaformthevariableoverheadexpenditurevarianceis:
Variableoverheadexpenditurevariance=(Standard variable overhead –Actualvariableoverhead)
(b) Variable overhead efficiency variance (VOEFV):Thevariableoverheadefficiencyvariancerevealsthedifferenceinvariableoverheadcostasaresultofusingmoreorfewerhoursthansetforthemanufactureoftheproducts.Itmeasuresthecostimpactuponvariableoverheadscausedbythelabourefficiency.Thus,itdoesnotresultfromthesavingorimproperuseofoverheadorfavourableorunfavourableoverheadprices.Variableoverheadefficiencyvariancemaybeexpressedasaformula:
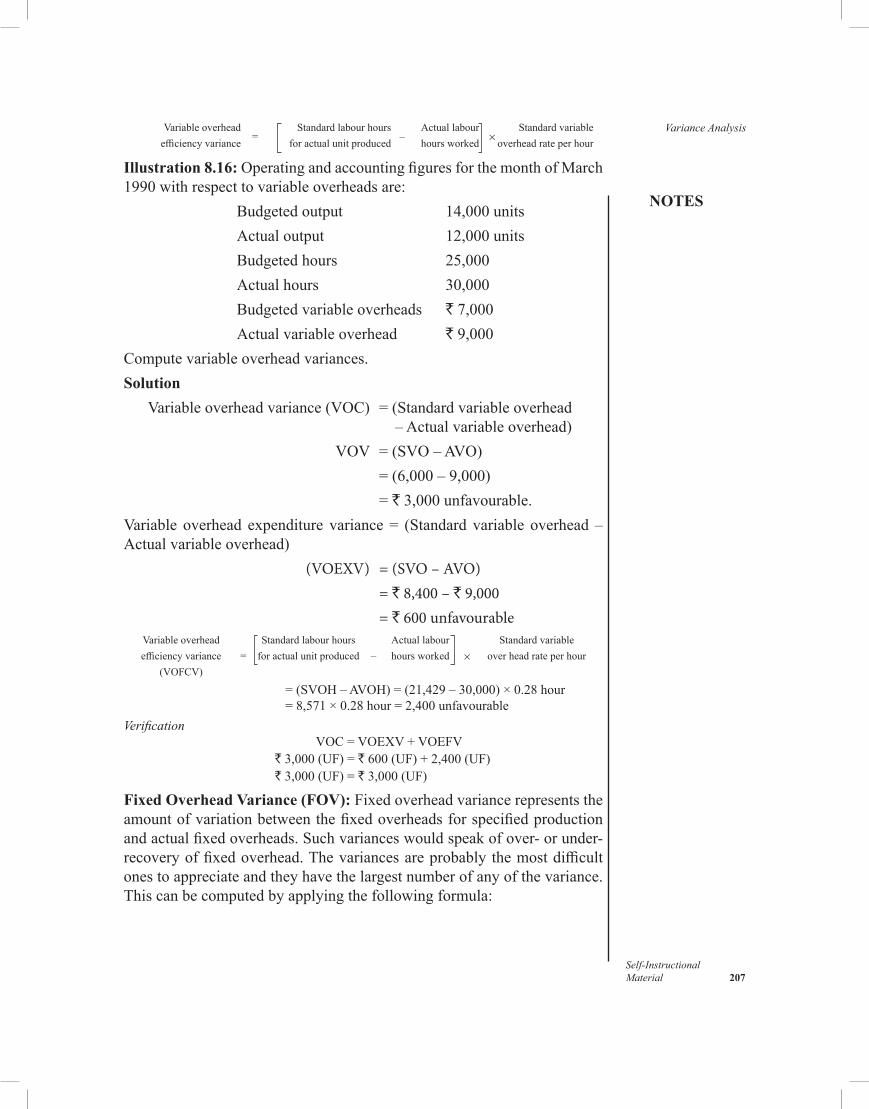
NOTES
Self-InstructionalMaterial 207
Variance AnalysisVariableoverheadefficiencyvariance
=Standardlabourhours
foractualunitproduced–
Actuallabourhoursworked ×
Standardvariableoverheadrateperhour
Illustration 8.16: OperatingandaccountingfiguresforthemonthofMarch1990withrespecttovariableoverheadsare:
Budgetedoutput 14,000units Actualoutput 12,000units Budgetedhours 25,000 Actualhours 30,000 Budgetedvariableoverheads `7,000 Actualvariableoverhead `9,000
Computevariableoverheadvariances.Solution Variableoverheadvariance(VOC) =(Standardvariableoverhead –Actualvariableoverhead) VOV=(SVO–AVO) =(6,000–9,000) = `3,000unfavourable.Variable overhead expenditure variance= (Standard variable overhead–Actualvariableoverhead) (VOEXV) = (SVO – AVO) = ` 8,400 – ` 9,000 = ` 600 unfavourable
Variableoverheadefficiencyvariance
(VOFCV)=
Standardlabourhoursforactualunitproduced –
Actuallabourhoursworked ×
Standardvariableoverheadrateperhour
=(SVOH–AVOH)=(21,429–30,000)×0.28hour =8,571×0.28 hour=2,400unfavourableVerification VOC=VOEXV+VOEFV `3,000(UF)=`600(UF)+2,400(UF) `3,000(UF)=`3,000(UF)
Fixed Overhead Variance (FOV):Fixedoverheadvariancerepresentstheamountofvariationbetweenthefixedoverheadsforspecifiedproductionandactualfixedoverheads.Suchvarianceswouldspeakofover-orunder-recoveryoffixedoverhead.Thevariancesareprobablythemostdifficultonestoappreciateandtheyhavethelargestnumberofanyofthevariance.Thiscanbecomputedbyapplyingthefollowingformula:
Variance Analysis
NOTES
Self-Instructional 208 Material
FixedOverheadVariance(FOV)=(Standardfixedoverheads* –Actualfixedoverheads)
FOV=(SFO–AFO)*Tobecalculatedforactualproduction.
Variancewillbefavourableifactualfixedoverheadarelessthanthestandardfixedoverheadsanditwillbeunfavourableoradverseifactualfixedoverheadsaremorethanthestandardfixedoverheads.
Fixedoverheadvariancecanbefurtherdividedintotwosub-variancesviz.,
• expenditurevariance;and• capacity/volumevariance.
Fixed Overhead Expenditure (or spending) Variance (FOEV):Expenditurevariancerepresentstheamountofdifferencebetweenthebudgetedandactualtotalsforfixedoverheadcosts.Pricedifferentialsandcompositionchangesinfixedoverheaditemsarethemajorreasonforsuchavariance.Itiscalculatedasfollows:Fixedoverheadexpenditurevariance(FOEPV)=Totalbudgetfixedoverhead– Totalactualfixedoverhead FOEPV=(BFO–AFO)
IftheAFOislessthantheBFOonactualproduction,thevarianceisfavourableandviceversa.Fixed Overhead Volume Variance (FOVV):Thesecondvariancedevelopedin connectionwithfixedoverhead is thevolumevariance.This variancerepresentstheamountofdifferencebetweenoverheadsabsorbedonactualoutputandthoseonbudgetedoutput.Theunder-orover-absorptionoffixedoverheadsreflectsthattheconcerndidnotoperateatnormalcapacity.Themajorreasonsforthisvariancearepoorschedulingofproduction,improperuse of labour, strikes, lockouts, power failures, etc.Volumevariance ismeasuredbymultiplyingthebudgetedfixedoverheadratebythedifferencebetweenthebudgetedoutputandactualoutput.Thus,Fixedoverheadvolumevariance(FOVV)=(Standardoutput–Actualoutput)× Standard rate per unit FOVV=(SOP–AOP)×SR
Whentheactualoutputislessthanthestandardoutput,thevariancewillbefavourableandviceversa.Illustration 8.17:Fromthefollowingdatacalculatefixedoverheadvariances:
Budgetedfixedoverhead `10,000Actualfixedoverheads ` 10,200
NOTES
Self-InstructionalMaterial 209
Variance AnalysisBudgetoutput 5,000unitsActualoutput 5,200unitsBudgetedhours 10,400hoursActualhours 10,050hours
SolutionFixedoverheadvariance(FOV) = (SFO–AFO) FOV = `10,400*–10,200 = `200favourableFixedoverheadexpenditurevariance(FOEXV)= (BFO–AFO) FOEXV = `10,000–10,200 = `200unfavourableFixedoverheadvolumevariance(FOVV) = (SOP–AOP)×SR FOVV = (5,000–5,200)×2** = 200 × 2 = `400favourableVerification
FOV = FOEXV+FOVV ` 200(F) = `200(UF)+`400(F) `200(F) = `200(F)Working:*Standardfixedoverheadforactualproduction= ×Actualoutput
=
= `10,400
Advance Variances:Fixedoverheadvolumevariancecanbefurthersub-dividedintothefollowingtwovariances:Capacity Variance: This variance indicates whether the volume ofproductionwasmoreorlessthannormal.Itrepresentstheamountofvariancethatoccursbecausetheactualactivitylevelwasdifferentfromthebudgetedlevel.Capacityvarianceissimilartovolumevarianceasbothattemptstomeasure the actual activity.However, the difference between these twovariancesliesinthefactthattheformermeasuresactualactivitywithinputsandthelattermeasuresactualactivityintermsofoutputs.Theformulaforcomputingthisvarianceis:
Variance Analysis
NOTES
Self-Instructional 210 Material
Capacityvariance(FOCV)=(Budgetedunits–Standardunits*) ×Standardoverheadrate FOCV=(BU×SU)×SR
*Standardunitsmeansbudgetedquantitytobeproducedduringtheactualhoursworked.Inotherwordsitmeansproductionatstandardrateduringactualhours.
If the budgeted units are less than standard units, the variance isfavourableandviceversa.Efficiency Variance: Efficiency variance reveals the difference infixedoverheadcostasaresultofusingmoreorfewerhoursthanplannedfortheproductionvolume.Suchvariancemaybecausedbyefficientorinefficientuseofthelabour,machine,etc.Thisvarianceiscomputedbymultiplyingthebudgetedfixedoverheadratebythedifferencebetweentheactualandstandardhoursforactualproduction.Thus,
Efficiencyvariance(FOEFV)=(Standardunits–Actualunits) ×Standardoverheadrate FOEFV=(SU–AU)×SRIfstandardunitsare less than theactualunits, thevariancewillbe
favourableandviceversa.Illustration 8.18:Calculatesub-variancesoffixedoverheadvolumevariancefromthecostdataasgiveninIllustration8.17.Solution: In Illustration 18.17 the fixed overhead volume variance hasbeen computed to `400favourablewhichwillbenowverifiedbyitssub-variances—capacityvarianceandefficiencyvariance. Capacityvariance(FOCV) =(BU–SU)×SR FOCV=(5,000–4,832*)×2 =168×2=`336(unfavourable) Efficiencyvariance(FOEFV) =(SU–AU)×SR FOEFV=(4,832–5,200)×2 =`736favourableVerification
FOvolumevariance=FOCapacityvariance+FOefficiencyvariance ` 400(F)=`336(UF)+`736(F) `400(F)=`400(F)Working:
Budgetedunits 5,00*Standardunits(SU)= Actual hour 10,050 4,832 unitsBudgetedhours 10,400
× = × =
Inadditiontotheabovediscussedsub-variancesofvolumevariance,onemorevarianceknownas‘Calendar variance’(discussedbelow)isalsosometimescalculated.Thisvariance iscalculatedwhen thedaysactuallyworkeddiffersfromthebudgeteddays.
NOTES
Self-InstructionalMaterial 211
Variance AnalysisCalendar Variance:Calendarvariancerepresentsthatportionofvolumevariancewhicharisesduetothedifferencebetweenactualnumberofworkingdaysandthenumberofworkingdaysinthebudget.Itisfavourableiftheactualworkingdaysarelessthanbudgetedworkingdays.Thisvariancecanbeexpressedasfollows: Calendarvariance(FOCLV) =Budgetedunits–Revisedbudgetedunits ×Standardoverheadrate. FOCLV =(BR–RBU)*×SRwhere BU =budgetedquantity BH =budgetedhours AH =actualhours*RBU=(BU/BH)×AHNote: Withtheincorporationofcalendarvarianceinthevolumevariances,theformulaforcapacityvariancealsochangesandstandsas:
Capacityvariance=(SU–RBU)×SR
Check Your Progress
4.Whatislabourefficiencyvariance? 5.Mentiontheformulaforlabourrevisedefficiencyvariance(LREV). 6.Whatarethesub-categoriesofvariableoverheadvariance? 7.Definecapacityvariance.
8.6 PRACTICAL PROBLEMS
Problem 8.1:Computematerialcostvariancefromthefollowingcostdata: Standardquantityperproduct =4units Standardpriceperunitofrawmaterial =` 3 Actualquantityforthetotaloutput =18,000units Actualpriceperunit =` 4 Output =5,000units
Solution Materialcostvariance =(Standardcost–Actualcost) MCV =(SP×SQ)–(AQ×AQ) =(3×20,000)–(4×18,000) =60,000–72,000 = `12,000unfavourable
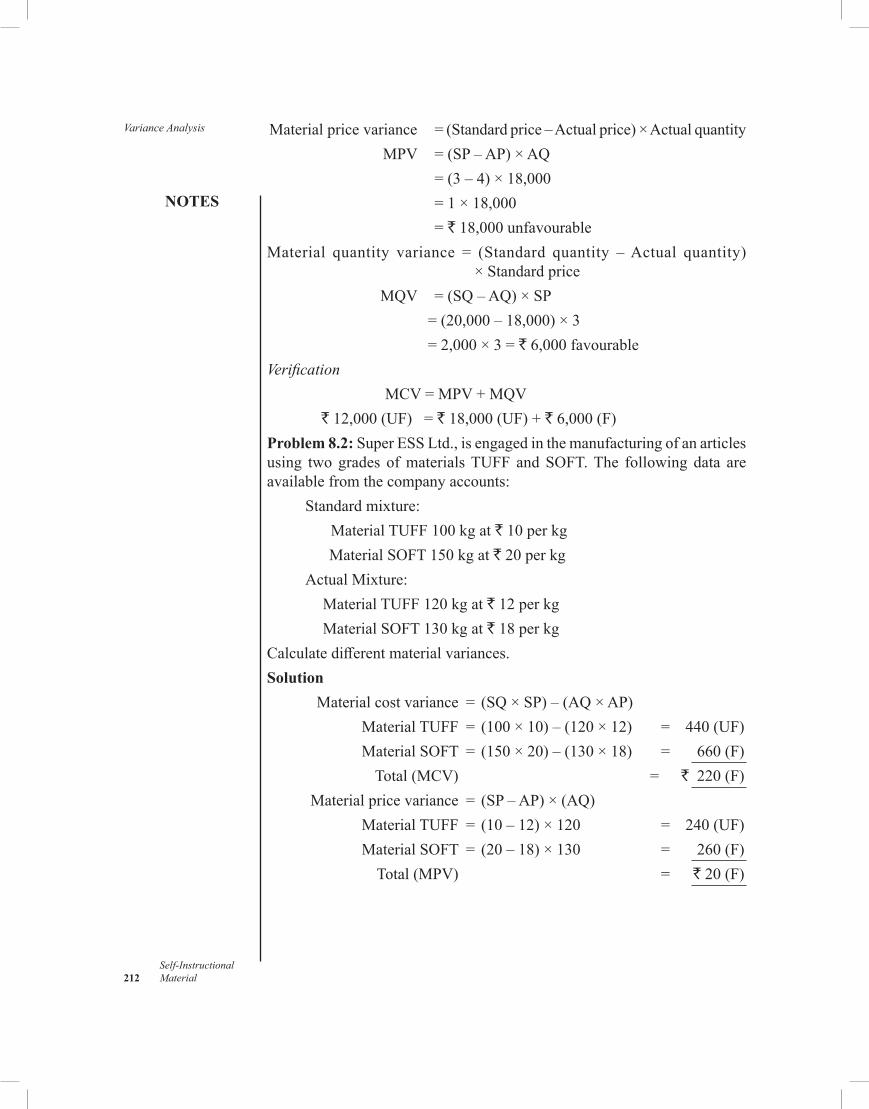
Variance Analysis
NOTES
Self-Instructional 212 Material
Materialpricevariance =(Standardprice–Actualprice)×Actualquantity MPV =(SP–AP)×AQ =(3–4)×18,000 =1×18,000 = `18,000unfavourableMaterial quantity variance = (Standard quantity –Actual quantity) × Standard price MQV =(SQ–AQ)×SP =(20,000–18,000)×3 =2,000×3=`6,000favourableVerification
MCV=MPV+MQV `12,000(UF) =`18,000(UF)+`6,000(F)
Problem 8.2:SuperESSLtd.,isengagedinthemanufacturingofanarticlesusing twogrades ofmaterialsTUFF andSOFT.The followingdata areavailablefromthecompanyaccounts:
Standardmixture: MaterialTUFF100kgat`10perkg MaterialSOFT150kgat`20perkgActualMixture: MaterialTUFF120kgat`12perkg MaterialSOFT130kgat`18perkg
Calculatedifferentmaterialvariances.Solution Materialcostvariance = (SQ×SP)–(AQ×AP) MaterialTUFF = (100×10)–(120×12) = 440(UF) MaterialSOFT = (150×20)–(130×18) = 660(F) Total(MCV) = `220(F) Materialpricevariance = (SP–AP)×(AQ) MaterialTUFF = (10–12)×120 = 240(UF) MaterialSOFT = (20–18)×130 = 260(F) Total(MPV) = `20(F)
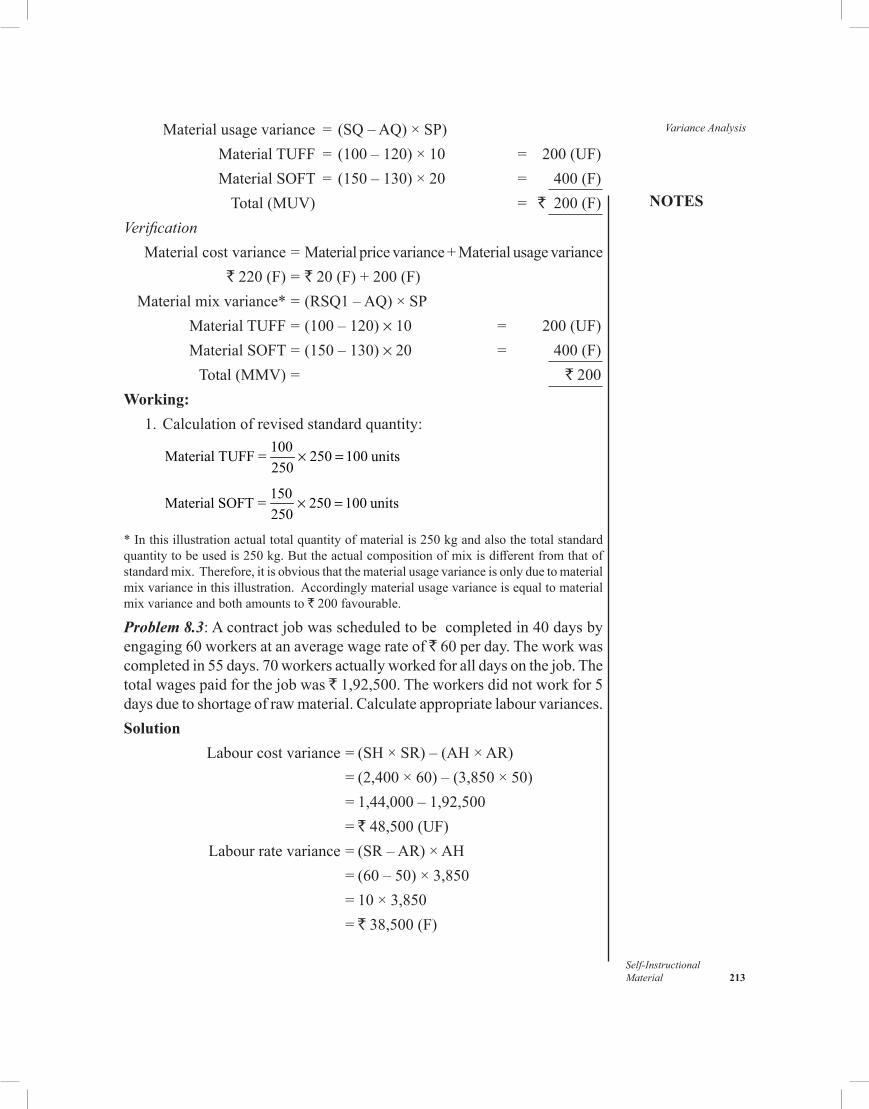
NOTES
Self-InstructionalMaterial 213
Variance Analysis Materialusagevariance = (SQ–AQ)×SP) MaterialTUFF = (100–120)×10 = 200(UF) MaterialSOFT = (150–130)×20 = 400(F) Total(MUV) = ` 200(F)Verification Materialcostvariance=Materialpricevariance+Materialusagevariance `220(F)=`20(F)+200(F) Materialmixvariance*=(RSQ1–AQ)×SP MaterialTUFF=(100–120)×10 = 200(UF) MaterialSOFT=(150–130)×20 = 400(F) Total(MMV)= ` 200Working: 1.Calculationofrevisedstandardquantity:
100MaterialTUFF= 250 100 units250
× =
150MaterialSOFT= 250 100 units250
× =
*Inthisillustrationactualtotalquantityofmaterialis250kgandalsothetotalstandardquantitytobeusedis250kg.Buttheactualcompositionofmixisdifferentfromthatofstandardmix.Therefore,itisobviousthatthematerialusagevarianceisonlyduetomaterialmixvarianceinthisillustration.Accordinglymaterialusagevarianceisequaltomaterialmixvarianceandbothamountsto`200favourable.
Problem 8.3:Acontractjobwasscheduledtobecompletedin40daysbyengaging60workersatanaveragewagerateof`60perday.Theworkwascompletedin55days.70workersactuallyworkedforalldaysonthejob.Thetotalwagespaidforthejobwas`1,92,500.Theworkersdidnotworkfor5daysduetoshortageofrawmaterial.Calculateappropriatelabourvariances.Solution
Labourcostvariance=(SH×SR)–(AH×AR) =(2,400×60)–(3,850×50) =1,44,000–1,92,500 = `48,500(UF) Labourratevariance=(SR–AR)×AH =(60–50)×3,850 =10×3,850 = `38,500(F)
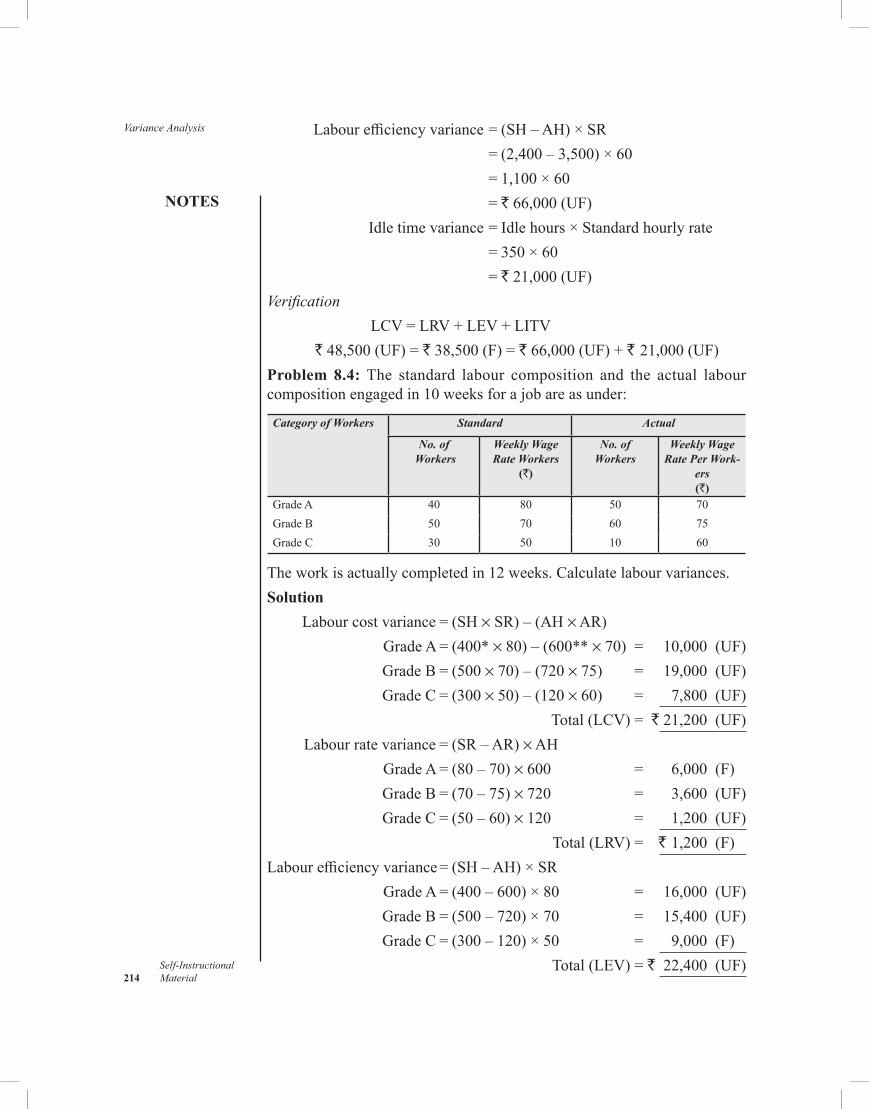
Variance Analysis
NOTES
Self-Instructional 214 Material
Labourefficiencyvariance=(SH–AH)×SR =(2,400–3,500)×60 =1,100×60 = `66,000(UF) Idletimevariance=Idlehours×Standardhourlyrate = 350 × 60 = `21,000(UF)
Verification
LCV=LRV+LEV+LITV `48,500(UF)=`38,500(F)=`66,000(UF)+` 21,000(UF)
Problem 8.4:The standard labour composition and the actual labourcompositionengagedin10weeksforajobareasunder:
Category of Workers Standard Actual
No. of Workers
Weekly Wage Rate Workers
(`)
No. of Workers
Weekly Wage Rate Per Work-
ers (`)
GradeA 40 80 50 70GradeB 50 70 60 75GradeC 30 50 10 60
Theworkisactuallycompletedin12weeks.Calculatelabourvariances.Solution Labourcostvariance=(SH×SR)–(AH×AR) GradeA=(400*×80)–(600**×70) = 10,000 (UF) GradeB=(500×70)–(720×75) = 19,000 (UF) GradeC=(300×50)–(120×60) = 7,800 (UF) Total(LCV)=`21,200 (UF) Labourratevariance=(SR–AR)×AH GradeA=(80–70)×600 = 6,000 (F) GradeB=(70–75)×720 = 3,600 (UF) GradeC=(50–60)×120 = 1,200 (UF) Total(LRV)= ` 1,200 (F)Labourefficiencyvariance=(SH–AH)×SR GradeA=(400–600)×80 = 16,000 (UF) GradeB=(500–720)×70 = 15,400 (UF) GradeC=(300–120)×50 = 9,000 (F) Total(LEV)=`22,400 (UF)
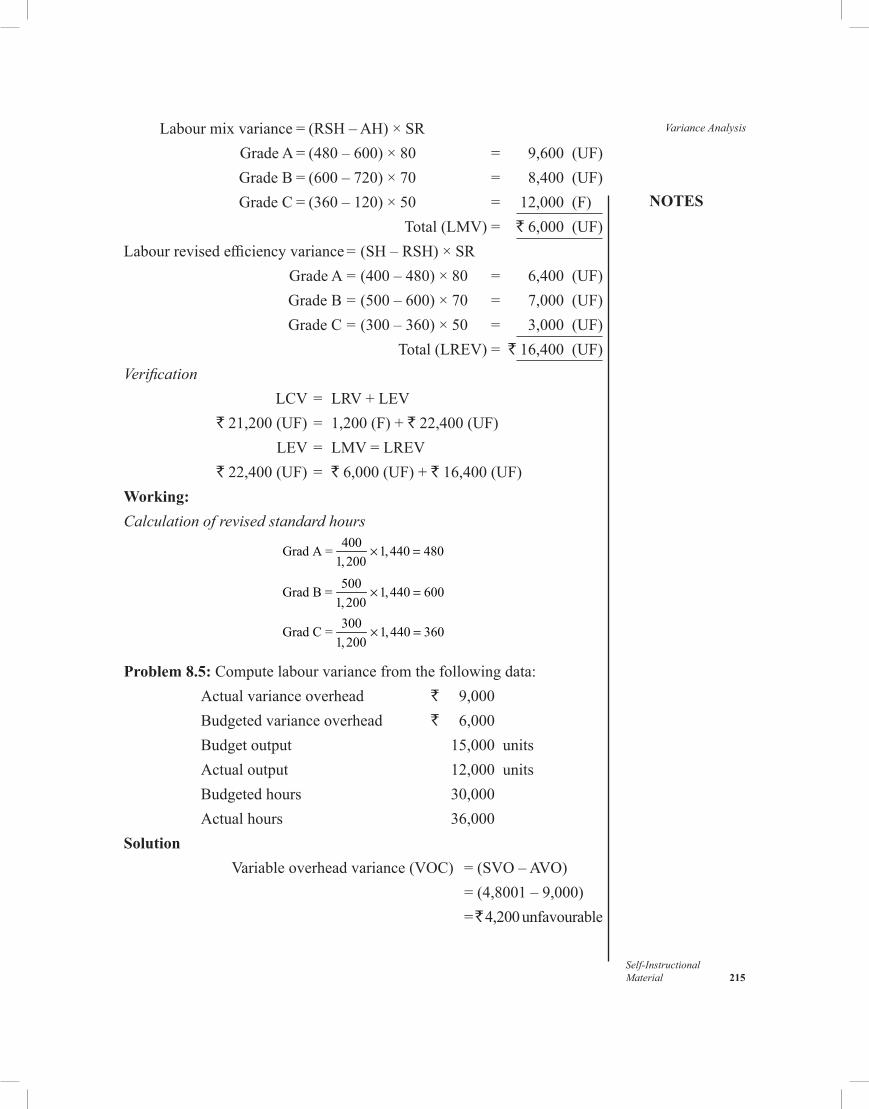
NOTES
Self-InstructionalMaterial 215
Variance Analysis Labourmixvariance=(RSH–AH)×SR GradeA=(480–600)×80 = 9,600 (UF) GradeB=(600–720)×70 = 8,400 (UF) GradeC=(360–120)×50 = 12,000 (F) Total(LMV)= `6,000 (UF)Labourrevisedefficiencyvariance=(SH–RSH)×SR GradeA=(400–480)×80 = 6,400 (UF) GradeB=(500–600)×70 = 7,000 (UF) GradeC=(300–360)×50 = 3,000 (UF) Total(LREV)= `16,400 (UF)Verification LCV= LRV+LEV `21,200(UF)= 1,200(F)+`22,400(UF) LEV= LMV=LREV `22,400(UF)= `6,000(UF)+`16,400(UF)Working:Calculation of revised standard hours
400GradA= 1,440 4801,200
× =
500GradB= 1,440 6001,200
× =
300GradC= 1,440 3601,200
× =
Problem 8.5: Computelabourvariancefromthefollowingdata: Actualvarianceoverhead ` 9,000 Budgetedvarianceoverhead ` 6,000 Budgetoutput 15,000units Actualoutput 12,000units Budgetedhours 30,000 Actualhours 36,000Solution Variableoverheadvariance(VOC) =(SVO–AVO) =(4,8001–9,000) = 4,200unfavourable
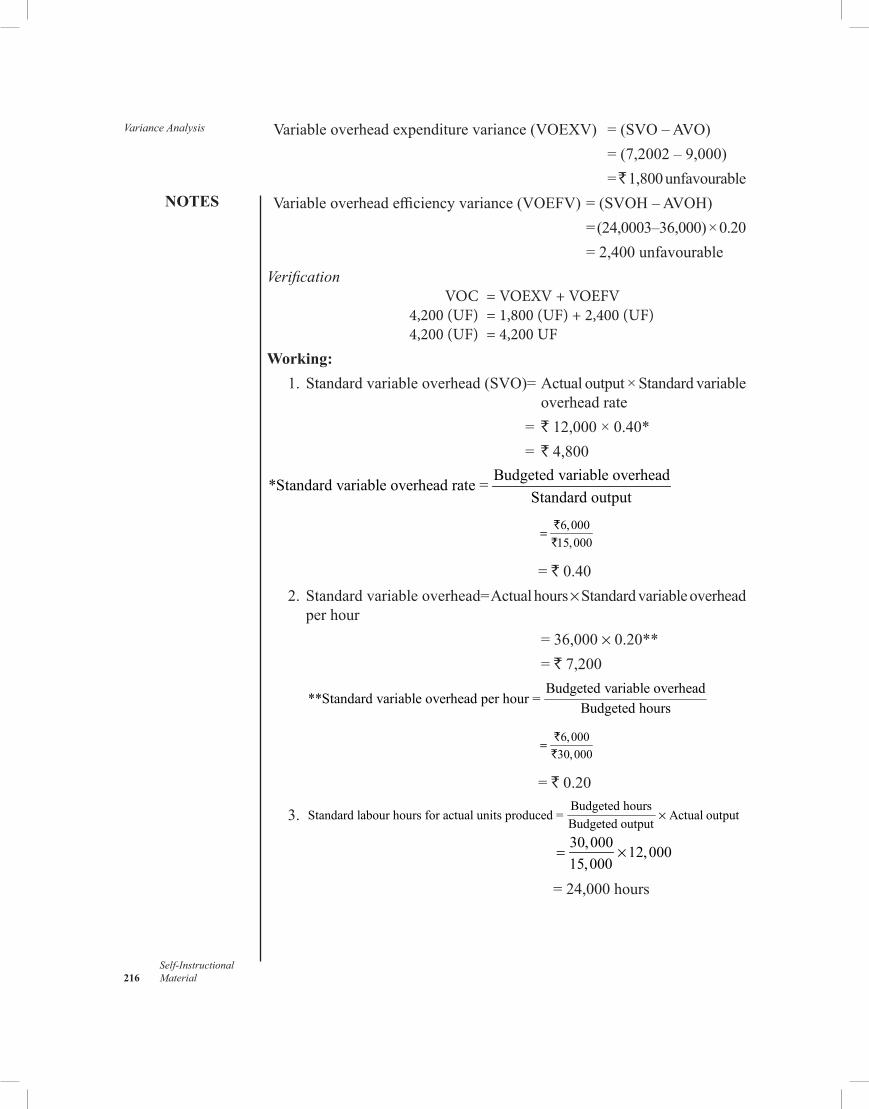
Variance Analysis
NOTES
Self-Instructional 216 Material
Variableoverheadexpenditurevariance(VOEXV) =(SVO–AVO) =(7,2002–9,000) = 1,800unfavourableVariableoverheadefficiencyvariance(VOEFV)=(SVOH–AVOH) =(24,0003–36,000)×0.20 =2,400unfavourableVerification VOC = VOEXV + VOEFV 4,200 (UF) = 1,800 (UF) + 2,400 (UF) 4,200 (UF) = 4,200 UFWorking: 1.Standardvariableoverhead(SVO)=Actualoutput×Standardvariable
overheadrate = `12,000×0.40* = `4,800
Budgeted variableoverhead*Standardvariableoverheadrate=Standard output
6,00015,000
= ``
= ` 0.40 2.Standardvariableoverhead=Actualhours×Standardvariableoverhead
perhour =36,000×0.20** = `7,200
Budgeted variableoverhead**Standardvariableoverheadperhour=
Budgeted hours
6,00030,000
= ``
= ` 0.20
3. Budgeted hoursStandardlabourhoursforactualunitsproduced= Actual output
Budgeted output×
30,000 12,00015,000
= ×
=24,000hours
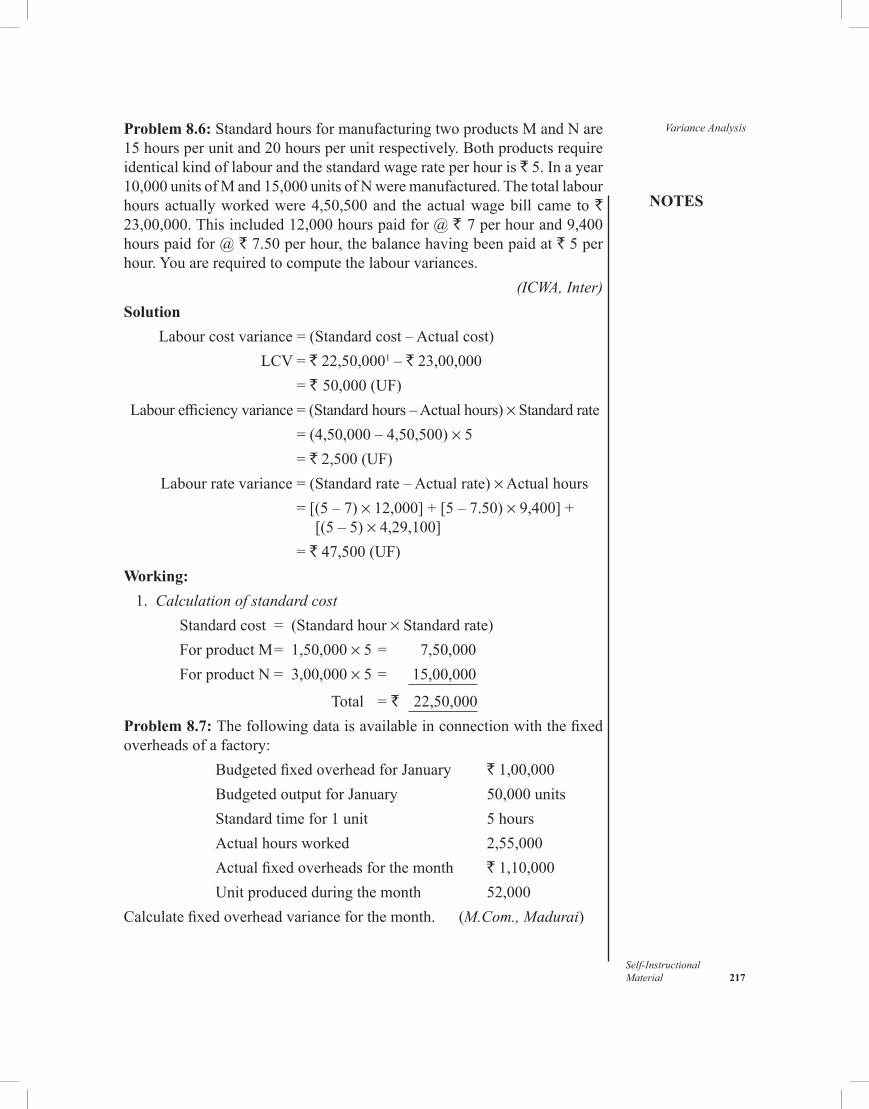
NOTES
Self-InstructionalMaterial 217
Variance AnalysisProblem 8.6: StandardhoursformanufacturingtwoproductsMandNare15hoursperunitand20hoursperunitrespectively.Bothproductsrequireidenticalkindoflabourandthestandardwagerateperhouris` 5. In a year 10,000unitsofMand15,000unitsofNweremanufactured.Thetotallabourhoursactuallyworkedwere4,50,500and theactualwagebill came to` 23,00,000.Thisincluded12,000hourspaidfor@` 7perhourand9,400hourspaidfor@`7.50perhour,thebalancehavingbeenpaidat` 5 per hour.Youarerequiredtocomputethelabourvariances.
(ICWA, Inter)
Solution Labourcostvariance=(Standardcost–Actualcost) LCV=`22,50,0001 – `23,00,000 = ` 50,000(UF) Labourefficiencyvariance=(Standardhours–Actualhours)× Standard rate =(4,50,000–4,50,500)× 5 = `2,500(UF) Labourratevariance=(Standardrate–Actualrate)×Actualhours =[(5–7)×12,000]+[5–7.50)×9,400]+ [(5–5)×4,29,100] = `47,500(UF)Working:
1. Calculation of standard cost
Standardcost = (Standardhour×Standardrate) ForproductM= 1,50,000×5= 7,50,000 ForproductN= 3,00,000×5= 15,00,000
Total =` 22,50,000Problem 8.7: Thefollowingdataisavailableinconnectionwiththefixedoverheadsofafactory: BudgetedfixedoverheadforJanuary `1,00,000 BudgetedoutputforJanuary 50,000units Standardtimefor1unit 5hours Actualhoursworked 2,55,000 Actualfixedoverheadsforthemonth `1,10,000 Unitproducedduringthemonth 52,000Calculatefixedoverheadvarianceforthemonth. (M.Com., Madurai)
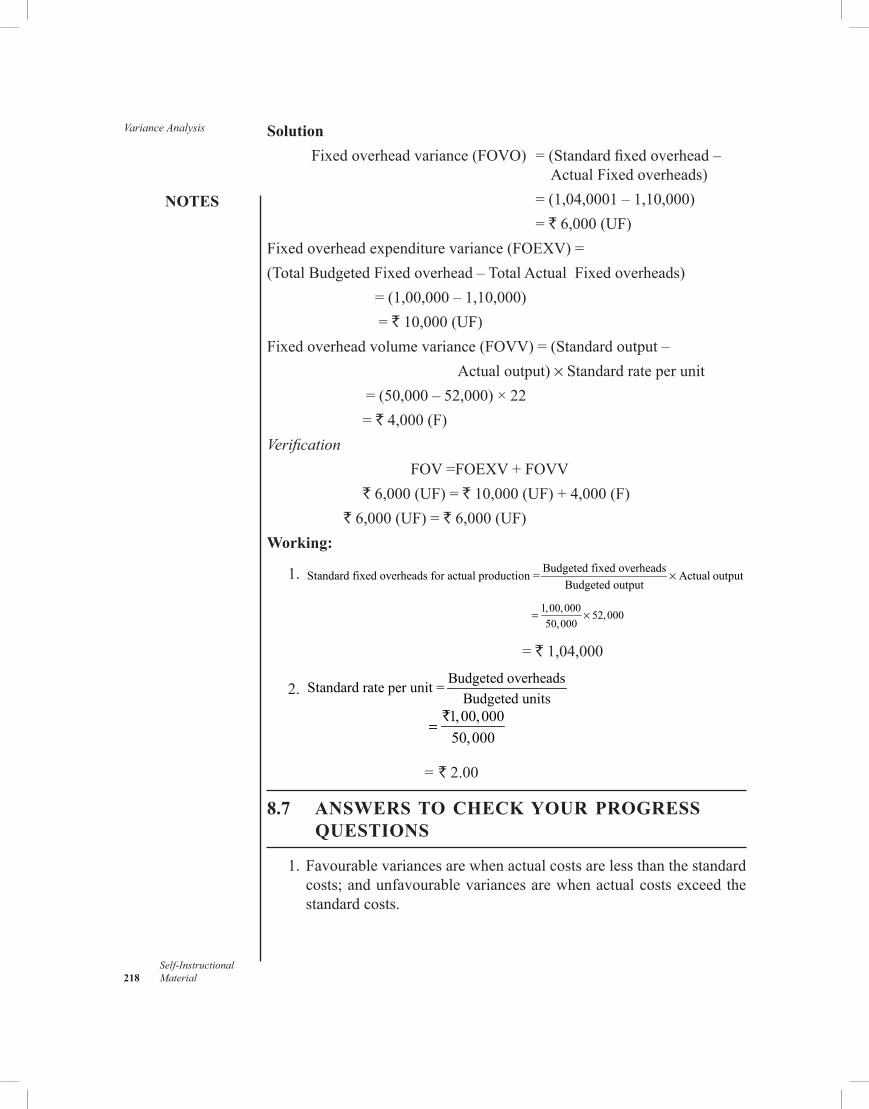
Variance Analysis
NOTES
Self-Instructional 218 Material
Solution Fixedoverheadvariance(FOVO) =(Standardfixedoverhead– ActualFixedoverheads) =(1,04,0001–1,10,000) = `6,000(UF)Fixedoverheadexpenditurevariance(FOEXV)=(TotalBudgetedFixedoverhead–TotalActualFixedoverheads) =(1,00,000–1,10,000) = `10,000(UF)Fixedoverheadvolumevariance(FOVV)=(Standardoutput– Actualoutput)× Standard rate per unit =(50,000–52,000)×22 = `4,000(F)Verification FOV=FOEXV+FOVV 6,000(UF)=`10,000(UF)+4,000(F) `6,000(UF)=`6,000(UF)Working:
1. BudgetedfixedoverheadsStandardfixedoverheadsforactualproduction= Actual outputBudgetedoutput
×
1,00,000 52,00050,000
= ×
= `1,04,000
2. Budgeted overheadsStandard rate per unit =Budgeted units
1,00,00050,000
= `
= ` 2.00
8.7 ANSWERS TO CHECK YOUR PROGRESS QUESTIONS
1.Favourablevariancesarewhenactualcostsarelessthanthestandardcosts;andunfavourablevariancesarewhenactualcostsexceedthestandard costs.
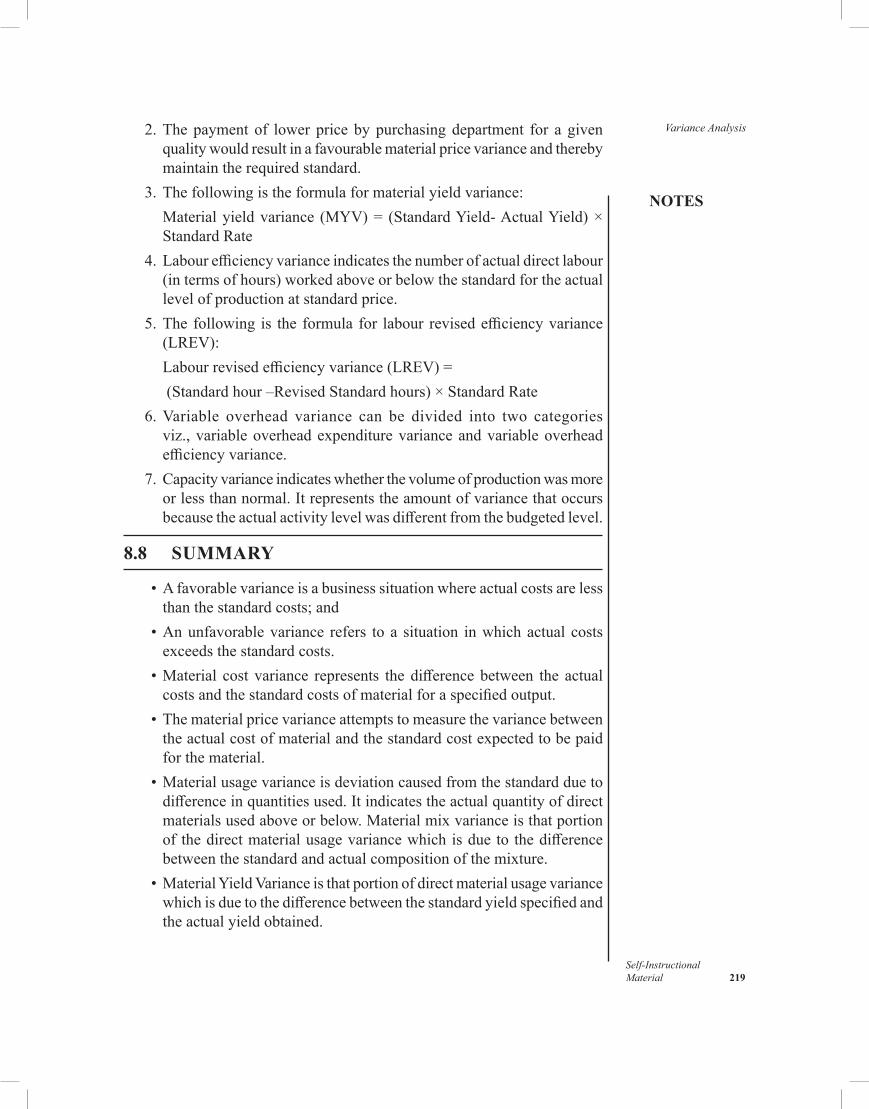
NOTES
Self-InstructionalMaterial 219
Variance Analysis 2.Thepayment of lower price bypurchasingdepartment for a givenqualitywouldresultinafavourablematerialpricevarianceandtherebymaintaintherequiredstandard.
3.Thefollowingistheformulaformaterialyieldvariance: Materialyieldvariance (MYV)= (StandardYield-ActualYield)×
StandardRate 4.Labourefficiencyvarianceindicatesthenumberofactualdirectlabour
(intermsofhours)workedaboveorbelowthestandardfortheactuallevelofproductionatstandardprice.
5.The following is the formula for labour revisedefficiencyvariance(LREV):
Labourrevisedefficiencyvariance(LREV)= (Standardhour–RevisedStandardhours)×StandardRate 6.Variable overhead variance can be divided into two categories
viz.,variableoverheadexpenditurevarianceandvariableoverheadefficiencyvariance.
7.Capacityvarianceindicateswhetherthevolumeofproductionwasmoreorlessthannormal.Itrepresentstheamountofvariancethatoccursbecausetheactualactivitylevelwasdifferentfromthebudgetedlevel.
8.8 SUMMARY
•Afavorablevarianceisabusinesssituationwhereactualcostsarelessthanthestandardcosts;and
•Anunfavorablevariance refers toa situation inwhichactual costsexceedsthestandardcosts.
•Material cost variance represents thedifferencebetween the actualcostsandthestandardcostsofmaterialforaspecifiedoutput.
•Thematerialpricevarianceattemptstomeasurethevariancebetweentheactualcostofmaterialandthestandardcostexpectedtobepaidforthematerial.
•Materialusagevarianceisdeviationcausedfromthestandardduetodifferenceinquantitiesused.Itindicatestheactualquantityofdirectmaterialsusedaboveorbelow.Materialmixvarianceisthatportionof thedirectmaterialusagevariancewhichisdueto thedifferencebetweenthestandardandactualcompositionofthemixture.
•MaterialYieldVarianceisthatportionofdirectmaterialusagevariancewhichisduetothedifferencebetweenthestandardyieldspecifiedandtheactualyieldobtained.
Variance Analysis
NOTES
Self-Instructional 220 Material
•Labourcostvariancerepresentsthedifferencebetweenstandardlabourcostspecifiedfortheactivityandtheactuallabourcostpaidfortheactivity.
•Labourefficiencyvarianceindicatesthenumberofactualdirectlabourhoursworked above or below the standard for the actual level ofproduction at standard price.
•Labourratevariancerepresentstheaverageoftheactualhourlyratespaidaboveorbelow.
•Labourrevisedefficiencyvariancerepresentsthedeviationbetweenthestandardlabourhoursspecifiedfortheactivityachievedandthelabourtimespentforthesame.
•LabourYieldVariance represents that potion of labour efficiencyvariancewhichisduetodifferencebetweenthestandardoutputandtheactualoutput.
•Overheadvariance represent thedifferencebetween the amount ofoverheadappliedtoproductionduringtheperiodandtheamountofactualoverheadcostincurredduringtheperiod.
•Variableoverheadvariancerepresentsthedifferencebetweenactualvariableoverheadsandthespecifiedvariableoverheads.
•Variableoverheadexpenditurevarianceisthedifferencebetweenactualvariableoverheadexpenditureandthestandardvariableoverheadsfortheactualhoursofoperation.
•TheVariableOverheadEfficiencyVariancerevealsthedifferenceinvariableoverheadcostasaresultofusingmoreorfewerhoursthansetforthemanufactureoftheproducts.
•Fixedoverheadvariancerepresentstheamountofvariationbetweenthestandardfixedoverheadsforspecifiedproductionandactualfixedoverheads.
•Fixed overhead expenditure represents the amount of differencebetweenthebudgetedandactualtotalsforfixedoverheadcosts.
•Fixedoverheadvolumevariancerepresentstheamountofdifferencebetweenoverheadsabsorbedonactualoutputandthoseonbudgetedoutput.
•Capacityvarianceindicatesthatthevolumeofproductionwasmoreorlessthannormal.
•EfficiencyVariancerevealsthedifferenceinfixedoverheadcostasaresultofusingmoreorfewerhoursthanplannedfortheproductionvolume.
NOTES
Self-InstructionalMaterial 221
Variance Analysis8.9 KEY WORDS
• Variance analysis: It is asystematicprocesswhichanalysesandinterpretsthevariances.
• Material variances: Itisdifferencebetweenthestandardssetforcostofobtainingmaterialsandforthequantitiestobeusedinproductionandtheactualcostsincurred.
• Labour variance:Itisdeterminedbycomparingpredeterminedlabourstandardswithactualcostofproductivelabour.
• Overhead variance: Itrepresentsthedifferencebetweentheamountofoverheadappliedtoproductionduringtheperiodandtheamountofactualoverheadcostincurredduringtheperiod.
8.10 SELF ASSESSMENT QUESTIONS AND EXERCISE
Short-Answer Question
1.Distinguishbetween (a) Materialpricevarianceandmaterialmixvariance;and (b) Labourefficientvarianceandlabourratevariance. 2.DefinethetermZerovariance.Describethemanagerialusesofvariance
analysis. 3.Explaininbrieftheaccountingtreatmentanddispositionofvariances. 4.Listthecausesformaterialpriceandusagevariance.
Long-Answer Question
1.Whatisvarianceanalysis?Explainandillustratethevarioustypesofmaterialvariances.
2.A companymanufactured 12,000 units during the year 2000 byconsuming36,000kgofrawmaterialwhichwaspurchasedat` 3 per kg.Theengineeringsectionofthecompanyhadestimated2kgofrawmaterialforaunitoutput.Thestandardpriceoftherawmaterialwasfixedfor`3.50perkg.Calculatematerialvariances.
3.ThefollowingstandardandactualdatapertaintoSubaLtd. Standard MaterialX—20kgat`3perkg MaterialY—30kgat`4perkg Normalprocesslossis10percentofinput
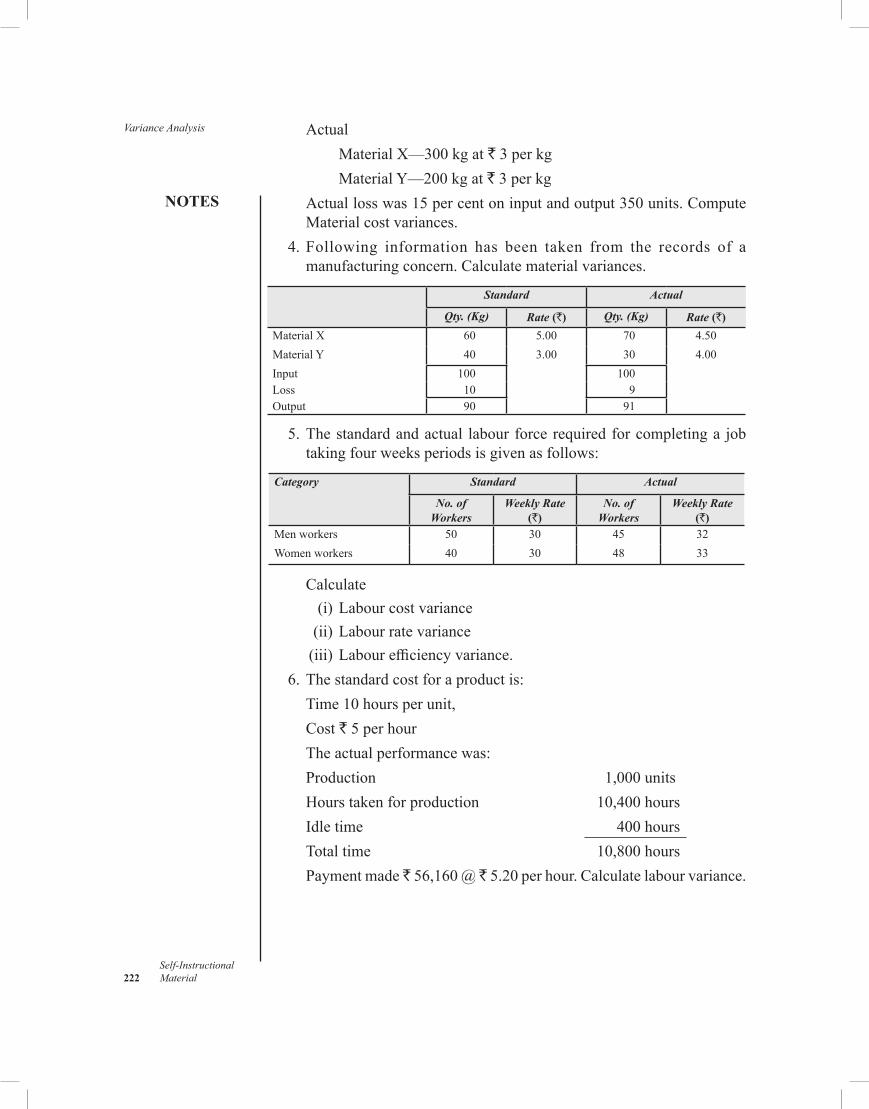
Variance Analysis
NOTES
Self-Instructional 222 Material
Actual MaterialX—300kgat`3perkg MaterialY—200kgat`3perkg Actuallosswas15percentoninputandoutput350units.Compute
Materialcostvariances. 4.Following information has been taken from the records of a
manufacturingconcern.Calculatematerialvariances.
Standard Actual
Qty. (Kg) Rate (`) Qty. (Kg) Rate (`)
MaterialX 60 5.00 70 4.50MaterialY 40 3.00 30 4.00Input 100 100Loss 10 9Output 90 91
5.Thestandardandactual labourforcerequiredforcompletinga jobtakingfourweeksperiodsisgivenasfollows:
Category Standard Actual
No. of Workers
Weekly Rate (`)
No. of Workers
Weekly Rate (`)
Menworkers 50 30 45 32Womenworkers 40 30 48 33
Calculate (i)Labourcostvariance (ii)Labourratevariance (iii)Labourefficiencyvariance. 6.Thestandardcostforaproductis: Time10hoursperunit, Cost `5perhour Theactualperformancewas: Production 1,000units Hourstakenforproduction 10,400hours Idletime 400hours Totaltime 10,800hours Paymentmade 56,160@ 5.20perhour.Calculatelabourvariance.
NOTES
Self-InstructionalMaterial 223
Variance Analysis 7.ThefollowingdataaretakenfromthebooksofEverestCompanyLtd. Standard MaterialX,50unitsat` 4 per unit MaterialY,40unitsat` 3 per unit 200Men@`2perhourfor50hours 130Women@`1perhourfor40hours Normalloss,10units Actual MaterialX,52unitsat` 3.50 per unit MaterialY,36unitsat` 3.50 per unit 210Men@`2perhourfor65hours 100Women@` 0.75perhourfor45hours Actualloss,7units Calculatematerialandlabourvariances. 8.Fromthefollowingdetails,computethedifferentoverheadvariances: Budgetedvariablecosts `20,000 (for80,000directlabourhours) Budgetfixedcosts ` 40,000 Normalactivity(directorlabourhour) 80,000 Actualhoursworked 22,000 Standardhours 20,000 Actualvariableoverheadcostsincurred `5,100 Actualfixedoverheadcostsincurred ` 9,800 9.Thestandardoutputperweekinafactoryis4,000unitsbuttheactual
outputfortheweekwas,4,800units.Thetotaloverheadexpensesfortheperiodwereasfollows:
Actual (`) Budget (`)
Fixed 1,800 1,600Variable 1,000 1,000Semi-variable 2,100 1,800
Theovertimeworkdoneduringtheweekwasequaltooneday’swork.Semi-variableexpensesareone-thirdfixedandtwo-thirdvariable.Findoutthedifferentvariances.
10.DoubleBeautyManufacturesLtd.hasgiventhefollowingbudgetedandactualfigures:
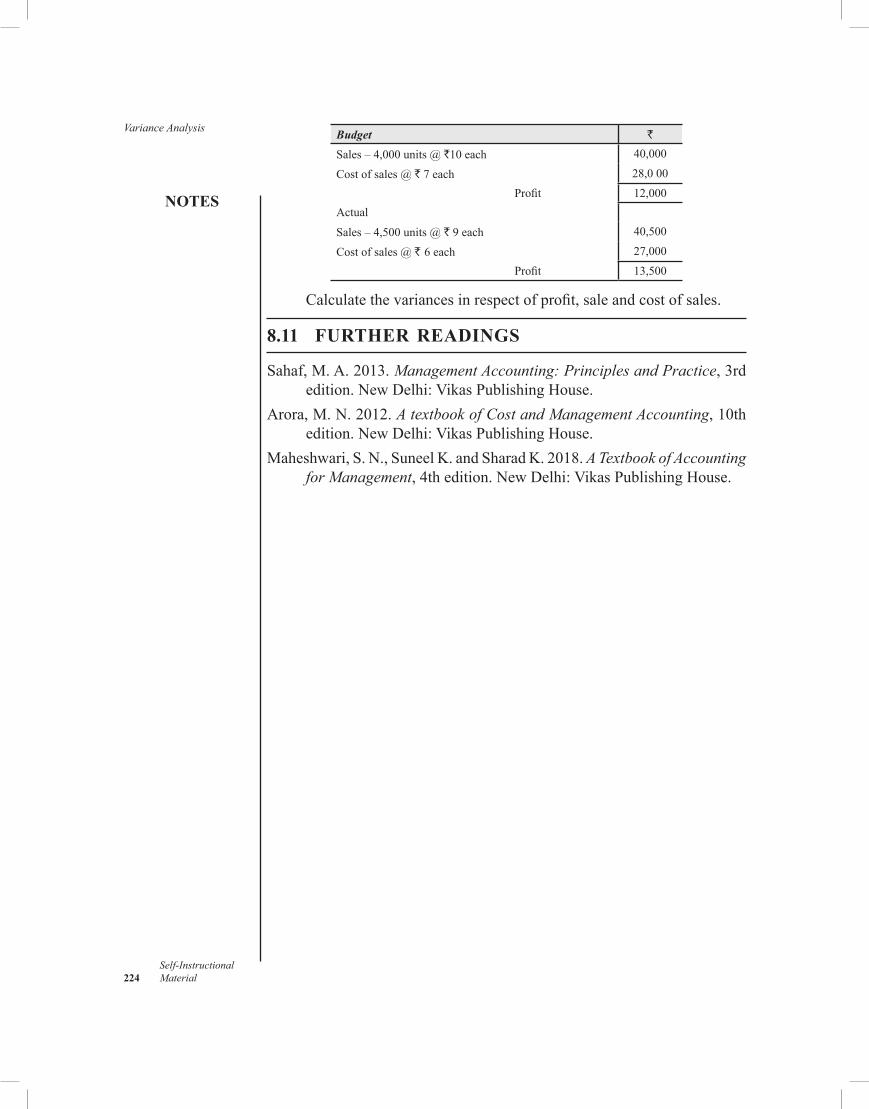
Variance Analysis
NOTES
Self-Instructional 224 Material
Budget `
Sales–4,000units@`10each 40,000
Costofsales@`7each 28,000 Profit 12,000Actual
Sales–4,500units@`9each 40,500
Costofsales@` 6each 27,000 Profit 13,500
Calculatethevariancesinrespectofprofit,saleandcostofsales.
8.11 FURTHER READINGS
Sahaf,M.A.2013.Management Accounting: Principles and Practice,3rdedition.NewDelhi:VikasPublishingHouse.
Arora,M.N.2012.A textbook of Cost and Management Accounting,10thedition.NewDelhi:VikasPublishingHouse.
Maheshwari,S.N.,SuneelK.andSharadK.2018.A Textbook of Accounting for Management,4thedition.NewDelhi:VikasPublishingHouse.
NOTES
Self-InstructionalMaterial 225
Marginal Costing, CVP Analysis And Break Even
AnalysisBLOCK - III
COSTING AND ITS APPLICATIONS
UNIT 9 MARGINAL COSTING, CVP ANALYSIS AND BREAK EVEN ANALYSIS
Structure 9.0 Introduction 9.1 Objectives 9.2 ConceptofMarginalCosting
9.2.1 AdvantagesandDisadvantagesofMarginalCosting 9.2.2 Contribution 9.2.3 MarginalCostEquation 9.2.4 Profit/VolumeRatio(P/VRatio)
9.3 ManagerialApplicationofMarginalCosting 9.4 CVPAnalysisAndBreakEvenAnalysis 9.5 AnswerstoCheckYourProgressQuestions 9.6 Summary 9.7 Key Words 9.8 SelfAssessmentQuestionsandExercises 9.9 FurtherReadings
9.0 INTRODUCTION
To makeoptimumuseoftheoutputcapacity,themanufacturingorganizationsare frequently confrontedwith the decision of additional output as longas theyoperate below their output capacity. Since this decision involvesadditionalcost,therefore,theorganizationsneedtoanalyseandunderstandthebehaviourofadditionalcostsbeforearrivingatsuchadecision.Suchanunderstandingisessentialbecauseeveryincreaseinthelevelofoutputwouldnotincreaseprofitsratherwoulddiminishtheorganization’smarginalprofitiftheorganizationisalreadyoperatingattheoptimumlevelofitsexistingoutputcapacity.However,suchadecisionwoulddefinitelyprovefinanciallysoundiftheorganizationhasanyunutilizedoutputcapacity.Consequently,themanagementneedstopossessknowledgeaboutthebehaviourofcostsasaresultofachangeinthelevelofoutputinordertoarriveatanaccuratedecision.It is inthiscontextanattempthasbeenmadeinthischaptertoidentifyandexaminetheimpactofchangeinthelevelofoutputoncostandbusiness result.
Marginal Costing, CVP Analysis And Break Even Analysis
NOTES
Self-Instructional 226 Material
9.1 OBJECTIVES
Aftergoingthroughthisunit,youwillbeableto: •Explainthemeaningofmarginalcosting •Describetheadvantages,limitationsandmanagerialusesofmarginal
costing •DiscussCVPanalysisandBreakevenanalysis
9.2 CONCEPT OF MARGINAL COSTING
Inthissection,youwilllearnabouttheconcept,advantagesandlimitationsofmarginalcosting.
Cost Behaviour
Theanalysisofcostbehaviourrevealsthatthecostofaproductcanbedividedintotwomajorcategories: •fixedcost;and • variablecostAspercostbehaviour,fixedcostremainsconstanttoaparticularlevelofoutput whereas variable cost has the tendency to changeproportionatelywiththevolumeofoutput.Theexamplegivenbelowwillclarifytheconceptfurther.Example:SubaCompanyLimitedsold2,000units@` 100 per unit during theyear2011–12withthefollowingdetailsofproductionexpenditure: (i)Wages` 20 per unit. (ii)Rentoffactory` 5000 per annum. (iii)Salaryofexecutive`50,000perannum. (iv)Rawmaterialrequiredtoproduceoneunitoffinishedproduct2kg@
`2perkg.Intheabove-mentionedexample,thecostsofrawmaterialandwages
musthavechangedproportionatelywiththechangeinthelevelofoutput,andtherefore,theyfallwithinthescopeofvariablecostswhereastherentoffactoryandsalaryofexecutivemusthaveremainedunchangeddespitethechangeinoutput.Infact,theymusthaveremainedconstantateverylevelofoutputandassuchfallwithinthescopeoffixedcosts.Onaccountofthisreason,itisnotlogicaltoapportionfixedcoststoproductionincaseofanyadditionaloutput.Marginalcostingisthetechniquewhichdealswiththisphenomenon.
NOTES
Self-InstructionalMaterial 227
Marginal Costing, CVP Analysis And Break Even
Analysis
Marginal Cost
Thecostofoneadditionalunitofoutputisknownasmarginalcost.Inotherwords,itreferstothecostthatisincurredbyabusinesstomovefromoutputlevel‘n’ to‘n+1’.AccordingtoterminologyofcostaccountancyoftheInstituteofCostandManagementAccountants,1974,Marginalcostistheamountofanygivenvolumeofoutputbywhichaggregatecostsarechangedifthevolumeofoutputisincreasedbyoneunit.BlockerandWeltmore,1972,definesmarginalcostastheincreaseordecreaseintotalcostwhichresultsfromproductionorsellingadditionalorfewerunitsofaproductorformachangeinthemethodofproductionordistributionsuchastheuseofimprovedmachinery,additionorexclusionofaproductorterritory,orselectionofanadditionalsaleschannel.Thus,marginalcostisthecostincurredbyabusinessfortheadditionaloutput.
Marginal Costing
Marginalcostingisanaccountingtechniquewhichascertainsmarginalcostofadditionaloutputbydifferentiatingbetweenfixedandvariablecosts.Thistechniqueaimstochargeonlythosecoststothecostofadditionalproductthatvarydirectlywithsalesvolumes.Thosecostswouldbedirectmaterial,directlabourandfactoryoverheadexpenseslikesuppliesandsomeindirectlabourandpower.Thecostoftheadditionalproductwouldnotincludefixedornon-variableexpensessuchasdepreciation,factoryinsurance,taxesandsupervisorysalaries.
MarginalcostingisdefinedbytheNationalAssociationofAccountants,1961,London,asamethodwhichproposesthatfixedexpensesbeclassifiedasperiodexpensesandbewrittenoffcurrentlyas isgenerallydonewithsellingandadministrationexpenses,andthatonlythevariablecostsbecomethebasisofinventoryvalueandprofitdetermination.
According to the Institute ofCost andManagementAccountants,marginalcostingistheascertainmentofmarginalcostsandoftheeffectonprofitofchangesinvolumeortypeofoutputbydifferentiatingbetweenfixedcostsandvariablecosts...Inthistechniqueofcostingonlyvariablecostsarechargedtooperations,processorproducts,leavingallindirectcoststobewrittenoffagainstprofitsintheperiodinwhichtheyarise.
Totheauthorofthisbook,marginalcostingisacostingtechniquethatconsidersonlythecoststhatvarydirectlywithvolume—directmaterials,direct labour and variable factory overheads and ignores fixed cost inadditionaloutputdecisions.Thus,thetechniqueofmarginalcostingliesin • differentiationbetweenfixedandvariablecosts; • ascertainmentofmarginalcosts;and •findingouteffectonprofitduetochangeinvolumeortypeofoutput.
Marginal Costing, CVP Analysis And Break Even Analysis
NOTES
Self-Instructional 228 Material
Characteristics of Marginal Costing
Marginalcostingrevealsthefollowingfourfeatures: • Method of Recording and Reporting:Marginalcostingisamethodof
recordingaswellasreportingcosts.Unlikedifferentialcostanalysisand break-even analysiswhichutilize traditional records,marginalcostingrequiresauniquemethodofrecordingcosttransactionsastheyoriginallytakeplace.
• Separation of Costs into Fixed and Variable Elements:Undermarginalcosting,alltypesofoperatingcosts(factory,sellingandadministrative)are separated intofixed andvariable components and are recordedseparately.
• Variable Costs Applied to Product: Variable cost elements arerecognizedasproductcosts,i.e.,theyarechargedtotheproductattheappropriatemovementsandfollowtheproductthroughtheinventoryaccounts,andthusaretreatedasexpenseswhentheproductissold.Variabledistributioncostsnormallyarechargeable toproductatornearthemomentofsale,andthusdonobecomepartoftheinventoryvalues.
• Fixed Cost Written Off as Period Cost: Fixedcosts(includingfixedfactoryoverheads)arehandledasperiodcosts,i.e.,theyarewrittenoffasexpensesintheperiodinwhichtheyareincurred.Theydonotfollowtheinventoriesthroughtheaccountsbutratheraretreatedinawaywhich is traditionally for selling andgeneral administrativeexpenses.Fromtheabovediscussion,itisclearthatmarginalcostingisnota
systemofcostascertainment-likejob,operatingorprocesscostingbutisatechniquetodealwiththeeffectonprofitsasaresultofchangesinvolumeortypeofoutput.Itmaybeincorporatedintothesystemofrecordingandcollecting costs or itmaybeused as an analytical tool for studying andreportingtheeffectsofchangesinvolumeandtypeofoutput.Whereitisincorporatedintothesystemofrecordingandcollectingcosts,thestocksarevaluedatvariablecosts,andfixedcostsaretreatedasperiodcostsinprofitstatements.
Concept of Absorption Costing
Absorptioncostingisasystemofcostingthatrecognizesallcostsincludingfixedonesasproductcosts,andtherefore,considersalloftheminascertainingthecostoftheproduct.Sincethecostingsystemdoesdifferentiatebetweenvariableandfixedcosts,itchargesthefullcoststoaproductirrespectiveofthe
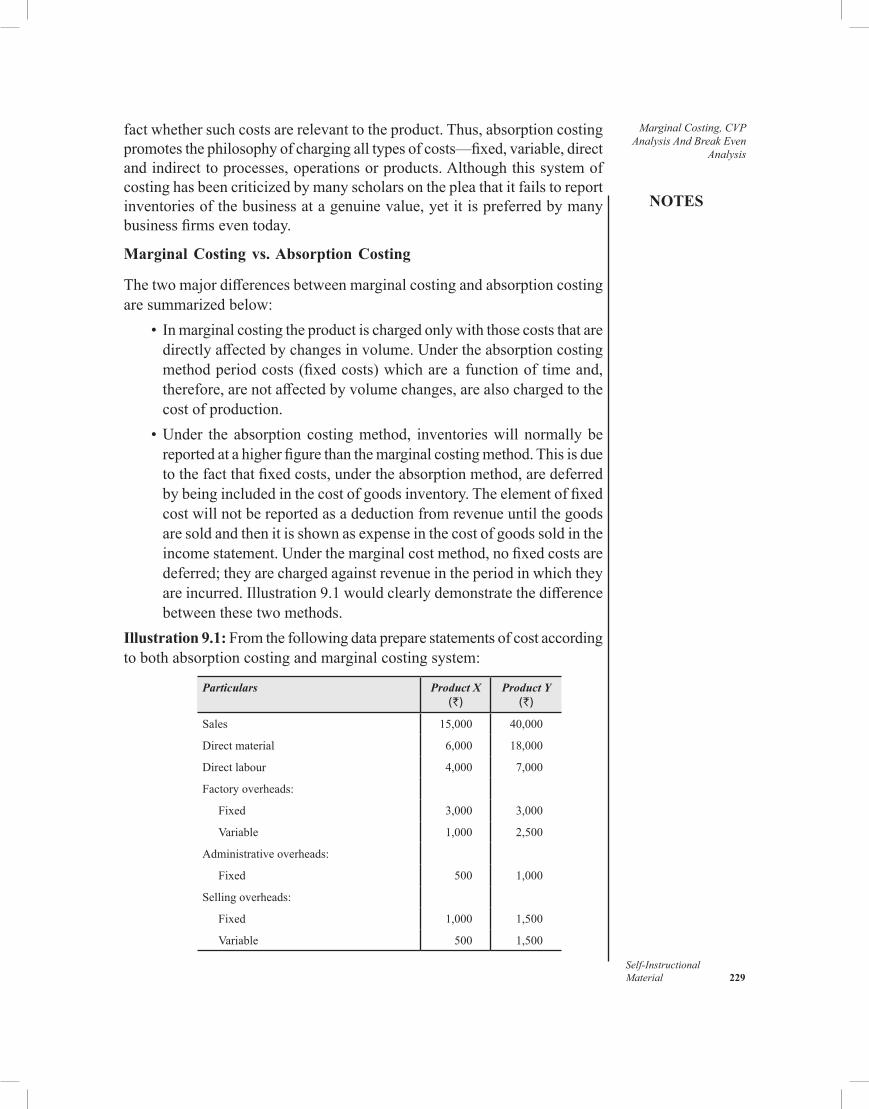
NOTES
Self-InstructionalMaterial 229
Marginal Costing, CVP Analysis And Break Even
Analysis
factwhethersuchcostsarerelevanttotheproduct.Thus,absorptioncostingpromotesthephilosophyofchargingalltypesofcosts—fixed,variable,directandindirecttoprocesses,operationsorproducts.Althoughthissystemofcostinghasbeencriticizedbymanyscholarsonthepleathatitfailstoreportinventoriesofthebusinessatagenuinevalue,yetitispreferredbymanybusinessfirmseventoday.
Marginal Costing vs. Absorption Costing
Thetwomajordifferencesbetweenmarginalcostingandabsorptioncostingaresummarizedbelow: • Inmarginalcostingtheproductischargedonlywiththosecoststhatare
directlyaffectedbychangesinvolume.Undertheabsorptioncostingmethodperiodcosts(fixedcosts)whichareafunctionoftimeand,therefore,arenotaffectedbyvolumechanges,arealsochargedtothecost of production.
•Under the absorptioncostingmethod, inventorieswill normallybereportedatahigherfigurethanthemarginalcostingmethod.Thisisduetothefactthatfixedcosts,undertheabsorptionmethod,aredeferredbybeingincludedinthecostofgoodsinventory.Theelementoffixedcostwillnotbereportedasadeductionfromrevenueuntilthegoodsaresoldandthenitisshownasexpenseinthecostofgoodssoldintheincomestatement.Underthemarginalcostmethod,nofixedcostsaredeferred;theyarechargedagainstrevenueintheperiodinwhichtheyareincurred.Illustration9.1wouldclearlydemonstratethedifferencebetweenthesetwomethods.
Illustration 9.1:Fromthefollowingdatapreparestatementsofcostaccordingtobothabsorptioncostingandmarginalcostingsystem:
Particulars Product X(`)
Product Y(`)
Sales 15,000 40,000
Directmaterial 6,000 18,000
Directlabour 4,000 7,000
Factoryoverheads:
Fixed 3,000 3,000
Variable 1,000 2,500
Administrativeoverheads:
Fixed 500 1,000
Sellingoverheads:
Fixed 1,000 1,500
Variable 500 1,500
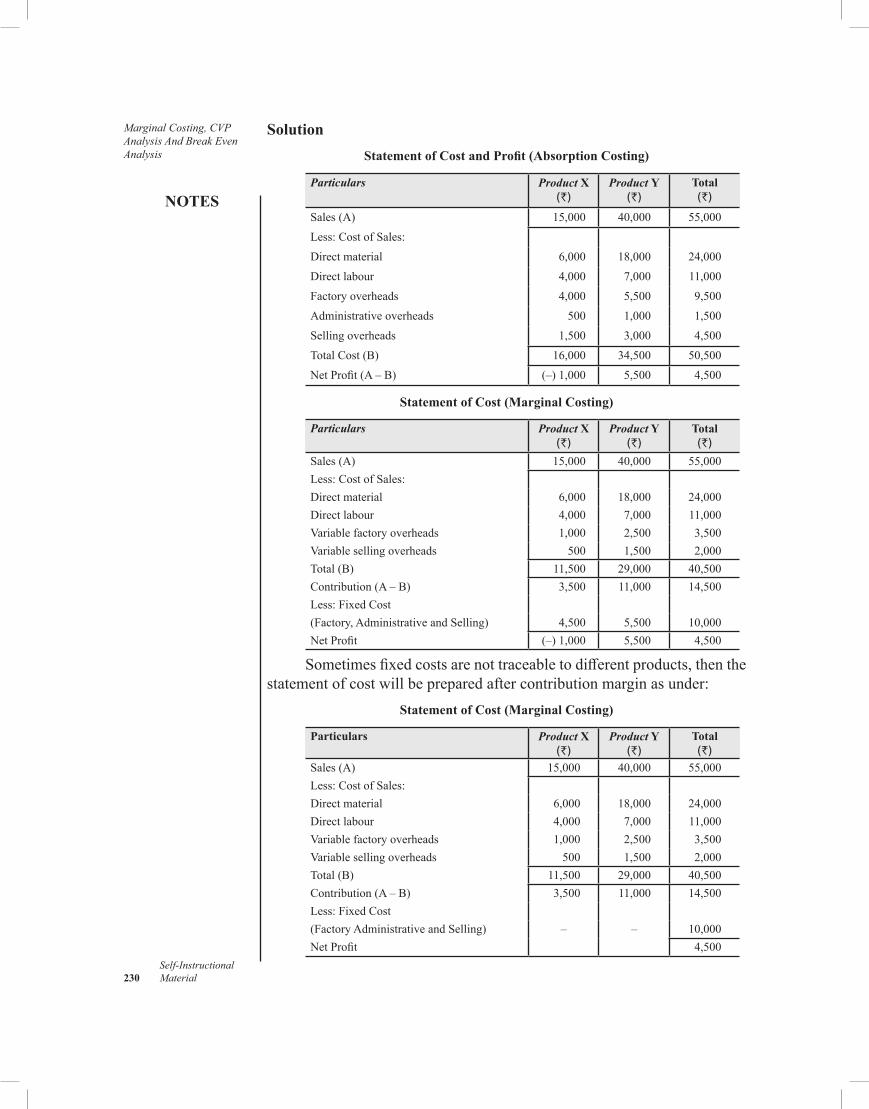
Marginal Costing, CVP Analysis And Break Even Analysis
NOTES
Self-Instructional 230 Material
SolutionStatement of Cost and Profit (Absorption Costing)
Particulars Product X(`)
Product Y(`)
Total(`)
Sales(A) 15,000 40,000 55,000Less:CostofSales:Directmaterial 6,000 18,000 24,000Directlabour 4,000 7,000 11,000Factoryoverheads 4,000 5,500 9,500Administrativeoverheads 500 1,000 1,500Sellingoverheads 1,500 3,000 4,500TotalCost(B) 16,000 34,500 50,500NetProfit(A–B) (–)1,000 5,500 4,500
Statement of Cost (Marginal Costing)
Particulars Product X(`)
Product Y(`)
Total(`)
Sales(A) 15,000 40,000 55,000Less:CostofSales:Directmaterial 6,000 18,000 24,000Directlabour 4,000 7,000 11,000Variablefactoryoverheads 1,000 2,500 3,500Variablesellingoverheads 500 1,500 2,000Total(B) 11,500 29,000 40,500Contribution(A–B) 3,500 11,000 14,500Less:FixedCost(Factory,AdministrativeandSelling) 4,500 5,500 10,000NetProfit (–)1,000 5,500 4,500
Sometimesfixedcostsarenottraceabletodifferentproducts,thenthestatementofcostwillbepreparedaftercontributionmarginasunder:
Statement of Cost (Marginal Costing)
Particulars Product X(`)
Product Y(`)
Total(`)
Sales(A) 15,000 40,000 55,000Less:CostofSales:Directmaterial 6,000 18,000 24,000Directlabour 4,000 7,000 11,000Variablefactoryoverheads 1,000 2,500 3,500Variablesellingoverheads 500 1,500 2,000Total(B) 11,500 29,000 40,500Contribution(A–B) 3,500 11,000 14,500Less:FixedCost(FactoryAdministrativeandSelling) – – 10,000NetProfit 4,500
NOTES
Self-InstructionalMaterial 231
Marginal Costing, CVP Analysis And Break Even
Analysis
9.2.1 Advantages and Disadvantages of Marginal Costing
AccordingtotheNationalAssociationofAccountants,marginalcostinghasthefollowingadvantagesanddisadvantages:
Advantages
•Cost–volume–profit relationship data required for profit planningpurposesarereadilyobtainedfromtheregularaccountingstatements.Hence,managementdoesnothavetoworkwithtwoseparatesetsofdatatorelateonetotheother.
•Theprofitforaperiodisnotaffectedbychangesinabsorptionoffixedexpensesresultingfrombuildingorreducinginventory.Otherthingsremainingequal(e.g.,settingprices,costs,salesmix)profitsmoveinthesamedirectionassaleswhenmarginalcostingisinuse.
•Manufacturingcostandincomestatementsinthemarginalcostformfollowmanagement’sthinkingmorecloselythandoestheabsorptioncostformforthesestatements.Forthisreason,managementfindsiteasiertounderstandandtousemarginalcostreports.
•Theimpactoffixedcostsonprofitsisemphasizedbecausethetotalamountofsuchcostfortheperiodappearsintheincomestatement.
•Marginal incomefigures facilitate relative appraisal of products,territories,classesofcustomersandothersegmentsof thebusinesswithouthavingtheresultobscuredbyallocationofjointfixedcosts.
•Marginalcostingtiesinwithsucheffectiveplansforcostcontrolasstandardcostsandflexiblebudgets.Infact,flexiblebudgetisanaspectofmarginalcostingandmanycompaniesthususemarginalcostingmethodsforthispurposewithoutrecognizingthemassuch.
•Marginalcostconstitutesaconceptofinventorycostwhichcorrespondscloselywith the current out-of-pocket expenditure necessary tomanufacturethegoods.
Disadvantages
•Difficultymay be encountered in distinguishing fixed costs. Inparticular,certainsemi-variablecostsmayfall inaborder-lineareaandmoreorlessarbitraryclassificationmaybeconsiderednecessaryinorder toarriveatapracticaldeterminationoffixedandvariablecomponents.
•Completemanufacturingcostisnotdeterminedintheprocessofcostingproductionandsupplementaryallocationoffixedoverheadsonnormalorsomeothervolumebasemustbemadetoprovideproductcostsforlong-rangepricingandotherlong-rangepolicydecisions.
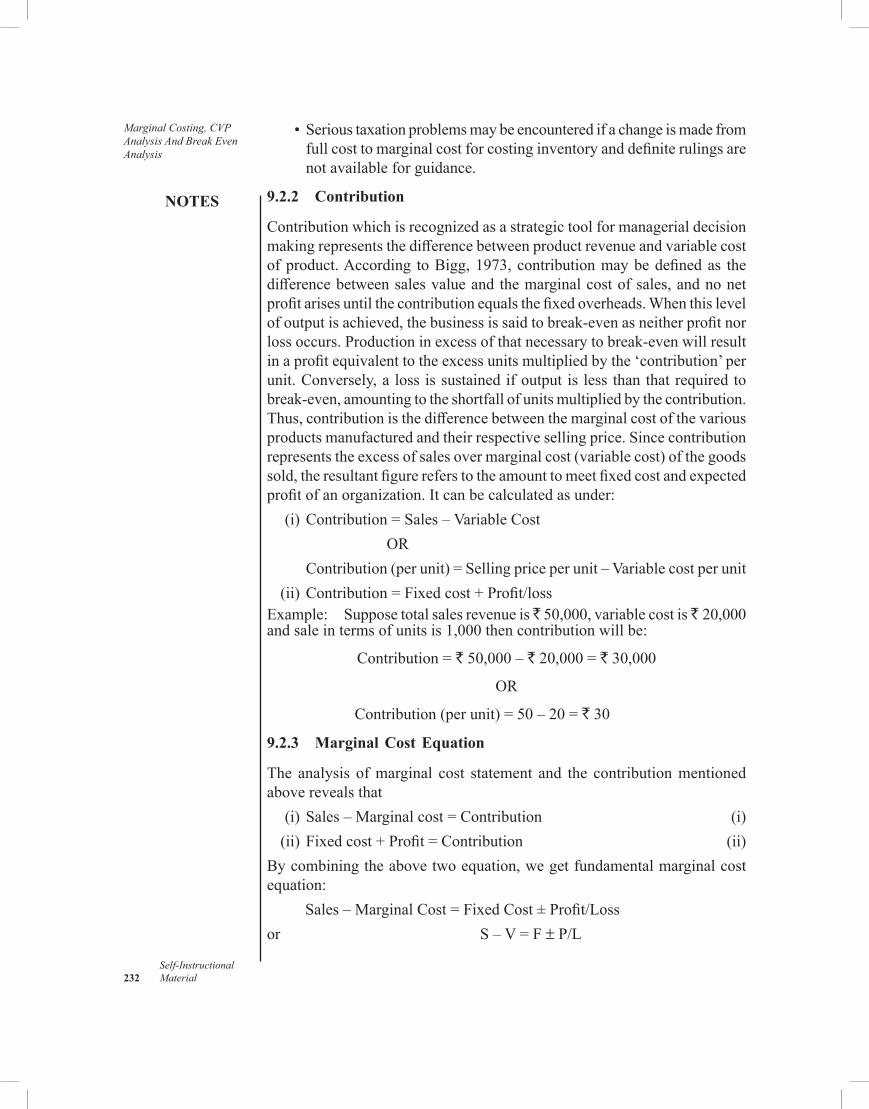
Marginal Costing, CVP Analysis And Break Even Analysis
NOTES
Self-Instructional 232 Material
• Serioustaxationproblemsmaybeencounteredifachangeismadefromfullcosttomarginalcostforcostinginventoryanddefiniterulingsarenotavailableforguidance.
9.2.2 Contribution
Contributionwhichisrecognizedasastrategictoolformanagerialdecisionmakingrepresentsthedifferencebetweenproductrevenueandvariablecostofproduct.According toBigg,1973,contributionmaybedefinedas thedifferencebetweensalesvalueandthemarginalcostofsales,andnonetprofitarisesuntilthecontributionequalsthefixedoverheads.Whenthislevelofoutputisachieved,thebusinessissaidtobreak-evenasneitherprofitnorlossoccurs.Productioninexcessofthatnecessarytobreak-evenwillresultinaprofitequivalenttotheexcessunitsmultipliedbythe‘contribution’perunit.Conversely,a loss issustainedifoutput is less thanthatrequiredtobreak-even,amountingtotheshortfallofunitsmultipliedbythecontribution.Thus,contributionisthedifferencebetweenthemarginalcostofthevariousproductsmanufacturedandtheirrespectivesellingprice.Sincecontributionrepresentstheexcessofsalesovermarginalcost(variablecost)ofthegoodssold,theresultantfigurereferstotheamounttomeetfixedcostandexpectedprofitofanorganization.Itcanbecalculatedasunder: (i)Contribution=Sales–VariableCost
OR Contribution(perunit)=Sellingpriceperunit–Variablecostperunit (ii)Contribution=Fixedcost+Profit/lossExample: Supposetotalsalesrevenueis 50,000,variablecostis 20,000andsaleintermsofunitsis1,000thencontributionwillbe:
Contribution = `50,000–`20,000=`30,000
OR
Contribution(perunit)=50–20=` 30
9.2.3 Marginal Cost Equation
The analysis ofmarginal cost statement and the contributionmentionedaboverevealsthat (i)Sales–Marginalcost=Contribution (i) (ii)Fixedcost+Profit=Contribution (ii)Bycombiningtheabovetwoequation,wegetfundamentalmarginalcostequation:
Sales–MarginalCost=FixedCost±Profit/Lossor S–V=F±P/L
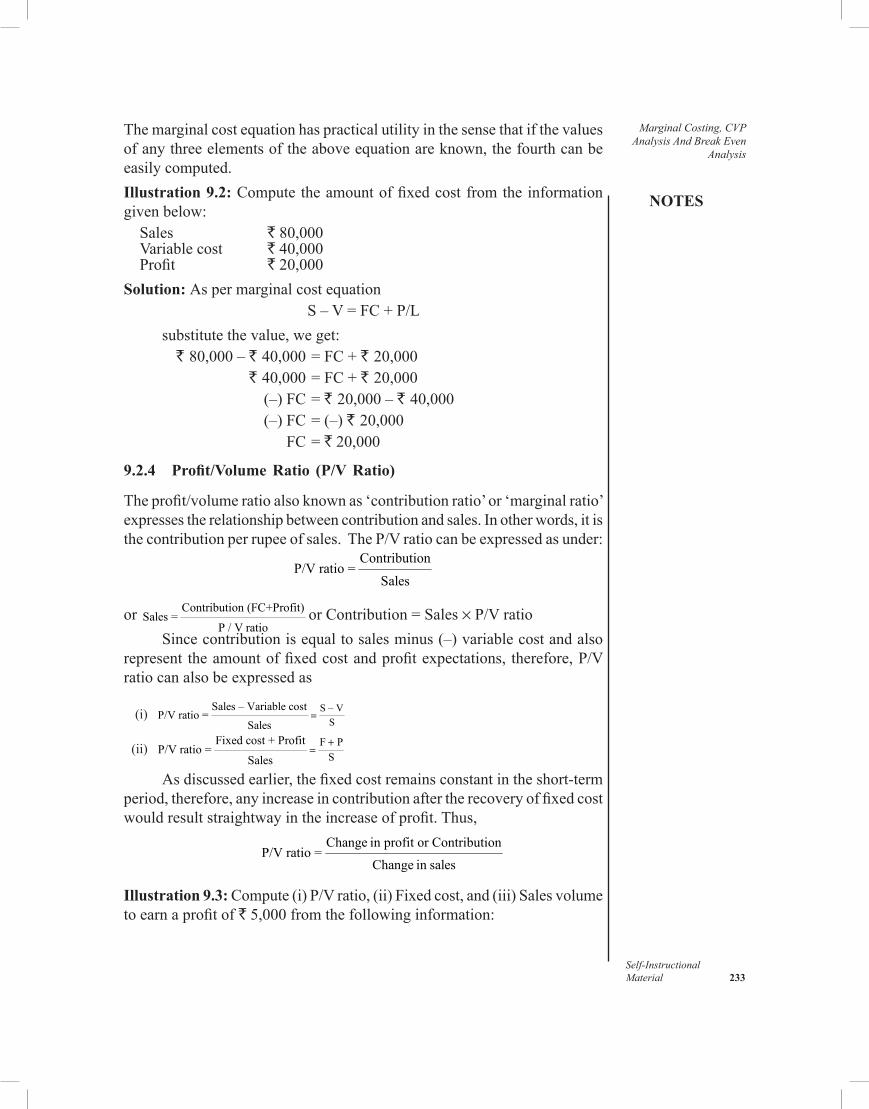
NOTES
Self-InstructionalMaterial 233
Marginal Costing, CVP Analysis And Break Even
Analysis
Themarginalcostequationhaspracticalutilityinthesensethatifthevaluesofanythreeelementsoftheaboveequationareknown,thefourthcanbeeasilycomputed.Illustration 9.2:Computetheamountoffixedcostfromtheinformationgivenbelow:Sales `80,000Variablecost `40,000Profit `20,000
Solution: AspermarginalcostequationS–V=FC+P/L
substitutethevalue,weget: ` 80,000–` 40,000=FC+` 20,000 ` 40,000=FC+` 20,000 (–)FC=` 20,000–` 40,000 (–)FC=(–)` 20,000 FC=`20,000
9.2.4 Profit/Volume Ratio (P/V Ratio)
Theprofit/volumeratioalsoknownas‘contributionratio’or‘marginalratio’expressestherelationshipbetweencontributionandsales.Inotherwords,itisthecontributionperrupeeofsales.TheP/Vratiocanbeexpressedasunder:
ContributionP/Vratio=
Sales
or Contribution(FC+Profit)Sales=
P / V ratioorContribution=Sales× P/Vratio
Sincecontributionisequaltosalesminus(–)variablecostandalsorepresent theamountoffixedcostandprofitexpectations, therefore,P/Vratiocanalsobeexpressedas
(i) S – VS
Sales–VariablecostP/Vratio=
Sales=
(ii) F PS
Fixedcost+ProfitP/Vratio=
Sales+
=
Asdiscussedearlier,thefixedcostremainsconstantintheshort-termperiod,therefore,anyincreaseincontributionaftertherecoveryoffixedcostwouldresultstraightwayintheincreaseofprofit.Thus,
Change inprofitorContributionP/Vratio=
Change in sales
Illustration 9.3:Compute(i)P/Vratio,(ii)Fixedcost,and(iii)Salesvolumetoearnaprofitof`5,000fromthefollowinginformation:
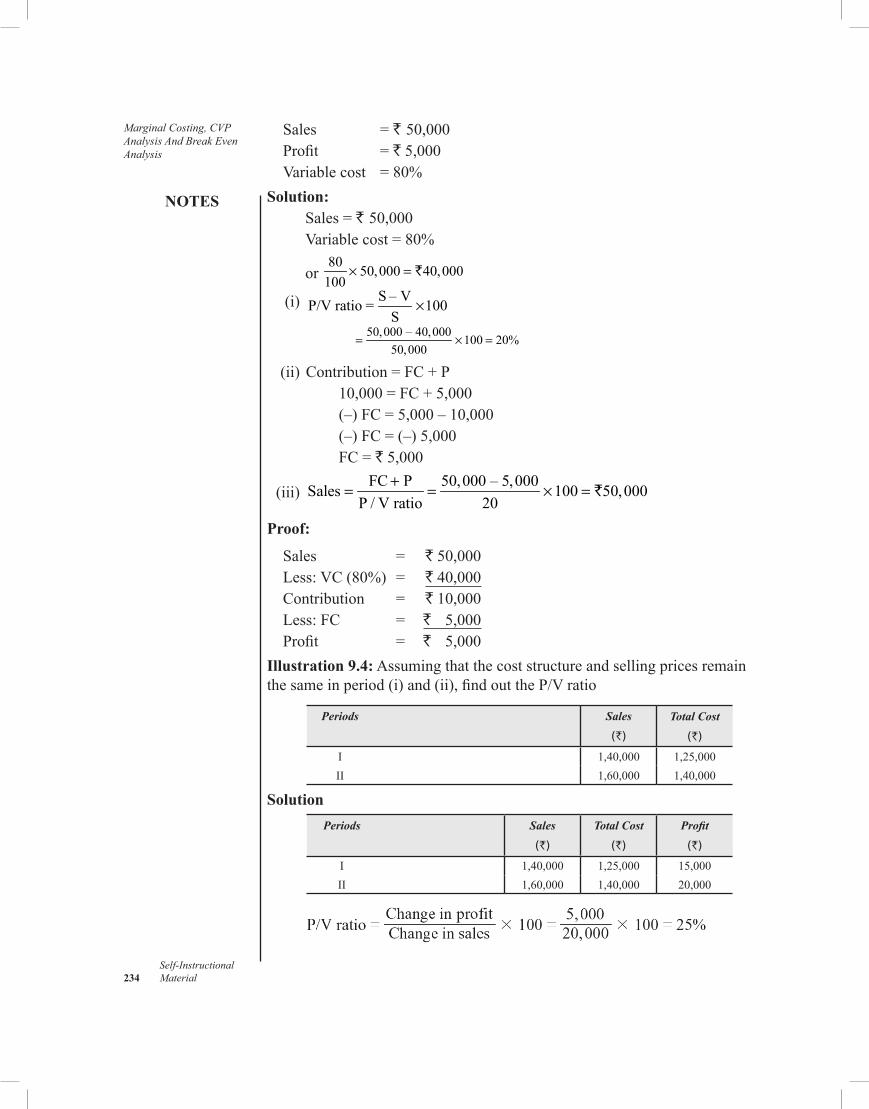
Marginal Costing, CVP Analysis And Break Even Analysis
NOTES
Self-Instructional 234 Material
Sales =` 50,000Profit =`5,000Variablecost =80%
Solution:Sales=` 50,000Variablecost=80%
or 80 50,000 40,000
100× = `
(i) S – VP/Vratio = 100S
×
50,000 – 40,000 100 20%
50,000= × =
(ii)Contribution=FC+P 10,000=FC+5,000 (–)FC=5,000–10,000 (–)FC=(–)5,000 FC=`5,000
(iii)FC P 50,000 – 5,000Sales 100 50,000
P / V ratio 20+= = × = `
Proof:
Sales = `50,000Less:VC(80%) = `40,000Contribution = `10,000Less:FC = ` 5,000Profit = ` 5,000
Illustration 9.4:Assumingthatthecoststructureandsellingpricesremainthesameinperiod(i)and(ii),findouttheP/Vratio
Periods Sales
(`)
Total Cost
(`)
I 1,40,000 1,25,000II 1,60,000 1,40,000
SolutionPeriods Sales
(`)
Total Cost
(`)
Profit
(`)
I 1,40,000 1,25,000 15,000II 1,60,000 1,40,000 20,000
NOTES
Self-InstructionalMaterial 235
Marginal Costing, CVP Analysis And Break Even
AnalysisCheck Your Progress
1.Howarefixedcoststreatedinmarginalcosting? 2.Statethefundamentalmarginalcostequation. 3.Whatismarginalratio?
9.3 MANAGERIAL APPLICATION OF MARGINAL COSTING
Decisionmaking is a regular phenomenon of any business.One of theimportantfactorsthatinfluencemanagerialdecisionsistherelevantcoststhatthemanagersneedtoidentifyandanalysetotaketherightdecisions.Thedecisioncriteriamostoftenusedforthepurposegenerallyincludecostminimization,profitmaximizationandcontributionmaximization.In thisdirection,marginalcosting is recognizedasaneffective toolandassuchmanagers prefer to usethistechniqueinthefollowingareasofmanagerialproblems: • pricingdecision • productionexpansiondecision •makeorbuydecision • scarceresourcesdecision • salesmixdecision
Pricing Decision
Pricingdecisionhasbeenaseriouschallengeforthemanagersasthesameisbeingconsideredanimportantcontributortothesuccessofafirm’smarketstrategy.Themostrecommendedapproachesforpricedeterminationaretheinteractionofsupplyanddemandandthecostofproductionbutbothfailtoprovideacompleteexplanationoftheproblem.However,inactualpracticethe short-termand long-termviewsofpricingmaywellbedifferent; thenatureanddegreeofcompetitionvariesfromperiodtoperiod,anddemandpositionsalsodonotremainconstant,therefore,theuseofasinglecriteriaforpricedeterminationmaynotbeeffective.However,marginalcostingisanusefultooltodealwithachallengingdecision.Consequently,managersoftenusethistechniquetodeterminethepriceofaproduct.However,thepricingdecisionbecomesmorecomplicatedwhenaproductistobesoldinmorethanonemarket.Illustration 9.5: ElectroElectronicsLtd.,dealsinelectricgoodsandsubmitsthefollowinginformationinrespectofthegoodsmanufacturedbyit.
Sellingpriceperunit ` 5.00Variablecostperunit ` 2.00
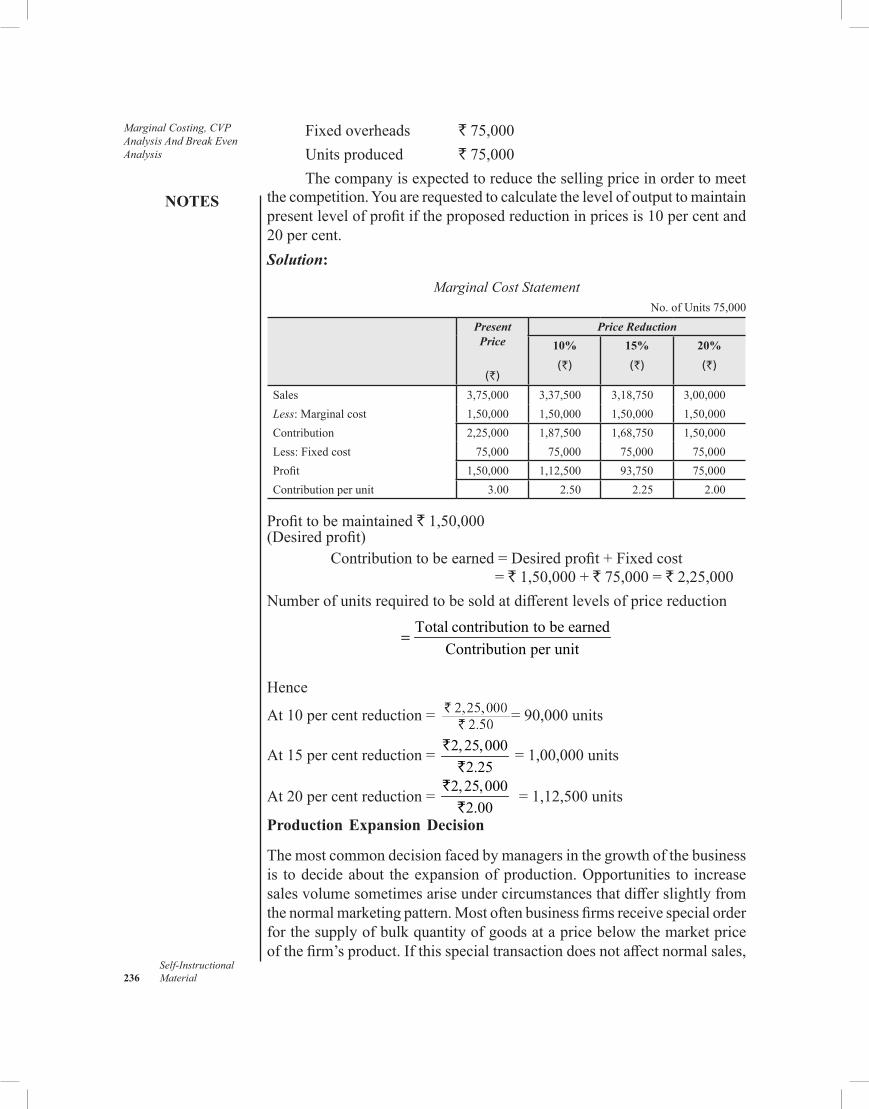
Marginal Costing, CVP Analysis And Break Even Analysis
NOTES
Self-Instructional 236 Material
Fixedoverheads `75,000Unitsproduced `75,000Thecompanyisexpectedtoreducethesellingpriceinordertomeet
thecompetition.Youarerequestedtocalculatethelevelofoutputtomaintainpresentlevelofprofitiftheproposedreductioninpricesis10percentand20 per cent.Solution:
Marginal Cost StatementNo.ofUnits75,000
Present Price
(`)
Price Reduction10%
(`)
15%
(`)
20%
(`)
Sales 3,75,000 3,37,500 3,18,750 3,00,000Less:Marginalcost 1,50,000 1,50,000 1,50,000 1,50,000Contribution 2,25,000 1,87,500 1,68,750 1,50,000Less:Fixedcost 75,000 75,000 75,000 75,000Profit 1,50,000 1,12,500 93,750 75,000Contribution per unit 3.00 2.50 2.25 2.00
Profittobemaintained`1,50,000(Desiredprofit)
Contributiontobeearned=Desiredprofit+Fixedcost = `1,50,000+`75,000=`2,25,000
NumberofunitsrequiredtobesoldatdifferentlevelsofpricereductionTotal contribution tobeearned
Contribution per unit=
Hence
At 10 per cent reduction = =90,000units
At 15 per cent reduction = 2,25,0002.25
``
=1,00,000units
At 20 per cent reduction = 2,25,0002.00
``
=1,12,500units
Production Expansion Decision
Themostcommondecisionfacedbymanagersinthegrowthofthebusinessis todecideabout theexpansionofproduction.Opportunities to increasesalesvolumesometimesariseundercircumstancesthatdifferslightlyfromthenormalmarketingpattern.Mostoftenbusinessfirmsreceivespecialorderforthesupplyofbulkquantityofgoodsatapricebelowthemarketpriceofthefirm’sproduct.Ifthisspecialtransactiondoesnotaffectnormalsales,
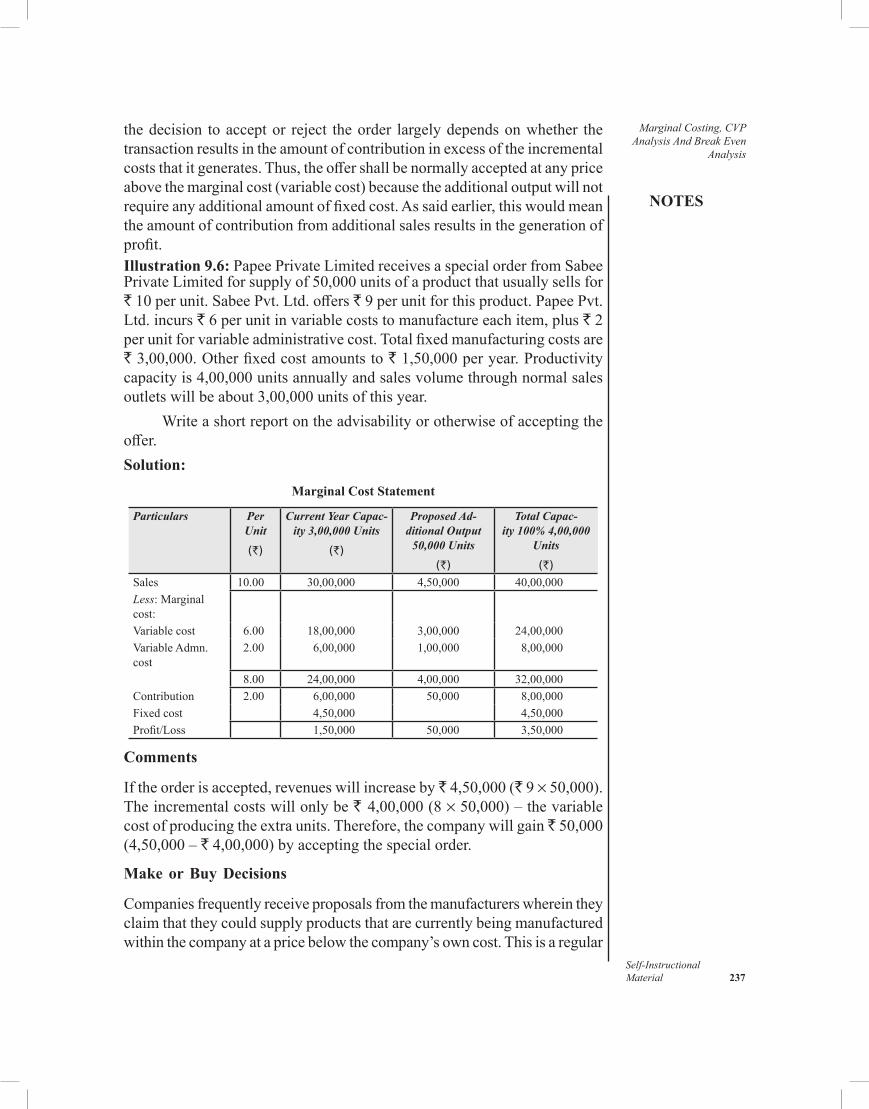
NOTES
Self-InstructionalMaterial 237
Marginal Costing, CVP Analysis And Break Even
Analysis
thedecision toacceptor reject theorder largelydependsonwhether thetransactionresultsintheamountofcontributioninexcessoftheincrementalcoststhatitgenerates.Thus,theoffershallbenormallyacceptedatanypriceabovethemarginalcost(variablecost)becausetheadditionaloutputwillnotrequireanyadditionalamountoffixedcost.Assaidearlier,thiswouldmeantheamountofcontributionfromadditionalsalesresultsinthegenerationofprofit.Illustration 9.6:PapeePrivateLimitedreceivesaspecialorderfromSabeePrivateLimitedforsupplyof50,000unitsofaproductthatusuallysellsfor` 10 perunit.SabeePvt.Ltd.offers`9perunitforthisproduct.PapeePvt.Ltd. incurs `6perunitinvariablecoststomanufactureeachitem,plus` 2 perunitforvariableadministrativecost.Totalfixedmanufacturingcostsare`3,00,000.Otherfixedcostamountsto`1,50,000peryear.Productivitycapacityis4,00,000unitsannuallyandsalesvolumethroughnormalsalesoutletswillbeabout3,00,000unitsofthisyear.
Writeashortreportontheadvisabilityorotherwiseofacceptingtheoffer.Solution:
Marginal Cost Statement
Particulars Per Unit
(`)
Current Year Capac-ity 3,00,000 Units
(`)
Proposed Ad-ditional Output
50,000 Units
(`)
Total Capac-ity 100% 4,00,000
Units
(`)Sales 10.00 30,00,000 4,50,000 40,00,000Less:Marginalcost:Variablecost 6.00 18,00,000 3,00,000 24,00,000VariableAdmn.cost
2.00 6,00,000 1,00,000 8,00,000
8.00 24,00,000 4,00,000 32,00,000Contribution 2.00 6,00,000 50,000 8,00,000Fixedcost 4,50,000 4,50,000Profit/Loss 1,50,000 50,000 3,50,000
Comments
Iftheorderisaccepted,revenueswillincreaseby`4,50,000(` 9 ×50,000).Theincrementalcostswillonlybe` 4,00,000(8×50,000)–thevariablecostofproducingtheextraunits.Therefore,thecompanywillgain 50,000(4,50,000–`4,00,000)byacceptingthespecialorder.
Make or Buy Decisions
Companiesfrequentlyreceiveproposalsfromthemanufacturerswhereintheyclaimthattheycouldsupplyproductsthatarecurrentlybeingmanufacturedwithinthecompanyatapricebelowthecompany’sowncost.Thisisaregular
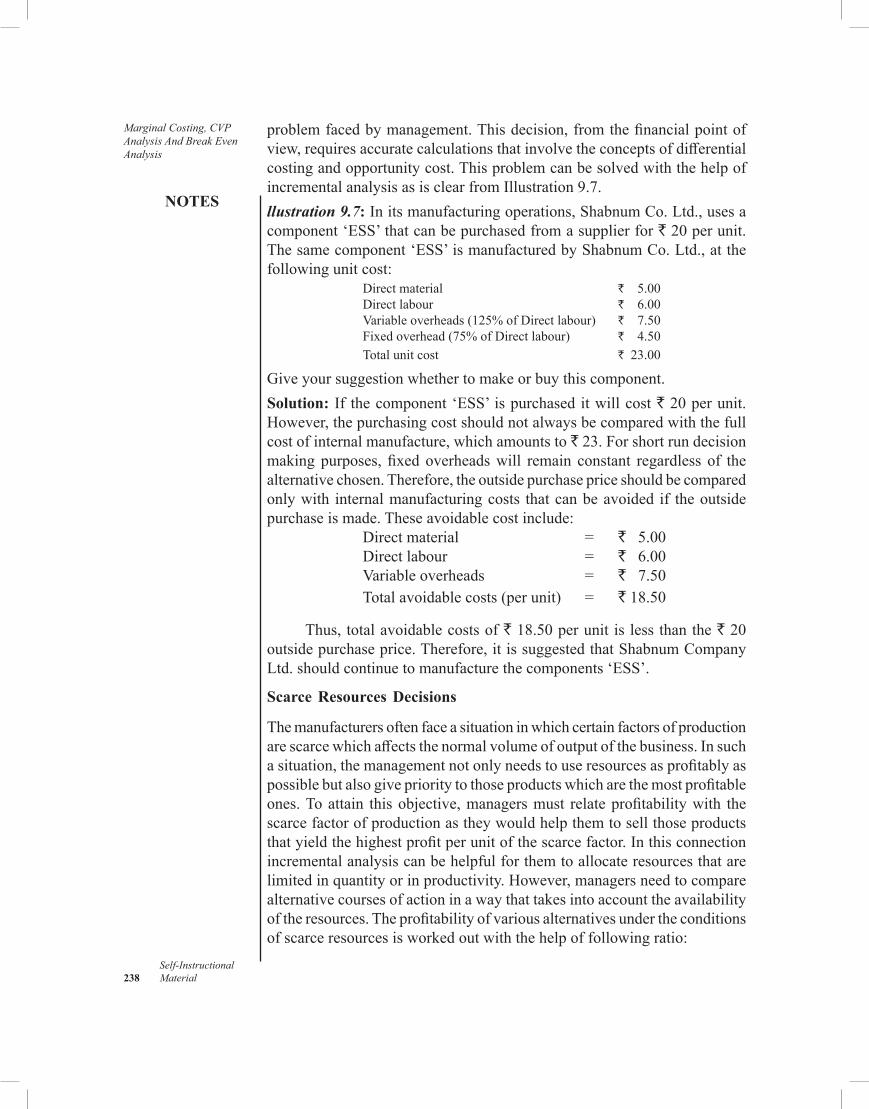
Marginal Costing, CVP Analysis And Break Even Analysis
NOTES
Self-Instructional 238 Material
problemfacedbymanagement.Thisdecision,fromthefinancialpointofview,requiresaccuratecalculationsthatinvolvetheconceptsofdifferentialcostingandopportunitycost.ThisproblemcanbesolvedwiththehelpofincrementalanalysisasisclearfromIllustration9.7.llustration 9.7:Initsmanufacturingoperations,ShabnumCo.Ltd.,usesacomponent‘ESS’thatcanbepurchasedfromasupplierfor` 20 per unit. Thesamecomponent‘ESS’ismanufacturedbyShabnumCo.Ltd.,atthefollowingunitcost:
Directmaterial ` 5.00Directlabour ` 6.00Variableoverheads(125%ofDirectlabour) ` 7.50Fixedoverhead(75%ofDirectlabour) ` 4.50Totalunitcost ` 23.00
Giveyoursuggestionwhethertomakeorbuythiscomponent.Solution: If thecomponent‘ESS’ ispurchaseditwillcost` 20 per unit. However,thepurchasingcostshouldnotalwaysbecomparedwiththefullcostofinternalmanufacture,whichamountsto`23.Forshortrundecisionmakingpurposes, fixedoverheadswill remain constant regardless of thealternativechosen.Therefore,theoutsidepurchasepriceshouldbecomparedonlywith internalmanufacturingcosts thatcanbeavoided if theoutsidepurchaseismade.Theseavoidablecostinclude:
Directmaterial = ` 5.00Directlabour = ` 6.00Variableoverheads = ` 7.50Totalavoidablecosts(perunit) = ` 18.50
Thus,totalavoidablecostsof`18.50perunitislessthanthe` 20 outsidepurchaseprice.Therefore,itissuggestedthatShabnumCompanyLtd.shouldcontinuetomanufacturethecomponents‘ESS’.
Scarce Resources Decisions
Themanufacturersoftenfaceasituationinwhichcertainfactorsofproductionarescarcewhichaffectsthenormalvolumeofoutputofthebusiness.Insuchasituation,themanagementnotonlyneedstouseresourcesasprofitablyaspossiblebutalsogiveprioritytothoseproductswhicharethemostprofitableones.Toattain thisobjective,managersmust relateprofitabilitywith thescarcefactorofproductionastheywouldhelpthemtosellthoseproductsthatyieldthehighestprofitperunitofthescarcefactor.Inthisconnectionincrementalanalysiscanbehelpfulforthemtoallocateresourcesthatarelimitedinquantityorinproductivity.However,managersneedtocomparealternativecoursesofactioninawaythattakesintoaccounttheavailabilityoftheresources.Theprofitabilityofvariousalternativesundertheconditionsofscarceresourcesisworkedoutwiththehelpoffollowingratio:
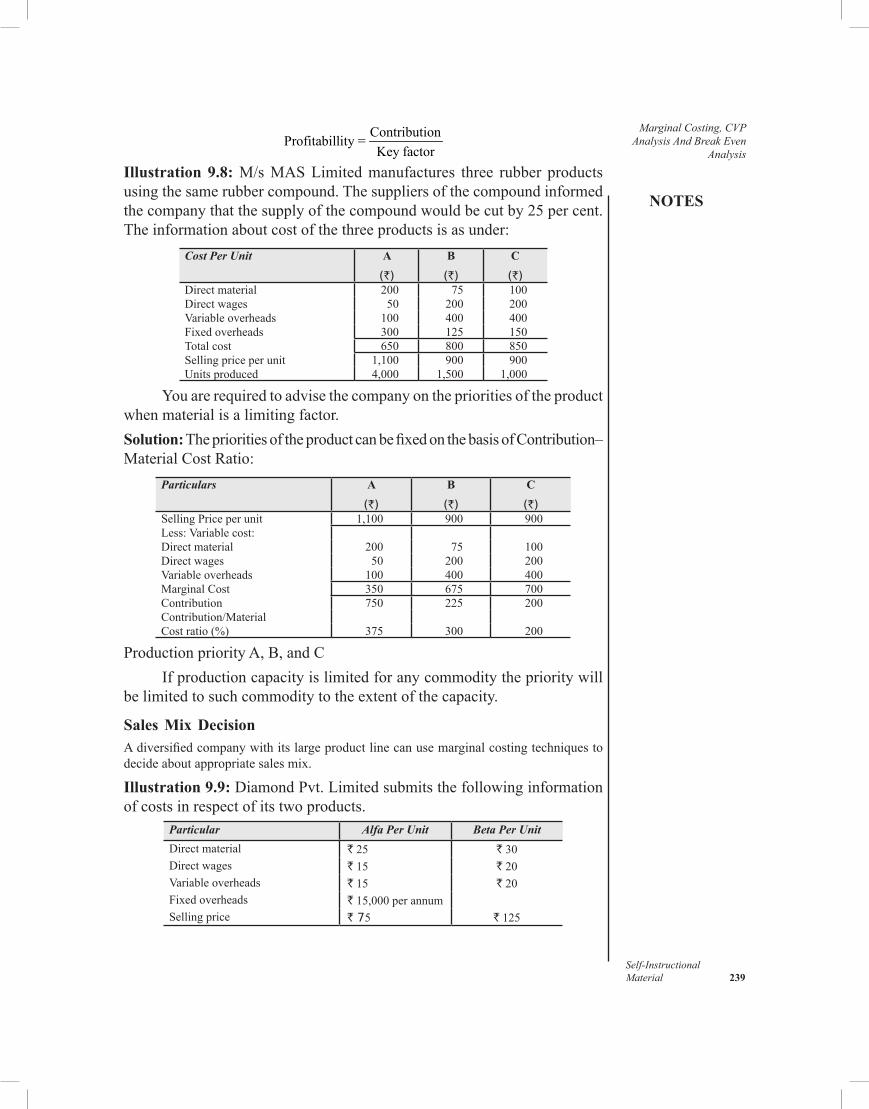
NOTES
Self-InstructionalMaterial 239
Marginal Costing, CVP Analysis And Break Even
Analysis
ContributionProfitabillity =Key factor
Illustration 9.8:M/sMASLimitedmanufactures three rubber productsusingthesamerubbercompound.Thesuppliersofthecompoundinformedthecompanythatthesupplyofthecompoundwouldbecutby25percent.Theinformationaboutcostofthethreeproductsisasunder:
Cost Per Unit A
(`)
B
(`)
C
(`)Directmaterial 200 75 100Directwages 50 200 200Variableoverheads 100 400 400Fixedoverheads 300 125 150Totalcost 650 800 850Sellingpriceperunit 1,100 900 900Unitsproduced 4,000 1,500 1,000
Youarerequiredtoadvisethecompanyontheprioritiesoftheproductwhenmaterialisalimitingfactor.Solution:TheprioritiesoftheproductcanbefixedonthebasisofContribution– MaterialCostRatio:
Particulars A
(`)
B
(`)
C
(`)SellingPriceperunit 1,100 900 900Less:Variablecost:Directmaterial 200 75 100Directwages 50 200 200Variableoverheads 100 400 400MarginalCost 350 675 700Contribution 750 225 200Contribution/MaterialCostratio(%) 375 300 200
ProductionpriorityA,B,andCIfproductioncapacityislimitedforanycommoditytheprioritywill
belimitedtosuchcommoditytotheextentofthecapacity.
Sales Mix DecisionAdiversifiedcompanywithitslargeproductlinecanusemarginalcostingtechniquestodecideaboutappropriatesalesmix.
Illustration 9.9:DiamondPvt.Limitedsubmitsthefollowinginformationofcostsinrespectofitstwoproducts.
Particular Alfa Per Unit Beta Per UnitDirectmaterial ` 25 ` 30Directwages ` 15 ` 20Variableoverheads ` 15 ` 20Fixedoverheads `15,000perannumSellingprice ` 75 ` 125
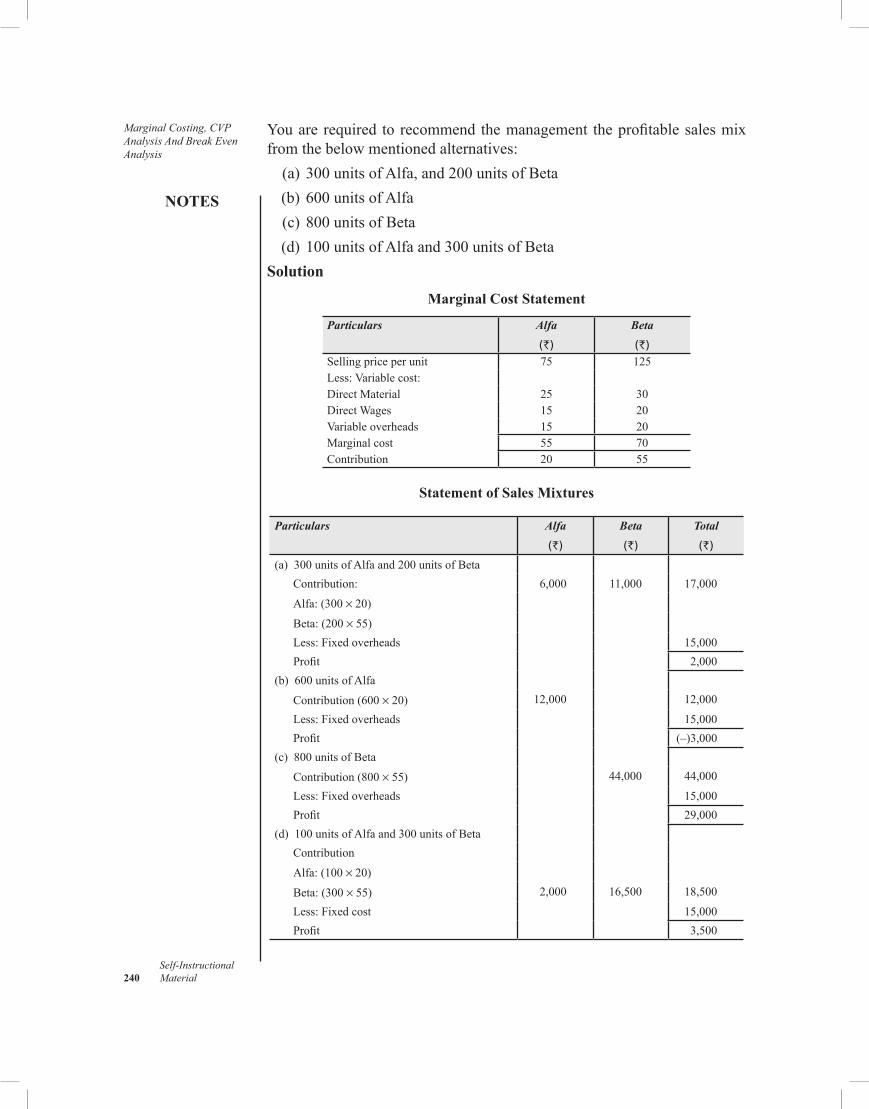
Marginal Costing, CVP Analysis And Break Even Analysis
NOTES
Self-Instructional 240 Material
Youarerequired torecommendthemanagement theprofitablesalesmixfromthebelowmentionedalternatives: (a) 300unitsofAlfa,and200unitsofBeta (b) 600unitsofAlfa (c) 800unitsofBeta (d) 100unitsofAlfaand300unitsofBetaSolution
Marginal Cost Statement
Particulars Alfa
(`)
Beta
(`)Sellingpriceperunit 75 125Less:Variablecost:DirectMaterial 25 30Direct Wages 15 20Variableoverheads 15 20Marginalcost 55 70Contribution 20 55
Statement of Sales Mixtures
Particulars Alfa
(`)
Beta
(`)
Total
(`)
(a) 300unitsofAlfaand200unitsofBetaContribution: 6,000 11,000 17,000
Alfa:(300×20)
Beta:(200×55)Less:Fixedoverheads 15,000Profit 2,000
(b) 600unitsofAlfa
Contribution (600 ×20) 12,000 12,000
Less:Fixedoverheads 15,000Profit (–)3,000
(c) 800unitsofBeta
Contribution (800 ×55) 44,000 44,000
Less:Fixedoverheads 15,000Profit 29,000
(d) 100unitsofAlfaand300unitsofBetaContribution
Alfa:(100×20)
Beta:(300×55) 2,000 16,500 18,500
Less:Fixedcost 15,000Profit 3,500
NOTES
Self-InstructionalMaterial 241
Marginal Costing, CVP Analysis And Break Even
Analysis9.4 CVP ANALYSIS AND BREAK EVEN ANALYSIS
Cost-volume-profitanalysis(CVPanalysis)isanextensionoftheprinciplesofmarginalcosting.Itstudiestheinterrelationshipofthreebasicfactorsofbusiness operations: (a)Costofproduction (b)Volumeofproduction/sales (c)Profit
These three factors are interconnected in such away that they actandreactononeanotherbecauseofcauseandeffectrelationshipamongstthem.Thecostofaproductdeterminesitssellingpriceandthesellingpricedeterminesthelevelofprofit.Thesellingpricealsoaffectsthevolumeofsaleswhichdirectlyaffectsthevolumeofproductionandvolumeofproductioninturninfluencescost.Inbrief,variationsinvolumeofproductionresultsinchangesincostandprofit.CIMALondonhasdefinedCVPanalysisas,‘thestudyoftheeffectsonfutureprofitsofchangesinfixedcost,variablecost,salesprice,quantityandmix.’
AnunderstandingofCVPanalysisisextremelyusefultomanagementinbudgetingandprofitplanning.Itexplainstheimpactofthefollowingonthenetprofit: (a)Changesinsellingprices (b)Changesinvolumeofsales (c)Changesinvariablecost (d)Changesinfixedcost
Infact,CVPanalysishelpsindeterminingtheprobableeffectofchangeinanyoneofthesefactorsontheremainingfactors.
Break-even Analysis
Break-evenanalysisisawidely-usedtechniquetostudytheCVPrelationship.Itisinterpretedinnarrowaswellasbroadsense.
Initsnarrowsense,break-evenanalysisisconcernedwithdeterminingbreak-evenpoint,i.e.,thatlevelofproductionandsaleswherethereisnoprofitandnoloss.Atthispointtotalcostisequaltototalsalesrevenue.
Whenusedinbroadsense,break-evenanalysisisusedtodetermineprobableprofit/lossatanygivenlevelofproduction/sales.Itisalsousedtodeterminetheamountofsalestoearnadesiredamountofprofit.
Marginal Costing, CVP Analysis And Break Even Analysis
NOTES
Self-Instructional 242 Material
Check Your Progress
4.Mentionthedecisioncriteriamostoftenusedfordecisionmakingin an organization.
5.Howistheprofitabilityofvariousalternativeundertheconditionsofscarceresourceworkedout?
6.ListtheelementswhoseimpactonthenetprofitisrevealedbytheCVPanalysis.
9.5 ANSWERS TO CHECK YOUR PROGRESS QUESTIONS
1.Fixedcostsarehandlesasperiodcosts, i.e., theyarewrittenoffasexpensesintheperiodinwhichtheyareincurred.Theydonotfollowtheinventoriesthroughtheaccountsbutratheraretreatedinawaywhichistraditionallyforsellingandgeneraladministrativeexpenses.
2.Thefollowingisthefundamentalmarginalcostequation: Sales–MarginalCost=FixedCost±Profit/Loss 3.Theprofit/volumeratioalsoknownas‘contributionratio’or‘marginal
ratio’ expresses the relationshipbetween contribution and sales. Inotherwords,itisthecontributionperrupeeofsales.
4.The decision criteriamost often used for decisionmaking in anorganization include cotsminimization, profitmaximization andcontributionmaximization.
5.Theprofitabilityofvariousalternativeundertheconditionsofscarceresourceworkedoutwiththehelpoffollowingratio:
ContributionKey Factor
Profitability =
6.CVPanalysisisextremelyusefultomanagementinbudgetingandprofitplanning.Itexplainstheimpactofthefollowingonthenetprofit:
(a) Changesinsellingprices (b) Changesinvolumeofsales (c) Changesinvariablecost (d) Changesinfixedcost
9.6 SUMMARY
• Fixedcost remainsconstant toaparticular levelofoutputwhereasvariable cost has the tendency to change proportionatelywith thevolumeofoutput.
NOTES
Self-InstructionalMaterial 243
Marginal Costing, CVP Analysis And Break Even
Analysis
•Marginalcostistheincreaseordecreaseintotalcostwhichresultsfromproductionorsellingadditionalorfewerunitsofaproductorformachangeinthemethodofproductionordistributionsuchastheuseofimprovedmachinery,additionorexclusionofaproductorterritory,orselectionofanadditionalsaleschannel.
•Marginalcostingisacostingtechniquethatconsidersonlythecoststhat varydirectlywith volume—directmaterials, direct labour andvariablefactoryoverheadsandignoresfixedcostinadditionaloutputdecisions.
•Contributionistheexcessofsalesovermarginalcost(variablecost)thatistheamountlefttomeetfixedcostandprofitexpectationofanorganization.
•Theprofit/volumeratioexpressestherelationshipbetweencontributionandsales.
•Marginalcostingasamanagerialtoolusesthedecisioncriteriawhichare generally basedon costminimization, profitmaximization andcontributionmaximization.
9.7 KEY WORDS
• Marginal cost: Itisthecostofoneadditionalunitofoutput. • Marginal costing: It is an accounting techniquewhich ascertains
marginalcostofadditionaloutputbydifferentiatingbetweenfixedandvariablecosts.
• Absorption costing: Itisasystemofcostingthatrecognizesallcostsinascertainingthecostoftheproduct.
• Contribution: Itisthedifferencebetweenthemarginalcostofvariousproductsmanufacturedandtheirrespectivesellingprice.
9.8 SELF ASSESSMENT QUESTIONS AND EXERCISES
Short-Answer Questions
1.Definemarginalcost.Discusstheimportanceofclassifyingexpensesintovariableandfixed.
2.What is differencebetweenOrthodox (or absorption) costing andmarginalcostinginconceptanduse?
3.Prepareamarginalcoststatementfromtheinformationgivenbelow: DirectMaterial `20,000 Directlabour `15,000
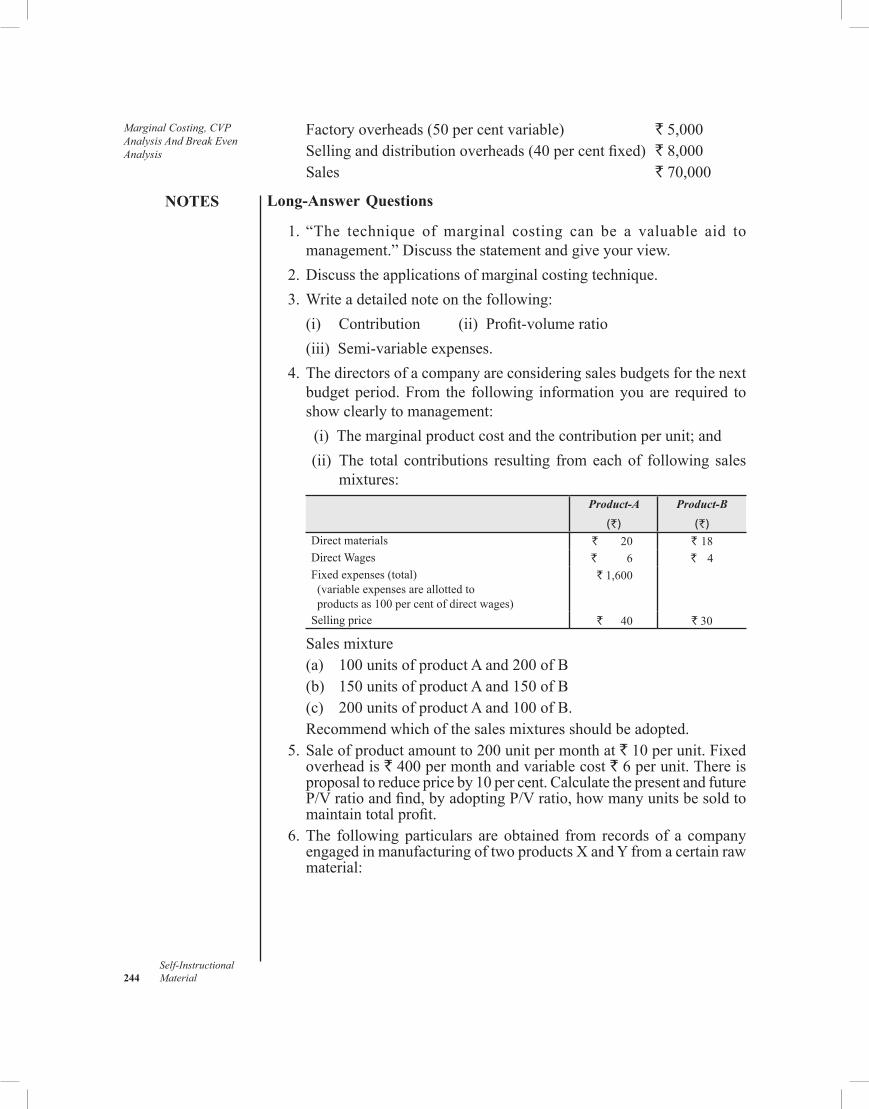
Marginal Costing, CVP Analysis And Break Even Analysis
NOTES
Self-Instructional 244 Material
Factoryoverheads(50percentvariable) `5,000 Sellinganddistributionoverheads(40percentfixed) `8,000 Sales `70,000
Long-Answer Questions
1. “The technique of marginal costing can be a valuable aid tomanagement.”Discussthestatementandgiveyourview.
2.Discusstheapplicationsofmarginalcostingtechnique. 3.Writeadetailednoteonthefollowing: (i) Contribution (ii)Profit-volumeratio (iii)Semi-variableexpenses. 4.Thedirectorsofacompanyareconsideringsalesbudgetsforthenext
budgetperiod.From the following informationyouare required toshowclearlytomanagement:
(i) Themarginalproductcostandthecontributionperunit;and (ii) The total contributions resulting fromeachof following sales
mixtures:Product-A
(`)
Product-B
(`)Directmaterials ` 20 ` 18Direct Wages ` 6 ` 4Fixedexpenses(total) (variableexpensesareallottedto productsas100percentofdirectwages)
`1,600
Sellingprice ` 40 ` 30
Salesmixture (a) 100unitsofproductAand200ofB (b) 150unitsofproductAand150ofB (c) 200unitsofproductAand100ofB. Recommendwhichofthesalesmixturesshouldbeadopted. 5.Saleofproductamountto200unitpermonthat`10perunit.Fixed
overheadis`400permonthandvariablecost`6perunit.Thereisproposaltoreducepriceby10percent.CalculatethepresentandfutureP/Vratioandfind,byadoptingP/Vratio,howmanyunitsbesoldtomaintaintotalprofit.
6.The followingparticulars are obtained from recordsof a companyengagedinmanufacturingoftwoproductsXandYfromacertainrawmaterial:
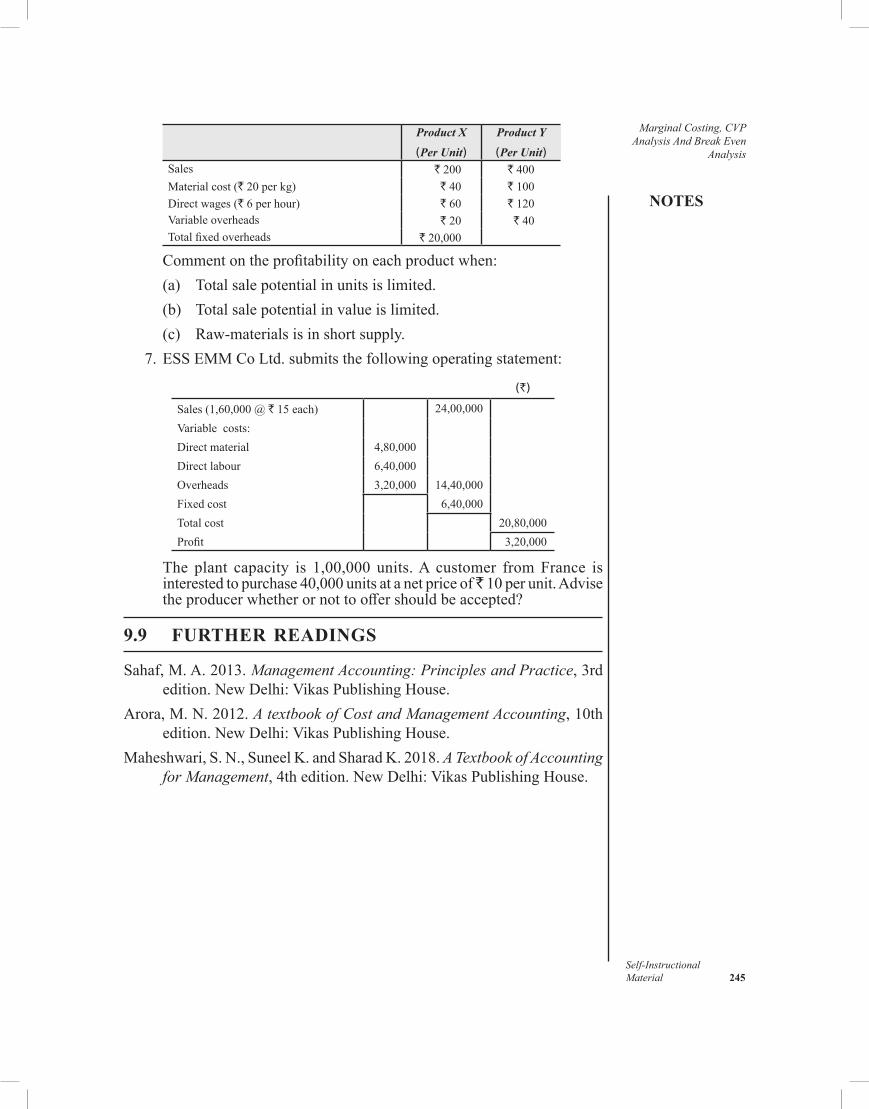
NOTES
Self-InstructionalMaterial 245
Marginal Costing, CVP Analysis And Break Even
Analysis
Product X
(Per Unit)
Product Y
(Per Unit)Sales ` 200 ` 400Materialcost(`20perkg) ` 40 ` 100Directwages(`6perhour) ` 60 ` 120Variableoverheads ` 20 ` 40Totalfixedoverheads `20,000
Commentontheprofitabilityoneachproductwhen: (a) Totalsalepotentialinunitsislimited. (b) Totalsalepotentialinvalueislimited. (c) Raw-materialsisinshortsupply. 7.ESSEMMCoLtd.submitsthefollowingoperatingstatement:
(`)
Sales(1,60,000@`15each) 24,00,000Variablecosts:Directmaterial 4,80,000Directlabour 6,40,000Overheads 3,20,000 14,40,000Fixedcost 6,40,000Totalcost 20,80,000Profit 3,20,000
The plant capacity is 1,00,000 units.A customer fromFrance isinterestedtopurchase40,000unitsatanetpriceof 10 per unit. Advise theproducerwhetherornottooffershouldbeaccepted?
9.9 FURTHER READINGS
Sahaf,M.A.2013.Management Accounting: Principles and Practice,3rdedition.NewDelhi:VikasPublishingHouse.
Arora,M.N.2012.A textbook of Cost and Management Accounting,10thedition.NewDelhi:VikasPublishingHouse.
Maheshwari,S.N.,SuneelK.andSharadK.2018.A Textbook of Accounting for Management,4thedition.NewDelhi:VikasPublishingHouse.
Break-Even Analysis/Point (BEA/BEP)
NOTES
Self-Instructional 246 Material
UNIT 10 BREAK-EVEN ANALYSIS/POINT (BEA/BEP)
Structure 10.0 Introduction 10.1 objectives 10.2 ConceptofBreak-EvenPoint/Analysis
10.2.1 ManagerialApplicationsandProfitPlanning 10.2.2 Assumptions,AdvantagesandLimitations 10.2.3 Margin of Safety 10.2.4 AngleofIncidence 10.2.5 Profit-VolumeGraph
10.3 AnswerstoCheckYourProgress 10.4 Summary 10.5 Key Words 10.6 SelfAssessmentQuestionsandExercises 10.7 FurtherReadings
10.0 INTRODUCTION
Break-evenanalysis isacosting technique thathelpsexecutives inprofitplanning and consequently it is essential for them to have an in-depthknowledgeaboutthenatureandapplicationofthistechnique.Thenarrowinterpretationofbreak-evenanalysislimitsittothestudyofbreak-evenpoint.Thebreak-even point isdefinedasthevolumeofactivityatwhichtotalsalesrevenueexactlyequalstotalcostsoftheoutputproducedorsold.Atthislevelofoperationsalesrevenueisadequatetocoverallcoststomanufactureandselltheproductleavingnoamountasprofit,andtherefore,thislevelisalsoknownasno profit no loss level.
10.1 OBJECTIVES
Aftergoingthroughthisunit,youwillbeableto: •ExplaintheconceptofBEP •Describethemarginofsafety •DiscusstheManagerialapplicationsandProfitplanningthroughbreak
evenanalysis
10.2 CONCEPT OF BREAK-EVEN POINT/ANALYSIS
Theapplicationofbreak-evenanalysisrequirestheuseoftheconceptofmarginal contributionwhich represents the amount left after deducting
NOTES
Self-InstructionalMaterial 247
Break-Even Analysis/Point (BEA/BEP)
variablecostsfromsales.Conceptually,contributionistheamountthatisutilizedtomeetfixedcostandexpectedprofitofthebusiness.Thisbringstolightanimportantfactthatatbreak-evenpointtotalcontributionwillbeexactlyequaltototalfixedcostastherewouldnoprofitatthispoint.Thus,inasituationwheretotalcostsoftheoutputconsistofonlyvariablecosts,thebreak-evenpointwouldbeatzerolevelofoperation.Inthesameway,profitscannotbeexpectedinasituationwheretotalcostscompriseonlyfixedonesuntilcontribution(i.e.,theamountofsale(perunit)thatexceedsperunitvariablecost)exceedssuchcosts.Thediscussionclearlyrevealsthatdeterminationofbreak-evenpoint requiressegregationof totalcosts intovariableandfixedcosts.
Break-even analysis is notmerely limited to seeking the break-evenpoint. Inabroadersense,break-evenanalysisrefers to thestudyofrelationshipbetweencost,volumeandprofitatdifferentlevelsofsalesorproductionwhichinaccountingterminologyisknownascost-volume-profit analysis.Cost-volume-profitanalysisasaplanningtoolanalysestheinherentrelationshipbetweenprice,coststructure,volumeandprofit.
Belkaoni definescost-volume-profitanalysisasan examination of cost and revenue behavioural patterns and their relationships with profit. The analysis separates costs into fixed and variable components and determines the levels of activity where costs and revenues are in equilibrium.
AccordingtoSchmiedickeandNagy,1978,cost-volume-profitanalysisis an analytical technique which uses the degree of cost variability for measuring the effect of changes in volume on resulting profits. Such analysis assumes that the plant assets of the firm will remain the same in the short run, therefore, the established level of fixed cost will also remain unchanged during the period being studied.
To theauthorof thisbook, cost-volume-profit analysis is a mature model to study the inter-related relationship between costs, price and profit structure of a company. It is a formal profit planning approach based on established relationship between different factors affecting profit.Theusualstartingpointinsuchananalysisisthe determinationofthecompany’sbreak-evenpoint.Thus,break-evenanalysisformsjustonecomponentofthe totalsystemofcost-volume-profitanalysis.However,itisoftenakeypart,anditcangivethemanagermany insightsintothedatawithwhichheorsheisworking(Garrison,1976).
Cost-volume-profit analysis provides the following importantinformation for managerialdecisionmaking:
• Costofproductionatvariouslevelsofoperation;• Volumeorlevelofproduction/activityrequiredtoattainaparticular
objective;• Profitsexpected/earned; and• Variationbetweencostofproductionandsalesrevenue.
Break-Even Analysis/Point (BEA/BEP)
NOTES
Self-Instructional 248 Material
Break-even Computation
The two major approaches to compute break-even are: •Mathematicalapproach •GraphicapproachMathematical Approach: Mathematicallybreak-evencanbecomputedbyengagingthetechniqueofunitcontributionwhichisdevelopedonthebasisofmarginalcostequationasdiscussedearlier.Theequationcanbestatedasfollows:
Sale=Variablecost+Fixedcost+ProfitSince at the break-evenpoint profit is absent, therefore, the same
equationforthispurposecanberewrittenasfollows: Sales=Variablecost+Fixedcostor Sales–Variablecost=Fixedcostor Contribution=FixedcostThestudyoftheaboveequationrevealsthatsalesrevenueofeachunit
leavesacertainamountintheshapeofcontributionmargintomeetfixedcosts.Thus,inordertoworkouttherequirednumberofunitstobreak-even(where the amountofcontributionwillbesufficienttocovertotalfixedcost),thetotalfixedcostmustbedividedbytheunitcontribution.Accordingly,thebreak-evenpointcanbecalculatedintermsofunitsbyusingthefollowingequation:
Break-evenpoint(intermsofunits)=
or where BEP=Break-evenpoint FC=Totalfixedcost SP=Sellingpriceperunit VC=VariablecostperunitThe break-even point can also be calculated in terms of rupees.
Althoughthesimplestwaytocalculateitistomultiplythebreak-evensalesinunitbythesellingprice,yettheotherapproachtocomputethebreak-evensalesintermsofrupeesistousecontributionmarginratio*.Inthisapproachtheunitcontributionmarginasshowninaboveequationisreplacedbythecontributionmarginratio.
Accordingly,thebreak-evenpointintermsofrupeescanbecomputedwiththehelpoftheequationasgivenunder.
*Contributionmarginratioexplainstherelationshipbetweencontributionandsales.Itrepresentsthepercentageofcontributiontosales.Theratioiscalculatedasfollows:CMR=SP–VC÷SP,whereSPandVCstandsforsellingpriceandvariablecostperunitrespectively.
NOTES
Self-InstructionalMaterial 249
Break-Even Analysis/Point (BEA/BEP)
where FC=Totalfixedcost CMR=ContributionmarginratioIn a situationwhereitisnotpossibletocalculatecontributionmargin
ratioasthesellingpriceandvariablecostperunitisnotreadilyavailable,thebreak-evenpointintermsofrupeesiscomputedwiththehelpofProfit-volumeratioasshownbelow:
where FC=Totalfixedcost P/Vratio=Profit/volumeratioThefollowingillustrationswillcleartheapplicationofmathematical
approachtobreak-evenanalysis.Illustration 10.1:Calculatebreak-evenpointfromthefollowinginformation:
Fixedcost=`1,200 Variablecost=`5,000Salesinrupees=`7,000 Salesinunits=`1,000
Solution
Working:
(i) Calculationofvariablecost=
(ii) Calculationofsellingprice(percost)=
(iii) Calculationofcontributionmarginratio(CMR)
Illustration 10.2: Computebeak-evenpointfrombelowgiveninformation:Fixedcost=` 3,600Variablecost=`15,000 Sales=`21,000
Solution: The formula applied in the above-mentioned question for thecalculationofbreak-evenpointcannotbeusedinthisproblemasitlackstheinformationonsellingpriceperunitandvariablecostperunit,therefore,thebreak-evenpointwillbecalculatedwiththehelpofP/Vratio.Thus
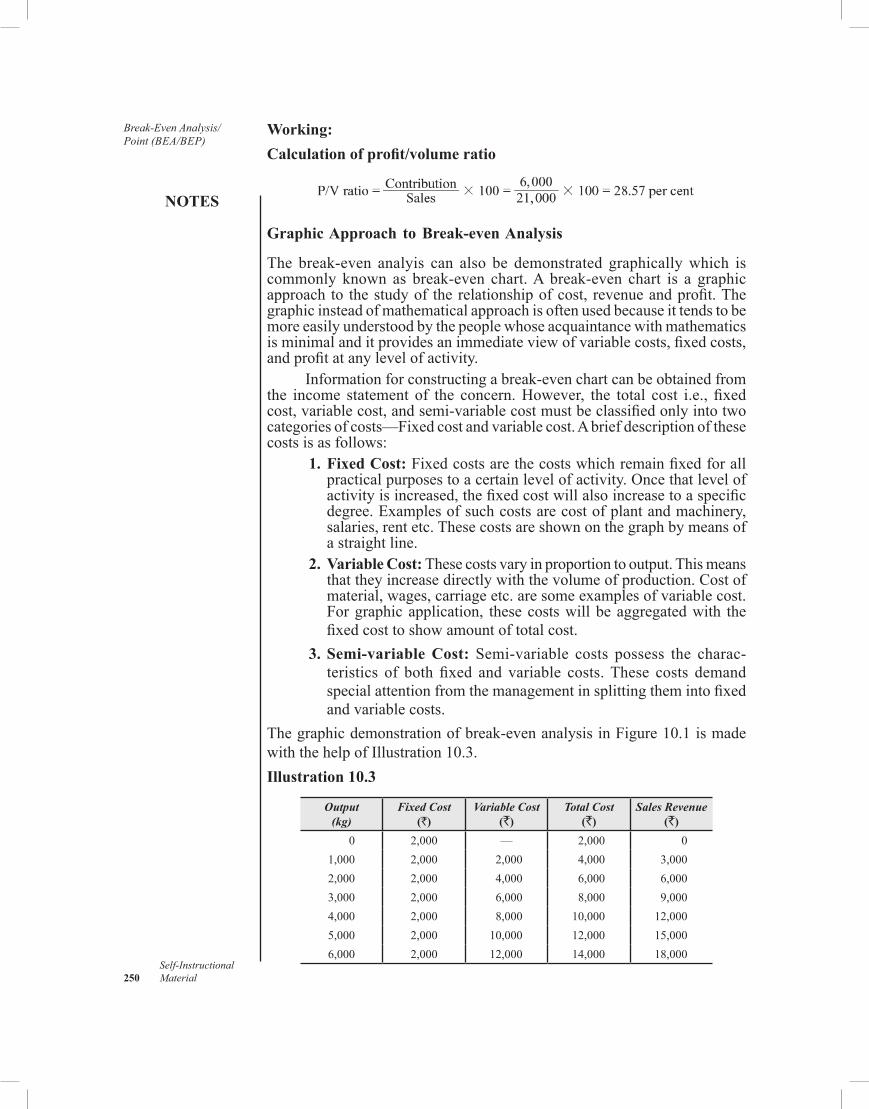
Break-Even Analysis/Point (BEA/BEP)
NOTES
Self-Instructional 250 Material
Working:Calculation of profit/volume ratio
Graphic Approach to Break-even Analysis
The break-even analyis can also be demonstrated graphicallywhich iscommonly known as break-even chart.A break-even chart is a graphicapproach to thestudyof therelationshipofcost, revenueandprofit.Thegraphicinsteadofmathematicalapproachisoftenusedbecauseittendstobemoreeasilyunderstoodbythepeoplewhoseacquaintancewithmathematicsisminimalanditprovidesanimmediateviewofvariablecosts,fixedcosts,andprofitatanylevelofactivity.
Informationforconstructingabreak-evenchartcanbeobtainedfromthe income statement of the concern.However, the total cost i.e., fixedcost,variablecost,andsemi-variablecostmustbeclassifiedonlyintotwocategoriesofcosts—Fixedcostandvariablecost.Abriefdescriptionofthesecostsisasfollows:
1. Fixed Cost: Fixedcostsarethecostswhichremainfixedforallpracticalpurposestoacertainlevelofactivity.Oncethatlevelofactivityisincreased,thefixedcostwillalsoincreasetoaspecificdegree.Examplesofsuchcostsarecostofplantandmachinery,salaries,rentetc.Thesecostsareshownonthegraphbymeansofastraightline.
2. Variable Cost: Thesecostsvaryinproportiontooutput.Thismeansthattheyincreasedirectlywiththevolumeofproduction.Costofmaterial,wages,carriageetc.aresomeexamplesofvariablecost.Forgraphicapplication, thesecostswillbeaggregatedwith thefixedcosttoshowamountoftotalcost.
3. Semi-variable Cost: Semi-variable costs possess the charac-teristics of both fixed and variable costs.These costs demandspecialattentionfromthemanagementinsplittingthemintofixedandvariablecosts.
Thegraphicdemonstrationofbreak-evenanalysisinFigure10.1ismadewiththehelpofIllustration10.3.Illustration 10.3
Output (kg)
Fixed Cost(`)
Variable Cost(`)
Total Cost (`)
Sales Revenue(`)
0 2,000 — 2,000 01,000 2,000 2,000 4,000 3,0002,000 2,000 4,000 6,000 6,0003,000 2,000 6,000 8,000 9,0004,000 2,000 8,000 10,000 12,0005,000 2,000 10,000 12,000 15,0006,000 2,000 12,000 14,000 18,000
NOTES
Self-InstructionalMaterial 251
Break-Even Analysis/Point (BEA/BEP)
Computebreak-evenpointfromtheinformationgivenabovewiththehelpofgraphicapproach.Solution: Thedrawingofbreak-evenchartinvolvesthefollowingsteps: 1. Salesvolume(output)inunitsisshownhorizontallyontheX-axis. 2.RevenueandcostsareshownverticallyontheY-axis. 3.AfixedcostlineisdrawnparalleltotheX-axisasshowninFigure10.1.
Inthisfigure,CFrepresentstotalfixedcosts,whichremainconstantat `2,000overalllevelsofoutput.
4.Variablecostsareplottedfromthelefthandsideofthefixedcostline.Ifsuchcostsareplottedfromthezerolevel(point)onthegraphasshowninFigure10.2,theyshowonlythevariablecostofproduction.InFigure10.2,OTVCrepresentstotalvariablecostswhichare 2 per kgatalllevelsofoutput.ByplottingvariablecostfromthefixedcostlineasshowninFigure10.3,suchlinerepresentstotaloperatingcost.InFigure10.3,twofunctionscomposedoffixedcostof`2,000andvariablecostof`2perkgarecombinedasisrepresentedbythelineCTC.
5.Thetotalrevenue/SalesareplottedfromzeropointattheleftasshowninFigure10.4.TotalsalesrevenueisshownasOSRinthisfigureandis `3perkgatalllevelsofoutput.
6.TotalcostandtotalsalesrevenuefunctionsarecombinedasshowninFigure10.5toproduceabreak-evenchart.
7.Thebreak-evenpointinchartoccurswheretotalcostlineintersectsrevenue/salesline.InFigure10.5,theintersectionoftotalcostfunction,CTCandthe totalsalesrevenuefunction,OSR,occursatpointM,whichestablishesthebreak-evenquantity.
8.Draw a perpendicular to theX-axis andY-axis from the point ofintersectionofcostandsaleslinetodeterminebreak-evenpointintermsofunitsandrupeesrespectively.InFigure10.5,MP1andMP2aretheperpendicularsdrawnformsuchintersectionofcostandsaleslinestoY-axisandX-axisrespectivelywhichdeterminebreak-evenpointatanoutputof2,000unitsandatasalesrevenueof 6,000respectively.Abovebreak-evenpoint,afirmwillbeprofitableandbelowitfirmwillincuraloss.
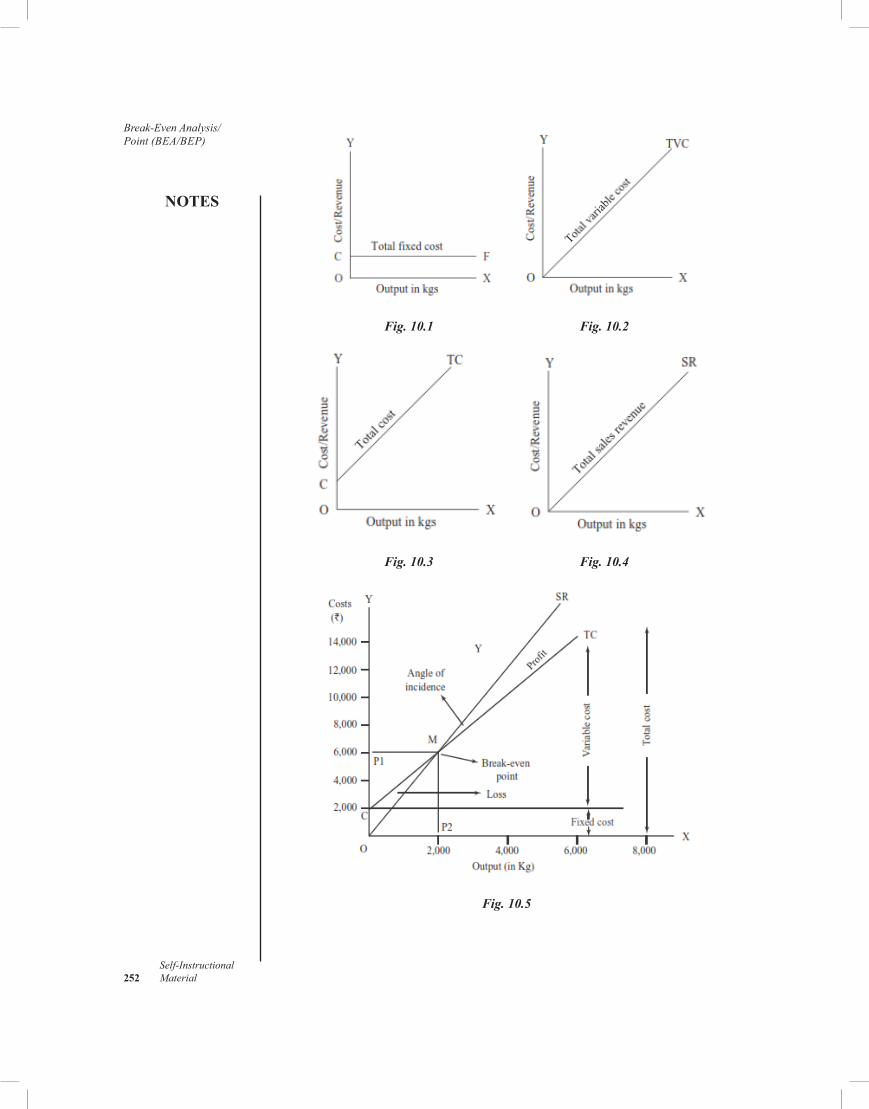
Break-Even Analysis/Point (BEA/BEP)
NOTES
Self-Instructional 252 Material
Fig. 10.1 Fig. 10.2
Fig. 10.3 Fig. 10.4
Fig. 10.5
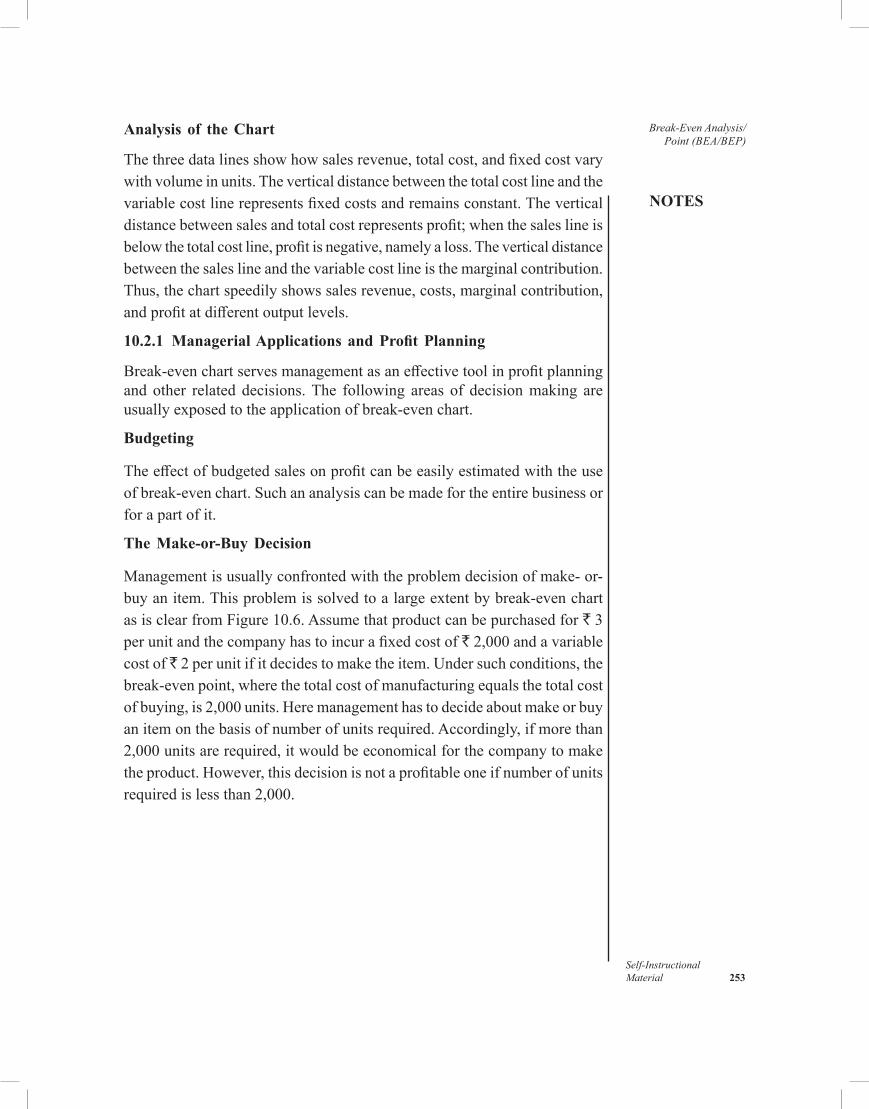
NOTES
Self-InstructionalMaterial 253
Break-Even Analysis/Point (BEA/BEP)
Analysis of the Chart
Thethreedatalinesshowhowsalesrevenue,totalcost,andfixedcostvarywithvolumeinunits.Theverticaldistancebetweenthetotalcostlineandthevariablecostlinerepresentsfixedcostsandremainsconstant.Theverticaldistancebetweensalesandtotalcostrepresentsprofit;whenthesaleslineisbelowthetotalcostline,profitisnegative,namelyaloss.Theverticaldistancebetweenthesaleslineandthevariablecostlineisthemarginalcontribution.Thus,thechartspeedilyshowssalesrevenue,costs,marginalcontribution,andprofitatdifferentoutputlevels.
10.2.1 Managerial Applications and Profit Planning
Break-evenchartservesmanagementasaneffectivetoolinprofitplanningandother related decisions.The following areas of decisionmaking areusuallyexposedtotheapplicationofbreak-evenchart.
Budgeting
Theeffectofbudgetedsalesonprofitcanbeeasilyestimatedwiththeuseofbreak-evenchart.Suchananalysiscanbemadefortheentirebusinessorfor a part of it.
The Make-or-Buy Decision
Management isusuallyconfrontedwiththeproblemdecisionofmake-or-buyanitem.Thisproblemissolvedtoalargeextentbybreak-evenchartasisclearfromFigure10.6.Assumethatproductcanbepurchasedfor` 3 perunitandthecompanyhastoincurafixedcostof`2,000andavariablecost of `2perunitifitdecidestomaketheitem.Undersuchconditions,thebreak-evenpoint,wherethetotalcostofmanufacturingequalsthetotalcostofbuying,is2,000units.Heremanagementhastodecideaboutmakeorbuyanitemonthebasisofnumberofunitsrequired.Accordingly,ifmorethan2,000unitsarerequired,itwouldbeeconomicalforthecompanytomaketheproduct.However,thisdecisionisnotaprofitableoneifnumberofunitsrequiredislessthan2,000.
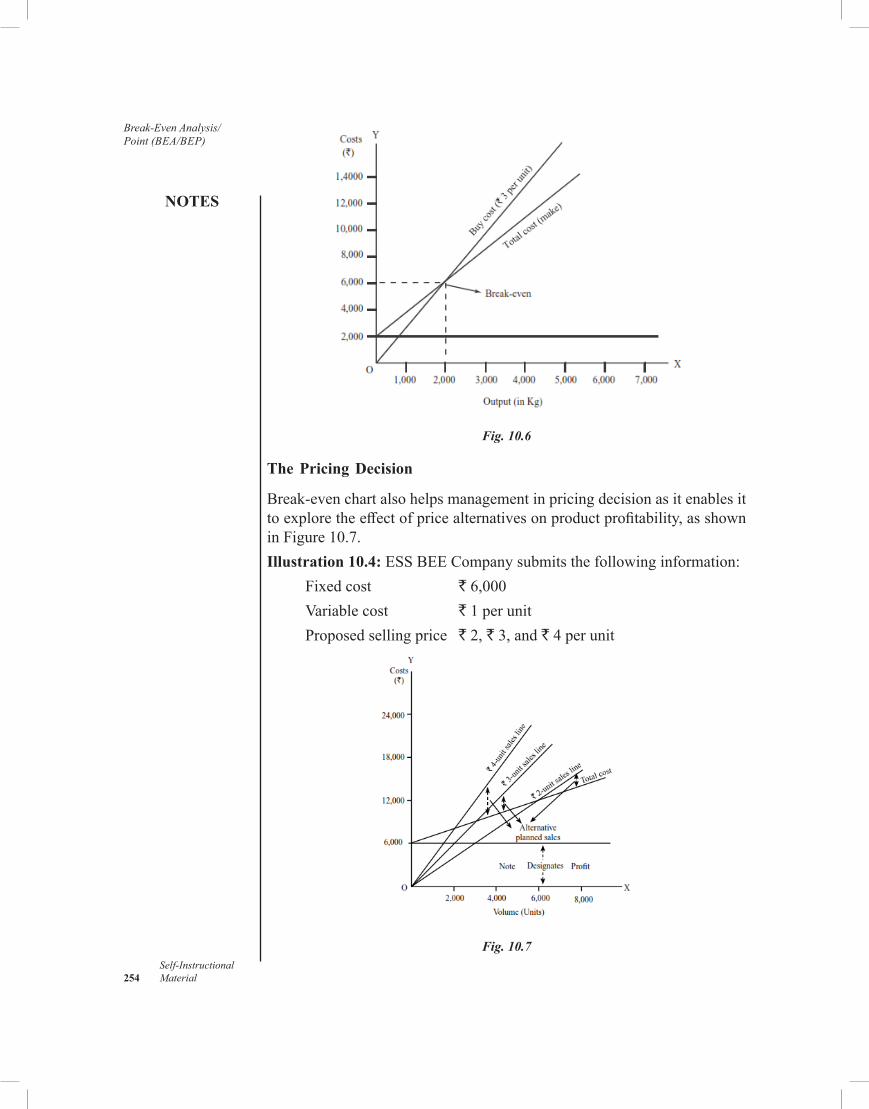
Break-Even Analysis/Point (BEA/BEP)
NOTES
Self-Instructional 254 Material
Fig. 10.6
The Pricing Decision
Break-evenchartalsohelpsmanagementinpricingdecisionasitenablesittoexploretheeffectofpricealternativesonproductprofitability,asshowninFigure10.7.Illustration 10.4: ESSBEECompanysubmitsthefollowinginformation:
Fixedcost `6,000Variablecost ` 1 per unit Proposedsellingprice `2,`3,and` 4 per unit
Fig. 10.7
NOTES
Self-InstructionalMaterial 255
Break-Even Analysis/Point (BEA/BEP)
Estimatedsales:8,000units@` 2 per unit4,000units@` 3 per unit3,500units@` 4 per unit
Youarerequiredtosuggestasuitablepricingpolicythatcanoffermaximumprofittothecompany.Solution: Letusdeterminetheexpectedprofitofthecompanyundervariousalternativeswiththehelpofabreak-evenchart(Figure.10.7).
InFigure10.7,ateachvolumelevel,theverticaldistancebetweenthesaleslineandthetotalcostlinerepresentsprofit.Thechartclearlyrevealsthatexpectedprofitisgreatestatasellingpriceof`4perunit,itisthen`4,500.Apriceofeither`3,or`2perunitgivesprofitofonly`2,000.However,themarginofsafetyisnotequallyfavourableat`4perunit.Atthispointthedifferencebetweenplannedsalesandbreak-evensales(wherethesaleslineintersectsthetotalcostline)is1,500units,comparedwith2,000unitsat a price of `2.Ontheotherhand,themarginofsafetyisonly1,000unitsat a price of `3.Onthewholeapriceof` 4 is indicated.
Sales Mix Analysis
Thestudyofcost-volume-profitcanbemadeeasilywiththehelpofbreak-evenchart.Suchastudycancovertheentireproductmixofacompanyinsteadofbeinglimitedtoasingleproduct.Eachproductwouldrequireaseparatechart.Theaggregatestudyofallchartscangiveaclearprofitabilitypictureofthegivensalesmix.Theprocessshallberepeatedforeachmixandthenthecomparisonofvariousmixescaneasilyindicatetheprofitablesalesmix.
10.2.2 Assumptions, Advantages and Limitations
Inthissection,let’slearnabouttheassumptions,advantagesandlimitationsofBreak-EvenAnalysis.
Assumption Underlying Break-Even Analysis
Beforethereaderdrawsanyconclusionswithrespecttotheaccuracyoforthedesirabilityofthebreak-evenchart,itisessentialthatheisacquaintedwiththeassumptionswhichhavebeenmadeinitsconstruction.Theseassumptionsmaybestatedasfollows: (i)Thechartassumesthatonlyoneproductisbeingsoldorthatthesame
mixofproductsisgoingtobesoldateachvolumelevel.Ifmorethanoneproductissold,thecostperunitofproduct(variableandfixed)willundoubtedlyvaryandtheunitsalespricewillalsoprobablydifferforvariousproducts.Therefore,theassumptionoflineartotalcostandlinearsalesfunctionswouldholdtrueonlyifitisassumedthatateach
Break-Even Analysis/Point (BEA/BEP)
NOTES
Self-Instructional 256 Material
volumeleveltheproportionofeachproductsoldtothetotalremainsconstant.Ifitispossibletoaccuratelydeterminethefixedandvariablecostsapplicabletoeachproduct,separatechartsmightbepreparedforeachproductsold.Thesechartscouldthenbecombinedtoestimateprofitsatanycombinedsalesvolumefortheindividualproducts.
(ii)The chart assumes thatfixed costs remain constant throughout therangeofvolumesdepictedonthebaseline.
(iii)Thechartassumesthatthevariablecostswillvaryindirectproportiontochangesinvolumeorwillremainconstantperunit.However,somesemi-variablecostmayincreaseatincreasingrateoratdecreasingrateandtheassumptionsofaconstantvariablerateperunitmaynotbevalidoverawiderangeofvolumechange.
(iv)AconstantunitsalespriceisanotherassumptionwhichisreflectedinthechartinFigure10.5.
(v) Increaseincosts(fixedorvariable)duetoincreaseinpriceratherthanvolumeisnotreflectedinthechart.
Advantages of Break-Even Chart
Break-evenchartisavaluabletoolinthehandsofmanagementasithelpsitinanumberofways.Theimportantamongthemarementionedbelow: (i)Break-evenchartpresentsaviewofimportantbusinessfactsandresults
moreclearlythanfinancialstatements. (ii) Itexaminestheinherentrelationshipbetweencost,revenueandprofit
insuchawayastohelpbusinessexecutivesindecisionmaking. (iii) Itrevealsbusinessstrengthandprofitearningcapacityofafirmwithout
muchdifficultyandeffort.Thestudyofmarginofsafetyandangleofincidencehelpsinnumberofdecisionmakingareassuchas:
(a) Expansioninlevelofactivity, (b) Costreduction, (c) Fixationofsellingprice;and (d) Productsubstitution. (iv) It helps cost controlmore effectivelyby analysing the relationship
betweenfixedandvariablecost. (v) Itcanascertainprofitatdifferentlevelsofactivity. (vi)Theselectionofmostprofitableproductmixispossiblebystudying
profitabilityofvariousproducts.(vii) Itmeasureseffectofchangesinprofitfactors.
NOTES
Self-InstructionalMaterial 257
Break-Even Analysis/Point (BEA/BEP)
Limitations of Break-Even Chart
Break-evenchartsuffersfromfollowinglimitations:
(i)Thefirstandforemostlimitationofbreak-evenchartisthatitisbasedonnumberofassumptionswhichmaynotholdtrueintheactualpractice.Fixedcostalsoincreasesbeyondaspecificlevelofactivity.Ifthelawofdiminishingreturnsisapplicableinthebusiness,theassumptionthatvariablecostsdovaryproportionallyshallnotproveeffective.Atthesametime,salesrevenueincreasesproportionallywithvolumeofsalesisnotpossiblealways.
(ii) Itcommunicatesalimitedamountofinformation.Thestudyofeffectofchangeinfixedcosts,variablecostsandsellingpricerequiresdrawingofnumberofcharts.
(iii)Asinglebreak-evenchart fails toexplaineffectofvariousproductmixesintheprofits.
(iv) It fails to take into consideration the important factors like plantcapacity,productiontechnologyandmethodologyandcapitalemployedwhichareveryimportantformanagerialdecisions.
(v) Itignoresthetimegapbetweenproductionandsales.Thesalesmayvarybecauseofvariousuncontrollableexternalfactorswhichreducesthesignificanceofthebreak-evenchartasamanagementguide.
10.2.3 Margin of Safety
Theamountbywhichthecurrentvolumeofsalesexceedsthebreak-evensalesvolume,eitherinunitsorrupeesrepresentsmarginofsafety.Thisisthedifferencebetweenthetotalsalesofafirmandtheamountofsalesatbreak-evenpoint.Itindicatestheextenttowhichsalesmaydecreasebeforethecompanysuffersaloss.Amarginofsafetyiscalculatedasfollows:
M/S=SA – SB
where M/S=Marginofsafety SA =Actualvolumeofsales SB=Break-evenvolumeofsalesMarginofsafetymaybeexpressedasapercentagebasedeitheronunits
orrupeevalue.Forthispurpose,thefollowingformulasareused:
1.M/S(inrupees)=
2.M/S(inunits)=
Break-Even Analysis/Point (BEA/BEP)
NOTES
Self-Instructional 258 Material
Ahighmarginofsafetyis thesignofprosperityofthebusiness.Alowmarginwouldindicatehighfixedcost.Suchacriticalsituationcallsfor: (i) Increaseinsellingprice; (ii)Decreaseinvariablecosts; (iii)Replacementofexistingproductlinebyamoreprofitableline;
and (iv) Increaseinvolumeofproduction.Illustration 10.5: Computemargin of safety of SubaLimited from theinformationgivenbelow:
Sellingprice=` 8 per unit Variablecost=` 5 per unit Fixedcost=`45,000 Sales(current)=25,000unitsp.a.
Solution (i)M/S(inrupees)=SA–SB = `2,00,000–`1,20,000=`80,000 (ii)M/S(inunits) =25,000units–15,000units=10,000units
OR (iii)M/S(inrupees)=
(iv)M/S(inunits) =
Working:
I.Marginalcoststatement Output:25,000units
Particulars Amount Per Unit (`)
Total (`)
Sales 8 2,00,000Less: Marginalcost 5 1,25,000Contribution 3 75,000Less: Fixedcost – 45,000Profit 30,000
NOTES
Self-InstructionalMaterial 259
Break-Even Analysis/Point (BEA/BEP)
II.CalculationofP/Vratio
III.Calculationofbreak-evenpoint
10.2.4 Angle of Incidence
Inbreak-evenchart,wheresaleslineintersectsthetotalcostlinethatangleisknownasangleof incidence.Frommanagerialpoint, a largeangleofincidencewouldmeanhighrateofprofit.Anarrowanglerevealshighvariablecostthatresultsinlowprofits.Managementalwaysaimstomaintainaslargeanangleaspossible.Businessexpertssuggesttostudytogethermarginofsafetyandangleofincidenceforexaminingworthofacompany.
10.2.5 Profit-Volume Graph
Aprofit-volumegraphexhibitstherelationshipofprofittovolumeofsales.Thisgraphisasimplerpresentationofthefactsillustratedinthebreak-evenchart.However,itfailstoshowhowcostvarywiththechangeinthelevelofactivity.Constructionofprofitgraph(seeFigure10.8)isrelativelyeasyandtheprocedureinvolves: (i)SelectingascaleforsalesontheX-axis. (ii)SelectingascaleforprofitorlossandfixedcostsontheY-axis. (iii)Dividingthegraphintotwoareas.Onearearevealsprofitandtheother
loss.Theseareasasformedbythesaleslinewhichdividesthegraphhorizontally.
(iv)Ontheverticalaxis,theareabelowthesaleslinerepresentsfixedcostsandthataboveitrepresentsprofit.
(v)Pointsareplottedfortherequiredfixedcostsandforprofitsandalineisdrawntoconnectthetwopoints.
Illustration 10.6: Acompanyproduces200unitsandsellsthemat 10eachunit.Themarginalcostofproductionis`6eachandtotalfixedcostoftheconcern is `400perannum.Constructaprofitgraph(Figure10.8).
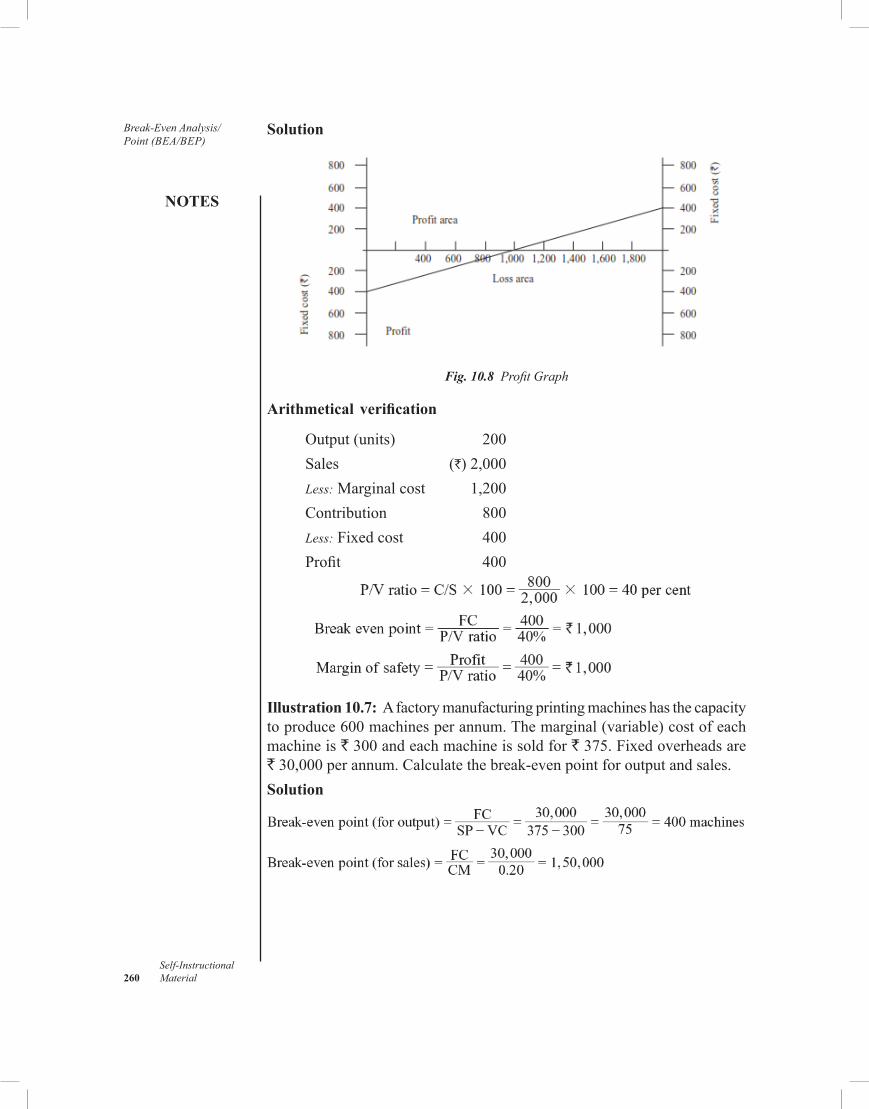
Break-Even Analysis/Point (BEA/BEP)
NOTES
Self-Instructional 260 Material
Solution
Fig. 10.8 Profit Graph
Arithmetical verification
Output(units) 200Sales (`)2,000Less:Marginalcost 1,200Contribution 800Less:Fixedcost 400Profit 400
Illustration 10.7: Afactorymanufacturingprintingmachineshasthecapacitytoproduce600machinesperannum.Themarginal(variable)costofeachmachineis`300andeachmachineissoldfor`375.Fixedoverheadsare`30,000perannum.Calculatethebreak-evenpointforoutputandsales.Solution
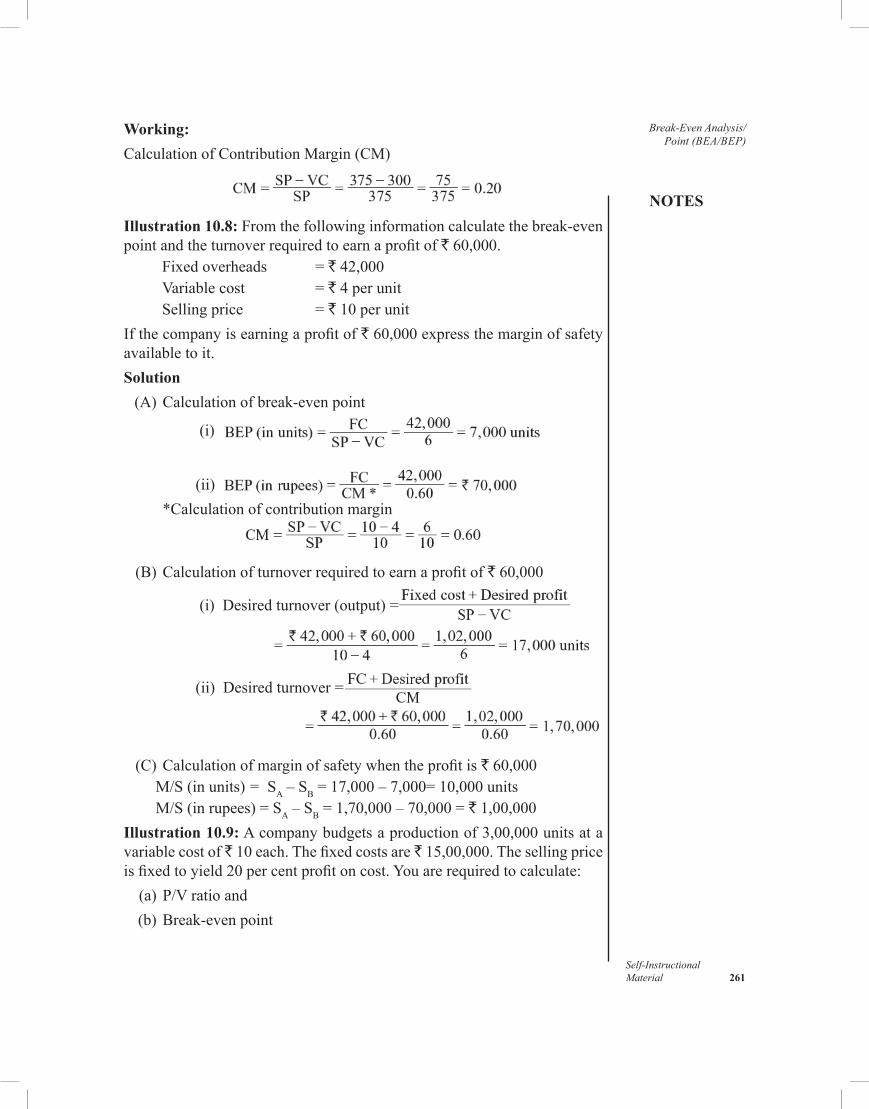
NOTES
Self-InstructionalMaterial 261
Break-Even Analysis/Point (BEA/BEP)
Working:CalculationofContributionMargin(CM)
Illustration 10.8: Fromthefollowinginformationcalculatethebreak-evenpointandtheturnoverrequiredtoearnaprofitof`60,000.
Fixedoverheads =`42,000Variablecost =` 4 per unitSellingprice =` 10 per unit
Ifthecompanyisearningaprofitof`60,000expressthemarginofsafetyavailabletoit.Solution (A)Calculationofbreak-evenpoint
(i)
(ii) *Calculationofcontributionmargin
(B)Calculationofturnoverrequiredtoearnaprofitof`60,000
(i) Desiredturnover(output)=
(ii) Desiredturnover=
(C)Calculationofmarginofsafetywhentheprofitis`60,000 M/S(inunits)= SA – SB=17,000–7,000=10,000units M/S(inrupees)=SA – SB=1,70,000–70,000=`1,00,000Illustration 10.9:Acompanybudgetsaproductionof3,00,000unitsatavariablecostof`10each.Thefixedcostsare`15,00,000.Thesellingpriceisfixedtoyield20percentprofitoncost.Youarerequiredtocalculate: (a)P/Vratioand (b)Break-evenpoint
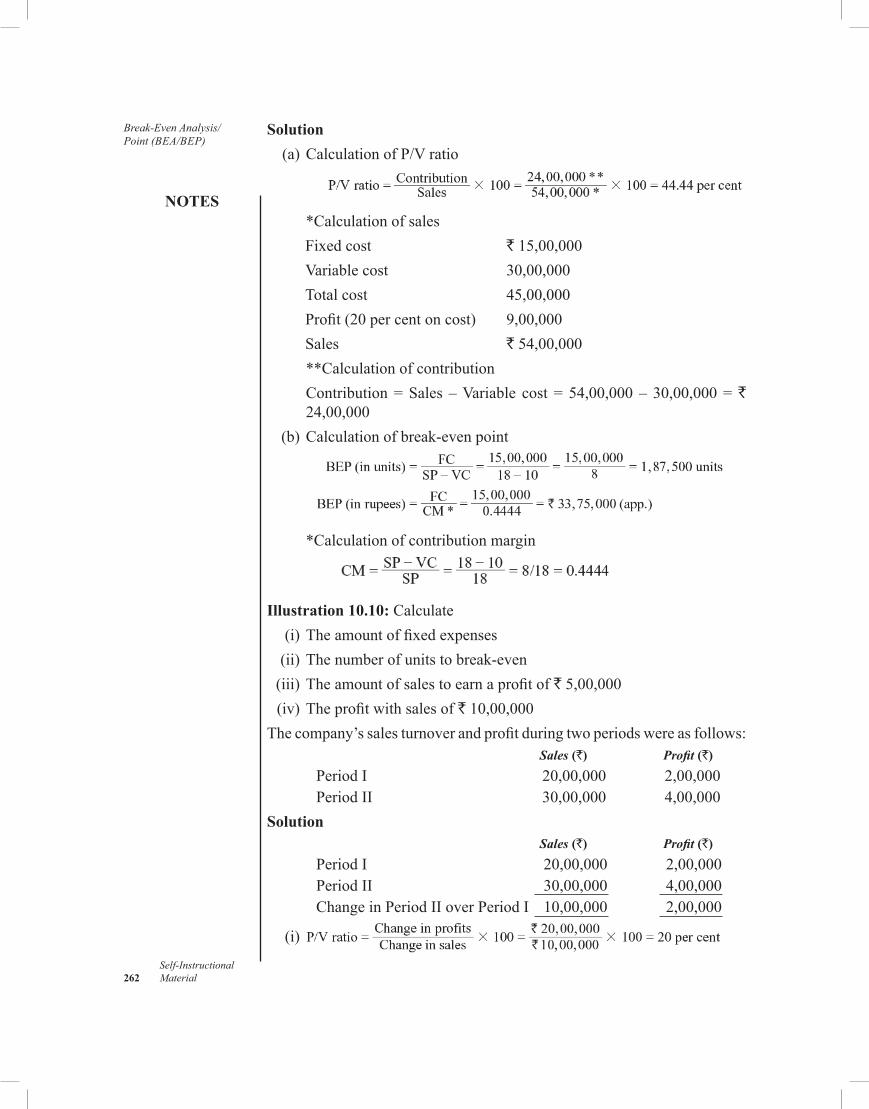
Break-Even Analysis/Point (BEA/BEP)
NOTES
Self-Instructional 262 Material
Solution (a)CalculationofP/Vratio
*CalculationofsalesFixedcost `15,00,000Variablecost 30,00,000Totalcost 45,00,000Profit(20percentoncost) 9,00,000Sales `54,00,000
**Calculationofcontribution Contribution=Sales –Variable cost= 54,00,000– 30,00,000=`
24,00,000 (b)Calculationofbreak-evenpoint
*Calculationofcontributionmargin
Illustration 10.10: Calculate (i)Theamountoffixedexpenses (ii)Thenumberofunitstobreak-even (iii)Theamountofsalestoearnaprofitof`5,00,000 (iv)Theprofitwithsalesof`10,00,000Thecompany’ssalesturnoverandprofitduringtwoperiodswereasfollows: Sales (`) Profit (`)
PeriodI 20,00,000 2,00,000 PeriodII 30,00,000 4,00,000Solution Sales (`) Profit (`)
PeriodI 20,00,000 2,00,000 PeriodII 30,00,000 4,00,000 ChangeinPeriodIIoverPeriodI 10,00,000 2,00,000
(i)
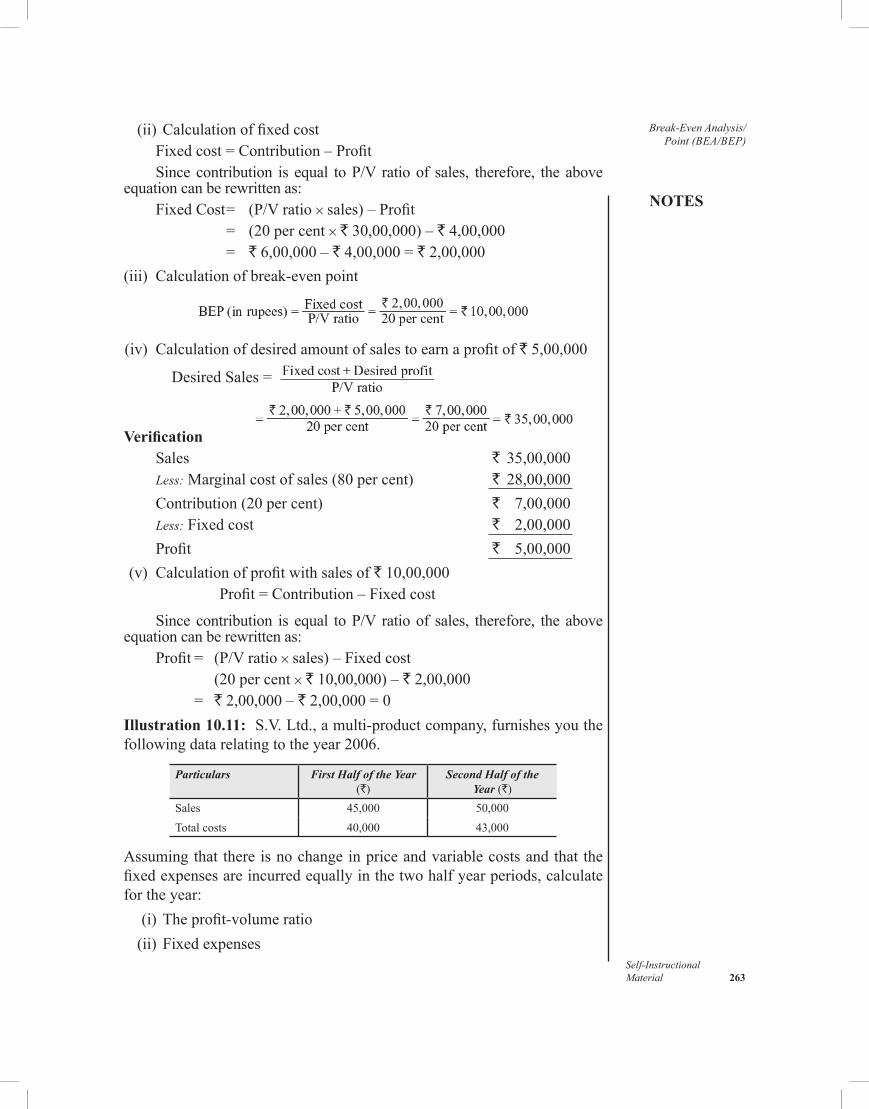
NOTES
Self-InstructionalMaterial 263
Break-Even Analysis/Point (BEA/BEP)
(ii)Calculationoffixedcost Fixedcost=Contribution–Profit Sincecontribution is equal toP/V ratioof sales, therefore, theaboveequationcanberewrittenas: FixedCost= (P/Vratio×sales)–Profit = (20 per cent × `30,00,000)–`4,00,000 = `6,00,000–`4,00,000=`2,00,000(iii) Calculationofbreak-evenpoint
(iv) Calculationofdesiredamountofsalestoearnaprofitof`5,00,000
DesiredSales=
Verification Sales ` 35,00,000 Less:Marginalcostofsales(80percent) ` 28,00,000 Contribution(20percent) ` 7,00,000 Less:Fixedcost ` 2,00,000 Profit ` 5,00,000(v) Calculationofprofitwithsalesof`10,00,000
Profit=Contribution–Fixedcost
Sincecontribution is equal toP/V ratioof sales, therefore, theaboveequationcanberewrittenas: Profit= (P/Vratio×sales)–Fixedcost (20 per cent × `10,00,000)–`2,00,000 = `2,00,000–`2,00,000=0Illustration 10.11: S.V.Ltd.,amulti-productcompany,furnishesyouthefollowingdatarelatingtotheyear2006.
Particulars First Half of the Year (`)
Second Half of the Year (`)
Sales 45,000 50,000Totalcosts 40,000 43,000
Assumingthatthereisnochangeinpriceandvariablecostsandthatthefixedexpensesareincurredequallyinthetwohalfyearperiods,calculatefortheyear: (i)Theprofit-volumeratio (ii)Fixedexpenses
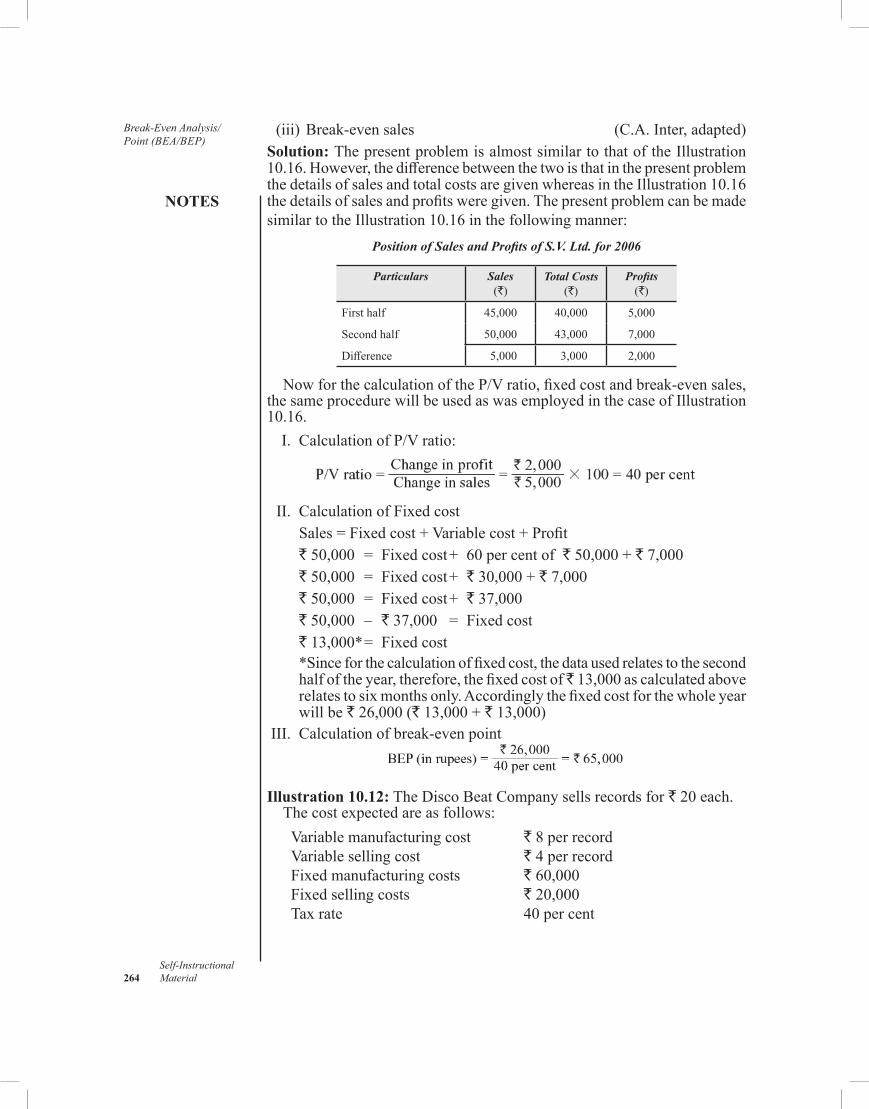
Break-Even Analysis/Point (BEA/BEP)
NOTES
Self-Instructional 264 Material
(iii)Break-evensales (C.A.Inter,adapted)Solution: ThepresentproblemisalmostsimilartothatoftheIllustration10.16.However,thedifferencebetweenthetwoisthatinthepresentproblemthedetailsofsalesandtotalcostsaregivenwhereasintheIllustration10.16thedetailsofsalesandprofitsweregiven.ThepresentproblemcanbemadesimilartotheIllustration10.16inthefollowingmanner:
Position of Sales and Profits of S.V. Ltd. for 2006
Particulars Sales (`)
Total Costs (`)
Profits (`)
Firsthalf 45,000 40,000 5,000
Secondhalf 50,000 43,000 7,000
Difference 5,000 3,000 2,000
NowforthecalculationoftheP/Vratio,fixedcostandbreak-evensales,thesameprocedurewillbeusedaswasemployedinthecaseofIllustration10.16. I. CalculationofP/Vratio:
II. CalculationofFixedcost
Sales=Fixedcost+Variablecost+Profit`50,000 = Fixedcost+ 60percentof`50,000+`7,000`50,000 = Fixedcost+ `30,000+`7,000`50,000 = Fixedcost+ `37,000`50,000 – `37,000 = Fixedcost`13,000*= Fixedcost*Sinceforthecalculationoffixedcost,thedatausedrelatestothesecondhalfoftheyear,therefore,thefixedcostof 13,000ascalculatedaboverelatestosixmonthsonly.Accordinglythefixedcostforthewholeyearwillbe`26,000(`13,000+`13,000)
III. Calculationofbreak-evenpoint
Illustration 10.12:TheDiscoBeatCompanysellsrecordsfor`20each.Thecostexpectedareasfollows:Variablemanufacturingcost ` 8 per recordVariablesellingcost ` 4 per recordFixedmanufacturingcosts `60,000Fixedsellingcosts `20,000Taxrate 40percent
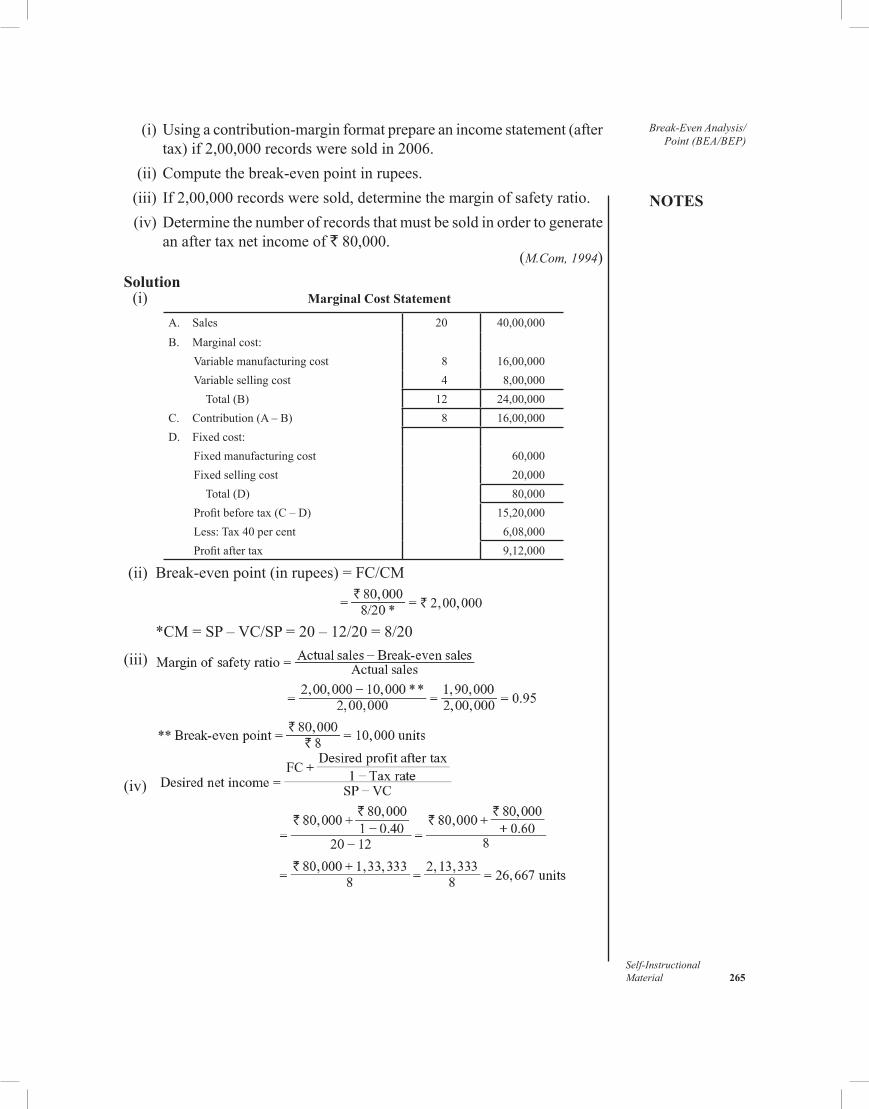
NOTES
Self-InstructionalMaterial 265
Break-Even Analysis/Point (BEA/BEP)
(i)Usingacontribution-marginformatprepareanincomestatement(aftertax)if2,00,000recordsweresoldin2006.
(ii)Computethebreak-evenpointinrupees. (iii) If2,00,000recordsweresold,determinethemarginofsafetyratio. (iv)Determinethenumberofrecordsthatmustbesoldinordertogenerate
anaftertaxnetincomeof`80,000. (M.Com, 1994)Solution (i) Marginal Cost Statement
A. Sales 20 40,00,000B. Marginalcost:
Variablemanufacturingcost 8 16,00,000Variablesellingcost 4 8,00,000Total(B) 12 24,00,000
C. Contribution(A–B) 8 16,00,000D. Fixedcost:
Fixedmanufacturingcost 60,000Fixedsellingcost 20,000Total(D) 80,000
Profitbeforetax(C–D) 15,20,000Less:Tax40percent 6,08,000Profitaftertax 9,12,000
(ii) Break-evenpoint(inrupees)=FC/CM
*CM=SP–VC/SP=20–12/20=8/20
(iii)
(iv)
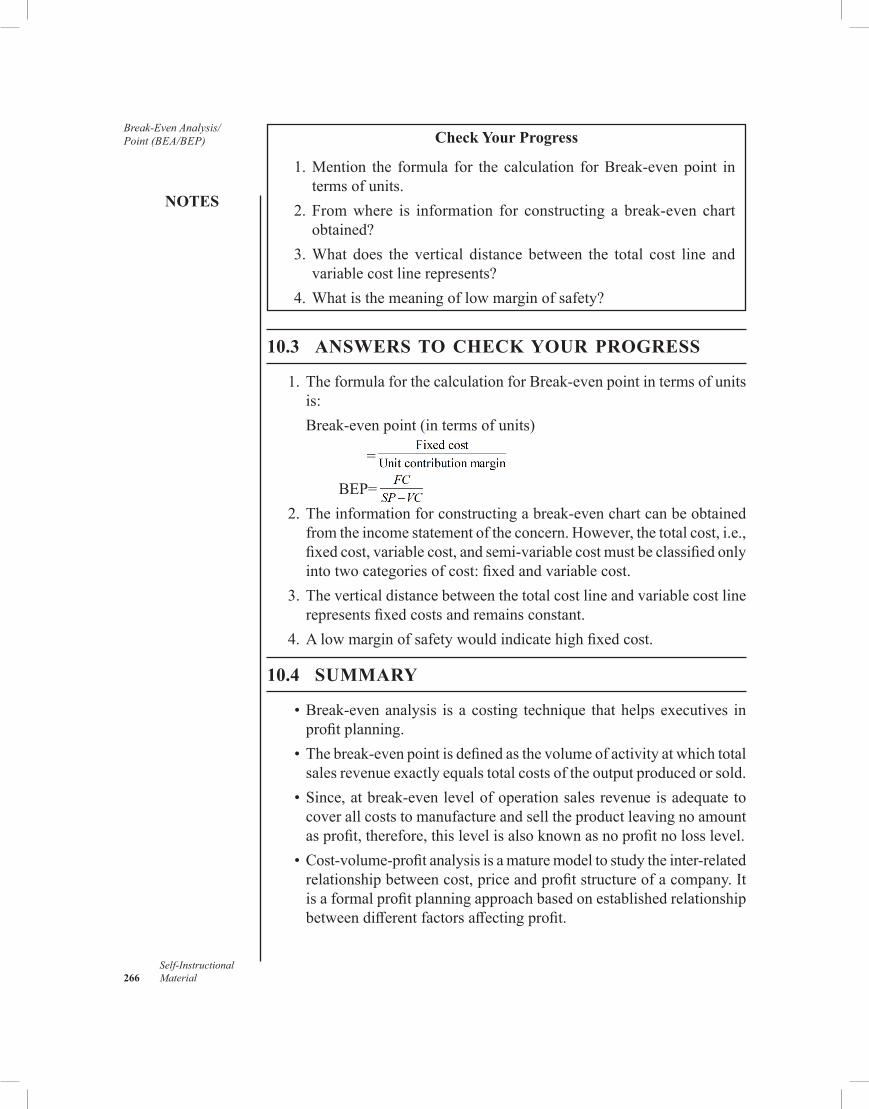
Break-Even Analysis/Point (BEA/BEP)
NOTES
Self-Instructional 266 Material
Check Your Progress
1.Mention the formula for the calculation forBreak-evenpoint interms of units.
2.Fromwhere is information for constructing a break-even chartobtained?
3.What does the vertical distance between the total cost line andvariablecostlinerepresents?
4.Whatisthemeaningoflowmarginofsafety?
10.3 ANSWERS TO CHECK YOUR PROGRESS
1.TheformulaforthecalculationforBreak-evenpointintermsofunitsis:
Break-evenpoint(intermsofunits)
=
BEP= 2.Theinformationforconstructingabreak-evenchartcanbeobtained
fromtheincomestatementoftheconcern.However,thetotalcost,i.e.,fixedcost,variablecost,andsemi-variablecostmustbeclassifiedonlyintotwocategoriesofcost:fixedandvariablecost.
3.Theverticaldistancebetweenthetotalcostlineandvariablecostlinerepresentsfixedcostsandremainsconstant.
4.Alowmarginofsafetywouldindicatehighfixedcost.
10.4 SUMMARY
•Break-evenanalysis is acosting technique thathelpsexecutives inprofitplanning.
•Thebreak-evenpointisdefinedasthevolumeofactivityatwhichtotalsalesrevenueexactlyequalstotalcostsoftheoutputproducedorsold.
•Since,atbreak-evenlevelofoperationsalesrevenueisadequatetocoverallcoststomanufactureandselltheproductleavingnoamountasprofit,therefore,thislevelisalsoknownasnoprofitnolosslevel.
•Cost-volume-profitanalysisisamaturemodeltostudytheinter-relatedrelationshipbetweencost,priceandprofitstructureofacompany.Itisaformalprofitplanningapproachbasedonestablishedrelationshipbetweendifferentfactorsaffectingprofit.
NOTES
Self-InstructionalMaterial 267
Break-Even Analysis/Point (BEA/BEP)
•Thebreak-evenanalysiscanalsobedemonstratedgraphically,whichiscommonlyknownasbreak-evenchart.
•Abreak-evenchartisagraphicapproachtothestudyoftherelationshipofcost,revenueandprofit.
•Fixedcostsarethecostswhichremainfixedforallpracticallypurposestoacertainlevelofactivity.
•Variablecostsvaryinproportiontooutput. •Semi-variablecostspossesthecharacteristicsofbothfixedandvariable
costs. •Theamountbywhichthecurrentvolumeofsalesexceedsthebreak-
evensalesvolume,eitherinunitsorrupeesrepresentsmarginofsafety.Marginofsafetymaybeexpressedasapercentagebasedeitheronunitsorrupeevalue.
• Inbreak-evenchart,wheresaleslineintersectsthetotalcostlinethatangleisknownasangleofincidence.Frommanagerialpoint,alargeangleof incidencewouldmeanhigh rateofprofit.Anarrowanglerevealshighvariablecostthatresultsinlowprofit.
•Aprofit-volumegraphexhibitstherelationshipofprofittovolumeofsales.Thisgraphisasimplerpresentationofthefactsillustratedinthebreak-evenchart.
10.5 KEY WORDS
• Break even point:Itisdefinedasthevolumeofactivityatwhichtotalsalesrevenueexactlyequalstotalcostsoftheoutputproducedorsold.
• Cost volume profit analysis:Itisaplanningtoolwhichanalysestheinherentrelationshipbetweenprice,coststructure,volumeandprofit.
• Margin of safety:Itistheamountbywhichthecurrentvolumeofsalesexceedsthebreak-evensalesvolume,eitherinunitsorrupees.
• Angle of incidence:Itistheanglewheresaleslineintersectsthetotalcostline.
10.6 SELF ASSESSMENT QUESTIONS AND EXERCISES
Short-Answer Questions
1.Definetheconceptofcost-volumeprofitanalysis. 2.ExplainthetermMarginofsafety.Howithelpsmanagersindecision
making? 3.CalculatetheBEPinthefollowingcases:
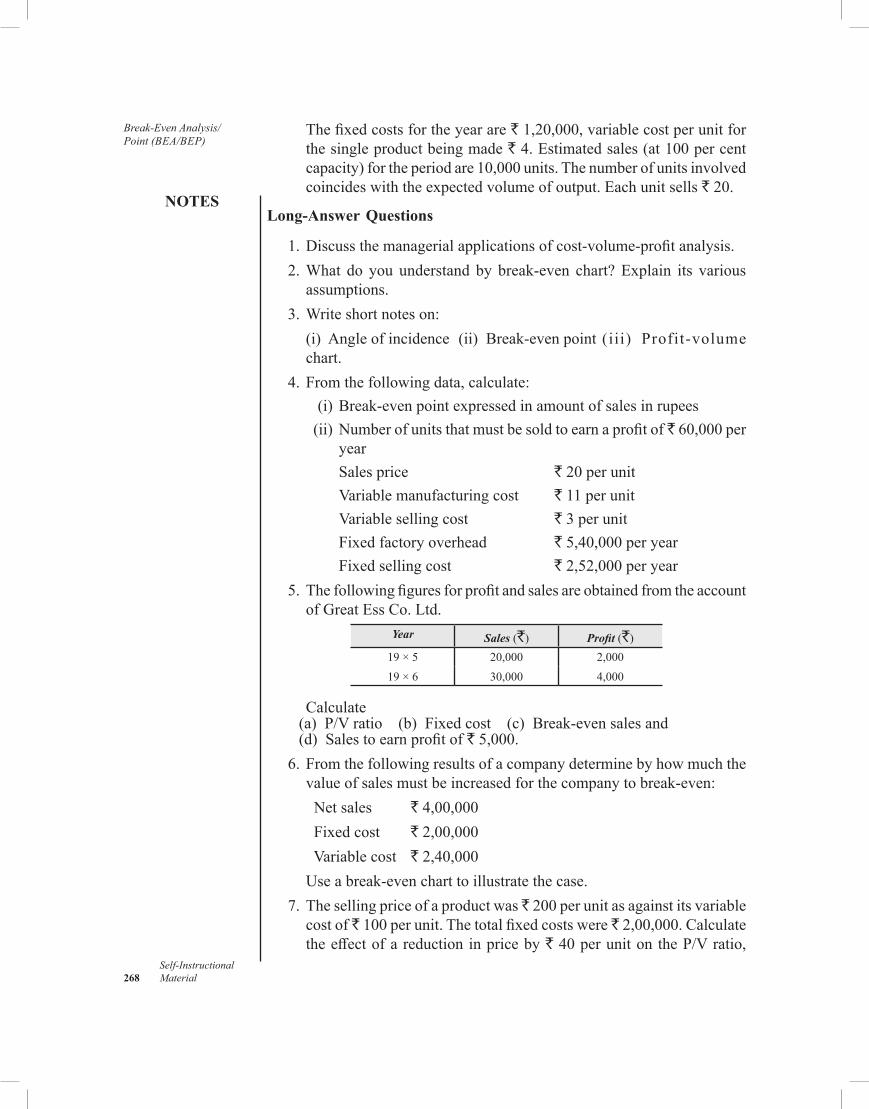
Break-Even Analysis/Point (BEA/BEP)
NOTES
Self-Instructional 268 Material
Thefixedcostsfortheyearare`1,20,000,variablecostperunitforthesingleproductbeingmade`4.Estimatedsales(at100percentcapacity)fortheperiodare10,000units.Thenumberofunitsinvolvedcoincideswiththeexpectedvolumeofoutput.Eachunitsells` 20.
Long-Answer Questions
1.Discussthemanagerialapplicationsofcost-volume-profitanalysis. 2.What do youunderstandby break-even chart?Explain its various
assumptions. 3.Writeshortnoteson: (i) Angleofincidence (ii) Break-evenpoint(iii) Profit-volume
chart. 4.Fromthefollowingdata,calculate: (i)Break-evenpointexpressedinamountofsalesinrupees (ii)Numberofunitsthatmustbesoldtoearnaprofitof`60,000per
year Salesprice ` 20 per unit Variablemanufacturingcost ` 11 per unit Variablesellingcost ` 3 per unit Fixedfactoryoverhead `5,40,000peryear Fixedsellingcost `2,52,000peryear 5.Thefollowingfiguresforprofitandsalesareobtainedfromtheaccount
ofGreatEssCo.Ltd.Year Sales (`) Profit (`)
19 × 5 20,000 2,00019 × 6 30,000 4,000
Calculate (a) P/Vratio (b) Fixedcost (c) Break-evensalesand
(d) Salestoearnprofitof`5,000. 6.Fromthefollowingresultsofacompanydeterminebyhowmuchthe
valueofsalesmustbeincreasedforthecompanytobreak-even: Netsales `4,00,000 Fixedcost `2,00,000 Variablecost `2,40,000 Useabreak-evencharttoillustratethecase. 7.Thesellingpriceofaproductwas 200perunitasagainstitsvariable
cost of `100perunit.Thetotalfixedcostswere`2,00,000.Calculatetheeffectofareductioninpriceby`40perunitontheP/Vratio,
NOTES
Self-InstructionalMaterial 269
Break-Even Analysis/Point (BEA/BEP)
break-evenpointandmarginofsafetyif4,000unitswereproducedandsold.
8.Thefollowingdatarelatetoacompanyfortheyearended31December,1988.
Unitsproduced =20,000 Fixedoverheads =`50,000 Variablecostperunit =` 6 Sellingpriceperunit =` 10 PrepareaP/Vgraph.
10.7 FURTHER READINGS
Sahaf,M.A.2010.Management Accounting: Principles and Practice,3rdedition.NewDelhi:VikasPublishingHouse.
Arora,M.N.2012.A textbook of Cost and Management Accounting,10thedition.NewDelhi:VikasPublishingHouse.
Maheshwari,S.N.,SuneelK.andSharadK.2018.A Textbook of Accounting for Management,4thedition.NewDelhi:VikasPublishingHouse.
Differential Costing
NOTES
Self-Instructional 270 Material
UNIT 11 DIFFERENTIAL COSTINGStructure 11.0 Introduction 11.1 Objectives 11.2 NatureandScopeofDifferentialCosting 11.3 DecisionMakingProcess 11.4 ApplicationofDifferentialCosting 11.5 AnswerstoCheckYourProgress 11.6 Summary 11.7 Key Words 11.8 SelfAssessmentQuestionsandExercises 11.9 FurtherReadings
11.0 INTRODUCTION
Whilestudyingtheunitonmarginalcosting,onerealizeshowimportantitisforthedecisionmakerstosplittotalcostsintofixedandvariablecostsinordertodecideaboutadditionaloutput.However,suchanapproachfailstobringfruitfulresultswhenafirmisconfrontedwithanalternativechoicedecisionwhichinvolvesevaluationoftwoormorealternativesinordertomakeafinalchoice.Tomeetthedemandsofsuchadecisionfirmsneedcostdataoncompetingalternativeswhicharegenerallynotreadilyavailablefromtheiraccountingrecords,andtherefore,callforanattemptonthepartofthefirmtoestimatecostsofcompetingalternativecoursesofaction.Infact,afirm’sattempttoestimatecostsofalternatecoursesofactionthatwouldhelpittochooseamongthecompetingalternativescallsfortheapplicationofdifferentialcostingwhichstudiestheeffectsofalternativedecisionsontotalcosts.However,theapplicationofdifferentialcostingasanaidtodecisionmakingdemandsaclearunderstandingoftheconceptofrelevantcostandthedecisionmakingprocessonthepartofuser.Accordinglyinthischapteranattemptismadetodiscussthenatureandscopeofdifferentialcostingwhichwillbefollowedbyadiscussiononrelevantcostanddecisionmakingprocess.
11.1 OBJECTIVES
Aftergoingthroughthisunit,youwillbeableto: •Explainthenatureandscopeofdifferentialcosting •Describethedecisionmakingprocess •Discussthemanagerialapplicationsofdifferentialcosting
NOTES
Self-InstructionalMaterial 271
Differential Costing11.2 NATURE AND SCOPE OF DIFFERENTIAL
COSTING
Differential costing is a costing technique that examines the effects ofalternativecoursesofactionontotalcosts.Whilecommentingonthenatureand scope of differential costing theChartered Institute ofManagementAccountants,1991,Londonstatesthatitisatechniqueusedinthepreparationofadhocinformationinwhichonlycostandincomedifferencesbetweenalternativecoursesofactionare taken intoconsideration.Suchacostingtechnique focuses on the study of differential costswhich refers to theamountofchangeincostsresultingfromtheselectionofonealternativetotheother.Thus,differentialcostingstudiestheeffectsofalternativedecisionsontotalcosts.Theamountofexpectedchangefromanalternativechoicedecisionmightresulteitherinanincreaseordecreaseinthetotalcosts.Fromthisapparentlyonegetstheimpressionthatadifferentialcostcantaketheformofincrementalordecrementalcostwhichultimatelywillbecoveredby incremental costing and decremental costing, respectively.However,suchaclassificationisjustsuperficialasthescholarsgenerallyusethetermincrementalcostingfordifferentialcosting.
Differential Costing vs. Marginal Costing
Sincedifferentialcostingstudiescostdifferencesbetweenalternativecoursesofaction,therefore,apparentlyitmaysoundsimilartomarginalcosting.Butintherealsense,itisnotsoasdifferentialcostingaimstostudytheimpactof alternative courses of actions on the costswhereasmarginal costingexamines the relationshipbetweencostandvolume.Further, theconceptofdifferentialcostingisbasedontotalcostwhichisnottrueofmarginalcostingthatconsidersonlydirect/variablecostsandignoresfixedcostinitsapplication.Although,boththetechniqueshelpfirmsincostanalysisandcostpresentationyettheyhavelargedistinctiveanduncommonareasofstudyandapplication.Someofthedifferencesaresummarizedbelow: •Differentialcostingisperspectiveinnaturewhereasmarginalcosting
isgenerallyhistoricalinnature. •For differential costing, the firms can use either traditional, i.e.,
absorptionorcontributionapproachforthepresentationofdatafordecisionmakers;marginalcostingadvocatescontributionapproachforthispurpose.
•Undermarginalcosting,costperunitdoesnotchangedespitethechangeintherangeofproduction.Butthatisnotalwaystrueofdifferentialcostingwherethecostperunitmaychangewithachangeinrangeofproduction.
Differential Costing
NOTES
Self-Instructional 272 Material
•Thesetoftoolsusedindifferentialcostingforperformanceevaluationisdifferentfromthatrecommendedbymarginalcosting.
•Differentialcostingisapplicabletoanadditionalvolumeofproductionwhereasmarginalcostingisusedforadditionalunits.
Relevant Costs
Oneoftheessentialfeaturesofdifferentialcostingisthatitconsidersonlyrelevantcostsinitsapplicationandthusignoreshistoricalcosts.Thetermrelevantcostsasusedindifferentialcostingrefertothecoststhatarepertinenttothedecisionwhichisundertheconsiderationofadecision-maker.Infact,suchcostshaveimpactonadecisionmaker’sintendedoutcome.CommentingonthenatureofrelevantcostCharteredInstituteofManagementAccountants,1991,Londonstatesthatrelevantcostsaresaidtobecostsappropriatetoaidingthemakingofspecificmanagementdecisions.Thusrelevantcostrepresentstheamountofdifferenceintermsofcostbetweenseveralalternativecoursesofactionthatareunderconsiderationofadecision–maker.Suchacostcanbedeterminedonlyinthecontextofaparticulardecision.Forexample,ifanalternative‘A’costsafirm 50,00,000and‘B’costs 60,00,000,theamount`10,00,000whichisthedifferencebetweenalternativesAandB,willbetherelevantcostforthefirm.Thisexamplebringstolightanimportantfactthatarelevantcostneedstobeacashcostandnotanon-cashcostlikeadepreciationwhichwouldnotresultinanykindofdifferentialcost.Infact,acosttoberelevantforthepurposeofdifferentialcostinghasnotonlytobeassociatedwithafirm’sdecisionbutalsoacashcost.Sincerelevantcostsrepresentfuturecoststhatdifferacrossalternatives,suchcostspossessthefollowingtwofeatures: •Future-oriented—Relevantcostsarefuturecostsandnottheonesthat
havealreadybeenincurred;and •Differbetweenalternatives—Relevantcostsareboundtochangeas
a resultofalternativecourseofaction.Thus, thecosts that remainconstantbetweendifferentalternativesdonotfallwithinthescopeofrelevantcosts.
Theanalysisoftheabovefeaturesofrelevantcostsbringsoutclearlythefactthatsuchcostsarebasicallydifferentialcosts—theamountofchangeincostthatafirmexpectsfromacourseofactionascomparedwithanalternative.However,onehas to remember that sunkcostsarenotconsidered in theanalysisofrelevantcosts.
11.3 DECISION MAKING PROCESS
Decisionmakingbeingoneofthebasicfunctionsofamanagertakesplaceateverylevelintheorganization.Sinceamanagementaccountantisresponsibleforgeneratingrelevantandrequisiteinformationforuseindecisionmaking,
NOTES
Self-InstructionalMaterial 273
Differential Costingtherefore,heneedstopossesstheunderstandingofthenatureandprocessofdecisionmaking.Decisionmakingistheprocessofmakingchoicesbetweenalternativecoursesofaction.Toensurearightchoice,adecisionmakerhastofollowasystematicapproachindecisionmakingwhichconsistsofthefollowingsteps: • Identificationandanalysisoftheproblem; • Identificationofalternatives; •Evaluationofalternatives; •Selectionofanalternative; •Detailedplanforcarryingoutofthealternative;and •Evaluationandcontrol.
Identification and Analysis of the Problem
Every rational decisionmakingprocess beginswith the identification ofthe problem.The identificationof a problemprovides a decisionmakeran opportunity towork for the solution of the problem.However,mereidentificationoftheproblemwillnothelpadecisionmakertofindasolutionfortheproblem.Everyproblemcallsforanin-depthstudyasgenerallytheproblemsarecharacterizedby‘ice-berg’principlewherealittleportionisvisibleandthemajorportionishiddenaboutwhichthedecisionmakerhasnoclue.Therefore,adecisionmakerhastomakealleffortstoidentifyandexamineevery issue involved in theproblembeforemakinganyattempttofindalogicalsolutionfortheproblem.Infact,suchanattemptcallsforproblemauditwhichwill help a decisionmaker not only to identify thepossiblecausesoftheproblembutalsoformulatetheobjectivestobemetinsolvingtheproblem.
Identification of Alternatives
The analysis of the problem is followedby the identificationof feasiblealternativesthatmayserveaspotentialsolutionstoaproblem.Thisstepofdecisionmakingcallsforapredictionwhich,infact,isitselfadecisionabouthowtomakedecision.However,adecisionmakerhastorememberthatbestpossiblesolutionsdonotautomaticallysubmitthemselvestothedecisionmakingprocess,hehastoformulateavarietyofwaysofdevisingalternatives.Althoughanumberoftoolsandtechniqueslikelateralthinking,diggingaholeelsewhere,andmorphologicalapproachhavebeendevelopedovertheyeartohelpdecisionmakersinthisregardyetsuchanattemptcallsforalotofeffortonthepartofdecisionmakersintermsofcontinuousresearchandthinking.Inthepastthisactivitywaspurelybasedonamanager’sintuition,however,atpresent,manymanagersprefertousedecisionsupportsystemforthispurpose.
Differential Costing
NOTES
Self-Instructional 274 Material
Evaluation of Alternatives
Inthisstepofdecisionmaking,amanagementaccountanthasatremendousrole toplaybyprovidingadequate information to thedecisionmakeronthe economic andfinancialworth of the alternatives that is essential forevaluation.Todischargethisfunctioneffectively,amanagementaccountantneedstopossessknowledgeaboutanumberoftoolsandtechniqueslikeprofitplanning,capitalbudgeting,risktechniques,linearprogramming,decisiontreeandforecastingtechniques.
Selection of an Alternative
Thecentraltaskofdecisionmakingisthechoicefromamongalternatives.Tochoosethebestalternative,adecision-makerneedstodevisetheselectioncriteriawhichmaynotbeeasy.Generally,thechoiceofthebestalternativeissimplyaccomplishedbyselecting thealternativewhichbestmeets thechosencriterion.Logically,adecisionmakerwouldprefertochoosethebestalternativebutpracticallyspeakingitisdifficulttodefinethe‘best’asdifferentcriteriawouldresultindifferentdecisionsfromthesamesetofalternatives.Although, for certaindecision situations,decisionmakers candevise theselectioncriteriathatwouldhelpthemtoidentifythebestalternativeyetsomedecisionsituationsaresocomplexthatdevisinganyselectioncriteriaforthemispracticallyimpossible.However,adecision-makerhastotakeanumberoffactorsincludingtheoneslikeresources,competenceandexperienceofthecompanythathavegreaterimpactonthechoiceofthealternative.
Detailed Plan for Carrying out of the Alternative
Oncetheselectionofthealternativeismade,adecision-makerhastocarryout the same.Sucha stepmaydemand the implementationofplansandprogrammes.
Evaluation and Control
After the plans and programmes have been implemented to attain thedesired outcome of the decision, a decisionmaker has to evaluate theactualperformancewithapurposetofindhowactualresultsreconcilewiththedesiredoutcomes.Thiswouldalsomeantodeviseandimplementthenecessarymeasuresiftheactualperformanceisnotintunewiththestandards.
Check Your Progress
1.Whichoutofthefollowingtwocosttechniquesisperspectiveinnature:differentialormarginalcosting?
2.Listthetoolsavailablewithmanagementaccountantsforevaluationofalternatives.
NOTES
Self-InstructionalMaterial 275
Differential Costing11.4 APPLICATION OF DIFFERENTIAL COSTING
Differentialcostinghastremendouspotentialasadecisionmakingtool.Itcanhelpafirminsuchdecisionsthatfallwithinthescopeoffollowingareasof business: •makeorbuy • acceptorrejectspecialorder • addordropproducts • sellorprocess • operateorshutdown • leaseorsell • expandorreduce • reduceormaintainpriceMake or BuyInahighlycompetitivemarket,oneofthemostperplexingproblemsthatamanufacturerfacesisarrivingatagoodmake-or-buydecision.Infact,itisnotuncommontofindthatfirmsneeddifferentcomponentsinthemanufacturingof products like automobiles, electronics and industrial products. Suchcomponentscanbemanufacturedwithinthefirmorcanbeprocuredfromthe suppliers. Such decisions have serious financial implication for thebusiness, therefore,managementhast todealwith this issuecarefully. Inthisregard,differentialcostinghelpsafirmbyascertainingtherelevantcostofboththeoptions—makeorbuy.However,suchanissuecropsuponlyonce thereexists someunutilizedcapacitywithin theexistingproductivecapacitywhichcanbeexploitedwithoutincurringanyinfrastructuralcost.Infact,differentialcostingcanhelpafirminbothsituations,i.e.,whenitisconsideringtomanufactureacomponentthatisbeingcurrentlyprocuredfromasupplierortoprocureacomponentfromthesuppliersthatisbeingcurrentlymanufactured.Illustration 11.1: Anautomobilemanufacturerisconsideringaproposaltoprocureacomponentfromthesupplierwhichiscurrentlybeingmanufacturedinternally.Thecompanyiscurrentlyoperatingat75%ofcapacityandnomajorincreaseinproductionisexpectedinthenearfuture.Thecostperunitofmanufacturingthecomponentisestimatedasfollows:
`
DirectMaterial 120Direct Labour 60Overhead(40%variable) 90TotalCostperunit 270
Differential Costing
NOTES
Self-Instructional 276 Material
Youarerequiredtoadvisethecompanywhethertobuythecomponentfromoutsideifthepartisavailableintheopenmarketfor` 250 per unit.Solution: Acursoryanalysisofmakeprice(`270)andbuyprice(`250)indicatesthatmakepriceismorethanbuypricetherefore,itisprofitableforthefirmtobuytheproduct.However,thisdecisionneedsacomparisonofbuycostwithavoidablecost(variablescostsonlyasfixedcostscannotbeavoidedintheshortrun).Therefore,buycostsofthecomponentwhichamounts to `250ismuchhigherincomparisontoavoidablecostof`216*thatcanbeavoided if thecompanydecides tostopmanufacturingof thecomponent under consideration.Thismean the componentwould cost` 304 (`250i.e.,buycost+`54i.e.,fixedcostswhichcannotbeavoidedintheshortrun)ifthecompanydecidedtostopmanufacturingcomponentinternallyandbuyexternally.Therefore,itisrecommendedthatthecompanymustmanufacturethecomponentinternally.*Calculationofavoidablecostsifcompanydecidestostopmanufacturingofthecomponent:
`
DirectMaterial 120Direct Labour 60Overhead(40%variable) 36TotalCostperunit 216
Accept or Reject Special Order
Itisnotuncommontofindthatfirmsgetopportunitiestoincreaseitssalesvolumeby receiving special orders for supply of such products that arewithinitsproductlines.However,suchordersgenerallydifferfromnormalmarketingpracticeastheycallforspecialdiscountsinprices.Suchadecisionisnotastraightforwarddecisionwhichcanbedecidedonthebasisofpricingthat thefirmchargeundernormalcircumstances.Infact,suchadecisioncallsfordifferentialanalysiswhichaimstocomparethedifferentialcostswithdifferentialrevenuebetweentheexistingvolumeofsalesandexpectedvolumeof sales if a special order is accepted. If the additional output,requiredtomeetthedemandsofspecialordercanbemanagedwithintheexistingproductioncapacityofthefirm,thedifferentialcostswouldincludeonlyvariablecostsoftheadditionaloutputotherwiseitwouldincludebothvariablecostaswellasfixedcostsoftheadditionaloutput.Thus,specialorderisgenerallyconsideredonthebasisofacomparisonbetweenthepriceofferedandexpecteddifferentialcostwhichisgenerallyequaltovariablecostintheshortperiod.Ifthepriceishigherthandifferentialcost,theorderisacceptedotherwiseitisrejected.
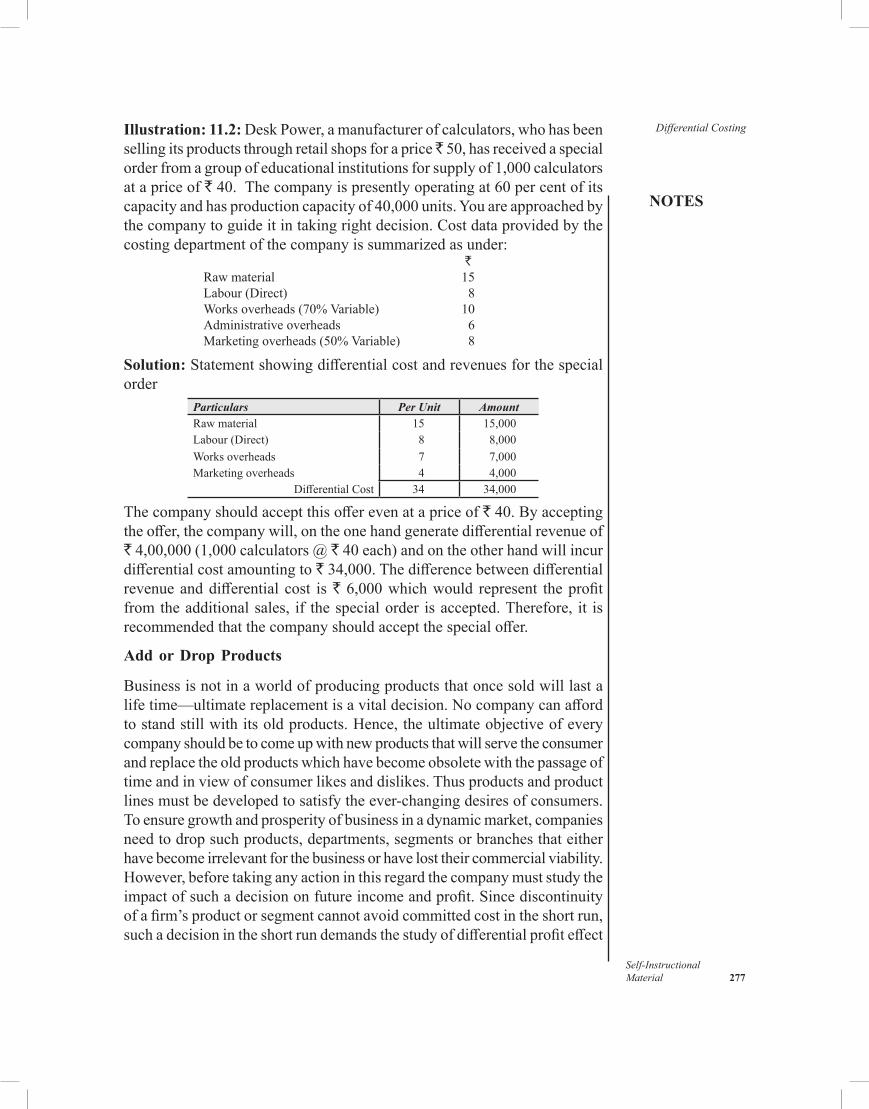
NOTES
Self-InstructionalMaterial 277
Differential CostingIllustration: 11.2: DeskPower,amanufacturerofcalculators,whohasbeensellingitsproductsthroughretailshopsforaprice 50,hasreceivedaspecialorderfromagroupofeducationalinstitutionsforsupplyof1,000calculatorsat a price of `40.Thecompanyispresentlyoperatingat60percentofitscapacityandhasproductioncapacityof40,000units.Youareapproachedbythecompanytoguideitintakingrightdecision.Costdataprovidedbythecostingdepartmentofthecompanyissummarizedasunder:
`Rawmaterial 15Labour(Direct) 8Worksoverheads(70%Variable) 10Administrativeoverheads 6Marketingoverheads(50%Variable) 8
Solution: Statementshowingdifferentialcostandrevenuesforthespecialorder
Particulars Per Unit AmountRawmaterial 15 15,000Labour(Direct) 8 8,000Worksoverheads 7 7,000Marketingoverheads 4 4,000
DifferentialCost 34 34,000
Thecompanyshouldacceptthisofferevenatapriceof`40.Byacceptingtheoffer,thecompanywill,ontheonehandgeneratedifferentialrevenueof`4,00,000(1,000calculators@`40each)andontheotherhandwillincurdifferentialcostamountingto`34,000.Thedifferencebetweendifferentialrevenueanddifferential cost is` 6,000whichwould represent theprofitfromtheadditionalsales, if thespecialorder isaccepted.Therefore, it isrecommendedthatthecompanyshouldacceptthespecialoffer.
Add or Drop Products
Businessisnotinaworldofproducingproductsthatoncesoldwilllastalifetime—ultimatereplacementisavitaldecision.Nocompanycanaffordtostandstillwithitsoldproducts.Hence,theultimateobjectiveofeverycompanyshouldbetocomeupwithnewproductsthatwillservetheconsumerandreplacetheoldproductswhichhavebecomeobsoletewiththepassageoftimeandinviewofconsumerlikesanddislikes.Thusproductsandproductlinesmustbedevelopedtosatisfytheever-changingdesiresofconsumers.Toensuregrowthandprosperityofbusinessinadynamicmarket,companiesneedtodropsuchproducts,departments,segmentsorbranchesthateitherhavebecomeirrelevantforthebusinessorhavelosttheircommercialviability.However,beforetakinganyactioninthisregardthecompanymuststudytheimpactofsuchadecisiononfutureincomeandprofit.Sincediscontinuityofafirm’sproductorsegmentcannotavoidcommittedcostintheshortrun,suchadecisionintheshortrundemandsthestudyofdifferentialprofiteffect
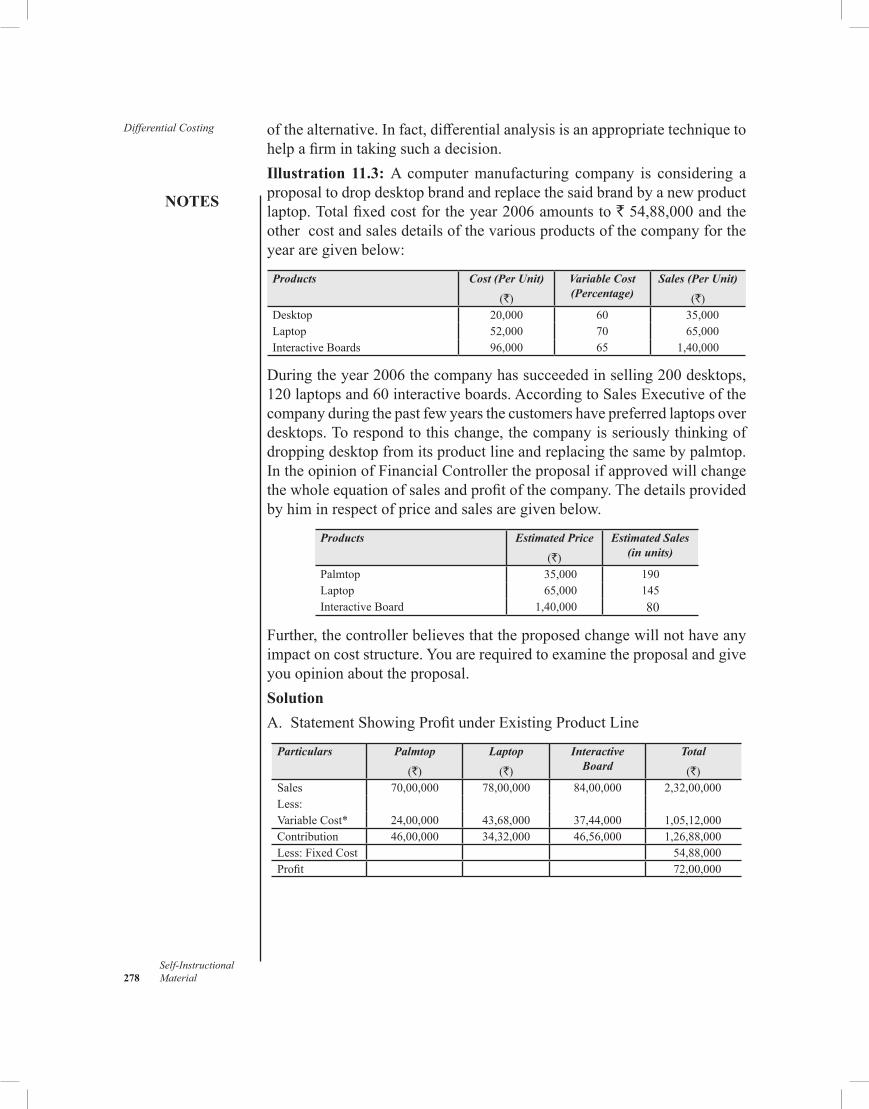
Differential Costing
NOTES
Self-Instructional 278 Material
ofthealternative.Infact,differentialanalysisisanappropriatetechniquetohelpafirmintakingsuchadecision.Illustration 11.3: A computer manufacturing company is considering a proposaltodropdesktopbrandandreplacethesaidbrandbyanewproductlaptop.Totalfixedcostfortheyear2006amountsto`54,88,000andtheothercostandsalesdetailsofthevariousproductsofthecompanyfortheyeararegivenbelow:
Products Cost (Per Unit)
(`)
Variable Cost(Percentage)
Sales (Per Unit)
(`)Desktop 20,000 60 35,000Laptop 52,000 70 65,000InteractiveBoards 96,000 65 1,40,000
Duringtheyear2006thecompanyhassucceededinselling200desktops,120laptopsand60interactiveboards.AccordingtoSalesExecutiveofthecompanyduringthepastfewyearsthecustomershavepreferredlaptopsoverdesktops.Torespondtothischange,thecompanyisseriouslythinkingofdroppingdesktopfromitsproductlineandreplacingthesamebypalmtop.IntheopinionofFinancialControllertheproposalifapprovedwillchangethewholeequationofsalesandprofitofthecompany.Thedetailsprovidedbyhiminrespectofpriceandsalesaregivenbelow.
Products Estimated Price
(`)
Estimated Sales(in units)
Palmtop 35,000 190Laptop 65,000 145InteractiveBoard 1,40,000 80
Further,thecontrollerbelievesthattheproposedchangewillnothaveanyimpactoncoststructure.Youarerequiredtoexaminetheproposalandgiveyouopinionabouttheproposal.SolutionA.StatementShowingProfitunderExistingProductLine
Particulars Palmtop
(`)
Laptop
(`)
InteractiveBoard
Total
(`)Sales 70,00,000 78,00,000 84,00,000 2,32,00,000Less:VariableCost* 24,00,000 43,68,000 37,44,000 1,05,12,000Contribution 46,00,000 34,32,000 46,56,000 1,26,88,000Less:FixedCost 54,88,000Profit 72,00,000
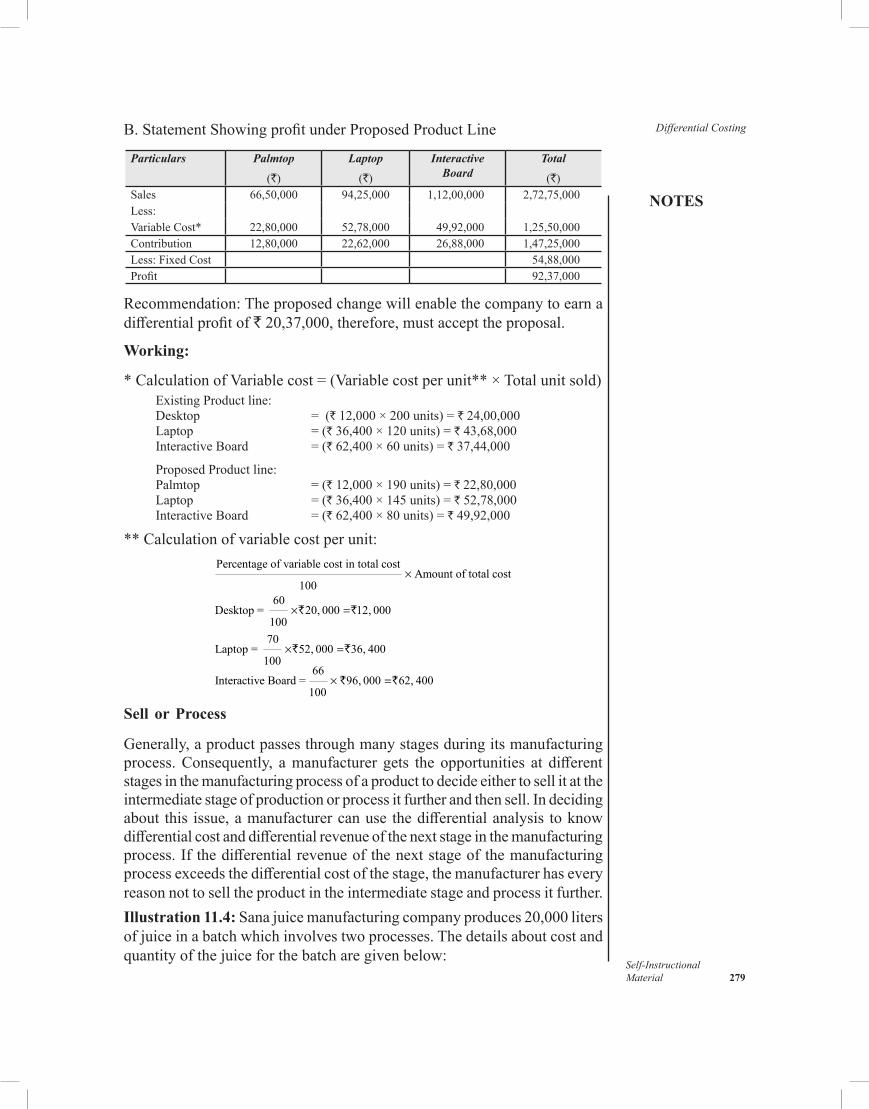
NOTES
Self-InstructionalMaterial 279
Differential CostingB. Statement Showing profit under Proposed Product Line
Particulars Palmtop
(`)
Laptop
(`)
InteractiveBoard
Total
(`)Sales 66,50,000 94,25,000 1,12,00,000 2,72,75,000Less:Variable Cost* 22,80,000 52,78,000 49,92,000 1,25,50,000Contribution 12,80,000 22,62,000 26,88,000 1,47,25,000Less: Fixed Cost 54,88,000Profit 92,37,000
Recommendation: The proposed change will enable the company to earn a differential profit of ` 20,37,000, therefore, must accept the proposal.
Working:
* Calculation of Variable cost = (Variable cost per unit** × Total unit sold)Existing Product line:Desktop = (` 12,000 × 200 units) = ` 24,00,000Laptop = (` 36,400 × 120 units) = ` 43,68,000Interactive Board = (` 62,400 × 60 units) = ` 37,44,000
Proposed Product line:Palmtop = (` 12,000 × 190 units) = ` 22,80,000Laptop = (` 36,400 × 145 units) = ` 52,78,000Interactive Board = (` 62,400 × 80 units) = ` 49,92,000
** Calculation of variable cost per unit:Percentage of variable cost in total cost
Amount of total cost100
60Desktop = 20, 000 12, 000
10070
Laptop = 52, 000 36, 400100
66Interactive Board = 96, 000 62, 400
100
×
× =
× =
× =
` `
` `
` `
Sell or Process
Generally, a product passes through many stages during its manufacturing process. Consequently, a manufacturer gets the opportunities at different stages in the manufacturing process of a product to decide either to sell it at the intermediate stage of production or process it further and then sell. In deciding about this issue, a manufacturer can use the differential analysis to know differential cost and differential revenue of the next stage in the manufacturing process. If the differential revenue of the next stage of the manufacturing process exceeds the differential cost of the stage, the manufacturer has every reason not to sell the product in the intermediate stage and process it further.Illustration 11.4: Sana juice manufacturing company produces 20,000 liters of juice in a batch which involves two processes. The details about cost and quantity of the juice for the batch are given below:
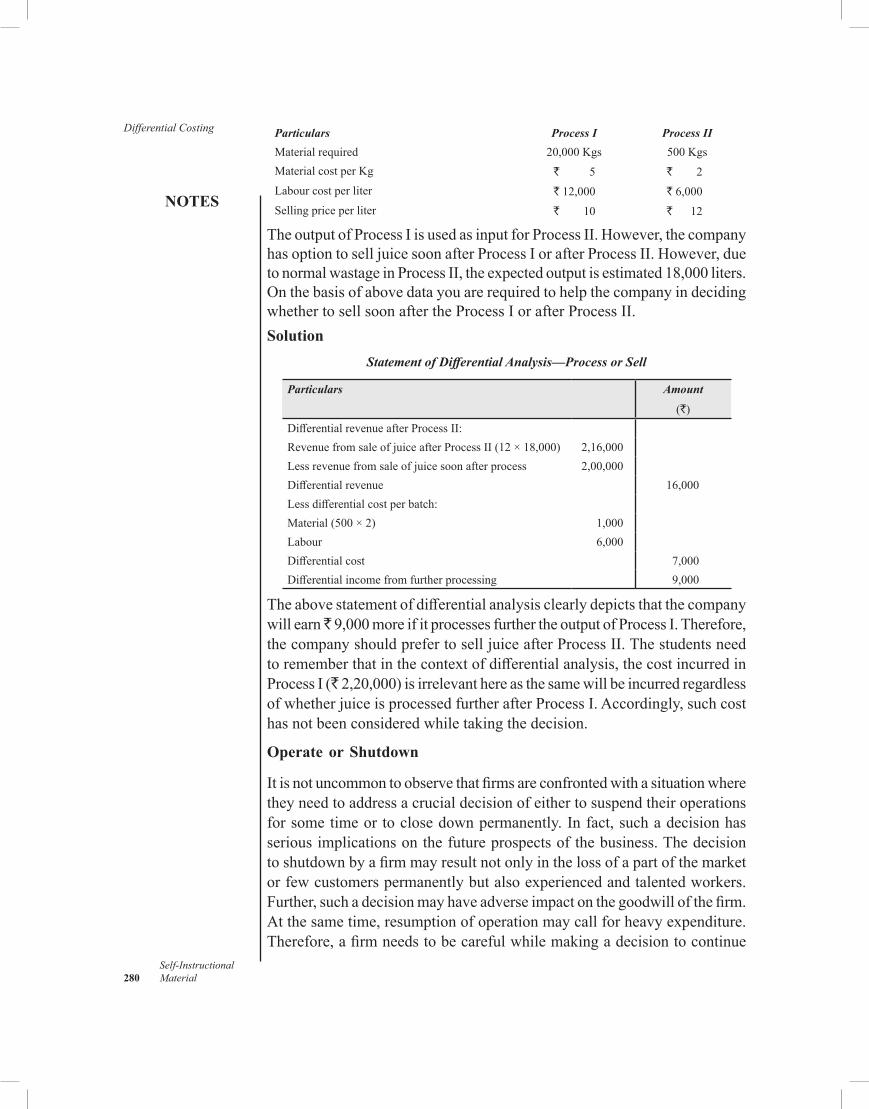
Differential Costing
NOTES
Self-Instructional 280 Material
Particulars Process I Process IIMaterialrequired 20,000Kgs 500 KgsMaterialcostperKg ` 5 ` 2Labourcostperliter `12,000 `6,000Sellingpriceperliter ` 10 ` 12
TheoutputofProcessIisusedasinputforProcessII.However,thecompanyhasoptiontoselljuicesoonafterProcessIorafterProcessII.However,duetonormalwastageinProcessII,theexpectedoutputisestimated18,000liters.OnthebasisofabovedatayouarerequiredtohelpthecompanyindecidingwhethertosellsoonaftertheProcessIorafterProcessII.Solution
Statement of Differential Analysis—Process or Sell
Particulars Amount
(`)DifferentialrevenueafterProcessII:RevenuefromsaleofjuiceafterProcessII(12×18,000) 2,16,000Lessrevenuefromsaleofjuicesoonafterprocess 2,00,000Differentialrevenue 16,000Lessdifferentialcostperbatch:Material(500×2) 1,000Labour 6,000Differentialcost 7,000Differentialincomefromfurtherprocessing 9,000
Theabovestatementofdifferentialanalysisclearlydepictsthatthecompanywillearn 9,000moreifitprocessesfurthertheoutputofProcessI.Therefore,thecompanyshouldprefertoselljuiceafterProcessII.Thestudentsneedtorememberthatinthecontextofdifferentialanalysis,thecostincurredinProcessI(`2,20,000)isirrelevanthereasthesamewillbeincurredregardlessofwhetherjuiceisprocessedfurtherafterProcessI.Accordingly,suchcosthasnotbeenconsideredwhiletakingthedecision.
Operate or Shutdown
It is not uncommon toobservethatfirmsareconfrontedwithasituationwheretheyneedtoaddressacrucialdecisionofeithertosuspendtheiroperationsforsometimeortoclosedownpermanently.Infact,suchadecisionhasseriousimplicationsonthefutureprospectsofthebusiness.Thedecisiontoshutdownbyafirmmayresultnotonlyinthelossofapartofthemarketorfewcustomerspermanentlybutalsoexperiencedandtalentedworkers.Further,suchadecisionmayhaveadverseimpactonthegoodwillofthefirm.Atthesametime,resumptionofoperationmaycallforheavyexpenditure.Therefore,afirmneedstobecarefulwhilemakingadecisiontocontinue
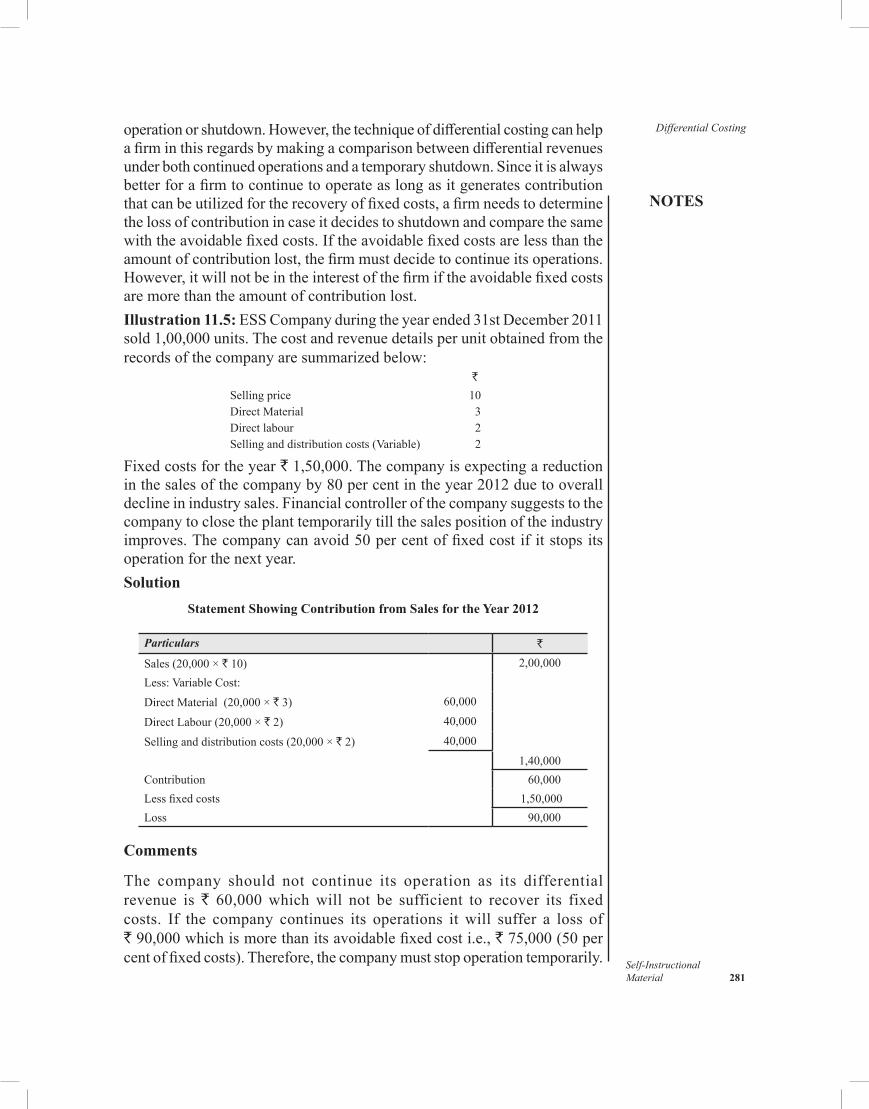
NOTES
Self-InstructionalMaterial 281
Differential Costingoperationorshutdown.However,thetechniqueofdifferentialcostingcanhelpafirminthisregardsbymakingacomparisonbetweendifferentialrevenuesunderbothcontinuedoperationsandatemporaryshutdown.Sinceitisalwaysbetterforafirmtocontinuetooperateaslongasitgeneratescontributionthatcanbeutilizedfortherecoveryoffixedcosts,afirmneedstodeterminethelossofcontributionincaseitdecidestoshutdownandcomparethesamewiththeavoidablefixedcosts.Iftheavoidablefixedcostsarelessthantheamountofcontributionlost,thefirmmustdecidetocontinueitsoperations.However,itwillnotbeintheinterestofthefirmiftheavoidablefixedcostsaremorethantheamountofcontributionlost.Illustration 11.5: ESSCompanyduringtheyearended31stDecember2011sold1,00,000units.Thecostandrevenuedetailsperunitobtainedfromtherecordsofthecompanyaresummarizedbelow:
`
Sellingprice 10DirectMaterial 3Directlabour 2Sellinganddistributioncosts(Variable) 2
Fixedcostsfortheyear`1,50,000.Thecompanyisexpectingareductioninthesalesofthecompanyby80percentintheyear2012duetooveralldeclineinindustrysales.Financialcontrollerofthecompanysuggeststothecompanytoclosetheplanttemporarilytillthesalespositionoftheindustryimproves.Thecompanycanavoid50percentoffixedcostif itstopsitsoperationforthenextyear.Solution
Statement Showing Contribution from Sales for the Year 2012
Particulars `
Sales(20,000×`10) 2,00,000Less:VariableCost:DirectMaterial(20,000×`3) 60,000
DirectLabour(20,000×`2) 40,000
Sellinganddistributioncosts(20,000×`2) 40,0001,40,000
Contribution 60,000Lessfixedcosts 1,50,000Loss 90,000
Comments
The company should not continue its operation as its differentialrevenue is ` 60,000whichwill not be sufficient to recover its fixedcosts. If the company continues its operations itwill suffer a loss of `90,000whichismorethanitsavoidablefixedcosti.e.,`75,000(50percentoffixedcosts).Therefore,thecompanymuststopoperationtemporarily.
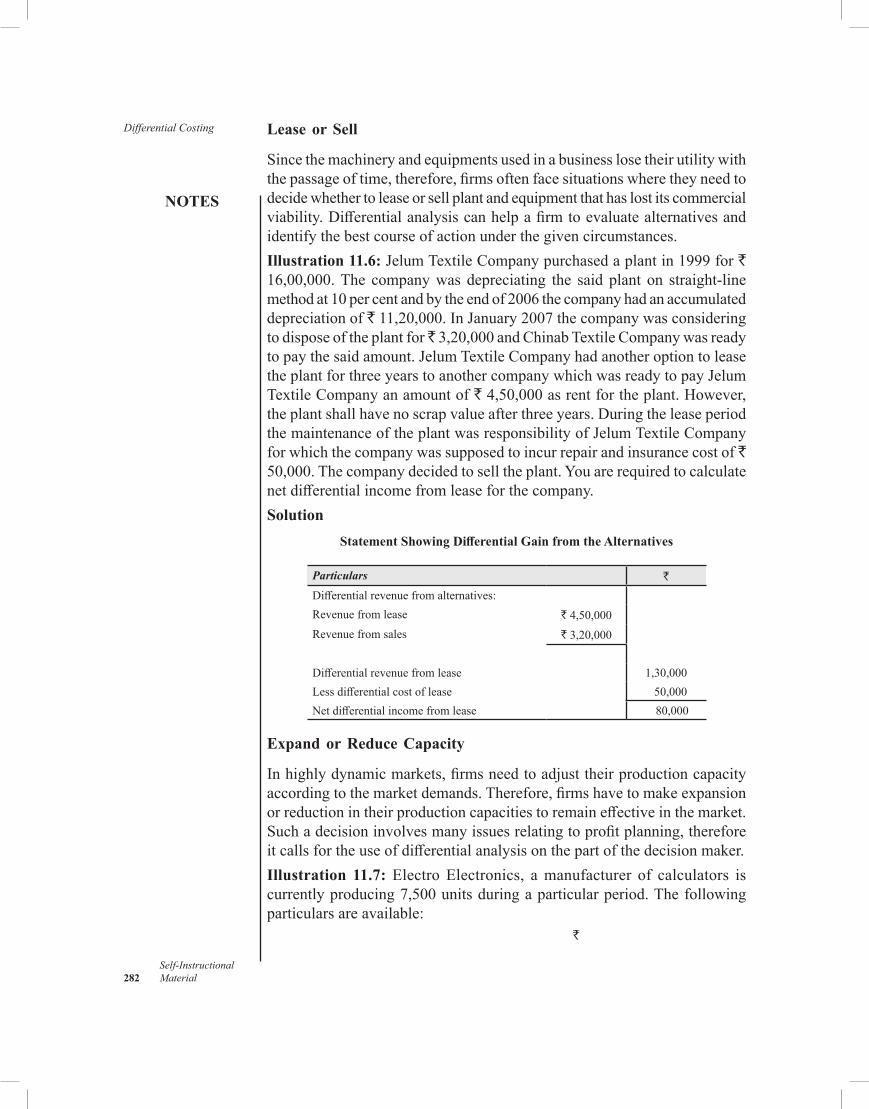
Differential Costing
NOTES
Self-Instructional 282 Material
Lease or Sell
Sincethemachineryandequipmentsusedinabusinesslosetheirutilitywiththepassageoftime,therefore,firmsoftenfacesituationswheretheyneedtodecidewhethertoleaseorsellplantandequipmentthathaslostitscommercialviability.Differentialanalysiscanhelpafirmtoevaluatealternativesandidentifythebestcourseofactionunderthegivencircumstances.Illustration 11.6: JelumTextileCompanypurchasedaplantin1999for` 16,00,000.The companywasdepreciating the said plant on straight-linemethodat10percentandbytheendof2006thecompanyhadanaccumulateddepreciation of `11,20,000.InJanuary2007thecompanywasconsideringtodisposeoftheplantfor 3,20,000andChinabTextileCompanywasreadytopaythesaidamount.JelumTextileCompanyhadanotheroptiontoleasetheplantforthreeyearstoanothercompanywhichwasreadytopayJelumTextileCompanyanamountof`4,50,000asrentfortheplant.However,theplantshallhavenoscrapvalueafterthreeyears.DuringtheleaseperiodthemaintenanceoftheplantwasresponsibilityofJelumTextileCompanyforwhichthecompanywassupposedtoincurrepairandinsurancecostof` 50,000.Thecompanydecidedtoselltheplant.Youarerequiredtocalculatenetdifferentialincomefromleaseforthecompany.Solution
Statement Showing Differential Gain from the Alternatives
Particulars `
Differentialrevenuefromalternatives:Revenuefromlease `4,50,000Revenuefromsales `3,20,000
Differentialrevenuefromlease 1,30,000Lessdifferentialcostoflease 50,000Netdifferentialincomefromlease 80,000
Expand or Reduce Capacity
Inhighlydynamicmarkets,firmsneedtoadjusttheirproductioncapacityaccordingtothemarketdemands.Therefore,firmshavetomakeexpansionorreductionintheirproductioncapacitiestoremaineffectiveinthemarket.Suchadecisioninvolvesmanyissuesrelatingtoprofitplanning,thereforeitcallsfortheuseofdifferentialanalysisonthepartofthedecisionmaker.Illustration 11.7: ElectroElectronics, amanufacturer of calculators iscurrentlyproducing7,500unitsduringaparticularperiod.Thefollowingparticularsareavailable:
`
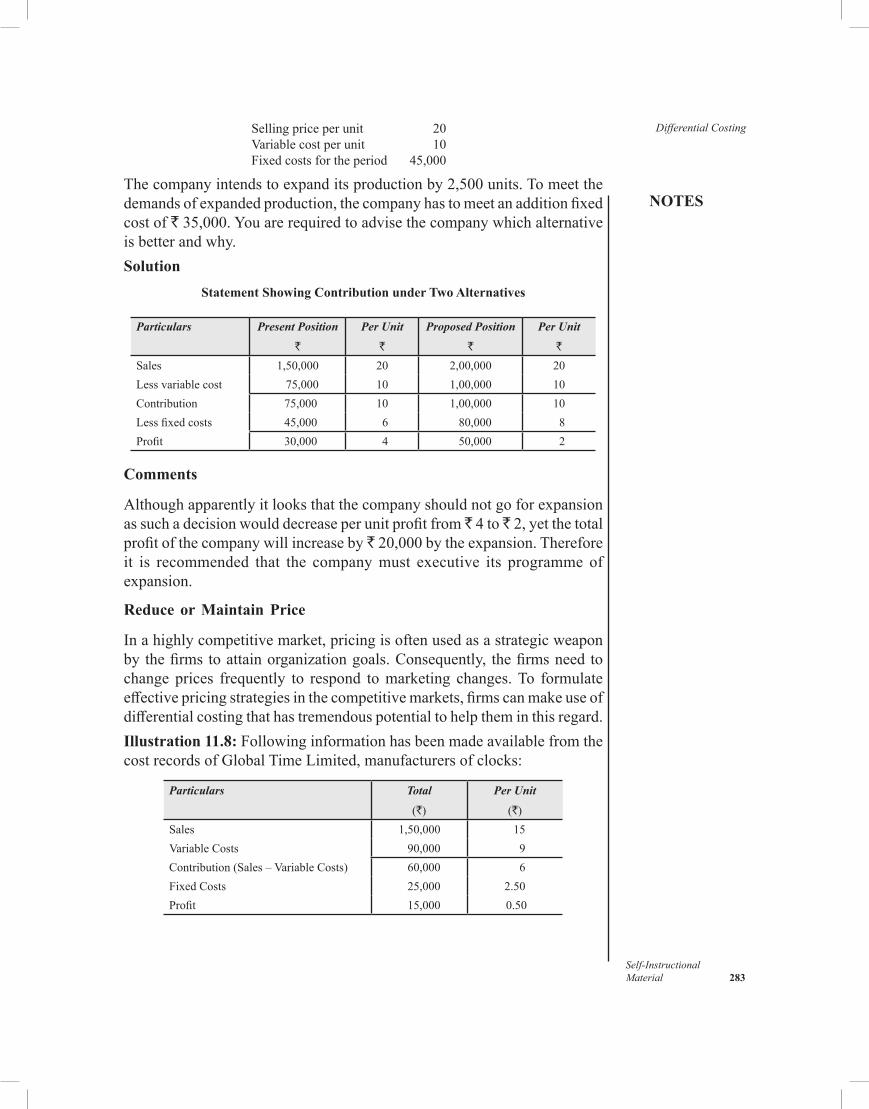
NOTES
Self-InstructionalMaterial 283
Differential CostingSellingpriceperunit 20Variablecostperunit 10Fixedcostsfortheperiod 45,000
Thecompanyintendstoexpanditsproductionby2,500units.Tomeetthedemandsofexpandedproduction,thecompanyhastomeetanadditionfixedcost of `35,000.Youarerequiredtoadvisethecompanywhichalternativeisbetterandwhy.Solution
Statement Showing Contribution under Two Alternatives
Particulars Present Position
`
Per Unit
`
Proposed Position
`
Per Unit
`
Sales 1,50,000 20 2,00,000 20Lessvariablecost 75,000 10 1,00,000 10Contribution 75,000 10 1,00,000 10Lessfixedcosts 45,000 6 80,000 8Profit 30,000 4 50,000 2
Comments
Althoughapparentlyitlooksthatthecompanyshouldnotgoforexpansionassuchadecisionwoulddecreaseperunitprofitfrom 4 to 2,yetthetotalprofitofthecompanywillincreaseby`20,000bytheexpansion.Thereforeit is recommended that the companymust executive its programmeofexpansion.
Reduce or Maintain Price
Inahighlycompetitivemarket,pricingisoftenusedasastrategicweaponbythefirmstoattainorganizationgoals.Consequently, thefirmsneedtochange prices frequently to respond tomarketing changes.To formulateeffectivepricingstrategiesinthecompetitivemarkets,firmscanmakeuseofdifferentialcostingthathastremendouspotentialtohelptheminthisregard.Illustration 11.8: FollowinginformationhasbeenmadeavailablefromthecostrecordsofGlobalTimeLimited,manufacturersofclocks:
Particulars Total
(`)
Per Unit
(`)Sales 1,50,000 15VariableCosts 90,000 9Contribution(Sales–VariableCosts) 60,000 6FixedCosts 25,000 2.50Profit 15,000 0.50
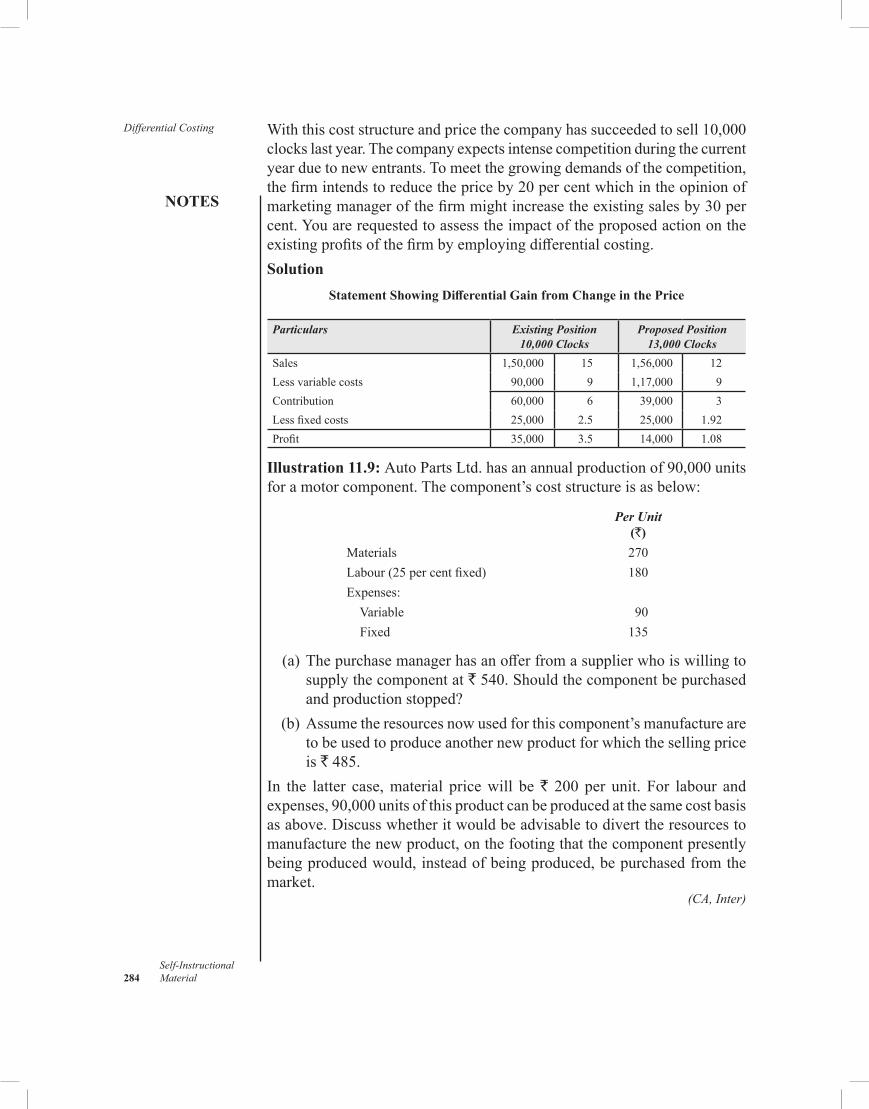
Differential Costing
NOTES
Self-Instructional 284 Material
Withthiscoststructureandpricethecompanyhassucceededtosell10,000clockslastyear.Thecompanyexpectsintensecompetitionduringthecurrentyearduetonewentrants.Tomeetthegrowingdemandsofthecompetition,thefirmintendstoreducethepriceby20percentwhichintheopinionofmarketingmanagerofthefirmmightincreasetheexistingsalesby30percent.Youarerequestedtoassesstheimpactoftheproposedactionontheexistingprofitsofthefirmbyemployingdifferentialcosting.Solution
Statement Showing Differential Gain from Change in the Price
Particulars Existing Position 10,000 Clocks
Proposed Position 13,000 Clocks
Sales 1,50,000 15 1,56,000 12Lessvariablecosts 90,000 9 1,17,000 9Contribution 60,000 6 39,000 3Lessfixedcosts 25,000 2.5 25,000 1.92Profit 35,000 3.5 14,000 1.08
Illustration 11.9: AutoPartsLtd.hasanannualproductionof90,000unitsforamotorcomponent.Thecomponent’scoststructureisasbelow:
Per Unit(`)
Materials 270Labour(25percentfixed) 180Expenses: Variable 90 Fixed 135
(a)Thepurchasemanagerhasanofferfromasupplierwhoiswillingtosupplythecomponentat`540.Shouldthecomponentbepurchasedandproductionstopped?
(b)Assumetheresourcesnowusedforthiscomponent’smanufacturearetobeusedtoproduceanothernewproductforwhichthesellingpriceis ` 485.
In the latter case,material pricewill be` 200 per unit. For labour andexpenses,90,000unitsofthisproductcanbeproducedatthesamecostbasisasabove.Discusswhetheritwouldbeadvisabletodiverttheresourcestomanufacturethenewproduct,onthefootingthatthecomponentpresentlybeingproducedwould,insteadofbeingproduced,bepurchasedfromthemarket.
(CA, Inter)
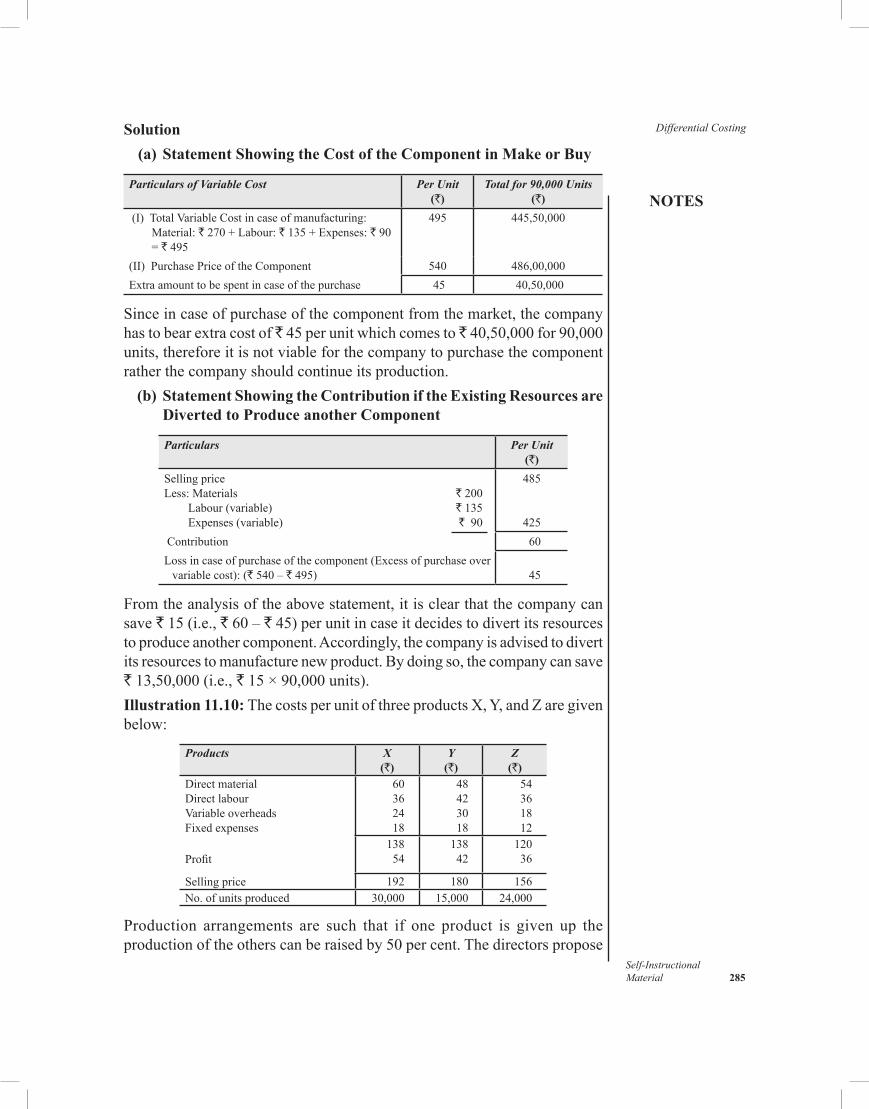
NOTES
Self-InstructionalMaterial 285
Differential CostingSolution (a) Statement Showing the Cost of the Component in Make or Buy
Particulars of Variable Cost Per Unit(`)
Total for 90,000 Units(`)
(I) TotalVariableCostincaseofmanufacturing:Material:`270+Labour:`135+Expenses:` 90 = ` 495
495 445,50,000
(II) PurchasePriceoftheComponent 540 486,00,000Extraamounttobespentincaseofthepurchase 45 40,50,000
Sinceincaseofpurchaseofthecomponentfromthemarket,thecompanyhastobearextracostof 45perunitwhichcomesto 40,50,000for90,000units,thereforeitisnotviableforthecompanytopurchasethecomponentratherthecompanyshouldcontinueitsproduction. (b) Statement Showing the Contribution if the Existing Resources are
Diverted to Produce another Component
Particulars Per Unit(`)
SellingpriceLess:Materials ` 200Labour(variable) ` 135Expenses(variable) ` 90
485
425 Contribution 60 Lossincaseofpurchaseofthecomponent(Excessofpurchaseovervariablecost):(` 540 – `495)
45
Fromtheanalysisoftheabovestatement,itisclearthatthecompanycansave `15(i.e.,` 60 – `45)perunitincaseitdecidestodivertitsresourcestoproduceanothercomponent.Accordingly,thecompanyisadvisedtodivertitsresourcestomanufacturenewproduct.Bydoingso,thecompanycansave`13,50,000(i.e.,`15×90,000units).Illustration 11.10: ThecostsperunitofthreeproductsX,Y,andZaregivenbelow:
Products X(`)
Y(`)
Z(`)
DirectmaterialDirectlabourVariableoverheadsFixedexpenses
Profit
Sellingprice
60362418
48423018
54361812
13854
13842
12036
192 180 156No.ofunitsproduced 30,000 15,000 24,000
Production arrangements are such that if one product is given up theproductionoftheotherscanberaisedby50percent.Thedirectorspropose
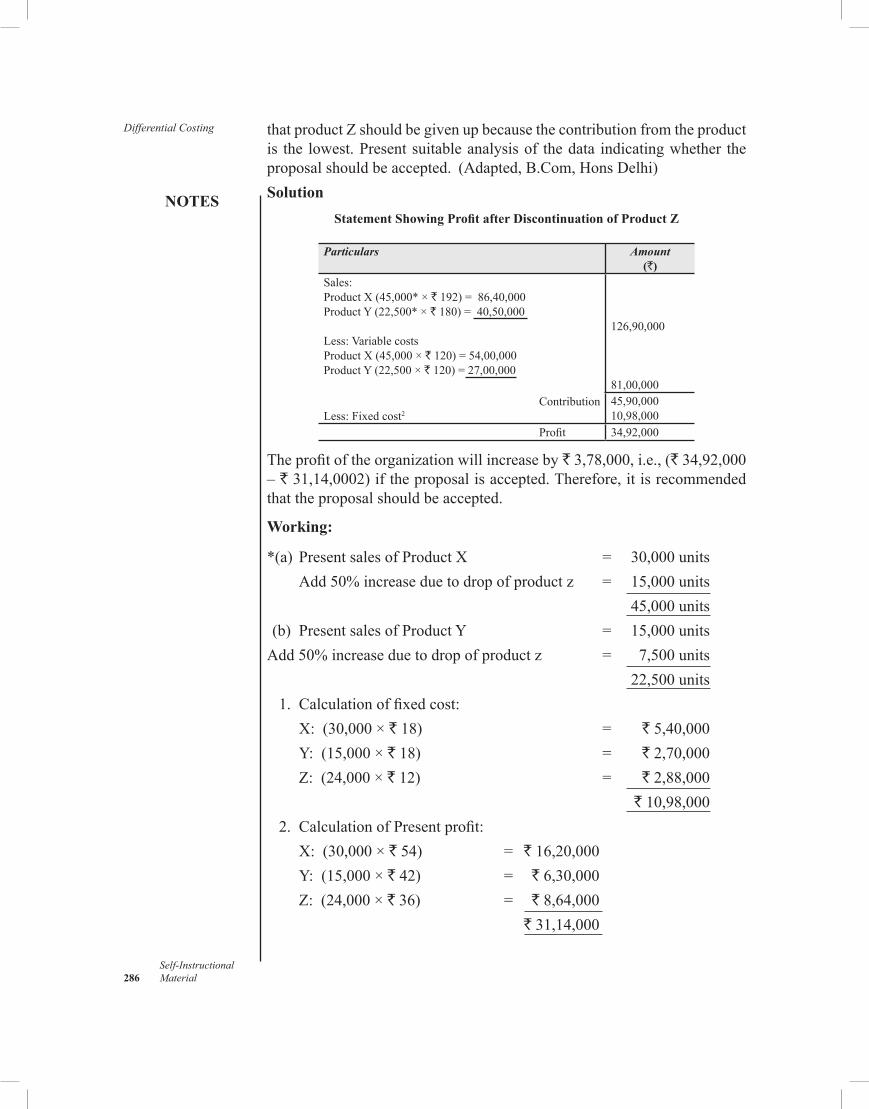
Differential Costing
NOTES
Self-Instructional 286 Material
thatproductZshouldbegivenupbecausethecontributionfromtheproductis the lowest.Presentsuitableanalysisof thedata indicatingwhether theproposalshouldbeaccepted. (Adapted,B.Com,HonsDelhi)Solution
Statement Showing Profit after Discontinuation of Product Z
Particulars Amount(`)
Sales:ProductX(45,000*× `192)=86,40,000ProductY(22,500*× `180)=40,50,000
Less:VariablecostsProductX(45,000× `120)=54,00,000ProductY(22,500× `120)=27,00,000
ContributionLess:Fixedcost2
126,90,000
81,00,00045,90,00010,98,000
Profit 34,92,000
Theprofitoftheorganizationwillincreaseby`3,78,000,i.e.,(`34,92,000– `31,14,0002)iftheproposalisaccepted.Therefore,itisrecommendedthattheproposalshouldbeaccepted.
Working:
*(a) PresentsalesofProductX = 30,000units Add50%increaseduetodropofproductz = 15,000units 45,000units(b) PresentsalesofProductY = 15,000unitsAdd50%increaseduetodropofproductz = 7,500units 22,500units 1. Calculationoffixedcost: X: (30,000× `18) = `5,40,000 Y: (15,000× `18) = `2,70,000 Z: (24,000×`12) = `2,88,000 `10,98,000 2. CalculationofPresentprofit: X: (30,000× `54) = `16,20,000 Y: (15,000× ` 42) = `6,30,000 Z: (24,000×`36) = `8,64,000 `31,14,000
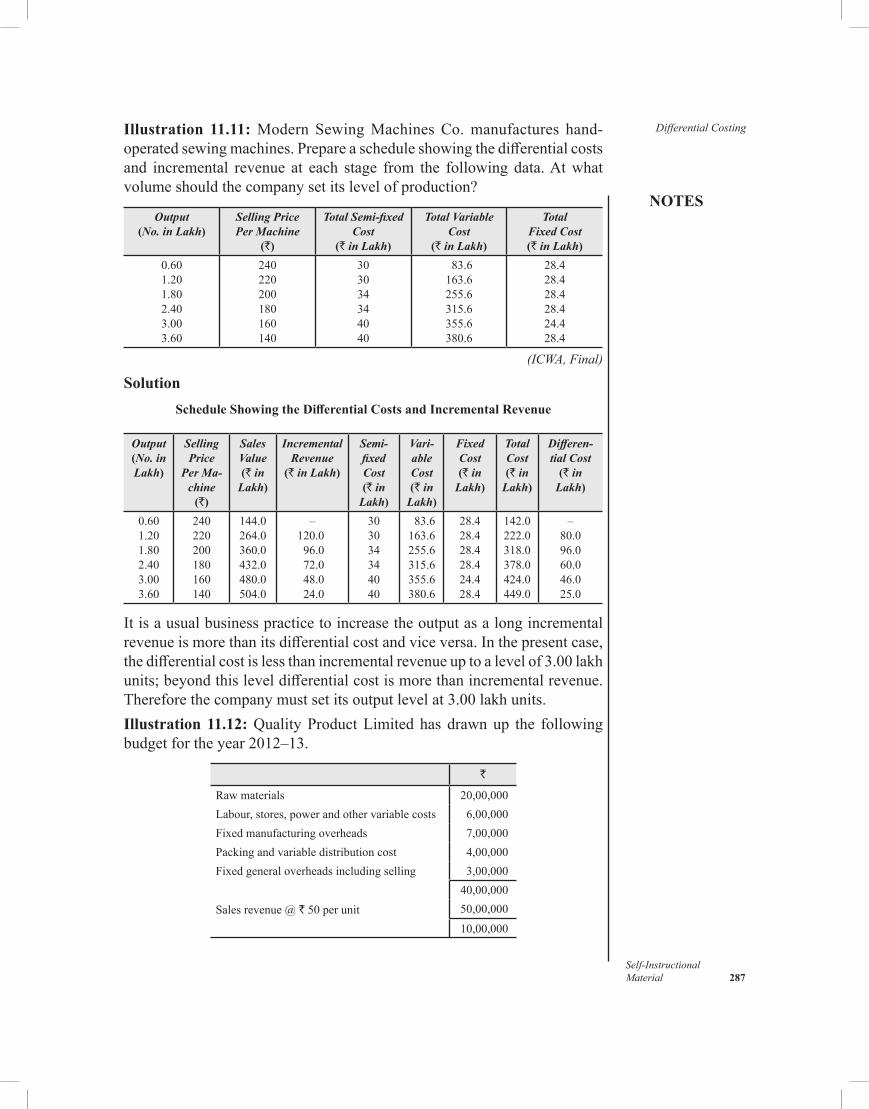
NOTES
Self-InstructionalMaterial 287
Differential CostingIllustration 11.11: Modern SewingMachinesCo.manufactures hand-operatedsewingmachines.Prepareascheduleshowingthedifferentialcostsand incremental revenue at each stage from the followingdata.Atwhatvolumeshouldthecompanysetitslevelofproduction?
Output(No. in Lakh)
Selling PricePer Machine
(`)
Total Semi-fixed Cost
(` in Lakh)
Total Variable Cost
(` in Lakh)
Total Fixed Cost(` in Lakh)
0.601.201.802.403.003.60
240220200180160140
303034344040
83.6163.6255.6315.6355.6380.6
28.428.428.428.424.428.4
(ICWA, Final)
SolutionSchedule Showing the Differential Costs and Incremental Revenue
Output(No. in Lakh)
Selling Price
Per Ma-chine
(`)
Sales Value(` in
Lakh)
IncrementalRevenue
(` in Lakh)
Semi-fixed Cost(` in
Lakh)
Vari-able Cost (` in
Lakh)
Fixed Cost(` in
Lakh)
Total Cost(` in
Lakh)
Differen-tial Cost
(` in Lakh)
0.601.201.802.403.003.60
240220200180160140
144.0264.0360.0432.0480.0504.0
–120.096.072.048.024.0
303034344040
83.6163.6255.6315.6355.6380.6
28.428.428.428.424.428.4
142.0222.0318.0378.0424.0449.0
–80.096.060.046.025.0
Itisausualbusinesspracticetoincreasetheoutputasalongincrementalrevenueismorethanitsdifferentialcostandviceversa.Inthepresentcase,thedifferentialcostislessthanincrementalrevenueuptoalevelof3.00lakhunits;beyondthisleveldifferentialcostismorethanincrementalrevenue.Thereforethecompanymustsetitsoutputlevelat3.00lakhunits.Illustration 11.12: QualityProductLimitedhas drawnup the followingbudgetfortheyear2012–13.
`
Rawmaterials 20,00,000Labour,stores,powerandothervariablecosts 6,00,000Fixedmanufacturingoverheads 7,00,000Packingandvariabledistributioncost 4,00,000Fixedgeneraloverheadsincludingselling 3,00,000
40,00,000Salesrevenue@` 50 per unit 50,00,000
10,00,000
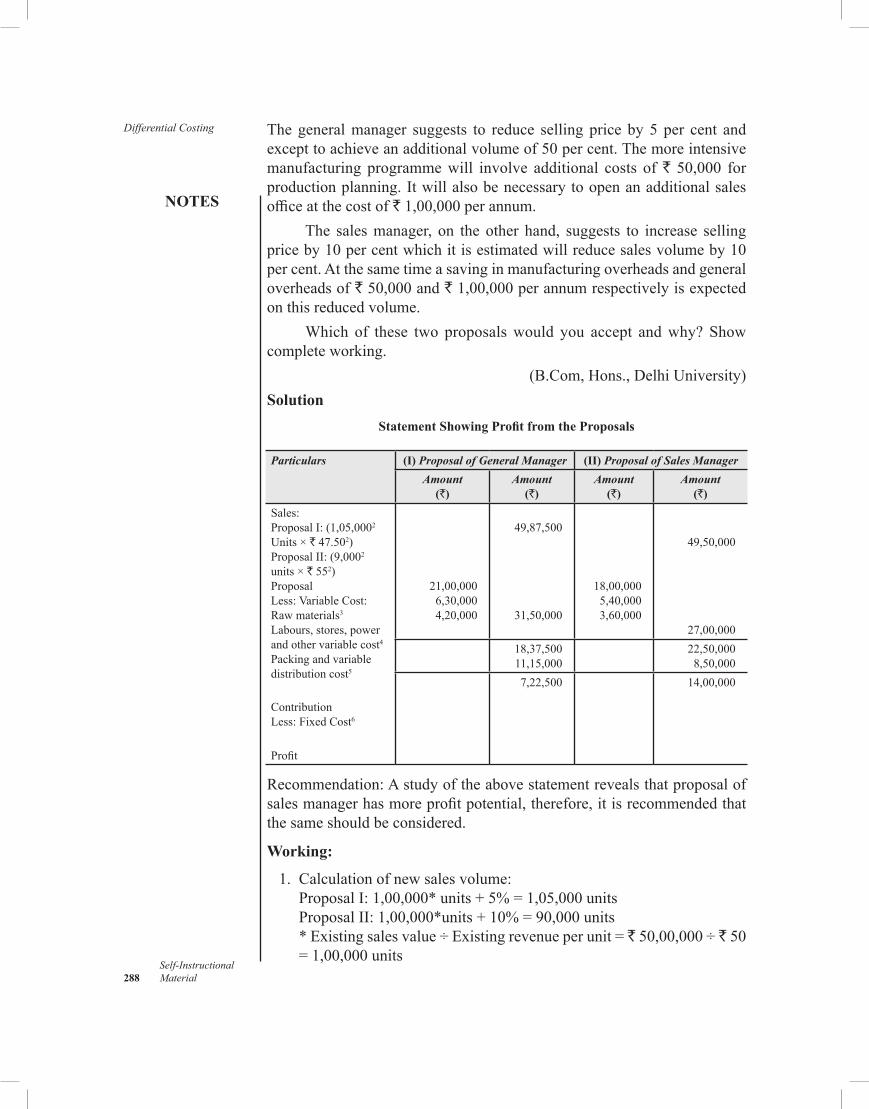
Differential Costing
NOTES
Self-Instructional 288 Material
Thegeneralmanager suggests to reduce sellingprice by5 per cent andexcepttoachieveanadditionalvolumeof50percent.Themoreintensivemanufacturing programmewill involve additional costs of` 50,000 forproductionplanning.Itwillalsobenecessarytoopenanadditionalsalesofficeatthecostof`1,00,000perannum.
The salesmanager, on the other hand, suggests to increase sellingpriceby10percentwhichitisestimatedwillreducesalesvolumeby10percent.Atthesametimeasavinginmanufacturingoverheadsandgeneraloverheadsof`50,000and`1,00,000perannumrespectivelyisexpectedonthisreducedvolume.
Which of these two proposalswould you accept andwhy?Showcompleteworking.
(B.Com,Hons.,DelhiUniversity)Solution
Statement Showing Profit from the Proposals
Particulars (I) Proposal of General Manager (II) Proposal of Sales ManagerAmount
(`)Amount
(`)Amount
(`)Amount
(`)Sales:ProposalI:(1,05,0002 Units× ` 47.502)ProposalII:(9,0002 units × ` 552)ProposalLess:VariableCost:Rawmaterials3 Labours,stores,powerandothervariablecost4Packingandvariabledistribution cost5
ContributionLess:FixedCost6
Profit
21,00,0006,30,0004,20,000
49,87,500
31,50,000
18,00,0005,40,0003,60,000
49,50,000
27,00,00018,37,50011,15,000
22,50,0008,50,000
7,22,500 14,00,000
Recommendation:Astudyoftheabovestatementrevealsthatproposalofsalesmanagerhasmoreprofitpotential,therefore,itisrecommendedthatthesameshouldbeconsidered.
Working:
1. Calculationofnewsalesvolume: ProposalI:1,00,000*units+5%=1,05,000units ProposalII:1,00,000*units+10%=90,000units *Existingsalesvalue÷Existingrevenueperunit=`50,00,000÷ ` 50
=1,00,000units
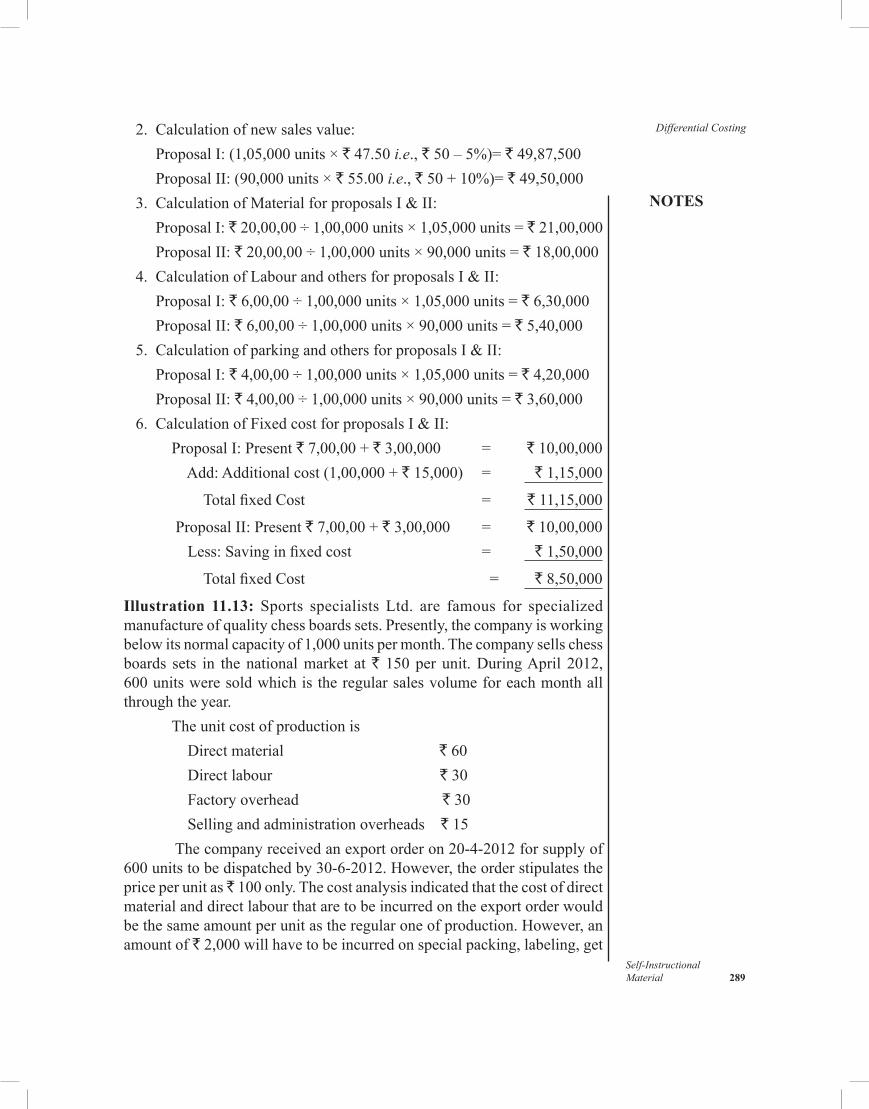
NOTES
Self-InstructionalMaterial 289
Differential Costing 2. Calculationofnewsalesvalue: ProposalI:(1,05,000units× ` 47.50 i.e.,`50–5%)=`49,87,500 ProposalII:(90,000units× ` 55.00 i.e.,`50+10%)=`49,50,000 3. CalculationofMaterialforproposalsI&II: ProposalI:`20,00,00÷1,00,000units×1,05,000units=`21,00,000 ProposalII:`20,00,00÷1,00,000units×90,000units=`18,00,000 4. CalculationofLabourandothersforproposalsI&II: ProposalI:`6,00,00÷1,00,000units×1,05,000units=`6,30,000 ProposalII:`6,00,00÷1,00,000units×90,000units=`5,40,000 5. CalculationofparkingandothersforproposalsI&II: ProposalI:`4,00,00÷1,00,000units×1,05,000units=`4,20,000 ProposalII:`4,00,00÷1,00,000units×90,000units=`3,60,000 6. CalculationofFixedcostforproposalsI&II: ProposalI:Present`7,00,00+`3,00,000 = `10,00,000 Add:Additionalcost(1,00,000+`15,000) = `1,15,000
TotalfixedCost = `11,15,000
ProposalII:Present`7,00,00+`3,00,000 = ` 10,00,000 Less:Savinginfixedcost = `1,50,000
TotalfixedCost = `8,50,000
Illustration 11.13: Sports specialists Ltd. are famous for specializedmanufactureofqualitychessboardssets.Presently,thecompanyisworkingbelowitsnormalcapacityof1,000unitspermonth.Thecompanysellschessboards sets in the nationalmarket at` 150per unit.DuringApril 2012, 600unitsweresoldwhichistheregularsalesvolumeforeachmonthallthroughtheyear. Theunitcostofproductionis
Directmaterial ` 60Directlabour ` 30Factoryoverhead ` 30Sellingandadministrationoverheads ` 15
Thecompanyreceivedanexportorderon20-4-2012forsupplyof600unitstobedispatchedby30-6-2012.However,theorderstipulatestheprice per unit as 100only.Thecostanalysisindicatedthatthecostofdirectmaterialanddirectlabourthataretobeincurredontheexportorderwouldbethesameamountperunitastheregularoneofproduction.However,anamount of `2,000willhavetobeincurredonspecialpacking,labeling,get
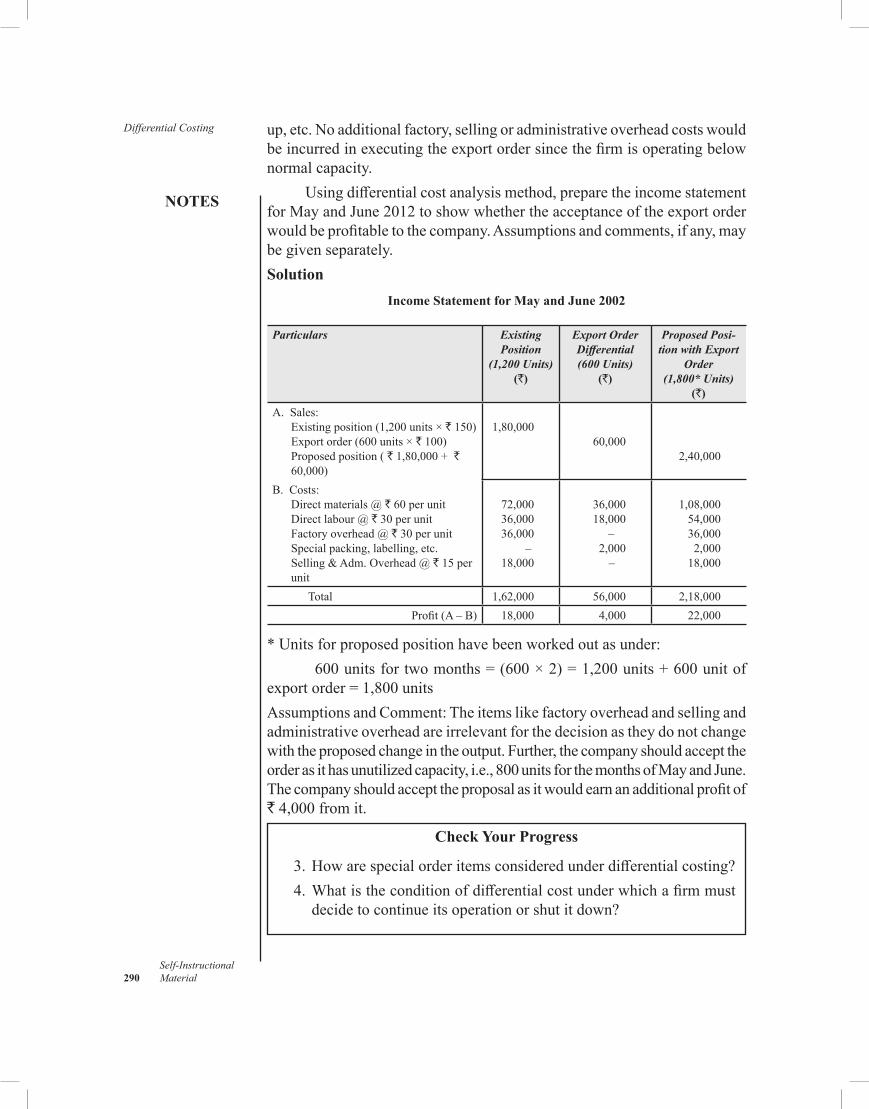
Differential Costing
NOTES
Self-Instructional 290 Material
up,etc.Noadditionalfactory,sellingoradministrativeoverheadcostswouldbeincurredinexecutingtheexportordersincethefirmisoperatingbelownormalcapacity.
Usingdifferentialcostanalysismethod,preparetheincomestatementforMayandJune2012toshowwhethertheacceptanceoftheexportorderwouldbeprofitabletothecompany.Assumptionsandcomments,ifany,maybegivenseparately.Solution
Income Statement for May and June 2002
Particulars Existing Position
(1,200 Units)(`)
Export Order Differential(600 Units)
(`)
Proposed Posi-tion with Export
Order(1,800* Units)
(`)A. Sales:
Existingposition(1,200units× `150) Exportorder(600units× `100)Proposedposition(`1,80,000+` 60,000)
1,80,00060,000
2,40,000
B. Costs:Directmaterials@` 60 per unitDirectlabour@` 30 per unitFactoryoverhead@` 30 per unitSpecialpacking,labelling,etc.Selling&Adm.Overhead@` 15 per unit
72,00036,00036,000
–18,000
36,00018,000 –2,000
–
1,08,00054,00036,0002,00018,000
Total 1,62,000 56,000 2,18,000Profit(A–B) 18,000 4,000 22,000
*Unitsforproposedpositionhavebeenworkedoutasunder: 600unitsfortwomonths=(600×2)=1,200units+600unitofexportorder=1,800unitsAssumptionsandComment:Theitemslikefactoryoverheadandsellingandadministrativeoverheadareirrelevantforthedecisionastheydonotchangewiththeproposedchangeintheoutput.Further,thecompanyshouldaccepttheorderasithasunutilizedcapacity,i.e.,800unitsforthemonthsofMayandJune.Thecompanyshouldaccepttheproposalasitwouldearnanadditionalprofitof `4,000fromit.
Check Your Progress
3.Howarespecialorderitemsconsideredunderdifferentialcosting? 4.Whatistheconditionofdifferentialcostunderwhichafirmmust
decidetocontinueitsoperationorshutitdown?
NOTES
Self-InstructionalMaterial 291
Differential Costing11.5 ANSWERS TO CHECK YOUR PROGRESS
1.Differentialcostingisperspectiveinnaturewhereasmarginalcostingisgenerallyhistoricalinnature.
2.Anumberof tools and techniques are availablewithmanagementaccountantsforevaluationofalternativeslikeprofitplanning,capitalbudgeting, risk techniques, linear programming, decision tree andforecastingtechniques.
3.Specialorderisgenerallyconsideredonthebasisofacomparisonbetween the price offered and expected differential costwhich isgenerally equal tovariable cost in the short period. If theprice ishigherthandifferentialcost,theorderisacceptedotheritisrejected.
4. Iftheavoidablefixedcostsarelessthantheamountofcontributionlost,thefirmmustdecidetocontinueitsoperations.However,itwillnotbeintheinterestofthefirmiftheavoidablefixedcostsaremorethantheamountofcontributionlost.
11.6 SUMMARY
•Differential costing refers to a costing technique that examines theeffectsofalternativecoursesofactionontotalcosts.
•Theconceptofdifferentialcostingisbasedontotalcostwhichisnottrueofmarginalcostingthatconsidersonlydirect/variablecostsandignoresfixedcostinitsapplication.
•Differentialcostingisperspectiveinnaturewhereasmarginalcostingisgenerallyhistoricalinnature.
•Undermarginalcostperunitdoesnotchangedespitethechangeintherange of production.
•Underdifferentialcostingthecostperunitmaychangewithachangein range of production.
•Thesetoftoolsusedindifferentialcostingforperformanceevaluationisdifferentthanrecommendedbymarginalcosting.
•Differentialcostingisapplicabletoanadditionalvolumeofproductionwhereasmarginalcostingisusedforadditionalunits.
•Relevant cost represents the amount of difference in terms ofcost between several alternative courses of action that are underconsiderationofadecision-maker.
•Relevantcostsarefuturecostsandnottheonesthathavealreadybeenincurred.
Differential Costing
NOTES
Self-Instructional 292 Material
•Relevantcostsareboundtochangeasaresultofalternativecourseofaction.
•Thecoststhatremainconstantbetweendifferentalternativesdonotfallwithinthescopeofrelevantcosts.
•Decisionmakingistheprocessofmakingchoicesbetweenalternativecourses of action.
•Everyrationaldecisionmakingprocessbeginswiththeidentificationoftheproblem.
•Everyproblemcallsforanin-depthstudyasgenerallytheproblemsarecharacterizedby‘ice-berg’principlewherealittleportionisvisibleandthemajorportionishiddenaboutwhichthedecision-makerhasnoclue.
•Althoughanumberoftoolsandtechniqueslikelateralthinking,diggingaholeelsewhere,andmorphologicalapproachhavebeendevelopedovertheyeartohelpdecision-makersindevelopingalternativesyetsuchanattemptcallsforlotofeffortonthepartofdecision-makersintermsofcontinuousresearchandthinking.
•To evaluate decision alternatives in their right perspectives, amanagementaccountantneedstopossessknowledgeaboutanumberof toolsand techniques likeprofitplanning,capitalbudgeting, risktechniques, linear programming, decision tree, and forecastingtechniques.
•Thechoiceofthebestalternativeissimplyaccomplishedbyselectingthealternativewhichbestmeetsthechosencriterion.
•Aftertheplansandprogrammeshavebeenimplementedtoattainthedesiredoutcomeofthedecision,adecision-makerhastoevaluatetheactualperformancewithapurposetofindhowactualresultsreconcilewiththedesiredoutcomes.
•Differential costinghas tremendouspotential as a decisionmakingtool.
11.7 KEY WORDS
•Differential costing:Itisacostingtechniquethatexaminestheeffectsofalternativecoursesofactionontotalcosts.
•Relevant costs:Itreferstothecoststhatarepertinenttothedecisionwhichisundertheconsiderationofadecision-maker.
•Decision making: It is the process ofmaking choices betweenalternativecoursesofaction.
NOTES
Self-InstructionalMaterial 293
Differential Costing11.8 SELF ASSESSMENT QUESTIONS AND
EXERCISES
Short-Answer Questions
1.Explaintheconceptof‘DifferentialCosting’. 2.Whatissignificanceofdifferentialcostasatoolfordecisionmaking
toolinshortperiod. 3.Differentiatebetweendifferentialcostingandmarginalcosting.Discuss
alsosimilaritiesamongthetwoapproachesofcosting. 4.What do you understand by ‘Differential cost’? Discuss the
characteristicsofsuchacost.
Long-Answer Questions
1. Identifyandexaminethestepsinvolvedindecisionmakingprocess. 2.Examineanddiscusstheareasofbusinesswheredifferentialcosting
canserveastoolfoolfordecisionmaking. 3.DoubleExxLimited, amanufacturer of rubber sheets, is currently
operatingat75percentof itsproducingcapacity.Thecompany isconsideringaproposal toenhance itscurrentoperation from7,500unitsto9,000units.Thedetailsofcostandsalesperunitobtainedfromtheaccountsofthecompanyaregivenbelow:
`Sellingprice 12DirectMaterial 4Directlabour 3Expenses(60percentVariable) 3
Youarerequiredtodeterminethedifferentialcostofadditionaloutputof1,500units.
4.Acompanyisconsideringaproposalwhethertobuyormanufactureanitemthatispresentlymanufacturedinternallyandusedasacomponentbythecompanyforitsproduce.Theexistingcoststructureoftheitemisgivenbelow:
Per unit (`)Materials 20Labour(Direct) 10Expenses(40percentfixed) 6
Thecomponentisavailableinthemarketfor`29.Youarerequestedtoadvisethecompanywhetheritshouldcontinuethemanufacturingofthecomponentoritshouldpurchasethesamefromthemarket.
Differential Costing
NOTES
Self-Instructional 294 Material
5.Acompanyhasreceivedanorderfromaforeignbuyertosupply2,000units at a price `90.Thecompanywhichiscurrentlyoperatingat60percentoperatingcapacityproduces10,000units.Thecostsheetfortheexistingoutputofthecompanyisgivenbelow:
` `Directmaterials 5,00,000Wages 3,00,000Fixedoverheads:Variable 1,00,000Fixed 2,00,000
3,00,000Sellinganddistributionoverheads:Variable 2,00,000Fixed 3,00,000
5,00,000
Thesellingprice(perunit)oftheexistingoutputis`200.Youarerequiredtoadvisethecompanywhethertoacceptorrejecttheorder.
11.9 FURTHER READINGS
Sahaf,M.A.2010.Management Accounting: Principles and Practice,3rdedition.NewDelhi:VikasPublishingHouse.
Arora,M.N.2012.A textbook of Cost and Management Accounting,10thedition.NewDelhi:VikasPublishingHouse.
Maheshwari,S.N.,SuneelK.andSharadK.2018.A Textbook of Accounting for Management,4thedition.NewDelhi:VikasPublishingHouse.
NOTES
Self-InstructionalMaterial 295
Capital Budgeting: Meaning and ImportanceBLOCK - IV
METHODS OF CAPITAL BUDGETING
UNIT 12 CAPITAL BUDGETING: MEANING AND IMPORTANCE
Structure 12.0 Introduction 12.1 Objectives 12.2 CapitalBudgeting:Meaning
12.2.1 Importance 12.2.2 StepsinCapitalBudgetingProcess 12.2.3 ObjectivesofCapitalBudgetingProgrammes 12.2.4 KindsofProposals 12.2.5 AppraisalMethods
12.3 AnswersToCheckYourProgress 12.4 Summary 12.5 Key Words 12.6 SelfAssessmentQuestionsandExercises 12.7 FurtherReadings
12.0 INTRODUCTION
Thedecisionsregardingtheprocurementoffixedassetsnotonlyhavestrategicimplications for any business but also involve huge initial investment.Since the investment in such assets is usually of substantialmagnitudeandthebenefitsorservicesreceivedintheformofcashflows from theiracquisitionusuallyextendoverafairlylongperiodoftime,companiesneedto pay serious attentionoverthebudgetingofsuchexpenditures.Forabigcommercialenterprise,itmayentailmillionsofrupeesspentannuallyoninfrastructurefacilitieswhereasforasmallercommercialconcern,itmightentailtheoccasionalpurchaseforonemachinecostingseveralthousandsofrupees.Extensiveresearchandanalysisarerequiredtoaid themanagementinmakingadecisiontocommittheselargesumswhichitisassumedwillbereturnedingreatly reducedinstallmentsovermanyaccountingperiods.Infact,thesuccessofanycommercialenterprisedependslargelyuponefficientutilizationofthefixedassets.Consequently,suchdecisionsaresubjecttoasystematic evaluationprocesswhichisknownascapital budgeting.
12.1 OBJECTIVES
Aftergoingthroughthisunit,youwillbeableto: •Explainthemeaningandimportanceofcapitalbudgeting •Describethestepsinvolvedinthecapitalbudgetingprocess
Capital Budgeting: Meaning and Importance
NOTES
Self-Instructional 296 Material
•Examinetheobjectivesandtypesofproposalsincapitalbudgeting •Discusstheappraisalmethods
12.2 CAPITAL BUDGETING: MEANING
Capitalexpendituredecisionsarenotonlyrecognizedasbeingmostcriticalforthesuccessofbusinessbutalsosubjecttoasystematicevaluationprocesstechnicallyreferredtoascapitalbudgeting.Capitalbudgetingreferstothepracticeofallocatingmoney,onaregularbasis, tobeusedforacquiringcapital assets. It is a decisionmaking process used byfirms to analysethepurchaseofmajorfixedassetswhichmayincludebothtangibleassetslike building,machinery, plant and equipment and intangible assets liketechnology,patentsandtrademarks.Commentingonthenatureandscopeofcapitalbudgeting,BiermanandSmidt(2006),statethatcapitalbudgetingis a many-sided activity that includes searching for new and more profitable investment proposals, investigating engineering and marketing considerations to predict the consequences of accepting the investment, and making economic analyses to determine the profit potential of each investment proposal.Thus,capitalbudgetingisconcernedwiththeprocessofplanningandcontrollingmajorexpenditureonprojectswithlivesextendingbeyondoneyear.
Totheauthorofthisbook,capitalbudgetingis a process of long-range planning expenditure for acquiring such assets which not only require significant investment but also generate cash flows beyond one year. It is investment decision making that aims to evaluate the financial desirability of a project with the help of cash flows rather than net income as advocated by accrual accounting.Capitalbudgetingisprimarilytheplanningandcontrolofexpenditureforcapitalassets,suchas: • replacementofexistingassetstomeetgrowingdemandsofthechanging
environmentingeneralandcompetitioninparticular; • acquisitionofnewequipment,buildingorfacilitieswiththeaimto
expandexistingoperations; • developingnewtypesofproductionmethodsand technologies like
automating production system; • respondingtosomechangeinlegal,operatingandsafetyenvironment;
and • developingthefirm’scommercialwebsites.
Exhibit 12.1 Popular Definitions on Capital BudgetingWeston and Brigham (1969): Capitalbudgetinginvolvestheentireprocessofplanningexpenditureswhosereturnsareexpectedtoextendbeyondoneyear.Thechoiceofoneyearisarbitrary,ofcourse,butisacut-offpointfordistinguishingamongthevariouskindsofexpenditures.
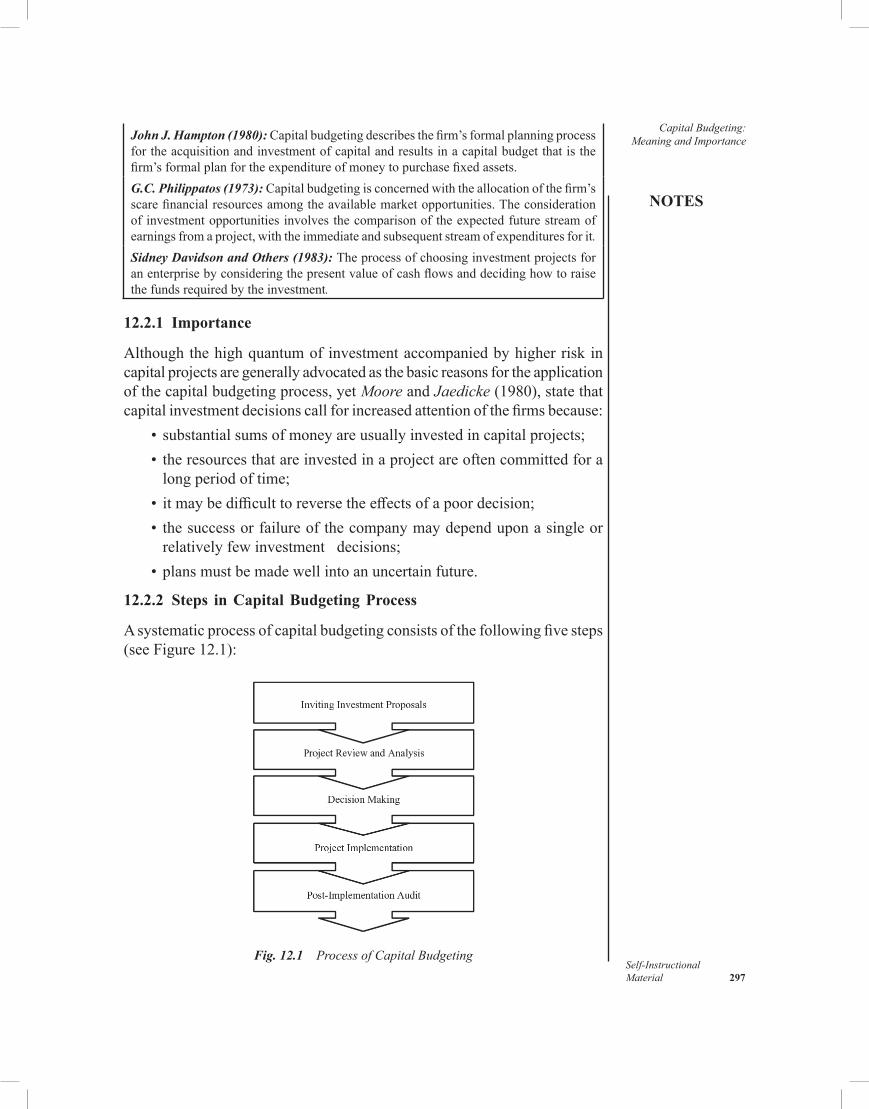
NOTES
Self-InstructionalMaterial 297
Capital Budgeting: Meaning and ImportanceJohn J. Hampton (1980): Capitalbudgetingdescribesthefirm’sformalplanningprocess
fortheacquisitionandinvestmentofcapitalandresultsinacapitalbudgetthatisthefirm’sformalplanfortheexpenditureofmoneytopurchasefixedassets.G.C. Philippatos (1973): Capitalbudgetingisconcernedwiththeallocationofthefirm’sscarefinancialresourcesamongtheavailablemarketopportunities.Theconsiderationofinvestmentopportunitiesinvolvesthecomparisonoftheexpectedfuturestreamofearningsfromaproject,withtheimmediateandsubsequentstreamofexpendituresforit.Sidney Davidson and Others (1983): Theprocessofchoosinginvestmentprojectsforanenterprisebyconsideringthepresentvalueofcashflowsanddecidinghowtoraisethefundsrequiredbytheinvestment.
12.2.1 Importance
Althoughthehighquantumof investmentaccompaniedbyhigherriskincapitalprojectsaregenerallyadvocatedasthebasicreasonsfortheapplicationofthecapitalbudgetingprocess,yetMoore and Jaedicke (1980),statethatcapitalinvestment decisionscallforincreasedattentionofthefirmsbecause: • substantialsumsofmoneyareusuallyinvestedincapitalprojects; • theresourcesthatareinvestedinaprojectareoftencommittedfora
longperiodoftime; • itmaybedifficulttoreversetheeffectsofapoordecision; • thesuccessorfailureofthecompanymaydependuponasingleor
relativelyfewinvestmentdecisions; • plansmustbemadewellintoanuncertainfuture.
12.2.2 Steps in Capital Budgeting Process
Asystematicprocessofcapitalbudgetingconsistsofthefollowingfivesteps(seeFigure12.1):
Fig. 12.1 Process of Capital Budgeting
Capital Budgeting: Meaning and Importance
NOTES
Self-Instructional 298 Material
Inviting Investment Proposals
The capital budgeting process beginswith invitation of proposals fromvarious departments of the organization. The step, in fact, providesorganizations the opportunities for investment. Project proposals need tobedesignedintunewithafirm’sstrategicplantoensureaperfectmatchbetweencorporateobjectivesandintendedoutcomeoftheproposals.Infact,investmentopportunitiescreatedbytheprojectproposalsmustcontributetoafirm’scorporategoals.Suchacontributionwouldhelptheorganizationtoassessthestrategicsignificanceoftheinvestment.Tohavesufficientandeffectiveprojectproposals,afirmmustencourage,appreciateandrewardthedepartmentstosubmitprojectproposalsthatareeffectivebothstrategicallyandprofitably.
Project Review and Analysis
Thisstepinvolvespreliminaryprojectscreeningandfinancialandcommercialviabilityof theprojects. Thenumberofprojectproposals receivedfromthedepartments is usuallymuchhigher than afirm’s available resourcesfor investment.Due to limited resources, it is not possible for afirm toconsiderallidentifiedprojectsforinvestment.Consequently,afirmneedstodevisesomecriterionthatwouldhelpafirminidentifyingthemostviableproposals for investment.Thecriteriongenerallyusedfor thispurpose isbasedonquantitativemeasureswhicharehighlyinfluencedbytheevaluators’judgements based on their intuitive feeling and experience.Once theprojectqualifiesthepreliminaryscreeningprocess,itissubjecttofinancialanalysiswhichexaminesthepotentialofaninvestmentincontributingtotheperformanceofafirm.Thetechniquesusedforsuchananalysishavebeendiscussed in thenextunit.However, thefinancial analysis involvesquantitative analysis to predict future cashflows from the projects.Theprocessofforecastingcashflowsisconsideredcrucialforinvestmentdecisionmakingprocess.
Decision Making
Thethirdstepintheprocesswillbedecisionmaking.Onthebasisofthenatureandscopeofcapitalprojects,afirmmayhavetodealwiththefollowingthreetypesofdecisions: •MutuallyExclusiveProjectDecision Inmanybusinesssituations,a
firmneedstochooseoneappropriatealternativeamongtwoormorealternativesassociatedwithacapitalproject.Forexample,auniversitymayhavetochoosebetweenconventionalande-admissionsystemsforenrollingthestudentsinitsMBAprogrammewithdifferentcoststructures and resources.The decision of the university to admitstudentsfortheprogrammethroughonesystemwouldeliminatetheuseoftheothersystem.Boththesystemsmaybeeffectiveandefficient
NOTES
Self-InstructionalMaterial 299
Capital Budgeting: Meaning and Importance
intheirownwaysbuttheuniversitycan’tacceptboth.Theuniversityneedstochooseonethatinitsopinionisthemostefficientandeffective.Suchsituations fallwithin thescopeofmutually exclusive projects whereafirmhastochooseoneoftheseveralalternativesprojects. In caseofsuchprojects,thefirmsneedtorankprojectsintermsoftheirdefinedcriteriaforthepurposesothatthemostappropriateprojectisidentifiedandselected.
• IndependentProjectDecision Itmaynotbeuncommonforfirmstofindsuchsituationswherethechoiceofoneprojectdoesnoteliminatethepossibilityofacceptanceofanother;assuchprojectsdonotcompetewitheachother.Suchprojectsaretechnicallyreferredtoasindependent projects.Forexample,auniversitymaybeconsideringproposalstoestablishitscampusesinalldifferentstatesofnorthernIndia.ItcouldchoosetoestablishcampuseseitherinallthestatesofnorthernIndia,ortosomestates,ortonone.Suchprojects,infactadvocatethephilosophyoftheaccept-reject approach tomakingdecisions.Thedecisionmakerswouldacceptall proposalsthatcouldmeettheirobjectivesandrejecttheonesthatfailtodoso.
•CapitalRationingDecision Althoughindependentprojectsarenotmutuallyexclusive,yetfirmsmayhavetorankthemforthepurposeofcapitalrationing.Generally,firmshavemoreproposalsforcapitalinvestmentsthantheyactuallycanfinance.Consequently,theyhavetorankthecapitalinvestmentproposalswithanaimtoidentifythemostprofitableonesthatcanbeactuallyfinancedfromavailableresources.Theprocessusedforthepurpose,technicallyreferredtoascapital rationing, actuallyrankstheprojectsonthebasisofpredeterminedrateofreturn.Theprocessofcapitalrationinginvolvesthefollowingtwosteps:o Rankingofproposalsfromhighesttolowestpriority;ando Selectionofcut-offpoint.Proposalsabovethecut-offaretakenup
whileasbelowit,arerejected.Theselectionofcut-offpointisanimportantdecisionwhichistakenafterdueconsiderationtothenumberoffactorslikethegoalsofthefirmandavailablefinancialresource.
Project Implementation
Aftertheprojecthasqualifiedevaluationstage,itneedstobeimplemented.Thisinvolvesexpendituresthatareincurredfortheexecutionoftheproject.Theimplementationoftheprojectmaycallfortheactiveparticipationofvariousfunctionaldepartmentsofafirm.Afirmmustmonitorimplementationoftheprojectconstantlywithanaimnotonlytoidentifyoperationalproblemsbutalsotosuggestsolutionsforsuchproblems.
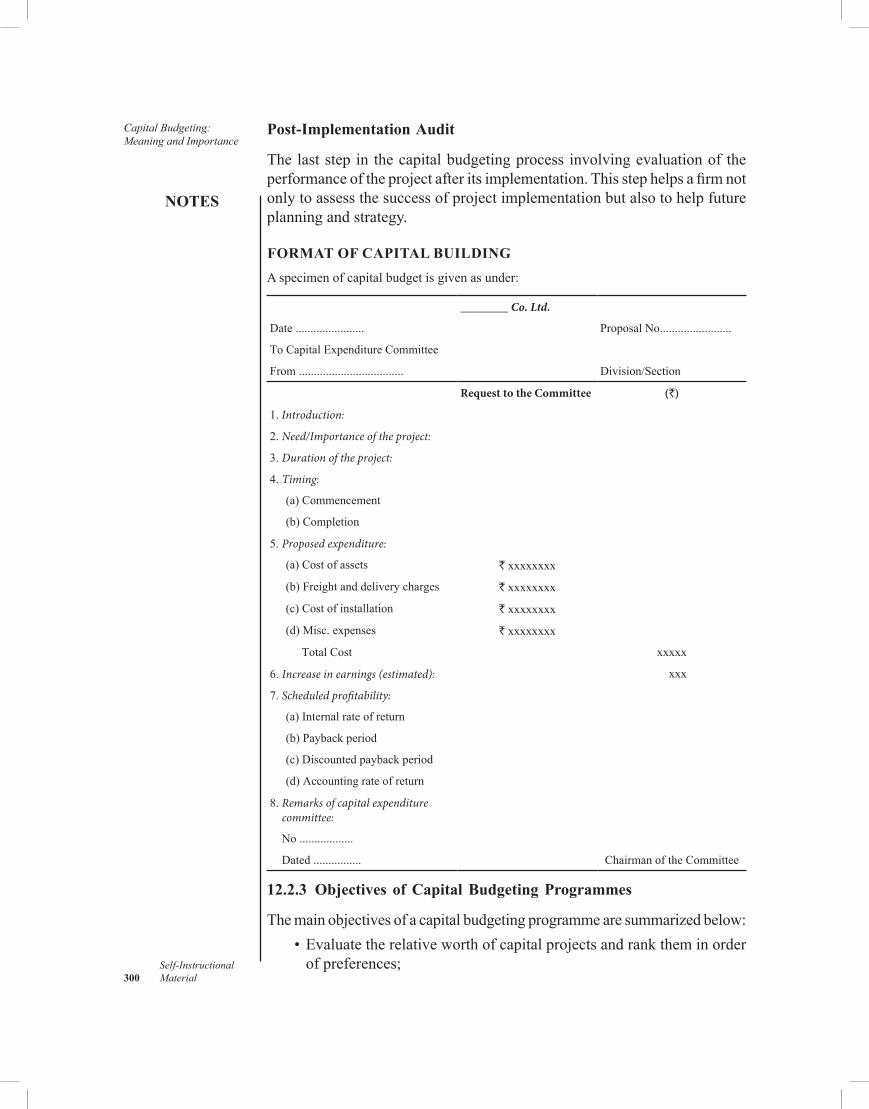
Capital Budgeting: Meaning and Importance
NOTES
Self-Instructional 300 Material
Post-Implementation Audit
Thelaststepin thecapitalbudgetingprocess involvingevaluationof theperformanceoftheprojectafteritsimplementation.Thisstephelpsafirmnotonlytoassessthesuccessofprojectimplementationbutalsotohelpfutureplanningandstrategy.
FORMAT OF CAPITAL BUILDINGAspecimenofcapitalbudgetisgivenasunder:
________ Co. Ltd.
Date ....................... ProposalNo........................
ToCapitalExpenditureCommittee
From................................... Division/Section
Request to the Committee (`)
1. Introduction:
2. Need/Importance of the project:
3. Duration of the project:
4. Timing:
(a)Commencement
(b)Completion
5. Proposed expenditure:
(a)Costofassets `xxxxxxxx
(b)Freightanddeliverycharges `xxxxxxxx
(c)Costofinstallation `xxxxxxxx
(d)Misc.expenses `xxxxxxxx
TotalCost xxxxx
6. Increase in earnings (estimated): xxx
7. Scheduled profitability:
(a)Internalrateofreturn
(b)Paybackperiod
(c)Discountedpaybackperiod
(d)Accountingrateofreturn
8. Remarks of capital expenditure committee:
No..................
Dated ................ ChairmanoftheCommittee
12.2.3 Objectives of Capital Budgeting Programmes
Themainobjectivesofacapitalbudgetingprogrammearesummarizedbelow: •Evaluatetherelativeworthofcapitalprojectsandranktheminorder
of preferences;
NOTES
Self-InstructionalMaterial 301
Capital Budgeting: Meaning and Importance
•Ensureefficientcontroloverlargeinvestmentsandexpenditures; •Provideforcashneedsformeetingcapitalprojectprogrammes; •Analyse the impact of capital expenditure on profitability of the
enterprise; • Facilitatelong-rangeplanning;and •Fixprioritiesonexpenditurebyusingthetechniquesofcapitalrationing
atthetimeofshortageofcapital,andthereby,makeoptimumuseofavailableresources.
12.2.4 Kinds of Proposals
Capitalbudgetingprocessincludesseveraldifferentproposals.Itdiffersfromfirmtofirm.However,themostcommononesare: • expansion; • replacement; • choiceofequipment;and • buyorlease.Expansion: Thequestionof expansionmay includewhether to build orpurchaseanewplant,orbuildorbuyanewfactory.Thisdecisionisconcernedwiththeestimationofcostwhichwillbeincurredandthereceiptswhichwillbeearnedfromaspecificprojectifundertaken.Replacement: Replacement programmes are essential for the overallgrowthanddevelopmentofacompanybecauserapidtechnologicalchangehasbecomeapermanent featureofcorporate life.To remaineffective inachangingbusinessenvironment,thefirmshavetointroducenewcapitalequipments.Consequently,firmshavetolookforcompetitiveadvantagesthroughasystematicapproachtothereplacementprogramme.However,littleattentionispaidbythemanagementtoreplacementdecisionsasindicatedbyvariousresearchstudiesconductedinthisarea.
Themanagement has to evaluate profitability of replacementinvestment.Such an evaluation shouldbebasedon an in-depth studyofallcostandsavingsinvolved.Thestudymustbecarefullymadesothatnofactorisoverlooked.Firmsoftenusesameevaluationprocessforreplacementdecisionswhichtheyuseforexpansiondecisions.Thisisnotahealthysignbecausetheanalysisofthesetwodecisionsdifferswitheachother.
Theanalysisofreplacementdecisiondiffersfromexpansiondecisioninthesensethatinthelatteremphasisisoncalculationofcostsandestimationofearnings over a numberofyearstocomewhereasintheformertheproblemistobedecidedwhethertoreplaceamachineatpresentoratafuturedate.Choice of Equipment: Itisconcernedwithdecisionofpurchaseofspecificitemsofequipmentinordertoproduceanewproduct.Therateofreturnoninvestmentwillgovernthepurchaseofequipment.
Capital Budgeting: Meaning and Importance
NOTES
Self-Instructional 302 Material
Buy-or-lease: Achoiceismadewhethertopurchaseorleasetherequiredequipment or building. In case of leased asset, a series of payments aremadeaftereveryspecificperiodintheshapeofrent.Thus,paymentsarespreadoveraseriesofannualrentalpayments.Sincethefirmhastomakepayments in installments, ithaspracticallyvery less immediatefinancialburden.However,theamountofrentoverthelifeoftheassetmayexceeditscostprice.Thisistheonlyseriouslimitationtothissystem.Incaseofpurchased assets, a huge initial capital is required,which eliminates theinitialpaymentatspecificintervalsoftime.Numberoftechniquesareusedtodecideaboutbuy-or-leasefacility.Themostvaluableandcommonlyusedamongthemisdiscountedcashflowanalysis.Theresultantnetcashinflowwilldiffernotonlyintotalamountbutalsointheirdistributionovertime,andbydiscountingtheseinflowsatanappropriateinterestrate,managementcandiscernwhether it isprofitable tobuyor lease.Thepresentworthoftheinflowsresultingfromleasingandbuyingarecomparedandthehigherpresentworthwillindicatethepreferablecourse,atleastfromthefinancialviewpoint.Ifthepresentworthofinflowsisaboutthesameforbuy-or-lease,managementcanputfinancialconsiderationsasideandmakeitschoiceonthebasisoffactorssuchasgreaterflexibilityandfreedomfromresponsibilityachievedthroughrenting,orbettercontrolandthepossibilityofacapitalgainachievedthroughbuying(Arustein,1976).
Apivotalfactorinbuy-or-leaseistheinterestrateatwhichthefutureinflows are discounted. In essence, this should be the rate atwhich thecompanycanordoesborrowlong-termfunds.Someexpertsarguethatcashinflowsinbuy-or-leaseanalysisshouldbediscountedattheminimumrateofreturnexpectedbythecompany.
Leasing has become a commonly acceptedmethod of obtainingpracticallyany typeofequipmentusedby thefirms.Unfortunately thereisnoeasyruleofthumbwhichcanbeappliedtodeterminewhenaleasingarrangementmightmakeeconomicsense.Eachleasingtransactionmustbeevaluatedinthelightofthecompany’sfinancialconditionandthetermsofthelease.Theadvantagesattributedtoleasingratherthanbuyingequipmentarenumerous,oftenredundant,andusuallyunclear.However,theadvantagesofconvenienceoftenattributedtoleasingarepurelysubjectiveandcannotbythemselvesbescrutinizedthroughquantitativeanalysis.Thisdoesnotmeanthatsubjectiveargumentsinfavourofleasingaremeaningless,butratherthatapotentiallesseeshouldaccuratelyquantifywhatitcoststoobtaintheconvenienceofleasefinancingorwhatissavedbysacrificingtheprestigeofequipmentownership.
12.2.5 Appraisal Methods
Corporateinvestmentdecisionsinvolvetheapplicationofasuitabletechniqueforthefinancialevaluationofinvestmentproposals.Thebasicapproachinanytechniquefortheevaluationofcapitalprojectinvolvescomparisonof
NOTES
Self-InstructionalMaterial 303
Capital Budgeting: Meaning and Importance
costsandbenefitsassociatedwiththeinvestmentplan.Somemethodsdefinecostsandbenefitsintermsofaccountingprofitsandsomeothersconsidercashflowsincost-benefitanalysis.Thefirmhastoselecttherightmethodofevaluation,fromamongmanyavailableones.
Variousmethods of evaluation of the capital budget have been inpractice defi ned by needs and situations. Somemethods,which aim atmeasuringshareholderwealthcreation,haveevolvedoveraperiodthroughacademiccontributionsbymanyauthorsandresearchers.Thelistofvariousmethodsandtheirvariantsare: 1.AccountingMethod:AccountingRateofReturn(ARR) 2.CashflowMethods (a)Non-discountedMethods:PayBackPeriod,ReciprocalofPBP,
LifePBP,ModifiedPaybackPeriod (b)DiscountedCash flowmethods:Net present valuemethod,
DiscountedPBP,ProfitabilityIndex,UniformAnnualSeries,NetterminalValue,SharePriceAppreciationRate,InternalRateofReturn,TerminalRateofReturn
(c)SpecialDiscountedMethods:EconomicRateofReturn,SocialRateReturn
Youwilllearnaboutthemajormethodsinthenextunit.
Check Your Progress
1.Howaredecisionsmadeformutuallyexclusiveprojects? 2.Statethedifferencebetweentheexpansionandreplacementproposal
incapitalbudgeting. 3.Whatisthemostcommonlyusedtechniquefordecisionsregarding
buy-or-leasedecision?
12.3 ANSWERS TO CHECK YOUR PROGRESS
1. Incaseofmutuallyexclusiveprojects,thefirmsneedtorankprojectsin terms of their defined criteria for the purpose so that themostappropriateprojectisidentifiedandselected.
2.Theanalysisofreplacementdecisiondiffersfromexpansiondecisioninthesensethatinthelatteremphasisisonthecalculationofcostsandestimationofearningsoveranumberofyearstocomewhereasintheformertheproblemistobedecidedwhethertoreplaceamachineat present or at a future date.
3.Themost valuable and commonly used technique for decisionsregardingbuy-or-leasedecisionisdiscountedcashflowanalysis.
Capital Budgeting: Meaning and Importance
NOTES
Self-Instructional 304 Material
12.4 SUMMARY
•Capitalexpendituredecisionsarenotonlyrecognizedasbeingmostcritical for the successofbusinessbut also subject to a systematicevaluationprocesstechnicallyreferredtoascapitalbudgeting.
•Capitalbudgetingisaprocessoflong-rangeplanningexpenditureforacquiringsuchassetswhichnotonlyrequiresignificant investmentbutalsogeneratecashflowsbeyondoneyear.Itisinvestmentdecisionmakingthataimstoevaluatethefinancialdesirabilityofaprojectwiththehelpofcashflowsratherthannetincomeasadvocatedbyaccrualaccounting.
•Asystematicprocessofcapitalbudgetingconsistsof thefollowingfivesteps:invitinginvestmentproposals,projectreviewandanalysis,decisionmaking,project implementations andpost-implementationaudit.
•Threetypesofdecisionsafirmmayhavetodealwithincludemutuallyexclusiveprojectdecision,independentprojectdecisionandcapitalrationing decision.
•Differentproposalsprocessincludesexpansion,replacement,choiceequipmentandbuyorlease.
•Differentcapitalexpenditureappraisalmethodsincludeaccounting,cashflowanddiscountedcashflowmethods.
12.5 KEY WORDS
•Capital budgeting: Itreferstothepracticeofallocatingmoney,onaregularbasis,tobeusedforacquiringcapitalassets.
•Capital rationing:Itisatechniqueinwhichprojectsarerankedonthebasisofpredeterminedrateofreturn.
12.6 SELF ASSESSMENT QUESTIONS AND EXERCISES
Short-Answer Questions
1.Mentionsomeofthecapitalassetstheplanningandcontrolofwhoseexpenditureisdonethroughcapitalbudgeting.
2.Whydocapitalinvestmentdecisionscallforincreasedattention? 3.Listthestepsinvolvedincapitalrationing. 4.Whataretheobjectivesofcapitalbudgetingprogrammes? 5.Writeashortnoteondifferentcapitalbudgetingappraisalmethods.
NOTES
Self-InstructionalMaterial 305
Capital Budgeting: Meaning and Importance
Long-Answer Questions
1.Describethestepsinthecapitalbudgetingprocess. 2. Illustrateaformatofcapitalbudgetanddiscussthekindsofproposals
underthecapitalbudgetingprocess.
12.7 FURTHER READINGS
Sahaf,M.A.2013.Management Accounting: Principles and Practice,3rdedition.NewDelhi:VikasPublishingHouse.
Arora,M.N.2012.A textbook of Cost and Management Accounting,10thedition.NewDelhi:VikasPublishingHouse.
Maheshwari,S.N.,SuneelK.andSharadK.2018.A Textbook of Accounting for Management,4thedition.NewDelhi:VikasPublishingHouse.
Appraisal Methods
NOTES
Self-Instructional 306 Material
UNIT 13 APPRAISAL METHODSStructure 13.0 Introduction 13.1 Objectives 13.2 MethodsofEvaluationorAppraisal 13.3 Non-discountedCashFlowMethod
13.3.1 PaybackandPaybackReciprocalMethod 13.3.2 AccountingRateofReturn
13.4 DiscountedCashFlow(Time-adjusted)Method 13.4.1 TheNetPresentValueMethod 13.4.2 InternalRateofReturn(IRR)Method 13.4.3 ProfitabilityIndex
13.5 PracticalProblems 13.6 AnswerstoCheckYourProgressQuestions 13.7 Summary 13.8 Key Words 13.9 SelfAssesmentQuestionsandExercises 13.10 FurtherReadings
13.0 INTRODUCTION
Differentapproachesareusedforevaluatingrelativeworthofalternativeinvestmentprojectswhichincludebothqualitativeandquantitativeanalysis.Qualitativeanalysismayrecognizenon-monetaryfactorslikesocialbenefits,quality,safety,flexibility,andthelikeintheevaluationofcapitalproposals.Quantitativeanalysisdeterminestheworthofinvestmentprojectsonthebasisofmonetaryfactorslikeinvestment,rateofreturn,economiclife,incometax,etc.Todealwiththisrathermixedsituation,commercialconcernsutilizeoneofthesoundapproachesfordeterminingtherelativeorabsoluteprofitabilityof all capitalproposals that areup for consideration.Havingmade thesecomputations,proposalsarelistedinthedescendingorderofprofitability.
13.1 OBJECTIVES
After goingthroughthisunit,youwillbeableto: • ExplainthePaybackperiodandAccountingrateofreturnmethods • Discuss theDiscounted cashflowmethods includingNet present value,
ProfitabilityindexandInternalrateofreturn
13.2 METHODS OF EVALUATION OR APPRAISAL
Manydifferent techniqueshavebeendevelopedtohelpexecutives in theevaluationofcapitalprojects.Suchtechniquesrangefromthosethatrepresentroughapproximationstothosethatarerelativelyprecise.Sometechniques
NOTES
Self-InstructionalMaterial 307
Appraisal Methodstake the timevalue ofmoney into accountwhile others ignore it in theprocessofevaluation.Themethodsthatdonottakethetimevalueofmoneyintoaccountaresimple tousebecause theydonot involvepresentvaluecomputation.Accordingly,evaluationtechniquescanbebroadlyclassifiedintotwogeneralcategories,namely: •Non-discountedcashflowmethods
o paybacko paybackreciprocalando accounting rate of return.
•Discountedcashflowmethodso netpresentvalueo internalrateofreturnando profitabilityindex.
13.3 NON-DISCOUNTED CASH FLOW METHOD
Inthissection,youwilllarnaboutnon-discountedcashflowmethod.
13.3.1 Payback and Payback Reciprocal Method
Paybackmethodwhichisnotonlyoneoftheoldestmethodsbutalsomostpopularmethodofevaluatinginvestmentproposalsinvolvesthecalculationof thespanof timerequired torecover initialcash investment. Infact, itdeterminesthepaybackperiodwhichisthelengthoftimethatelapsesbeforetotalcumulativecashinflows(aftertaxbeforedepreciation)fromtheprojectequaltheinitialcashoutlaysfortheproject.Theformulaforthepaybackperiod is as under:
Thus, the computation of payback period requires informationlike initialcostof theproject (investment)andnetcash inflowsfromtheinvestment.Thenetcashinflowsrepresenttheamountofprofitaftertaxbutbefore depreciation.
Assume that investment (project cost)of` 4,00,000 is expected toproduceannualreturns(cashinflows)of`50,000fortenyears.Nosalvagerecoveryisexpectedfromtheinvestmentattheendofthetenyears.Theinitialinvestmentwillberecoveredineightyears,ascalculatedbelow:
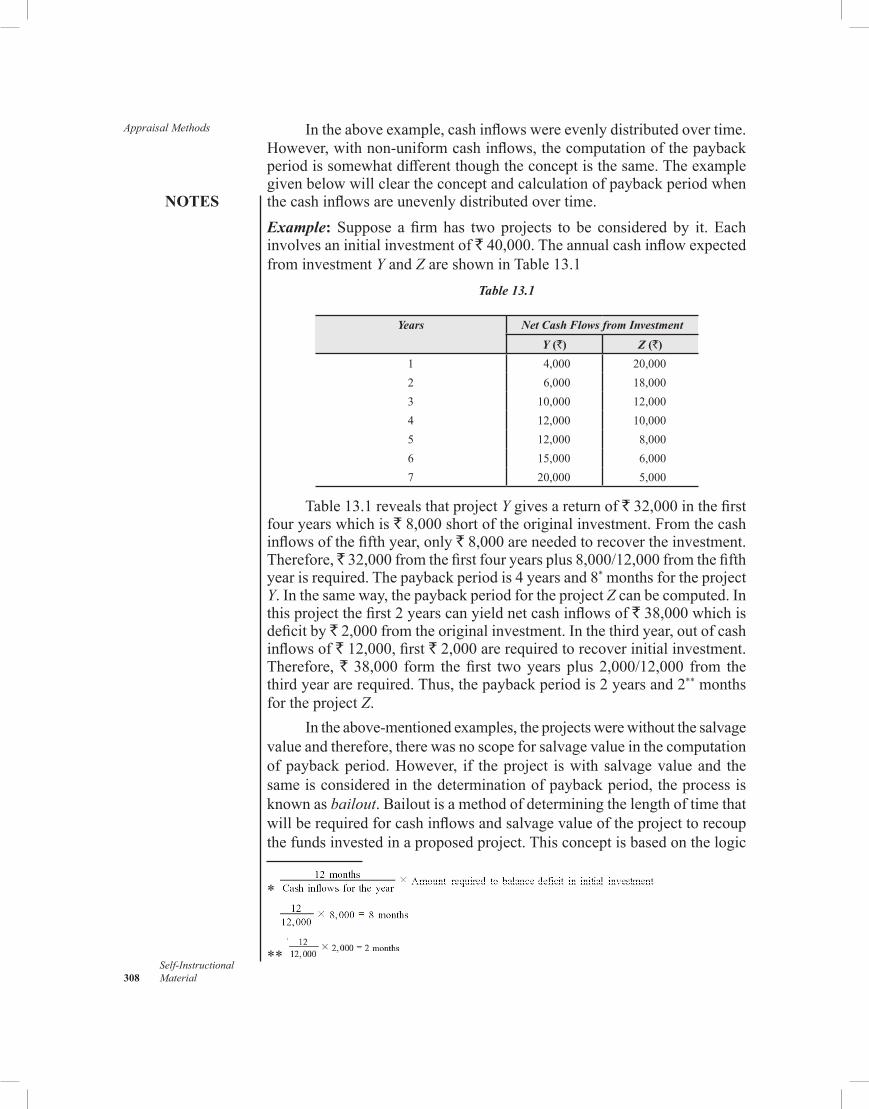
Appraisal Methods
NOTES
Self-Instructional 308 Material
In theaboveexample,cashinflowswereevenlydistributedovertime.However,withnon-uniformcashinflows,thecomputationofthepaybackperiodissomewhatdifferentthoughtheconceptisthesame.Theexamplegivenbelowwillcleartheconceptandcalculationofpaybackperiodwhenthecashinflowsareunevenlydistributedovertime.Example: Suppose afirmhas twoprojects to be consideredby it.Eachinvolvesaninitialinvestmentof`40,000.Theannualcashinflowexpectedfrom investment Y and ZareshowninTable13.1
Table 13.1
Years Net Cash Flows from Investment
Y (`) Z (`)
1 4,000 20,0002 6,000 18,0003 10,000 12,0004 12,000 10,0005 12,000 8,0006 15,000 6,0007 20,000 5,000
Table13.1revealsthatprojectY gives a return of `32,000inthefirstfouryearswhichis`8,000shortoftheoriginalinvestment.Fromthecashinflowsofthefifthyear,only`8,000areneededtorecovertheinvestment.Therefore, 32,000fromthefirstfouryearsplus8,000/12,000fromthefifthyearisrequired.Thepaybackperiodis4yearsand8*monthsfortheprojectY.Inthesameway,thepaybackperiodfortheprojectZ can be computed. In thisprojectthefirst2yearscanyieldnetcashinflowsof`38,000whichisdeficitby`2,000fromtheoriginalinvestment.Inthethirdyear,outofcashinflowsof`12,000,first`2,000arerequiredtorecoverinitialinvestment.Therefore,` 38,000 form thefirst twoyears plus 2,000/12,000 from thethirdyeararerequired.Thus,thepaybackperiodis2yearsand2**monthsfortheprojectZ.
Intheabove-mentionedexamples,theprojectswerewithoutthesalvagevalueandtherefore,therewasnoscopeforsalvagevalueinthecomputationofpaybackperiod.However, if theproject iswithsalvagevalueand thesameisconsideredinthedeterminationofpaybackperiod,theprocessisknownasbailout.Bailoutisamethodofdeterminingthelengthoftimethatwillberequiredforcashinflowsandsalvagevalueoftheprojecttorecoupthefundsinvestedinaproposedproject.Thisconceptisbasedonthelogic
*
**
NOTES
Self-InstructionalMaterial 309
Appraisal Methodsthataproposedprojecthasasalvagevalueattheexpiryoftheprojectand,therefore,adueconsiderationmustbegiventothisvalueintheevaluationofcapitalprojects.Infact,itisanextensionofthepaybackmethod.
The paybackmethod suggests the ranking of projects accordingto the lengthof timethey take topayback their initialcosts. Infact, themanagementdecidesbeforehandthemaximumpaybackperiod,i.e.,‘cut-off period’,beyondwhichaprojectisrejected.Cut-off period denotedtherisktolerancelevelinthefirm.Aprojectwithashortpaybackperiodinvolveslessriskthantheonewithalongerpayback.Therefore,managementalwaysprefers to acceptprojectswithquickpaybackbecause the short paybackperiodinrelationtotheeconomiclifewouldalsoindicatehighprofitabilityof a project.However, it is not always true because sometimes projectswithshorterpaybackperiodsmaybelessprofitableascomparedtolongerpaybackprojects.
Another glaringweakness of the payback period as a device forevaluatinginvestmentisthatitfailstoconsiderwhetherthecashinflowsareunevenlydistributedovertime.Thismethodalsodoesnottakeintoaccountthetimevalueofmoney.Thislapsecanbebridgedbyanimprovedmethodofpaybacktechnique—‘Discounted payback method’ whichrecognizesthetimeperiodrequiredtoequatecumulatedpresentvalueofcashinflowswiththepresentvalueofcashoutflowsintheevaluationofcapitalprojects.Itconsiderstheamountoftimerequiredtoconvertthenetpresentvalueofaprojectfromnegativetopositiveratherthanthetimerequiredtorecovertheactualinvestmentoftheproject.Theperiodwherethenetpresentvalueoftheproject’scashflowsamountstozeroisknownasthebreak-even period. Theperioduptobreak-evenperiodisthe‘discounted payback period’.Thebreak-evenperiodbecomestheevaluationcriterionfortheselectionoftheprojects.Theprojectswithshorterdiscountedpaybackperiodarepreferred.
Further,noconsiderationisgiventocashinflowsafterthepaybackdateunderpaybackmethod.Asa result, ithammerscapitalprojects thatyieldsmallcashinflowsintheirearlyyearsandheavycashinflowsintheirlateryears.However,toovercomethis,drawbackexpertshavedevelopedaspecialdeviceknownas‘post payback profitability index’ whichisaratiobetweenpostpaybackprofitsandinvestment.Theprojectwithhigherratioisconsideredcommerciallymoreviable.Anotherlimitationofthepaybackperiodmethodistodecideaboutcut-offperiod.Mostofthesecriticismstemfromtheemphasisthatthepaybackmethodplacesonliquidityratherthanprofitability;thischaracterisitsprimaryweakness(RosellandFrasure,1980).
Nevertheless,theuttersimplicityofthepaybackperiodmethodmakesitattractivetomanypersons,particularlynon-financialpeople.Payback Reciprocal: Thismethodattemptstoestimatetheinternalrateofreturn.Thepaybackreciprocalsarecalculatedbydividingannualcashinflow
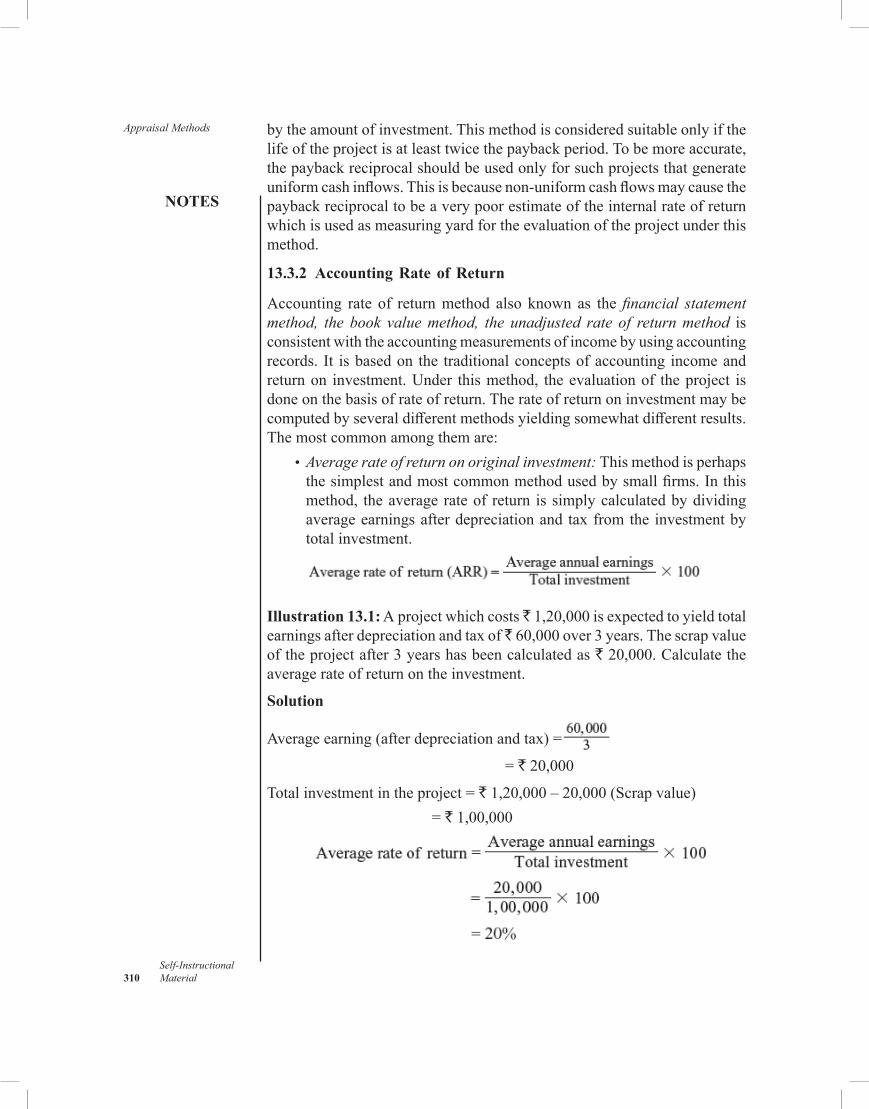
Appraisal Methods
NOTES
Self-Instructional 310 Material
bytheamountofinvestment.Thismethodisconsideredsuitableonlyifthelifeoftheprojectisatleasttwicethepaybackperiod.Tobemoreaccurate,thepaybackreciprocalshouldbeusedonlyforsuchprojectsthatgenerateuniformcashinflows.Thisisbecausenon-uniformcashflowsmaycausethepaybackreciprocaltobeaverypoorestimateoftheinternalrateofreturnwhichisusedasmeasuringyardfortheevaluationoftheprojectunderthismethod.
13.3.2 Accounting Rate of Return
Accounting rate of returnmethod also known as thefinancial statement method, the book value method, the unadjusted rate of return method is consistentwiththeaccounting measurements of income by using accounting records. It isbasedon the traditionalconceptsofaccounting income and returnon investment.Under thismethod, theevaluationof theproject isdoneonthebasisofrate ofreturn.Therateofreturnoninvestmentmaybecomputedbyseveraldifferentmethodsyieldingsomewhat differentresults.Themostcommonamongthemare: • Average rate of return on original investment: Thismethodisperhaps
thesimplestandmostcommonmethodusedbysmallfirms.Inthismethod, theaveragerateof return issimplycalculatedbydividingaverageearningsafterdepreciationandtaxfromthe investmentbytotalinvestment.
Illustration 13.1:Aprojectwhichcosts 1,20,000isexpectedtoyieldtotalearningsafterdepreciationandtaxof 60,000over3years.Thescrapvalueoftheprojectafter3yearshasbeencalculatedas`20,000.Calculatetheaveragerateofreturnontheinvestment.
Solution
Averageearning(afterdepreciationandtax)=
= `20,000
Totalinvestmentintheproject=`1,20,000–20,000(Scrapvalue) = `1,00,000
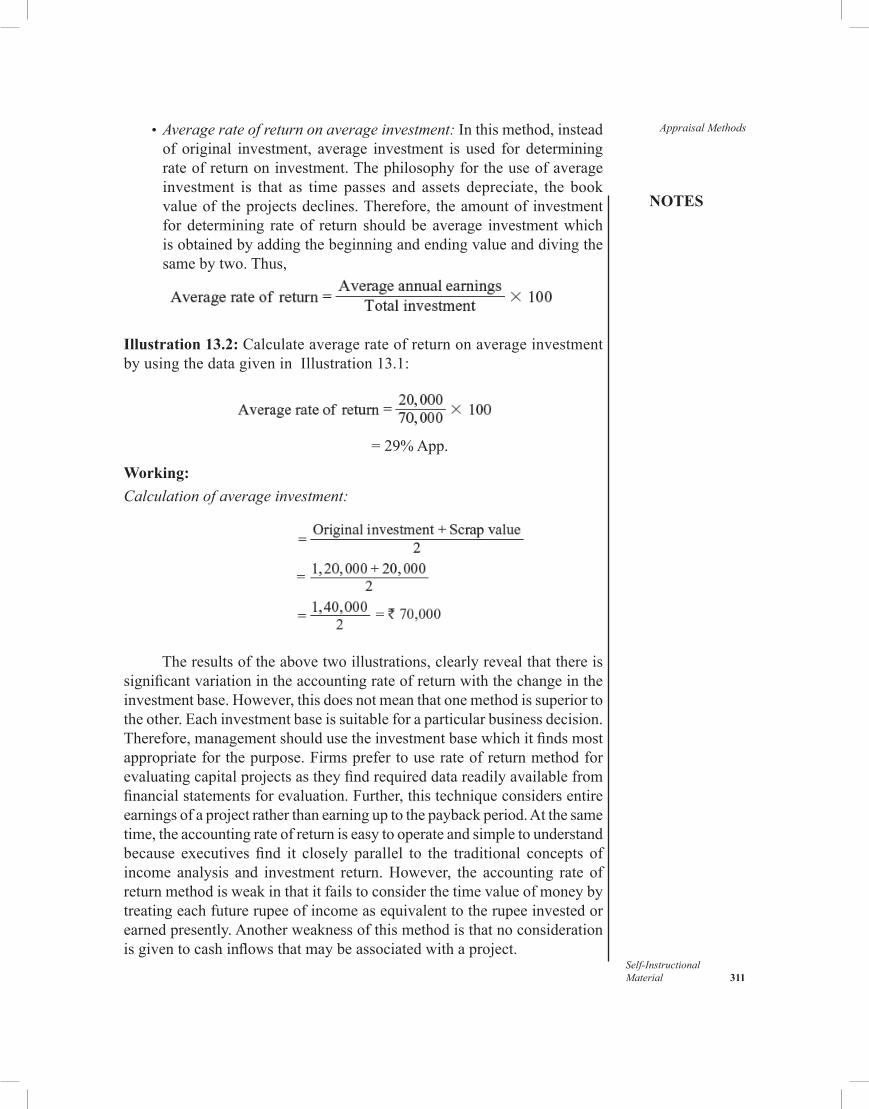
NOTES
Self-InstructionalMaterial 311
Appraisal Methods • Average rate of return on average investment: Inthismethod,insteadof original investment, average investment is used for determiningrateofreturnoninvestment.Thephilosophyfortheuseofaverageinvestment is that as time passes and assets depreciate, the bookvalueof theprojectsdeclines.Therefore, theamountof investmentfordetermining rateof return shouldbe average investmentwhichisobtainedbyaddingthebeginningandendingvalueanddivingthesamebytwo.Thus,
Illustration 13.2:CalculateaveragerateofreturnonaverageinvestmentbyusingthedatagiveninIllustration13.1:
=29%App.
Working:Calculation of average investment:
Theresultsoftheabovetwoillustrations,clearlyrevealthatthereissignificantvariationintheaccountingrateofreturnwiththechangeintheinvestmentbase.However,thisdoesnotmeanthatonemethodissuperiortotheother.Eachinvestmentbaseissuitableforaparticularbusinessdecision.Therefore,managementshouldusetheinvestmentbasewhichitfindsmostappropriateforthepurpose.Firmsprefertouserateofreturnmethodforevaluatingcapitalprojectsastheyfindrequireddatareadilyavailablefromfinancialstatementsforevaluation.Further,thistechniqueconsidersentireearningsofaprojectratherthanearninguptothepaybackperiod.Atthesametime,theaccountingrateofreturniseasytooperateandsimpletounderstandbecause executivesfind it closely parallel to the traditional concepts ofincome analysis and investment return.However, the accounting rate ofreturnmethodisweakinthatitfailstoconsiderthetimevalueofmoneybytreatingeachfuturerupeeofincomeasequivalenttotherupeeinvestedorearnedpresently.Anotherweaknessofthismethodisthatnoconsiderationisgiventocashinflowsthatmaybeassociatedwithaproject.
Appraisal Methods
NOTES
Self-Instructional 312 Material
Check Your Progress
1.Whatisbailout? 2.Whyshouldpaybackreciprocalmethodbeusedonlyforprojects
generatinguniformcashinflows? 3.Statethephilosophybehindtheaveragerateofreturnonaverage
investment.
13.4 DISCOUNTED CASH FLOW (TIME-ADJUSTED) METHOD
Thediscountedcashflowsmethoddealswithactualcashflowinsteadoftheaccountingconceptofincome.Itrecognizesthetimevalueofmoneyandclaimsthatarupeeinhandtodaypossessesmoreworththanarupeetobereceivedinfuture.Theamountofmoneytobereceivedinthefutureisnotequivalenttothesameamountofmoneyheldatthepresenttimebecauseofthedifferenceintime.Thedifferenceinthevalueoftwoamountsofthetwodifferentperiodsrepresentstheinterests,whichisthecostofmoneytotheborrowerandareturntothelender.Onthispleathediscountedcashflowmethoddiscountsmoneydueinthefuturetocompensatefortheinterestitcouldearnifitwereavailabletodayinstead.Thediscountedvalueiscalledthepresentworth.Thisconcept isobviouslysignificant forevaluationofcapitalprojectbyensuringthattheamountofinvestmentisnotmorethanthepresentvalueofthefuturecashreceipts.Thisisdonebydiscountingfuturecashreceiptstopresentvalue.
Thediscountedcashflowmodelisbasedonthefollowingassumption:• Thecashinflowsfromaprojectoccurattheendofeachperiod;• The cost of capital—cost of funds obtained from investors—is
determinable;and• Therateofinterestusedisrelevantforthelifeoftheproject.This
would alsomean that the cash inflows canbe reinvested at thediscounting rate.
Themajor techniques of discounted cashflowmethod have beendiscussedbelow:
13.4.1 The Net Present Value Method
Thenetpresentvaluemethodattemptstodiscountthecashflowsofaprojecttotheirpresentvalueusingapre-determineddiscountraterepresentingthecostofcapital***.Thismethodaimstofindthenetpresentvalueoftheproject
***Thecostofcapitalisatechnicaltermusedbywritersonbusinessfinancetorefertotheratewhichafirmmust earn on its investments
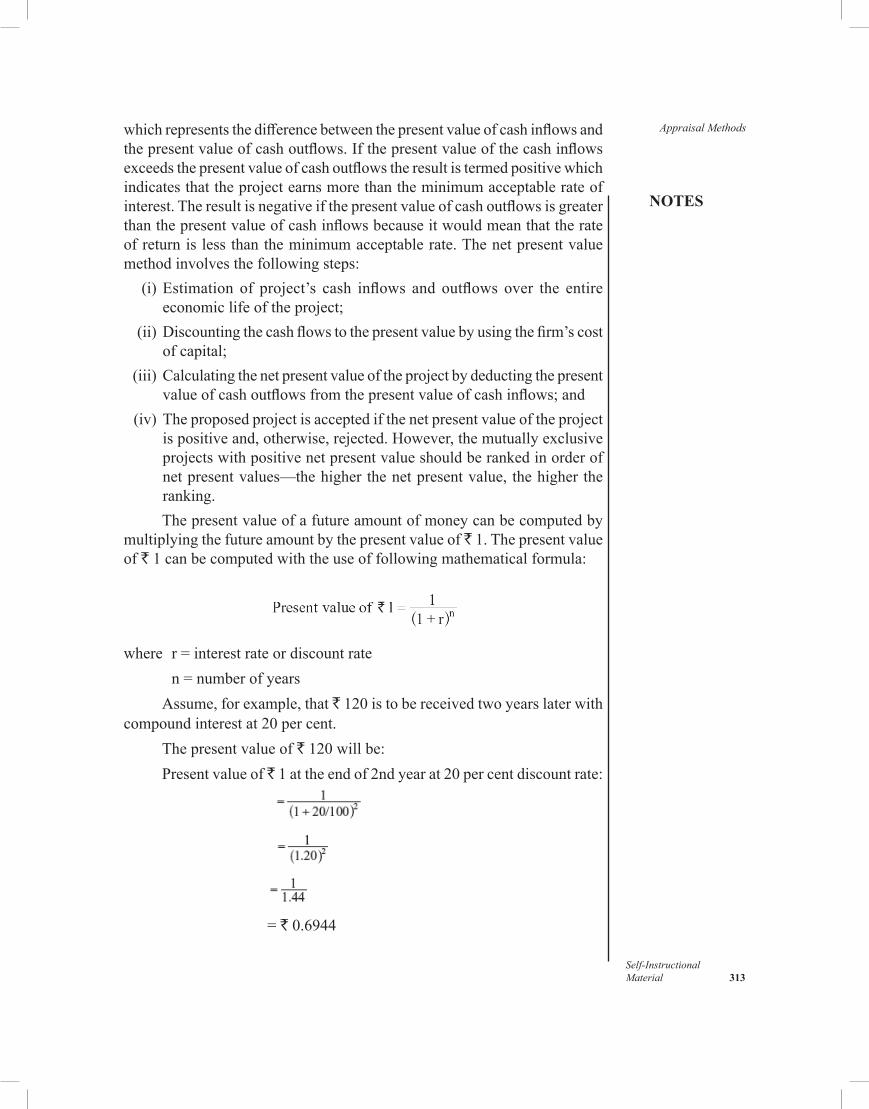
NOTES
Self-InstructionalMaterial 313
Appraisal Methodswhichrepresentsthedifferencebetweenthepresentvalueofcashinflowsandthepresentvalueofcashoutflows.Ifthepresentvalueofthecashinflowsexceedsthepresentvalueofcashoutflowstheresultistermedpositivewhichindicatesthattheprojectearnsmorethantheminimumacceptablerateofinterest.Theresultisnegativeifthepresentvalueofcashoutflowsisgreaterthanthepresentvalueofcashinflowsbecauseitwouldmeanthattherateofreturnislessthantheminimumacceptablerate.Thenetpresentvaluemethodinvolvesthefollowingsteps: (i)Estimation of project’s cash inflows and outflows over the entire
economiclifeoftheproject; (ii)Discountingthecashflowstothepresentvaluebyusingthefirm’scost
ofcapital; (iii)Calculatingthenetpresentvalueoftheprojectbydeductingthepresent
valueofcashoutflowsfromthepresentvalueofcashinflows;and (iv)Theproposedprojectisacceptedifthenetpresentvalueoftheproject
ispositiveand,otherwise,rejected.However,themutuallyexclusiveprojectswithpositivenetpresentvalueshouldberankedinorderofnetpresentvalues—thehigher thenetpresentvalue, thehigher theranking.Thepresentvalueofafutureamountofmoneycanbecomputedby
multiplyingthefutureamountbythepresentvalueof`1.Thepresentvalueof `1canbecomputedwiththeuseoffollowingmathematicalformula:
where r= interest rate or discount rate n = number of years
Assume,forexample,that`120istobereceivedtwoyearslaterwithcompound interest at 20 per cent.
Thepresentvalueof`120willbe:Presentvalueof`1attheendof2ndyearat20percentdiscountrate:
= ` 0.6944
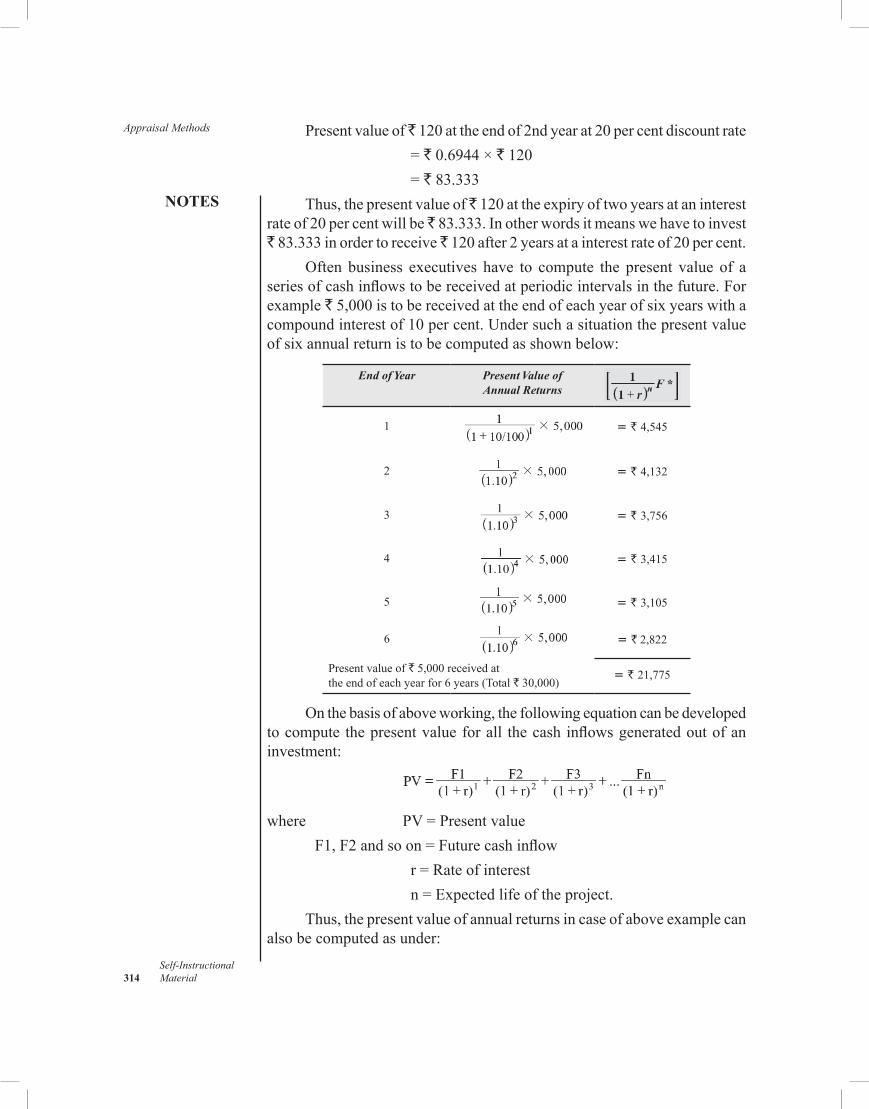
Appraisal Methods
NOTES
Self-Instructional 314 Material
Presentvalueof 120attheendof2ndyearat20percentdiscountrate = ` 0.6944 × ` 120 = ` 83.333Thus,thepresentvalueof 120attheexpiryoftwoyearsataninterest
rateof20percentwillbe 83.333.Inotherwordsitmeanswehavetoinvest` 83.333 in order to receive 120 after 2 years at a interest rate of 20 per cent.
Often business executives have to compute the present value of aseriesofcashinflowstobereceivedatperiodicintervalsinthefuture.Forexample`5,000istobereceivedattheendofeachyearofsixyearswithacompoundinterestof10percent.Undersuchasituationthepresentvalueofsixannualreturnistobecomputedasshownbelow:
End of Year Present Value of Annual Returns
1 = ` 4,545
2 = ` 4,132
3 = ` 3,756
4 = ` 3,415
5 = ` 3,105
6 = `2,822
Presentvalueof`5,000receivedat theendofeachyearfor6years(Total`30,000)
= ` 21,775
Onthebasisofaboveworking,thefollowingequationcanbedevelopedtocompute thepresentvalueforall thecashinflowsgeneratedoutofaninvestment:
where PV=Presentvalue
F1,F2andsoon=Futurecashinflow r=Rateofinterest n=Expectedlifeoftheproject.Thus,thepresentvalueofannualreturnsincaseofaboveexamplecan
alsobecomputedasunder:
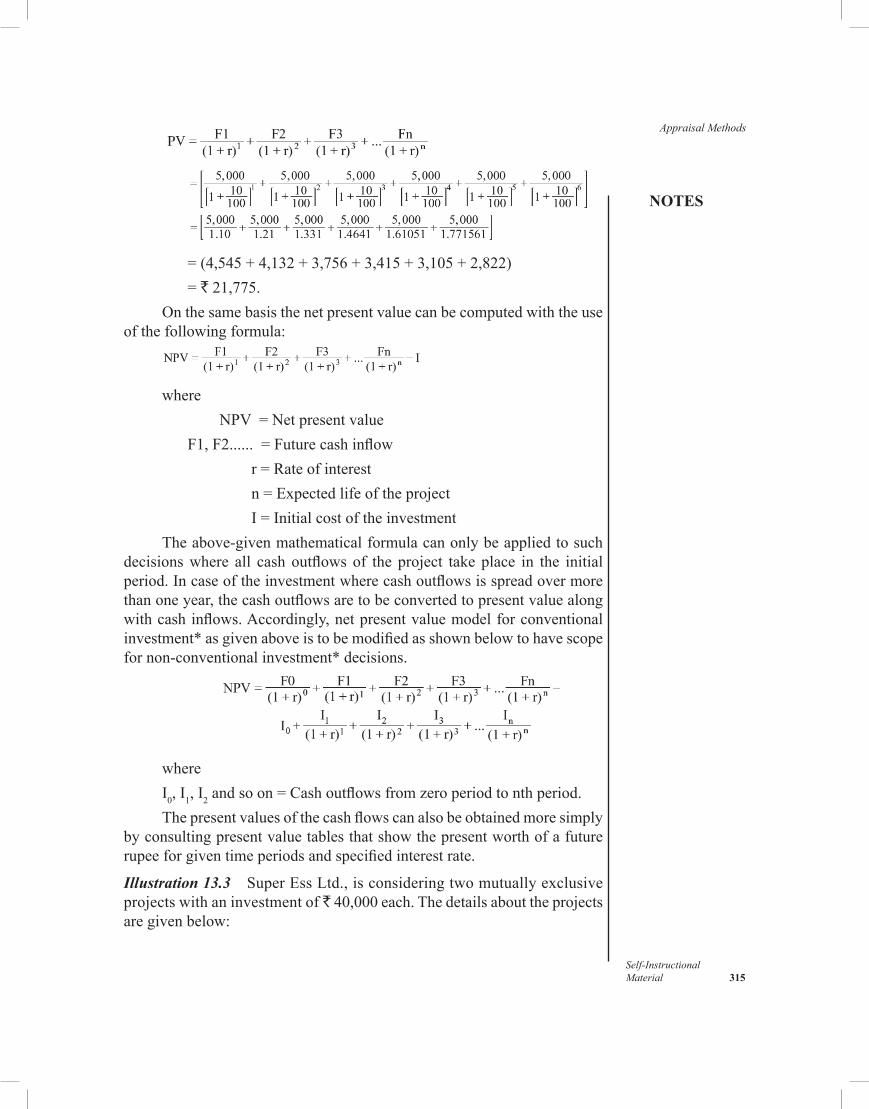
NOTES
Self-InstructionalMaterial 315
Appraisal Methods
=(4,545+4,132+3,756+3,415+3,105+2,822) = `21,775.Onthesamebasisthenetpresentvaluecanbecomputedwiththeuse
ofthefollowingformula:
where NPV=Netpresentvalue F1,F2......=Futurecashinflow r=Rateofinterest n=Expectedlifeoftheproject I=InitialcostoftheinvestmentTheabove-givenmathematicalformulacanonlybeappliedtosuch
decisionswhere all cashoutflowsof the project takeplace in the initialperiod.Incaseoftheinvestmentwherecashoutflowsisspreadovermorethanoneyear,thecashoutflowsaretobeconvertedtopresentvaluealongwithcashinflows.Accordingly,netpresentvaluemodelforconventionalinvestment*asgivenaboveistobemodifiedasshownbelowtohavescopefornon-conventionalinvestment*decisions.
whereI0,I1,I2andsoon=Cashoutflowsfromzeroperiodtonthperiod.Thepresentvaluesofthecashflowscanalsobeobtainedmoresimply
byconsultingpresentvaluetablesthatshowthepresentworthofafuturerupeeforgiventimeperiodsandspecifiedinterestrate.
Illustration 13.3 SuperEssLtd.,isconsideringtwomutuallyexclusiveprojectswithaninvestmentof`40,000each.Thedetailsabouttheprojectsaregivenbelow:
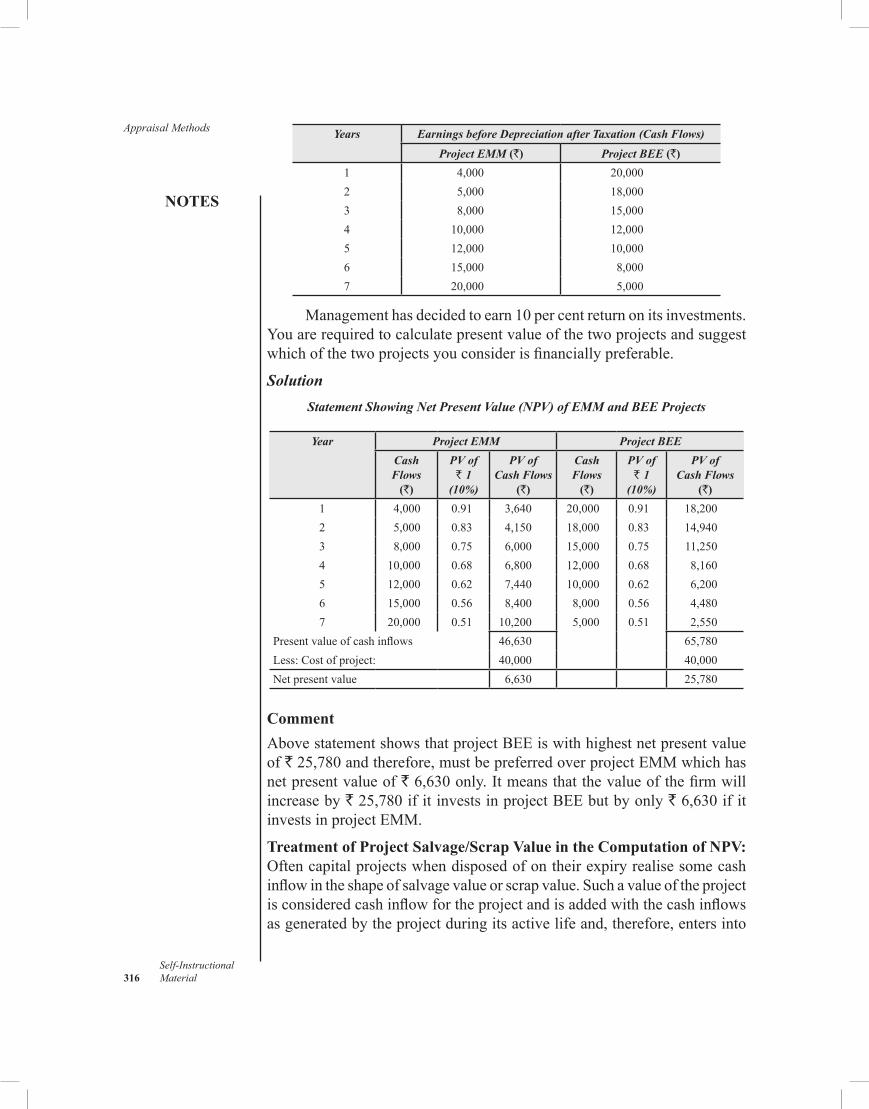
Appraisal Methods
NOTES
Self-Instructional 316 Material
Years Earnings before Depreciation after Taxation (Cash Flows)
Project EMM (`) Project BEE (`)
1 4,000 20,0002 5,000 18,0003 8,000 15,0004 10,000 12,0005 12,000 10,0006 15,000 8,0007 20,000 5,000
Managementhasdecidedtoearn10percentreturnonitsinvestments.Youarerequiredtocalculatepresentvalueofthetwoprojectsandsuggestwhichofthetwoprojectsyouconsiderisfinanciallypreferable.
SolutionStatement Showing Net Present Value (NPV) of EMM and BEE Projects
Year Project EMM Project BEE
Cash Flows
(`)
PV of ` 1
(10%)
PV of Cash Flows
(`)
Cash Flows
(`)
PV of ` 1
(10%)
PV of Cash Flows
(`)
1 4,000 0.91 3,640 20,000 0.91 18,2002 5,000 0.83 4,150 18,000 0.83 14,9403 8,000 0.75 6,000 15,000 0.75 11,2504 10,000 0.68 6,800 12,000 0.68 8,1605 12,000 0.62 7,440 10,000 0.62 6,2006 15,000 0.56 8,400 8,000 0.56 4,4807 20,000 0.51 10,200 5,000 0.51 2,550
Presentvalueofcashinflows 46,630 65,780Less: Cost of project: 40,000 40,000Netpresentvalue 6,630 25,780
CommentAbovestatementshowsthatprojectBEEiswithhighestnetpresentvalueof `25,780andtherefore,mustbepreferredoverprojectEMMwhichhasnetpresentvalueof`6,630only.Itmeansthatthevalueofthefirmwillincrease by `25,780ifitinvestsinprojectBEEbutbyonly`6,630ifitinvestsinprojectEMM.
Treatment of Project Salvage/Scrap Value in the Computation of NPV: Oftencapitalprojectswhendisposedofontheirexpiryrealisesomecashinflowintheshapeofsalvagevalueorscrapvalue.Suchavalueoftheprojectisconsideredcashinflowfortheprojectandisaddedwiththecashinflowsasgeneratedbytheprojectduringitsactivelifeand,therefore,entersinto
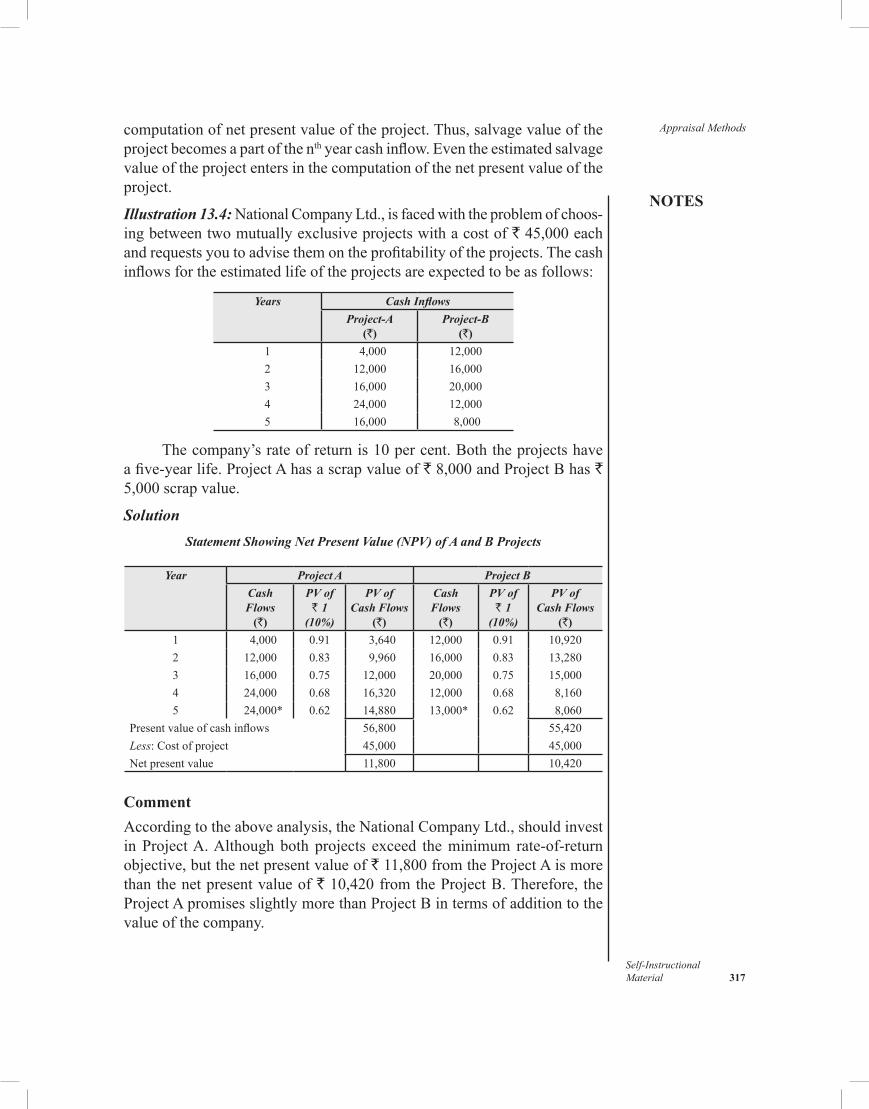
NOTES
Self-InstructionalMaterial 317
Appraisal Methodscomputationofnetpresentvalueoftheproject.Thus,salvagevalueoftheprojectbecomesapartofthenthyearcashinflow.Eventheestimatedsalvagevalueoftheprojectentersinthecomputationofthenetpresentvalueoftheproject.
Illustration 13.4:NationalCompanyLtd.,isfacedwiththeproblemofchoos-ingbetweentwomutuallyexclusiveprojectswithacostof`45,000eachandrequestsyoutoadvisethemontheprofitabilityoftheprojects.Thecashinflowsfortheestimatedlifeoftheprojectsareexpectedtobeasfollows:
Years Cash Inflows
Project-A(`)
Project-B(`)
1 4,000 12,0002 12,000 16,0003 16,000 20,0004 24,000 12,0005 16,000 8,000
Thecompany’srateofreturnis10percent.Boththeprojectshaveafive-yearlife.ProjectAhasascrapvalueof`8,000andProjectBhas` 5,000scrapvalue.
SolutionStatement Showing Net Present Value (NPV) of A and B Pro jects
Year Project A Project B
Cash Flows
(`)
PV of ` 1
(10%)
PV of Cash Flows
(`)
Cash Flows
(`)
PV of ` 1
(10%)
PV of Cash Flows
(`)
1 4,000 0.91 3,640 12,000 0.91 10,9202 12,000 0.83 9,960 16,000 0.83 13,2803 16,000 0.75 12,000 20,000 0.75 15,0004 24,000 0.68 16,320 12,000 0.68 8,1605 24,000* 0.62 14,880 13,000* 0.62 8,060
Presentvalueofcashinflows 56,800 55,420Less: Cost of project 45,000 45,000Netpresentvalue 11,800 10,420
CommentAccordingtotheaboveanalysis,theNationalCompanyLtd.,shouldinvestinProjectA.Althoughboth projects exceed theminimum rate-of-returnobjective,butthenetpresentvalueof`11,800fromtheProjectAismorethanthenetpresentvalueof`10,420fromtheProjectB.Therefore, theProjectApromisesslightlymorethanProjectBintermsofadditiontothevalueofthecompany.
Appraisal Methods
NOTES
Self-Instructional 318 Material
13.4.2 Internal Rate of Return (IRR) Method
TheseconddiscountedcashflowtechniqueofinvestmentappraisalistheInternalRateofReturnmethod.Itisalsoknownasthediscounted rate of return method, the adjusted rate of return method, investors method,andtime-adjusted rate of return method.Thismethodattemptstodeterminetherateofinterestwhichwhenappliedtothefutureincomestreamwillexactlyequatethepresentvalueofthatstreamtothepresentvalueoftheinvestment.SucharateofinterestistechnicallyknownasInternal Rate of Return.Thus,theinternalrateofreturnisthediscountratethatequatedthepresentvalueofnetbenefitsfromtheprojectwiththecostoftheproject.Insimplewords,theinternalrateofreturnisthatdiscountratewhichwillcausethenetpresentvalueoftheprojecttobeequaltozero.Thisrateisalsoknownasthe“break-even”rate.Theformulaforcalculatingtheinternalrateofreturnis:
where F1,F2andsoon= Futurecashinflow r= Rateofinterest n= Expectedlifeoftheproject I= InitialcostofinvestmentUnderthismethod,thevalueof‘r’—internalrateofreturnisunknown
whichisdeterminedinternally.Itiswiththisphilosophythatthistechniqueisknownasinternalrateofreturnmethod.
When the internal rateof return for theproject is determined, it iscomparedwiththecompany’spredeterminedrateofreturntomeasuretheprofitability of the project.The project that produces an internal rate ofreturngreaterthanthecompany’spredeterminedrateofreturn(usuallythecostofcapital)isselectedandisnormallyrejectedinothercases.Wherethemethodisusedtochoosebetweenmutuallyexclusiveprojects,theprojectthatproducesthehigherrateofreturnisselected.
Thecomputationoftheinternalrateofreturnrequiresthesamebasicdatawhich isused for thecomputationofnetpresentvalue.There isnoorganisedsystemforcalculatingtheinternalrateofreturn.Itisfoundbytrialanderror.Thepresentvalueofthecashflowsfromaninvestmentmustbecomputedat somearbitrarily selected interest rate.Where thepresentvalueofcashinflowssocomputedisequaltoinvestmentcostthatrateisselected.Normallytherateofreturnrangesbetween10percentto15percent,therefore,10percentisagoodstartpointformostoftheproblems.
NOTES
Self-InstructionalMaterial 319
Appraisal MethodsBusinessexpertshavedevelopedasystematicprocedurefordeterminingtheinternalrateofreturnwhereinafactortechnicallyknownas“factor of the time-adjusted rate of return”iscomputedbydividinginitialinvestmentbyannualcashflowi.e.,
Thefactorsocomputedshowspresentvalueof`1receivedannuallyover‘n’yearsandthushelpsexecutivestodeterminetheinternalrateofreturnoftheparticularprojectfromthepresentvalueannuitytables.Themethodcanbewellunderstoodfromthebelow-mentionedillustration.
Illustration 13.5:SuperGroupCompanyLtd.isconsideringaprojectthatcosts 22,600hasalifeof10years.Theprojectisexpectedtoyieldanannualcashflowof`4,000.Calculateinternalrateofreturn.
Solution
= 5.65Theaboveanalysisrevealsthatafactorof5.65willequatecashinflow
series of `4,000withaninitialinvestmentof`22,600.Tofindinternalrateofreturnwewillnowconsultpresentvalueannuitytables(seeAppendixTable13.1).WecaneasilyfindfromApp.Table13.1thatat12percentrateofreturnforaperiodof10years,thepresentvalueis5.650whichisexactlythefigureofthefactorwehavecomputed.Therefore,12percentrateofreturnistheinternalrateofreturnforthepresentproblem.
Theabove-explainedsystematicprocedureusedfordeterminingtheinternalrateofreturnisapplicableonlyforsuchinvestmentdecisionwhereannualcashflowsfromtheinvestmentsareuniformovertheentirelifeoftheproject.The investmentprojectswithnon-uniformannualcashflowsarenotwithinthescopeofthe‘presentvaluefactor’systemandassuchitisnotpossibletouseannuitytablestofindinternalrateofreturn.Therefore,insuchinvestments,theinternalrateofreturnisdeterminedbyhitandtrial.
Illustration 13.6:OrdinaryCompanyLtd.isconsideringpurchaseofmodernplant.Twotypesofplants—TEEandSEEareavailableinthemarketcosting`4,25,070and`3,18,030respectively.Theplantsaremutuallyexclusive.Theprofitsbeforechargingdepreciationbutafterpaymentof incometaxareasfollows:
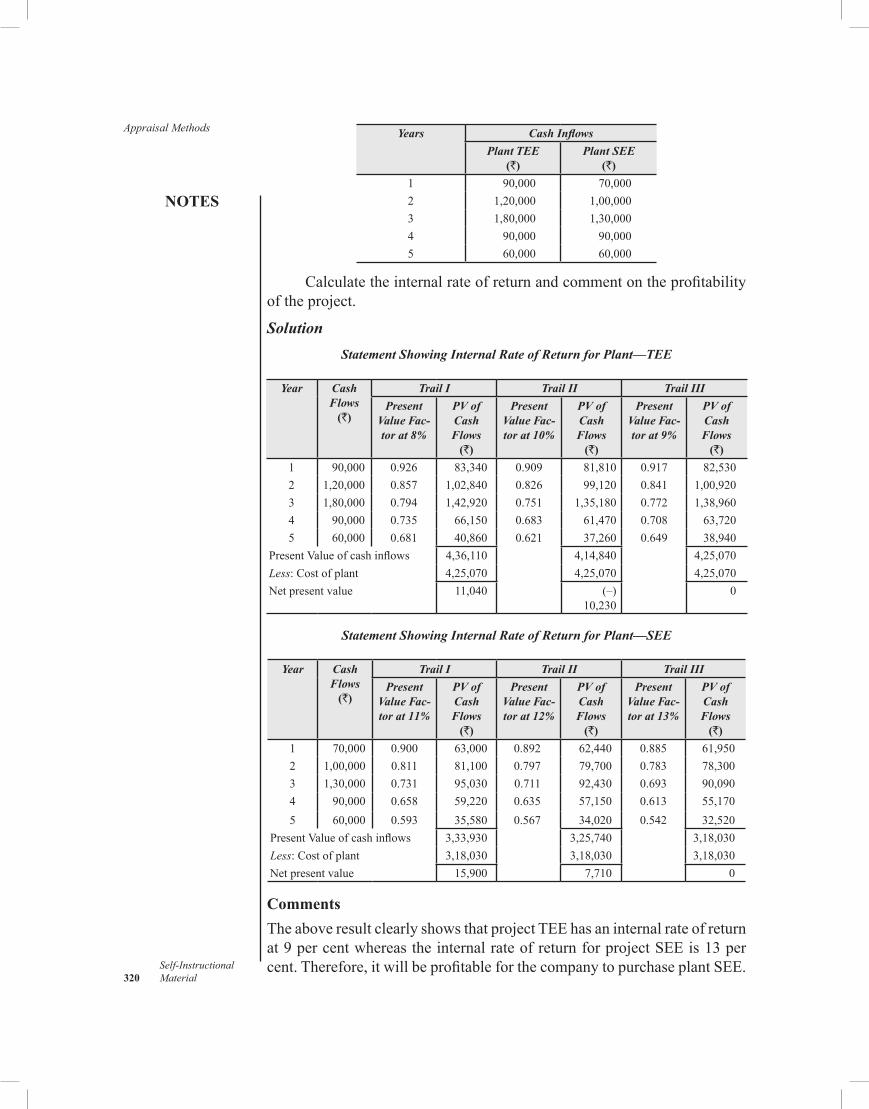
Appraisal Methods
NOTES
Self-Instructional 320 Material
Years Cash Inflows
Plant TEE(`)
Plant SEE(`)
1 90,000 70,0002 1,20,000 1,00,0003 1,80,000 1,30,0004 90,000 90,0005 60,000 60,000
Calculate the internal rate of return and comment on the profitability of the project.
SolutionStatement Showing Internal Rate of Return for Plant—TEE
Year Cash Flows(`)
Trail I Trail II Trail III
Present Value Fac-tor at 8%
PV of Cash Flows(`)
Present Value Fac-tor at 10%
PV of Cash Flows(`)
Present Value Fac-tor at 9%
PV of Cash Flows(`)
1 90,000 0.926 83,340 0.909 81,810 0.917 82,5302 1,20,000 0.857 1,02,840 0.826 99,120 0.841 1,00,9203 1,80,000 0.794 1,42,920 0.751 1,35,180 0.772 1,38,9604 90,000 0.735 66,150 0.683 61,470 0.708 63,7205 60,000 0.681 40,860 0.621 37,260 0.649 38,940
Present Value of cash inflows 4,36,110 4,14,840 4,25,070Less: Cost of plant 4,25,070 4,25,070 4,25,070Net present value 11,040 (–)
10,230 0
Statement Showing Internal Rate of Return for Plant—SEE
Year Cash Flows(`)
Trail I Trail II Trail III
Present Value Fac-tor at 11%
PV of Cash Flows(`)
Present Value Fac-tor at 12%
PV of Cash Flows(`)
Present Value Fac-tor at 13%
PV of Cash Flows(`)
1 70,000 0.900 63,000 0.892 62,440 0.885 61,9502 1,00,000 0.811 81,100 0.797 79,700 0.783 78,3003 1,30,000 0.731 95,030 0.711 92,430 0.693 90,0904 90,000 0.658 59,220 0.635 57,150 0.613 55,1705 60,000 0.593 35,580 0.567 34,020 0.542 32,520
Present Value of cash inflows 3,33,930 3,25,740 3,18,030Less: Cost of plant 3,18,030 3,18,030 3,18,030Net present value 15,900 7,710 0
CommentsThe above result clearly shows that project TEE has an inter nal rate of return at 9 per cent whereas the internal rate of return for project SEE is 13 per cent. Therefore, it will be profitable for the company to purchase plant SEE.
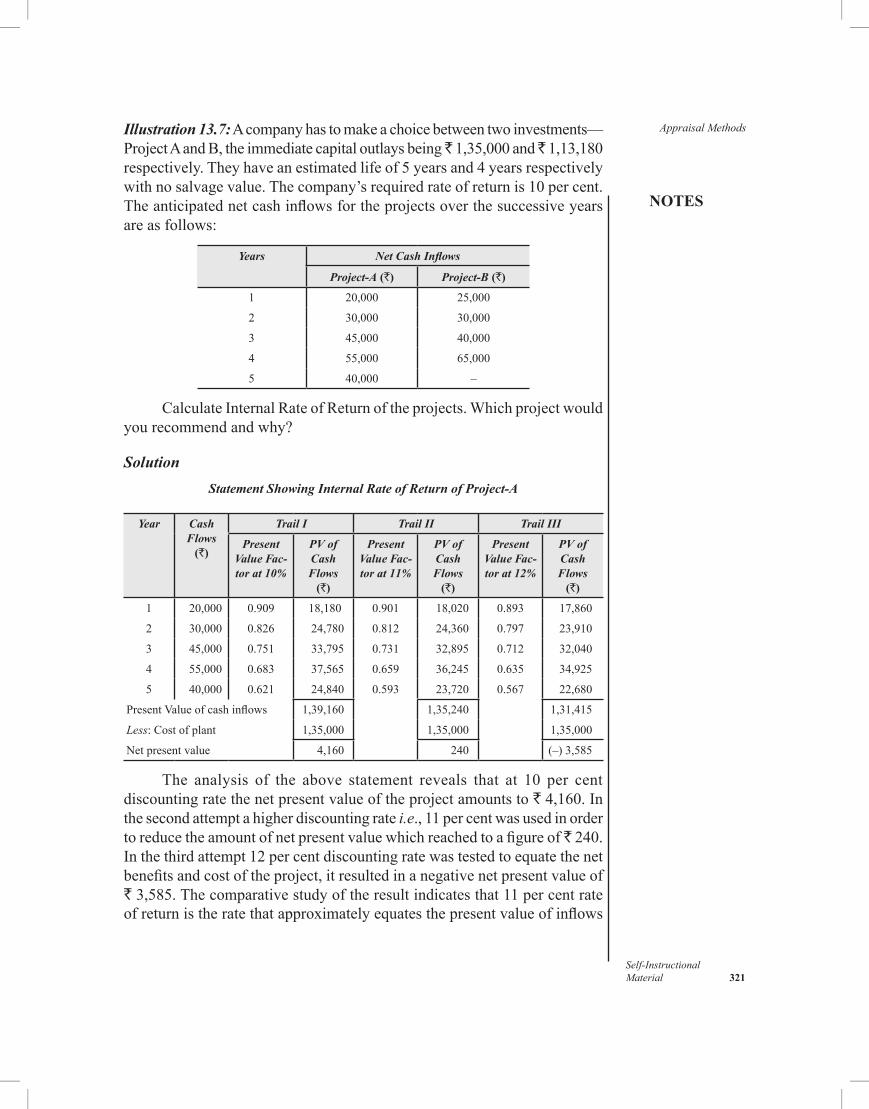
NOTES
Self-InstructionalMaterial 321
Appraisal MethodsIllustration 13.7: A company has to make a choice between two investments—Project A and B, the immediate capital outlays being 1,35,000 and 1,13,180 respectively. They have an estimated life of 5 years and 4 years respectively with no salvage value. The com pany’s required rate of return is 10 per cent. The anticipated net cash inflows for the projects over the successive years are as follows:
Years Net Cash Inflows
Project-A (`) Project-B (`)
1 20,000 25,000
2 30,000 30,000
3 45,000 40,000
4 55,000 65,000
5 40,000 –
Calculate Internal Rate of Return of the projects. Which project would you recommend and why?
SolutionStatement Showing Internal Rate of Return of Project-A
Year Cash Flows(`)
Trail I Trail II Trail III
Present Value Fac-tor at 10%
PV of Cash Flows(`)
Present Value Fac-tor at 11%
PV of Cash Flows(`)
Present Value Fac-tor at 12%
PV of Cash Flows(`)
1 20,000 0.909 18,180 0.901 18,020 0.893 17,860
2 30,000 0.826 24,780 0.812 24,360 0.797 23,910
3 45,000 0.751 33,795 0.731 32,895 0.712 32,040
4 55,000 0.683 37,565 0.659 36,245 0.635 34,925
5 40,000 0.621 24,840 0.593 23,720 0.567 22,680
Present Value of cash inflows 1,39,160 1,35,240 1,31,415
Less: Cost of plant 1,35,000 1,35,000 1,35,000
Net present value 4,160 240 (–) 3,585
The analysis of the above statement reveals that at 10 per cent discounting rate the net present value of the project amounts to ` 4,160. In the second attempt a higher discounting rate i.e., 11 per cent was used in order to reduce the amount of net present value which reached to a figure of 240. In the third attempt 12 per cent discounting rate was tested to equate the net benefits and cost of the project, it resulted in a nega tive net present value of ` 3,585. The comparative study of the result indicates that 11 per cent rate of return is the rate that approximately equates the present value of inflows
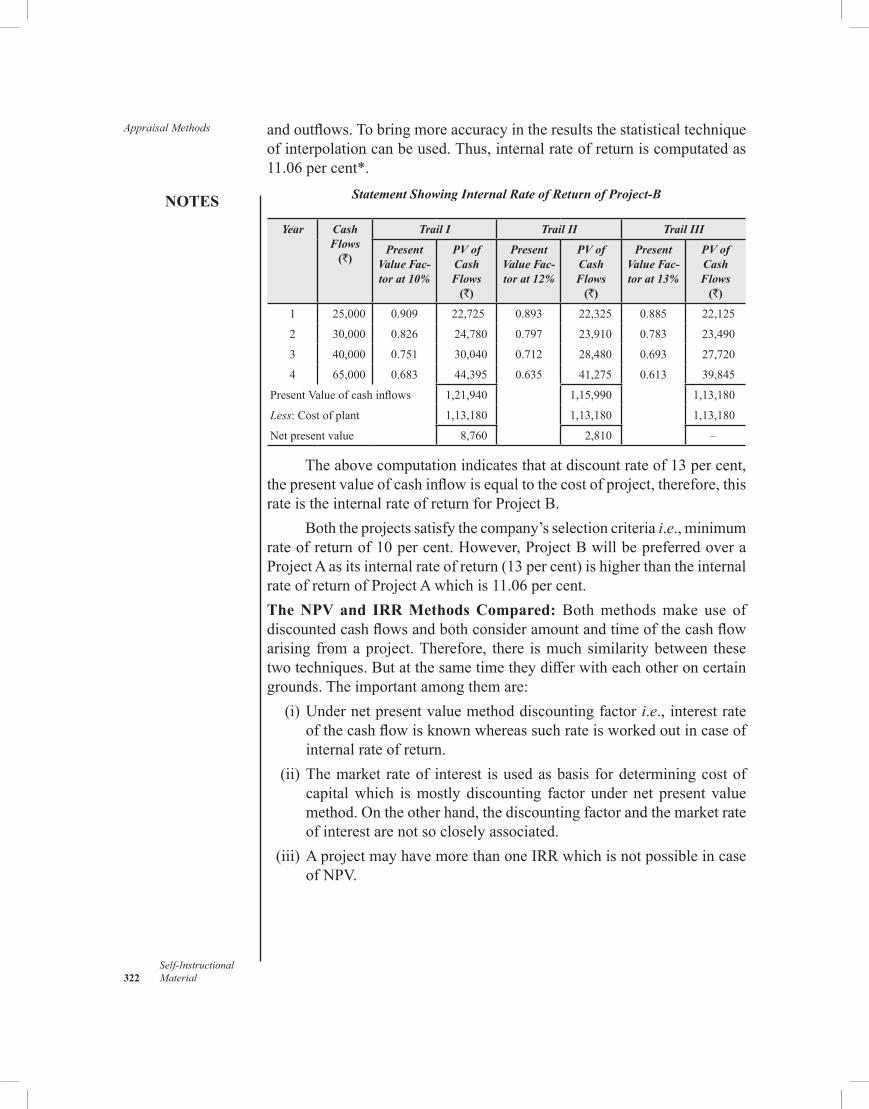
Appraisal Methods
NOTES
Self-Instructional 322 Material
andoutflows.Tobringmoreaccuracyintheresultsthestatisticaltechniqueofinterpolationcanbeused.Thus,internalrateofreturniscomputatedas11.06percent*.
Statement Showing Internal Rate of Return of Project-B
Year Cash Flows
(`)
Trail I Trail II Trail III
Present Value Fac-tor at 10%
PV of Cash Flows
(`)
Present Value Fac-tor at 12%
PV of Cash Flows
(`)
Present Value Fac-tor at 13%
PV of Cash Flows
(`)
1 25,000 0.909 22,725 0.893 22,325 0.885 22,125
2 30,000 0.826 24,780 0.797 23,910 0.783 23,490
3 40,000 0.751 30,040 0.712 28,480 0.693 27,720
4 65,000 0.683 44,395 0.635 41,275 0.613 39,845
PresentValueofcashinflows 1,21,940 1,15,990 1,13,180
Less:Costofplant 1,13,180 1,13,180 1,13,180
Netpresentvalue 8,760 2,810 –
Theabovecomputationindicatesthatatdiscountrateof13percent,thepresentvalueofcashinflowisequaltothecostofproject,therefore,thisrateistheinternalrateofreturnforProjectB.
Boththeprojectssatisfythecompany’sselectioncriteriai.e.,minimumrateofreturnof10percent.However,ProjectBwillbepreferredoveraProjectAasitsinternalrateofreturn(13percent)ishigherthantheinternalrateofreturnofProjectAwhichis11.06percent.The NPV and IRR Methods Compared: Bothmethodsmake use ofdiscountedcashflowsandbothconsideramountandtimeofthecashflowarising fromaproject.Therefore, there ismuchsimilaritybetween thesetwotechniques.Butatthesametimetheydifferwitheachotheroncertaingrounds.Theimportantamongthemare: (i)Undernetpresentvaluemethoddiscountingfactori.e.,interestrate
ofthecashflowisknownwhereassuchrateisworkedoutincaseofinternalrateofreturn.
(ii)Themarket rateof interest isusedasbasis fordeterminingcostofcapitalwhich ismostly discounting factor under net present valuemethod.Ontheotherhand,thediscountingfactorandthemarketrateofinterestarenotsocloselyassociated.
(iii)AprojectmayhavemorethanoneIRRwhichisnotpossibleincaseofNPV.
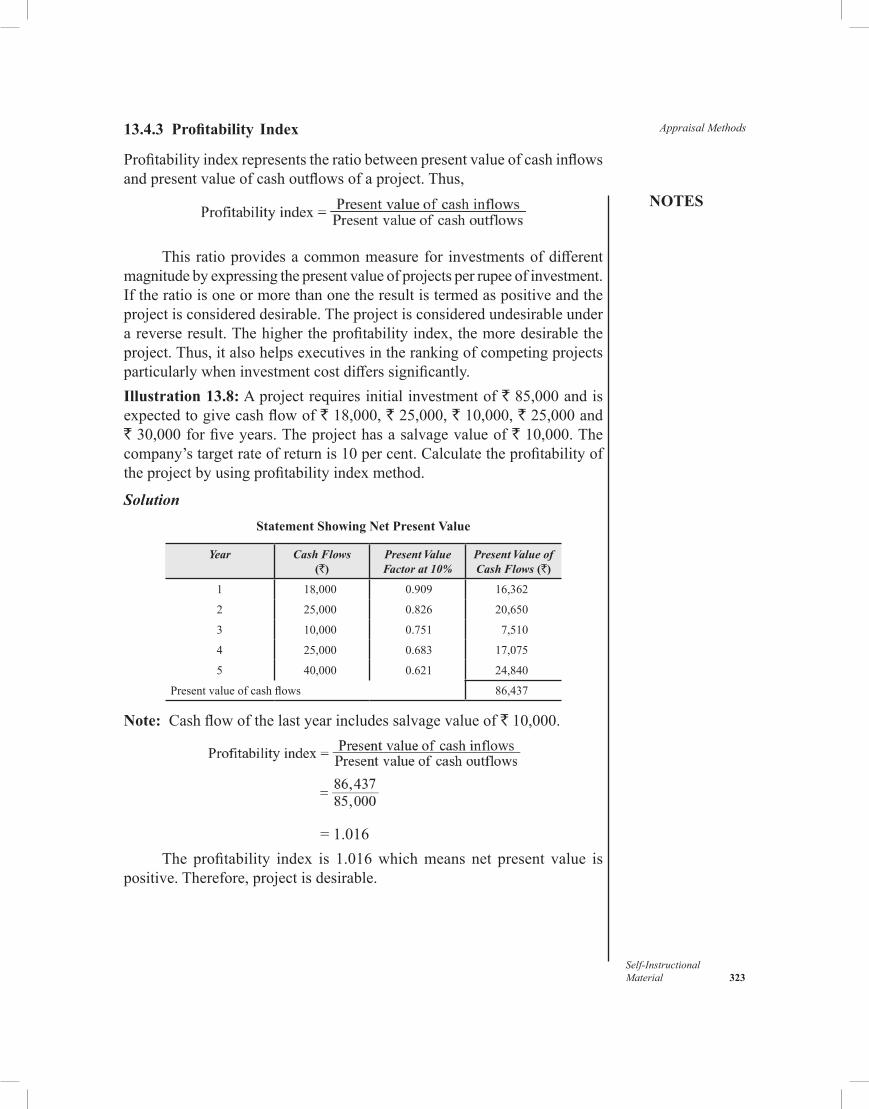
NOTES
Self-InstructionalMaterial 323
Appraisal Methods13.4.3 Profitability Index
Profitabilityindexrepresentstheratiobetweenpresentvalueofcashinflowsandpresentvalueofcashoutflowsofaproject.Thus,
This ratioprovidesacommonmeasurefor investmentsofdifferentmagnitudebyexpressingthepresentvalueofprojectsperrupeeofinvestment.Iftheratioisoneormorethanonetheresultistermedaspositiveandtheprojectisconsidereddesirable.Theprojectisconsideredundesirableunderareverseresult.Thehighertheprofitabilityindex,themoredesirabletheproject.Thus,italsohelpsexecutivesintherankingofcompetingprojectsparticularlywheninvestmentcostdifferssignificantly.Illustration 13.8:Aprojectrequiresinitialinvestmentof`85,000andisexpectedtogivecashflowof`18,000,`25,000,`10,000,`25,000and`30,000forfiveyears.Theprojecthasasalvagevalueof`10,000.Thecompany’stargetrateofreturnis10percent.Calculatetheprofitabilityoftheprojectbyusingprofitabilityindexmethod.
SolutionStatement Showing Net Present Value
Year Cash Flows(`)
Present Value Factor at 10%
Present Value of Cash Flows (`)
1 18,000 0.909 16,362
2 25,000 0.826 20,650
3 10,000 0.751 7,510
4 25,000 0.683 17,075
5 40,000 0.621 24,840
Presentvalueofcashflows 86,437
Note: Cashflowofthelastyearincludessalvagevalueof`10,000.
= 1.016The profitability index is 1.016whichmeans net present value is
positive.Therefore,projectisdesirable.
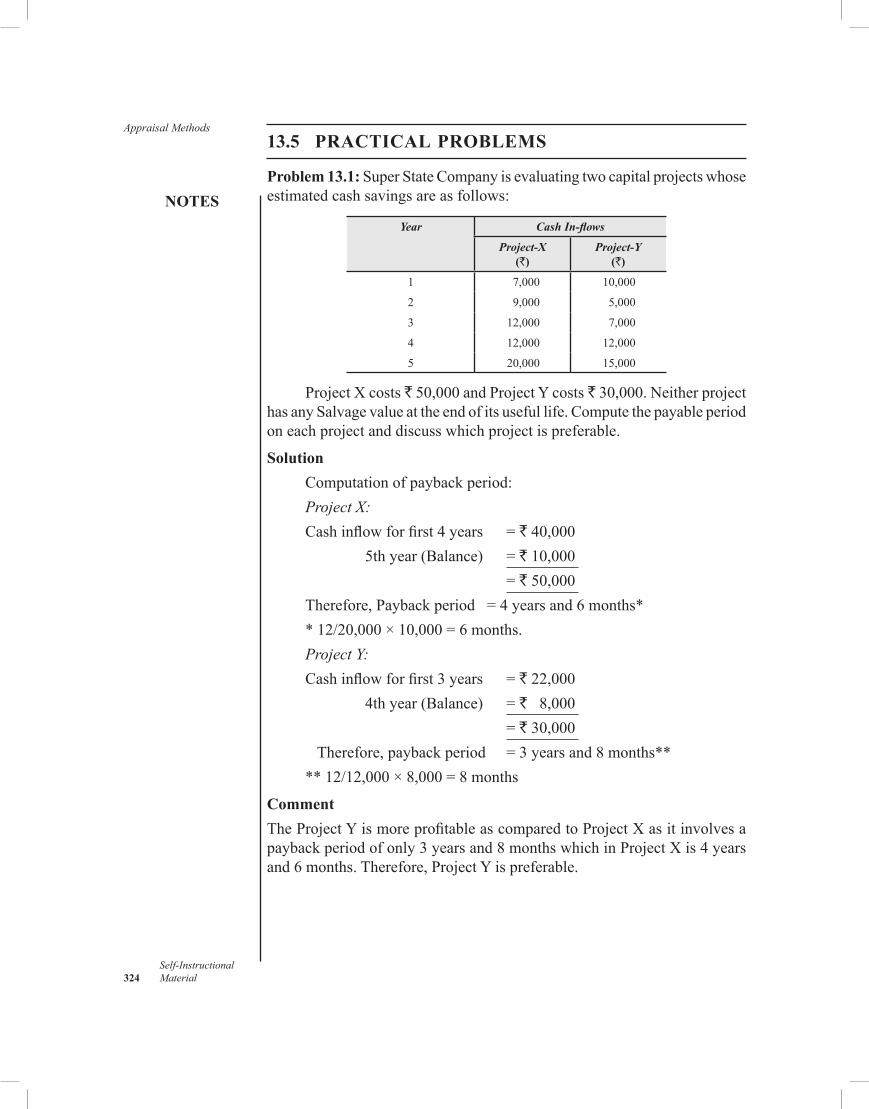
Appraisal Methods
NOTES
Self-Instructional 324 Material
13.5 PRACTICAL PROBLEMS
Problem 13.1:SuperStateCompanyisevaluatingtwocapitalprojectswhoseestimatedcashsavingsareasfollows:
Year Cash In-flows
Project-X(`)
Project-Y(`)
1 7,000 10,000
2 9,000 5,000
3 12,000 7,000
4 12,000 12,000
5 20,000 15,000
ProjectXcosts`50,000andProjectYcosts`30,000.NeitherprojecthasanySalvagevalueattheendofitsusefullife.Computethepayableperiodoneachprojectanddiscusswhichprojectispreferable.
SolutionComputationofpaybackperiod:Project X:Cashinflowforfirst4years =`40,000 5thyear(Balance) =`10,000 = `50,000Therefore,Paybackperiod =4yearsand6months**12/20,000×10,000=6months.Project Y:Cashinflowforfirst3years =`22,000 4thyear(Balance) =`8,000 = `30,000Therefore,paybackperiod =3yearsand8months****12/12,000×8,000=8months
CommentTheProjectYismoreprofitableascomparedtoProjectXasitinvolvesapaybackperiodofonly3yearsand8monthswhichinProjectXis4yearsand6months.Therefore,ProjectYispreferable.
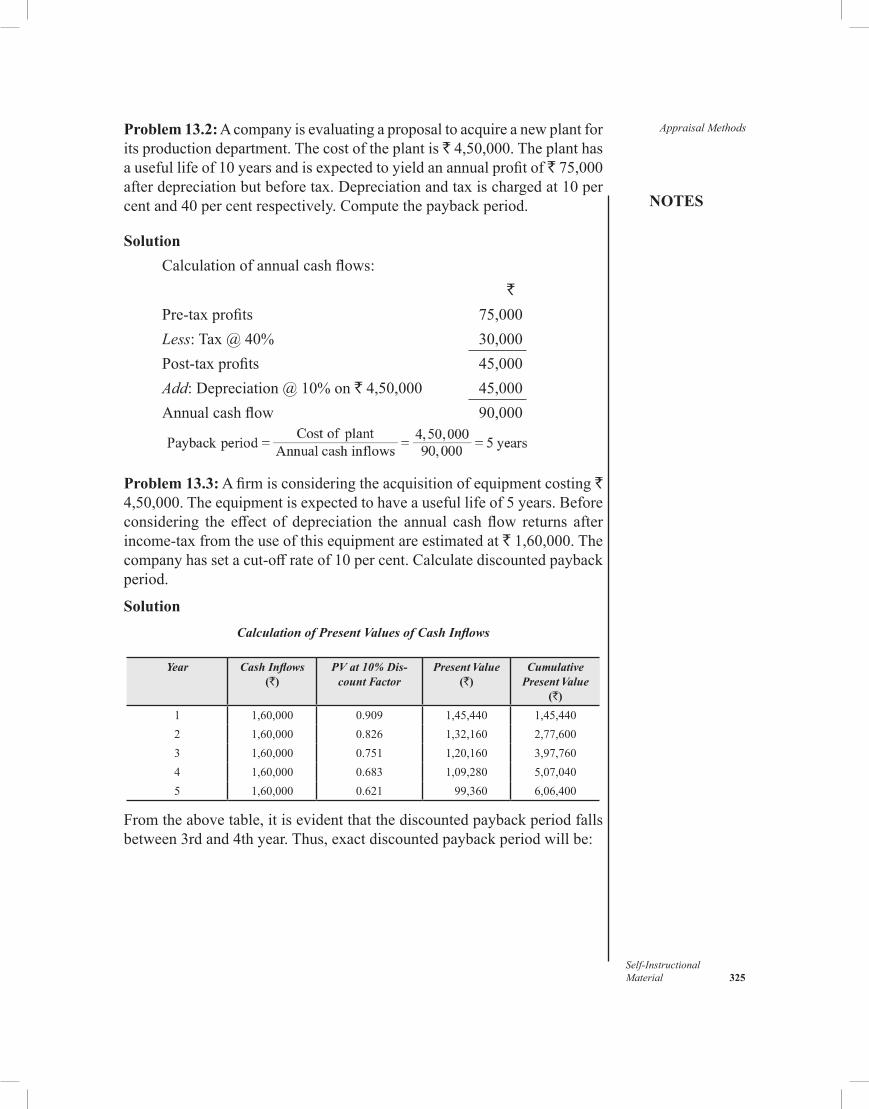
NOTES
Self-InstructionalMaterial 325
Appraisal MethodsProblem 13.2:Acompanyisevaluatingaproposaltoacquireanewplantforitsproductiondepartment.Thecostoftheplantis`4,50,000.Theplanthasausefullifeof10yearsandisexpectedtoyieldanannualprofitof`75,000afterdepreciationbutbeforetax.Depreciationandtaxischargedat10percentand40percentrespectively.Computethepaybackperiod.
SolutionCalculationofannualcashflows: `
Pre-taxprofits 75,000Less:Tax@40% 30,000Post-taxprofits 45,000Add:Depreciation@10%on`4,50,000 45,000Annualcashflow 90,000
Problem 13.3:Afirmisconsideringtheacquisitionofequipmentcosting` 4,50,000.Theequipmentisexpectedtohaveausefullifeof5years.Beforeconsidering the effect of depreciation the annual cashflow returns afterincome-taxfromtheuseofthisequipmentareestimatedat`1,60,000.Thecompanyhassetacut-offrateof10percent.Calculatediscountedpaybackperiod.
SolutionCalculation of Present Values of Cash Inflows
Year Cash Inflows(`)
PV at 10% Dis-count Factor
Present Value(`)
Cumulative Present Value
(`)
1 1,60,000 0.909 1,45,440 1,45,4402 1,60,000 0.826 1,32,160 2,77,6003 1,60,000 0.751 1,20,160 3,97,7604 1,60,000 0.683 1,09,280 5,07,0405 1,60,000 0.621 99,360 6,06,400
Fromtheabovetable,itisevidentthatthediscountedpaybackperiodfallsbetween3rdand4thyear.Thus,exactdiscountedpaybackperiodwillbe:
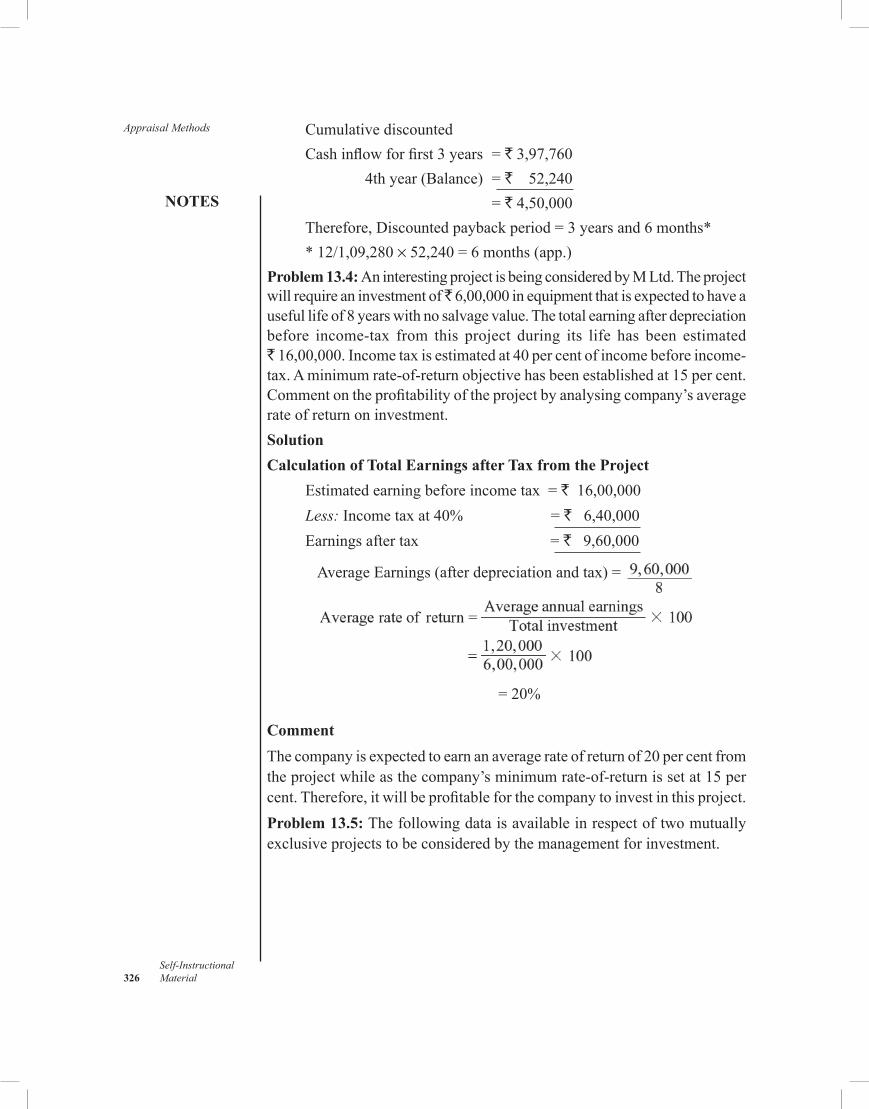
Appraisal Methods
NOTES
Self-Instructional 326 Material
CumulativediscountedCashinflowforfirst3years =`3,97,760 4thyear(Balance) =`52,240 = `4,50,000Therefore,Discountedpaybackperiod=3yearsand6months**12/1,09,280×52,240=6months(app.)
Problem 13.4: AninterestingprojectisbeingconsideredbyMLtd.Theprojectwillrequireaninvestmentof 6,00,000inequipmentthatisexpectedtohaveausefullifeof8yearswithnosalvagevalue.Thetotalearningafterdepreciationbefore income-tax from this project during its life has been estimated `16,00,000.Incometaxisestimatedat40percentofincomebeforeincome-tax.Aminimumrate-of-returnobjectivehasbeenestablishedat15percent.Commentontheprofitabilityoftheprojectbyanalysingcompany’saveragerate of return on investment.SolutionCalculation of Total Earnings after Tax from the Project
Estimatedearningbeforeincometax=`16,00,000Less:Incometaxat40% =`6,40,000Earningsaftertax = `9,60,000
AverageEarnings(afterdepreciationandtax)=
=20%
CommentThecompanyisexpectedtoearnanaveragerateofreturnof20percentfromtheprojectwhileasthecompany’sminimumrate-of-returnissetat15percent.Therefore,itwillbeprofitableforthecompanytoinvestinthisproject.Problem 13.5:Thefollowingdataisavailableinrespectoftwomutuallyexclusiveprojectstobeconsideredbythemanagementforinvestment.
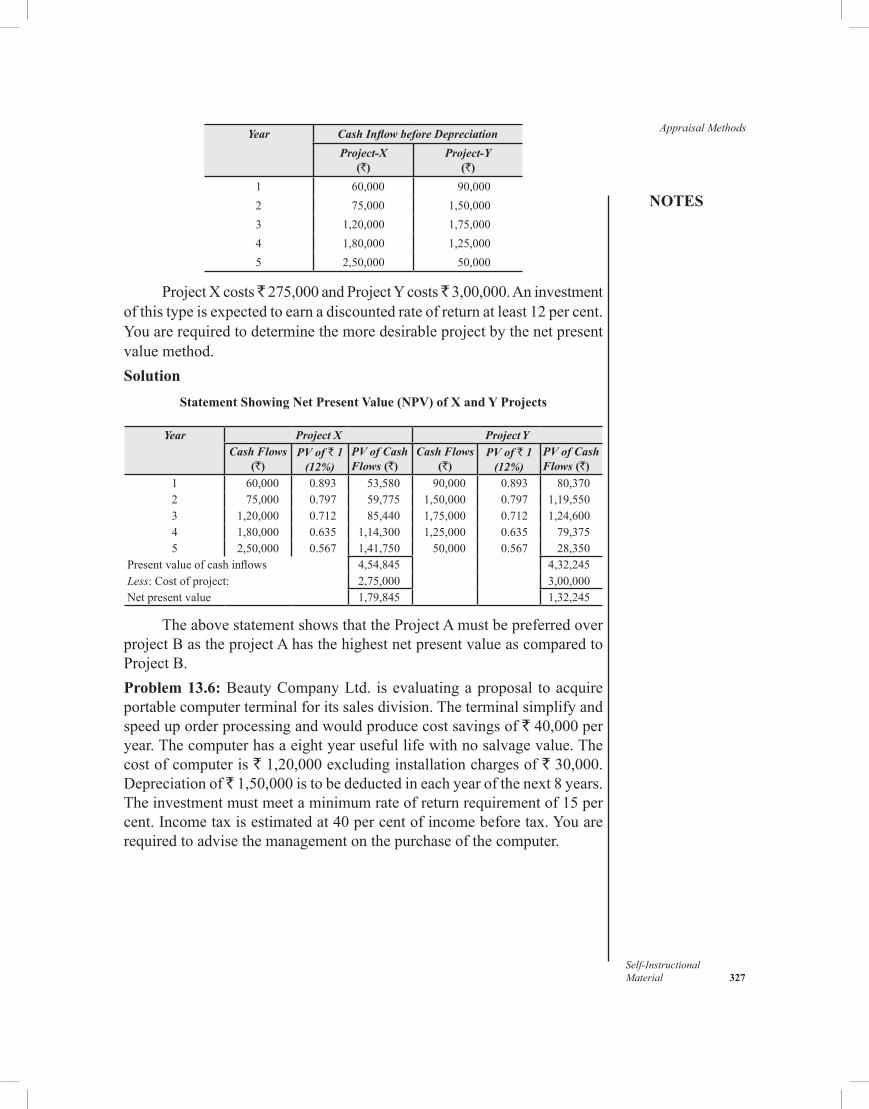
NOTES
Self-InstructionalMaterial 327
Appraisal MethodsYear Cash Inflow before Depreciation
Project-X(`)
Project-Y(`)
1 60,000 90,0002 75,000 1,50,0003 1,20,000 1,75,0004 1,80,000 1,25,0005 2,50,000 50,000
ProjectXcosts 275,000andProjectYcosts 3,00,000.Aninvestmentofthistypeisexpectedtoearnadiscountedrateofreturnatleast12percent.Youarerequiredtodeterminethemoredesirableprojectbythenetpresentvaluemethod.Solution
Statement Showing Net Present Value (NPV) of X and Y Projects
Year Project X Project Y
Cash Flows(`)
PV of ` 1 (12%)
PV of Cash Flows (`)
Cash Flows(`)
PV of ` 1 (12%)
PV of Cash Flows (`)
1 60,000 0.893 53,580 90,000 0.893 80,3702 75,000 0.797 59,775 1,50,000 0.797 1,19,5503 1,20,000 0.712 85,440 1,75,000 0.712 1,24,6004 1,80,000 0.635 1,14,300 1,25,000 0.635 79,3755 2,50,000 0.567 1,41,750 50,000 0.567 28,350
Presentvalueofcashinflows 4,54,845 4,32,245Less: Cost of project: 2,75,000 3,00,000Netpresentvalue 1,79,845 1,32,245
TheabovestatementshowsthattheProjectAmustbepreferredoverprojectBastheprojectAhasthehighestnetpresentvalueascomparedtoProjectB.Problem 13.6:BeautyCompanyLtd. isevaluatingaproposal toacquireportablecomputerterminalforitssalesdivision.Theterminalsimplifyandspeeduporderprocessingandwouldproducecostsavingsof`40,000peryear.Thecomputerhasaeightyearusefullifewithnosalvagevalue.Thecost of computer is `1,20,000excludinginstallationchargesof`30,000.Deprecia tion of 1,50,000istobedeductedineachyearofthenext8years.Theinvestmentmustmeetaminimumrateofreturnrequirementof15percent.Incometaxisestimatedat40percentofincomebeforetax.Youarerequiredtoadvisethemanagementonthepurchaseofthecomputer.
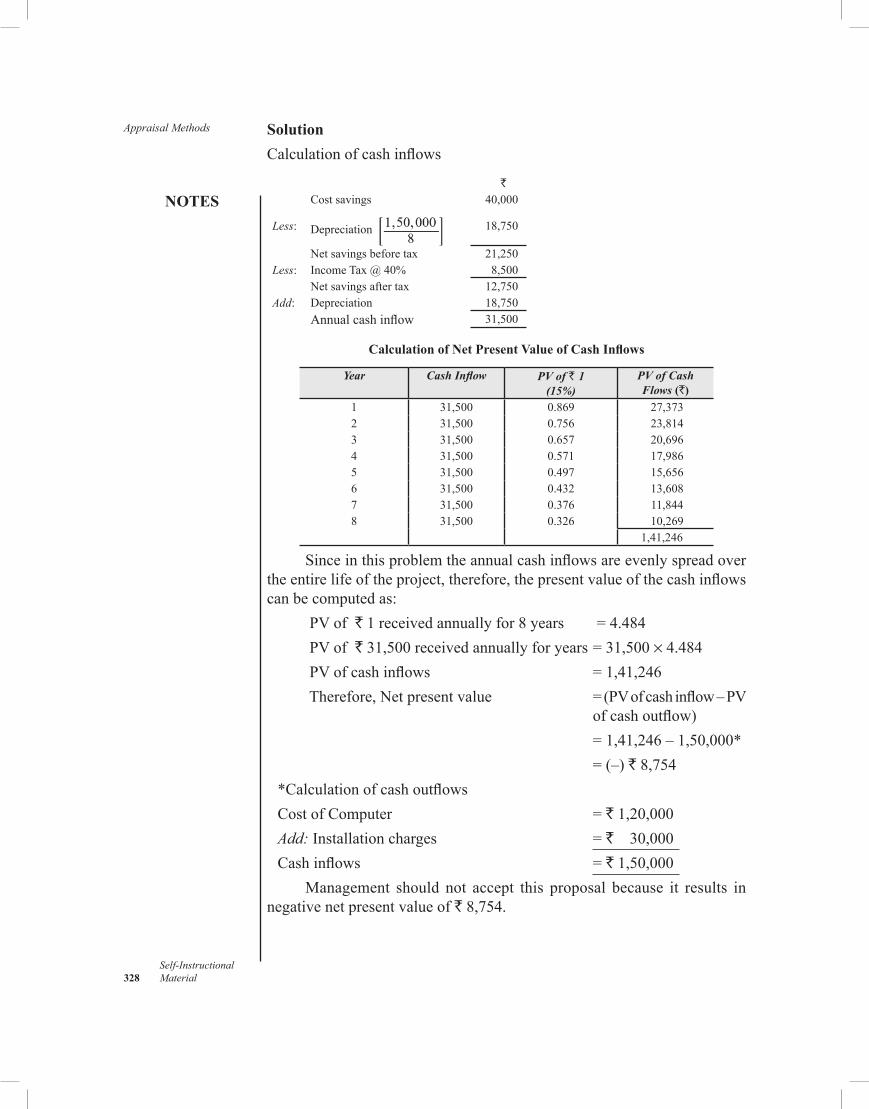
Appraisal Methods
NOTES
Self-Instructional 328 Material
SolutionCalculationofcashinflows
`Cost savings 40,000
Less: Depreciation 18,750
Netsavingsbeforetax 21,250Less: IncomeTax@40% 8,500
Netsavingsaftertax 12,750Add: Depreciation 18,750
Annualcashinflow 31,500
Calculation of Net Present Value of Cash Inflows
Year Cash Inflow PV of ` 1 (15%)
PV of Cash Flows (`)
1 31,500 0.869 27,3732 31,500 0.756 23,8143 31,500 0.657 20,6964 31,500 0.571 17,9865 31,500 0.497 15,6566 31,500 0.432 13,6087 31,500 0.376 11,8448 31,500 0.326 10,269
1,41,246
Sinceinthisproblemtheannualcashinflowsareevenlyspreadovertheentirelifeoftheproject,therefore,thepresentvalueofthecashinflowscan be computed as: PVof`1receivedannuallyfor8years =4.484 PVof`31,500receivedannuallyforyears=31,500× 4.484 PVofcashinflows =1,41,246 Therefore,Netpresentvalue =(PVofcashinflow–PV
ofcashoutflow) =1,41,246–1,50,000* =(–)`8,754*CalculationofcashoutflowsCost of Computer = `1,20,000Add:Installationcharges =`30,000Cashinflows =`1,50,000
Management should not accept this proposal because it results innegativenetpresentvalueof`8,754.
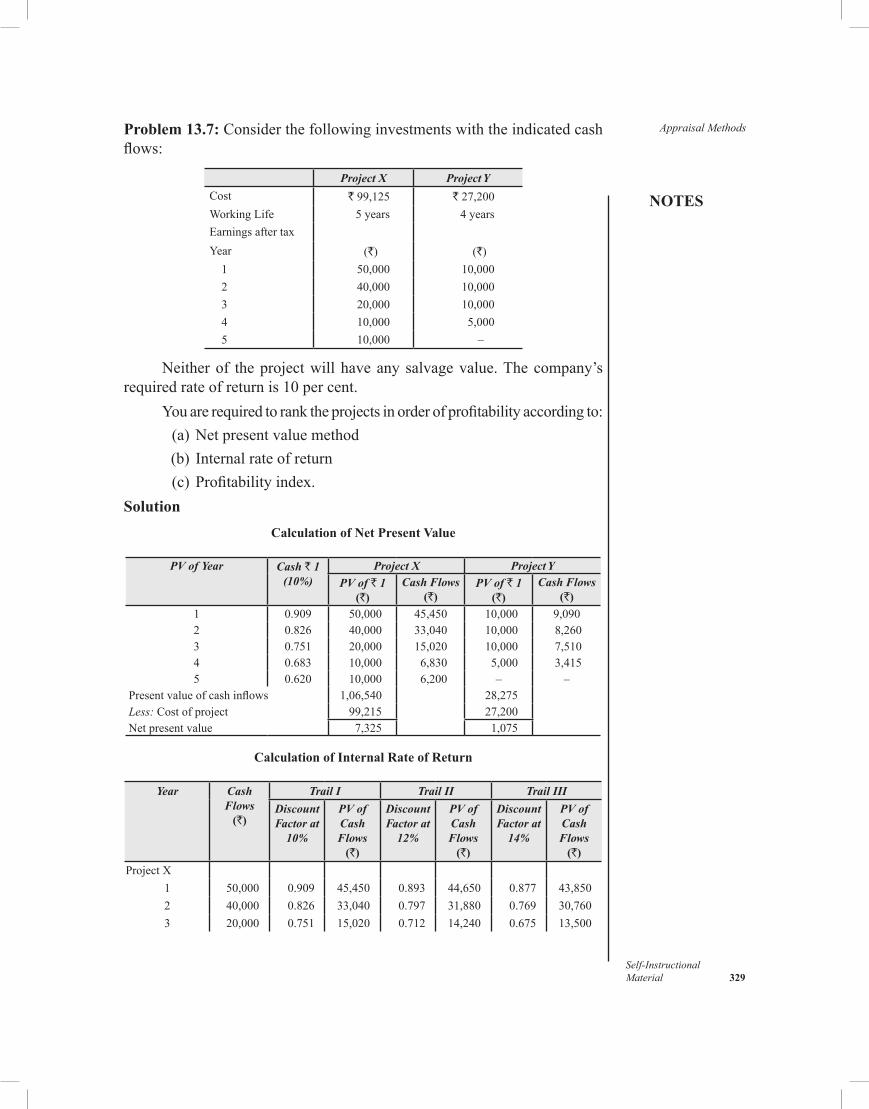
NOTES
Self-InstructionalMaterial 329
Appraisal MethodsProblem 13.7: Considerthefollowinginvestmentswiththeindicatedcashflows:
Project X Project Y
Cost `99,125 `27,200WorkingLife 5 years 4 yearsEarningsaftertaxYear (`) (`) 1 50,000 10,000 2 40,000 10,000 3 20,000 10,000 4 10,000 5,000 5 10,000 –
Neitherof theprojectwillhaveanysalvagevalue.Thecompany’srequiredrateofreturnis10percent.
Youarerequiredtoranktheprojectsinorderofprofitabilityaccordingto: (a)Netpresentvaluemethod (b) Internalrateofreturn (c)Profitabilityindex.Solution
Calculation of Net Present Value
PV of Year Cash ` 1 (10%)
Project X Project Y
PV of ` 1(`)
Cash Flows(`)
PV of ` 1(`)
Cash Flows(`)
1 0.909 50,000 45,450 10,000 9,0902 0.826 40,000 33,040 10,000 8,2603 0.751 20,000 15,020 10,000 7,5104 0.683 10,000 6,830 5,000 3,4155 0.620 10,000 6,200 – –
Presentvalueofcashinflows 1,06,540 28,275Less: Cost of project 99,215 27,200Netpresentvalue 7,325 1,075
Calculation of Internal Rate of Return
Year Cash Flows
(`)
Trail I Trail II Trail III
Discount Factor at
10%
PV of Cash Flows
(`)
Discount Factor at
12%
PV of Cash Flows
(`)
Discount Factor at
14%
PV of Cash Flows
(`)
ProjectX1 50,000 0.909 45,450 0.893 44,650 0.877 43,8502 40,000 0.826 33,040 0.797 31,880 0.769 30,7603 20,000 0.751 15,020 0.712 14,240 0.675 13,500
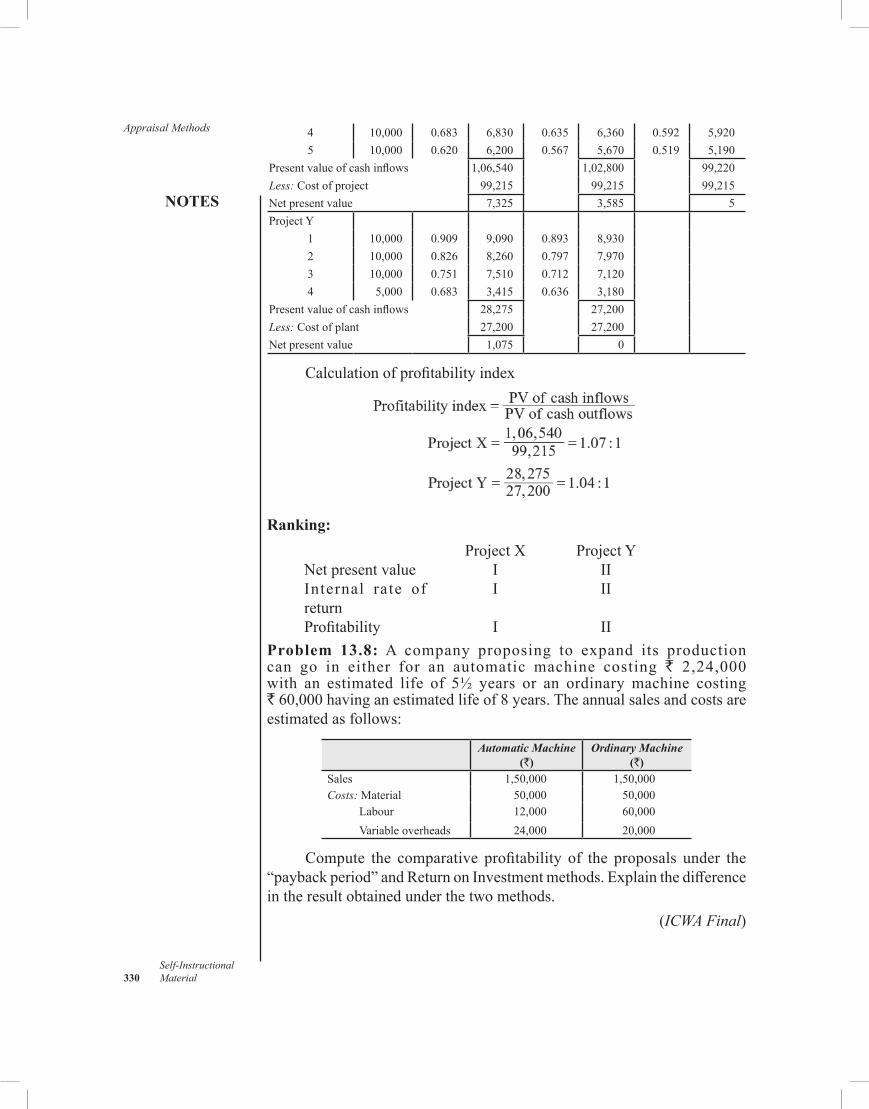
Appraisal Methods
NOTES
Self-Instructional 330 Material
4 10,000 0.683 6,830 0.635 6,360 0.592 5,9205 10,000 0.620 6,200 0.567 5,670 0.519 5,190
Presentvalueofcashinflows 1,06,540 1,02,800 99,220Less: Cost of project 99,215 99,215 99,215Netpresentvalue 7,325 3,585 5ProjectY
1 10,000 0.909 9,090 0.893 8,9302 10,000 0.826 8,260 0.797 7,9703 10,000 0.751 7,510 0.712 7,1204 5,000 0.683 3,415 0.636 3,180
Presentvalueofcashinflows 28,275 27,200Less:Costofplant 27,200 27,200Netpresentvalue 1,075 0
Calculationofprofitabilityindex
Ranking:ProjectX ProjectY
Netpresentvalue I IIInternal rate ofreturn
I II
Profitability I IIProblem 13.8: A company proposing to expand its productioncan go in either for an automatic machine costing ` 2,24,000with an estimated life of 5½ years or an ordinarymachine costing `60,000havinganestimatedlifeof8years.Theannualsalesandcostsareestimated as follows:
Automatic Machine(`)
Ordinary Machine(`)
Sales 1,50,000 1,50,000Costs:Material 50,000 50,000
Labour 12,000 60,000Variableoverheads 24,000 20,000
Compute the comparative profitability of the proposals under the“paybackperiod”andReturnonInvestmentmethods.Explainthedifferenceintheresultobtainedunderthetwomethods.
(ICWA Final)
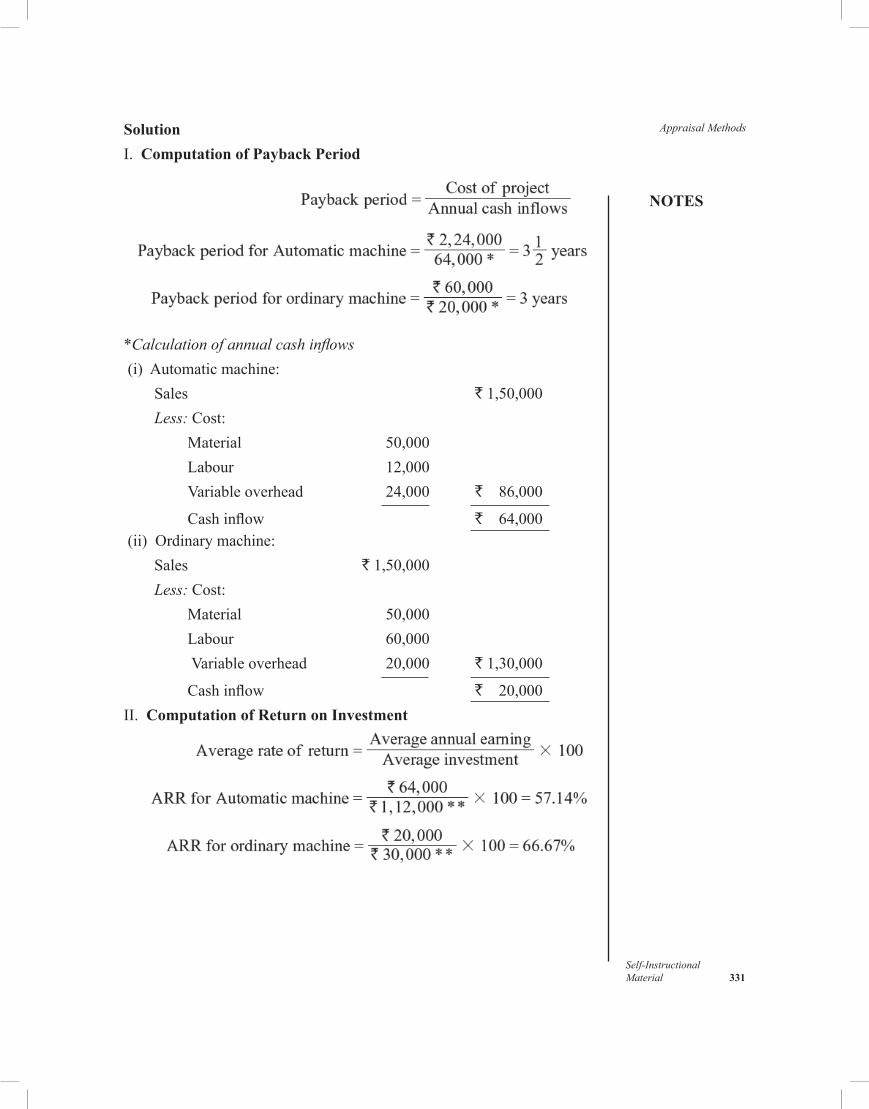
NOTES
Self-InstructionalMaterial 331
Appraisal MethodsSolutionI. Computation of Payback Period
*Calculation of annual cash inflows(i) Automaticmachine:
Sales `1,50,000Less: Cost:
Material 50,000Labour 12,000Variableoverhead 24,000 `86,000
Cashinflow `64,000(ii) Ordinarymachine:
Sales 1,50,000Less: Cost:
Material 50,000Labour 60,000Variableoverhead 20,000 `1,30,000
Cashinflow `20,000II. Computation of Return on Investment
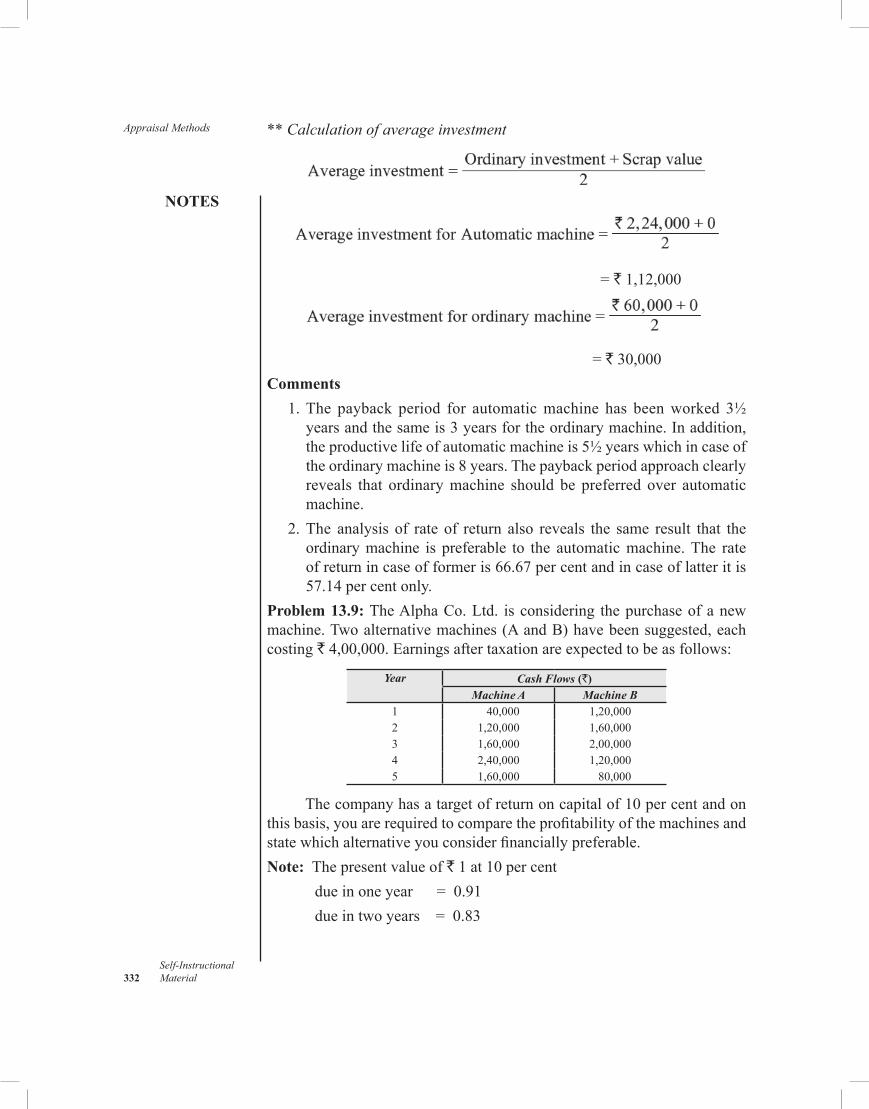
Appraisal Methods
NOTES
Self-Instructional 332 Material
**Calculation of average investment
= `1,12,000
= `30,000Comments 1.The payback period for automaticmachine has beenworked 3½
yearsandthesameis3yearsfortheordinarymachine.Inaddition,theproductivelifeofautomaticmachineis5½yearswhichincaseoftheordinarymachineis8years.Thepaybackperiodapproachclearlyreveals that ordinarymachine should be preferred over automaticmachine.
2.The analysis of rate of return also reveals the same result that theordinarymachine is preferable to the automaticmachine.The rateofreturnincaseofformeris66.67percentandincaseoflatteritis 57.14percentonly.
Problem 13.9:TheAlphaCo.Ltd. isconsidering thepurchaseofanewmachine.Twoalternativemachines(AandB)havebeensuggested,eachcosting `4,00,000.Earningsaftertaxationareexpectedtobeasfollows:
Year Cash Flows (`)Machine A Machine B
1 40,000 1,20,0002 1,20,000 1,60,0003 1,60,000 2,00,0004 2,40,000 1,20,0005 1,60,000 80,000
Thecompanyhasatargetofreturnoncapitalof10percentandonthisbasis,youarerequiredtocomparetheprofitabilityofthemachinesandstatewhichalternativeyouconsiderfinanciallypreferable.Note: Thepresentvalueof` 1 at 10 per cent due in one year = 0.91 dueintwoyears= 0.83
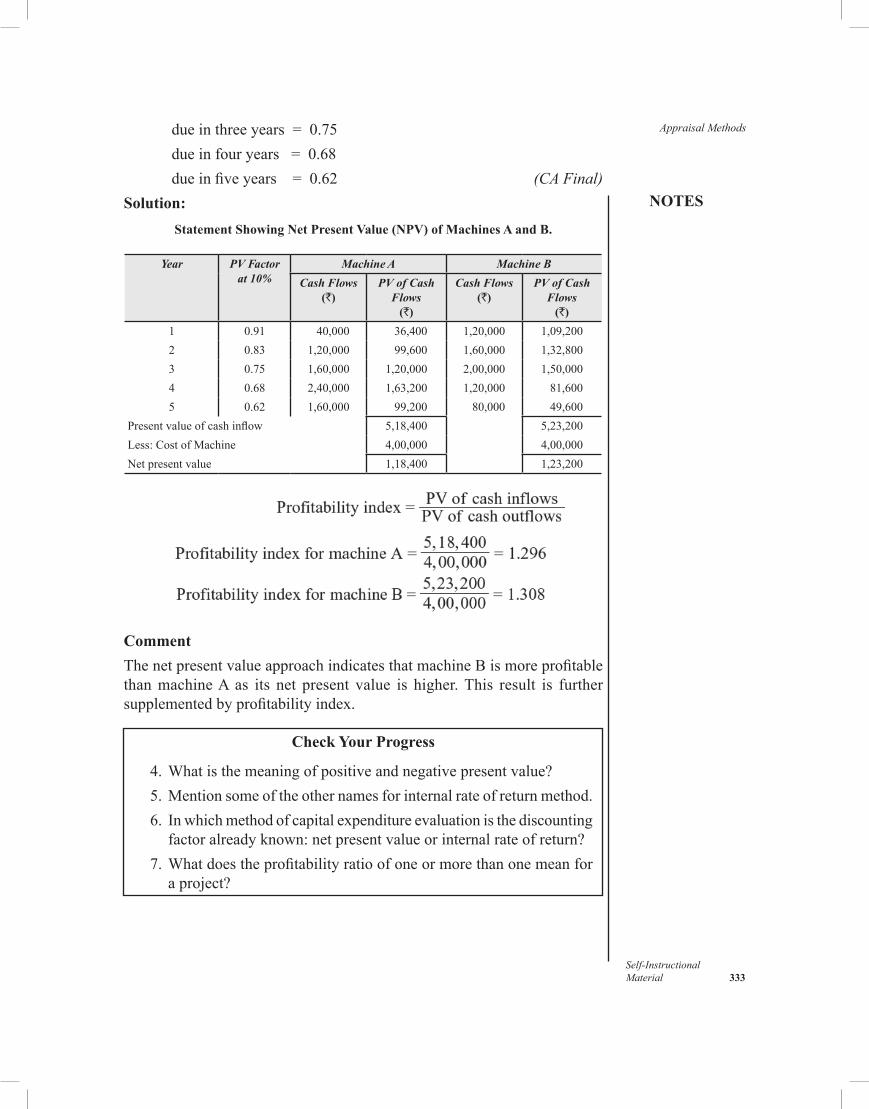
NOTES
Self-InstructionalMaterial 333
Appraisal Methods dueinthreeyears= 0.75 due in four years = 0.68 dueinfiveyears= 0.62 (CA Final)Solution:
Statement Showing Net Present Value (NPV) of Machines A and B.
Year PV Factor at 10%
Machine A Machine B
Cash Flows(`)
PV of Cash Flows
(`)
Cash Flows(`)
PV of Cash Flows
(`)
1 0.91 40,000 36,400 1,20,000 1,09,2002 0.83 1,20,000 99,600 1,60,000 1,32,8003 0.75 1,60,000 1,20,000 2,00,000 1,50,0004 0.68 2,40,000 1,63,200 1,20,000 81,6005 0.62 1,60,000 99,200 80,000 49,600
Presentvalueofcashinflow 5,18,400 5,23,200Less:CostofMachine 4,00,000 4,00,000Netpresentvalue 1,18,400 1,23,200
CommentThenetpresentvalueapproachindicatesthatmachineBismoreprofitablethanmachineA as its net present value is higher.This result is furthersupplementedbyprofitabilityindex.
Check Your Progress
4.Whatisthemeaningofpositiveandnegativepresentvalue? 5.Mentionsomeoftheothernamesforinternalrateofreturnmethod. 6. Inwhichmethodofcapitalexpenditureevaluationisthediscounting
factoralreadyknown:netpresentvalueorinternalrateofreturn? 7.Whatdoestheprofitabilityratioofoneormorethanonemeanfor
aproject?
Appraisal Methods
NOTES
Self-Instructional 334 Material
13.6 ANSWERS TO CHECK YOUR PROGRESS QUESTIONS
1.Bailoutisthemethodofdeterminingthelengthoftimethatwillberequiredforcashinflowsandsalvagevalueoftheprojecttorecoupthefundsinvestedinaproposedproject.
2.Thepayback reciprocal shouldbeusedonly for suchprojects thatgenerate uniform cash inflows.This is because non-uniform cashflowsmaycausethepaybackreciprocaltobeaverypoorestimateoftheinternalrateofreturnwhichisusedasameasuringyardfortheevaluationoftheprojectunderthismethod.
3.Thephilosophyfortheuseofaverageinvestmentisthatastimepassesandassetsdepreciate,thebookvalueoftheprojectdeclines.Therefore,the amount of investment for determining rate of return shouldbeaverage investmentwhich isobtainedbyadding thebeginningandendingvalueanddivingthesamebytwo.
4. Ifthepresentvalueofthecashinflowsexceedsthepresentvalueofcashoutflows the result is termedpositivewhich indicates that theprojectearnsmorethantheminimumacceptablerateofinterest.Theresultisnegativeifthepresentvalueofcashoutflowsisgreaterthanthepresentvalueofcashinflowsbecauseitwouldmeanthattherateofreturnislessthantheminimumacceptablerate.
5.Theinternalrateofreturnmethodisalsoknownasthediscountedrateofreturnmethod,theadjustedrateofreturnmethod,investorsmethod,andtime-adjustedrateofreturnmethod.
6.Underthenetpresentvaluemethoddiscountingfactor,i.e.,interestrateofthecashflowisknownwhereassuchrateisworkedoutincaseofinternalrateofreturn.
7. Iftheratioisoneormorethanonetheresultistermedaspositiveandtheprojectisconsidereddesirable.
13.7 SUMMARY
•Capitalbudgetingisaprocessoflongrangeplanningforacquiringsuchassetswhichwillrendersomesortofserviceoverseveralaccountingperiods.
• Paybackmethodinvolvesthecalculationofthespanoftimerequiredtorecoverinitialcashinvestment.
•Postpaybackprofitabilityindexwhichisaratiobetweenpostpaybackprofitsandinvestment.
NOTES
Self-InstructionalMaterial 335
Appraisal Methods • Paybackreciprocalisamethodofcapitalproposalsthatattemptstoestimatetheinternalrateofreturn.
•Accountingrateofreturnmethodattemptstoevaluatetheprojectdoneonthebasisofrateofreturn.
•Averagerateofreturnonoriginalinvestmentconsidersaveragerateofreturnwhichissimplycalculatedbydividingtheaverageearningsafterdepreciationandtaxfromtheinvestmentbythetotalinvestment.
• In average rateof returnonaverage investment insteadoforiginalinvestment average investment is used for determining rate of return on investment.
•Thediscountedcashflowsmethoddealswithactualcashflowinsteadoftheaccountingconceptofincome.
•Thenetpresentvaluemethodattemptstodiscountthecashflowsofaprojecttotheirpresentvalueusingapre-determineddiscountraterepresentingthecostofcapital.
• Internalrateofreturnmethodattemptstodeterminetherateofinterestwhichwhenappliedtothefutureincomestreamwillexactlyequatethepresentvalueofthatstreamtothepresentvalueoftheinvestment.
•Profitabilityindexrepresentstheratiobetweenpresentvalueofcashinflowsandpresentvalueofcashoutflowsofaproject.
•Capitalrationingmaybedefinedasaprocesswhichinvolvesnecessaryrankingofinvestmentproposalsforafirmwithshortageofcapitaltoinvest.
13.8 KEY WORDS
• Payback period:Itisthelengthoftimethatelapsesbeforecumulativecash inflows from theproject equal the initial cashoutlays for theproject.
• Discounted cash flow methods:Itdealswithactualcashflowandrecognizestimevalueofmoney.
• Time value of money:Itistheconceptwhichsaysthatarupeeinhandtodaypossessesmoreworththanarupeetobereceivedinfuture.
• Internal rate of return:Itistherateofinterestwhichwhenappliedtothefutureincomestreamwillexactlyequatethepresentvalueofthatstreamtothepresentvalueoftheinvestment.
• Profitability index: Itrepresentstheratiobetweenpresentvalueofcashinflowsandpresentvalueofcashoutflowsofaproject.
Appraisal Methods
NOTES
Self-Instructional 336 Material
13.9 SELF ASSESMENT QUESTIONS AND EXERCISES
Short-Answer Questions
1.Explaintheconceptofcapitalbudgeting.Whyarecapitalinvestmentdecisionssoimportant?
2.Discussthenatureandelementsofcapitalbudgeting. 3.Explainvarioustechniquesofevaluatingcapitalinvestmentproposal,
whichtechniqueisconsideredtobethebest? 4.What are the principlemethods employed for ascertaining the
profitabilityofacapitalexpenditureproject? 5.Howarenetpresentvaluecalculationsperformedinactualbusiness
situations? 6.ExplainthedifferencebetweentheDiscountedRateofReturnmethod
and theNetPresentValuemethod in the evaluation of investmentalternatives.
7.Explainthemajordrawbacksofvariouscapitalbudgetingtechniques. 8. Inreplacementsituation,howaretheproceedsfromthesaleofold
equipmentusedincomputingthenetinvestment? 9.Theinvestmentalternativeyieldingthehighestdiscountedrateofreturn
isthemostacceptable.Willthisalwaysbetrue?Explain. 10.Writeshortnoteson: (a) Bailout (b) Post-paybackprofitabilityindex (c) Paybackreciprocal. 11.ExplaintheAccountingRateofReturnandtheInternalRateofReturn
methodsforevaluatingcapitalproposals. 12.Explainindetailthemajorstepsincapitalbudgeting. 13. “The discounted rate of return and the present valuemethods of
appraisingcapitalexpendituresprojectsaccomplishbasicallythesamegoal”.Explainhowtheydothis.
14.Howdoesacapitalinvestmentdifferfromotherbusinessinvestment? 15. “Itisthecapitalexpendituredecisionthatspellsthedifferencebetween
thebusinesssuccessandbusinessfailure”.Doyouagreewiththeabovestatement?
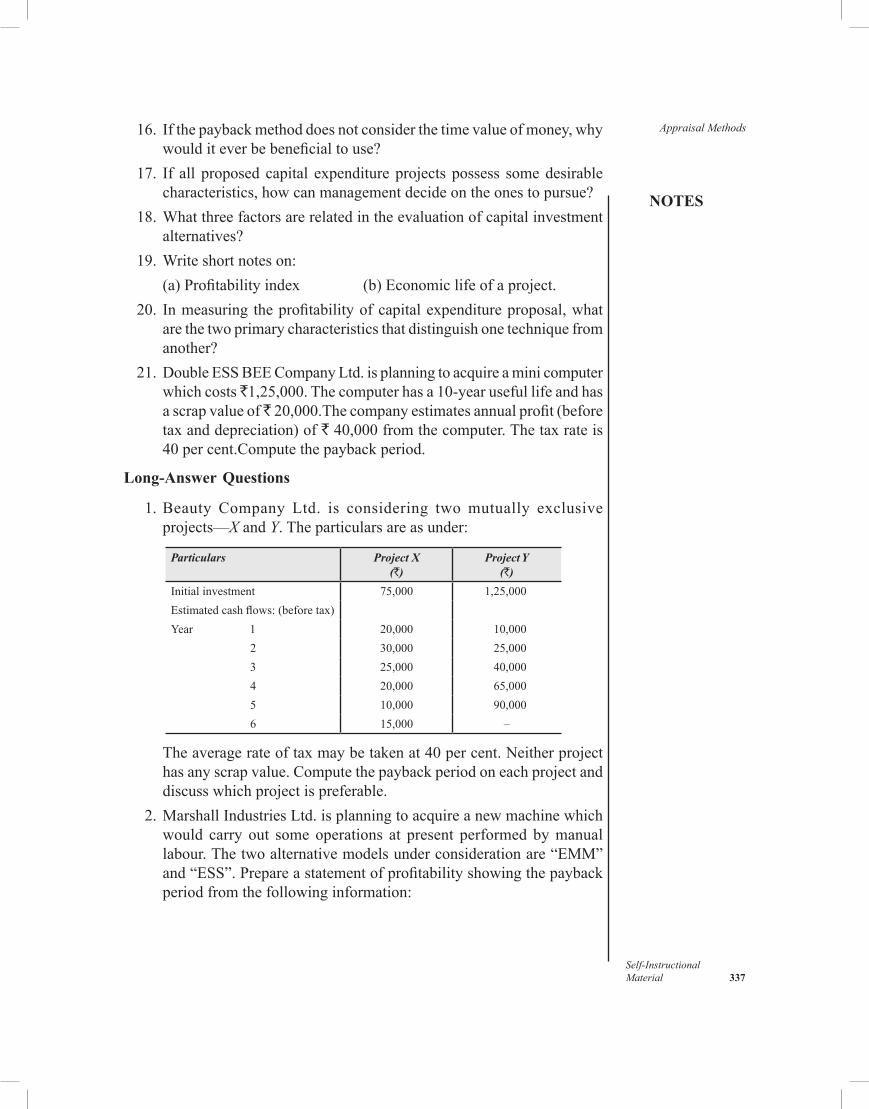
NOTES
Self-InstructionalMaterial 337
Appraisal Methods 16. Ifthepaybackmethoddoesnotconsiderthetimevalueofmoney,whywoulditeverbebeneficialtouse?
17. If all proposed capital expenditureprojects possess somedesirablecharacteristics,howcanmanagementdecideontheonestopursue?
18.Whatthreefactorsarerelatedintheevaluationofcapitalinvestmentalternatives?
19.Writeshortnoteson: (a)Profitabilityindex (b)Economiclifeofaproject. 20. Inmeasuring theprofitabilityofcapitalexpenditureproposal,what
arethetwoprimarycharacteristicsthatdistinguishonetechniquefromanother?
21.DoubleESSBEECompanyLtd.isplanningtoacquireaminicomputerwhichcosts 1,25,000.Thecomputerhasa10-yearusefullifeandhasascrapvalueof 20,000.Thecompanyestimatesannualprofit(beforetaxanddepreciation)of`40,000fromthecomputer.Thetaxrateis40percent.Computethepaybackperiod.
Long-Answer Questions
1.Beauty Company Ltd. is considering twomutually exclusiveprojects—X and Y.Theparticularsareasunder:
Particulars Project X(`)
Project Y(`)
Initialinvestment 75,000 1,25,000Estimatedcashflows:(beforetax)Year 1 20,000 10,000
2 30,000 25,0003 25,000 40,0004 20,000 65,0005 10,000 90,0006 15,000 –
Theaveragerateoftaxmaybetakenat40percent.Neitherprojecthasanyscrapvalue.Computethepaybackperiodoneachprojectanddiscusswhichprojectispreferable.
2.MarshallIndustriesLtd.isplanningtoacquireanewmachinewhichwould carry out some operations at present performed bymanuallabour.Thetwoalternativemodelsunderconsiderationare“EMM”and“ESS”.Prepareastatementofprofitabilityshowingthepaybackperiodfromthefollowinginformation:
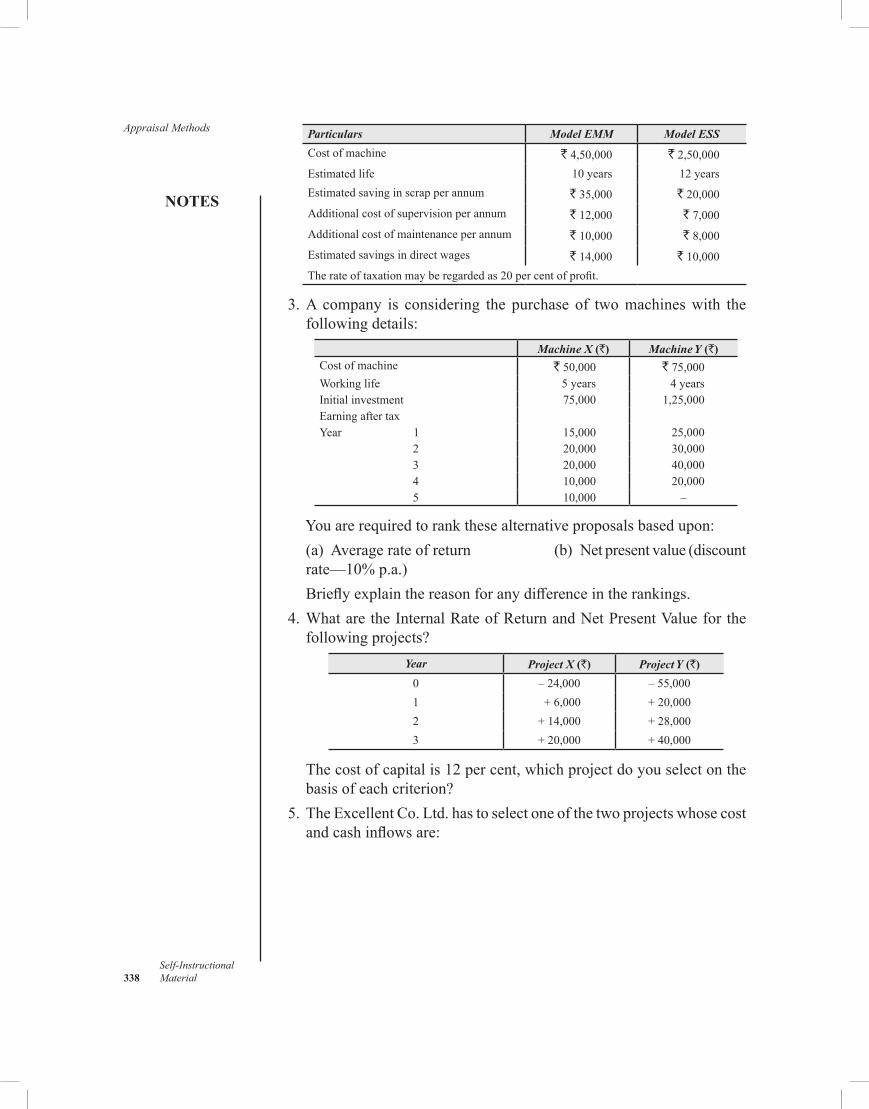
Appraisal Methods
NOTES
Self-Instructional 338 Material
Particulars Model EMM Model ESS
Costofmachine `4,50,000 `2,50,000Estimatedlife 10 years 12 yearsEstimatedsavinginscrapperannum `35,000 `20,000Additionalcostofsupervisionperannum `12,000 `7,000Additionalcostofmaintenanceperannum `10,000 `8,000Estimatedsavingsindirectwages `14,000 `10,000Therateoftaxationmayberegardedas20percentofprofit.
3.A company is considering the purchase of twomachineswith thefollowingdetails:
Machine X (`) Machine Y (`)Costofmachine `50,000 `75,000Workinglife 5 years 4 yearsInitialinvestment 75,000 1,25,000EarningaftertaxYear 1 15,000 25,000
2 20,000 30,0003 20,000 40,0004 10,000 20,0005 10,000 –
Youarerequiredtorankthesealternativeproposalsbasedupon: (a) Averagerateofreturn (b) Netpresentvalue(discount
rate—10%p.a.) Brieflyexplainthereasonforanydifferenceintherankings. 4.WhataretheInternalRateofReturnandNetPresentValueforthe
followingprojects?Year Project X (`) Project Y (`)
0 –24,000 –55,0001 +6,000 +20,0002 +14,000 +28,0003 +20,000 +40,000
Thecostofcapitalis12percent,whichprojectdoyouselectonthebasisofeachcriterion?
5.TheExcellentCo.Ltd.hastoselectoneofthetwoprojectswhosecostandcashinflowsare:
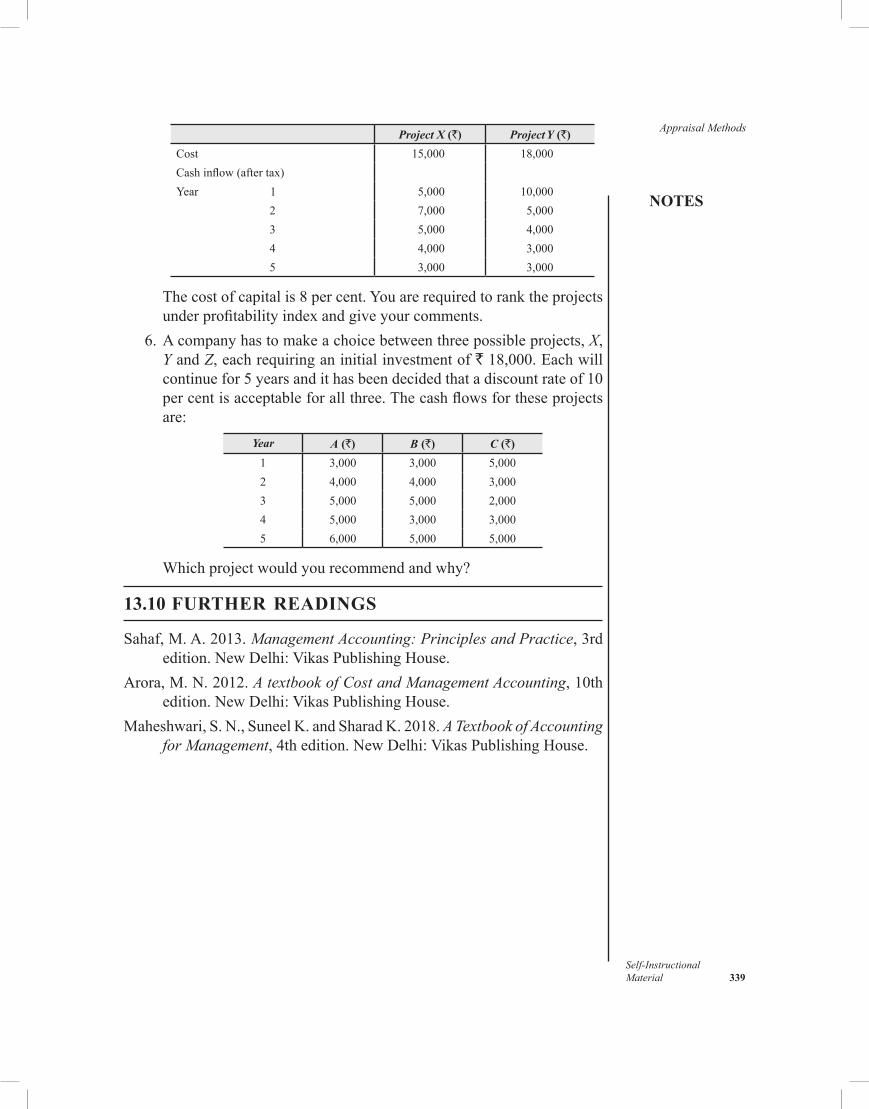
NOTES
Self-InstructionalMaterial 339
Appraisal MethodsProject X (`) Project Y (`)
Cost 15,000 18,000Cashinflow(aftertax)Year 1 5,000 10,000
2 7,000 5,0003 5,000 4,0004 4,000 3,0005 3,000 3,000
Thecostofcapitalis8percent.Youarerequiredtoranktheprojectsunderprofitabilityindexandgiveyourcomments.
6.Acompanyhastomakeachoicebetweenthreepossibleprojects,X,Y and Z,eachrequiringaninitialinvestmentof`18,000.Eachwillcontinuefor5yearsandithasbeendecidedthatadiscountrateof10percentisacceptableforallthree.Thecashflowsfortheseprojectsare:
Year A (`) B (`) C (`)
1 3,000 3,000 5,0002 4,000 4,000 3,0003 5,000 5,000 2,0004 5,000 3,000 3,0005 6,000 5,000 5,000
Whichprojectwouldyourecommendandwhy?
13.10 FURTHER READINGS
Sahaf,M.A.2013.Management Accounting: Principles and Practice,3rdedition.NewDelhi:VikasPublishingHouse.
Arora,M.N.2012.A textbook of Cost and Management Accounting,10thedition.NewDelhi:VikasPublishingHouse.
Maheshwari,S.N.,SuneelK.andSharadK.2018.A Textbook of Accounting for Management,4thedition.NewDelhi:VikasPublishingHouse.
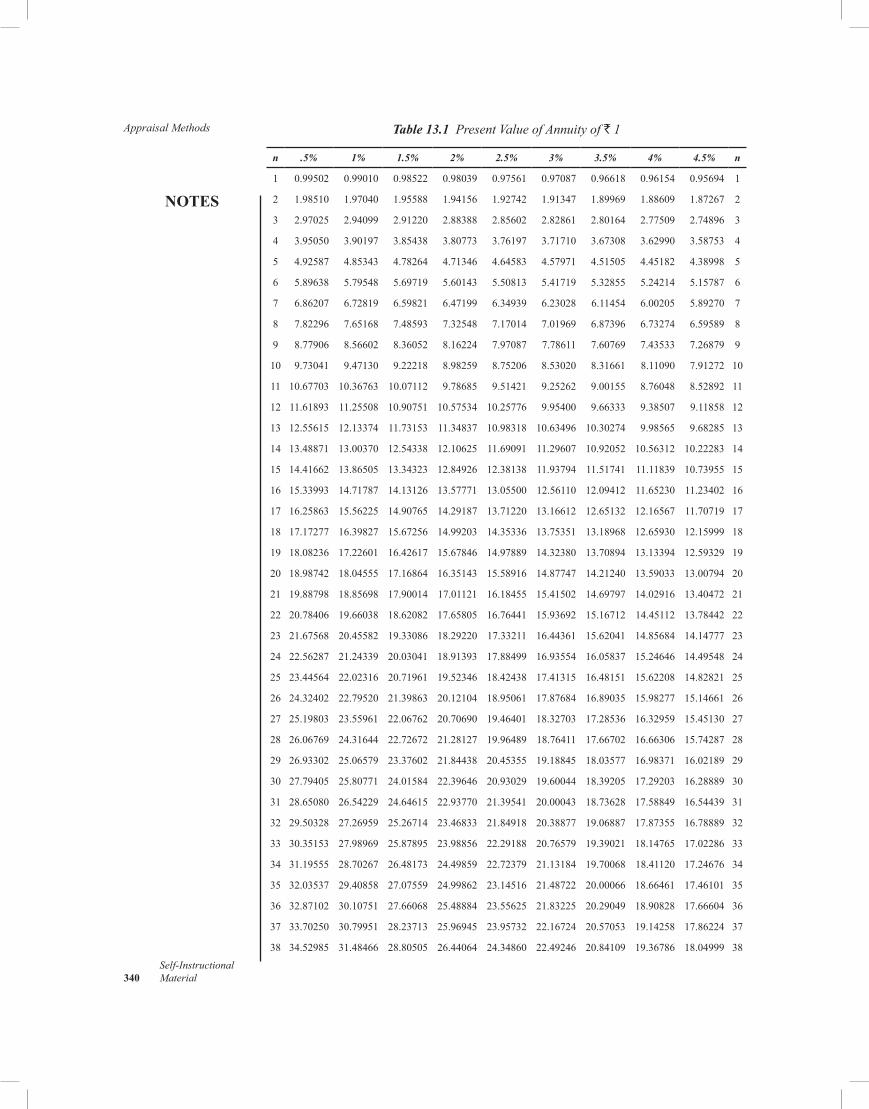
Appraisal Methods
NOTES
Self-Instructional 340 Material
Table 13.1 Present Value of Annuity of ` 1
n .5% 1% 1.5% 2% 2.5% 3% 3.5% 4% 4.5% n
1 0.99502 0.99010 0.98522 0.98039 0.97561 0.97087 0.96618 0.96154 0.95694 1
2 1.98510 1.97040 1.95588 1.94156 1.92742 1.91347 1.89969 1.88609 1.87267 2
3 2.97025 2.94099 2.91220 2.88388 2.85602 2.82861 2.80164 2.77509 2.74896 3
4 3.95050 3.90197 3.85438 3.80773 3.76197 3.71710 3.67308 3.62990 3.58753 4
5 4.92587 4.85343 4.78264 4.71346 4.64583 4.57971 4.51505 4.45182 4.38998 5
6 5.89638 5.79548 5.69719 5.60143 5.50813 5.41719 5.32855 5.24214 5.15787 6
7 6.86207 6.72819 6.59821 6.47199 6.34939 6.23028 6.11454 6.00205 5.89270 7
8 7.82296 7.65168 7.48593 7.32548 7.17014 7.01969 6.87396 6.73274 6.59589 8
9 8.77906 8.56602 8.36052 8.16224 7.97087 7.78611 7.60769 7.43533 7.26879 9
10 9.73041 9.47130 9.22218 8.98259 8.75206 8.53020 8.31661 8.11090 7.91272 10
11 10.67703 10.36763 10.07112 9.78685 9.51421 9.25262 9.00155 8.76048 8.52892 11
12 11.61893 11.25508 10.90751 10.57534 10.25776 9.95400 9.66333 9.38507 9.11858 12
13 12.55615 12.13374 11.73153 11.34837 10.98318 10.63496 10.30274 9.98565 9.68285 13
14 13.48871 13.00370 12.54338 12.10625 11.69091 11.29607 10.92052 10.56312 10.22283 14
15 14.41662 13.86505 13.34323 12.84926 12.38138 11.93794 11.51741 11.11839 10.73955 15
16 15.33993 14.71787 14.13126 13.57771 13.05500 12.56110 12.09412 11.65230 11.23402 16
17 16.25863 15.56225 14.90765 14.29187 13.71220 13.16612 12.65132 12.16567 11.70719 17
18 17.17277 16.39827 15.67256 14.99203 14.35336 13.75351 13.18968 12.65930 12.15999 18
19 18.08236 17.22601 16.42617 15.67846 14.97889 14.32380 13.70894 13.13394 12.59329 19
20 18.98742 18.04555 17.16864 16.35143 15.58916 14.87747 14.21240 13.59033 13.00794 20
21 19.88798 18.85698 17.90014 17.01121 16.18455 15.41502 14.69797 14.02916 13.40472 21
22 20.78406 19.66038 18.62082 17.65805 16.76441 15.93692 15.16712 14.45112 13.78442 22
23 21.67568 20.45582 19.33086 18.29220 17.33211 16.44361 15.62041 14.85684 14.14777 23
24 22.56287 21.24339 20.03041 18.91393 17.88499 16.93554 16.05837 15.24646 14.49548 24
25 23.44564 22.02316 20.71961 19.52346 18.42438 17.41315 16.48151 15.62208 14.82821 25
26 24.32402 22.79520 21.39863 20.12104 18.95061 17.87684 16.89035 15.98277 15.14661 26
27 25.19803 23.55961 22.06762 20.70690 19.46401 18.32703 17.28536 16.32959 15.45130 27
28 26.06769 24.31644 22.72672 21.28127 19.96489 18.76411 17.66702 16.66306 15.74287 28
29 26.93302 25.06579 23.37602 21.84438 20.45355 19.18845 18.03577 16.98371 16.02189 29
30 27.79405 25.80771 24.01584 22.39646 20.93029 19.60044 18.39205 17.29203 16.28889 30
31 28.65080 26.54229 24.64615 22.93770 21.39541 20.00043 18.73628 17.58849 16.54439 31
32 29.50328 27.26959 25.26714 23.46833 21.84918 20.38877 19.06887 17.87355 16.78889 32
33 30.35153 27.98969 25.87895 23.98856 22.29188 20.76579 19.39021 18.14765 17.02286 33
34 31.19555 28.70267 26.48173 24.49859 22.72379 21.13184 19.70068 18.41120 17.24676 34
35 32.03537 29.40858 27.07559 24.99862 23.14516 21.48722 20.00066 18.66461 17.46101 35
36 32.87102 30.10751 27.66068 25.48884 23.55625 21.83225 20.29049 18.90828 17.66604 36
37 33.70250 30.79951 28.23713 25.96945 23.95732 22.16724 20.57053 19.14258 17.86224 37
38 34.52985 31.48466 28.80505 26.44064 24.34860 22.49246 20.84109 19.36786 18.04999 38
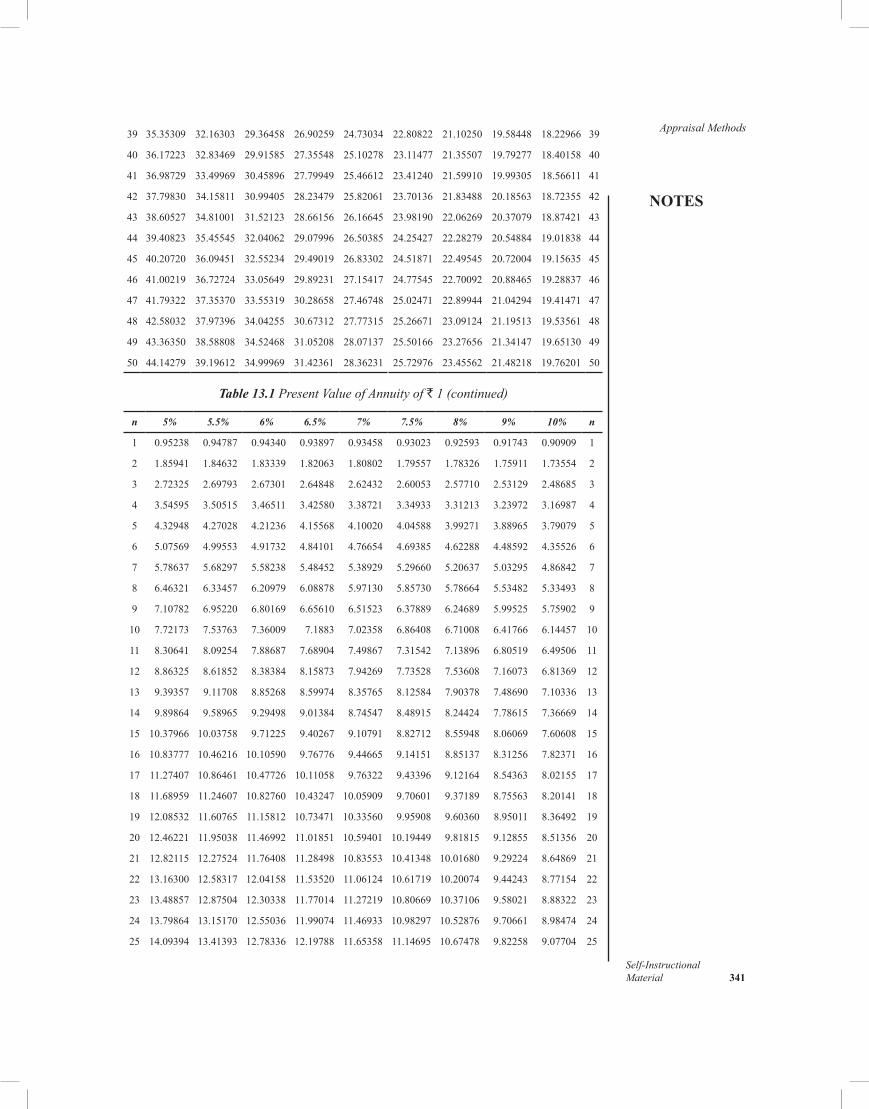
NOTES
Self-InstructionalMaterial 341
Appraisal Methods39 35.35309 32.16303 29.36458 26.90259 24.73034 22.80822 21.10250 19.58448 18.22966 39
40 36.17223 32.83469 29.91585 27.35548 25.10278 23.11477 21.35507 19.79277 18.40158 40
41 36.98729 33.49969 30.45896 27.79949 25.46612 23.41240 21.59910 19.99305 18.56611 41
42 37.79830 34.15811 30.99405 28.23479 25.82061 23.70136 21.83488 20.18563 18.72355 42
43 38.60527 34.81001 31.52123 28.66156 26.16645 23.98190 22.06269 20.37079 18.87421 43
44 39.40823 35.45545 32.04062 29.07996 26.50385 24.25427 22.28279 20.54884 19.01838 44
45 40.20720 36.09451 32.55234 29.49019 26.83302 24.51871 22.49545 20.72004 19.15635 45
46 41.00219 36.72724 33.05649 29.89231 27.15417 24.77545 22.70092 20.88465 19.28837 46
47 41.79322 37.35370 33.55319 30.28658 27.46748 25.02471 22.89944 21.04294 19.41471 47
48 42.58032 37.97396 34.04255 30.67312 27.77315 25.26671 23.09124 21.19513 19.53561 48
49 43.36350 38.58808 34.52468 31.05208 28.07137 25.50166 23.27656 21.34147 19.65130 49
50 44.14279 39.19612 34.99969 31.42361 28.36231 25.72976 23.45562 21.48218 19.76201 50
Table 13.1 Present Value of Annuity of ` 1 (continued)
n 5% 5.5% 6% 6.5% 7% 7.5% 8% 9% 10% n
1 0.95238 0.94787 0.94340 0.93897 0.93458 0.93023 0.92593 0.91743 0.90909 1
2 1.85941 1.84632 1.83339 1.82063 1.80802 1.79557 1.78326 1.75911 1.73554 2
3 2.72325 2.69793 2.67301 2.64848 2.62432 2.60053 2.57710 2.53129 2.48685 3
4 3.54595 3.50515 3.46511 3.42580 3.38721 3.34933 3.31213 3.23972 3.16987 4
5 4.32948 4.27028 4.21236 4.15568 4.10020 4.04588 3.99271 3.88965 3.79079 5
6 5.07569 4.99553 4.91732 4.84101 4.76654 4.69385 4.62288 4.48592 4.35526 6
7 5.78637 5.68297 5.58238 5.48452 5.38929 5.29660 5.20637 5.03295 4.86842 7
8 6.46321 6.33457 6.20979 6.08878 5.97130 5.85730 5.78664 5.53482 5.33493 8
9 7.10782 6.95220 6.80169 6.65610 6.51523 6.37889 6.24689 5.99525 5.75902 9
10 7.72173 7.53763 7.36009 7.1883 7.02358 6.86408 6.71008 6.41766 6.14457 10
11 8.30641 8.09254 7.88687 7.68904 7.49867 7.31542 7.13896 6.80519 6.49506 11
12 8.86325 8.61852 8.38384 8.15873 7.94269 7.73528 7.53608 7.16073 6.81369 12
13 9.39357 9.11708 8.85268 8.59974 8.35765 8.12584 7.90378 7.48690 7.10336 13
14 9.89864 9.58965 9.29498 9.01384 8.74547 8.48915 8.24424 7.78615 7.36669 14
15 10.37966 10.03758 9.71225 9.40267 9.10791 8.82712 8.55948 8.06069 7.60608 15
16 10.83777 10.46216 10.10590 9.76776 9.44665 9.14151 8.85137 8.31256 7.82371 16
17 11.27407 10.86461 10.47726 10.11058 9.76322 9.43396 9.12164 8.54363 8.02155 17
18 11.68959 11.24607 10.82760 10.43247 10.05909 9.70601 9.37189 8.75563 8.20141 18
19 12.08532 11.60765 11.15812 10.73471 10.33560 9.95908 9.60360 8.95011 8.36492 19
20 12.46221 11.95038 11.46992 11.01851 10.59401 10.19449 9.81815 9.12855 8.51356 20
21 12.82115 12.27524 11.76408 11.28498 10.83553 10.41348 10.01680 9.29224 8.64869 21
22 13.16300 12.58317 12.04158 11.53520 11.06124 10.61719 10.20074 9.44243 8.77154 22
23 13.48857 12.87504 12.30338 11.77014 11.27219 10.80669 10.37106 9.58021 8.88322 23
24 13.79864 13.15170 12.55036 11.99074 11.46933 10.98297 10.52876 9.70661 8.98474 24
25 14.09394 13.41393 12.78336 12.19788 11.65358 11.14695 10.67478 9.82258 9.07704 25
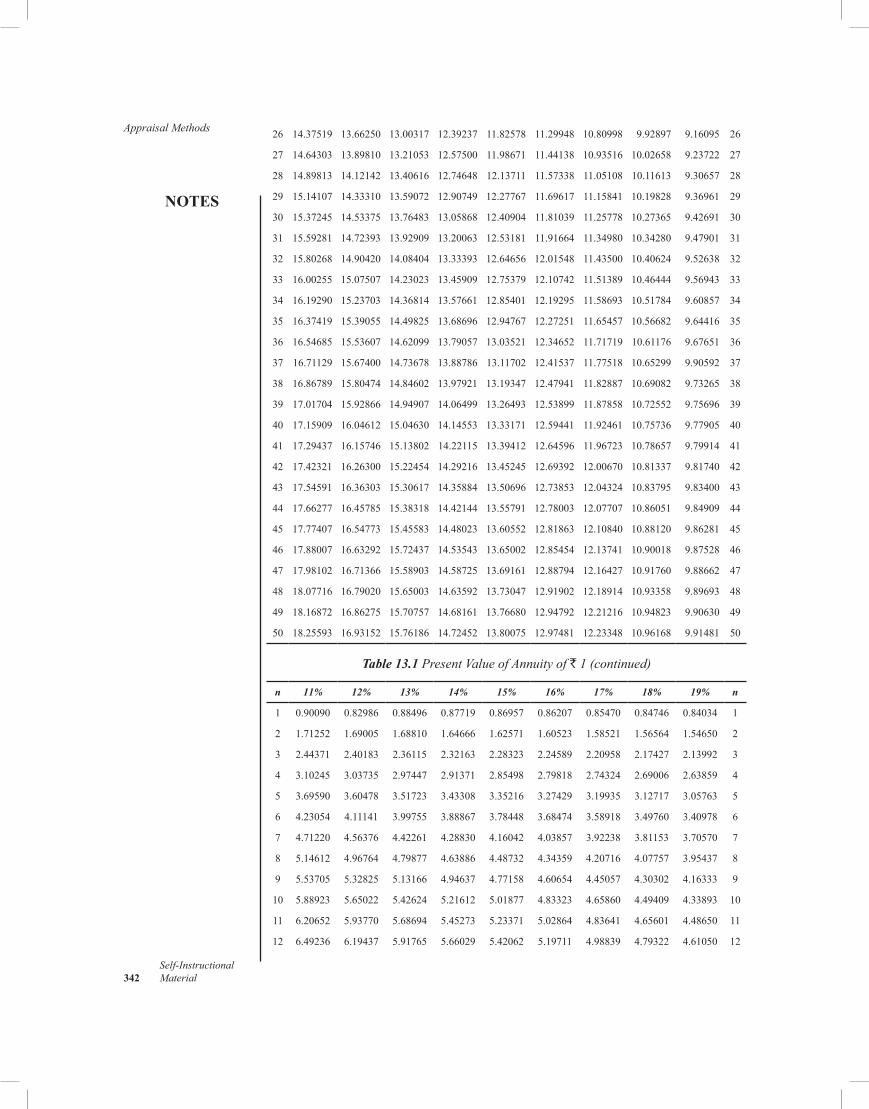
Appraisal Methods
NOTES
Self-Instructional 342 Material
26 14.37519 13.66250 13.00317 12.39237 11.82578 11.29948 10.80998 9.92897 9.16095 26
27 14.64303 13.89810 13.21053 12.57500 11.98671 11.44138 10.93516 10.02658 9.23722 27
28 14.89813 14.12142 13.40616 12.74648 12.13711 11.57338 11.05108 10.11613 9.30657 28
29 15.14107 14.33310 13.59072 12.90749 12.27767 11.69617 11.15841 10.19828 9.36961 29
30 15.37245 14.53375 13.76483 13.05868 12.40904 11.81039 11.25778 10.27365 9.42691 30
31 15.59281 14.72393 13.92909 13.20063 12.53181 11.91664 11.34980 10.34280 9.47901 31
32 15.80268 14.90420 14.08404 13.33393 12.64656 12.01548 11.43500 10.40624 9.52638 32
33 16.00255 15.07507 14.23023 13.45909 12.75379 12.10742 11.51389 10.46444 9.56943 33
34 16.19290 15.23703 14.36814 13.57661 12.85401 12.19295 11.58693 10.51784 9.60857 34
35 16.37419 15.39055 14.49825 13.68696 12.94767 12.27251 11.65457 10.56682 9.64416 35
36 16.54685 15.53607 14.62099 13.79057 13.03521 12.34652 11.71719 10.61176 9.67651 36
37 16.71129 15.67400 14.73678 13.88786 13.11702 12.41537 11.77518 10.65299 9.90592 37
38 16.86789 15.80474 14.84602 13.97921 13.19347 12.47941 11.82887 10.69082 9.73265 38
39 17.01704 15.92866 14.94907 14.06499 13.26493 12.53899 11.87858 10.72552 9.75696 39
40 17.15909 16.04612 15.04630 14.14553 13.33171 12.59441 11.92461 10.75736 9.77905 40
41 17.29437 16.15746 15.13802 14.22115 13.39412 12.64596 11.96723 10.78657 9.79914 41
42 17.42321 16.26300 15.22454 14.29216 13.45245 12.69392 12.00670 10.81337 9.81740 42
43 17.54591 16.36303 15.30617 14.35884 13.50696 12.73853 12.04324 10.83795 9.83400 43
44 17.66277 16.45785 15.38318 14.42144 13.55791 12.78003 12.07707 10.86051 9.84909 44
45 17.77407 16.54773 15.45583 14.48023 13.60552 12.81863 12.10840 10.88120 9.86281 45
46 17.88007 16.63292 15.72437 14.53543 13.65002 12.85454 12.13741 10.90018 9.87528 46
47 17.98102 16.71366 15.58903 14.58725 13.69161 12.88794 12.16427 10.91760 9.88662 47
48 18.07716 16.79020 15.65003 14.63592 13.73047 12.91902 12.18914 10.93358 9.89693 48
49 18.16872 16.86275 15.70757 14.68161 13.76680 12.94792 12.21216 10.94823 9.90630 49
50 18.25593 16.93152 15.76186 14.72452 13.80075 12.97481 12.23348 10.96168 9.91481 50
Table 13.1 Present Value of Annuity of ` 1 (continued)
n 11% 12% 13% 14% 15% 16% 17% 18% 19% n
1 0.90090 0.82986 0.88496 0.87719 0.86957 0.86207 0.85470 0.84746 0.84034 1
2 1.71252 1.69005 1.68810 1.64666 1.62571 1.60523 1.58521 1.56564 1.54650 2
3 2.44371 2.40183 2.36115 2.32163 2.28323 2.24589 2.20958 2.17427 2.13992 3
4 3.10245 3.03735 2.97447 2.91371 2.85498 2.79818 2.74324 2.69006 2.63859 4
5 3.69590 3.60478 3.51723 3.43308 3.35216 3.27429 3.19935 3.12717 3.05763 5
6 4.23054 4.11141 3.99755 3.88867 3.78448 3.68474 3.58918 3.49760 3.40978 6
7 4.71220 4.56376 4.42261 4.28830 4.16042 4.03857 3.92238 3.81153 3.70570 7
8 5.14612 4.96764 4.79877 4.63886 4.48732 4.34359 4.20716 4.07757 3.95437 8
9 5.53705 5.32825 5.13166 4.94637 4.77158 4.60654 4.45057 4.30302 4.16333 9
10 5.88923 5.65022 5.42624 5.21612 5.01877 4.83323 4.65860 4.49409 4.33893 10
11 6.20652 5.93770 5.68694 5.45273 5.23371 5.02864 4.83641 4.65601 4.48650 11
12 6.49236 6.19437 5.91765 5.66029 5.42062 5.19711 4.98839 4.79322 4.61050 12
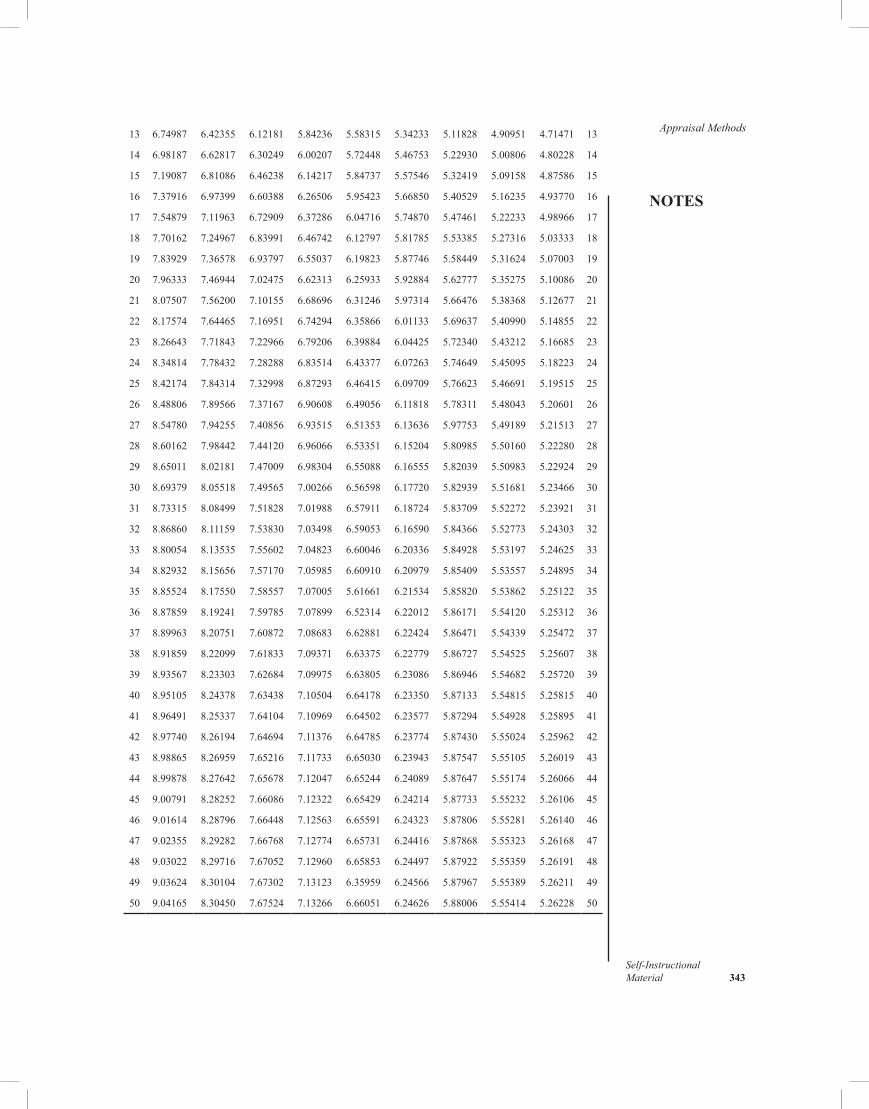
NOTES
Self-InstructionalMaterial 343
Appraisal Methods13 6.74987 6.42355 6.12181 5.84236 5.58315 5.34233 5.11828 4.90951 4.71471 13
14 6.98187 6.62817 6.30249 6.00207 5.72448 5.46753 5.22930 5.00806 4.80228 14
15 7.19087 6.81086 6.46238 6.14217 5.84737 5.57546 5.32419 5.09158 4.87586 15
16 7.37916 6.97399 6.60388 6.26506 5.95423 5.66850 5.40529 5.16235 4.93770 16
17 7.54879 7.11963 6.72909 6.37286 6.04716 5.74870 5.47461 5.22233 4.98966 17
18 7.70162 7.24967 6.83991 6.46742 6.12797 5.81785 5.53385 5.27316 5.03333 18
19 7.83929 7.36578 6.93797 6.55037 6.19823 5.87746 5.58449 5.31624 5.07003 19
20 7.96333 7.46944 7.02475 6.62313 6.25933 5.92884 5.62777 5.35275 5.10086 20
21 8.07507 7.56200 7.10155 6.68696 6.31246 5.97314 5.66476 5.38368 5.12677 21
22 8.17574 7.64465 7.16951 6.74294 6.35866 6.01133 5.69637 5.40990 5.14855 22
23 8.26643 7.71843 7.22966 6.79206 6.39884 6.04425 5.72340 5.43212 5.16685 23
24 8.34814 7.78432 7.28288 6.83514 6.43377 6.07263 5.74649 5.45095 5.18223 24
25 8.42174 7.84314 7.32998 6.87293 6.46415 6.09709 5.76623 5.46691 5.19515 25
26 8.48806 7.89566 7.37167 6.90608 6.49056 6.11818 5.78311 5.48043 5.20601 26
27 8.54780 7.94255 7.40856 6.93515 6.51353 6.13636 5.97753 5.49189 5.21513 27
28 8.60162 7.98442 7.44120 6.96066 6.53351 6.15204 5.80985 5.50160 5.22280 28
29 8.65011 8.02181 7.47009 6.98304 6.55088 6.16555 5.82039 5.50983 5.22924 29
30 8.69379 8.05518 7.49565 7.00266 6.56598 6.17720 5.82939 5.51681 5.23466 30
31 8.73315 8.08499 7.51828 7.01988 6.57911 6.18724 5.83709 5.52272 5.23921 31
32 8.86860 8.11159 7.53830 7.03498 6.59053 6.16590 5.84366 5.52773 5.24303 32
33 8.80054 8.13535 7.55602 7.04823 6.60046 6.20336 5.84928 5.53197 5.24625 33
34 8.82932 8.15656 7.57170 7.05985 6.60910 6.20979 5.85409 5.53557 5.24895 34
35 8.85524 8.17550 7.58557 7.07005 5.61661 6.21534 5.85820 5.53862 5.25122 35
36 8.87859 8.19241 7.59785 7.07899 6.52314 6.22012 5.86171 5.54120 5.25312 36
37 8.89963 8.20751 7.60872 7.08683 6.62881 6.22424 5.86471 5.54339 5.25472 37
38 8.91859 8.22099 7.61833 7.09371 6.63375 6.22779 5.86727 5.54525 5.25607 38
39 8.93567 8.23303 7.62684 7.09975 6.63805 6.23086 5.86946 5.54682 5.25720 39
40 8.95105 8.24378 7.63438 7.10504 6.64178 6.23350 5.87133 5.54815 5.25815 40
41 8.96491 8.25337 7.64104 7.10969 6.64502 6.23577 5.87294 5.54928 5.25895 41
42 8.97740 8.26194 7.64694 7.11376 6.64785 6.23774 5.87430 5.55024 5.25962 42
43 8.98865 8.26959 7.65216 7.11733 6.65030 6.23943 5.87547 5.55105 5.26019 43
44 8.99878 8.27642 7.65678 7.12047 6.65244 6.24089 5.87647 5.55174 5.26066 44
45 9.00791 8.28252 7.66086 7.12322 6.65429 6.24214 5.87733 5.55232 5.26106 45
46 9.01614 8.28796 7.66448 7.12563 6.65591 6.24323 5.87806 5.55281 5.26140 46
47 9.02355 8.29282 7.66768 7.12774 6.65731 6.24416 5.87868 5.55323 5.26168 47
48 9.03022 8.29716 7.67052 7.12960 6.65853 6.24497 5.87922 5.55359 5.26191 48
49 9.03624 8.30104 7.67302 7.13123 6.35959 6.24566 5.87967 5.55389 5.26211 49
50 9.04165 8.30450 7.67524 7.13266 6.66051 6.24626 5.88006 5.55414 5.26228 50
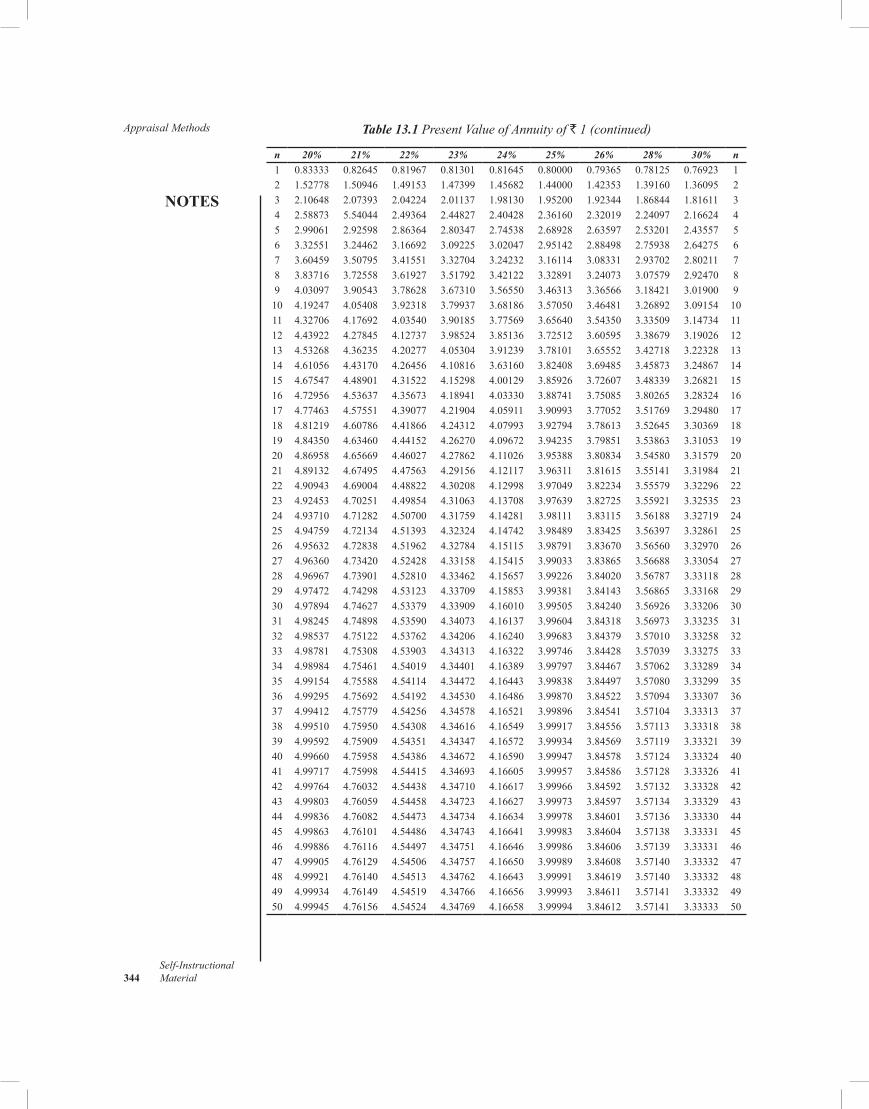
Appraisal Methods
NOTES
Self-Instructional 344 Material
Table 13.1 Present Value of Annuity of ` 1 (continued)
n 20% 21% 22% 23% 24% 25% 26% 28% 30% n
1 0.83333 0.82645 0.81967 0.81301 0.81645 0.80000 0.79365 0.78125 0.76923 12 1.52778 1.50946 1.49153 1.47399 1.45682 1.44000 1.42353 1.39160 1.36095 23 2.10648 2.07393 2.04224 2.01137 1.98130 1.95200 1.92344 1.86844 1.81611 34 2.58873 5.54044 2.49364 2.44827 2.40428 2.36160 2.32019 2.24097 2.16624 45 2.99061 2.92598 2.86364 2.80347 2.74538 2.68928 2.63597 2.53201 2.43557 56 3.32551 3.24462 3.16692 3.09225 3.02047 2.95142 2.88498 2.75938 2.64275 67 3.60459 3.50795 3.41551 3.32704 3.24232 3.16114 3.08331 2.93702 2.80211 78 3.83716 3.72558 3.61927 3.51792 3.42122 3.32891 3.24073 3.07579 2.92470 89 4.03097 3.90543 3.78628 3.67310 3.56550 3.46313 3.36566 3.18421 3.01900 910 4.19247 4.05408 3.92318 3.79937 3.68186 3.57050 3.46481 3.26892 3.09154 1011 4.32706 4.17692 4.03540 3.90185 3.77569 3.65640 3.54350 3.33509 3.14734 1112 4.43922 4.27845 4.12737 3.98524 3.85136 3.72512 3.60595 3.38679 3.19026 1213 4.53268 4.36235 4.20277 4.05304 3.91239 3.78101 3.65552 3.42718 3.22328 1314 4.61056 4.43170 4.26456 4.10816 3.63160 3.82408 3.69485 3.45873 3.24867 1415 4.67547 4.48901 4.31522 4.15298 4.00129 3.85926 3.72607 3.48339 3.26821 1516 4.72956 4.53637 4.35673 4.18941 4.03330 3.88741 3.75085 3.80265 3.28324 1617 4.77463 4.57551 4.39077 4.21904 4.05911 3.90993 3.77052 3.51769 3.29480 1718 4.81219 4.60786 4.41866 4.24312 4.07993 3.92794 3.78613 3.52645 3.30369 1819 4.84350 4.63460 4.44152 4.26270 4.09672 3.94235 3.79851 3.53863 3.31053 1920 4.86958 4.65669 4.46027 4.27862 4.11026 3.95388 3.80834 3.54580 3.31579 2021 4.89132 4.67495 4.47563 4.29156 4.12117 3.96311 3.81615 3.55141 3.31984 2122 4.90943 4.69004 4.48822 4.30208 4.12998 3.97049 3.82234 3.55579 3.32296 2223 4.92453 4.70251 4.49854 4.31063 4.13708 3.97639 3.82725 3.55921 3.32535 2324 4.93710 4.71282 4.50700 4.31759 4.14281 3.98111 3.83115 3.56188 3.32719 2425 4.94759 4.72134 4.51393 4.32324 4.14742 3.98489 3.83425 3.56397 3.32861 2526 4.95632 4.72838 4.51962 4.32784 4.15115 3.98791 3.83670 3.56560 3.32970 2627 4.96360 4.73420 4.52428 4.33158 4.15415 3.99033 3.83865 3.56688 3.33054 2728 4.96967 4.73901 4.52810 4.33462 4.15657 3.99226 3.84020 3.56787 3.33118 2829 4.97472 4.74298 4.53123 4.33709 4.15853 3.99381 3.84143 3.56865 3.33168 2930 4.97894 4.74627 4.53379 4.33909 4.16010 3.99505 3.84240 3.56926 3.33206 3031 4.98245 4.74898 4.53590 4.34073 4.16137 3.99604 3.84318 3.56973 3.33235 3132 4.98537 4.75122 4.53762 4.34206 4.16240 3.99683 3.84379 3.57010 3.33258 3233 4.98781 4.75308 4.53903 4.34313 4.16322 3.99746 3.84428 3.57039 3.33275 3334 4.98984 4.75461 4.54019 4.34401 4.16389 3.99797 3.84467 3.57062 3.33289 3435 4.99154 4.75588 4.54114 4.34472 4.16443 3.99838 3.84497 3.57080 3.33299 3536 4.99295 4.75692 4.54192 4.34530 4.16486 3.99870 3.84522 3.57094 3.33307 3637 4.99412 4.75779 4.54256 4.34578 4.16521 3.99896 3.84541 3.57104 3.33313 3738 4.99510 4.75950 4.54308 4.34616 4.16549 3.99917 3.84556 3.57113 3.33318 3839 4.99592 4.75909 4.54351 4.34347 4.16572 3.99934 3.84569 3.57119 3.33321 3940 4.99660 4.75958 4.54386 4.34672 4.16590 3.99947 3.84578 3.57124 3.33324 4041 4.99717 4.75998 4.54415 4.34693 4.16605 3.99957 3.84586 3.57128 3.33326 4142 4.99764 4.76032 4.54438 4.34710 4.16617 3.99966 3.84592 3.57132 3.33328 4243 4.99803 4.76059 4.54458 4.34723 4.16627 3.99973 3.84597 3.57134 3.33329 4344 4.99836 4.76082 4.54473 4.34734 4.16634 3.99978 3.84601 3.57136 3.33330 4445 4.99863 4.76101 4.54486 4.34743 4.16641 3.99983 3.84604 3.57138 3.33331 4546 4.99886 4.76116 4.54497 4.34751 4.16646 3.99986 3.84606 3.57139 3.33331 4647 4.99905 4.76129 4.54506 4.34757 4.16650 3.99989 3.84608 3.57140 3.33332 4748 4.99921 4.76140 4.54513 4.34762 4.16643 3.99991 3.84619 3.57140 3.33332 4849 4.99934 4.76149 4.54519 4.34766 4.16656 3.99993 3.84611 3.57141 3.33332 4950 4.99945 4.76156 4.54524 4.34769 4.16658 3.99994 3.84612 3.57141 3.33333 50
NOTES
Self-InstructionalMaterial 345
Methods of Evaluation of Alternative Capital
Expenditure ProgrammeUNIT 14 METHODS OF EVALUATION OF ALTERNATIVE CAPITAL EXPENDITURE PROGRAMME
Structure 14.0 Introduction 14.1 Objectives 14.2 EconomicRateofReturn(ERR):EconomicCost-BenefitAnalysis 14.3 SocialRateofReturn(SRR):SocialCost-BenefitAnalysis 14.4 CapitalAmortizationSchedule(CAS) 14.5 RiskAdjustedDiscountRate(RADR)
14.5.1 IntuitiveApproach 14.5.2 ConstantSharePriceApproach 14.5.3 CAPMAapproach 14.5.4 AdjustedWACCapproach
14.6 AnswerstoCheckYourProgressQuestions 14.7 Summary 14.8 Key Words 14.9 SelfAssessmentQuestionsandExercises 14.10 FurtherReadings
14.0 INTRODUCTION
Various techniques for the evaluation of capital investment or capitalexpenditureproposalshavebeendiscussedinthepreviousunit.Academiciansstronglyadvocatethediscountedcashflowtechniquesforthecapitalbudgetevaluation.TheDCFtechniquesaresaidtobeintunewiththefirm’sobjectiveofshareholderwealthmaximization,becausetheyconsiderthetimevalueofmoney.Whiletalkingabouttheindustrypracticesinthepreviouschapter,observationsweremadethatmoreandmoreIndianfirmsareshiftingtowardstheuseofDCFtechniquesfortheprojectevaluation.Almostthree-fourthof the surveyedfirmsusedDCF techniques.However, among them, theIRRwasthemostpreferredtechniquecomparedtotheNPV.AcademiciansadvocateNPVratherthanIRR,becauseinalmostallsituations,NPVservesbetter purpose.
Thecriteriaofevaluationtechniquesdiscussedinthepreviousunitareusedbythemanagementforevaluatingthefinancialviabilityofaprojectfromthecompany’sangle.Thegovernmentanditsagenciesevaluateprojects
Methods of Evaluation of Alternative Capital Expenditure Programme
NOTES
Self-Instructional 346 Material
fromtheangleofnationaleconomy.Projectsofsocialimportance(undertakenbyfirmsorgovernment)needspecialattentioninevaluation.Therefore,twomoremethodsofprojectevaluationhavecomeintothevoguenamely: (a)EconomicRateofReturn(ERR):EconomicCost-BenefitAnalysis (b)TheSocialRateofReturn(SRR):SocialCost-BenefitAnalysis
Inthisunit,youwilllearnaboutsomeothermethodsofevaluationofcapitalexpenditureprogramme,suchastheEconomicRateofReturn(ERR)andSocialRate ofReturn (SSR),CapitalAmortizationSchedule (CAS)methodand RiskAdjustedDiscountRate(RADR) method.
14.1 OBJECTIVES
Aftergoingthroughthisunit,youwillbeableto: •Discusstheeconomicrateofreturnforcapitalexpenditureevaluation •Describethesocialrateofreturn •ExplaintheCapitalamortizationscheduleandriskadjusteddiscount
rate
14.2 ECONOMIC RATE OF RETURN (ERR): ECONOMIC COST-BENEFIT ANALYSIS
Anewprojectofafirmmayhaveanimpactontheeconomyinmanyways.Revenuegenerationforgovernment,conservationorearningsofvaluableforeignexchange,creationofemploymentanddistributionofincomearemostimportantamongthem,especiallyinunderdevelopedanddevelopingeconomies.Afirm’scostandbenefitsfromtheprojectandinternalrateofreturn(IRR)earnedbytheprojectforthefirmisnotanindicatorofthenetbenefittothenation’seconomy.Economiccostsandbenefitsandeconomicrateofreturnsarecalculatedfordeterminingtheeconomicimpactofaproject.
Calculation of Economic Cost-Benefits
Costsandbenefitsofaproject to thenationaleconomyaremeasuredbymakinganadjustmentinthefinancialcashflowofaproject.Thefollowingtwotypesofmodificationsareimportant: (a)Firm’scashflowbutnotthecashflowfortheeconomy(thecashflows
thatonlychangehandswithinasingleeconomyisnottheeconomiccashflow)
(b) Issuesofimmediateconcernsforthenation.Thefirstpointisoftenquantifiablewithverylittleornojudgment.The
secondpointhasanelementofsubjectiveassessment.Boththepointsareconceptuallyexplainedbelow:
NOTES
Self-InstructionalMaterial 347
Methods of Evaluation of Alternative Capital
Expenditure Programme
Cash flow that merely change hands
Someprojectcashflowsoccurforafirmbutinthecontextofthenationaleconomy, itmaynot be a cashflow.These items are excluded from thecalculation of economic cashflow.The following can bementioned asexampleswherethefirm’scashflowisnotthecashflowfortheeconomy: (a)Subsidyreceivedbythecompanyonprojectinvestment (b) Incometaxandotherdirectandindirecttaxexpensesintheproject
report Also,theuseofresourcesthatdonotresultintothedepletionofnational
resourcesisnotconsideredaseconomiccashflowthoughitmaybeafinancialcashflowforthefirm.Someexamplesare:
(c)Wages,onlyifinthesituationofwidespreadunemployment,whichismorecommonamongunskilledlabourinIndia.Inthiscase,wagespaidbythefirmdonotamounttothedepletionofresources,becauselabourhour isanon-storableservicewhich;otherwise,willremainidleandwasted.However,iftheproposedprojectisjustdisplacingtheworkersfromtheothergainfulemployment,itissurelytheeconomicexpensetoo.Itmaybenotedthatfinancial(firm’s)cashflowandeconomic(national)
cashflowmaynotbethesamebecauseeitheritismerelyachangeofhandswithin thesameeconomyor thefirmisusing idleresourcewhichwouldhavedepletedanyway.
Issue of national concern
Nationsmayhaveseveralconcerns.Someofthemincludeconservationofsomeresources, impacton incomedistribution,social infrastructure (likeeducationandresearch)andforeignexchange.Afirm’sfinancialcashflowwouldtakeactualvalueoftheresourcesconsumedandearned:forexample,offoreignexchange.But,economicvalueofthosecashflowsmaybedifferentbecausetheseresourcesaredearertothenationaleconomy.Therefore,theeconomicvalueofsuchfinancialcashflowmustbeadjustedeitherupordown,dependinguponhowmuchdeareachoneofthemis.
Letustakeanexampleoftheforeignexchangecomponentofaproject.Foreignexchangeisdeartomanynations,especiallytounderdevelopedanddevelopingnationsbecausetheyusuallyexperiencethetradedeficitorthebalanceofpaymentisunfavourabletothem.Foreignexchangeisaseriousconcern for such economies.Many corporate projects involve import ofequipmentsandmachinery,importandexportofgoodsandservicesandinsomecases,paymentfordividendsinforeignexchange.Someothersreduceimportastheyproduceimportsubstituteitems.Thefirmwilltaketheactual
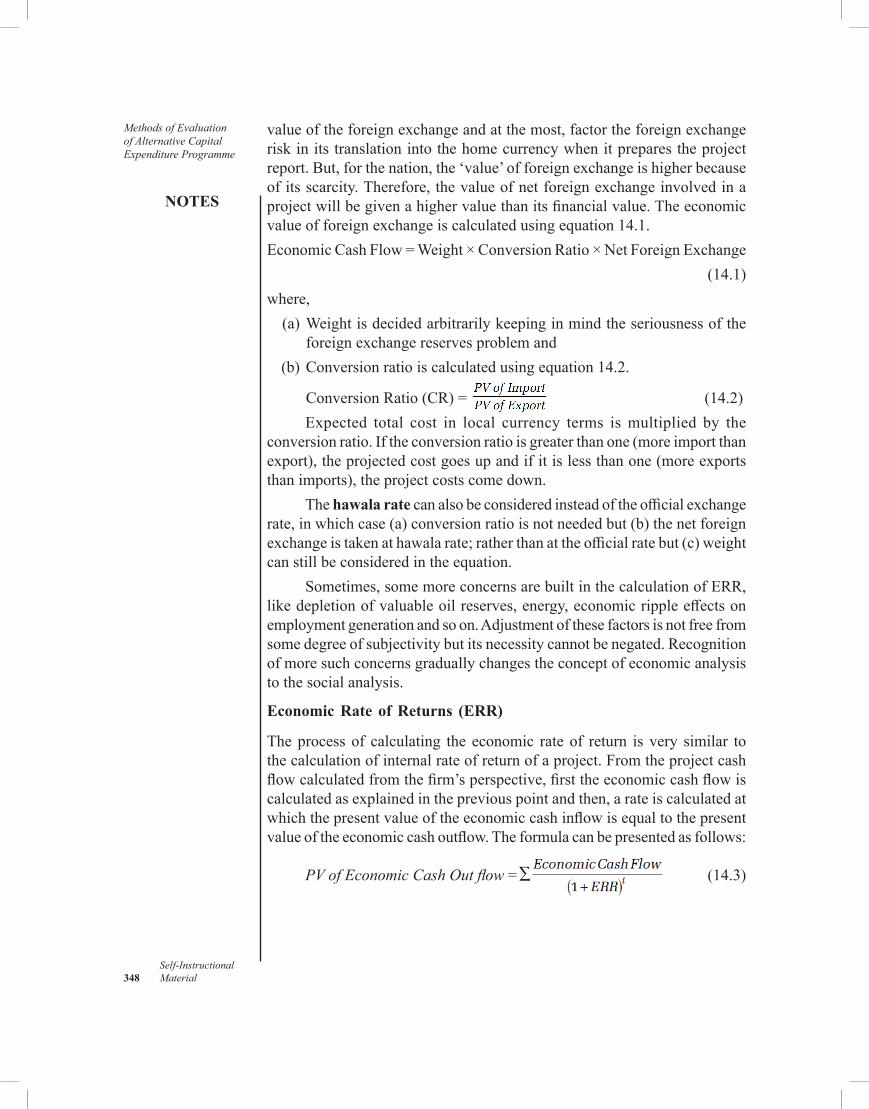
Methods of Evaluation of Alternative Capital Expenditure Programme
NOTES
Self-Instructional 348 Material
valueoftheforeignexchangeandatthemost,factortheforeignexchangeriskinitstranslationintothehomecurrencywhenitpreparestheprojectreport.But,forthenation,the‘value’offoreignexchangeishigherbecauseofitsscarcity.Therefore,thevalueofnetforeignexchangeinvolvedinaprojectwillbegivenahighervaluethanitsfinancialvalue.Theeconomicvalueofforeignexchangeiscalculatedusingequation14.1.EconomicCashFlow=Weight×ConversionRatio×NetForeignExchange
(14.1)where, (a)Weightisdecidedarbitrarilykeepinginmindtheseriousnessofthe
foreignexchangereservesproblemand (b)Conversionratioiscalculatedusingequation14.2.
ConversionRatio(CR)= (14.2)Expected total cost in local currency terms ismultiplied by the
conversionratio.Iftheconversionratioisgreaterthanone(moreimportthanexport),theprojectedcostgoesupandifitislessthanone(moreexportsthanimports),theprojectcostscomedown.
Thehawala ratecanalsobeconsideredinsteadoftheofficialexchangerate,inwhichcase(a)conversionratioisnotneededbut(b)thenetforeignexchangeistakenathawalarate;ratherthanattheofficialratebut(c)weightcanstillbeconsideredintheequation.
Sometimes,somemoreconcernsarebuiltinthecalculationofERR,likedepletionofvaluableoilreserves,energy,economicrippleeffectsonemploymentgenerationandsoon.Adjustmentofthesefactorsisnotfreefromsomedegreeofsubjectivitybutitsnecessitycannotbenegated.Recognitionofmoresuchconcernsgraduallychangestheconceptofeconomicanalysistothesocialanalysis.
Economic Rate of Returns (ERR)
Theprocessof calculating the economic rateof return isvery similar tothecalculationofinternalrateofreturnofaproject.Fromtheprojectcashflowcalculatedfromthefirm’sperspective,firsttheeconomiccashflowiscalculatedasexplainedinthepreviouspointandthen,arateiscalculatedatwhichthepresentvalueoftheeconomiccashinflowisequaltothepresentvalueoftheeconomiccashoutflow.Theformulacanbepresentedasfollows:
PV of Economic Cash Out flow = (14.3)
NOTES
Self-InstructionalMaterial 349
Methods of Evaluation of Alternative Capital
Expenditure Programme
where, tisthetimeperiodThenationwillhaveitsownacceptableERR.IftheERRoftheproject
isgreaterthantheacceptableERR,theprojectisacceptabletothenation.TheconceptandcalculationofERRisusefulindeterminingseveralfiscalpoliciesofthenation,whichwouldprimarilyincludeincentivesanddisincentivesfor private projects.
In the context of India, yet another example can bementioned—infrastructureprojects.SettingupapowerplantortheconstructionofroadisessentialfortheeconomicdevelopmentofIndia.Cascadingeffectofpowergenerationorroadontheeconomyissignificant.Therefore,neteconomicbenefitsofapowerplant to thenationwouldbehigher than itsfinancialbenefittothepromoters.Apartoftheeconomicbenefitscanbepassedontothecompanyastheirfinancialbenefitsviasomeincentives(e.g.,taxbreak)andguarantees(e.g.,rateguarantee).
14.3 SOCIAL RATE OF RETURN (SRR): SOCIAL COST-BENEFIT ANALYSIS
The concept ofERRcanbe expanded to encompass the social cost andbenefitsandtherebycalculatethesocialrateofreturn.Thismethodofprojectevaluationisalsopopularlyknownassocialcost-benefitanalysis(SCBA).Governmentandsocialprojectsareevaluatedonthelineofsocialcost-benefitanalysis.Manyinternationalfundingagencieswouldfinanceasocialprojectbasedonitssocialrateofreturn.
SCBA is a very subjectivemethod but conceptually sound.Thefollowingbrieftextgivesaconceptualexplanation.Thedetailsarekeptoutofthedomainofthisbook.Thereaderswhoareinterestedinreadingauthenticmaterial onSCBA should read ‘Manual for theEvaluation of IndustrialProjects’,UNIDOpublication,1980(reprinted1993).Also‘AGuidetotheEconomicAppraisalofProjectsinDevelopingCountries’,bytheMinistryofOverseasDevelopment(1978)ofGreatBritaincanbeuseful.
Financialanalysisiscarriedoutfromtheangleofinvestorsorfirm.Investors’netmonetarybenefitsare in thecentreoffinancial analysisofprojects.Itwasdiscussedinthemethodofeconomicrateofreturnthattheeconomic analysis is employedwhen the government is interested in itspureeconomicconsiderations.Socialimplicationsofaprojectcanalsobeencompassedintheanalysisandsocialrateofreturncanbecalculated.
Non-Quantifiable Cost-Benefits in Projects
Financialcost-benefitisfromtheangleofafirm,economiccost-benefitisfromtheangleofanation’seconomy.Bothinvolveassessmentofidentifiable
Methods of Evaluation of Alternative Capital Expenditure Programme
NOTES
Self-Instructional 350 Material
rupeevalueofcostsandbenefitsforeitherthefirmorforthenation.Economiccost-benefitanalysiswillbedonebygovernmentandgovernmentagenciesindeterminingtheincentivesanddisincentivestobusinesseseitherintermsofconcessionalrateofpowersupplyorsupplyofcheappaperorguaranteedsupplyofscarceresourcesorofferingguaranteeslikerate-guaranteeandsoon.
Some projects, private or government, generate non-quantifiablecost-benefits.Manyprojectsofthiskindareinitiatedtoprovideeconomicimpetusandnotfortappingthecurrentlyavailableopportunities.Therippleeffectsofsuchprojectscannotbemeasuredineconomictermsasseveralcostsandbenefitsarenon-quantifiableat least immediately:forexample,constructionofadamhasseveralsocialcostslikedisplacementofhabitats,loss of agricultural land, potential effect on ecology and so on, againstmanysocialbenefitslikeirrigation,floodcontrol,beautificationandtourismpotential,etc.Thelandscapeoftheareamaychangetobenefitsomeandharmsomeothersonimmediatetermsandlong-termbasis.TheKonkanRailwayprojectisanotherexamplewhichcanbementionedhere.TheperspectivewasthatoncetheKonkanrailwaywouldbecompleted,theareathatitpassesthrough,maystartdeveloping,evenifitisadifficultterrain.However,itcouldnotbeascertainedwhatwouldbetherateofdevelopmentandwhenthedevelopmentcouldhappen.Butsuchprojectsdohaverippleeffects.Ineconomically backward areas, social infrastructure projects like literacyprogrammes,educationinitiativesandfamilyplanningprogrammescreateconditionsforeconomicgrowth.Thenon-quantifiablecostsandbenefitsinsuchprojectsareplenty.Suchprojectsbreakthecyclethatkeepstheregionbackward.Theycannotbeevaluatedeitheronfinancialoreconomicgrounds.
Inprivateprojects,akindofSCBAwouldhelpinshapinggovernmentpoliciesandpoliciesof foundationswhowork for thecommunity.Someimmediateconcernsarebuiltintothesocialcost-benefitanalysisofprivateprojectstodeterminethelevelofgovernmentincentivesanddisincentives.Today,globalwarmingisanissue.Theimpactofglobalwarmingmaynotbefeltintheforeseeablefuturebutatleastall(evenbeyondthescientificcommunity) have started agreeingnow that globalwarming is a seriousissue.Therefore,anyprojectthataffectstheozonelayerislessdesirableanddeservesdisincentivesandotherprojectslikeresearchforalternateenergyor projects using alternative energy deserve incentives.Thus, today theenvironmenteffectmustbebuiltintothesocialcost-benefits.
Therefore,allagenciesthataimatsocialwelfare,likegovernmentandinternationalinstitutionsliketheWorldBank,InternationalMonetaryFundandUNIDOwillusesocialcost-benefitanalysisfortheevaluationofprojects.
NOTES
Self-InstructionalMaterial 351
Methods of Evaluation of Alternative Capital
Expenditure Programme
Basics of Social Cost-Benefit Analysis
Socialprojectsof thegovernmentand thosefinancedby thegovernmentwillbeappraisedonSCBAlines.Thefollowingfactorswarrantsocialcost-benefitanalysis: •Marketimperfection •Externalities,taxesandsubsidies •Concernforsavings •Concernforredistribution •Meritwants
Most of the factormarkets are imperfect.The degree ofmarketimperfectionishighinunderdevelopedanddevelopingnations.Resourcesdonotgetfairlypricedduetoimperfection.Marketimperfectionismanifestedinimmobilityofresourcesorinmobility-shyresources.Landisnotmobile.Lackofinfrastructurekeepsawaythebusinessfromfarawayplaceswherelandmaybeverycheap.Labourismobilityshyduetofamilyandsocialreasons,coupledwith inadequate communication facilities and immigration laws.Otherresourceslikematerialarealsonotfreelymobileduetotransportation,bankingandwarehousingfacilitiesandassociatedcostsandgovernment-imposedrestrictionsworsenthemechanismofpricingofresourcesplannedasapartoftheproject.Duetosuchreasons,marketpricesdonotreflectthetrueeconomicprices,requiringtheuseofshadowpriceforthevaluationofcostsandbenefits.
Typical low savings and investment rates are also the features ofunderdeveloped and developing nations.Any project,which generatessavings,willdoeconomicgoodtothenationbecausethecascadingeffectsofsavingswillbeexperiencedbytheeconomy.Similarly,unequaldistributionofincomeandincomegeneratingopportunitiesarealsomattersofconcernforsuchnations.Aproject,whichresultsineffectiveredistributionofincome,ismorevaluablethanthoseprojectswhereincomeisconcentratedinafewhands.Someoftheresourcesconsumedorproducedmaybedearer(meritgoods) than the others.These factors of generation of savings, incomeredistribution and consumption or production of merit goods must be assigned ahighervalueastheyaretheimmediateconcernsofdevelopingnations.
UNIDO Approach for SCBA
Asinanyprojectevaluation,SCBAalsoinvolvesestimatingcostsandbenefitsintermsofcashflowanddeterminingdiscountratesothatnetpresentvalueoftheprojectcanbecalculated.
Methods of Evaluation of Alternative Capital Expenditure Programme
NOTES
Self-Instructional 352 Material
Estimating social cash flow
UnitedNationsInternationalDevelopmentOrganization(UNIDO)followsfivesteps(firsttwoplusthreesub-stepslistedinthethirdpointbelow)inestimatingcashflowintheSCBAapproach. (a)Calculationoffinancialprofitabilityofaproject,measuredatthemarket
price of resources and output (b)Calculation of the net benefits of projectsmeasured in terms of
economicprices.Someresourcesarepricedatinternationalpricesandforsomeresources,shadowpricesareconsidered
(c)Adjusttheneteconomiccostsandbenefitswiththefollowingimpactsoftheprojecttogetsocialcostandbenefits:• Savingsandinvestments• Incomeredistribution• Meritsanddemeritsgoods
Calculating financial cost-benefits
Thefirststepofmeasuringthefinancialprofitabilityofaprojectatmarketprice, involves evaluationof the project from the company’s angle only.Whenitistranslatedintotheeconomiccost-benefits,somecostsandbenefitsareexcludedbecausetheyonlyamounttochangeofhandsintheeconomyasstatedinthediscussiononERRandtheeconomiccostandbenefitsarepricedateconomicrates,ratherthanmarketsrates.
Calculating economic cost-benefits
Goodsproducedandconsumedbytheprojectmustbehandledinthreesub-steps,namely, (a)Separatenon-economiccost-benefitsfromeconomicbenefits (b) Identifytradable goodsandpricethem (c) Identifynon-tradable goodsandpricethem
Asdiscussedearlier, someflowofmoney infinancialcost-benefitsmaynotinvolveanyeconomiccostsorbenefits.Thesecashflowsmustbeexcludedfromthesocialcostbenefitanalysis.Specificfinancialcashflowbeinganon-economiccashflowisalwayseconomyspecificissue.Therefore,UNIDOhasdevelopedapplicationmodelsfordifferenteconomies.
Therearethreealternativepricingspossibleforthegoodsandservicesnamely,
• Market(producer’s)price• Free-tradeprice(worldprice)• Shadowprice,andsecondbestshadowprice
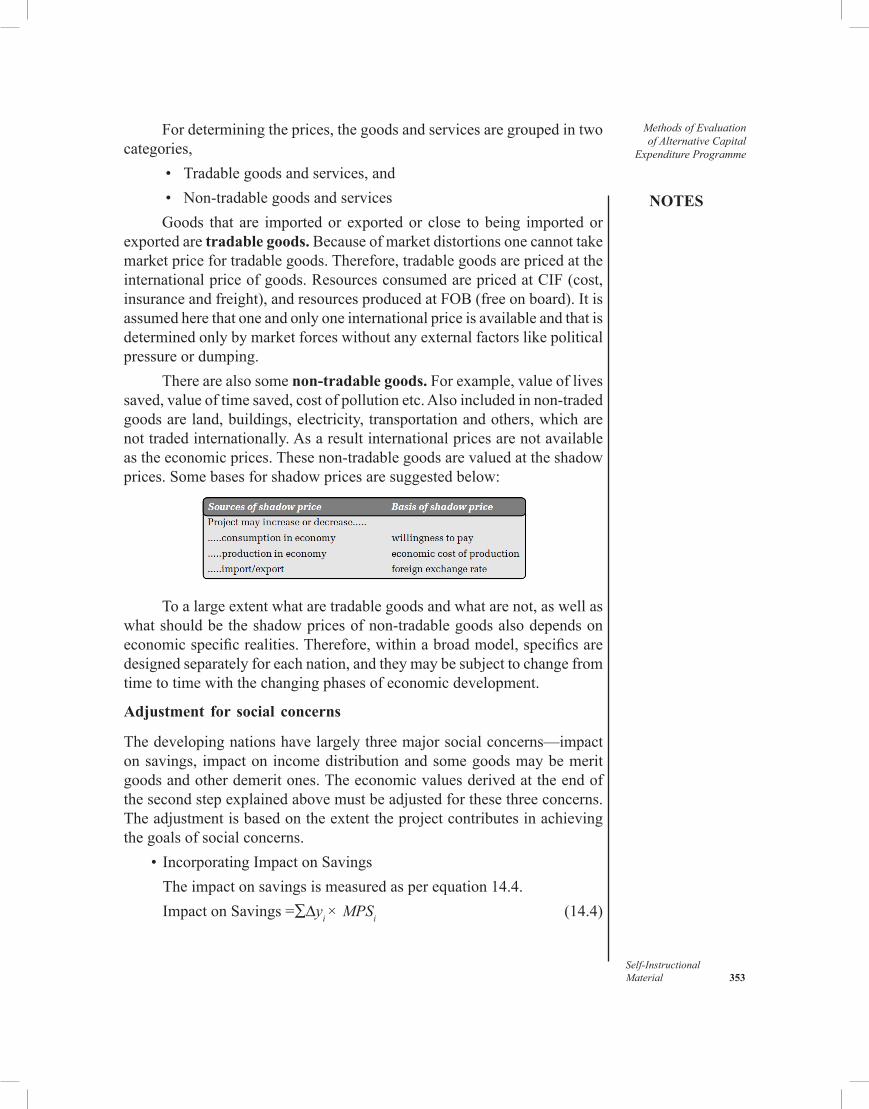
NOTES
Self-InstructionalMaterial 353
Methods of Evaluation of Alternative Capital
Expenditure Programme
Fordeterminingtheprices,thegoodsandservicesaregroupedintwocategories,
• Tradablegoodsandservices,and• Non-tradablegoodsandservicesGoods that are importedor exportedor close tobeing importedor
exportedaretradable goods.Becauseofmarketdistortionsonecannottakemarketpricefortradablegoods.Therefore,tradablegoodsarepricedattheinternationalpriceofgoods.ResourcesconsumedarepricedatCIF(cost,insuranceandfreight),andresourcesproducedatFOB(freeonboard).Itisassumedherethatoneandonlyoneinternationalpriceisavailableandthatisdeterminedonlybymarketforceswithoutanyexternalfactorslikepoliticalpressure or dumping.
Therearealsosomenon-tradable goods.Forexample,valueoflivessaved,valueoftimesaved,costofpollutionetc.Alsoincludedinnon-tradedgoodsareland,buildings,electricity,transportationandothers,whicharenottradedinternationally.Asaresultinternationalpricesarenotavailableastheeconomicprices.Thesenon-tradablegoodsarevaluedattheshadowprices.Somebasesforshadowpricesaresuggestedbelow:
Toalargeextentwhataretradablegoodsandwhatarenot,aswellaswhatshouldbetheshadowpricesofnon-tradablegoodsalsodependsoneconomicspecificrealities.Therefore,withinabroadmodel,specificsaredesignedseparatelyforeachnation,andtheymaybesubjecttochangefromtimetotimewiththechangingphasesofeconomicdevelopment.
Adjustment for social concerns
Thedevelopingnationshavelargelythreemajorsocialconcerns—impactonsavings, impactonincomedistributionandsomegoodsmaybemeritgoodsandotherdemeritones.Theeconomicvaluesderivedattheendofthesecondstepexplainedabovemustbeadjustedforthesethreeconcerns.Theadjustmentisbasedontheextenttheprojectcontributesinachievingthegoalsofsocialconcerns. • IncorporatingImpactonSavings Theimpactonsavingsismeasuredasperequation14.4. Impact on Savings =∑∆yi × MPSi (14.4)
Methods of Evaluation of Alternative Capital Expenditure Programme
NOTES
Self-Instructional 354 Material
where,Δyi=changeinsavingsinyeari MPS=marginalpropensityofsavingsinyeari
The value of rupee of savings is the present value of additionalconsumptionstreamproducedwhenthatrupeeofsavingisinvestedatthemargin.Asathumbrule,itisbelievedthatonerupeeinvestedinagriculturegenerates say `7, industry`10, infrastructure projects`30 and socialinfrastructuregeneratesanetvalueof`70. • IncorporatingImpactonIncomeRedistribution
Theimpactonincomeredistributionismeasuredintermsofwillingnesstopay.Varioussectorsorparties, like theproject itself,otherbusinesses,government,workers,consumersandothers,maygainor losedueto theproject.Theirwillingnesstopay(orcharge)forgoodstheyreceive(orlose)isestimated.However,themethodsofestimationmaybemuchlessobjective.Forexample,asurveymethod,whichinvolvesadministrationofquestionnairemaynotofferreliableshadowpricebecauseoflackofexperienceofgoodsandalsobecauseofpsychologicalissuesiftheyaretheloserofgoods.Onecandetermineweight(price)byusingelasticityofmarginalutilityofincomebasedontheequation14.5.
Wi = (14.5)
where,Wi=weightassignedtoincomeatthelevelofCi B=base-levelincome,withweightof1 n=elasticityofmarginalutilityofincome
• IncorporatingImportanceofGoodsMerit goods are the oneswhose social value is greater than their
economic value. For example, conservation of oil and generation ofemploymentaremorevalueditems.Energyisameritgood.Someothersaredemeritgoods,wheresocialvalueislessthaneconomicvalue.Cosmeticsaredemeritgoods.Thelistofmeritanddemeritgoodsandtheirimportancemay vary from nation to nation.
Economicpricesofresourcesareadjustedupwardordownward,asthecasemaybe,ontheconsiderationofsavings,incomedistributionandmeritordemeritgoods.Theadjustmentfactorsforvariousresourcesaregenerallypre-decidedbyanagency,likeUNIDOforeachcountry.Thesefactorsareperiodicallyreviewedinthelightofchangedconditions.
Thestreamofsocialcostsandbenefitsisobtainedafterthefivestepsdescribed above.
NOTES
Self-InstructionalMaterial 355
Methods of Evaluation of Alternative Capital
Expenditure Programme
Little-Mirrlees Approach to SCBA (L-M Manual)
Inthefieldofsocialcost-benefitanalysis,theotherapproachwhichismorediscussedisLittle-Mirrlees(L-M)approachormanual.Little-Mirrlees(1969)wrotethisapproachforO.E.C.D.(OrganizationforEconomicCooperationandDevelopment),thisapproachcreatedseveralcontroversies,whichresultedintomanyothersauthorstoojoiningtheattemptofexplanationandfurtherclarification.
ThebasicconceptofSCBAinUNIDOapproachandinL-Mapproachisthesame.Mostapproachesarealsosame,butsomecountriesandtheWorldBankuseL-Mapproachbecauseitgivesready-to-usedetailedprocedureforcomputationofdifficultshadowprices.ThemaincontributionofL-Misinbringingsimplicitybythewayofusing‘worldprices’or‘realforeignexchangeprices’asshadowpricesforallgoodswhethertradableornon-tradable.Itisbasedontheassumptionthatinternationalmarketisperfectorefficient.L-Mapproachsuggeststhat, • Usec.i.f.(cost-insurance-and-freightorimport)priceifthegoodsthe
producedintheeconomyreduceimport • Usef.o.b.(free-on-boardorexport)priceifthegoodsproducedinthe
economyareavailableforexport.Now,onecan see a similaritywithUNIDOapproach in the above
suggestions,butthedifferenceisthatthesesuggestionsareevenapplicabletothepricingofnon-tradablegoods.StilltheLittle-Mirrleesapproachislesswidelyusedthanwasinitiallyexpected(Squire,1996).
Estimating Social Discount Rate
Oneneedstodeterminetherateatwhichcashflowmustbediscountedforcalculatingthenetpresentvalue.Alternativelyonecancalculatetheinternalrateofreturnsforagivencashflow.TheinternalrateofreturnintheSCBAisknownassocial rate of return (SRR).SRRistherateatwhichthepresentvalueofcashinflowisequaltothepresentvalueofcashoutflow.However,SRRhastobecomparedwithabenchmark,whichissocialdiscountrate(orsocialrequiredrateofreturn).Thus,whetherNPViscalculatedorSRR,oneneedstoknowthesocial discount rate.
Applyingtheopportunitycostrule,theSRRfromtheprojectforegoneinfavourofthisprojectshouldbetakenasasocialrequiredrateofreturnorsocialdiscountrate.Somealternativesare:
• After-taxinterestrate• Consumptionrateofinterest• Foreignexchangeinthehandsofgovernment
Methods of Evaluation of Alternative Capital Expenditure Programme
NOTES
Self-Instructional 356 Material
After-tax interest rate ismore appropriate from thefirm’s angle incalculatingfinancialrateofreturn.Intheabsenceoftheopportunityreturn,theconsumptionrateofinterestcanbetakenasthecut-offrate,asdoneinUNIDOapproach.L-Mapproachisinfavourofusing‘investmentdiscountrate’.Thediscountrateshouldthenbetherelativevalueoffutureversuspresent foreign exchange held by the government.They argue that in adeveloping country’s context,marginal foreign exchange in the hand ofthegovernmentwillbeusedforinvestment,sothediscountrateshouldbeaninvestmentdiscountrateratherthanaconsumptiondiscountrate.Someothersargueandrecommendintegratingequityconcernsbecausethefundsusedby the governments especially have intergenerational equity effect.Intergenerational equity occurs in deficit financing activity, because theburdenofdeficitfinancingisonthefuturegeneration,implyingthatthecostofequityinthefutureisrelevantasadiscountrate.Thus,intergenerationalequitycostshouldbeconsideredasthesocialrequiredrateofreturn.
Check Your Progress
1.Mentiontheexampleswherethefirm’scashflowisnot thecashflowfortheeconomy.
2.Whatistheprocessofcalculationofeconomicrateofreturnsimilarto?
3.Listthefactorswhichwarrantsocialcost-benefitanalysis. 4.Whataresomeofthenon-tradablegoodsusedforcalculationof
economiccost-benefits?
14.4 CAPITAL AMORTIZATION SCHEDULE (CAS)
Amortizationisanaccountingtechniqueusedtoperiodicallylowerthebookvalueofaloanorintangibleassetoverasetperiodoftime.Inrelationtoaloan,amortizationfocusesonspreadingoutloanpaymentsovertime.Whenapplied toanassetorcapital, amortization is similar todepreciation.Allcapitalassetswearoutordeclineinusefulnessandvalueastheybecomeagedandareused,thusanamortizationexpensemustberecorded.Accountingamortizationistheprocessofallocatingormatchingthecostofcapitalassetsoverthetimethattheyareused.Costofcapitalassetsshouldbeamortizedovertheirusefullives.
TheCASmethodintroducedisfoundtobeaperfectsubstitutefortheDCFmethod.TheCASmethodistransparentandhasmanyadvantagesdiscussedhere.Thismethod,unliketheDCFmethod,clearlyidentifiesandquantifiesthereinvestment.TheCASmethodrevealsthatreinvestmentleadstomultipleIRRandspuriousNPV.Hitherto, thespuriousnatureofNPV
NOTES
Self-InstructionalMaterial 357
Methods of Evaluation of Alternative Capital
Expenditure Programme
causedbythereinvestmentisneitherstudiednorreportedandthereforetheNPVrulehasbeensupported.ThemodifiedCAS(MCAS)methodeliminatesthereinvestmentandtherebyresolvestheproblemofmultipleIRRandleadstoauniqueandreal IRRandeliminates thespuriousNPVtoo. Itallowsestimating the IRRasa returnon the totalcapital investmentandon thedecliningbalanceofcapital.
There are three factors used in determining amortization expense.Theyare:
(a) Cost of Capital Asset
Thecostofacapitalassetisallnecessaryandreasonableexpensesincurredtopreparetheassetforitsintendedpurposeoruse.
(b) Salvage Value
Salvagevalueisalsoknownasresidualorscrapvalue.Salvagevalueistheestimatedamountofmoneythecorporationexpectstoreceivefromsellingordisposingofftheassetattheendofitsusefullife.Othercompaniesalsoprefertradingofftheirassetforaquickertransaction.
(c) Useful Life
Theuseful life of aCapital asset is the estimated#of years the asset isexpectedtobeusedinbusinessoperationsofthecompany.Alsoknownas‘servicelife’,usefullifeisnotnecessarilytheasset’stotalproductivelife.Forexample,thetotalestimatedlifeofabrandnewcomputeris3–4years,yetmanylargeorganizationsprefertotradeintheiroldcomputersfornewonesevery2years.Inthisregard,thecomputerswouldhaveausefullifeoftwoyears.
Predictingtheusefullifeofanassetisahardthingtodobecauseofseveralreasons.Theseincludewearandtearfromnormalbusinessoperations,obsolescenceandinadequacy.Whenanorganizationisgrowingfast,itsassetsbecomeobsoletefaster,asthecompanyneedsnewimprovedtechnologyorhardwaretokeepgrowing.Thus,inadequacyreferstotheconditionwherethecapacityofthecompany’scapitalassetsisnotstrongenoughtomeettheneedsofitsoperations.Obsolescencereferstowhenduetosophisticatednewtechnologicaladvancementsandimprovements,thecompany’scurrentcapitalassetsbecomeobsoleteandneedtobereplaced.Thecompanyusuallydisposesofftheobsoleteassetbeforeitreachesitsfullusefullife.
14.5 RISK ADJUSTED DISCOUNT RATE (RADR)
Riskadjustmentistherealissueinthedeterminationofthecut-offrateforprojects.Whenthediscountrateiscalculatedaftertheadjustmentforrisk,it
Methods of Evaluation of Alternative Capital Expenditure Programme
NOTES
Self-Instructional 358 Material
iscalledriskadjusteddiscountrate,popularlyknownasRADR.AsimplisticformulaforRADRwilllookliketheonebelow:
RRR = RADR = Rf+Rp (14.6)where, Rf =risk-freerate Rp =riskpremiumFourdifferentmethodscanbeprescribedforRADRcalculation.The
listoffourmethodsisgivenbelow:• Intuitiveapproach• Constantsharepriceapproach• CAPMapproach• AdjustedWACCapproachOfthesefourmethods,thelastoneisthepragmaticapproach,widely
prescribedforRADRcalculation.
14.5.1 Intuitive Approach
Riskpremiumcanbeestimatedbasedonintuitivejudgment,andaddedintotheriskfreerateprevailingintheeconomy.Generally,theinterestrateongovernmentsecuritiesisconsideredastherisk-freerate.Theloadoftheriskpremiumissubjectivelydecided.Firmsusuallypredeterminedifferentriskpremiumsfordifferenttypesofprojects.Forexample,3percentpremiumforreplacementofmachinery,5percentforexpansion,8percentfornewproductdevelopmentand12percentforresearchprojects,maybeconsideredastheriskpremium.Thesubjectivitycanbereducediftheriskpremiumisestimatedonthebasisofthedegreeofoperatingleverageoftheproject.
Thismethodsuffersfromallthelimitationsofanysubjectivemethodofdecisionmaking.Moreover,itdoesnotconsidertheportfolioriskeffectoftheproject.Ahigh-riskbusinesscanacceptanotherriskyprojectandstilloverallriskofbusinessmaydeclineifthecashflowfromthecurrentbusinessandthatfromthenewprojectareinverselycorrelatedwitheachother.Thiswouldjustifytheuseoflowerdiscountrate,butintuitiveapproachdoesnotconsidersuch‘portfolio’effectonriskandreturns.
14.5.2 Constant Share Price Approach
Theintuitivemethodassumesthattheriskoftheprojectdependsupontheclassofproject, theportfolio risknotbeing relevant.Theconstant sharepriceapproachfordeterminingtherisk-adjusteddiscountrateisconcernedaboutthenetchangeintheoverallriskofthebusinessduetotheinclusionofaproposedprojectintheportfolio.Therefore,thismethodisalsoknownas‘portfolioeffectadjustment’.Theconditioninthiscaseisthat‘thenewprojectmustearnatleastthatmuchwhichisenoughtomaintainthecurrentlevelofshareprice(wealth)’.
NOTES
Self-InstructionalMaterial 359
Methods of Evaluation of Alternative Capital
Expenditure Programme
14.5.3 CAPM Aapproach
Thecapitalassetpricingmodel(CAPM)calculatestheexpectedreturnbyshareholders.TheCAPMformulaisasfollows:
Ke= Rf+(Rm–Rf)bi (14.7)where, Rm= returnonmarketport-folio Rf= risk-freerate b= systematic risk of the company (covarianceof
returnonfirm’sshareandmarketreturn)Shareholderscalculatetheirexpectedreturnbystudyingthesecurity
returns.Likewise,abusinessfirminvestsinvariousprojects.Ifshareholdersaresubstitutedwithfirmsandequityshare(security)withprojects,theCAPMcanbeappliedforthecalculationoftherequiredrateofreturnbyafirmfromitsinvestmentinaproject.ForapplicationoftheCAPMinaprojectsituation,Rm (market return)will be the returns from awell- diversified projectportfolio,andßi willbethecovarianceofreturnsfromtheproposedprojectwithprojectmarket returns.Here,manydifficultiesmaybeencountered,someofwhichmaybe: • Unlikethesharemarket,thereisno‘projectmarket’.Therefore,project-
marketreturndatacanbeonlysurrogatedata.Onemayhavetosettlefortheaveragereturnintheeconomyasasubstituteforprojectmarketreturn.
•Unlikethehistoryofafirm’sshares,thehistoryofprojectreturnisnotyetknownastheprojectisattheplanningstage.ThisisadifficultysimilartofindingtheCAPM-basedKewhenequitysharesareeithernotlistedornottradedonastockmarket.
•Thesolutiontothedifficultydescribedinthesecondpointabovecanbefoundifaproxyprojectisavailable.Aproxyprojectistheonewhichissimilartotheproposedprojectofthecompany,andthatisalreadyonstream.Thereturnsfromtheproxyprojectandprojectmarketreturnscanbestudied.Therelationshipbetweenthereturnsfromproxyprojectandprojectmarketreturncanbeconsideredastheindicatorofexpectedreturnsontheproposedproject.However,yetanotherdifficultymaybeencounteredhere.Aproxyprojectmaybeofacompanywhosecapitalstructureisdifferentthanthatofthecompanyinquestion.Thisdifficultycanbeovercomebyadjustingforthedifferenceinthedebt-equityratio.
Thefollowingstepsare followedfor thecalculationof theCAPM-basedrisk-adjusteddiscountrateforacorporateproject. (a)Findthereturnsonprojectmarket. (b)Findaprojectofsimilartypeandsize,alreadyundertakenbysome
otherfirm,andcollectdataforthatproxyproject’sreturn.
Methods of Evaluation of Alternative Capital Expenditure Programme
NOTES
Self-Instructional 360 Material
(c)Findboftheproxyprojectreturnswiththeprojectmarketreturns. (d)Adjustfordebt-equitydifferencebetweenthefirmoftheproxyproject
andthefirmwhichplanstoundertaketheproposedproject.
14.5.4 Adjusted WACC approach
TheCAPMsuffersfromlimitationswhenitisappliedtotheprojectsituation.Therefore,onehastosearchforanalternativemethodfortheadjustmentof risk.Thecostofcapitalcanbe takenas thebasisanddifferential riskpremiumcanbeadjustedinitforfindingtheriskadjusteddiscountrate.Thisisexpressedintheequationformasfollows:
RADR=WACC±ΔRp (14.8)
where, ΔRp indicates differential (change in) risk premiumIfthenewprojectisinthesameriskclassanditisunlikelytochange
theriskprofileofthebusiness,DRpwillbezero.Thenewproject,hence,isdiscountedattheweightedaveragecostofcapital.Theoretically,CAPM-basedRADRandWACCbasedRADRwillbeequal.ItwillalsogivethesameresultasthebasicequationofRADR(RADR=Rf+Rp).
Thismethodisverysimilartothe‘ConstantSharePriceApproach’ofdeterminingRADR.Thedifferenceliesinthebasedataconsumed.InsteadofEPS,in‘ConstantSharePriceApproach’,thecostofcapitalistakenasabasisintheadjustedWACCApproach.
TheadjustedWACCapproachcanbepracticedinthefollowingsteps:• CalculateWACCbeforetheannouncementoftheinvestmentand
financingplansofthefirm.• Announcethedetailsoftheinvestmentandfinancingplansforthe
nextperiodtocome.• Allowthemarkettorespondtotheannouncement,andwatchthe
marketpricesstabilizingaftertheannouncement.• Take the newvalues of bonds and stock and calculate the new
WACCaftertheannouncement.ThenewWACCisthereflectionofchange,ifany,inthefirm’srisk.
• Then,calculatetheRADRanduseitastherequiredrateofreturnfromthenewprojects.
Check Your Progress
5.WhatistheCAStheperfectsubstitutefor? 6.Whyispredictingtheusefullifeofanassetisahardthingtodo? 7.State the assumption behind the intuitive approach toRADR
calculation.
NOTES
Self-InstructionalMaterial 361
Methods of Evaluation of Alternative Capital
Expenditure Programme14.6 ANSWERS TO CHECK YOUR PROGRESS
QUESTIONS
1.Thefollowingcanbementionedasexampleswherethefirm’scashflowisnotthecashflowfortheeconomy:
(a)Subsidyreceivedbythecompanyonprojectinvestment (b) Incometaxandotherdirectandindirecttaxexpensesintheproject
report 2.Theprocessofcalculatingtheeconomicrateofreturnisverysimilar
tothecalculationofinternalrateofreturnofaproject. 3.Thefollowingfactorswarrantsocialcost-benefitanalysis:
• Marketimperfection• Externalities,taxesandsubsidies• Concernforsavings• Concernforredistribution• Meritwants
4.Examplesofthenon-tradablegoodsinthecalculationofeconomiccost-benefits include value of lives saved, value of time saved,cost of pollution etc.Also included in non-traded goods are land,buildings,electricity,transportationandothers,whicharenottradedinternationally.
5.TheCASmethodintroducedisfoundtobeaperfectsubstitutefortheDCFmethod.
6.Predictingtheusefullifeofanassetisahardthingtodobecauseofseveral reasons.These includewearand tear fromnormalbusinessoperations,obsolescenceandinadequacy.
7.Theintuitivemethodassumesthattheriskoftheprojectdependsupontheclassofproject,theportfoliorisknotbeingrelevant.
14.7 SUMMARY
•Afirm’scostandbenefitsfromtheprojectandinternalrateofreturn(IRR)earnedbytheprojectforthefirmisnotanindicatorofthenetbenefit to the nation’s economy.Economic costs and benefits andeconomicrateofreturnsarecalculatedfordeterminingtheeconomicimpact of a project.
•Costsandbenefitsofaprojecttothenationaleconomyaremeasuredbymakinganadjustmentinthefinancialcashflowofaproject.
Methods of Evaluation of Alternative Capital Expenditure Programme
NOTES
Self-Instructional 362 Material
• Someproject cashflowsoccur for afirmbut in the contextof thenationaleconomy,itmaynotbeacashflow.Theseitemsareexcludedfromthecalculationofeconomiccashflow.
•Afirm’sfinancialcashflowwouldtakeactualvalueoftheresourcesconsumedandearned:forexample,offoreignexchange.But,economicvalueofthosecashflowsmaybedifferentbecausetheseresourcesaredearertothenationaleconomy.Therefore,theeconomicvalueofsuchfinancialcashflowmustbeadjustedeitherupordown,dependinguponhowmuchdeareachoneofthemis.
•Theprocessofcalculatingtheeconomicrateofreturnisverysimilartothecalculationofinternalrateofreturnofaproject.Fromtheprojectcashflowcalculatedfromthefirm’sperspective,firsttheeconomiccashflowiscalculatedasexplainedinthepreviouspointandthen,arateiscalculatedatwhichthepresentvalueoftheeconomiccashinflowisequaltothepresentvalueoftheeconomiccashoutflow.
•TheconceptofERRcanbeexpandedtoencompassthesocialcostandbenefitsandtherebycalculatethesocialrateofreturn.Thismethodofprojectevaluation isalsopopularlyknownassocialcost-benefitanalysis(SCBA).
•All agencies that aim at social welfare, like government andinternationalinstitutionsliketheWorldBank,InternationalMonetaryFundandUNIDOwillusesocialcost-benefitanalysisfortheevaluationof projects.
•UnitedNations InternationalDevelopmentOrganization (UNIDO)followsfivesteps(firsttwoplusthreesub-stepslistedinthethirdpointbelow) inestimatingcashflow in theSCBAapproach:Calculationoffinancialprofitability,Calculationofnetbenefitsofprojects,andadjustmentoftheneteconomiccostsandbenefits.
• Inthefieldofsocialcost-benefitanalysis,theotherapproachwhichismorediscussedisLittle-Mirrlees(L-M)approachormanual.Little-Mirrlees(1969)wrotethisapproachforO.E.C.D.(OrganizationforEconomicCooperation andDevelopment), this approach createdseveral controversies,which resulted intomanyothers authors toojoiningtheattemptofexplanationandfurtherclarification.
•Accountingamortizationistheprocessofallocatingormatchingthecostofcapitalassetsoverthetimethattheyareused.Costofcapitalassetsshouldbeamortizedovertheirusefullives.
•Therearethreefactorsusedindeterminingamortizationexpense:costofcapitalasset,salvagevalue,andusefullife.
NOTES
Self-InstructionalMaterial 363
Methods of Evaluation of Alternative Capital
Expenditure Programme
•Riskadjustmentistherealissueinthedeterminationofthecut-offrateforprojects.Whenthediscountrateiscalculatedaftertheadjustmentforrisk, it iscalledriskadjusteddiscountrate,popularlyknownasRADR.
•FourdifferentmethodscanbeprescribedforRADRcalculation.Thelistoffourmethodsisgivenbelow:o Intuitiveapproacho Constantsharepriceapproacho CAPMapproacho AdjustedWACCapproach
14.8 KEY WORDS
•Hawala:Itreferstotheinformalchanneloftransferringfundsfromonelocationtoanother.
•SRR: Itistherateatwhichthepresentvalueofcashinflowisequaltothepresentvalueofcashoutflow.
•Amortization: Itisanaccountingtechniqueusedtoperiodicallylowerthebookvalueofaloanorintangibleassetoverasetperiodoftime.
•Capital asset pricing model: It refers to themodelexplaining therelationshipbetweenexpectedreturnsforanassetandthesystematicriskinvolved.
14.9 SELF ASSESSMENT QUESTIONS AND EXERCISES
Short-Answer Questions
1.Mentiontheprocessofcalculatingeconomicrateofreturns. 2.Whatarethenon-quantifiablecost-benefitsinprojects? 3.Writeashortnoteonthefactorswarrantingsocialcost-benefitanalysis. 4.BrieflyexplainLittle-MirrleesApproachtoSCBA(L-MManual). 5.WriteashortnoteonthebenefitsofCapitalamortizationschedule. 6.Whatarethethreefactorsusedindeterminingamortizationexpense?
Long-Answer Questions
1.Discussthecalculationofeconomiccost-benefits. 2.DescribetheUNIDOapproachforSCBA. 3.ExplainthedifferentmethodscanbeprescribedforRADRcalculation.
Methods of Evaluation of Alternative Capital Expenditure Programme
NOTES
Self-Instructional 364 Material
14.10 FURTHER READINGS
Sahaf,M.A.2013.Management Accounting: Principles and Practice,3rdedition.NewDelhi:VikasPublishingHouse.
Arora,M.N.2012.A textbook of Cost and Management Accounting,10thedition.NewDelhi:VikasPublishingHouse.
Maheshwari,S.N.,SuneelK.andSharadK.2018.A Textbook of Accounting for Management,4thedition.NewDelhi:VikasPublishingHouse.