Embed Size (px)
Citation preview
Final Contract Report Management by Primary Care Clinicians of Patients Suspected of Having Community-Acquired Methicillin-Resistant Staphylococcus Aureus Infections Prepared for: Agency for Healthcare Research and Quality U.S. Department of Health and Human Services 540 Gaither Road Rockville, MD 20850 www.ahrq.gov Contract No.: HHSA-290-2007-10008 Prepared by: State Network of Colorado Ambulatory Practices and Partners AHRQ Publication No. 11-0007-3-EF October 2010

The findings and conclusions in this document are those of the author(s), who are responsible for its content, and do not necessarily represent the views of the Agency for Healthcare Research and Quality (AHRQ). No statement in this report should be construed as an official position of AHRQ or of the U.S. Department of Health and Human Services. This document is in the public domain and may be used and reprinted without permission. AHRQ appreciates citation of the source. Suggested format follows: State Network of Colorado Ambulatory Practices and Partners. Management by Primary Care Clinicians of Patients Suspected of Having Community-Acquired Methicillin-Resistant Staphylococcus Aureus Infections. Rockville, MD: Agency for Healthcare Research and Quality; October 2010. AHRQ Publication No. 11-0007-3-EF.
i
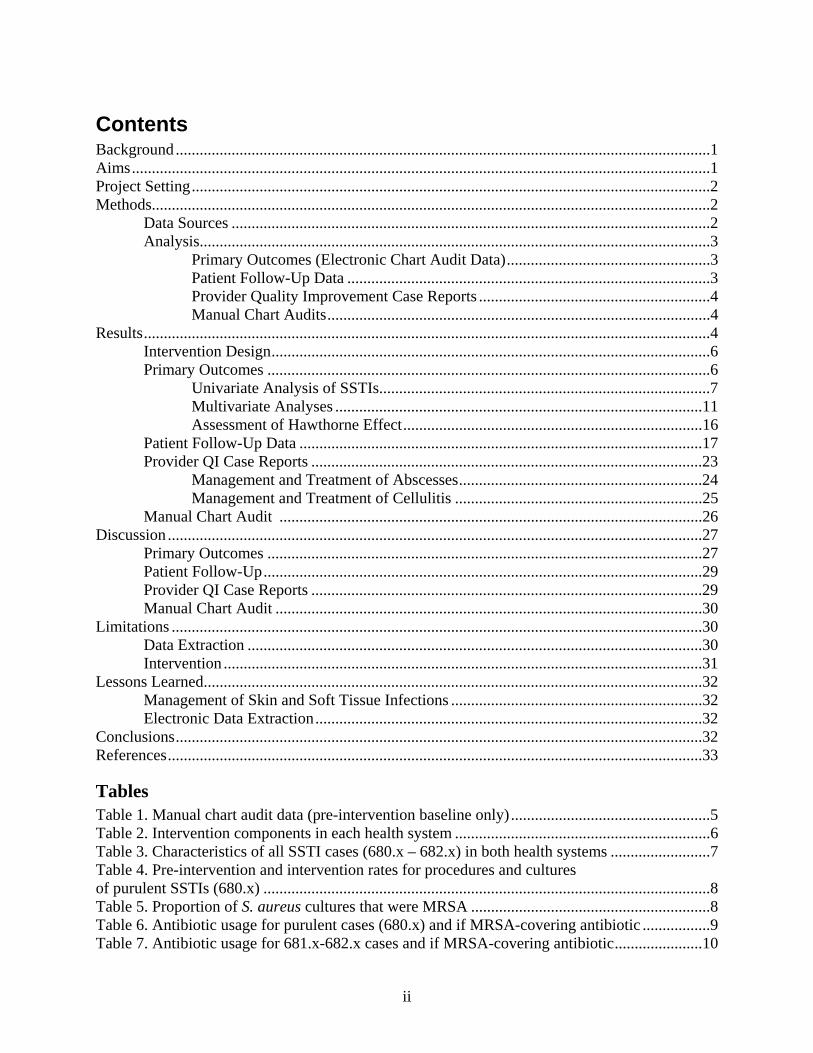
Contents Background ......................................................................................................................................1 Aims .................................................................................................................................................1 Project Setting ..................................................................................................................................2 Methods............................................................................................................................................2
Data Sources ........................................................................................................................2 Analysis................................................................................................................................3
Primary Outcomes (Electronic Chart Audit Data) ...................................................3 Patient Follow-Up Data ...........................................................................................3 Provider Quality Improvement Case Reports ..........................................................4 Manual Chart Audits ................................................................................................4
Results ..............................................................................................................................................4 Intervention Design ..............................................................................................................6 Primary Outcomes ...............................................................................................................6
Univariate Analysis of SSTIs...................................................................................7 Multivariate Analyses ............................................................................................11 Assessment of Hawthorne Effect ...........................................................................16
Patient Follow-Up Data .....................................................................................................17 Provider QI Case Reports ..................................................................................................23
Management and Treatment of Abscesses .............................................................24 Management and Treatment of Cellulitis ..............................................................25
Manual Chart Audit ..........................................................................................................26 Discussion ......................................................................................................................................27
Primary Outcomes .............................................................................................................27 Patient Follow-Up ..............................................................................................................29 Provider QI Case Reports ..................................................................................................29 Manual Chart Audit ...........................................................................................................30
Limitations .....................................................................................................................................30 Data Extraction ..................................................................................................................30 Intervention ........................................................................................................................31
Lessons Learned .............................................................................................................................32 Management of Skin and Soft Tissue Infections ...............................................................32 Electronic Data Extraction .................................................................................................32
Conclusions ....................................................................................................................................32 References ......................................................................................................................................33
Tables Table 1. Manual chart audit data (pre-intervention baseline only) ..................................................5 Table 2. Intervention components in each health system ................................................................6 Table 3. Characteristics of all SSTI cases (680.x – 682.x) in both health systems .........................7 Table 4. Pre-intervention and intervention rates for procedures and cultures of purulent SSTIs (680.x) ................................................................................................................8 Table 5. Proportion of S. aureus cultures that were MRSA ............................................................8 Table 6. Antibiotic usage for purulent cases (680.x) and if MRSA-covering antibiotic .................9 Table 7. Antibiotic usage for 681.x-682.x cases and if MRSA-covering antibiotic ......................10
ii
iii
Table 8. Antibiotic usage for all SSTI (680.x-682.x) cases and if MRSA-covering antibiotic .....11 Table 9. Odds ratio estimates for procedures performed on purulent SSTIs (680.x) ....................12 Table 10. Odds ratios for cultures obtained on purulent SSTIs (680.x) ........................................12 Table 11. Among 680.x cases, odds ratios for receiving antibiotics .............................................13 Table 12. Among all cases (680-2.x), odds ratios for receiving antibiotics ..................................13 Table 13. 680.x cases only, odds ratios for receiving a MRSA-covering antibiotic .....................14 Table 14. Among all cases 680.x-682.x, odds ratios for receiving a MRSA-covering antibiotic ........................................................................................................................................14 Table 15. If an antibiotic was prescribed (680.x-682.x cases), odds ratios for receiving a MRSA-covering antibiotic (model excludes cases in which no antibiotic was prescribed) .......15 Table 16. Among 681.x-682.x cases, odds ratios for prescribed antibiotics and prescribed MRSA-covering antibiotics ...........................................................................................................15 Table 17. Hawthorne Effect, purulent (680.x) intervention cases only .........................................17 Table 18. Hawthorne Effect, 681.x and 682.x intervention cases only .........................................17 Table 19. Characteristic of patients who completed quality improvement calls ...........................18 Table 20. Follow-up status following initial management of SSTI ...............................................20 Table 21. Characteristics of patients seen with SSTI diagnosis in QI case reports .......................23 Table 22. Number of qualitative provider interview cases by infection type ................................23 Table 23. Antibiotics prescriptions by interviewed providers .......................................................25 Table 24. Type of antibiotic prescribed .........................................................................................25 Table 25. Manual chart audit results, including pre-intervention and intervention periods ..........27
Figures Figure 1. 680.x Skin infections and antibiotic prescribing rates in WHA, MCNT, and combined ...................................................................................................................................9 Figure 2. 681.x–682.x Skin infections and antibiotic prescribing rates in WHA, MCNT, and combined .................................................................................................................................10

Background Purulent skin and soft tissue infections (SSTIs) requiring medical attention are often
managed in primary care, although in the United States they account for only a small percentage of total primary care office visits. According to Medical Expenditure Panel Survey (MEPS) data from 2005, this condition presents in less than 0.5 percent of outpatient visits, accounting for slightly over 2.5 million visits by just under 900,000 people annually.1 Staphylococcus aureus is the most common pathogen causing this condition.
SSTI management is becoming more complex. The prevalence of SSTIs caused by community-acquired methicillin-resistant Staphylococcus aureus (CA-MRSA) has been increasing rapidly, including in otherwise healthy individuals.2 CA-MRSA is a significant public health concern as it has the potential to develop quickly into an invasive skin infection and cause other life-threatening complications.3-5 Like other SSTIs, most CA-MRSA infections are managed initially on an outpatient basis in primary care settings. Therefore, it is critical that primary care clinicians recognize and appropriately treat potential CA-MRSA infections. Current evidence suggests that treatments that take into account the possibility of CA-MRSA are not the norm. For instance, the MEPS 2005 data indicates that when an antibiotic was prescribed for an abscess, it covered MRSA in only 17 percent of the cases.1 Cellulitis, an SSTI without purulence (not an abscess), is typically caused by Staphylococcus aureus or streptococcus.
In response to this growing public health problem, the Centers for Disease Control and Prevention (CDC) convened an expert panel and published recommendations and a clinical algorithm/flowsheet for outpatient management of CA-MRSA. The guideline for management of CA-MRSA involves the following, alone or in combination: incision and drainage (I&D), culture of the purulent material, and use of systemic antibiotics. Although the CDC guidelines are being widely disseminated, their feasibility and therefore uptake in busy primary care settings are unknown. Our project in this task order advanced our understanding of CA-MRSA by developing real-world strategies consistent with the CDC guidelines and by testing these strategies in busy primary care settings.
Aims The purpose of this study was to test interventions specifically designed for two health
networks to optimize treatment for SSTIs consistent with the CDC CA-MRSA guidelines. This study had three specific aims:
1. Describe the baseline incidence and clinical practice for SSTIs in three large health systems: two private health systems and a large integrated urban community health center.
2. Design two intervention strategies and associated outcome measures consistent with the CDC CA-MRSA guidelines.
3. Conduct a clinical trial evaluating the effect of the intervention strategies on the outcomes in primary care clinics within two health care systems.
Previous reports described the complete findings for aims 1 and 2, which we only summarize in this report. We fully describe findings from aim 3 in this report.
1
Project Setting For the intervention phase of the project, we worked with two health networks, Medical
Clinic of North Texas (MCNT) and Wilmington Health Associates (WHA). (Denver Health and Hospital Association [DHHA] only participated during the pre-intervention phase of the project.)
MCNT is a large group practice in north Dallas that includes 35 practice locations and approximately 120 clinicians, the majority of whom are in primary care and are family physicians, general internists, and general pediatricians. The system also includes one obstetrics-gynecology practice and one rheumatology practice. The system cares for approximately 150,000 people per year. All providers are on the same, linked electronic medical record system, NextGen.
WHA is a multispecialty group practice in Wilmington, North Carolina, with about 100 clinicians, of whom approximately 35 are in primary care. Primary care clinicians include family physicians, general internists, and general pediatricians. The entire group uses a single electronic medical record, A4 Healthmatics.
DHHA, a fully integrated safety net urban health system, includes a federally qualified community health center component consisting of 20 primary care and school-based clinics that receive more than 320,000 annual visits. The DHHA system implemented outpatient guidelines for CA-MRSA in August 2004, well before the CDC guidelines and flowsheet were published. The DHHA guidelines are very similar to the CDC guidelines. Therefore, the DHHA system provided an opportunity to seek “best practices” approaches to guideline implementation. Neither the WHA nor MCNT systems had implemented any system-wide approach to CA-MRSA.
Methods We conducted a clinical trial for 6 to 7 months in 16 clinics within the WHA and MCNT
systems. We worked with each organization’s existing internal quality improvement (QI) team to conduct ongoing practice implementation of the new SSTI guidelines. We conducted the trial using a before-after study design, which includes 12 months of historical data review of care prior to the initial start date for all participating clinics. Treatment of SSTIs during the 6- to 7-month intervention period was compared to 12 months of historical data. The prolonged historical timeframe helped us discern if there had been any secular trends in the SSTI outcome measures prior to the implementation. These trends were adjusted for in the quantitative analysis. All data were de-identified.
Data Sources Data for this project came from two main sources: de-identified electronic health record
data and QI data made available to the research team. CINA extracted standardized, electronic chart audit data from participating WHA and MCNT sites according to International Classification of Diseases, 9th Revision (ICD-9) codes for SSTIs (680.x, 681.x, 682.x). A randomly generated number linked the de-identified patient-level data provided to the research team. CINA, which has a Health Insurance Portability and Accountability Act business agreement with all organizations, managed the data collection. WHA and MCNT conducted manual chart audits that were used as a supplement to the electronic chart audit.
Quality improvement data were made available from patient followups conducted within and by each network and from case report evaluations that providers completed on select cases.
2
On behalf of the health systems, the investigators agreed to follow up by phone with providers to learn about the management of specific cases.
Analysis
Primary Outcomes (Electronic Chart Audit Data) Descriptive statistics, including frequencies and percentages, were used to characterize
the historical and intervention data. For the primary outcomes, bivariate Chi-square, Student's t-tests, and Fisher’s exact tests were conducted to compare pre-intervention and intervention electronic chart audit data. Generalized estimating equations (GEE) with exchangeable variance-covariance structures were used to model the odds of a patient receiving a culture, a drainage procedure, an antibiotic, and a MRSA antibiotic while accounting for correlations due to clustering of patients within providers. Independent variables included in the models were gender, child or adult status, the presence of diabetes, a history of previous skin infection, the health care system through which services were received, and the specialties of the providers who delivered the services.
A longitudinal growth model was used to determine whether evidence existed of the increasing use of antibiotics as well as MRSA antibiotics across the population of patients served during the November 2007 through October 2008 historical control period. The longitudinal analysis revealed that this was indeed the case for patients with a 681.x or 682.x diagnosis but not for a 680.x diagnosis. The longitudinal growth model predicted that the percent of 681.x and 682.x patients who were prescribed antibiotics by a provider increased by 1 percent per month (p=0.0008). In addition, the percent of patients prescribed MRSA antibiotics increased by 0.5 percent per month (p=.0480). In both cases, the increases were significant. To hold the impact of the historical data constant, a piecewise GEE model was used to determine whether the odds of antibiotic and MRSA antibiotic use was greater during the intervention period.
Patient Follow-Up Data For the patient follow-up data, bivariate chi-square and Fisher’s exact tests were
conducted to compare pre-intervention and intervention outcomes on several important measures, including hospitalization, emergency department (ED) or urgent care visits, medication adherence, whether the infection resolved, and time to resolution. Linear regression was used to model approximate duration of infection, and logistic regression was used to model the odds of an unplanned care event (combined ED and urgent care visits and hospitalization).
Time to resolution was based on patient response when asked how long ago did the infection clear (this was not asked to patients who said the infection was still present). The answer was selected by the patient from several options and was converted to days (e.g., “about a week ago” converted to 7 days, “more than a week ago” estimated to be 11 days). From the interval between the initial SSTI clinical visit and the patient follow-up response, we subtracted the number of days since the infection cleared to determine time to resolution. Our plan was to have the patient follow-up contacts occur between 15 and 31 days after the initial SSTI visit. However, due to logistical difficulties, some patients, including most at WHA, had very long intervals (up to 6 months) between the SSTI visit and the patient follow-up contact (see the Limitations section for further discussion). In these cases with a long interval, it is possible there was a recall bias in interpreting patient responses, and this bias would be especially likely when the patient was asked how long ago did the infection clear. In addition, because the longest
3

response possible was “more than a week ago,” time to resolution could not be accurately determined when there was a long interval. Therefore, in calculating time to resolution, cases were excluded when the interval between the initial SSTI and the follow-up patient contact was greater than 31 days. Cases were also excluded when data elements required to calculate time to resolution were missing. The other patient follow-up data collected on the cases with long intervals were included in the results.
Provider Quality Improvement Case Reports The case reports were summarized with basic descriptive statistics (e.g., frequencies and
percents). Follow-up interviews were treated as qualitative data and were analyzed iteratively beginning with an initial review of the data for major themes, stratified by cellulitis and abscess cases. The initial themes were shared with the study team for feedback and comments. The interview data then were analyzed fully, arriving at a final set of themes for further review and verification by the team.
Manual Chart Audits For the patient follow-up data, univariate analyses were conducted to compare the pre-
intervention and intervention periods.
Results Aim 1. Describe the baseline incidence and clinical practice for SSTIs in three large health systems: two private health systems and a large integrated urban community health center.
There were 92 manual chart audits in the three systems. A majority of abscesses in each system and overall (57.6 percent) were classified as 680.x. Rarely was cellulitis coded as 680.x. Overall, antibiotics were started in almost two-thirds of cases, but of these, less than 40 percent were agents that covered MRSA. DHHA had higher procedure rates and higher utilization of antibiotics (including MRSA coverage), but a higher culture rate was not found (only increased antibiotic usage was significant). Most of the abscesses were small and solitary (Table 1).
4
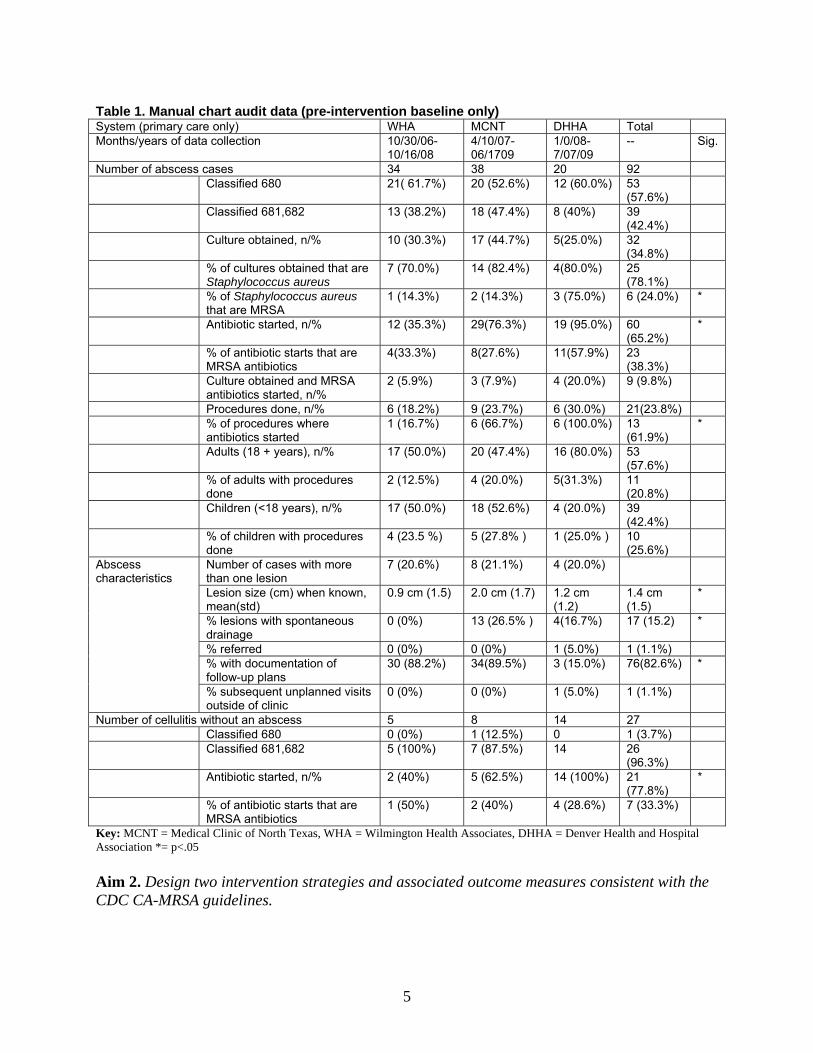
Table 1. Manual chart audit data (pre-intervention baseline only) System (primary care only) WHA MCNT DHHA Total Months/years of data collection 10/30/06-
10/16/08 4/10/07-06/1709
1/0/08- 7/07/09
-- Sig.
Number of abscess cases 34 38 20 92 Classified 680 21( 61.7%) 20 (52.6%) 12 (60.0%) 53
(57.6%)
Classified 681,682 13 (38.2%) 18 (47.4%) 8 (40%) 39 (42.4%)
Culture obtained, n/% 10 (30.3%)
17 (44.7%)
5(25.0%) 32 (34.8%)
% of cultures obtained that are Staphylococcus aureus
7 (70.0%) 14 (82.4%) 4(80.0%) 25 (78.1%)
% of Staphylococcus aureus that are MRSA
1 (14.3%) 2 (14.3%) 3 (75.0%) 6 (24.0%) *
Antibiotic started, n/% 12 (35.3%) 29(76.3%) 19 (95.0%) 60 (65.2%)
*
% of antibiotic starts that are MRSA antibiotics
4(33.3%) 8(27.6%) 11(57.9%) 23 (38.3%)
Culture obtained and MRSA antibiotics started, n/%
2 (5.9%)
3 (7.9%)
4 (20.0%) 9 (9.8%)
Procedures done, n/% 6 (18.2%) 9 (23.7%) 6 (30.0%) 21(23.8%) % of procedures where
antibiotics started 1 (16.7%) 6 (66.7%) 6 (100.0%) 13
(61.9%) *
Adults (18 + years), n/% 17 (50.0%) 20 (47.4%) 16 (80.0%) 53 (57.6%)
% of adults with procedures done
2 (12.5%) 4 (20.0%) 5(31.3%) 11 (20.8%)
Children (<18 years), n/% 17 (50.0%) 18 (52.6%) 4 (20.0%) 39 (42.4%)
% of children with procedures done
4 (23.5 %) 5 (27.8% ) 1 (25.0% ) 10 (25.6%)
Abscess characteristics
Number of cases with more than one lesion
7 (20.6%) 8 (21.1%) 4 (20.0%)
Lesion size (cm) when known, mean(std)
0.9 cm (1.5) 2.0 cm (1.7) 1.2 cm (1.2)
1.4 cm (1.5)
*
% lesions with spontaneous drainage
0 (0%) 13 (26.5% ) 4(16.7%) 17 (15.2) *
% referred 0 (0%) 0 (0%) 1 (5.0%) 1 (1.1%) % with documentation of follow-up plans
30 (88.2%) 34(89.5%) 3 (15.0%) 76(82.6%) *
% subsequent unplanned visits outside of clinic
0 (0%) 0 (0%) 1 (5.0%) 1 (1.1%)
Number of cellulitis without an abscess 5 8 14 27 Classified 680 0 (0%) 1 (12.5%) 0 1 (3.7%)
Classified 681,682 5 (100%) 7 (87.5%) 14 26 (96.3%)
Antibiotic started, n/% 2 (40%) 5 (62.5%) 14 (100%) 21 (77.8%)
*
% of antibiotic starts that are MRSA antibiotics
1 (50%) 2 (40%) 4 (28.6%) 7 (33.3%)
Key: MCNT = Medical Clinic of North Texas, WHA = Wilmington Health Associates, DHHA = Denver Health and Hospital Association *= p<.05 Aim 2. Design two intervention strategies and associated outcome measures consistent with the CDC CA-MRSA guidelines.
5
Intervention Design Based on the results from Aim 2 focus group results, the intervention was developed to
specifically deal with: (1) time constraints, (2) forgetting to do a culture and/or not having the culturette readily available, and (3) provider concerns about performing I&Ds. Therefore, we developed ideas for a prepackaged kit with point-of-care information for patients and providers to be ready and on hand. To remind providers to do a culture, culturettes would be readily available with the kits.
We worked with the QI contracts from WHA and MCNT and developed the following intervention strategies to be implemented in each system (Table 2). The study team took the findings from the focus groups and worked closely with the key contacts from MCNT and WHA to solve feasibility issues and refine the specific intervention strategies. A feasibility pilot test of the intervention was conducted. Table 2. Intervention components in each health system Type of Intervention MCNT WHAReady-made tray/kit X X Provider information (at the point-of-care)
X X
Patient information X X Provider education X X Nursing/staff education X X Patient followup X X EHR protocol X Key: MCNT = Medical Clinic of North Texas, WHA = Wilmington Health Associates. HER=electronic health record
Continuing medical education (CME) presentations on SSTIs and CA-MRSA were given in both MCNT and WHA. For MCNT, Dr. Connie Price, an infectious disease consultant for the project, conducted an Internet-based CME conference for providers. For WHA, CME was provided during an in-person meeting by an in-house infectious disease specialist and an in-house surgeon. Overall, the intervention in WHA and MCNT were very similar; the CME and EHR differences between the two systems were minor, therefore the data from the two systems were combined for analysis. Aim 3. Conduct a clinical trial evaluating the effect of the intervention strategies on the outcomes in primary care clinics within two health care systems.
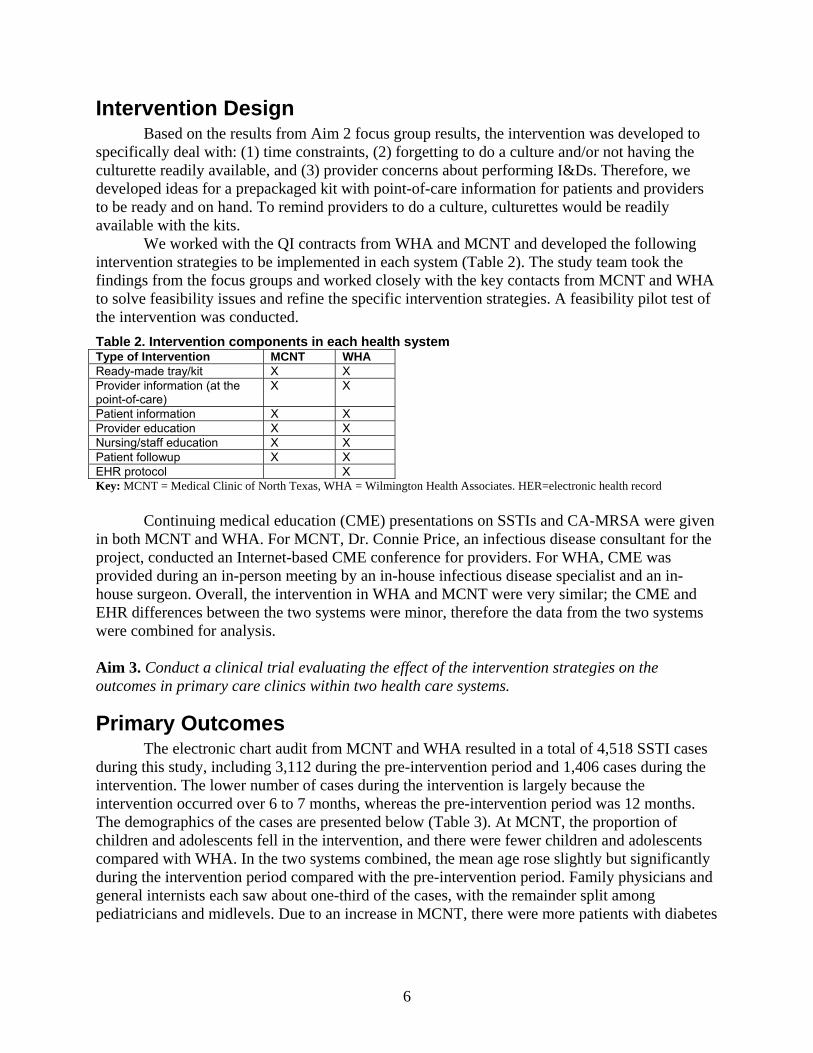
Primary Outcomes The electronic chart audit from MCNT and WHA resulted in a total of 4,518 SSTI cases
during this study, including 3,112 during the pre-intervention period and 1,406 cases during the intervention. The lower number of cases during the intervention is largely because the intervention occurred over 6 to 7 months, whereas the pre-intervention period was 12 months. The demographics of the cases are presented below (Table 3). At MCNT, the proportion of children and adolescents fell in the intervention, and there were fewer children and adolescents compared with WHA. In the two systems combined, the mean age rose slightly but significantly during the intervention period compared with the pre-intervention period. Family physicians and general internists each saw about one-third of the cases, with the remainder split among pediatricians and midlevels. Due to an increase in MCNT, there were more patients with diabetes
6

in the intervention period, whereas patients with previous SSTIs were more common in the intervention period due to an increase in WHA. Table 3. Characteristics of all SSTI cases (680.x – 682.x) in both health systems
MCNT WHA Combined
Pre Intervention p Value* Pre Interve
ntion p Value Pre Intervention p Value
Total number of cases (n) 1870 643 - 1242 763 - 3112 1406 -Children/adolescents (n) 351 81 - 415 258 - 766 339 -Children/adolescents (%) 18.77 12.60 0.0003 33.41 33.81 0.8539 24.61 24.11 0.7155Mean age 42.83 46.84 0.0002 39.65 40.57 0.4858 41.56 43.44 0.0267Female (n) 1025 346 - 674 419 - 1699 765 -Female (%) 54.81 53.81 0.6596 54.27 54.91 0.7774 54.6 54.41 0.9077Clinician specialty** FM (n) 764 264 - 396 213 - 1160 477 - FM (%) 40.86 41.06 0.9284 31.88 27.92 0.0607 37.28 33.93 0.0301 IM (n) 597 185 - 408 293 - 1005 478 - IM (%) 31.93 28.77 0.1362 32.85 38.4 0.0114 32.29 34 0.2591 Peds (n) 153 37 - 314 203 - 467 240 - Peds (%) 8.18 5.75 0.0446 25.28 26.61 0.5106 15.01 17.07 0.0772 IM & Peds (n) 81 27 - 0 0 - 81 27 - IM & Peds (%) 4.33 4.2 0.8864 0 0 - 2.6 1.92 0.1644 Midlevel (n) 236 108 - 124 54 - 360 162 - Midlevel (%) 12.62 16.8 0.0079 9.98 7.08 0.0263 11.57 11.52 0.9642Clinical features Diabetes (n) 270 123 - 229 145 - 499 268 - Diabetes (%) 14.44 19.13 0.0047 18.44 19 0.7521 16.03 19.06 0.0121 Fever (n) 2 2 - 7 3 - 9 5 - Fever (%) 0.11 0.31 0.2628 0.56 0.39 0.5989 0.29 0.36 0.7100Previous case SSTI (n) 321 114 - 123 150 - 444 264 -Previous case SSTI (%) 17.17 17.73 0.7445 9.9 19.66 <.0001 14.27 18.78 0.0001Key: MCNT = Medical Clinic of North Texas, WHA = Wilmington Health Associates, FM = family medicine, IM = internal medicine, Peds = pediatrics, SSTI = skin and soft tissue infection *p values only calculated for proportions or mean values.
Univariate Analysis of SSTIs The univariate findings for procedures and cultures were performed only on 680.x ICD-9
codes, because the majority of 681.x-682.x codes are cellulitis, for which procedures and cultures cannot be done. There was a significant decrease in the procedure rate in WHA and combined systems, but not in MCNT (Table 4). However, overall, the procedure rate was unexpectedly low, as was the culture rate. The culture rate was higher than the procedure rate, which suggests that in some cases cultures were obtained even though there was no procedure performed or the procedure was not detected in the electronic billing data.
7
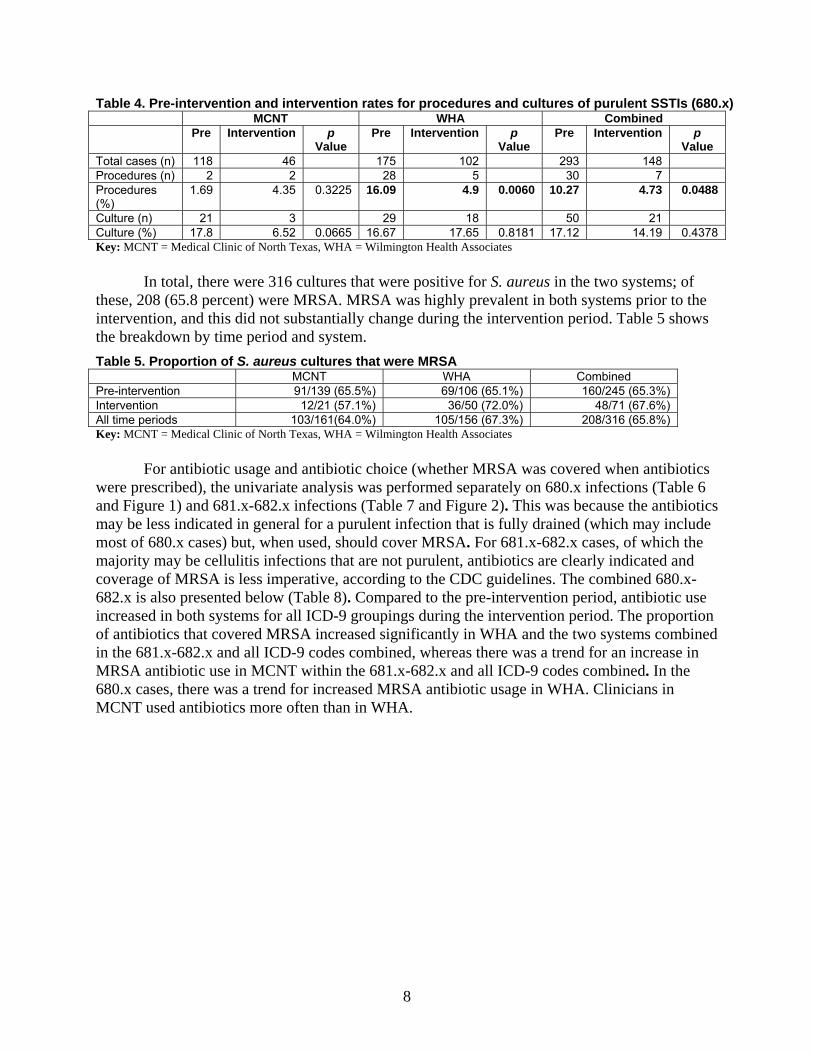
Table 4. Pre-intervention and intervention rates for procedures and cultures of purulent SSTIs (680.x) MCNT WHA Combined Pre Intervention p
Value Pre Intervention p
Value Pre Intervention p
Value Total cases (n) 118 46 175 102 293 148 Procedures (n) 2 2 28 5 30 7 Procedures (%)
1.69 4.35 0.3225 16.09 4.9 0.0060 10.27 4.73 0.0488
Culture (n) 21 3 29 18 50 21 Culture (%) 17.8 6.52 0.0665 16.67 17.65 0.8181 17.12 14.19 0.4378 Key: MCNT = Medical Clinic of North Texas, WHA = Wilmington Health Associates
In total, there were 316 cultures that were positive for S. aureus in the two systems; of
these, 208 (65.8 percent) were MRSA. MRSA was highly prevalent in both systems prior to the intervention, and this did not substantially change during the intervention period. Table 5 shows the breakdown by time period and system. Table 5. Proportion of S. aureus cultures that were MRSA MCNT WHA Combined Pre-intervention 91/139 (65.5%) 69/106 (65.1%) 160/245 (65.3%) Intervention 12/21 (57.1%) 36/50 (72.0%) 48/71 (67.6%) All time periods 103/161(64.0%) 105/156 (67.3%) 208/316 (65.8%) Key: MCNT = Medical Clinic of North Texas, WHA = Wilmington Health Associates
For antibiotic usage and antibiotic choice (whether MRSA was covered when antibiotics
were prescribed), the univariate analysis was performed separately on 680.x infections (Table 6 and Figure 1) and 681.x-682.x infections (Table 7 and Figure 2). This was because the antibiotics may be less indicated in general for a purulent infection that is fully drained (which may include most of 680.x cases) but, when used, should cover MRSA. For 681.x-682.x cases, of which the majority may be cellulitis infections that are not purulent, antibiotics are clearly indicated and coverage of MRSA is less imperative, according to the CDC guidelines. The combined 680.x-682.x is also presented below (Table 8). Compared to the pre-intervention period, antibiotic use increased in both systems for all ICD-9 groupings during the intervention period. The proportion of antibiotics that covered MRSA increased significantly in WHA and the two systems combined in the 681.x-682.x and all ICD-9 codes combined, whereas there was a trend for an increase in MRSA antibiotic use in MCNT within the 681.x-682.x and all ICD-9 codes combined. In the 680.x cases, there was a trend for increased MRSA antibiotic usage in WHA. Clinicians in MCNT used antibiotics more often than in WHA.
8
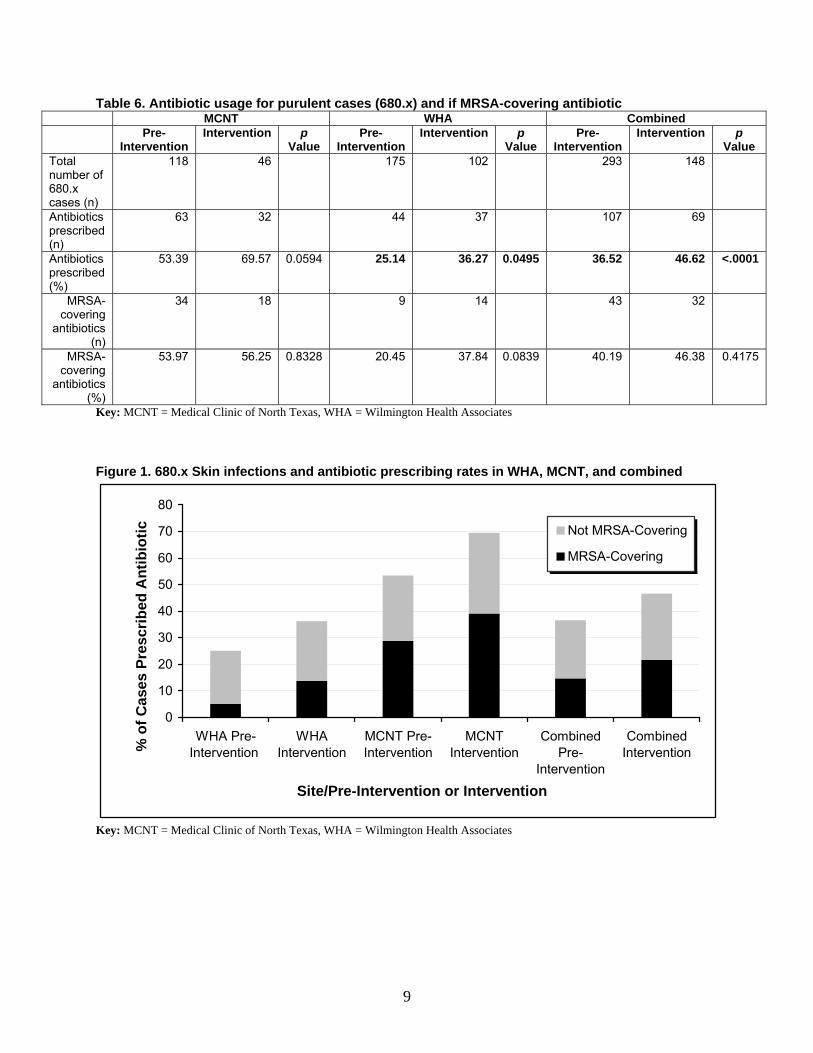
Table 6. Antibiotic usage for purulent cases (680.x) and if MRSA-covering antibiotic MCNT WHA Combined Pre-
Intervention Intervention p
Value Pre-
Intervention Intervention p
Value Pre-
Intervention Intervention p
Value Total number of 680.x cases (n)
118 46 175 102 293 148
Antibiotics prescribed (n)
63 32 44 37 107 69
Antibiotics prescribed (%)
53.39 69.57 0.0594 25.14 36.27 0.0495 36.52 46.62 <.0001
MRSA-covering
antibiotics (n)
34 18 9 14 43 32
MRSA-covering
antibiotics (%)
53.97 56.25 0.8328 20.45 37.84 0.0839 40.19 46.38 0.4175
Key: MCNT = Medical Clinic of North Texas, WHA = Wilmington Health Associates Figure 1. 680.x Skin infections and antibiotic prescribing rates in WHA, MCNT, and combined
0
10
20
30
40
50
60
70
80
WHA Pre-Intervention
WHAIntervention
MCNT Pre-Intervention
MCNTIntervention
CombinedPre-
Intervention
CombinedIntervention
Site/Pre-Intervention or Intervention
% o
f Cas
es P
resc
ribed
Ant
ibio
tic Not MRSA-Covering
MRSA-Covering
Key: MCNT = Medical Clinic of North Texas, WHA = Wilmington Health Associates
9
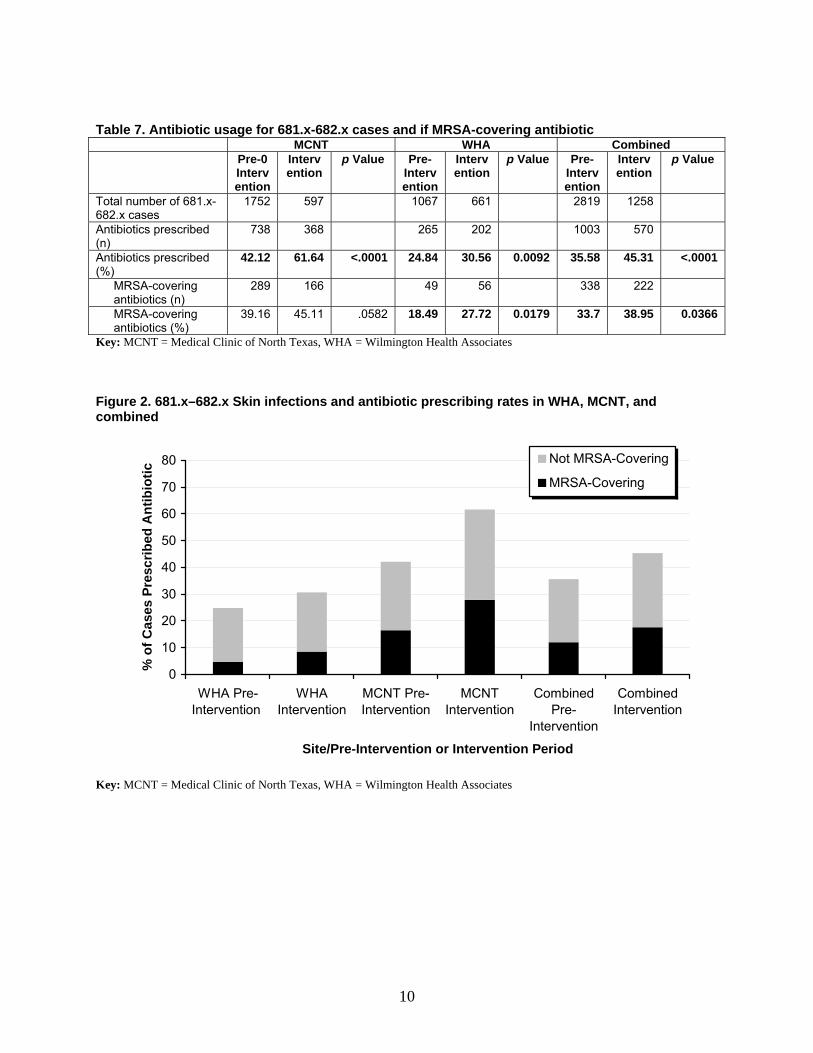
Table 7. Antibiotic usage for 681.x-682.x cases and if MRSA-covering antibiotic
MCNT WHA Combined Pre-0
Intervention
Intervention
p Value Pre-Intervention
Intervention
p Value Pre- Intervention
Intervention
p Value
Total number of 681.x-682.x cases
1752 597 1067 661 2819 1258
Antibiotics prescribed (n)
738 368 265 202 1003 570
Antibiotics prescribed (%)
42.12 61.64 <.0001 24.84 30.56 0.0092 35.58 45.31 <.0001
MRSA-covering antibiotics (n)
289 166 49 56 338 222
MRSA-covering antibiotics (%)
39.16 45.11 .0582 18.49 27.72 0.0179 33.7 38.95 0.0366
Key: MCNT = Medical Clinic of North Texas, WHA = Wilmington Health Associates Figure 2. 681.x–682.x Skin infections and antibiotic prescribing rates in WHA, MCNT, and combined
0
10
20
30
40
50
60
70
80
WHA Pre-Intervention
WHAIntervention
MCNT Pre-Intervention
MCNTIntervention
CombinedPre-
Intervention
CombinedIntervention
Site/Pre-Intervention or Intervention Period
% o
f Cas
es P
resc
ribed
Ant
ibio
tic
Not MRSA-Covering
MRSA-Covering
Key: MCNT = Medical Clinic of North Texas, WHA = Wilmington Health Associates
10
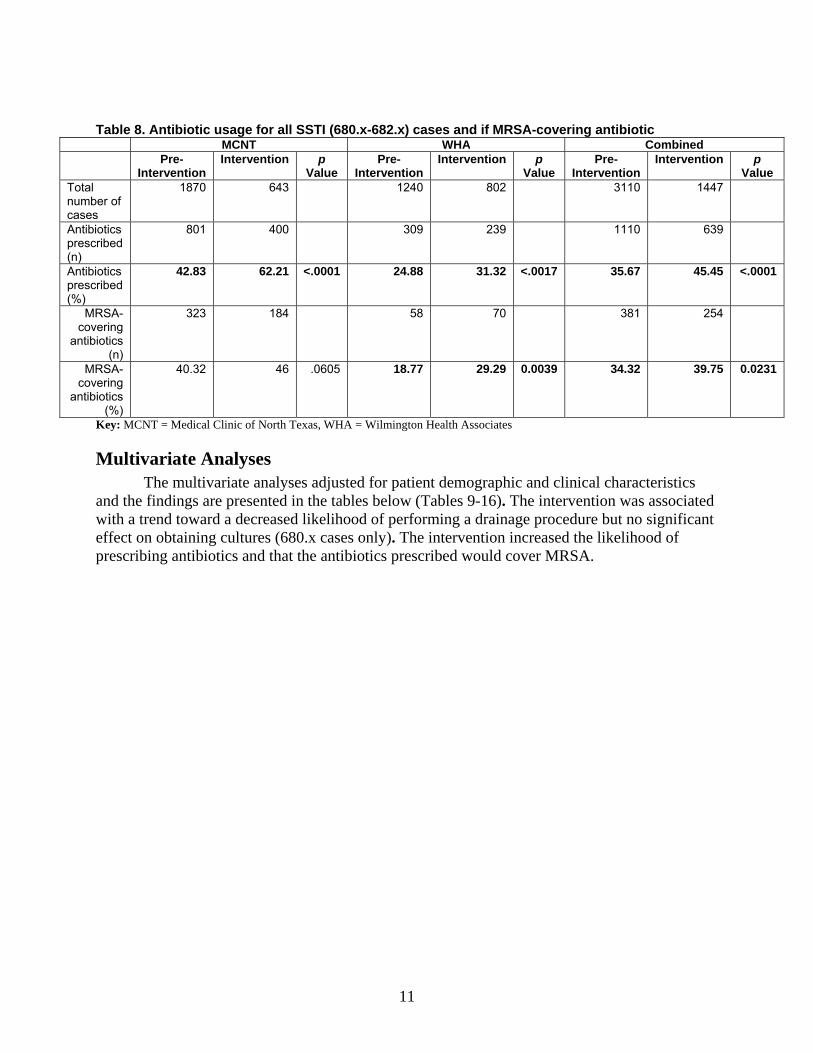
Table 8. Antibiotic usage for all SSTI (680.x-682.x) cases and if MRSA-covering antibiotic MCNT WHA Combined
Pre- Intervention
Intervention p Value
Pre-Intervention
Intervention p Value
Pre- Intervention
Intervention p Value
Total number of cases
1870 643 1240 802 3110 1447
Antibiotics prescribed (n)
801 400 309 239 1110 639
Antibiotics prescribed (%)
42.83 62.21 <.0001 24.88 31.32 <.0017 35.67 45.45 <.0001
MRSA-covering
antibiotics (n)
323 184 58 70 381 254
MRSA-covering
antibiotics (%)
40.32 46 .0605 18.77 29.29 0.0039 34.32 39.75 0.0231
Key: MCNT = Medical Clinic of North Texas, WHA = Wilmington Health Associates
Multivariate Analyses The multivariate analyses adjusted for patient demographic and clinical characteristics
and the findings are presented in the tables below (Tables 9-16). The intervention was associated with a trend toward a decreased likelihood of performing a drainage procedure but no significant effect on obtaining cultures (680.x cases only). The intervention increased the likelihood of prescribing antibiotics and that the antibiotics prescribed would cover MRSA.
11
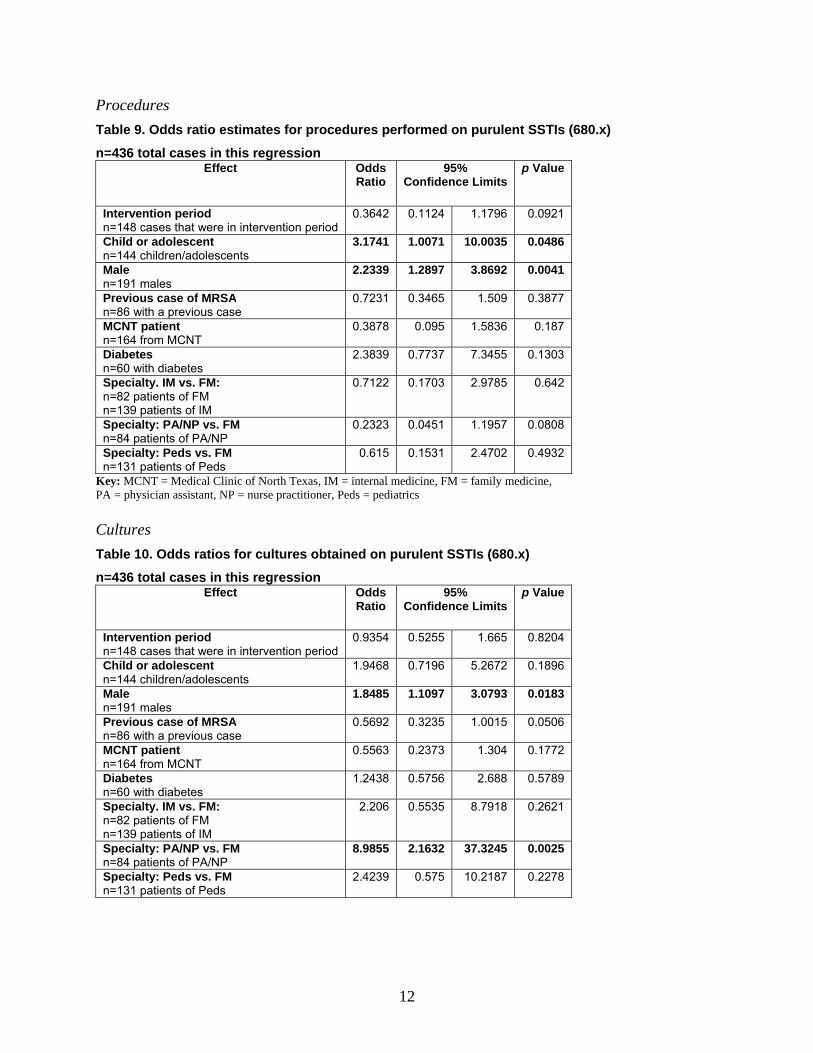
Procedures Table 9. Odds ratio estimates for procedures performed on purulent SSTIs (680.x)
n=436 total cases in this regression Effect Odds
Ratio 95%
Confidence Limits p Value
Intervention period n=148 cases that were in intervention period
0.3642 0.1124 1.1796 0.0921
Child or adolescent n=144 children/adolescents
3.1741 1.0071 10.0035 0.0486
Male n=191 males
2.2339 1.2897 3.8692 0.0041
Previous case of MRSA n=86 with a previous case
0.7231 0.3465 1.509 0.3877
MCNT patient n=164 from MCNT
0.3878 0.095 1.5836 0.187
Diabetes n=60 with diabetes
2.3839 0.7737 7.3455 0.1303
Specialty. IM vs. FM: n=82 patients of FM n=139 patients of IM
0.7122 0.1703 2.9785 0.642
Specialty: PA/NP vs. FM n=84 patients of PA/NP
0.2323 0.0451 1.1957 0.0808
Specialty: Peds vs. FM n=131 patients of Peds
0.615 0.1531 2.4702 0.4932
Key: MCNT = Medical Clinic of North Texas, IM = internal medicine, FM = family medicine, PA = physician assistant, NP = nurse practitioner, Peds = pediatrics Cultures Table 10. Odds ratios for cultures obtained on purulent SSTIs (680.x)
n=436 total cases in this regression Effect Odds
Ratio 95%
Confidence Limits p Value
Intervention period n=148 cases that were in intervention period
0.9354 0.5255 1.665 0.8204
Child or adolescent n=144 children/adolescents
1.9468 0.7196 5.2672 0.1896
Male n=191 males
1.8485 1.1097 3.0793 0.0183
Previous case of MRSA n=86 with a previous case
0.5692 0.3235 1.0015 0.0506
MCNT patient n=164 from MCNT
0.5563 0.2373 1.304 0.1772
Diabetes n=60 with diabetes
1.2438 0.5756 2.688 0.5789
Specialty. IM vs. FM: n=82 patients of FM n=139 patients of IM
2.206 0.5535 8.7918 0.2621
Specialty: PA/NP vs. FM n=84 patients of PA/NP
8.9855 2.1632 37.3245 0.0025
Specialty: Peds vs. FM n=131 patients of Peds
2.4239 0.575 10.2187 0.2278
12

Antibiotics Table 11. Among 680.x cases, odds ratios for receiving antibiotics
n=436 total cases in this regression Effect Odds
Ratio 95%
Confidence Limits p Value
Intervention period n=148 cases that were in intervention period
2.183 1.4429 3.3026 0.0002
Child or adolescent n=144 children/adolescents
0.3628 0.1488 0.8846 0.0258
Male n=191 males
1.0333 0.6821 1.5651 0.8773
Previous case of MRSA n=86 with a previous case
0.8014 0.4327 1.484 0.4812
MCNT patient n=164 from MCNT
2.7345 1.5667 4.7726 0.0004
Diabetes n=60 with diabetes
0.5532 0.323 0.9477 0.0311
Specialty. IM vs. FM: n=82 patients of FM n=139 patients of IM
0.6585 0.3786 1.1451 0.1389
Specialty: PA/NP vs. FM n=84 patients of PA/NP
1.6038 0.696 3.6957 0.2674
Specialty: Peds vs. FM n=131 patients of Peds
2.597 1.028 6.559 0.0436
Key: MCNT = Medical Clinic of North Texas, IM = internal medicine, FM = family medicine, PA = physician assistant, NP = nurse practitioner, Peds = pediatrics Table 12. Among all cases (680-2.x), odds ratios for receiving antibiotics
n = 4,457 total cases in this regression Effect Odds
Ratio 95%
Confidence Limitsp Value
Intervention n=1,406 cases that were in intervention period
1.7806 1.4921 2.1248 <.0001
Child or adolescent (age<18) n=1,105 children/adolescents
1.0557 0.8539 1.3051 0.6168
Male n=815 males
1.1009 0.9851 1.2302 0.0899
Previous case of MRSA n=708 with a previous case
0.9287 0.7609 1.1336 0.4672
MCNT patient n=2,513 patients from MCNT
3.0809 2.4068 3.9438 <.0001
Diabetes n=767 patients with diabetes
0.8595 0.7145 1.0339 0.1083
Specialty. IM vs. FM n=1,483 patients of IM n=1,637 patients of FM
0.8586 0.6109 1.2067 0.3801
Specialty: PA/NP vs. FM n=522 patients of PA/NP
1.0849 0.6606 1.7818 0.7474
Specialty: Peds vs. FM n=815 patients of Peds
1.2664 0.9208 1.7416 0.1464
ICD-9 of 680.x vs. 681.x-682.x n=441 patients with a 680.x diagnosis
1.0279 0.8041 1.3140 0.8260
Key: MCNT = Medical Clinic of North Texas, IM = internal medicine, FM = family medicine, PA = physician assistant, NP = nurse practitioner, Peds = pediatrics, ICD-9 = International Classification of Diseases-9
13
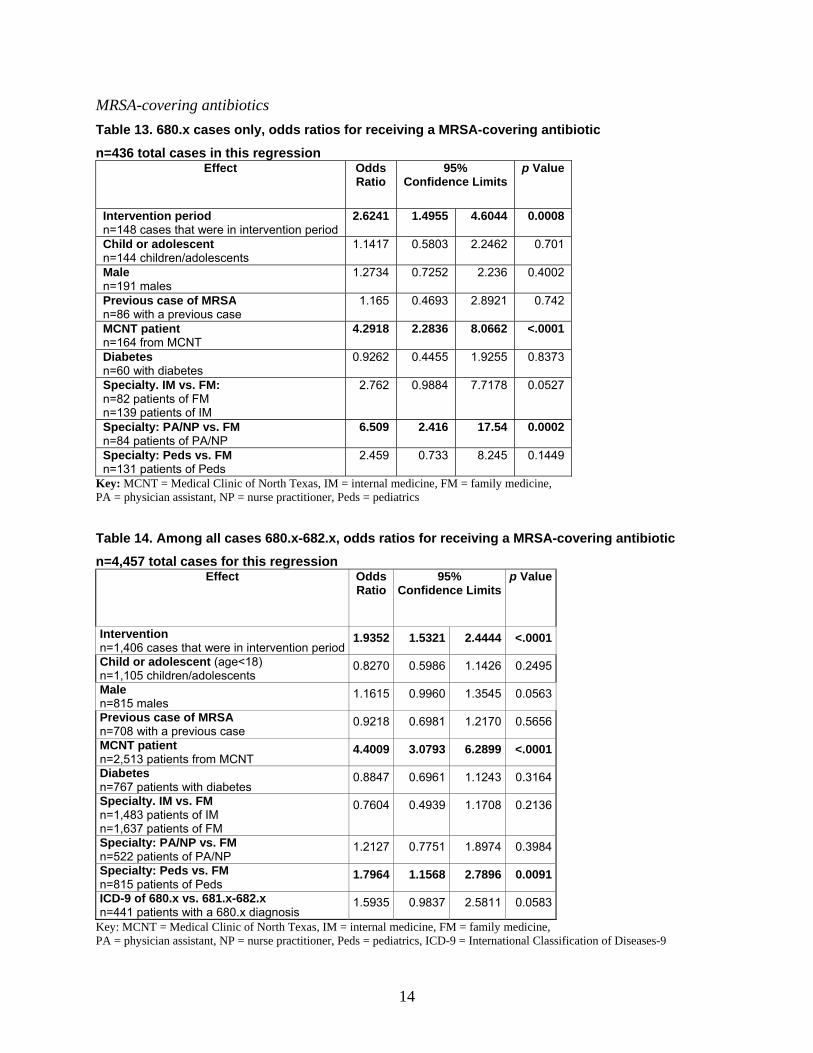
MRSA-covering antibiotics Table 13. 680.x cases only, odds ratios for receiving a MRSA-covering antibiotic
n=436 total cases in this regression Effect Odds
Ratio 95%
Confidence Limits p Value
Intervention period n=148 cases that were in intervention period
2.6241 1.4955 4.6044 0.0008
Child or adolescent n=144 children/adolescents
1.1417 0.5803 2.2462 0.701
Male n=191 males
1.2734 0.7252 2.236 0.4002
Previous case of MRSA n=86 with a previous case
1.165 0.4693 2.8921 0.742
MCNT patient n=164 from MCNT
4.2918 2.2836 8.0662 <.0001
Diabetes n=60 with diabetes
0.9262 0.4455 1.9255 0.8373
Specialty. IM vs. FM: n=82 patients of FM n=139 patients of IM
2.762 0.9884 7.7178 0.0527
Specialty: PA/NP vs. FM n=84 patients of PA/NP
6.509 2.416 17.54 0.0002
Specialty: Peds vs. FM n=131 patients of Peds
2.459 0.733 8.245 0.1449
Key: MCNT = Medical Clinic of North Texas, IM = internal medicine, FM = family medicine, PA = physician assistant, NP = nurse practitioner, Peds = pediatrics Table 14. Among all cases 680.x-682.x, odds ratios for receiving a MRSA-covering antibiotic
n=4,457 total cases for this regression Effect Odds
Ratio 95%
Confidence Limitsp Value
Intervention n=1,406 cases that were in intervention period
1.9352 1.5321 2.4444 <.0001
Child or adolescent (age<18) n=1,105 children/adolescents
0.8270 0.5986 1.1426 0.2495
Male n=815 males
1.1615 0.9960 1.3545 0.0563
Previous case of MRSA n=708 with a previous case
0.9218 0.6981 1.2170 0.5656
MCNT patient n=2,513 patients from MCNT
4.4009 3.0793 6.2899 <.0001
Diabetes n=767 patients with diabetes
0.8847 0.6961 1.1243 0.3164
Specialty. IM vs. FM n=1,483 patients of IM n=1,637 patients of FM
0.7604 0.4939 1.1708 0.2136
Specialty: PA/NP vs. FM n=522 patients of PA/NP
1.2127 0.7751 1.8974 0.3984
Specialty: Peds vs. FM n=815 patients of Peds
1.7964 1.1568 2.7896 0.0091
ICD-9 of 680.x vs. 681.x-682.x n=441 patients with a 680.x diagnosis
1.5935 0.9837 2.5811 0.0583
Key: MCNT = Medical Clinic of North Texas, IM = internal medicine, FM = family medicine, PA = physician assistant, NP = nurse practitioner, Peds = pediatrics, ICD-9 = International Classification of Diseases-9
14
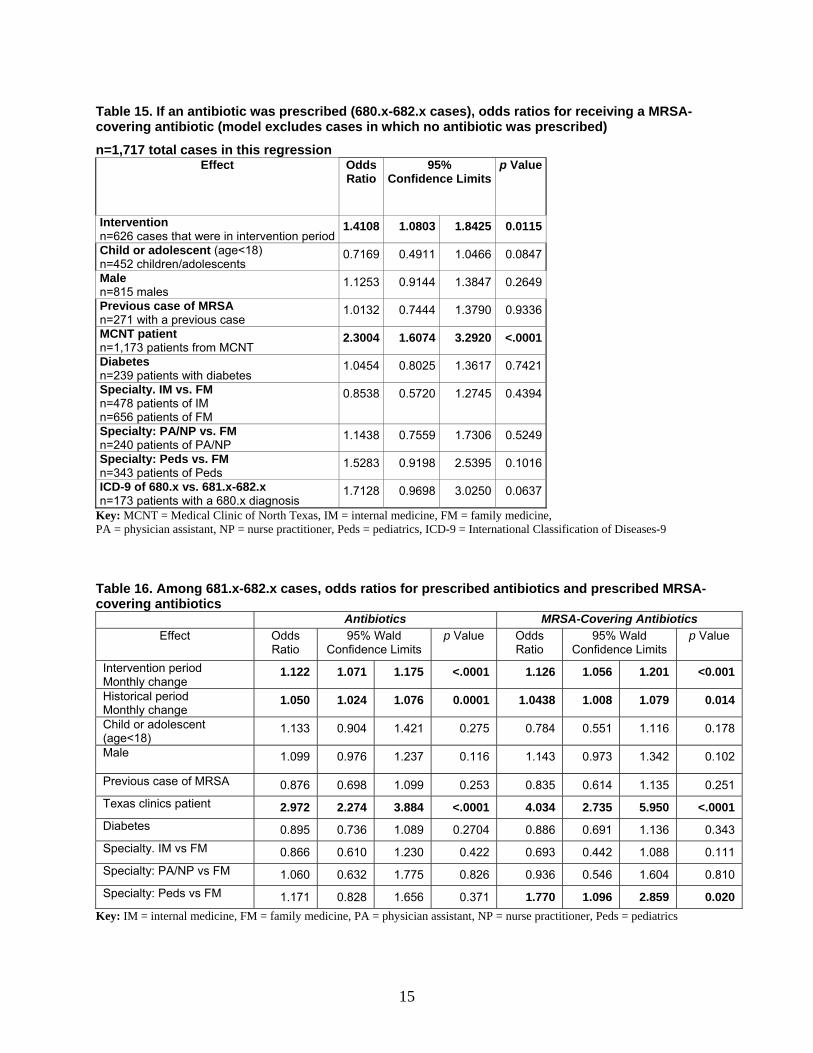
Table 15. If an antibiotic was prescribed (680.x-682.x cases), odds ratios for receiving a MRSA-covering antibiotic (model excludes cases in which no antibiotic was prescribed)
n=1,717 total cases in this regression Effect Odds
Ratio 95%
Confidence Limitsp Value
Intervention n=626 cases that were in intervention period
1.4108 1.0803 1.8425 0.0115
Child or adolescent (age<18) n=452 children/adolescents
0.7169 0.4911 1.0466 0.0847
Male n=815 males
1.1253 0.9144 1.3847 0.2649
Previous case of MRSA n=271 with a previous case
1.0132 0.7444 1.3790 0.9336
MCNT patient n=1,173 patients from MCNT
2.3004 1.6074 3.2920 <.0001
Diabetes n=239 patients with diabetes
1.0454 0.8025 1.3617 0.7421
Specialty. IM vs. FM n=478 patients of IM n=656 patients of FM
0.8538 0.5720 1.2745 0.4394
Specialty: PA/NP vs. FM n=240 patients of PA/NP
1.1438 0.7559 1.7306 0.5249
Specialty: Peds vs. FM n=343 patients of Peds
1.5283 0.9198 2.5395 0.1016
ICD-9 of 680.x vs. 681.x-682.x n=173 patients with a 680.x diagnosis
1.7128 0.9698 3.0250 0.0637
Key: MCNT = Medical Clinic of North Texas, IM = internal medicine, FM = family medicine, PA = physician assistant, NP = nurse practitioner, Peds = pediatrics, ICD-9 = International Classification of Diseases-9 Table 16. Among 681.x-682.x cases, odds ratios for prescribed antibiotics and prescribed MRSA-covering antibiotics
Antibiotics MRSA-Covering Antibiotics Effect Odds
Ratio 95% Wald
Confidence Limits p Value Odds
Ratio 95% Wald
Confidence Limits p Value
Intervention period Monthly change
1.122 1.071 1.175 <.0001 1.126 1.056 1.201 <0.001
Historical period Monthly change
1.050 1.024 1.076 0.0001 1.0438 1.008 1.079 0.014
Child or adolescent (age<18)
1.133 0.904 1.421 0.275 0.784 0.551 1.116 0.178
Male 1.099 0.976 1.237 0.116 1.143 0.973 1.342 0.102
Previous case of MRSA 0.876 0.698 1.099 0.253 0.835 0.614 1.135 0.251 Texas clinics patient 2.972 2.274 3.884 <.0001 4.034 2.735 5.950 <.0001 Diabetes 0.895 0.736 1.089 0.2704 0.886 0.691 1.136 0.343 Specialty. IM vs FM 0.866 0.610 1.230 0.422 0.693 0.442 1.088 0.111 Specialty: PA/NP vs FM 1.060 0.632 1.775 0.826 0.936 0.546 1.604 0.810 Specialty: Peds vs FM 1.171 0.828 1.656 0.371 1.770 1.096 2.859 0.020
Key: IM = internal medicine, FM = family medicine, PA = physician assistant, NP = nurse practitioner, Peds = pediatrics
15

Some other associations regarding clinicians include that pediatricians were more likely to cover MRSA, midlevels were more likely to obtain a culture, and providers at MCNT were more likely to prescribe antibiotics and more likely to cover MRSA when antibiotics were prescribed. Male patients were twice as likely to have drainage procedures done and were also twice as likely to get cultures done. Patients with diabetes were less likely to have antibiotics prescribed (680.x, cases only).
Antibiotics and MRSA Antibiotics, Accounting for Temporal Changes Temporal changes did not account for the increase in antibiotic use or MRSA antibiotics
during the intervention in 680.x cases, as seen in Tables 11 and 13. Among patients with a 681.x or 682.x diagnosis, the piecewise GEE model indicated that the intervention generated an increase in antibiotic and MRSA-antibiotic prescriptions that exceeded the natural rate of change that occurred over the period of the study. However, this increase was not statistically significant (p=0.0539 for antibiotics and p=0.1220 for MRSA antibiotics), and thus we cannot rule out that the increase in antibiotics and MRSA antibiotics weren’t due to temporal trends. There was a 12 percent per month increase in the odds of receiving an antibiotic and a 13 percent per month increase in the odds of receiving a MRSA antibiotic during the intervention period. These increases were only 5 percent and 4 percent, respectively, during the historical period (Table 16).
Other findings from the model for patients with a 681.x or 682.x diagnosis were quite revealing. For example, the odds of a patient receiving an antibiotic and an antibiotic to treat MRSA were higher for patients from Texas clinics than for patients from North Carolina clinics. The odds that a patient seen by a pediatrician received a MRSA antibiotic were higher than the odds that patients seen by a family medicine physician received such treatment.
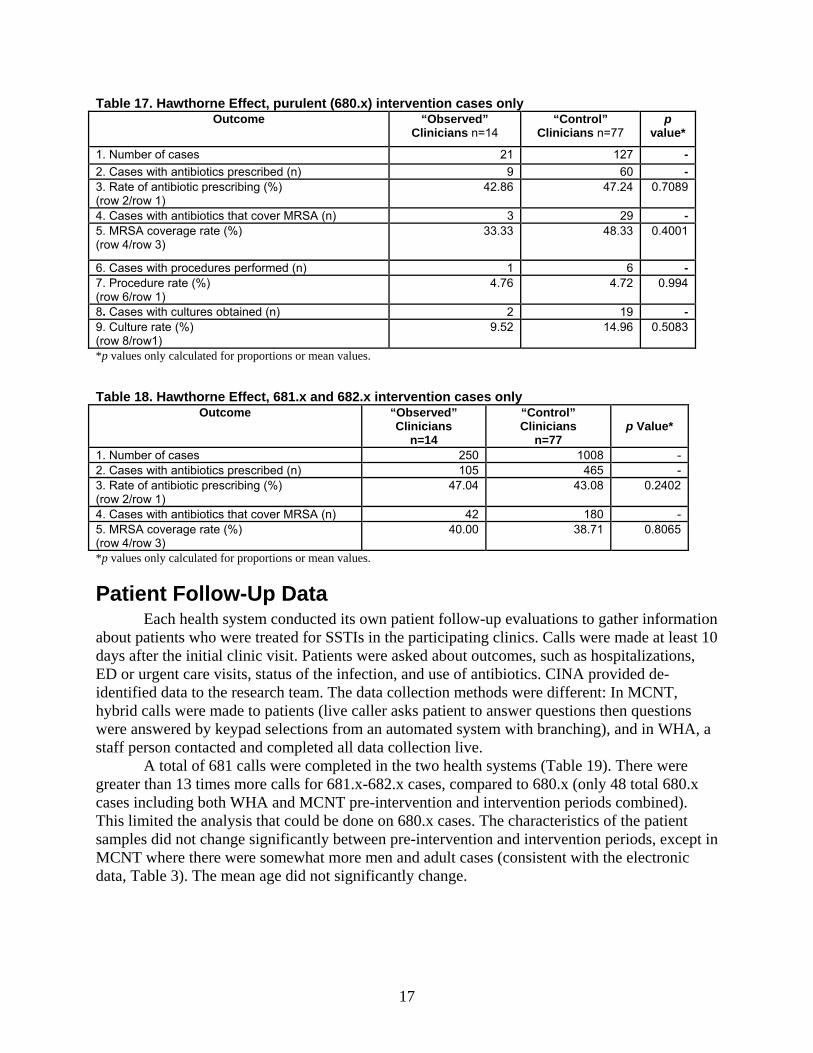
Assessment of Hawthorne Effect The Hawthorne Effect is often discussed in practice-based research networks research but
rarely measured. In this project, approximately 25 percent of clinicians participated in the evaluation of cases via the QI component of the project, which also included follow-up interviews. The other 75 percent of clinicians were “controls” for those clinicians who were “observed.” We found no Hawthorne Effects, including in the prescribing of antibiotics or the selection of antibiotics that cover MRSA, which are two outcome measures in which a Hawthorne Effect might be expected (Tables 17 and 18).
16
17
Table 17. Hawthorne Effect, purulent (680.x) intervention cases only Outcome “Observed”
Clinicians n=14 “Control”
Clinicians n=77 p
value*
1. Number of cases 21 127 -2. Cases with antibiotics prescribed (n) 9 60 -3. Rate of antibiotic prescribing (%) (row 2/row 1)
42.86 47.24 0.7089
4. Cases with antibiotics that cover MRSA (n) 3 29 -5. MRSA coverage rate (%) (row 4/row 3)
33.33 48.33 0.4001
6. Cases with procedures performed (n) 1 6 -7. Procedure rate (%) (row 6/row 1)
4.76 4.72 0.994
8. Cases with cultures obtained (n) 2 19 -9. Culture rate (%) (row 8/row1)
9.52 14.96 0.5083
*p values only calculated for proportions or mean values. Table 18. Hawthorne Effect, 681.x and 682.x intervention cases only
Outcome “Observed” Clinicians
n=14
“Control” Clinicians
n=77
p Value*
1. Number of cases 250 1008 -2. Cases with antibiotics prescribed (n) 105 465 -3. Rate of antibiotic prescribing (%) (row 2/row 1)
47.04 43.08 0.2402
4. Cases with antibiotics that cover MRSA (n) 42 180 -5. MRSA coverage rate (%) (row 4/row 3)
40.00 38.71 0.8065
*p values only calculated for proportions or mean values.
Patient Follow-Up Data Each health system conducted its own patient follow-up evaluations to gather information
about patients who were treated for SSTIs in the participating clinics. Calls were made at least 10 days after the initial clinic visit. Patients were asked about outcomes, such as hospitalizations, ED or urgent care visits, status of the infection, and use of antibiotics. CINA provided de-identified data to the research team. The data collection methods were different: In MCNT, hybrid calls were made to patients (live caller asks patient to answer questions then questions were answered by keypad selections from an automated system with branching), and in WHA, a staff person contacted and completed all data collection live.
A total of 681 calls were completed in the two health systems (Table 19). There were greater than 13 times more calls for 681.x-682.x cases, compared to 680.x (only 48 total 680.x cases including both WHA and MCNT pre-intervention and intervention periods combined). This limited the analysis that could be done on 680.x cases. The characteristics of the patient samples did not change significantly between pre-intervention and intervention periods, except in MCNT where there were somewhat more men and adult cases (consistent with the electronic data, Table 3). The mean age did not significantly change.
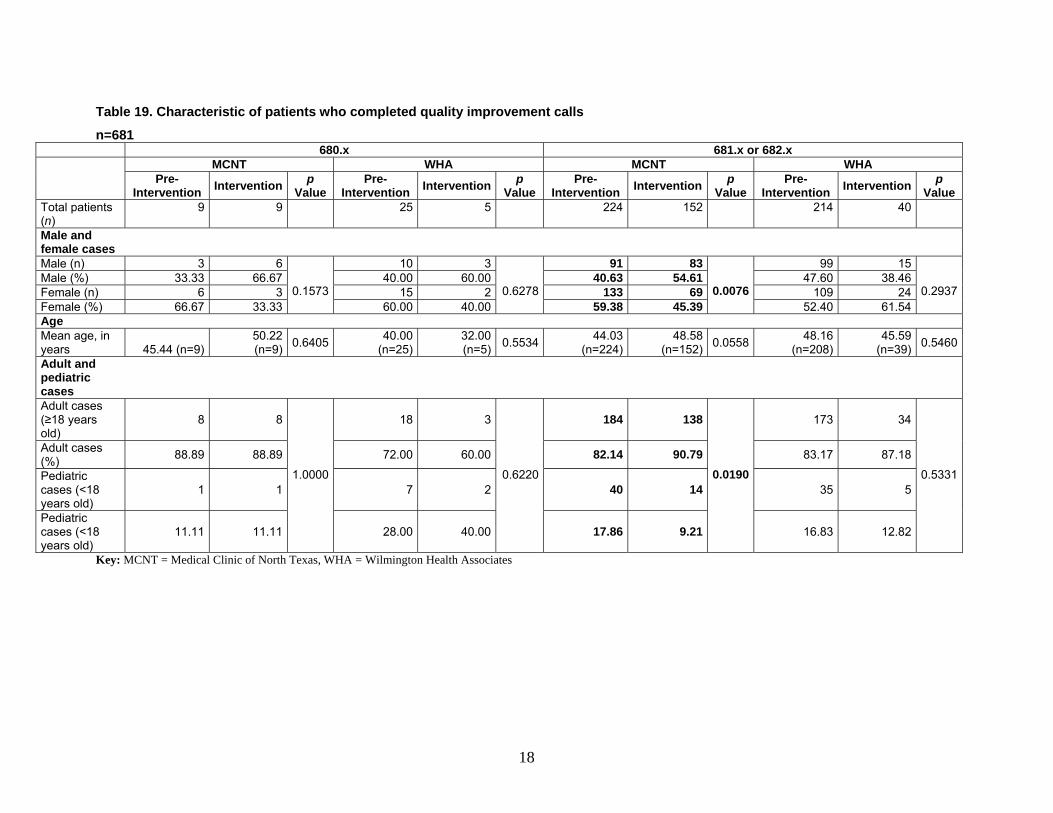
Table 19. Characteristic of patients who completed quality improvement calls
n=681 680.x 681.x or 682.x MCNT WHA MCNT WHA
Pre-
Intervention Intervention p Value
Pre-Intervention Intervention p
Value Pre-
Intervention Intervention p Value
Pre-Intervention Intervention p
Value Total patients (n)
9 9 25 5 224 152 214 40
Male and female cases
Male (n) 3 6
0.1573
10 3
0.6278
91 83
0.0076
99 15
0.2937Male (%) 33.33 66.67 40.63 54.6140.00 60.00 47.60 38.46Female (n) 6 3 133 6915 2 109 24Female (%) 66.67 33.33 59.38 45.3960.00 40.00 52.40 61.54Age Mean age, in years 45.44 (n=9)
50.22 (n=9) 0.6405 40.00
(n=25)32.00(n=5) 0.5534 44.03
(n=224) 48.58
(n=152) 0.0558 48.16(n=208)
45.59(n=39) 0.5460
Adult and pediatric cases
Adult cases (≥18 years old)
8 8
1.0000
18 3
0.6220
184 138
0.0190
173 34
0.5331
Adult cases (%) 88.89 88.89 82.14 90.7972.00 60.00 83.17 87.18
Pediatric cases (<18 years old)
1 1 40 147 2 35 5
Pediatric cases (<18 years old)
11.11 11.11 17.86 9.2128.00 40.00 16.83 12.82
Key: MCNT = Medical Clinic of North Texas, WHA = Wilmington Health Associates
18

Among the outcomes patients were asked about, there were no significant differences reported between the pre-intervention and intervention periods. Although unplanned care events were more common in MCNT, these events were infrequent across both groups with no significant change from pre-intervention to intervention. The proportion of cases that resolved at the time of the patient telephone contact did not change between the pre-intervention and intervention period, although there was a much higher proportion resolved in WHA compared to MCNT (Table 20). The number of cases with a 680.x diagnosis and time to resolution data was too small to discern any trends. Among 681-682.x cases, there were sufficient cases for MCNT only, and during the intervention, the time to resolution decreased slightly by 0.7 days, but this was not significant (p=0.4881). Because of the delays in the vast majority of WHA calls resulting in their exclusion from the time to resolution analysis, the sample size for time to resolution at WHA for 681-682.x cases is very small and difficult to interpret. The overwhelming majority of patients who were prescribed antibiotics said they picked them up, indicating good adherence. Second courses of antibiotics occurred in less than 10 percent of cases overall and were more common in MCNT. However, there was no change in the rate of this comparing the pre-intervention to the intervention period.
19
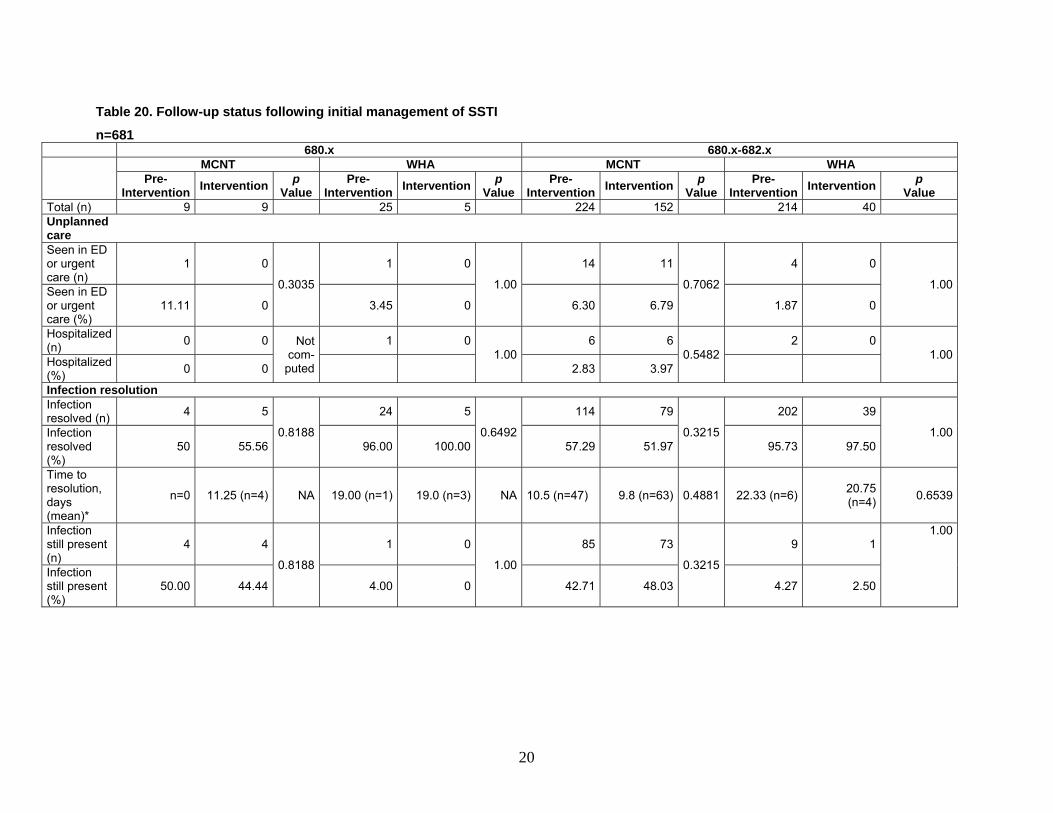
Table 20. Follow-up status following initial management of SSTI
n=681 680.x 680.x-682.x MCNT WHA MCNT WHA
Pre-
Intervention Intervention p Value
Pre-Intervention Intervention p
Value Pre-
Intervention Intervention p Value
Pre-Intervention Intervention p
Value Total (n) 9 9 25 5 224 152 214 40Unplanned care
Seen in ED or urgent care (n)
1 0
0.3035
1 0 4 0
1.00
14 11
0.7062 1.00Seen in ED or urgent care (%)
11.11 0 3.45 0 6.30 6.79 1.87 0
Hospitalized (n) 0 0 Not
com-puted
1 0 6 6 2 01.00 0.5482 1.00Hospitalized
(%) 0 0 2.83 3.97
Infection resolution Infection resolved (n) 4 5
0.8188
24 5
0.6492
114 79
0.3215
202 39
1.00Infection resolved (%)
50 55.56 96.00 100.00 57.29 51.97 95.73 97.50
Time to resolution, days (mean)*
n=0 11.25 (n=4) NA 19.00 (n=1) 19.0 (n=3) NA 10.5 (n=47) 9.8 (n=63) 0.4881 22.33 (n=6) 20.75 (n=4) 0.6539
Infection still present (n)
4 4
0.8188
1 0 9 1
1.00
85 73
0.3215
1.00
Infection still present (%)
50.00 44.44 4.00 0 42.71 48.03 4.27 2.50
20
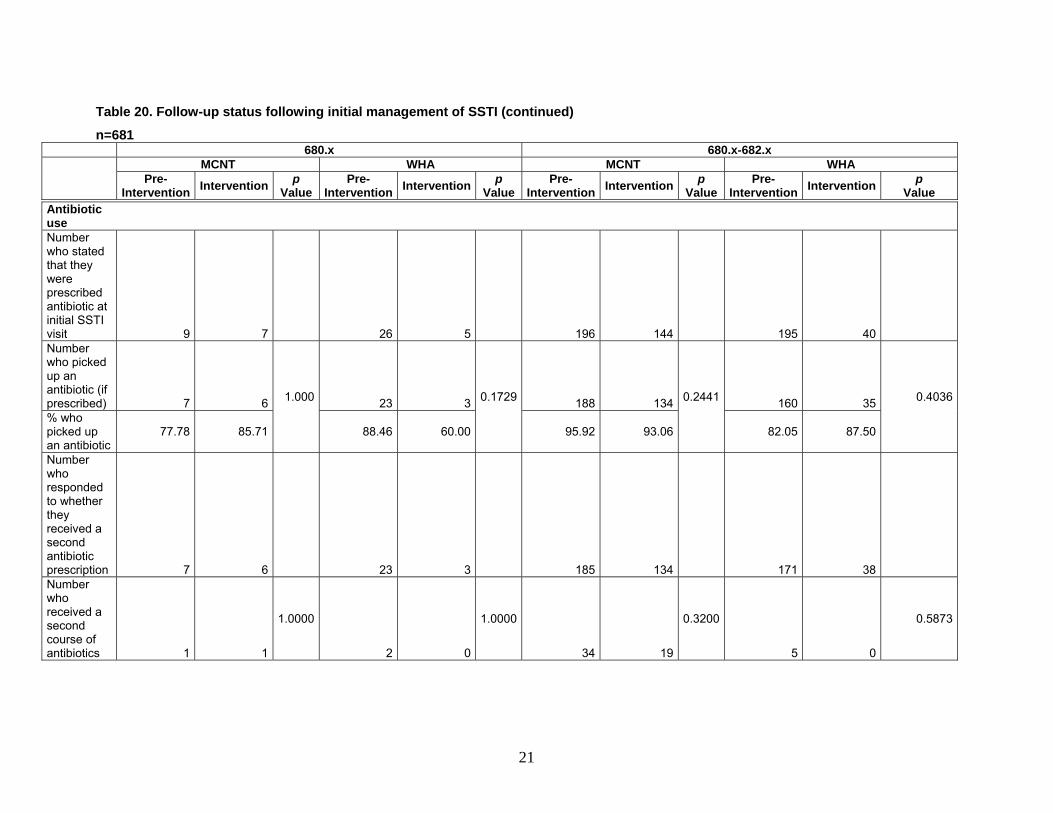
Table 20. Follow-up status following initial management of SSTI (continued)
n=681 680.x 680.x-682.x MCNT WHA MCNT WHA
Pre-
Intervention Intervention p Value
Pre-Intervention Intervention p
Value Pre-
Intervention Intervention p Value
Pre-Intervention Intervention p
Value
Antibiotic use
Number who stated that they were prescribed antibiotic at initial SSTI visit 9 7
26 5
196 144
195 40
Number who picked up an antibiotic (if prescribed) 7 6 1.000 23 3 0.1729 188 134 0.2441 160 35 0.4036
% who picked up an antibiotic
77.78 85.71 88.46 60.00 95.92 93.06 82.05 87.50
Number who responded to whether they received a second antibiotic prescription 7 6
23 3 185 134 171 38Number who received a second course of antibiotics 1 1
1.0000
2 0 5 0
1.0000
34 19
0.3200 0.5873
21
22
Table 20. Follow-up status following initial management of SSTI (continued)
n=681 680.x 680.x-682.x MCNT WHA MCNT WHA
Pre-
Intervention Intervention p Value
Pre-Intervention Intervention p
Value Pre-
Intervention Intervention p Value
Pre-Intervention Intervention p
Value
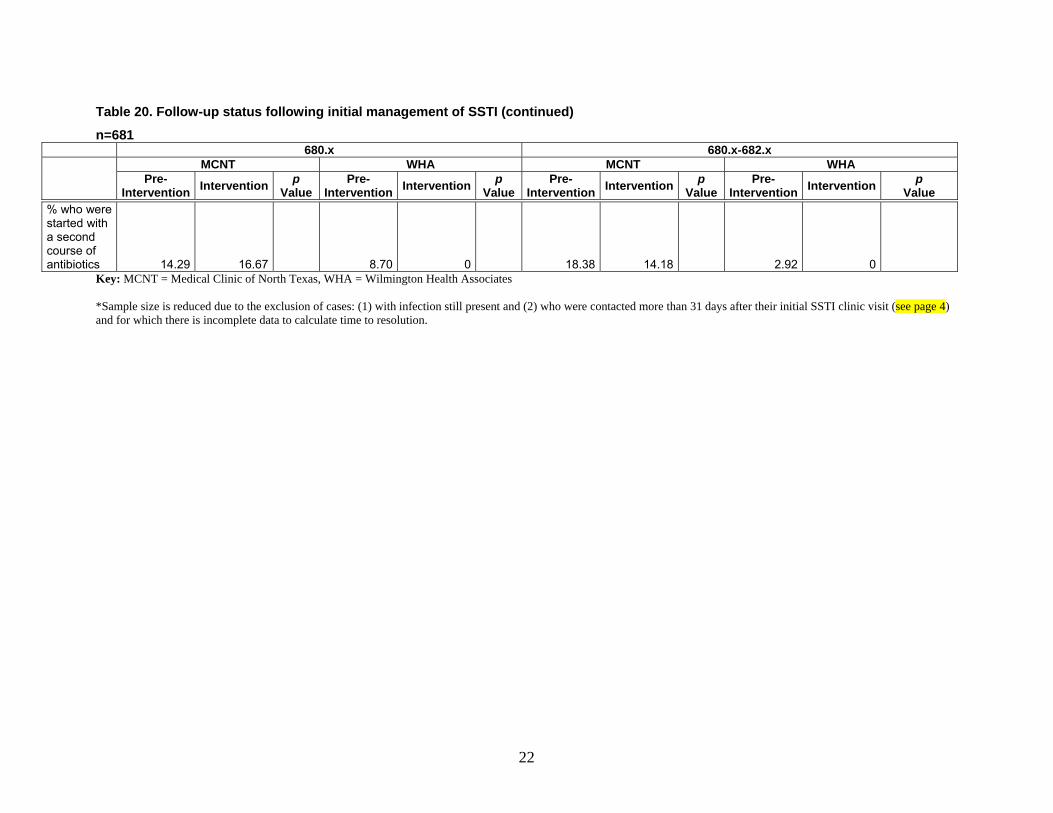
% who were started with a second course of antibiotics 14.29 16.67
8.70 0 18.38 14.18 2.92 0Key: MCNT = Medical Clinic of North Texas, WHA = Wilmington Health Associates *Sample size is reduced due to the exclusion of cases: (1) with infection still present and (2) who were contacted more than 31 days after their initial SSTI clinic visit (see page 4) and for which there is incomplete data to calculate time to resolution.
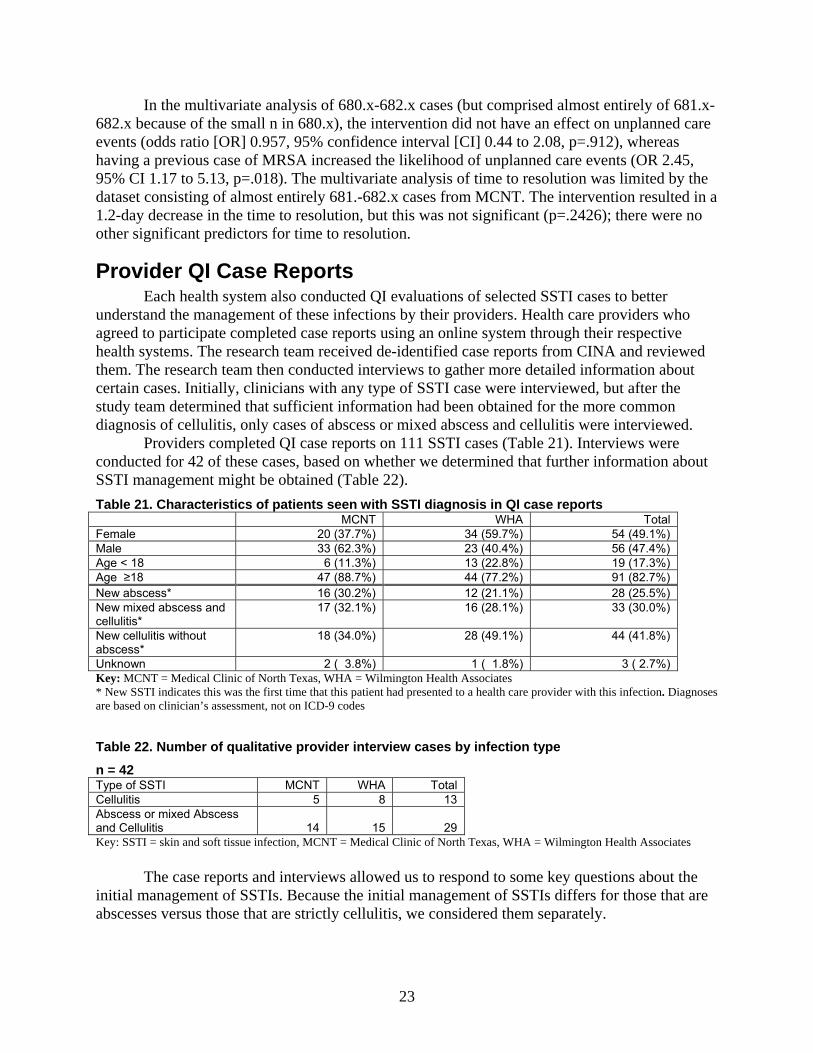
In the multivariate analysis of 680.x-682.x cases (but comprised almost entirely of 681.x-682.x because of the small n in 680.x), the intervention did not have an effect on unplanned care events (odds ratio [OR] 0.957, 95% confidence interval [CI] 0.44 to 2.08, p=.912), whereas having a previous case of MRSA increased the likelihood of unplanned care events (OR 2.45, 95% CI 1.17 to 5.13, p=.018). The multivariate analysis of time to resolution was limited by the dataset consisting of almost entirely 681.-682.x cases from MCNT. The intervention resulted in a 1.2-day decrease in the time to resolution, but this was not significant (p=.2426); there were no other significant predictors for time to resolution.
Provider QI Case Reports Each health system also conducted QI evaluations of selected SSTI cases to better
understand the management of these infections by their providers. Health care providers who agreed to participate completed case reports using an online system through their respective health systems. The research team received de-identified case reports from CINA and reviewed them. The research team then conducted interviews to gather more detailed information about certain cases. Initially, clinicians with any type of SSTI case were interviewed, but after the study team determined that sufficient information had been obtained for the more common diagnosis of cellulitis, only cases of abscess or mixed abscess and cellulitis were interviewed.
Providers completed QI case reports on 111 SSTI cases (Table 21). Interviews were conducted for 42 of these cases, based on whether we determined that further information about SSTI management might be obtained (Table 22). Table 21. Characteristics of patients seen with SSTI diagnosis in QI case reports MCNT WHA Total Female 20 (37.7%) 34 (59.7%) 54 (49.1%) Male 33 (62.3%) 23 (40.4%) 56 (47.4%) Age < 18 6 (11.3%) 13 (22.8%) 19 (17.3%) Age ≥18 47 (88.7%) 44 (77.2%) 91 (82.7%) New abscess* 16 (30.2%) 12 (21.1%) 28 (25.5%) New mixed abscess and cellulitis*
17 (32.1%) 16 (28.1%) 33 (30.0%)
New cellulitis without abscess*
18 (34.0%) 28 (49.1%) 44 (41.8%)
Unknown 2 ( 3.8%) 1 ( 1.8%) 3 ( 2.7%) Key: MCNT = Medical Clinic of North Texas, WHA = Wilmington Health Associates * New SSTI indicates this was the first time that this patient had presented to a health care provider with this infection. Diagnoses are based on clinician’s assessment, not on ICD-9 codes
Table 22. Number of qualitative provider interview cases by infection type
n = 42 Type of SSTI MCNT WHA Total Cellulitis 5 8 13 Abscess or mixed Abscess and Cellulitis 14 15 29 Key: SSTI = skin and soft tissue infection, MCNT = Medical Clinic of North Texas, WHA = Wilmington Health Associates
The case reports and interviews allowed us to respond to some key questions about the initial management of SSTIs. Because the initial management of SSTIs differs for those that are abscesses versus those that are strictly cellulitis, we considered them separately.
23
Management and Treatment of Abscesses The CDC guidelines recommend I&D as the primary treatment for abscess and culturing
all purulent discharge. The guidelines note that if an antibiotic is used in the treatment of abscesses, it should cover CA-MRSA. In light of these recommendations, the key questions for purulent skin infections were:
1. What factors influence whether a provider elects to drain an abscess? 2. What factors influence whether a provider packs an abscess after an I&D? 3. In a patient with an abscess, what factors influence whether or not a culture is done? 4. When antibiotics are used, what factors influence the decision whether or not to cover
MRSA? 5. How did providers use the intervention materials (I&D kits, patient education, and
provider guidelines), and what were the barriers to implementation? 1. What factors influence whether a provider elects to drain an abscess?
Among the QI case reports, 66 were cases with abscesses. The primary care providers provided QI information for 29 of these cases. These providers reported either performing a drainage procedure or referring the patient for a drainage procedure in 65 percent of these patients. Large deep abscesses were more likely to be drained. Reasons for not draining an abscess included: Spontaneous drainage, patient self manipulation leading to drainage, small size, folliculitis, or being located in a sensitive position like the scrotum. 2. What factors influence whether a provider packs an abscess after an I&D?
Provider opinions about packing varied, with some reporting that they pack most abscesses and some almost never pack. The most common reason for packing was large abscess size. Providers who did not use packing reported not seeing treatment failures. Other reasons for not packing abscesses included: Not having or being unable to find packing material, insufficient time, lack of available follow-up appointments, packing requires a larger incision that makes a larger scar, a superficial abscess, or an abscess that was fully drained. 3. In a patient with an abscess, what factors influence whether or not a culture is done?
All providers interviewed reported that they generally obtain cultures when treating abscesses. Cultures were actually obtained in 67 percent of the cases discussed in the provider interviews. Reasons for not culturing included: No procedure was done, no pus was seen, or the culture, regardless of the results, would not change the treatment. No providers indicated that culture results for these cases changed the treatment. 4. When antibiotics are used, what factors influence the decision whether or not to cover MRSA?
Among the cases where an interview was conducted, providers reported using antibiotics for over 90 percent of patients with abscesses (Table 23). The majority of providers prescribed antibiotics for all abscesses when MRSA was suspected. This was considered to be the community standard of care, even if an abscess was drained completely. The most commonly used antibiotic was TMP/SMX (trimethoprim\sulfamethosazole), which was prescribed for 73 percent of patients (Table 24). Providers prescribed antibiotics that the CDC recommends to cover CA-MRSA in all patients with abscesses who received antibiotics. Many clinicians
24
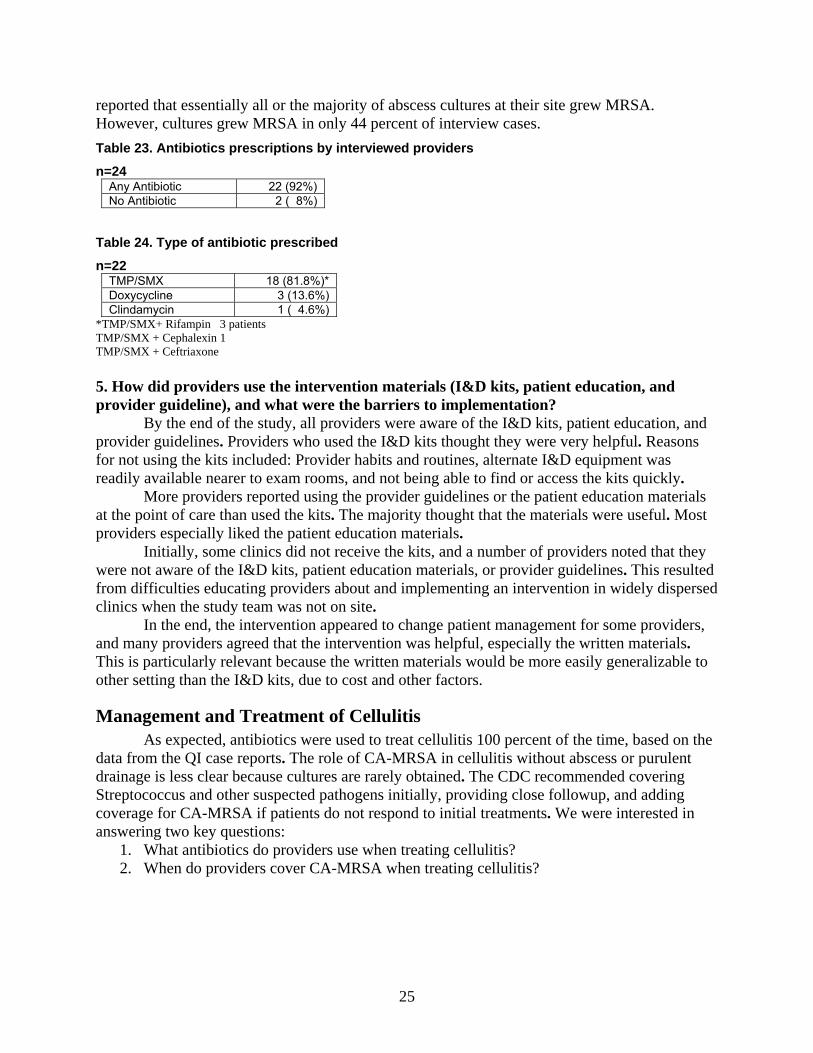
reported that essentially all or the majority of abscess cultures at their site grew MRSA. However, cultures grew MRSA in only 44 percent of interview cases. Table 23. Antibiotics prescriptions by interviewed providers
n=24 Any Antibiotic 22 (92%) No Antibiotic 2 ( 8%)
Table 24. Type of antibiotic prescribed
n=22 TMP/SMX 18 (81.8%)* Doxycycline 3 (13.6%) Clindamycin 1 ( 4.6%)
*TMP/SMX+ Rifampin 3 patients TMP/SMX + Cephalexin 1 TMP/SMX + Ceftriaxone 5. How did providers use the intervention materials (I&D kits, patient education, and provider guideline), and what were the barriers to implementation?
By the end of the study, all providers were aware of the I&D kits, patient education, and provider guidelines. Providers who used the I&D kits thought they were very helpful. Reasons for not using the kits included: Provider habits and routines, alternate I&D equipment was readily available nearer to exam rooms, and not being able to find or access the kits quickly.
More providers reported using the provider guidelines or the patient education materials at the point of care than used the kits. The majority thought that the materials were useful. Most providers especially liked the patient education materials.
Initially, some clinics did not receive the kits, and a number of providers noted that they were not aware of the I&D kits, patient education materials, or provider guidelines. This resulted from difficulties educating providers about and implementing an intervention in widely dispersed clinics when the study team was not on site.
In the end, the intervention appeared to change patient management for some providers, and many providers agreed that the intervention was helpful, especially the written materials. This is particularly relevant because the written materials would be more easily generalizable to other setting than the I&D kits, due to cost and other factors.
Management and Treatment of Cellulitis As expected, antibiotics were used to treat cellulitis 100 percent of the time, based on the
data from the QI case reports. The role of CA-MRSA in cellulitis without abscess or purulent drainage is less clear because cultures are rarely obtained. The CDC recommended covering Streptococcus and other suspected pathogens initially, providing close followup, and adding coverage for CA-MRSA if patients do not respond to initial treatments. We were interested in answering two key questions:
1. What antibiotics do providers use when treating cellulitis? 2. When do providers cover CA-MRSA when treating cellulitis?
25
1. What antibiotics do providers use when treating cellulitis? The majority of the patients (58 percent) in this QI report sample received antibiotics that
are recommended by the CDC for suspected CA-MRSA. Antibiotics covering Group A Streptococci were prescribed for 75 percent of patients. 2. When do providers cover CA-MRSA when treating cellulitis?
Eight of the 12 providers providing QI data were more likely to consider CA-MRSA as the cause of a cellulitis when the appearance of the cellulitis suggested CA-MRSA. Cellulitis from MRSA was described as “very red,” inflamed, or draining pus and as having a rapid onset associated with fever or an ill-appearing patient. A “gut feeling” that the cellulitis was caused by MRSA or a cellulitis that looked like it might turn into an abscess also made providers more likely to treat a cellulitis patient with a CA-MRSA-covering antibiotic. Patients at higher risk for risk MRSA infection described by clinicians included recently hospitalized patients, frail older patients, nursing home residents, hospital workers, diabetics, and patients who played contact sports.
Manual Chart Audit Manual chart audits were conducted in each health system for comparison with CINA’s
automated data extraction (i.e., electronic chart audit). In addition to the manual chart audit conducted prior to the intervention period, a manual chart audit was conducted after the intervention period on 40 randomly selected abscess cases per health system for the 6- to 7-month intervention time period (with up to 100 cases total including a short audit of non-abscess SSTIs cases to verify non-abscess status). This chart audit was used validate the automated audit information and collect additional information not available electronically, such as key elements of the history (e.g., length of time from initial symptoms until presentation, whether the patient in contact sports program) and physical description of the abscess (location, size, and description of the SSTI).
A total of 160 cases were reviewed for the chart audit, including 40 pre-intervention in each system and 40 during the intervention in each system (Table 25). The procedure rate among abscesses was about 25 percent in the pre-intervention and intervention audits combined, which was three times higher than the procedure rate found in the electronic audit. This suggests that procedures were not being captured in the electronic audit. Similarly, the overall culture rate in the audit was 37 percent, 2.3 times higher than found in the electronically obtained data.
26

Table 25. Manual chart audit results, including pre-intervention and intervention periods
Key: MCNT = Medical Clinic of North Texas, WHA = Wilmington Health Associates
System (primary care only) WHA MCNT Total
Months/years of data collection Pre-Interven-tion
Interven-tion
Pre-Interven-tion
Interven-tion
Pre-Interven-tion
Interven-tion
Number of abscess cases 34 39 38 40 72 79 Classified 680 21
(61.7%)19
(48.7%)20
(52.6%)20
(50.0%)41
(56.9%) 39 (49.4%)
Classified 681,682
13 (38.2%)
20 (51.3%)
18 (47.4%)
19 (50.0%)
31 (43.1%)
39 (49.4%)
Culture obtained, n/%
10 (30.3%)
13 (33.3%)
17 (44.7%)
16 (40.0%)
27 (37.5%)
29 (36.7%)
% of Cultures obtained that are Staphylococcus aureus
7 (70.0%) 9 (69.2%) 14 (82.4%)
10 (62.5%)
21 (77.8%)
19 (65.5%)
% of Staphylococcus aureus that are MRSA
1 (14.3%) 4 (44.4%)
2 (14.3%) 7 (70.0%) 3 (14.3%) 11 (57.9%)
Procedures done, n/%
6 (18.2%) 7 (18.0%) 9 (23.7%) 15 (37.5%)
15 (20.8%)
22 (27.8%)
Abscess characteristics
Number of cases with more than one lesion
7 (20.6%) 7 (18.0%) 8 (21.1%) 2 (21.1%) 15 (20.83%)
9 (11.4%)
% Referred 0 (0%)
0 (0%)
0 (0%)
4 (10.0%) 0 (0%)
4 (5.1%)
% with documentation of follow-up plans
30 (88.2%)
35 (89.7%)
34 (89.5%)
25 (62.5%)
64 (88.9%)
60 (75.9%)
% Subsequent unplanned visits outside of clinic
0 (0%) 0 (0%) 0 (0%) 0 (0%) 0 (0%) 0 (0%)
Number of cellulitis without an abscess
5 0 8 0 13 0 (0%)
Classified 680 0 (0%)
0 (0%)
1 (12.5%) 0 (0%)
1 (7.7%)
0 (0%)
Classified 681,682
5 (100%) 0 (0%)
7 (87.5%) 0 (0%)
12 (92.3%)
0 (0%)
Discussion Primary Outcomes
The intervention was designed to optimize treatment for SSTIs consistent with the CDC CA-MRSA guidelines. In particular, we looked for changes in rates of I&D procedures performed, cultures obtained, and use of systemic antibiotics. When 3,112 pre-intervention SSTI cases were compared to 1,406 intervention-period cases, overall procedure and culture rates were low. Based on the qualitative findings, many of the abscesses were spontaneously draining when the patient presented at clinic, and these generally do not require that a procedure be performed.
27
A trend toward a small decrease in the overall procedure rate was observed. Clinical considerations, such as abscess size or depth degree of fluctuance may drive decisions about drainage procedures more than the suspected etiology of the infection. If this is true, then an intervention aimed at increasing MRSA awareness would not be expected to increase procedure rates. It is possible that increasing awareness of MRSA across the population may have resulted in patients presenting earlier in the course of their illness over time. Very early abscesses may be less likely to need drainage procedures; this might explain the overall decrease in procedure rates during the intervention. In this context, it is interesting to note that men were two times more likely to receive a drainage procedure; perhaps this is because men are less likely to see a doctor for any complaint and may present later in the course of an SSTI. Among midlevel providers, culture rates were significantly higher despite lower procedure rates. Cultures obtained from spontaneously draining lesions and from aspirated lesions may account for cultures when procedures are not done or detected. However, it is unclear why these circumstances would be more common among midlevels.
It is likely that we were unable to capture the majority of procedures in the electronic dataset, as suggested by the much higher procedure rate in the manual audit. Reasons for not capturing procedures include that the clinician does not bill for it (this may be more common for aspiration procedures, which are a more minor procedure) or the patient is referred to a specialist or emergency room where a procedure is done but not captured in the electronic dataset. When the majority of procedures are not captured, the trend toward a decrease in the procedure rate may be a spurious finding. Finally, the intervention period coincided with the peak of the 2009 H1N1 influenza epidemic when practices reported very high patient volumes. Amid high patient volume, providers may have felt they did not have enough time to perform procedures.
The CDC recommends that providers culture all purulent infections, but the intervention did not increase culture rates significantly. Cultures are important for MRSA disease surveillance, yet the culture may have little impact on the care of an individual patient, especially if MRSA-covering antibiotics will be given anyway. The providers who agreed to participate in the QI evaluations were very interested in MRSA surveillance and performed cultures in all patients where there was purulent drainage, yet none of these culture results actually changed the clinical management for those patients. Although MRSA prevalence is increasing (or providers are becoming more aware of increasing MRSA prevalence), it is reasonable to expect little or no change in clinician behavior on drainage (and therefore culture, which is tied to drainage) because that is already standard of care. Finally, similar to the discussion of procedure rates above, for unclear reasons, cultures were not fully captured in the electronic dataset, and therefore significant changes in the culture rate could be missed. Supporting this is the finding of a much higher culture rate in the manual audit.
CDC guidelines recommend I&D as the primary treatment for abscesses and that systemic use of antibiotics, if used, cover MRSA. Antibiotics are recommended for the treatment of cellulitis; however, the CDC notes that the role of MRSA in cellulitis is uncertain. Compared to the pre-intervention period, during the intervention period antibiotic use increased significantly in both systems for all 680.x, 681.x, and 682.x skin infections, and the proportion of prescribed antibiotics that covered MRSA also increased significantly. It is possible that the significant increase in antibiotics and MRSA-covering antibiotics for 681.x-682.x can be accounted for by temporal trends. The piecewise GEE model indicated that the intervention generated an increase in antibiotic and MRSA antibiotic prescriptions that exceeded the natural rate of change that occurred over the period of the study. However, this increase was not
28
statistically significant (p=0.0539 for antibiotics and p=0.1220 for MRSA antibiotics). The increase in antibiotics and MRSA-covering antibiotics for 680.x was also significant and, as opposed to 681.x-682.x cases, temporal trends do not explain it.
Patients with diabetes among 680.x cases appeared to receive fewer antibiotics. It is possible that diabetics were referred to specialists more often for I&D since primary care clinicians may be reluctant to perform procedures in higher risk diabetic patients. If this was the case, any antibiotics would not appear associated with the provider at the index visit.
If we postulate that the proportion of cellulitis cases in diagnostic codes 681.x and 682.x remained approximately the same across the duration of the study, then most of this increase in antibiotic prescribing during the intervention may have resulted from the increased use of antibiotics for abscesses. In the focus groups and qualitative interviews, providers frequently noted that they were uncomfortable not treating possible MRSA with antibiotics. Some clinicians commented that using antibiotics in abscess patients with suspected MRSA was the “community standard of care” with the implication that deviating from the community standard of care may increase malpractice risk. From the increasing prevalence of MRSA, or increased awareness of its prevalence, it is reasonable to expect that clinicians would change their prescribing behaviors, including possibly prescribing more often, and certainly prescribing more often to cover MRSA, as the results suggest.
Patient Follow-Up The patient follow-up data did not reveal significant differences from pre-intervention to
intervention on key outcomes of hospitalization, ED or urgent care visits, proportion of cases that resolved, medication adherence, the need for a second course of antibiotics, or time to infection resolution. This suggests that the intervention did not have any untoward effects in each of the systems nor did it improve these important outcomes. It may be that unmeasured effects, such as the severity of the SSTI, were more important for these outcomes. There were some notable differences between the two health systems. In the multivariate analyses, a previous MRSA infection was associated with more unplanned care events, which may be due to greater difficulty in successfully treating recurrent infections. Otherwise, the multivariate analysis for time to resolution and unplanned care events did not yield any new significant findings.
Although we do not have data to explain the variation in reported visits to ED or urgent care, it is possible that differences in clinic access for follow-up care, availability and access to urgent care centers, or open-access scheduling would account for these differences between the systems. Finally, almost all cases in WHA were resolved at the time of follow-up, whereas only about half of the cases had resolved in MCNT. This is likely because the average days to followup differed significantly in the two health systems, with WHA completing calls about 36 days later on average than MCNT.
Provider QI Case Reports Clinicians providing QI reports performed significantly more drainage procedures for
abscesses and obtained cultures 100 percent of the time a procedure was done or when the abscess drained spontaneously. This could reflect increased concern about MRSA in providers who volunteered to be interviewed or a reporting bias in which providers were more likely to agree to be interviewed about cases that were more difficult to manage and, therefore, were more likely to require drainage. These providers were more likely to prescribe antibiotics for abscesses, and when antibiotics were prescribed, they reported using MRSA-covering antibiotics
29

100 percent of the time. This could be a result of the intervention, or it could reflect greater provider knowledge of MRSA and the guidelines from a baseline higher level of concern about MRSA. As noted before, these providers frequently expressed the idea that they were uncomfortable not treating abscesses with antibiotics because they perceived that this was the community standard of care. Only a few of the interviewed providers were willing to forgo antibiotics in completely drained abscesses regardless of the CDC guidelines and research data showing that adding antibiotic treatment to drainage procedures does not change outcomes for completely drained abscesses less than 5 cm in diameter. It should be emphasized that the provider QI reports and interviews were not done on randomly selected cases. When all cases were considered, no Hawthorne Effect was seen.
The qualitative analysis of the QI reports also added information not available in any other part of the study about:
• Widely varying provider views about and use of packing. • Provider concerns about using doxycyline or clindamycin for SSTI treatment. • High rates of spontaneous drainage in abscesses and how this changed treatment
decisions. • Whether culture results changed clinical management. • Whether providers thought about covering MRSA and/or strep in cellulitis patients. • Providers’ thoughts about presenting characteristics of MRSA infections. • Providers’ assessment of MRSA risk factors. • How the intervention materials were used in clinical practice.
Manual Chart Audit The manual audit indicates that the 680.x code is sensitive and specific for purulent
infections (as compared to cellulitis). The manual audit also suggests limitations in the electronic dataset for identifying cultures and procedures, as discussed above.
Limitations Data Extraction
Although data were extracted electronically from EHRs, there are possible limitations with regard to the accuracy and completeness of the data. The focus of this project was on purulent infections, which are likely to be caused by CA-MRSA, as compared to cellulitis, in which the etiology is less clear. Although the 680.x ICD-9 codes reliably identify purulent infections, the majority of purulent infections are coded as 681-682.x. Yet within the 681-682.x codes, the majority of cases appear to not be purulent (cellulitis only). Thus a major limitation of this project is identifying with reasonable certainty the cases that are purulent based on the diagnostic code. Billing codes were used to determine if a procedure was done, but there may be inaccuracies in the data due to billing data being separate from EHR data. Based on our interviews with clinicians, we learned that some procedures are not billed for any number of reasons. In one health system with a surgical department, the billing system is separate from the EHR. Because there is a manual process for following up on missing Current Procedural Terminology, or CPT, codes, physicians may feel less urgency to enter these at the same time as the procedure; thus billing codes for procedures might not appear with the ICD-9 classification code at the time of visit. Although EHRs have codified prescriptions for most medications and
30

dosages, they still allow for manual entry by clinicians. Because manual entries contained misspellings, incomplete words, or non-standard entries, we have missed detecting some antibiotics. Also, we would have missed handwritten prescriptions for antibiotics. While we do not believe these data limitations were different during the pre-intervention and intervention periods, it is possible that providers who were not billing as much for procedures did increase their coding during this QI project.
With heavy reliance on servers for storing and transferring electronic data, server outages can have potentially negative consequences for a study such as this. At one point, a server in WHA was down, so new data feeds were not updating records. This outage meant that patient followups could not be conducted for several weeks. While WHA attempted to remedy the problem by calling patients who had been missed, it may have significantly decreased the number of completed patient follow-up evaluations WHA could conduct. In addition, calls to patients were delayed because of this, increasing the possibility of a recall bias and leading to data that could not be used for time to resolution of infection. These delays also biased the comparison between the two systems of whether an infection was resolved, since the longer the delay in contacting the patient, the more likely the infection would have resolved independent of clinical care factors. Finally, at WHA, the calls to patients were made by a staff person with other work responsibilities, resulting in delays even when the servers were fully operational (this staff person also changed mid-study due to health reasons). In MCNT, the calls to patients were made by an outside company contracted by MCNT, and this resulted in calls to patients occurring much sooner after the initial SSTI encounter. The small sample size of 680.x cases in the patient follow-up calls unfortunately made it difficult to discern trends in these ICD-9 codes that have the most specificity for purulent infections.
Late in the study period, servers at CINA were out for a period of time, which halted provider QI case reporting in both health systems. It is not known how many case reports were delayed or incomplete due to the outage, but the number is likely very small.
Intervention The study team for this QI project was based in Kansas City and Denver, remote from
where the intervention was conducted in North Carolina and Texas. Although there was a key champion for each system, there was no identified champion at each site; thus, we are uncertain of the fidelity of the intervention. This concern was confirmed in the clinician interviews, during which several clinicians stated they were unaware of the intervention.
There was a potential ceiling effect for benefit from the intervention, because the prevalence of MRSA was already in two-thirds of S. aureus cases prior to the start of the intervention. This intervention may demonstrate greater benefit in clinics or systems where MRSA is less prevalent.
The proportion of pediatric patients with SSTIs was somewhat lower in the intervention period. This could be due to a lower proportion of pediatric providers in one health system. It could also be that seasonality played a role as the intervention period did not include the summer months.
Finally, the intervention consisted of provider education, a ready-made I&D kit, and point-of-care informational materials for providers and patients. The intervention resulted in an increase in antibiotic use and the use of MRSA antibiotics specifically. Yet because of the multiple components to the intervention, we cannot state with certainty which component(s) contributed to these findings.
31

Lessons Learned Management of Skin and Soft Tissue Infections
Initial management of SSTIs in these primary care practices is mostly concordant with CDC recommendations; however, management of specific cases can vary significantly based on the provider’s assessment of the initial presentation of the skin infection.
While earlier focus group results with clinicians suggested that providers would like I&D kits readily available, in practice, it appears that some providers prefer to use their own routine to gather supplies. Patient handouts were valuable, regardless of the utility of I&D kits.
Electronic Data Extraction 1. Lessons learned from Distributed Ambulatory Research in Therapeutics Network
(DARTNet) a. The use of DARTNet ultimately provided the QI effort and the project team with
the use of high-quality data across two very large clinical enterprises. It is difficult to access the practicality of this effort without such an automated system.
b. The “certification” of data extracted from EHRs by DARTNet is an important, yet demanding endeavor. Because data entry into EHRs and billing systems is still a human process, mapping the process for study-specific codes and criteria in each clinic system would help understand early data extraction problems and plan for improving programming to find and extract the correct data. Multiple data extractions and analyses were required to assure the fidelity of data capture and the development of a continuity of care record that met the analytic needs of the QI effort as well as the project team.
c. Reliance on a single programmer as the dependent person to extract and organize the required data can be problematic.
2. Frequent surveillance of multiple data systems is needed for early detection of any problems. Weekly or monthly audits of all data sources by at least two separate entities may help detect data problems earlier. Such an effort would have provided an early warning to the project team concerning missing patient information.
3. Study teams should cover a portion of person’s time in each health system to have “on-the-ground” help for planning, troubleshooting, and monitoring the project.
Conclusions In this project, the intervention resulted in an increase in antibiotics use and an increase in
the proportion of prescribed antibiotics that covered MRSA. It did not change the rate of obtaining a culture, and there was a trend toward a decrease in the procedure rate. Although the specific drainage kit may not be generalizable, the overall intervention is, including having a ready-to-go drainage kit at the point of care, as well as the educational materials for providers and patients. Having an educational session for providers on SSTIs and MRSA is also a generalizable intervention, and may have contributed to the outcomes.
Based upon our experiences and learning from this project, consideration should be given to replicating this intervention in a health system where the prevalence of CA-MRSA is lower, such as <20 percent of S. aureus positive cultures. Also, it may be more generalizable to not use the pre-packaged procedure kits due to the wide variance in how procedures are done throughout
32
33
the country and to only use the printed point-of-care patient and provider materials, as well as clinician education.
Finally, the efforts of the project team using Government funds have resulted in the ability to certify DARTNet for large-scale data extractions and aggregations related to CA-MRSA care in primary care practices. The Government may have an interest in conducting larger scale comparative effectiveness studies (comparing multiple intervention or practice redesign strategies) using these newly developed capabilities of DARTNet to build upon what was learned in the project funded by this task order and to provide actionable evidence to guide the provision of care for CA-MRSA.
References 1. Agency for Healthcare Research and
Quality. Medical Expenditure Panel Survey. Available at: http://www.meps.ahrq.gov/mepsweb/. Accessed May 28 2008.
2. Fridkin SK, Hageman JC, Morrison M, et al. Methicillin-resistant Staphylococcus aureus disease in three communities. N Engl J Med 2005 Apr;352(14):1436-44. Erratum in N Engl J Med 2005 Jun 2;352(22):2362.
3. Miller LG, Perdreau-Remington F, Rieg G, et al. Necrotizing fasciitis caused by community-associated methicillin-resistant Staphylococcus aureus in Los Angeles. N Engl J Med 2005 Apr 7;352(14):1445-53.
4. Martinez-Aguilar G, Avalos-Mishaan A, Hulten K, et al. Community-acquired, methicillin-resistant and methicillin-susceptible Staphylococcus aureus musculoskeletal infections in children. Pediatr Infect Dis J 2004 Aug;23(8):701-6.
5. Gonzalez BE, Hulten KG, Dishop MK, et al. Pulmonary manifestations in children with invasive community-acquired Staphylococcus aureus infection. Clin Infect Dis 2005 Sep;41(5):583-90.