Embed Size (px)
Citation preview
MANAGEMENT DISCUSSION AND ANALSYIS
(all tabular amounts are expressed in thousands of CDN dollars, except per share amounts)
Three and Six Months ended June 30, 2012 and 2011
The following management discussion and analysis (“MD&A”) of the financial position and results of operations of Secure Energy
Services Inc. (“Secure” or the “Corporation”) has been prepared by management and reviewed and approved by the Board of
Directors of Secure on August 13, 2012. The discussion and analysis is a review of the financial results of the Corporation based upon
accounting principles that are generally accepted in Canada (the issuer‟s “GAAP”), which includes International Financial Reporting
Standards (“IFRS”).
The MD&A‟s focus is primarily a comparison of the financial performance for the three and six months ended June 30, 2012 and
2011 and should be read in conjunction with the Corporation‟s audited consolidated financial statements and accompanying notes
prepared under IFRS for the year ended December 31, 2011. The Corporation‟s management is responsible for the information
disclosed in this MD&A and the accompanying unaudited condensed consolidated interim financial statements, and has in place
appropriate information systems, procedures and controls to ensure that information used internally by management and disclosed
externally is materially complete and reliable. In addition, the Corporation‟s Audit Committee, on behalf of the Board of Directors,
provides an oversight role with respect to all public financial disclosures made by the Corporation. The MD&A has been prepared as
of August 13, 2012. Additional information regarding the Corporation is available on the System for Electronic Document Analysis
and Retrieval (“SEDAR”) at www.sedar.com.
FORWARD-LOOKING STATEMENTS
Certain statements contained in this MD&A constitute “forward-looking statements” and/or “forward-looking information” within the
meaning of applicable securities laws (collectively referred to as forward-looking statements). When used in this document, the words
“may”, “would”, “could”, “will”, “intend”, “plan”, “anticipate”, “believe”, “estimate”, “expect”, and similar expressions, as they relate
to Secure, or its management, are intended to identify forward-looking statements. Such statements reflect the current views of Secure
with respect to future events and operating performance and speak only as of the date of this MD&A. In particular, this MD&A
contains forward-looking statements pertaining to: general market conditions; the oil and natural gas industry; activity levels in the oil
and gas sector, including drilling levels; demand for the Corporation‟s services and the factors contributing thereto; expansion
strategy; the expanded 2012 capital budget, the allocation between the PRD and DS divisions and the intended use thereof; debt
service; capital expenditures; completion of facilities; future capital needs; access to capital; acquisition strategy; the Corporation's
capital spending on the new Rocky Mountain House and Judy Creek, Alberta full service terminals and the timing of completion
thereof; oil purchase and resale revenue; the construction of landfills at Saddle Hills and Fox Creek, Alberta and the timing for
completion thereof; the timing for completion of expansion at the Obed and Dawson FSTs; the timing for completion of the Drayton
Valley blending plant; the timing of closing of the $75 million bought deal offering and the use of proceeds therefrom; the amount of
the Corporation's asset retirement obligations and the timing thereof; and the closing of the acquisition of Imperial Drilling Fluids
Engineering Inc.
Forward-looking statements concerning expected operating and economic conditions are based upon prior year results as well as the
assumption that increases in market activity and growth will be consistent with industry activity in Canada, United States, and
internationally and growth levels in similar phases of previous economic cycles. Forward-looking statements concerning the
availability of funding for future operations are based upon the assumption that the sources of funding which the Corporation has
relied upon in the past will continue to be available to the Corporation on terms favorable to the Corporation and that future economic
and operating conditions will not limit the Corporation‟s access to debt and equity markets. Forward-looking statements concerning
the relative future competitive position of the Corporation are based upon the assumption that economic and operating conditions,
including commodity prices, crude oil and natural gas storage levels, interest rates, the regulatory framework regarding oil and natural
gas royalties, environmental regulatory matters, the ability of the Corporation and its subsidiary to successfully market their services
and drilling and production activity in North America will lead to sufficient demand for the Corporation‟s services and its subsidiary‟s
services including demand for oilfield services for drilling and completion of oil and natural gas wells, that the current business
environment will remain substantially unchanged, and that present and anticipated programs and expansion plans of other
organizations operating in the energy service industry will result in increased demand for the Corporation‟s services and its
subsidiary‟s services. Forward-looking statements concerning the nature and timing of growth are based on past factors affecting the
growth of the Corporation, past sources of growth and expectations relating to future economic and operating conditions. Forward-
looking statements in respect of the costs anticipated to be associated with the acquisition and maintenance of equipment and property
are based upon assumptions that future acquisition and maintenance costs will not significantly increase from past acquisition and
maintenance costs.
2012 Second Quarter Interim Report page 2
Forward-looking statements involve significant risks and uncertainties, should not be read as guarantees of future performance or
results, and will not necessarily be accurate indications of whether such results will be achieved. Readers are cautioned not to place
undue reliance on these statements as a number of factors could cause actual results to differ materially from the results discussed in
these forward-looking statements, including but not limited to those factors referred to and under the heading “Business Risks” and
under the heading “Risk Factors” in the Corporation‟s annual information form (“AIF”) for the year ended December 31, 2011.
Although forward-looking statements contained in this MD&A are based upon what the Corporation believes are reasonable
assumptions, the Corporation cannot assure investors that actual results will be consistent with these forward-looking statements. The
forward-looking statements in this MD&A are expressly qualified by this cautionary statement. Unless otherwise required by law,
Secure does not intend, or assume any obligation, to update these forward-looking statements.
CORPORATE OVERVIEW
Secure is a TSX publicly traded energy services company that focuses on providing specialized services to upstream oil and natural
gas companies operating in the Western Canadian Sedimentary Basin ("WCSB") and in the United States. The services provided by
the Corporation assist these companies with the handling, processing and sale of crude oil, drilling fluids, recycling services and
various complementary services associated with oil and natural gas development and production.
The Corporation operates two divisions:
PROCESSING, RECOVERY AND DISPOSAL DIVISION (“PRD”)
Operating under the trade name Secure Energy Services Inc, the PRD division provides clean oil terminalling, custom treating of
crude oil, crude oil marketing, produced and waste water disposal, oilfield waste processing, landfill disposal, and oil purchase/resale
service. Secure currently operates fifteen facilities throughout western Canada, providing these services at its full service terminals
(“FST”), landfills or stand alone water disposal facilities (“SWD”).
DRILLING SERVICES DIVISION (“DS”)
Operating under the trade name Marquis Alliance Energy Group Inc. and its wholly owned subsidiaries (“Marquis Alliance”) and
operating under the trade name XL Fluids Systems Inc. (“XL Fluids”), the DS division provides drilling fluid systems, solids control,
and environmental services. The drilling fluids service line comprises the majority of the revenue for the division, which includes the
design and implementation of drilling fluid systems for producers drilling for oil, bitumen and natural gas. The DS division focuses
on providing products and systems that are designed for more complex wells, such as medium to deep wells, horizontal wells and
horizontal wells drilled into the oil sands.
For a complete description of services provided in both of the above divisions, please refer to the headings “Secure Energy Services
Inc.”, “Description of Business” and “Industry Overview” in the Corporation‟s annual information form (“AIF”) for the year ended
December 31, 2011.
CORPORATE STRATEGY
Secure‟s goal is to achieve profitable growth while providing cost effective solutions and delivering exceptional customer service. To
achieve this goal, Secure‟s strategy is to:
Design, construct and expand facilities in key under-serviced and capacity constrained markets;
Complete strategic acquisitions that exploit the full value chain in the energy services market, providing full cycle „cradle to
grave‟ solutions;
Reduce waste, recycle and reuse fluids at Secure facilities;
Conduct operations in a safe and environmentally responsible manner; and
Enhance environmental stewardship for the Corporation‟s customers.
2012 Second Quarter Interim Report page 3
SELECTED FINANCIAL HIGHLIGHTS
In the second quarter of 2012, Secure experienced strong demand for its services as both of the Corporation‟s divisions performed
extremely well despite lower activity levels associated with spring breakup and wet weather in both May and June. During the second
quarter of 2012, revenue (excluding oil purchase/resale) increased by 181% and earnings before interest, taxes, depreciation and
amortization (“EBITDA”) increased by 137% over the second quarter of 2011. The Corporation‟s solid results relate to increased
processing and disposal volumes, improvement in operating margin, and expansion of the Corporation‟s service offerings. The
expansion of service offerings includes the establishment of the DS division in June 2011, new facilities and completed acquisitions,
the opening of the permanent Wild River SWD in May of 2012, and the Dawson FST crude oil pipeline connection to the Pembina
Pipeline system in June of 2012. Overall, the operating and financial highlights for the three and six months ended June 30, 2012 can
be summarized as follows:
($000's except share and per share data) (unaudited) (1)
2012 2011 % Change 2012 2011 % Change
Revenue (excludes oil purchase and resale) 68,906 24,541 181 184,333 44,964 310
Oil purchase and resale 154,756 69,203 124 317,042 116,778 171
Total revenue 223,662 93,744 139 501,375 161,742 210
EBITDA (2)
13,789 5,824 137 46,348 16,560 180
Per share ($), basic 0.15 0.08 88 0.51 0.25 104
Per share ($), diluted 0.15 0.08 88 0.49 0.23 113
Profit for the period 1,087 10 - 16,064 4,240 279
Per share ($), basic 0.01 0.00 100 0.18 0.07 157
Per share ($), diluted 0.01 0.00 100 0.17 0.06 183
Funds from operations (2)
12,584 5,403 133 41,131 16,060 156
Per share ($), basic 0.14 0.08 75 0.45 0.24 88
Per share ($), diluted 0.13 0.07 86 0.44 0.22 100
Cash dividends per common share nil nil - nil nil -
Capital expenditures (2)
48,631 84,823 (43) 84,464 101,458 (17)
Total assets 618,736 399,772 55 618,736 399,772 55
Long term borrowings 135,109 16,539 717 135,109 16,539 717
Common shares - end of period 91,805,351 86,942,806 6 91,805,351 86,942,806 6
Weighted average common shares
basic 91,527,556 71,207,964 29 91,092,801 67,539,221 35
diluted 94,210,135 75,851,337 24 94,194,889 71,875,475 31
(1) Certain amounts were reclassified to conform with current period presentation
(2) Refer to "Non GAAP measures and operational definitions" on page 5 for further information
Six Months Ended June 30,Three Months Ended June 30,
SECOND QUARTER AND YEAR-TO-DATE 2012 HIGHLIGHTS
During the three and six months ended June 30, 2012 the Corporation:
Increased EBITDA per share (diluted) significantly by 88% and 113% for the three and six months ended June 30, 2012
compared to the same periods of 2011. The Corporation achieved record EBITDA of $13.8 million and $46.3 million for the
three and six months ended June 30, 2012 compared to $5.8 million and $16.6 million for the three and six months ended
June 30, 2011. EBITDA increased significantly by 137% and 180% for the three and six months ended June 30 as a result of
the establishment of the DS division, increased demand, improved operating margins, the new facilities, acquisitions and the
added expansion services in the PRD division added during the last half of 2011;
Increased total profit for the six months ended June 30, 2012 substantially by 279% to $16.1 million compared to the six
months ended June 30, 2011;
Reported solid revenue (excluding oil purchase and resale) of $68.9 million and $184.3 million for the three and six months
ended June 30, 2012 compared to $24.5 million and $45.0 million in the comparable periods of 2011. Revenue has increased
significantly over the prior period as a result of increased demand and expansion of the Corporations offerings. The PRD
division second quarter disposal volumes increased by 52% and processing and terminalling volumes increased by 157%,
respectively, as compared to the second quarter of 2011. The PRD division also continued to benefit from higher throughput
2012 Second Quarter Interim Report page 4
and increased demand from Drayton Valley FST, Silverdale FST and Dawson FST. The Wild River SWD also commenced
operations in May adding to the division‟s processing and disposal volumes. The DS division (acquired June 1, 2011) had a
strong second quarter performance, with revenue per operating day of $7,073 compared to $4,919 in the first quarter of 2012.
The DS division also realized a 27% market share in western Canada compared to 28% in the first quarter of 2012;
Recorded oil purchase and resale revenue of $154.8 million and $317.0 million for the three and six months ended June 30,
2012 versus $69.2 million and $116.8 million in the comparable periods of 2011. The substantial increase is a result of
Secure becoming a single shipper at the Drayton Valley FST in January 2012, single shipper at the La Glace FST in the
fourth quarter of 2011, single shipper at the Dawson FST in June 2012, and due to increased throughput at all pipeline
connected facilities;
Invested capital for the three and six months ended June 30, 2012 of $48.6 million and $84.5 million, respectively. Capital
expenditures for the first six months of 2012 are summarized as follows:
o Wild River SWD (permanent facility);
o Phase III (oil treating and terminalling) at Dawson FST;
o Oil based mud (“OBM”) blending plant at the Drayton Valley FST;
o Judy Creek FST and Rocky Mountain House (“Rocky”) FST;
o Obed and Dawson FST expansions;
o Saddle Hills and Fox Creek landfills;
o Rental equipment & long lead equipment (centrifuges, tanks, treaters);
o New West Drilling Fluids Inc. (“New West”) acquisition;
Subsequent to the second quarter:
o The Corporation entered into a joint venture agreement (the “JV agreement”) with Pembina Midstream Limited
Partnership (“Pembina”) for 50% of the treating, terminalling and crude oil marketing operations of the Judy Creek
FST. The Corporation will be the operator of the facility. In addition, the assets associated with waste processing at
the Judy Creek FST are excluded from the JV agreement;
o On July 2, 2012, the Corporation closed an asset purchase agreement (the “acquisition”) with DRD Saltwater
Disposal LLC (“DRD”) to acquire the operating assets of DRD for total cash and share consideration of US$29.9
million. The operating assets acquired include two recently constructed fully operational SWD facilities serving the
Bakken oil play. The acquisition of DRD allows the Corporation to expand its geographical presence of its PRD
division into North Dakota, and to continue to expand on the Corporation‟s growth strategy in underserviced
markets. The Corporation paid US$20.9 million in cash and issued 1,168,519 common shares of the Corporation at
a closing price per share of $7.90 for consideration of US$9.0 million. Prior to June 30, 2012, the Corporation made
a deposit of $21.2 million for the acquisition. The deposit was drawn from the Corporation‟s revolving credit
facility;
o The Corporation increased the 2012 capital budget by $50.0 million expanding it from approximately $116.0 million
to approximately $166.0 million. The $50.0 million addition to the 2012 capital budget will be allocated to the PRD
Division; $30.0 million will be used for additional growth capital and $20.0 million for expansion capital. The
growth capital will be used to purchase existing facilities, long lead items required for facilities to be constructed in
2013 and the construction of additional SWD facilities in 2012. The expansion capital relates to Obed and Dawson
FST expansions and for the construction of an additional cell at the Pembina Area Landfill. The expansion projects
at Obed and Dawson FST commenced prior to June 30, 2012 and are anticipated to be completed in the third
quarter. The expanded capital budget excludes the DRD acquisition.
o On July 24, 2012, the Corporation announced a bought deal financing (the “Offering”) issuing 9,554,141 shares at
$7.85 for total proceeds of $75.0 million. In addition, the Corporation will grant the underwriters an over-allotment
option, exercisable for a period of 30 days following closing of the Offering, to purchase up to 1,433,121 additional
common shares at the offering price which, if exercised in full, would result in additional gross proceeds of
approximately $11.2 million. The underwriters have given notice that the over-allotment will be exercised in full
after the closing of the Offering. The proceeds of the Offering will initially be used to repay the Corporation‟s
revolving credit facility, however it is management‟s intention to redraw on the revolving credit facility to fund a
portion of the increased 2012 capital expenditure program, and for working capital and general corporate purposes;
o On August 13, 2012, the board of directors approved an asset purchase agreement to acquire the operating assets of
Imperial Drilling Fluids Engineering Inc. (“IDF”) for US$7.0 million and a series of earn out payments that, in
2012 Second Quarter Interim Report page 5
aggregate, range from US$2.7 million to US$8.0 million for total maximum consideration of US$15.0 million. IDF
is a private drilling fluids company operating in Greeley, Colorado. IDF specializes in drilling fluids in Colorado,
predominately in the Niobrara and Cordell Shale plays.
OUTLOOK
The seasonality created by spring break up, combined with wet weather in May and June, resulted in lower industry activity levels
throughout western Canada. Secure is not immune to the impact of these conditions but due to the base of production related revenue,
the Corporation performed well during the second quarter. Continuous rain and cool temperatures combined to suppress the typical
rebound in activity levels after spring breakup causing a delay in some drilling programs which will likely be pushed into the third
quarter. The Corporation closely monitors changes to capital budgets and cash flows of customers and despite the announcement of
some reductions in capital budgets of the Corporation‟s customers, Secure expects demand to remain relatively strong during the
second half of 2012. Driving this demand is an increase in meters drilled as a result of more complex drilling, a move to horizontal
wells and greater lengths/depths being pursued by operators. This move to horizontal wells positively impacts drilling and drilling
related activities for both of the Corporation‟s divisions. The level of drilling activity has a greater impact on the DS division than the
PRD division, as the operating activities of the PRD division are more heavily weighted to the production cycle, specifically
processing, treating, terminalling and marketing of crude oil.
The Corporation is exploring a number of opportunities to expand Secure through additional service lines, organic growth, and/or
through strategic acquisitions in key market areas in both Canada and the United States. On July 2, 2012 Secure expanded its PRD
business into North Dakota through the acquisition from DRD Saltwater Disposal, LLC of two recently constructed operating SWD
facilities serving the Bakken oil play. The acquisition provides the foundation upon which Secure will look to expand its PRD services
at the existing locations and potential future locations. Following this acquisition, Secure announced on July 24, 2012 it was
expanding its 2012 organic capital expenditures by $50.0 million to approximately $166.0 million. The expanded capital budget
allows Secure to take advantage of additional growth opportunities, including opportunities in North Dakota, some of which are
already underway.
In the PRD division, construction continued on the new Rocky FST and the Judy Creek FST. Secure expects these new FSTs to
commence operations in early 2013. Secure has commenced construction of a landfill in Fox Creek and is expecting construction to
start in late third quarter on a landfill in Saddle Hills, AB to service the Montney production area. During the third quarter, the PRD
division will commission an OBM blending facility at its existing Drayton Valley FST to reduce costs associated with logistics, to
develop recycling opportunities and to support the ongoing activities in the DS division.
The DS division continues to perform well in Western Canada and is now beginning to gain momentum in the U.S., primarily through
its field operations in Williston, North Dakota and marketing office in Denver, Colorado. Complementing this organic growth is the
proposed asset acquisition of Imperial Drilling Fluids Engineering Inc. (“Imperial”). The acquisition of Imperial, located in Greeley,
Colorado, represents Marquis Alliance‟s first exposure to the developing Niobrara oil shale market of Northern Colorado.
The accomplishments in the first six months are a direct result of the hard work and dedication of the Secure‟s employees, consultants
and industry partners. The Corporation continues to add employees that have a strong entrepreneurial attitude and the desire to work
as a team in assisting the Corporation‟s customers.
Based on Secure‟s available debt capacity, the announced equity financing and cash flow from operations, the Corporation is well
positioned to execute on its newly expanded 2012 capital program and take advantage of additional future growth opportunities.
NON-GAAP MEASURES AND OPERATIONAL DEFINITIONS
Certain supplementary measures in this MD&A do not have any standardized meaning as prescribed under IFRS and, therefore, are
considered non-GAAP measures. These measures are described and presented in order to provide information regarding the
Corporation‟s financial results, liquidity and its ability to generate funds to finance its operations. These measures are identified and
presented, where appropriate, together with reconciliations to the equivalent IFRS measure. However, they should not be used as an
alternative to IFRS measures because they may not be consistent with calculations of other companies. These non-GAAP measures,
and certain operational definitions used by the Corporation, are further explained below.
2012 Second Quarter Interim Report page 6
Operating margin
Operating margin is calculated as revenue less operating expenses which includes direct product costs for drilling services but
excludes depreciation, depletion and amortization, general and administrative expenses, and oil purchase/resale services. Management
analyzes operating margin as a key indicator of cost control and operating efficiency.
Operating days
Operating days are calculated by multiplying the average number of active rigs where the DS division provides drilling fluids services
by the number of days in the period.
Canadian Market Share
Canadian market share is calculated by comparing active rigs where the DS division operates to total active rigs in Western Canada.
The CAODC publishes total active rigs in Western Canada on a semi-weekly basis.
Funds from operations
Funds from operations refers to cash flow from operations before changes in non-cash working capital. Secure‟s management views
cash flow from operating activities before changes in non-cash working capital balances as a measure of liquidity and believes that
funds from operations is a metric used by many investors to assess the financial performance of the Corporation. Any use of cash from
an increase in working capital in a particular period will be financed by existing cash or by the revolving credit facility.
($000's) (unaudited) 2012 2011 % Change 2012 2011 % Change
Cash from (used in) operating activities 26,447 22,621 17 50,363 28,143 79
Add (deduct):
Non-cash working capital changes (13,863) (17,218) (19) (9,232) (12,083) (24)
Funds from operations 12,584 5,403 133 41,131 16,060 156
Three Months Ended June 30, Six Months Ended June 30,
EBITDA
EBITDA is calculated as profit excluding depreciation, depletion, amortization and accretion, share-based payments expense, interest,
and taxes. EBITDA is not a recognized measure under IFRS. Management believes that in addition to profit, EBITDA is a useful
supplemental measure as it provides an indication of the results generated by the Corporation‟s principal business activities prior to
consideration of how those activities are financed or how the results are taxed.
($000's) (unaudited) 2012 2011 % Change 2012 2011 % Change
Profit 1,087 10 - 16,064 4,240 279
Add:
Depreciation, depletion and amortization 9,347 4,739 97 18,787 8,990 109
Share-based payments 1,661 485 242 2,688 988 172
Current tax expense 191 261 (27) 3,025 261 1,059
Deferred income tax expense 495 80 519 3,263 1,682 94
Interest, accretion and finance costs 1,008 249 305 2,521 399 532
EBITDA 13,789 5,824 137 46,348 16,560 180
Three Months Ended June 30, Six Months Ended June 30,
Capital Expenditures
Expansion, growth or acquisition capital are capital expenditures with the intent to expand or restructure operations, enter into new
locations or emerging markets, or complete a business acquisition. Sustaining capital refers to capital expenditures in respect of capital
asset additions, replacements or improvements required to maintain ongoing business operations. The determination of what
constitutes sustaining capital expenditures versus expansion capital involves judgment by management.
2012 Second Quarter Interim Report page 7
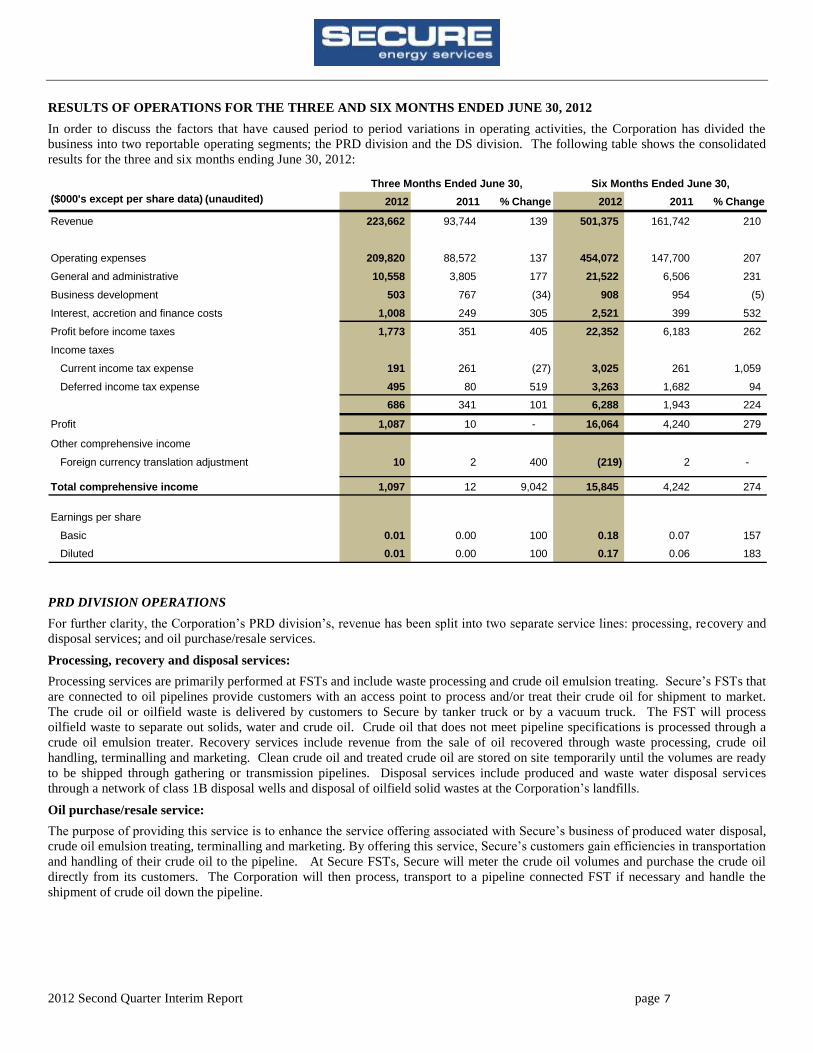
RESULTS OF OPERATIONS FOR THE THREE AND SIX MONTHS ENDED JUNE 30, 2012
In order to discuss the factors that have caused period to period variations in operating activities, the Corporation has divided the
business into two reportable operating segments; the PRD division and the DS division. The following table shows the consolidated
results for the three and six months ending June 30, 2012:
($000's except per share data) (unaudited) 2012 2011 % Change 2012 2011 % Change
Revenue 223,662 93,744 139 501,375 161,742 210
Operating expenses 209,820 88,572 137 454,072 147,700 207
General and administrative 10,558 3,805 177 21,522 6,506 231
Business development 503 767 (34) 908 954 (5)
Interest, accretion and finance costs 1,008 249 305 2,521 399 532
Profit before income taxes 1,773 351 405 22,352 6,183 262
Income taxes
Current income tax expense 191 261 (27) 3,025 261 1,059
Deferred income tax expense 495 80 519 3,263 1,682 94
686 341 101 6,288 1,943 224
Profit 1,087 10 - 16,064 4,240 279
Other comprehensive income
Foreign currency translation adjustment 10 2 400 (219) 2 -
Total comprehensive income 1,097 12 9,042 15,845 4,242 274
Earnings per share
Basic 0.01 0.00 100 0.18 0.07 157
Diluted 0.01 0.00 100 0.17 0.06 183
Three Months Ended June 30, Six Months Ended June 30,
PRD DIVISION OPERATIONS
For further clarity, the Corporation‟s PRD division‟s, revenue has been split into two separate service lines: processing, recovery and
disposal services; and oil purchase/resale services.
Processing, recovery and disposal services:
Processing services are primarily performed at FSTs and include waste processing and crude oil emulsion treating. Secure‟s FSTs that
are connected to oil pipelines provide customers with an access point to process and/or treat their crude oil for shipment to market.
The crude oil or oilfield waste is delivered by customers to Secure by tanker truck or by a vacuum truck. The FST will process
oilfield waste to separate out solids, water and crude oil. Crude oil that does not meet pipeline specifications is processed through a
crude oil emulsion treater. Recovery services include revenue from the sale of oil recovered through waste processing, crude oil
handling, terminalling and marketing. Clean crude oil and treated crude oil are stored on site temporarily until the volumes are ready
to be shipped through gathering or transmission pipelines. Disposal services include produced and waste water disposal services
through a network of class 1B disposal wells and disposal of oilfield solid wastes at the Corporation‟s landfills.
Oil purchase/resale service:
The purpose of providing this service is to enhance the service offering associated with Secure‟s business of produced water disposal,
crude oil emulsion treating, terminalling and marketing. By offering this service, Secure‟s customers gain efficiencies in transportation
and handling of their crude oil to the pipeline. At Secure FSTs, Secure will meter the crude oil volumes and purchase the crude oil
directly from its customers. The Corporation will then process, transport to a pipeline connected FST if necessary and handle the
shipment of crude oil down the pipeline.
2012 Second Quarter Interim Report page 8
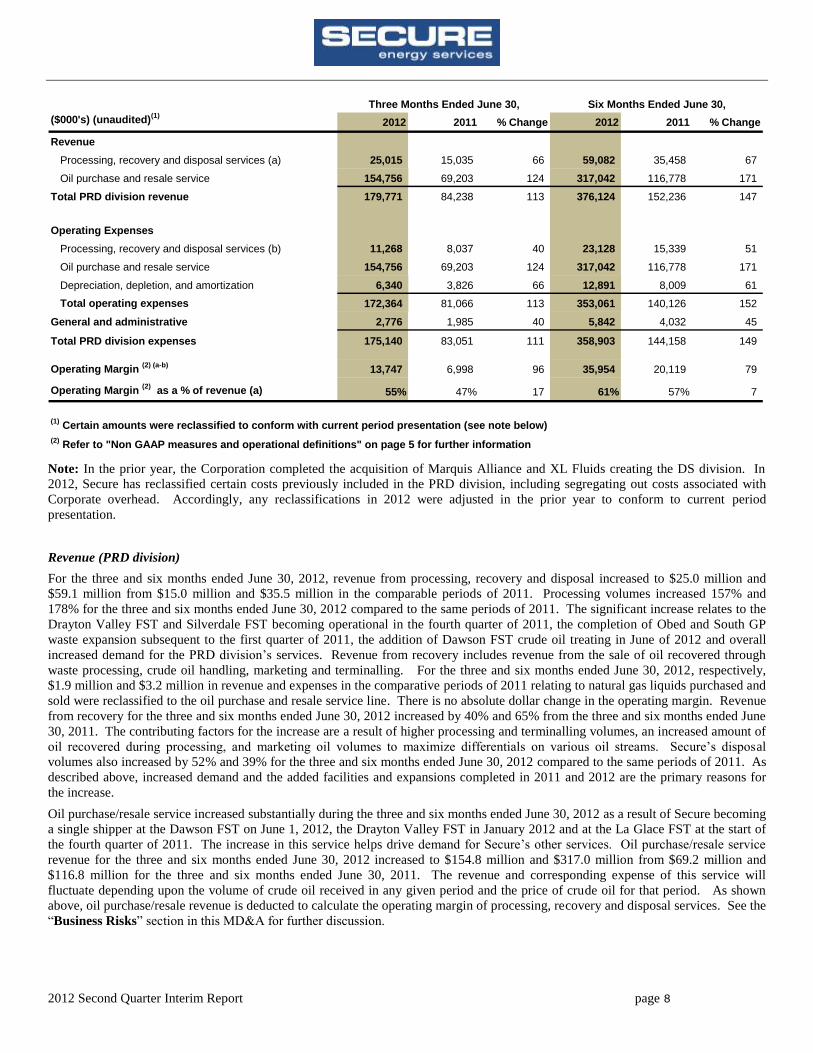
($000's) (unaudited)(1)
2012 2011 % Change 2012 2011 % Change
Revenue
Processing, recovery and disposal services (a) 25,015 15,035 66 59,082 35,458 67
Oil purchase and resale service 154,756 69,203 124 317,042 116,778 171
Total PRD division revenue 179,771 84,238 113 376,124 152,236 147
Operating Expenses
Processing, recovery and disposal services (b) 11,268 8,037 40 23,128 15,339 51
Oil purchase and resale service 154,756 69,203 124 317,042 116,778 171
Depreciation, depletion, and amortization 6,340 3,826 66 12,891 8,009 61
172,364 81,066 113 353,061 140,126 152
General and administrative 2,776 1,985 40 5,842 4,032 45
Total PRD division expenses 175,140 83,051 111 358,903 144,158 149
13,747 6,998 96 35,954 20,119 79
55% 47% 17 61% 57% 7
(1) Certain amounts were reclassified to conform with current period presentation (see note below)
(2) Refer to "Non GAAP measures and operational definitions" on page 5 for further information
Total operating expenses
Three Months Ended June 30,
Operating Margin (2)
as a % of revenue (a)
Operating Margin (2) (a-b)
Six Months Ended June 30,
Note: In the prior year, the Corporation completed the acquisition of Marquis Alliance and XL Fluids creating the DS division. In
2012, Secure has reclassified certain costs previously included in the PRD division, including segregating out costs associated with
Corporate overhead. Accordingly, any reclassifications in 2012 were adjusted in the prior year to conform to current period
presentation.
Revenue (PRD division)
For the three and six months ended June 30, 2012, revenue from processing, recovery and disposal increased to $25.0 million and
$59.1 million from $15.0 million and $35.5 million in the comparable periods of 2011. Processing volumes increased 157% and
178% for the three and six months ended June 30, 2012 compared to the same periods of 2011. The significant increase relates to the
Drayton Valley FST and Silverdale FST becoming operational in the fourth quarter of 2011, the completion of Obed and South GP
waste expansion subsequent to the first quarter of 2011, the addition of Dawson FST crude oil treating in June of 2012 and overall
increased demand for the PRD division‟s services. Revenue from recovery includes revenue from the sale of oil recovered through
waste processing, crude oil handling, marketing and terminalling. For the three and six months ended June 30, 2012, respectively,
$1.9 million and $3.2 million in revenue and expenses in the comparative periods of 2011 relating to natural gas liquids purchased and
sold were reclassified to the oil purchase and resale service line. There is no absolute dollar change in the operating margin. Revenue
from recovery for the three and six months ended June 30, 2012 increased by 40% and 65% from the three and six months ended June
30, 2011. The contributing factors for the increase are a result of higher processing and terminalling volumes, an increased amount of
oil recovered during processing, and marketing oil volumes to maximize differentials on various oil streams. Secure‟s disposal
volumes also increased by 52% and 39% for the three and six months ended June 30, 2012 compared to the same periods of 2011. As
described above, increased demand and the added facilities and expansions completed in 2011 and 2012 are the primary reasons for
the increase.
Oil purchase/resale service increased substantially during the three and six months ended June 30, 2012 as a result of Secure becoming
a single shipper at the Dawson FST on June 1, 2012, the Drayton Valley FST in January 2012 and at the La Glace FST at the start of
the fourth quarter of 2011. The increase in this service helps drive demand for Secure‟s other services. Oil purchase/resale service
revenue for the three and six months ended June 30, 2012 increased to $154.8 million and $317.0 million from $69.2 million and
$116.8 million for the three and six months ended June 30, 2011. The revenue and corresponding expense of this service will
fluctuate depending upon the volume of crude oil received in any given period and the price of crude oil for that period. As shown
above, oil purchase/resale revenue is deducted to calculate the operating margin of processing, recovery and disposal services. See the
“Business Risks” section in this MD&A for further discussion.
2012 Second Quarter Interim Report page 9
Operating Expenses (PRD division)
Operating expenses from processing, recovery and disposal services for the three and six months ended June 30, 2012 increased to
$11.3 million and $23.1 million from $8.0 million and $15.3 million in the comparative periods of 2011. Operating expenses have
increased as a result of higher variable costs (trucking, utilities, etc.) associated with higher demand and the 66% and 67% increase in
revenue (excluding oil purchase/resale) for both three and six months ended June 30, 2012, respectively, compared to the three and six
months ended June 30, 2011. Operating expenses are also higher with the addition of the Drayton Valley FST and Silverdale FST
becoming operational in the fourth quarter of 2011, the completion of Obed and South GP waste expansion subsequent to the first
quarter of 2011, the addition of Dawson FST crude oil treating and terminaling and Wild River SWD in the second quarter of 2012.
Operating margin as a percentage of revenue from processing, recovery and disposal services for the three and six months ended June
30, 2012 was 55% and 61%, up from 47% and 57% in the same periods of 2011. Overall, operating margins increased by 8% for the
second quarter of 2012 and also positively impacted the operating margin year to date. As discussed in the PRD revenue analysis,
revenue and expenses in the comparative quarter of 2011 were reclassified to the oil purchase and resale service line. There is no
absolute dollar change on the operating margin. The operating margin is typically lower in the second quarter as a result of spring
break up. In the second quarter of 2011, operating costs and margins were impacted as expenses were higher due to heavy rains that
caused an increase in road maintenance costs, site costs, and leachate disposal costs. In the second quarter of 2012, wet weather was a
factor; however it was significantly less than in the same period in the prior year. Road maintenance costs, site costs, and leachate
disposal costs were down $0.6 million and repairs and maintenance costs were down $0.2 million. In addition, in the prior year the
Corporation had start up costs associated with South GP FST and the temporary Wild River SWD. The change in operating margin
may fluctuate period over period as a result of changes in volumes affected by seasonality, as new facilities come online and activity
levels change, as the Corporation‟s sales mix or type of services received varies, and as commodity prices rise and fall.
Depreciation, Depletion and Amortization (PRD division)
Depreciation, depletion and amortization expense for the three and six months ended June 30, 2012 increased to $6.3 million and
$12.9 million from $3.8 million and $8.0 million for the three and six months ended June 30, 2011. Depreciation, depletion and
amortization expense has increased significantly with the additions of the Drayton Valley FST, Silverdale FST, Obed FST waste
expansion and the South Grande Prairie FST waste expansion, the Wild River SWD, the Dawson crude oil treating and terminalling
and the increase in disposal volumes at the PRD division landfills. Landfill cell costs are depleted on a unit basis, therefore as
disposal volumes increase there is a corresponding increase to the amount of depletion expensed.
General and Administrative (PRD division)
General and administrative expenses (“G&A”) increased for the three and six months ended June 30, 2012 to $2.8 million and $5.8
million from $2.0 million and $4.0 million in the comparative period of 2011. The increase is in line with management expectations.
In 2012, the Corporation has reclassified G&A in the PRD division to exclude all public company costs, salaries, share based
payments and office costs relating to corporate employees. G&A is currently 11.1% of revenue (excluding oil purchase/resale) in the
division. For the three and six months ended June 30, 2012, the most significant impact to G&A continues to relate to the hiring of
employees and increased office space to support the growth in operations. G&A also includes office lease, insurance, utilities and
communications. Included in benefits are non-cash share-based payments for the three and six months ended June 30, 2012 of $0.8
million and $1.4 million compared to $0.3 million and $0.8 million in the same period of 2011. The increase in stock-based
compensation relates mainly to stock options granted to new employees hired and options granted annually to employees.
DS DIVISION OPERATIONS
On June 1, 2011, the acquisition of Marquis Alliance created the DS division, which was expanded on July 1, 2011 with the
acquisition of XL Fluids and on January 25, 2012 with the acquisition of New West. Accordingly, the results of the DS division only
includes activity from June 1, 2011, the period in which Marquis Alliance became a wholly owned subsidiary of the Corporation.
Geographically, the primary focus of the DS division has been the WCSB. In addition, there are two wholly owned subsidiaries that
also provide services to various basins in the United States as well as internationally in India. The DS division‟s WCSB operations
are coordinated from the Calgary, Alberta office and the U.S. operations are conducted from the Denver, Colorado office.
Drilling services:
The DS division has three service lines: drilling fluids, environmental services, and solids control. The drilling fluids service line is
the core service of the DS division. Drilling fluid products are designed to optimize the efficiency of customer drilling operations.
These efficiencies are achieved by engineering solutions that improve drilling performance and penetration, while reducing fluid
2012 Second Quarter Interim Report page 10
related non-productive time. Experienced technical personnel design adaptable drilling programs to meet the needs of increasingly
complex horizontal and directional drilling. These programs can save customers significant amounts of money by proactively
anticipating the drilling challenges they may encounter. The environmental service line provides remediation, reclamation, special
project management, professional services, and drilling waste management to customers in the WCSB. Services include pre-drilling
assessments, remediation of former wellsites, facilities, commercial and industrial properties – from initial assessment through to
reclamation certification. The solids control service line provides equipment that ensures the quality of drilling fluids through the
drilling cycle by continually processing and recycling the drilling fluids as they return to surface. This equipment ensures the
continual removal of the cuttings and solids from the drilling fluid. In turn, higher penetration rates are maintained, and less fluid is
wasted; therefore overall drilling costs are reduced. The current fleet of high speed centrifuges, drying shakers, bead recovery units,
tanks, and ancillary equipment is offered as a standalone package or part of an integrated drilling fluids and environmental package.
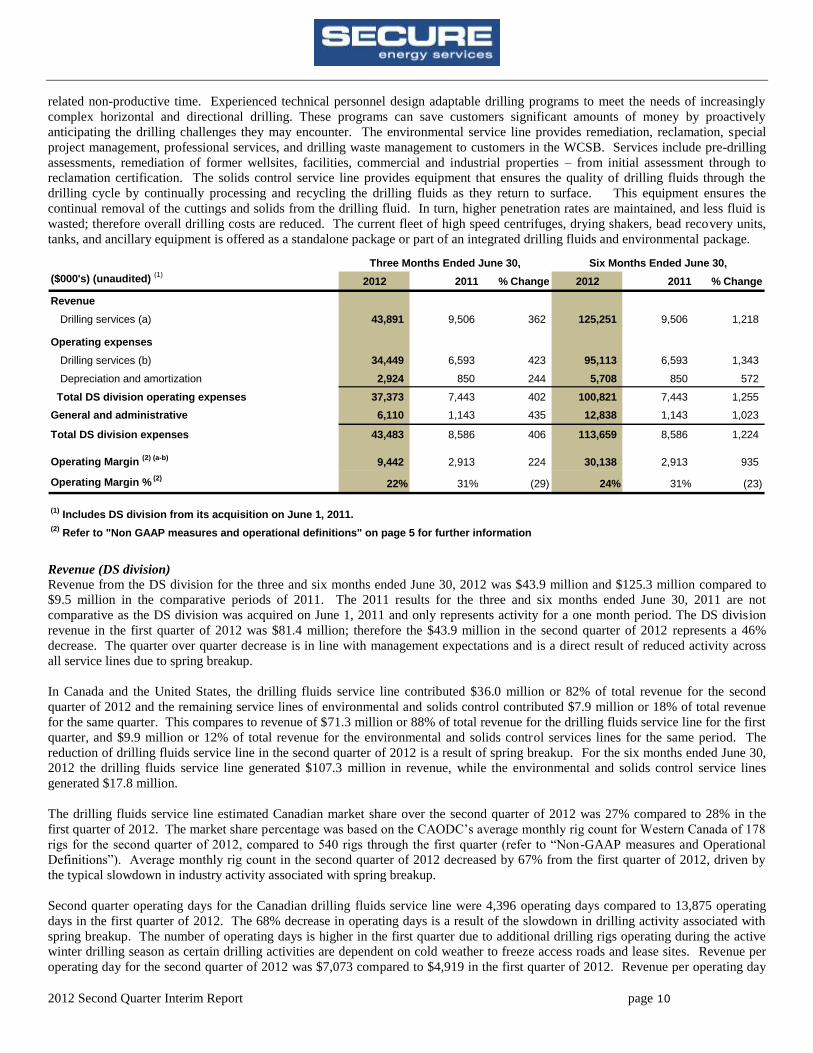
($000's) (unaudited) (1)
2012 2011 % Change 2012 2011 % Change
Revenue
Drilling services (a) 43,891 9,506 362 125,251 9,506 1,218
Operating expenses
Drilling services (b) 34,449 6,593 423 95,113 6,593 1,343
Depreciation and amortization 2,924 850 244 5,708 850 572
Total DS division operating expenses 37,373 7,443 402 100,821 7,443 1,255
General and administrative 6,110 1,143 435 12,838 1,143 1,023
Total DS division expenses 43,483 8,586 406 113,659 8,586 1,224
9,442 2,913 224 30,138 2,913 935 #DIV/0! #DIV/0!
22% 31% (29) 24% 31% (23)
(1) Includes DS division from its acquisition on June 1, 2011.
(2) Refer to "Non GAAP measures and operational definitions" on page 5 for further information
Operating Margin % (2)
Operating Margin (2) (a-b)
Three Months Ended June 30, Six Months Ended June 30,
Revenue (DS division)
Revenue from the DS division for the three and six months ended June 30, 2012 was $43.9 million and $125.3 million compared to
$9.5 million in the comparative periods of 2011. The 2011 results for the three and six months ended June 30, 2011 are not
comparative as the DS division was acquired on June 1, 2011 and only represents activity for a one month period. The DS division
revenue in the first quarter of 2012 was $81.4 million; therefore the $43.9 million in the second quarter of 2012 represents a 46%
decrease. The quarter over quarter decrease is in line with management expectations and is a direct result of reduced activity across
all service lines due to spring breakup.
In Canada and the United States, the drilling fluids service line contributed $36.0 million or 82% of total revenue for the second
quarter of 2012 and the remaining service lines of environmental and solids control contributed $7.9 million or 18% of total revenue
for the same quarter. This compares to revenue of $71.3 million or 88% of total revenue for the drilling fluids service line for the first
quarter, and $9.9 million or 12% of total revenue for the environmental and solids control services lines for the same period. The
reduction of drilling fluids service line in the second quarter of 2012 is a result of spring breakup. For the six months ended June 30,
2012 the drilling fluids service line generated $107.3 million in revenue, while the environmental and solids control service lines
generated $17.8 million.
The drilling fluids service line estimated Canadian market share over the second quarter of 2012 was 27% compared to 28% in the
first quarter of 2012. The market share percentage was based on the CAODC‟s average monthly rig count for Western Canada of 178
rigs for the second quarter of 2012, compared to 540 rigs through the first quarter (refer to “Non-GAAP measures and Operational
Definitions”). Average monthly rig count in the second quarter of 2012 decreased by 67% from the first quarter of 2012, driven by
the typical slowdown in industry activity associated with spring breakup.
Second quarter operating days for the Canadian drilling fluids service line were 4,396 operating days compared to 13,875 operating
days in the first quarter of 2012. The 68% decrease in operating days is a result of the slowdown in drilling activity associated with
spring breakup. The number of operating days is higher in the first quarter due to additional drilling rigs operating during the active
winter drilling season as certain drilling activities are dependent on cold weather to freeze access roads and lease sites. Revenue per
operating day for the second quarter of 2012 was $7,073 compared to $4,919 in the first quarter of 2012. Revenue per operating day
2012 Second Quarter Interim Report page 11
can fluctuate significantly due to changes in product mix, the type of well that is being drilled and when lost circulation events occur.
The amount of drilling fluid required can increase significantly when lost circulation occurs, as drilling fluid is lost in the formation.
The substantial increase in revenue per operating day to $7,073 was a result of a small number of wells drilled in the second quarter
where lost circulation occurred, requiring more drilling fluid. Accordingly, revenue per operating day was higher because of the
additional drilling fluid sold and due to the lower number of rigs operating in the second quarter. Demand and utilization for the
environmental and solids control service lines declined in the second quarter due to spring breakup, and is in line with management
expectations.
Operating Expenses (DS division)
Operating margin represents the profit earned on revenue after deducting operating expenses, which includes the direct cost of
products, logistics, personnel, and associated equipment in the DS division. Operating margins (excluding depreciation) in the DS
division can vary due to changes in product mix, well type, geographic area, and nature of activity (i.e. drilling fluids, environmental,
solids control, etc.). Operating expenses for the second quarter of 2012 were $34.4 million compared to $6.6 million in the second
quarter of 2011. Again, the 2011 results for the three and six months ended June 30, 2011 are not comparative as the DS division was
acquired on June 1, 2011 and only represents activity for a one month period. In the second quarter of 2012, operating expenses are
lower than the operating expenses in the first quarter of $60.7 million due to lower product costs associated with reduced volumes.
For the three months ended June 30, 2012 operating margins were $9.4 million or 22% of revenue compared to $20.7 million or 25%
of revenue for the first three months of 2012. The 31% operating margin from the second quarter of 2011 is not comparable as it only
represents one month of activity and does not include the impact on the operating margin during April and May of 2011. The decrease
in the operating margin percentage of 3% from the first quarter of 2012 to the second quarter of 2012 relates to a lower margin product
mix with proportionality higher sales volumes of low margin oil based stock. Oil based stock is an expensive, low margin and high
volume commodity. Therefore, in periods of rising oil based stock prices or increased activity in oil based drilling fluids, revenue and
product costs will increase accordingly, resulting in decreased margins on a percentage basis. Operating margins on an absolute basis
remains in line with management expectations.
Depreciation and Amortization (DS division)
Depreciation and amortization for the three months ended June 30, 2012 was $2.9 million compared to $2.8 million for the three
months ended March 31, 2012. Depreciation and amortization increased by 5% in the second quarter as a result of a larger fixed asset
base associated with the ongoing purchase of assets to support growth across the various business lines.
General and Administrative (DS division)
For the second quarter ending June 30, 2012 G&A was $6.1 million compared to $6.7 million for the first quarter of 2012. G&A as a
percentage of revenue was 13.9% for the three months ending June 30, 2012, versus 8.3% for the three months ending March 31,
2012. The increase in the percentage of revenue is due to a lower base of revenue during spring breakup. In 2012, the Corporation
has reclassified G&A in the DS division to exclude all salaries, share based payments and office costs relating to corporate employees.
The most significant accounts within G&A include: salaries and benefits for office staff, professional fees, office lease, insurance,
utilities, and communications. G&A decreased from the first quarter of 2012 to the second quarter of 2012 mainly due to a reduction
in legal fees incurred in the normal course of business. Overall, G&A is in line with management expectations for the second quarter
of 2012.
2012 Second Quarter Interim Report page 12
OTHER INCOME AND EXPENSES
CORPORATE EXPENSES
($000's) (unaudited)(1)
2012 2011 % Change 2012 2011 % Change
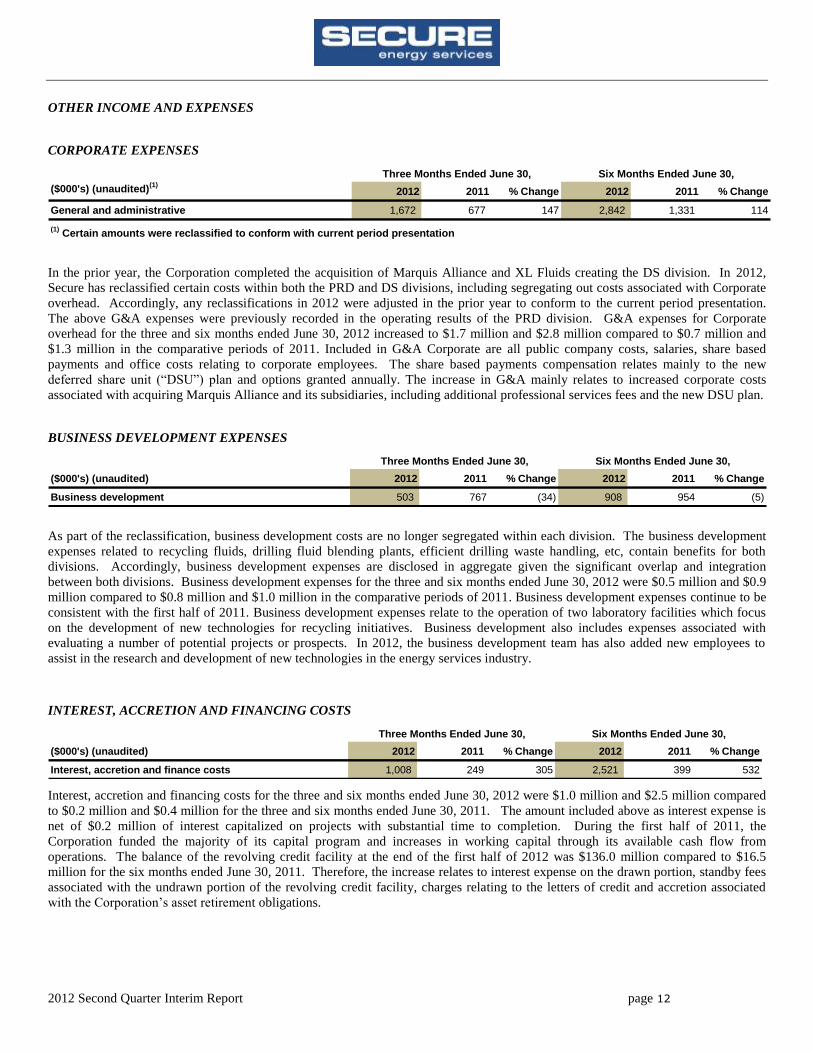
General and administrative 1,672 677 147 2,842 1,331 114
(1) Certain amounts were reclassified to conform with current period presentation
Three Months Ended June 30, Six Months Ended June 30,
In the prior year, the Corporation completed the acquisition of Marquis Alliance and XL Fluids creating the DS division. In 2012,
Secure has reclassified certain costs within both the PRD and DS divisions, including segregating out costs associated with Corporate
overhead. Accordingly, any reclassifications in 2012 were adjusted in the prior year to conform to the current period presentation.
The above G&A expenses were previously recorded in the operating results of the PRD division. G&A expenses for Corporate
overhead for the three and six months ended June 30, 2012 increased to $1.7 million and $2.8 million compared to $0.7 million and
$1.3 million in the comparative periods of 2011. Included in G&A Corporate are all public company costs, salaries, share based
payments and office costs relating to corporate employees. The share based payments compensation relates mainly to the new
deferred share unit (“DSU”) plan and options granted annually. The increase in G&A mainly relates to increased corporate costs
associated with acquiring Marquis Alliance and its subsidiaries, including additional professional services fees and the new DSU plan.
BUSINESS DEVELOPMENT EXPENSES
($000's) (unaudited) 2012 2011 % Change 2012 2011 % Change
Business development 503 767 (34) 908 954 (5)
Three Months Ended June 30, Six Months Ended June 30,
As part of the reclassification, business development costs are no longer segregated within each division. The business development
expenses related to recycling fluids, drilling fluid blending plants, efficient drilling waste handling, etc, contain benefits for both
divisions. Accordingly, business development expenses are disclosed in aggregate given the significant overlap and integration
between both divisions. Business development expenses for the three and six months ended June 30, 2012 were $0.5 million and $0.9
million compared to $0.8 million and $1.0 million in the comparative periods of 2011. Business development expenses continue to be
consistent with the first half of 2011. Business development expenses relate to the operation of two laboratory facilities which focus
on the development of new technologies for recycling initiatives. Business development also includes expenses associated with
evaluating a number of potential projects or prospects. In 2012, the business development team has also added new employees to
assist in the research and development of new technologies in the energy services industry.
INTEREST, ACCRETION AND FINANCING COSTS
($000's) (unaudited) 2012 2011 % Change 2012 2011 % Change
Interest, accretion and finance costs 1,008 249 305 2,521 399 532
Three Months Ended June 30, Six Months Ended June 30,
Interest, accretion and financing costs for the three and six months ended June 30, 2012 were $1.0 million and $2.5 million compared
to $0.2 million and $0.4 million for the three and six months ended June 30, 2011. The amount included above as interest expense is
net of $0.2 million of interest capitalized on projects with substantial time to completion. During the first half of 2011, the
Corporation funded the majority of its capital program and increases in working capital through its available cash flow from
operations. The balance of the revolving credit facility at the end of the first half of 2012 was $136.0 million compared to $16.5
million for the six months ended June 30, 2011. Therefore, the increase relates to interest expense on the drawn portion, standby fees
associated with the undrawn portion of the revolving credit facility, charges relating to the letters of credit and accretion associated
with the Corporation‟s asset retirement obligations.
2012 Second Quarter Interim Report page 13
FOREIGN CURRENCY TRANSLATION ADJUSTMENT
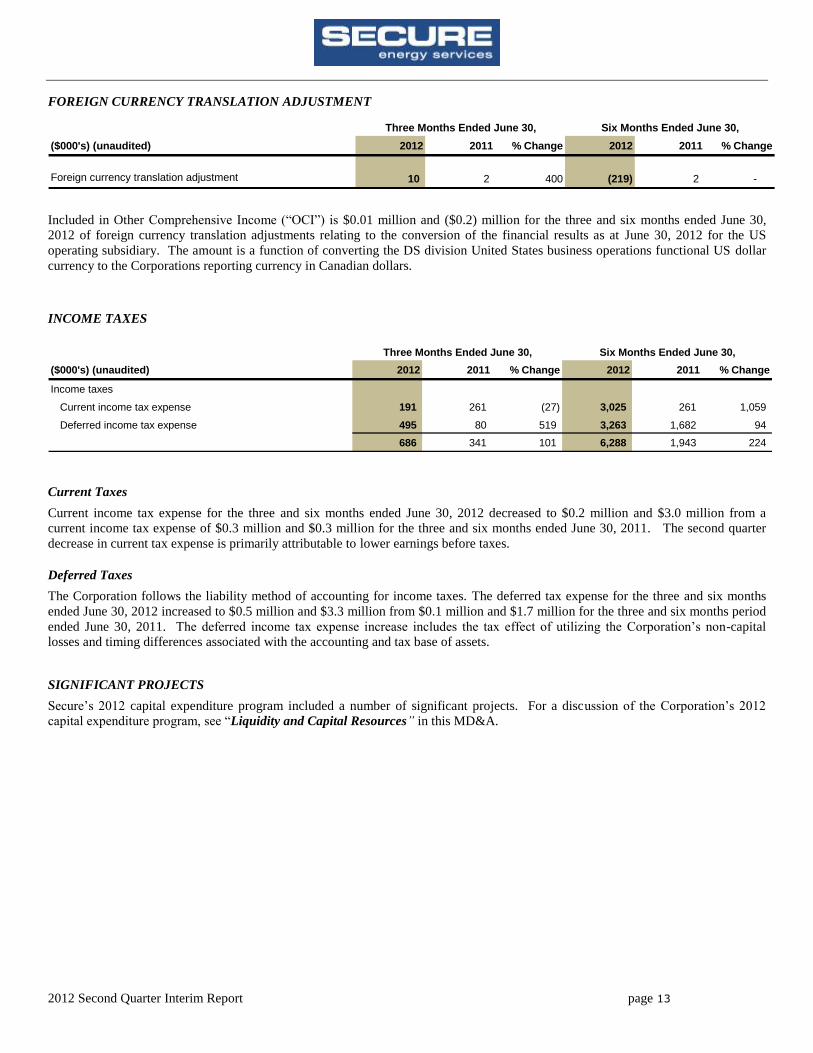
($000's) (unaudited) 2012 2011 % Change 2012 2011 % Change
10 2 400 (219) 2 -
Three Months Ended June 30,
Foreign currency translation adjustment
Six Months Ended June 30,
Included in Other Comprehensive Income (“OCI”) is $0.01 million and ($0.2) million for the three and six months ended June 30,
2012 of foreign currency translation adjustments relating to the conversion of the financial results as at June 30, 2012 for the US
operating subsidiary. The amount is a function of converting the DS division United States business operations functional US dollar
currency to the Corporations reporting currency in Canadian dollars.
INCOME TAXES
($000's) (unaudited) 2012 2011 % Change 2012 2011 % Change
Income taxes
Current income tax expense 191 261 (27) 3,025 261 1,059
Deferred income tax expense 495 80 519 3,263 1,682 94
686 341 101 6,288 1,943 224
Three Months Ended June 30, Six Months Ended June 30,
Current Taxes
Current income tax expense for the three and six months ended June 30, 2012 decreased to $0.2 million and $3.0 million from a
current income tax expense of $0.3 million and $0.3 million for the three and six months ended June 30, 2011. The second quarter
decrease in current tax expense is primarily attributable to lower earnings before taxes.
Deferred Taxes
The Corporation follows the liability method of accounting for income taxes. The deferred tax expense for the three and six months
ended June 30, 2012 increased to $0.5 million and $3.3 million from $0.1 million and $1.7 million for the three and six months period
ended June 30, 2011. The deferred income tax expense increase includes the tax effect of utilizing the Corporation‟s non-capital
losses and timing differences associated with the accounting and tax base of assets.
SIGNIFICANT PROJECTS
Secure‟s 2012 capital expenditure program included a number of significant projects. For a discussion of the Corporation‟s 2012
capital expenditure program, see “Liquidity and Capital Resources” in this MD&A.
2012 Second Quarter Interim Report page 14
GEOGRAPHICAL FINANCIAL INFORMATION
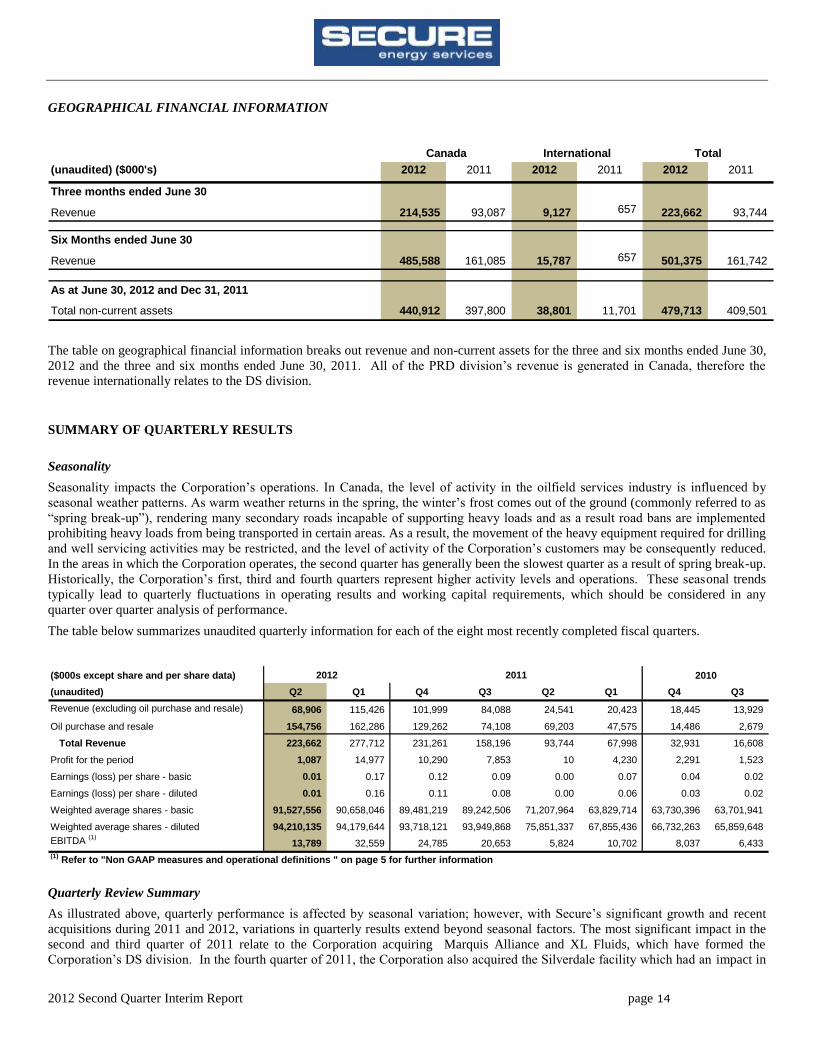
(unaudited) ($000's) 2012 2011 2012 2011 2012 2011
Three months ended June 30
Revenue 214,535 93,087 9,127 657 223,662 93,744
Six Months ended June 30
Revenue 485,588 161,085 15,787 657 501,375 161,742
As at June 30, 2012 and Dec 31, 2011
Total non-current assets 440,912 397,800 38,801 11,701 479,713 409,501
Canada International Total
The table on geographical financial information breaks out revenue and non-current assets for the three and six months ended June 30,
2012 and the three and six months ended June 30, 2011. All of the PRD division‟s revenue is generated in Canada, therefore the
revenue internationally relates to the DS division.
SUMMARY OF QUARTERLY RESULTS
Seasonality
Seasonality impacts the Corporation‟s operations. In Canada, the level of activity in the oilfield services industry is influenced by
seasonal weather patterns. As warm weather returns in the spring, the winter‟s frost comes out of the ground (commonly referred to as
“spring break-up”), rendering many secondary roads incapable of supporting heavy loads and as a result road bans are implemented
prohibiting heavy loads from being transported in certain areas. As a result, the movement of the heavy equipment required for drilling
and well servicing activities may be restricted, and the level of activity of the Corporation‟s customers may be consequently reduced.
In the areas in which the Corporation operates, the second quarter has generally been the slowest quarter as a result of spring break-up.
Historically, the Corporation‟s first, third and fourth quarters represent higher activity levels and operations. These seasonal trends
typically lead to quarterly fluctuations in operating results and working capital requirements, which should be considered in any
quarter over quarter analysis of performance.
The table below summarizes unaudited quarterly information for each of the eight most recently completed fiscal quarters.
($000s except share and per share data)
(unaudited) Q2 Q1 Q4 Q3 Q2 Q1 Q4 Q3
Revenue (excluding oil purchase and resale) 68,906 115,426 101,999 84,088 24,541 20,423 18,445 13,929
Oil purchase and resale 154,756 162,286 129,262 74,108 69,203 47,575 14,486 2,679
Total Revenue 223,662 277,712 231,261 158,196 93,744 67,998 32,931 16,608
Profit for the period 1,087 14,977 10,290 7,853 10 4,230 2,291 1,523
Earnings (loss) per share - basic 0.01 0.17 0.12 0.09 0.00 0.07 0.04 0.02
Earnings (loss) per share - diluted 0.01 0.16 0.11 0.08 0.00 0.06 0.03 0.02
Weighted average shares - basic 91,527,556 90,658,046 89,481,219 89,242,506 71,207,964 63,829,714 63,730,396 63,701,941
Weighted average shares - diluted 94,210,135 94,179,644 93,718,121 93,949,868 75,851,337 67,855,436 66,732,263 65,859,648
EBITDA (1)
13,789 32,559 24,785 20,653 5,824 10,702 8,037 6,433
(1) Refer to "Non GAAP measures and operational definitions " on page 5 for further information
201020112012
Quarterly Review Summary
As illustrated above, quarterly performance is affected by seasonal variation; however, with Secure‟s significant growth and recent
acquisitions during 2011 and 2012, variations in quarterly results extend beyond seasonal factors. The most significant impact in the
second and third quarter of 2011 relate to the Corporation acquiring Marquis Alliance and XL Fluids, which have formed the
Corporation‟s DS division. In the fourth quarter of 2011, the Corporation also acquired the Silverdale facility which had an impact in
2012 Second Quarter Interim Report page 15
the fourth quarter along with the opening of the Drayton Valley FST. In the first quarter of 2012, the Corporation acquired New West,
a Canadian based drilling fluids company specializing in providing drilling fluid systems and products for heavy oil drilling. New
West was integrated into the DS division in the first quarter of 2012. In the second quarter of 2012, the Corporation commenced
operations of the permanent Wild River SWD and completed crude oil treating and terminalling (Phase III) at the Dawson FST. In
addition, the Corporation‟s oil purchase/resale service revenue has also increased significantly quarter over quarter. By offering this
service, Secure‟s customers gain efficiencies in transportation and handling of their crude oil to the pipeline. The significant increase
in the first and second quarter of 2012 and the fourth quarter of 2011 are a result of Secure becoming a single shipper at Dawson FST
in June of 2012, Drayton Valley FST on January 1, 2012 and La Glace FST on October 1, 2011. Secure became a single shipper at the
Fox Creek FST on December 1, 2010. See the “Business Risks” section in this MD&A for further discussion on this service.
Finally, each quarter was impacted by the date at which any one of the constructed or acquired FSTs, SWDs or landfills commenced
operations. For a complete description of Secure‟s business assets and operations, please refer to the headings “Secure Energy
Services Inc.”, “Description of Business” and “Industry Overview” in the Corporation‟s AIF for the year ended December 31, 2011
which includes a description of the date on which each of Secure‟s facilities commenced operations. In addition to when the facility
commenced operating activities or was acquired, the quarters were also impacted by the length of time required for several oil and
natural gas producers to conduct their own individual audits of the facilities to ensure Secure met all required internal specifications
for disposal of oilfield wastes. This process is conducted at all landfills, FSTs and SWDs before the producer will begin sending
waste. Depending on the producer, this process can take several months.
LIQUIDITY AND CAPITAL RESOURCES
Liquidity risk is the risk that the Corporation will not be able to meet financial obligations at the point at which they are due. The
Corporation manages its liquidity risk through cash and debt management. Management‟s assessment of the Corporation‟s liquidity
reflects estimates, assumptions and judgments relating to current market conditions. The Corporation has historically funded its
operations and capital program primarily with equity financing, cash flow from operations and its credit facility. The Corporation‟s
objective in capital program management is to ensure adequate sources of capital are available to carry out its capital plan, while
maintaining operational growth and increased cash flow so as to sustain future development of the business.
Sources of Cash
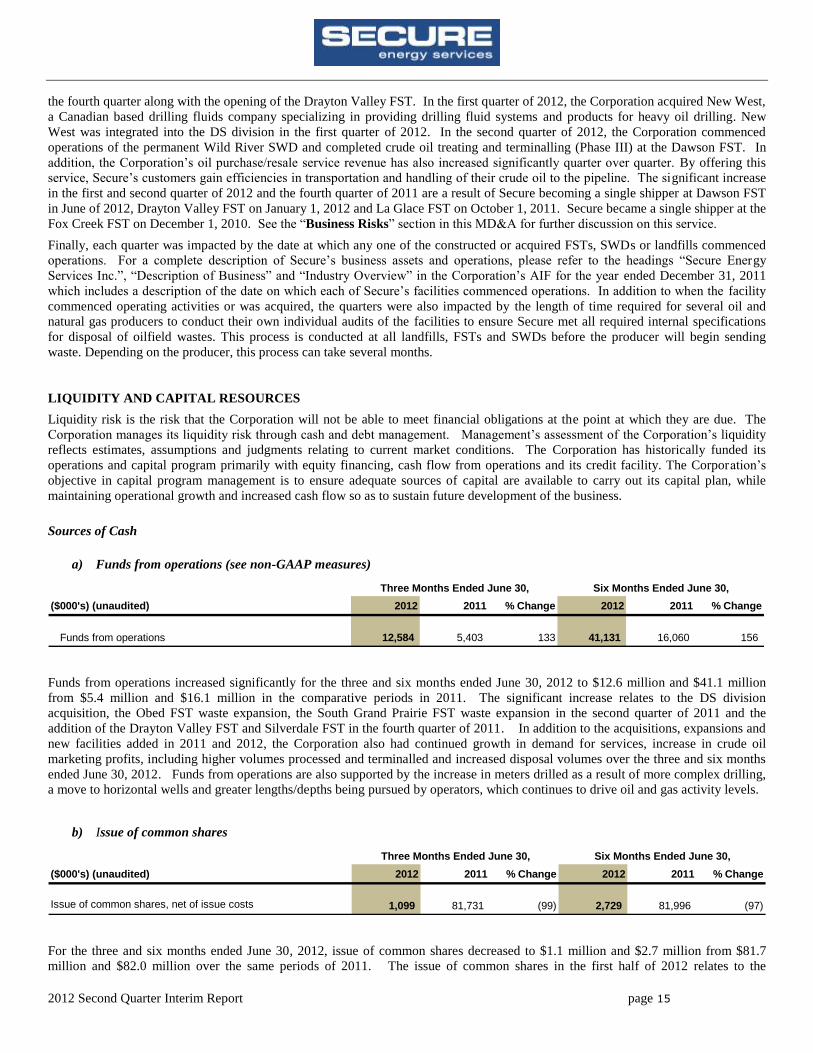
a) Funds from operations (see non-GAAP measures)
($000's) (unaudited) 2012 2011 % Change 2012 2011 % Change
Funds from operations 12,584 5,403 133 41,131 16,060 156
Three Months Ended June 30, Six Months Ended June 30,
Funds from operations increased significantly for the three and six months ended June 30, 2012 to $12.6 million and $41.1 million
from $5.4 million and $16.1 million in the comparative periods in 2011. The significant increase relates to the DS division
acquisition, the Obed FST waste expansion, the South Grand Prairie FST waste expansion in the second quarter of 2011 and the
addition of the Drayton Valley FST and Silverdale FST in the fourth quarter of 2011. In addition to the acquisitions, expansions and
new facilities added in 2011 and 2012, the Corporation also had continued growth in demand for services, increase in crude oil
marketing profits, including higher volumes processed and terminalled and increased disposal volumes over the three and six months
ended June 30, 2012. Funds from operations are also supported by the increase in meters drilled as a result of more complex drilling,
a move to horizontal wells and greater lengths/depths being pursued by operators, which continues to drive oil and gas activity levels.
b) Issue of common shares
($000's) (unaudited) 2012 2011 % Change 2012 2011 % Change
1,099 81,731 (99) 2,729 81,996 (97) Issue of common shares, net of issue costs
Three Months Ended June 30, Six Months Ended June 30,
For the three and six months ended June 30, 2012, issue of common shares decreased to $1.1 million and $2.7 million from $81.7
million and $82.0 million over the same periods of 2011. The issue of common shares in the first half of 2012 relates to the
2012 Second Quarter Interim Report page 16
exercising of options and warrants in accordance with the Corporation‟s share-based payment plan (the “Plan”). Under the Plan, the
Corporation may grant share options to its employees, directors, and consultants for up to 10% of the issued and outstanding common
shares of the Corporation calculated on a non-diluted basis at the time of grant. Options issued under the Plan have a term of five years
to expiry and vest over a three year period starting one year from the date of the grant. As at June 30, 2012, Secure had a total of
91,805,351 common shares and 7,402,613 employee stock options outstanding. The $81.7 million in the second quarter of 2011
relates to the closing of a public offering, on a bought deal basis, on May 19, 2011.
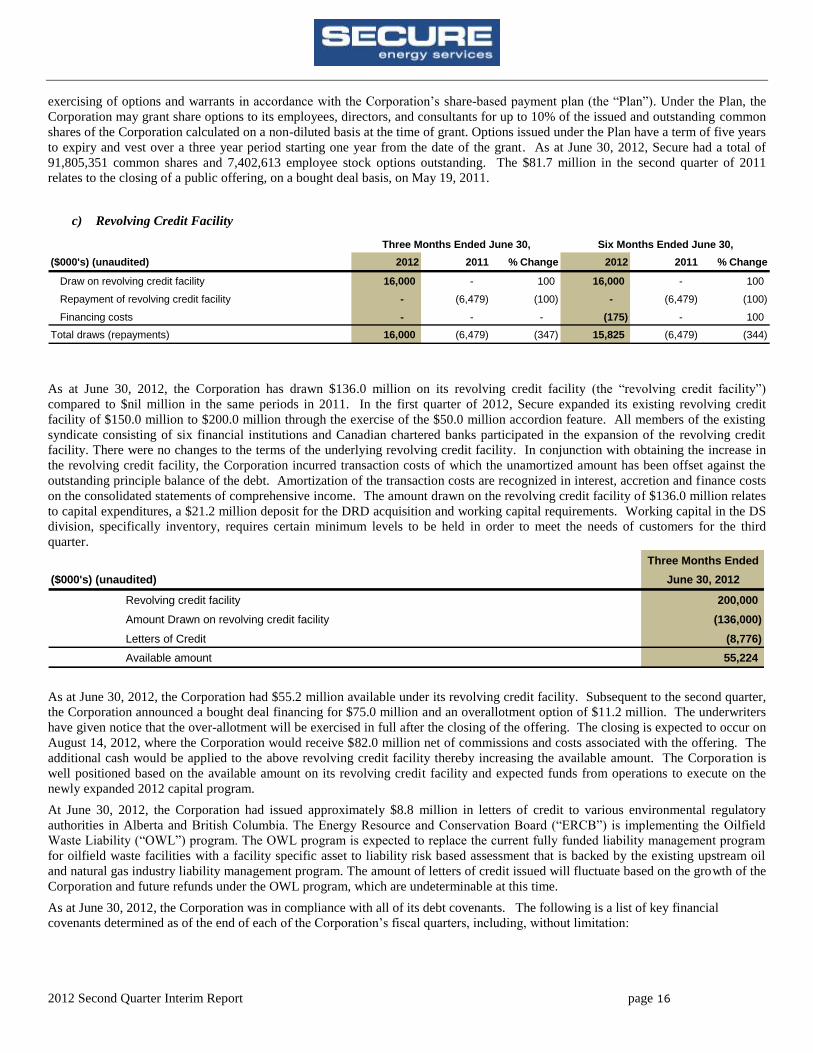
c) Revolving Credit Facility
($000's) (unaudited) 2012 2011 % Change 2012 2011 % Change
Draw on revolving credit facility 16,000 - 100 16,000 - 100
Repayment of revolving credit facility - (6,479) (100) - (6,479) (100)
Financing costs - - - (175) - 100
Total draws (repayments) 16,000 (6,479) (347) 15,825 (6,479) (344)
Six Months Ended June 30,Three Months Ended June 30,
As at June 30, 2012, the Corporation has drawn $136.0 million on its revolving credit facility (the “revolving credit facility”)
compared to $nil million in the same periods in 2011. In the first quarter of 2012, Secure expanded its existing revolving credit
facility of $150.0 million to $200.0 million through the exercise of the $50.0 million accordion feature. All members of the existing
syndicate consisting of six financial institutions and Canadian chartered banks participated in the expansion of the revolving credit
facility. There were no changes to the terms of the underlying revolving credit facility. In conjunction with obtaining the increase in
the revolving credit facility, the Corporation incurred transaction costs of which the unamortized amount has been offset against the
outstanding principle balance of the debt. Amortization of the transaction costs are recognized in interest, accretion and finance costs
on the consolidated statements of comprehensive income. The amount drawn on the revolving credit facility of $136.0 million relates
to capital expenditures, a $21.2 million deposit for the DRD acquisition and working capital requirements. Working capital in the DS
division, specifically inventory, requires certain minimum levels to be held in order to meet the needs of customers for the third
quarter.
Three Months Ended
($000's) (unaudited) June 30, 2012
Revolving credit facility 200,000
Amount Drawn on revolving credit facility (136,000)
Letters of Credit (8,776)
Available amount 55,224
As at June 30, 2012, the Corporation had $55.2 million available under its revolving credit facility. Subsequent to the second quarter,
the Corporation announced a bought deal financing for $75.0 million and an overallotment option of $11.2 million. The underwriters
have given notice that the over-allotment will be exercised in full after the closing of the offering. The closing is expected to occur on
August 14, 2012, where the Corporation would receive $82.0 million net of commissions and costs associated with the offering. The
additional cash would be applied to the above revolving credit facility thereby increasing the available amount. The Corporation is
well positioned based on the available amount on its revolving credit facility and expected funds from operations to execute on the
newly expanded 2012 capital program.
At June 30, 2012, the Corporation had issued approximately $8.8 million in letters of credit to various environmental regulatory
authorities in Alberta and British Columbia. The Energy Resource and Conservation Board (“ERCB”) is implementing the Oilfield
Waste Liability (“OWL”) program. The OWL program is expected to replace the current fully funded liability management program
for oilfield waste facilities with a facility specific asset to liability risk based assessment that is backed by the existing upstream oil
and natural gas industry liability management program. The amount of letters of credit issued will fluctuate based on the growth of the
Corporation and future refunds under the OWL program, which are undeterminable at this time.
As at June 30, 2012, the Corporation was in compliance with all of its debt covenants. The following is a list of key financial
covenants determined as of the end of each of the Corporation‟s fiscal quarters, including, without limitation:
2012 Second Quarter Interim Report page 17
Senior Debt to EBITDA (see Non-GAAP measures) Ratio: the Funded Debt to EBITDA Ratio shall not exceed 3.00:1; where
EBITDA is adjusted for acquisitions on a pro-forma trailing twelve month basis;
Senior Debt to Capitalization Ratio: the ratio of Senior Debt to Senior Debt plus Equity shall not be greater than 40%; and
Fixed Charge Coverage Ratio: the Fixed Charge Coverage Ratio shall not be less 1.00:1.
The revolving credit facility is to be used for working capital, to refinance existing debt, for capital expenditures including permitted
acquisitions, and for general corporate purposes. The Corporation can borrow by way of Canadian dollar advances through Canadian
Prime Rate Loans or Bankers Acceptances or United States dollar advances through US Base Rate Loans or Libor or letters of credit
denominated in Canadian or U.S. dollars. The revolving credit facility provides that the Corporation may borrow, repay, draw on and
convert between types of borrowings at any time. The revolving credit facility bears interest ranging from 1.0% to 2.0% above the
prime rate or Bankers Acceptances ranging from 2.0% to 3.0% above the Bankers Acceptance depending on the Corporation‟s
prevailing funded debt to EBITDA ratio, with any unused amounts subject to standby fees ranging from 0.50% to 0.75%. Funded debt
includes all outstanding debt, including capital leases, and any outstanding letters of credit. The revolving credit facility is to be used
for working capital, to refinance existing debt, for capital expenditures including permitted acquisitions, and for general corporate
purposes. The revolving credit facility is due July 29, 2014 (the “maturity date”), and includes an option for the Corporation to extend
the maturity date (on an annual basis) to a maximum of three years from the extension request date, subject to approval by the
Corporation‟s lenders. Repayment of any amounts drawn on the facility would therefore be repayable on the maturity date if the
revolving credit facility was not extended. As security for the revolving credit facility, the Corporation granted lenders a security
interest over all of its present and after acquired property. A $1.0 billion debenture provides a first fixed charge over the Corporation‟s
real properties and a floating charge over all present and after acquired property not subject to the fixed charge.
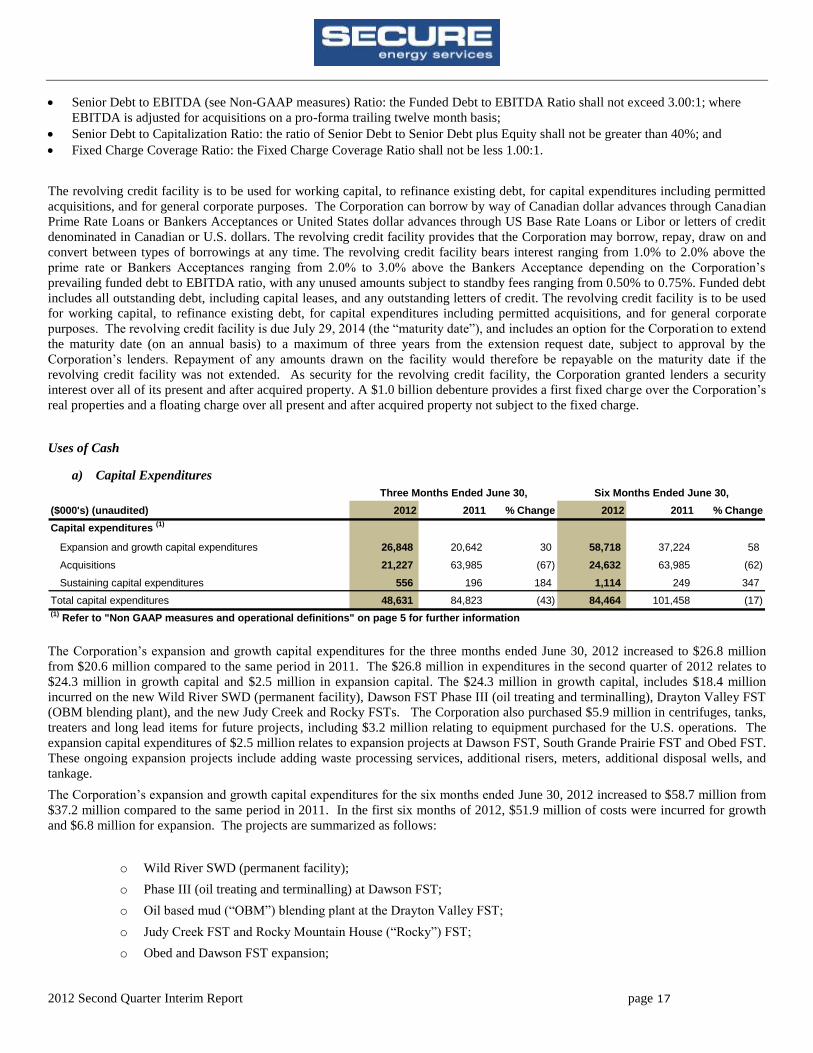
Uses of Cash
a) Capital Expenditures
($000's) (unaudited) 2012 2011 % Change 2012 2011 % Change
Capital expenditures (1)
Expansion and growth capital expenditures 26,848 20,642 30 58,718 37,224 58
Acquisitions 21,227 63,985 (67) 24,632 63,985 (62)
Sustaining capital expenditures 556 196 184 1,114 249 347
Total capital expenditures 48,631 84,823 (43) 84,464 101,458 (17)
(1) Refer to "Non GAAP measures and operational definitions" on page 5 for further information
Six Months Ended June 30,Three Months Ended June 30,
The Corporation‟s expansion and growth capital expenditures for the three months ended June 30, 2012 increased to $26.8 million
from $20.6 million compared to the same period in 2011. The $26.8 million in expenditures in the second quarter of 2012 relates to
$24.3 million in growth capital and $2.5 million in expansion capital. The $24.3 million in growth capital, includes $18.4 million
incurred on the new Wild River SWD (permanent facility), Dawson FST Phase III (oil treating and terminalling), Drayton Valley FST
(OBM blending plant), and the new Judy Creek and Rocky FSTs. The Corporation also purchased $5.9 million in centrifuges, tanks,
treaters and long lead items for future projects, including $3.2 million relating to equipment purchased for the U.S. operations. The
expansion capital expenditures of $2.5 million relates to expansion projects at Dawson FST, South Grande Prairie FST and Obed FST.
These ongoing expansion projects include adding waste processing services, additional risers, meters, additional disposal wells, and
tankage.
The Corporation‟s expansion and growth capital expenditures for the six months ended June 30, 2012 increased to $58.7 million from
$37.2 million compared to the same period in 2011. In the first six months of 2012, $51.9 million of costs were incurred for growth
and $6.8 million for expansion. The projects are summarized as follows:
o Wild River SWD (permanent facility);
o Phase III (oil treating and terminalling) at Dawson FST;
o Oil based mud (“OBM”) blending plant at the Drayton Valley FST;
o Judy Creek FST and Rocky Mountain House (“Rocky”) FST;
o Obed and Dawson FST expansion;
2012 Second Quarter Interim Report page 18
o Saddle Hills and Fox Creek landfills; and
o Rental equipment & long leads (centrifuges, tanks, treaters).
The Wild River SWD facility was completed and commissioned in May and Phase III at Dawson was commissioned and completed in
June. The Drayton Valley OBM blending plant, the Obed FST and Dawson FST expansions are expected to be completed in the third
quarter. The Corporation also expects the Judy Creek and Rocky FSTs to be operational in the first quarter of 2013. The Saddle Hills
and Fox Creek landfills were delayed in June due to wet weather, however it is anticipated construction to commence in the third
quarter. The Corporation intends to fund its capital program primarily with existing cash, cash flow from operations and its expanded
credit facility.
For the three and six months ended June 30, 2012 acquisitions decreased to $21.2 million and $24.6 million from $64.0 million and
$64.0 million in the comparative period of 2011. In January 2012, the Corporation completed the acquisition of the operating assets
(excluding working capital) of New West for an aggregate cash purchase price of $3.4 million. New West is a Canadian based drilling
fluids company specializing in providing drilling fluid systems and products for heavy oil drilling. On July 2, 2012, the Corporation
closed an asset purchase agreement (the “acquisition”) with DRD to acquire the operating assets of DRD for total cash and share
consideration of US$29.9 million. The Corporation paid a $21.2 million deposit for the acquisition of the operating assets of DRD,
which is included in deposit on asset acquisition on the consolidated statements of financial position as at June 30, 2012. This amount
was applied to the purchase price on closing. The prior year acquisition relates to acquiring all of the issued and outstanding shares of
Marquis Alliance.
Sustaining capital or maintenance capital refers to capital expenditures in respect of capital asset additions, replacements or
improvements required to maintain ongoing business operations. The determination of what constitutes sustaining capital expenditures
versus expansion and growth capital involves judgment by management. During the three and six months ended June 30, 2012,
sustaining capital was $0.6 million and $1.1 million compared to $0.2 million and $0.2 million for the three and six months ended
June 30, 2011. Sustaining capital is typically minimal in the first two years of operation of a facility because each facility is
constructed with new equipment or refurbished equipment. Sustaining capital typically relates to pump and riser replacements or
upgrades. As a facility matures, the amount of sustaining capital required will increase.
b) Contractual Obligations
The Corporation has a total of $40.1 million in commitments, excluding the above commitment relating to the revolving credit facility.
The $40.1 million includes commitments for finance and operating lease agreements primarily for heavy equipment, vehicles, land
leases and office space, and capital commitments relating to purchases for use in the Corporation‟s current and future capital projects.
This also includes inventory purchases relating to a specialized product used in drilling fluids systems. Overall, the Corporation has
sufficient funds from operations and availability though the revolving credit facility to meet upcoming commitments.
($000's) (unaudited) Total 1 year or less 1-3 years 4-5 years
5 years and
thereafter
Total Commitments 40,084 29,282 6,973 2,718 1,111
Payments due by period
The Corporation‟s asset retirement obligations were estimated by management based on the Corporation‟s estimated costs to
remediate, reclaim, and abandon the Corporation‟s facilities and estimated timing of the costs to be incurred in future periods. The
Corporation has estimated the net present value of its asset retirement obligations at June 30, 2012 to be $17.4 million (December 31,
2011 - $15.0 million) based on a total future liability of $22.6 million as at June 30, 2012 (December 31, 2011 - $20.1 million). These
costs are expected to be incurred over the next one to 25 years. The Corporation used its risk-free interest rates of 1.03% to 2.33% and
an inflation rate of 3.00% to calculate the net present value of its asset retirement obligations.
PROPOSED TRANSACTIONS
As of the date of this MD&A, the board of directors have approved an asset purchase agreement to acquire the operating assets of
IDF. The business acquisition is not expected to have a material effect on the financial condition, results of operations or cash flows
of Secure.
2012 Second Quarter Interim Report page 19
The Corporation has also previously announced a bought deal financing for $75.0 million and an overallotment option granted to the
underwriters of $11.2 million under the same terms as the bought deal financing. The underwriters have given notice that the over-
allotment will be exercised in full after the closing of the Offering. The closing is expected to occur on August 14, 2012, where the
Corporation would receive $82.0 million net of commissions and costs associated with the offering. There is no other proposed asset
or business acquisition or disposition expected to have a material effect on the financial condition, results of operations or cash flows
of Secure.
BUSINESS RISKS
The following information describes certain significant risks and uncertainties inherent in the Corporation‟s business. This section
does not describe all risks applicable to the Corporation, its industry or its business, and it is intended only as a summary of certain
material risks. If any of such risks or uncertainties actually occurs, the Corporation‟s business, financial condition or operating results
could be harmed substantially and could differ materially from the plans and other forward-looking statements discussed in this
MD&A.
Oil and Natural Gas prices
The demand, pricing and terms for oilfield waste disposal services in the Corporation‟s existing or future service areas largely depend
upon the level of exploration, development and production activity for both crude oil and natural gas in the WCSB, Quebec, the
United States and India. Oil and natural gas industry conditions are influenced by numerous factors over which the Corporation has no
control, including oil and natural gas prices, expectations about future oil and natural gas prices, levels of consumer demand, the cost
of exploring for, producing and delivering oil and natural gas, the expected rates of declining current production, the discovery rates of
new oil and natural gas reserves, available pipeline and other oil and natural gas transportation capacity, weather conditions, political,
regulatory and economic conditions, and the ability of oil and natural gas companies to raise equity capital or debt financing.
The level of activity in the oil and natural gas industry is volatile. No assurance can be given that natural gas exploration and
production activities will continue at their current levels. Any prolonged substantial reduction in oil and natural gas prices would
likely affect oil and natural gas production levels and therefore affect the demand for drilling and well services by oil and natural gas
companies. Any addition to, or elimination or curtailment of, government incentives for companies involved in the exploration for and
production of oil and natural gas could have a significant effect on the oilfield services industry in the WCSB, Quebec, the United
States and India. A material decline in crude oil or natural gas prices or industry activity could have a material adverse effect on the
Corporation‟s business, financial condition, results of operations and cash flows.
In addition, treatment and waste disposal services are largely dependent on the willingness of customers to outsource their waste
management activities. As such, the demand for Secure‟s services could be curtailed by a trend towards internal waste management.
Commodity price risk – non-trading
The value of the Corporation‟s crude oil inventory is impacted by the commodity price of crude oil. Crude oil prices have historically
fluctuated widely and are affected by numerous factors outside of the Corporation‟s control. Crude oil prices are primarily based on
West Texas Intermediate ("WTI"), plus or minus a differential to WTI based on the crude type and market conditions. As part of
normal operating activities, the Corporation is required to hold a certain amount of inventory in any given month. The Corporation is
therefore exposed to commodity price fluctuations. The Corporation has elected not to actively manage commodity price risk
associated with crude oil inventory at this time as the exposure to these fluctuations is not considered significant.
Commodity price risk – trading
The Corporation is exposed to commodity price risk on its crude oil marketing contracts. The physical trading activities related to the
contracts exposes the Corporation to the risk of profit or loss depending on a variety of factors including: changes in the prices of
commodities; foreign exchange rates; changes in value of different qualities of a commodity; changes in the relationships between
commodity prices and the contracts; physical loss of product through operational activities; and counterparty performance as a result
of disagreements over terms of deals and/or contracts. These risks are mitigated by the fact that the Corporation only trades physical
volumes, the volumes are traded over a short period, and the Corporation does not currently participate in the long term storage of the
commodities. The oil and gas producer forecasts or nominates crude oil volumes expected to be delivered to the Corporation‟s
facilities in advance of the production month as part of normal oil and gas operations. As part of the Corporation‟s processing, and
facility operations, Secure will use net buy and net sell crude oil contracts for marketing and trading of crude oil. The volume
purchased or sold relates to physical volumes only. Through this process, the Corporation may hold open positions. The Corporation
defines an “open position” as the difference between physical deliveries of all net buy crude oil contracts offset against physical
delivery of all net sell crude oil contracts. The open position is subject to commodity price risk. The Corporation may choose to do
this based on energy commodity pricing relationships, time periods or qualities.
2012 Second Quarter Interim Report page 20
Foreign currency risk
A significant portion of the Corporation‟s activities relate to the purchase and sale of crude oil or drilling fluids products which are
transacted in or referenced to US dollars. The risk is mitigated as the majority of the activities occur in the same period; therefore
foreign currency risk exposure is limited to crude oil or drilling fluids products held in inventory. The Corporation does not maintain
an active hedge program to mitigate this risk as the exposure is limited at this time.
Volatility of market price of Common Shares
The market price of the Common Shares may be volatile. The volatility may affect the ability of holders to sell the Common Shares at
an advantageous price. Market price fluctuations in the Common Shares may be due to the Corporation's operating results failing to
meet the expectations of securities analysts or investors in any quarter, downward revision in securities analysts' estimates,
governmental regulatory action, adverse change in general market conditions or economic trends, acquisitions, dispositions or other
material public announcements by the Corporation or its competitors, along with a variety of additional factors, including, without
limitation, those set forth under "Forward-Looking Statements" herein. In addition, the market price for securities in the stock markets,
including the TSX, recently experienced significant price and trading fluctuations. These fluctuations have resulted in volatility in the
market prices of securities that often has been unrelated or disproportionate to changes in operating performance. These broad market
fluctuations may adversely affect the market prices of the Common Shares.
Competitive conditions
The Corporation competes with a number of companies, some of which have greater technical and financial resources. The western
Canadian market for the PRD division is dominated by two large market participants, Tervita Corporation (formerly CCS Midstream
Services) with approximately 53 facilities, and Newalta Corporation with 35 facilities. There can be no assurance that competitors will
not substantially increase the resources devoted to the development and marketing of services that compete with those of the
Corporation, or that new or existing competitors will not enter the various markets in which the Corporation is active. In addition,
reduced levels of activity in the oil and natural gas industry could intensify competition and the pressure on competitive pricing and
may result in lower revenues or margins to the Corporation in both divisions. The Corporation‟s customers may elect not to purchase
its services if they view the Corporation‟s financial viability as unacceptable, which would cause the Corporation to lose customers.
Financing future growth or expansion
The Corporation‟s business strategy is based in part upon the continued expansion of the Corporation‟s network of facilities. In order
to continue to implement its business strategy, the Corporation will be required to further its capital investment. The Corporation may
finance these capital expenditures through vendor financings, ongoing cash flow from operations, borrowings under its revolving
credit facility and by raising capital through the sale of additional debt or equity securities. The Corporation‟s ability to obtain
financing or to access the capital markets for future offerings may be limited by the restrictive covenants in the Corporation‟s current
and future debt agreements, by the Corporation‟s future financial condition, and by adverse market conditions resulting from, among
other things, general economic conditions and contingencies and uncertainties beyond the Corporation‟s control.
Access to capital
The Corporation may find it necessary in the future to obtain additional debt or equity to support ongoing operations, to undertake
capital expenditures, or to undertake acquisitions or other business combination transactions. There can be no assurance that additional
financing will be available to the Corporation when needed or on terms acceptable to the Corporation. The Corporation‟s inability to
raise financing to support ongoing operations or to fund capital expenditures or acquisitions could limit the Corporation‟s growth and
may have a material adverse effect on the Corporation. The credit agreement governing the credit facility imposes operating and
financial restrictions on the Corporation that may prevent the Corporation from pursuing certain business opportunities and restrict its
ability to operate its business.
The credit agreement governing the revolving credit facility contains covenants that restrict the Corporation‟s ability to take various
actions. In addition, the credit agreement governing the revolving credit facility requires the Corporation to comply with specified
financial ratios. The Corporation‟s ability to comply with these covenants will likely be affected by events beyond its control, and the
Corporation cannot assure that it will satisfy those requirements.
The restrictions contained in the credit agreement could also limit the Corporation‟s ability to plan for or react to market conditions,
meet capital needs or otherwise restrict the Corporation‟s activities or business plans and adversely affect its ability to finance its
operations, enter into acquisitions or to engage in other business activities that would be in the Corporation‟s interest.
2012 Second Quarter Interim Report page 21
Seasonal nature of the industry
In Canada, the level of activity in the oilfield services industry is influenced by seasonal weather patterns. As warm weather returns in
the spring, the winter‟s frost comes out of the ground (commonly referred to as "spring break-up"), rendering many secondary roads
incapable of supporting heavy loads and, as a result, road bans are implemented prohibiting heavy loads from being transported in
certain areas. As a result, the movement of the heavy equipment required for drilling and well servicing activities is restricted and the
level of activity of our customers is consequently reduced. In addition, the transportation of heavy waste loads is restricted resulting in
smaller loads and a general reduction in the volume of waste delivered to Secure‟s facilities. Accordingly, while the Corporation‟s
facilities are open and accessible year-round, spring break-up reduces the Corporation‟s activity levels. In the areas in which Secure
operates, the second quarter has generally been the slowest quarter as a result of spring break-up.
Development of new technology and equipment
The technology used in the PRD division for waste treatment, recovery and disposal business is not protected by intellectual property
rights. As such, there are no significant technological barriers to entry within the industry. The technology used in the DS division for
drilling fluids systems and drilling fluid in some instances are protected by intellectual property rights, however new technological
advances could occur within the drilling fluids system and drilling fluids industry at anytime.
Risk of third party claims for infringement
A third party may claim that the Corporation has infringed such third party's intellectual property rights or may challenge the right of
the Corporation in their intellectual property. In such event, the Corporation will undertake a review to determine what, if any, actions
the Corporation should take with respect to such claim. Any claim, whether or not with merit, could be time consuming to evaluate,
result in costly litigation, cause delays in the operations of the Corporation or require the Corporation to enter into licensing
agreements that may require the payment of a license fee or royalties to the owner of the intellectual property. Such royalty or
licensing agreements, if required, may not be available on terms acceptable to the Corporation.
Equipment risks
The Corporation's ability to meet customer demands in respect of performance and cost will depend upon continuous improvements in
the Corporation's operating equipment. There can be no assurance that the Corporation will be successful in its efforts in this regard or
that it will have the resources available to meet this continuing demand. The Corporation's failure to do so could have a material
adverse effect on it. No assurances can be given that competitors will not achieve technological advantages over the Corporation.
Credit risk
Credit risk affects both our non-trading and trading activities. The Corporation provides credit to its customers in the normal course of
operations and assumes credit risk with counterparties through its trading activities. In addition, the Corporation is at risk for potential
losses if counterparties in its trading activities do not fulfill their contractual obligations. A substantial portion of the Corporation‟s
accounts receivable are with customers or counterparties involved in the oil and natural gas industry, whose revenues may be affected
by fluctuations in oil and natural gas prices, economic conditions, environmental regulations, government policy, royalty rates and
geopolitical factors. Collection of these receivables could be influenced by economic factors affecting this industry. The carrying
value of trade accounts receivable reflects management‟s assessment of the associated risks. In order to mitigate collection risk, the
Corporation assesses the credit worthiness of customers or counterparties by assessing the financial strength of the customers or
counterparties through a formal credit process and by routinely monitoring credit risk exposures. In addition, the Corporation uses
standard agreements that allow for the netting of exposures associated with a single counterparty. Where the Corporation has a legally
enforceable right to offset, the amounts are recorded on a net basis.
Environmental protection & health and safety
The oil and natural gas industry is regulated by a number of federal and provincial legislation in Canada, federal and state laws and
regulations in the United States and other applicable laws in the jurisdictions in which the Corporation operates. These regulations set
forth numerous prohibitions and requirements with respect to planning and approval processes related to land use, sustainable resource
management, waste management, responsibility for the release of presumed hazardous materials, protection of wildlife and the
environment, and the health and safety of workers. Legislation provides for restrictions and prohibitions on the transport of dangerous
goods and the release or emission of various substances, including substances used and produced in association with certain oil and
natural gas industry operations. The legislation addresses various permits required for drilling, access road construction, camp
construction, well completion, installation of surface equipment, air monitoring, surface and ground water monitoring in connection
2012 Second Quarter Interim Report page 22
with these activities, waste management and access to remote or environmentally sensitive areas. Legislation regulating the oil and
natural gas industry may be changed to impose higher standards and potentially more costly obligations on the oil and gas customers
of the Corporation. The Corporation's oil and gas customers will also be required to comply with any regulatory schemes for
greenhouse gas emissions adopted by any applicable jurisdiction. The direct or indirect cost of these regulations may have a material
adverse effect on the oil and gas customers of the Corporation and consequently on the Corporation's business, financial condition,
results of operations and cash flows. Given the evolving nature of the debate related to climate change and control of greenhouse gases
and resulting requirements, management is unable to predict the impact of greenhouse gas emissions legislation and regulation on the
Corporation and it is possible that it could have a material adverse affect on the Corporation's business, financial condition, results of
operations and cash flows.
The Corporation is subject to a complex and increasingly stringent array of legal requirements and potential liabilities, including with
respect to the ownership and management of property, the need to obtain and comply with permits and approvals, the health and safety
of employees, and the handling, use, storage, disposal, intentional or accidental release of hazardous products or oilfield waste
material. Failure to comply with these requirements could expose the Corporation to substantial penalties. There can be no assurance
that the Corporation will not be required, at some future date, to incur significant costs to comply with environmental laws, or that its
operations, business, assets or cash flow will not be materially adversely affected by existing conditions or by the requirements or
potential liability under current or future environmental laws.
The Corporation may incur substantial costs, including fines, damages, criminal or civil sanctions, and remediation costs, or
experience interruptions in the Corporation‟s operations for violations or liabilities arising under these laws and regulations. The
Corporation may have the benefit of insurance maintained by the Corporation, its customers or others. However, the Corporation may
become liable for damages against which it cannot adequately insure or against which it may elect not to insure because of high costs
or other reasons.
The occurrence of any of the matters above, including new legislation or more rigorous enforcement of existing legislation may result
in significant liability to the Corporation, which could have a material adverse affect on the financial results, cash flows and overall
financial condition of the Corporation.
In addition, the Corporation‟s customers may elect not to purchase its services if they view its safety record as unacceptable, which
could cause the Corporation to lose customers and substantial revenues. These risks may be greater for the Corporation because it may
acquire companies that have not allocated significant resources and management focus to safety or have a poor safety record.
Governmental regulation
In addition to environmental regulations, the Corporation‟s operations are subject to a variety of other federal, provincial and local
laws, regulations and guidelines, including laws and regulations relating to health and safety, the conduct of operations, and the
manufacture, management, transportation, storage, and disposal of certain materials used in the Corporation‟s operations. The
Corporation believes that it is in compliance with such laws, regulations and guidelines. The Corporation has invested financial and
managerial resources to comply with applicable laws, regulations and guidelines and will continue to do so in the future. Although
regulatory expenditures have not, historically, been material to the Corporation, such laws, regulations and guidelines are subject to
change. Accordingly, it is impossible for the Corporation to predict the cost or effect of such laws, regulations or guidelines on the
Corporation‟s future operations. In addition, the Corporation‟s securities are being sold in Canada and are listed on the TSX, and the
Corporation is accordingly subject to regulation by Canadian securities regulators and Canadian federal and provincial laws and
regulations. The Corporation believes that it is in compliance with such laws and regulations.
Regulation and taxation of energy industry
Material changes to the regulation and taxation of the energy industry in the jurisdictions in which the Corporation operates may
reasonably be expected to have an impact on the energy services industry. Generally, a significant increase in the regulation or
taxation of the energy industry or material uncertainty regarding such issues may be expected to result in a decrease in industry
drilling and production activity in the applicable jurisdiction.
Provincial royalty rate changes
The provincial governments of Alberta, British Columbia, Manitoba, Quebec and Saskatchewan collect royalties on the production
from Crown lands. These fiscal royalty regimes are reviewed and adjusted from time to time by the respective governments for
appropriateness and competitiveness. As an example, during 2009 and 2010, changes were announced to the royalty regimes and/or
drilling incentive programs in Alberta and British Columbia. These changes, as well as the potential for future changes in these and
other jurisdictions, add uncertainty to the outlook of the oilfield services sector.
2012 Second Quarter Interim Report page 23
Operating risks and insurance
The Corporation has an insurance and risk management program in place to protect its assets, operations and employees. The
Corporation also has programs in place to address compliance with current safety and regulatory standards. However, the
Corporation‟s operations are subject to risks inherent in the oilfield services industry, such as equipment defects, malfunctions,
failures, accidents, and natural disasters. These risks and hazards could expose the Corporation to substantial liability for personal
injury, loss of life, business interruption, property damage or destruction, pollution, and other environmental damages.
Although the Corporation has obtained insurance against certain of these risks, such insurance is subject to coverage limits and
exclusions and may not be available for the risks and hazards to which the Corporation is exposed. In addition, no assurance can be
given that such insurance will be adequate to cover the Corporation‟s liabilities or will be generally available in the future or, if
available, that premiums will be commercially justifiable. If the Corporation incurs substantial liability and such damages are not
covered by insurance or are in excess of policy limits, or if the Corporation incurs such liability at a time when it is not able to obtain
liability insurance, the Corporation‟s business, results of operations and financial condition could be materially adversely affected.
Potential replacement or reduced use of products and services
Certain of the Corporation's equipment or systems may become obsolete or experience a decrease in demand through the introduction
of competing products that are lower in cost, exhibit enhanced performance characteristics or are determined by the market to be more
preferable for environmental or other reasons. The Corporation will need to keep current with the changing market for drilling fluids
and solids control equipment and technological and regulatory changes. If the Corporation fails to do so, this could have a material
adverse affect on its business, financial condition, results of operations and cash flows.
Performance of obligations
The Corporation's success depends in large part on whether it fulfills its obligations with clients and maintains client satisfaction. If
the Corporation fails to satisfactorily perform its obligations, or makes professional errors in the services that it provides, its clients
could terminate contracts, including master service agreements, exposing the Corporation to loss of its professional reputation and risk
of loss or reduced profits or, in some cases, the loss of a project.
Legal proceedings
The Corporation is named as a defendant in the Tervita Corporation (formerly CCS) Action. See "Legal Proceedings and Regulatory
Actions". While management of Secure does not believe that this action will have a material effect on the business or financial
condition of the Corporation, no assurance can be given as to the final outcome of this or any other legal proceedings or that the
ultimate resolution of this or any other legal proceedings will not have a material adverse effect on the Corporation.
In the event that the plaintiff is successful in asserting its claim against the Corporation, the Corporation has insurance and potential
damages claimed in the Corporation‟s countersuit which may mitigate the impact upon the financial condition of the Corporation;
however, the Corporation‟s insurance is limited to $5 million (which will be reduced by the amount of expenses of the lawsuit
claimed by Secure against the insurance) and there can be no assurance that Secure‟s insurer will not determine that one or more of the
claims specified in the Tervita Corporation Action are not covered by Secure‟s insurance policy and deny coverage. In the event that
the Tervita Corporation Action was to be determined in a manner adverse to the Corporation, it could have a material adverse effect
on the Corporation‟s business, financial condition and results of operations.
Oil and Natural Gas market
Fuel conservation measures, alternative fuel requirements, increasing consumer demand for alternatives to oil and natural gas, and
technological advances in fuel economy and energy generation devices could reduce the demand for oil and other liquid hydrocarbons.
The Corporation cannot predict the effect of changing demand for oil and natural gas products, and any major changes may materially
and adversely affect the Corporation‟s business, financial condition, results of operations and cash flows.
Merger and acquisition activity
The Corporation may undertake future acquisitions of businesses and assets in the ordinary course of business. Achieving the benefits
of acquisitions depends in part on having the acquired assets perform as expected, successfully consolidating functions, retaining key
employees and customer relationships, and integrating operations and procedures in a timely and efficient manner. Such integration
may require substantial management effort, time and resources and may divert management‟s focus from other strategic opportunities
and operational matters, and ultimately the Corporation may fail to realize the anticipated benefits of such acquisitions. Merger and
acquisition activity in the oil and natural gas exploration and production sector may impact demand for the Corporation‟s services as
2012 Second Quarter Interim Report page 24
customers focus on reorganizing their business prior to committing funds to exploration and development projects. Further, the
acquiring company may have preferred supplier relationships with oilfield service providers other than the Corporation.
In addition, the Corporation may discover that it has acquired substantial undisclosed liabilities in connection with an acquisition. The
existence of undisclosed liabilities or the Corporation's inability to retain existing customers or employees of the acquired entity could
have a material adverse impact on the Corporation's business, financial condition, results of operations and cash flows.
Terrorist activities
Terrorist activities, anti-terrorist efforts and other armed conflicts involving the United States, Canada, or other countries may
adversely affect the United States, Canada, and global economies and could prevent the Corporation from meeting its financial and
other obligations. If any of these events occur, the resulting political instability and societal disruption could reduce overall demand
for oil and natural gas, potentially putting downward pressure on demand for the Corporation‟s services and causing a reduction in its
revenues. Oil and natural gas-related facilities could be direct targets of terrorist attacks, and the Corporation‟s operations could be
adversely affected if infrastructure integral to its customers‟ operations is destroyed or damaged. Costs for insurance and other
security may increase as a result of these threats, and some insurance coverage may become more difficult to obtain, if available at all.
Market conditions
Fixed costs, including costs associated with leases, labour costs and depreciation, account for a significant portion of the Corporation‟s
expenses. As a result, reduced productivity resulting from reduced demand, equipment failure, weather, or other factors could
significantly affect the business, financial condition, results of operations and cash flows.
Conflict of interest
Certain of the directors and officers of the Corporation are also directors and officers of oil and natural gas exploration and/or
production entities and oil and natural gas service companies, and conflicts of interest may arise between their duties as officers and
directors of the Corporation and as officers and directors of such other companies.
Sources, Pricing and Availability of Products and Third Party Services
The Corporation sources their products from a variety of suppliers, many of whom are located in Canada and the United States.
Should any suppliers of the Corporation be unable to provide the necessary products or services or otherwise fail to deliver products or
services in the quantities required or at acceptable prices, any resulting delays in the provision of services or in the time required to
find new suppliers could have a material adverse effect on the business, financial condition, results of operations and cash flows of the
Corporation. In addition, the ability of the Corporation to compete and grow will be dependent on the Corporation having access, at a
reasonable cost and in a timely manner, to equipment, parts and components. Failure of suppliers to deliver such equipment, parts and
components at a reasonable cost and in a timely manner would be detrimental to the ability of the Corporation to maintain and expand
its client list. No assurance can be given that the Corporation will be successful in maintaining the required supply of equipment, parts
and components. It is also possible that the final costs of the equipment contemplated by the capital expenditure program of the
Corporation may be greater than anticipated by management, and may be greater than the amount of funds available to the
Corporation, in which circumstance the Corporation may curtail or extend the timeframes for completing its capital expenditure plans.
The ability of the Corporation to provide services to its customers is also dependent upon the availability at reasonable prices of raw
materials which the Corporation purchases from various suppliers, many of whom are located in Canada or the United States.
Alternate suppliers do exist for all raw materials. In periods of high industry activity, periodic industry shortages of certain materials
have been experienced and costs are sometimes affected. In contrast, periods of low industry activity levels may cause financial
distress on a supplier, thus limiting their ability to continue to operate and provide the Corporation with necessary services and
supplies. Management maintains relationships with a number of suppliers in an attempt to mitigate this risk. However, if the current
suppliers are unable to provide the necessary raw materials, or otherwise fail to deliver products in the quantities required, any
resulting delays in the provision of services to the clients of the Corporation could have a material adverse effect on the Corporation's
results of operation and cash flows.
Global financial conditions
Global financial conditions include the commodity and equity markets that have recently been volatile as investors react to the
sovereign-debt crisis in Europe. Investors fear global economies are heading into another recession and central banks and the
government will be required to increase debt loads in an effort to avoid it. As a result of these global conditions, the Corporation is
subject to increased counterparty risk and liquidity risk. The Corporation is exposed to various counterparty risks including, but not
limited to: (i) financial institutions that hold the cash of the Corporation or provide available funding on the Revolving Facility; and
2012 Second Quarter Interim Report page 25
(ii) the insurance providers of the Corporation. As a result, the cash of the Corporation may become exposed to credit related losses in
the event of non-performance by counterparties to these financial instruments. In the event that a counterparty fails to complete its
obligations, the Corporation would bear the risk of loss of the amount expected to be received under these financial instruments in the
event of the default or bankruptcy of a counterparty.
The Corporation is also exposed to liquidity risk in the event its cash positions decline or become inaccessible for any reason, or
additional financing is required to advance its projects or growth strategy and appropriate financing is unavailable, or demand for oil
and gas falls. Any of these factors may impact the ability of the Corporation to obtain further equity based funding, loans and other
credit facilities in the future and, if obtained, on terms favourable to the Corporation. If these increased levels of volatility and market
turmoil were to continue, the Corporation's results of operations and planned growth could be adversely impacted.
Availability of qualified employees
The Corporation‟s ability to provide reliable service is dependent upon attracting and retaining skilled workers. The Corporation
attempts to overcome this by offering an attractive compensation package and training to enhance skills and career prospects.
Shortages of experienced and skilled workers could have a material adverse effect on the Corporation by increasing labour costs,
constraining growth or the level of activity as a result of the inability to expand human resources of the Corporation or through the
loss of existing employees to competitive businesses. Additionally, a shortage of skilled oilfield workers may constrain overall activity
and growth in the oil and natural gas industry, which could have a material adverse effect on the financial results and cash flows and
overall financial condition of the Corporation.
Proprietary technology
The Corporation relies on various intellectual property rights to maintain proprietary control over its patents and trademarks.
The success and ability of the Corporation to compete depends in part on the proprietary technology of the Corporation, and the ability
of the Corporation to prevent others from copying such proprietary technologies. The Corporation currently relies on industry
confidentiality practices, in some cases by a letter agreement, brand recognition by oil and natural gas exploration and production
entities and in some cases patents (or patents pending) to protect its proprietary technology.
There can be no assurance that the Corporation‟s patent applications will be valid, or that patents will issue from the patent
applications that the Corporation has filed or will file. Accordingly, there can be no assurance that the patent application will be valid
or will afford the Corporation with protection against competitors with similar technology.
The products developed by the Corporation may also incorporate technology that will not be protected by any patent and are capable
of being duplicated or improved upon by competitors. Accordingly, the Corporation may be vulnerable to competitors who develop
competing technology, whether independently or as a result of acquiring access to the proprietary information of the Corporation and
trade secrets. In addition, effective patent protection may be unavailable or limited in certain foreign countries and may be
unenforceable under the laws of certain jurisdictions. Policing unauthorized use of the Corporation's enhancements could prove to be
difficult, and there can be no assurance that the steps taken by the Corporation will prevent misappropriation of its enhancements. In
addition, litigation may be necessary in the future to enforce the intellectual property rights of the Corporation to protect their patents,
to determine the validity and scope of the proprietary rights of others, or to defend against claims of infringement or invalidity. Such
litigation could result in substantial costs and diversion of resources and could have a material adverse effect on the Corporation's
business, results of operations or financial condition.
Despite the efforts of the Corporation, the intellectual property rights of the Corporation may be invalidated, circumvented,
challenged, infringed or required to be licensed to others. It cannot be assured that any steps the Corporation may take to protect its
intellectual property rights and other rights to such proprietary technologies that are central to the Corporation's operations will
prevent misappropriation or infringement.
Economic dependence
The top ten customers of the Corporation accounted for approximately 32% of revenue for the first half of 2012, of which no single
customer accounting for more than approximately 10%. The Corporation does not generally enter into long term contracts with its
customers and there can be no assurance that the current customers will continue their relationships with the Corporation. The loss of
one or more major customers, any significant decrease in services provided to a customer, or prices paid or any other changes to the
terms of service with customers, could have a material adverse affect on the financial results, cash flows, and the overall financial
condition of the Corporation.
2012 Second Quarter Interim Report page 26
Interest rates
The Corporation‟s banking facilities have interest rates which float with the lender‟s prime rate, and as such, as these banking facilities
are drawn, the Corporation will be exposed to higher interest costs if the prime rate should increase.
Leverage and restrictive covenants
The degree to which the Corporation is financially leveraged could have important consequences to the shareholders of the
Corporation, including: (i) a portion of the Corporation's cash flow from operations will be dedicated to the payment of the principal
of and interest on its indebtedness; and (ii) certain of the Corporation's borrowings have variable rates of interest, which float with the
lender‟s prime rate, and as such, as these banking facilities are drawn, the Corporation will be exposed to higher interest costs if the
prime rate should increase. The Corporation's ability to make scheduled payments of principal and interest on, or to refinance, its
indebtedness will depend on its future operating performance and cash flow, which are subject to prevailing economic conditions,
prevailing interest rate levels, and financial, competitive, business and other factors, many of which are beyond its control.
The Corporation's lender has been provided with security over all of the assets of the Corporation. A failure to comply with the
obligations in the agreements in respect of the revolving credit facility could result in an event of default which, if not cured or
waived, could permit acceleration of the relevant indebtedness.
Key personnel
The Corporation‟s success depends to a significant extent on a number of its officers and key employees. The Corporation does not
carry "key man" insurance that would compensate it for the loss of officers or key employees. The loss of the services of one or more
of these officers or employees could have an adverse effect on the Corporation.
Landfill closure costs
Operating and maintaining a landfill is capital intensive and generally requires letters of credit to secure performance and financial
obligations. In addition, the Corporation has material financial obligations to pay closure and post-closure costs in respect of its
landfills. The Corporation has estimated these costs and made provisions for them, but these costs could exceed the Corporation‟s
current provisions as a result of, among other things, any federal, provincial or local government regulatory action including, but not
limited to, unanticipated closure and post-closure obligations. The requirement to pay increased closure and post-closure costs could
substantially increase the Corporation‟s letters of credit which could increase the Corporation‟s future operating costs and cause its
profit to decline.
Legal and financial compliance
The Corporation is required to comply with the rules and regulations applicable to public companies in Canada and to file reports with
the Canadian securities administrators. Accordingly, the Corporation incurs significant legal, accounting and other expenses that the
Corporation did not incur as a private company. The Corporation‟s management and other personnel must devote a substantial amount
of time and resources to comply with these requirements. These rules and regulations will increase the Corporation‟s legal and
financial compliance costs, compared to similar costs incurred as a private company.
Disclosure controls & procedures
Management has designed disclosure controls and procedures to provide reasonable assurance that material information relating to the
Corporation, is made known to the Chief Executive Officer and Chief Financial Officer by others within the Corporation, particularly
during the period in which the annual and interim filings of the Corporation are being prepared, in an accurate and timely manner in
order for the Corporation to comply with its disclosure and financial reporting obligations and in order to safeguard the Corporation‟s
assets. Consistent with the concept of reasonable assurance, the Corporation recognizes that the relative cost of maintaining these
controls and procedures should not exceed their expected benefits. As such, the Corporation‟s disclosure controls and procedures can
only provide reasonable assurance, and not absolute assurance, that the objectives of such controls and procedures are met.
2012 Second Quarter Interim Report page 27
Internal controls over financial reporting
The Chief Executive Officer and Chief Financial Officer of the Corporation are responsible for establishing and maintaining adequate
internal control over financial reporting to provide reasonable assurance regarding the reliability of financial reporting and the
preparation of financial statements for external purposes. While management of the Corporation has put in place certain plans and
procedures to mitigate the risk of a material misstatement in the Corporation‟s financial reporting, a system of internal controls can
provide only reasonable, not absolute, assurance that the objectives of the control system are met, no matter how well conceived or
operated.
Raising additional capital
The Corporation may issue additional Common Shares in the future, which may dilute a shareholder‟s holdings in the Corporation.
The Corporation‟s articles permit the issuance of an unlimited number of Common Shares and an unlimited number of preferred
shares, and shareholders will have no pre-emptive rights in connection with any further issuances. The directors of the Corporation
have the discretion to determine the provisions attaching to any preference shares and the price and the terms of issue of further
issuances of Common Shares.
OUTSTANDING SHARE CAPITAL
As at August 13, 2012, there were 92,988,870 Common Shares issued and outstanding. In addition as at August 13, 2012, there were
7,369,354 share options outstanding, 3,420,301 of which were exercisable, and there are no warrants outstanding. Subsequent to the
second quarter, the Corporation announced a bought deal financing for $75.0 million, issuing 9,554,141 plus an overallotment of
$11.2 million, issuing 1,433,121 shares. The closing is expected to occur on August 14, 2012.
OFF-BALANCE SHEET ARRANGEMENTS
At June 30, 2012, the Corporation had no off-balance sheet arrangements.
TRANSACTIONS WITH RELATED PARTIES
For the three and six months ended June 30, 2012, the Corporation incurred approximately $0.3 million and $0.6 million of expenses
with related parties. Related parties include companies that have common directors, officers, employees and shareholders. The nature
of the expenses relate to operating and general and administrative expenses for use in the Corporation‟s PRD and DS divisions.
Amounts are unsecured, interest free and settlement occurs in cash. There have been no guarantees provided or received for any
related party receivables or payables. For the three and six months ended June 30, 2012, the Corporation has not recorded any
impairment of receivables relating to amounts owed by related parties (June 30, 2011 - Nil). This assessment is undertaken each
financial reporting period through examining the financial position of the related party and the market in which the related party
operates.
FINANCIAL INSTRUMENTS AND OTHER INSTRUMENTS
As at June 30, 2012, the Corporation‟s financial instrument assets include cash and short term deposits, accounts receivables and
accrued receivables, and other receivables. The Corporation‟s financial instrument liabilities include accounts payable and accrued
liabilities, and long term borrowings. The fair values of these financial instruments approximate their carrying amount due to the short
term maturity of these instruments. The use of financial instruments exposes the Corporation to credit, liquidity and market risk. A
discussion of how these and other risks are managed can be found in the “Business Risk” section of this MD&A. Further information
on how the fair value of financial instruments is determined is included in the “Critical accounting policies and estimates” section of
this MD&A.
There are no off-balance sheet arrangements. Of the Corporation‟s financial instruments, only accounts receivable and notes
receivable represent credit risk. The Corporation provides credit to its customers in the normal course of operations. The Corporation‟s
credit risk policy includes performing credit evaluations on its customers. Substantially all of the Corporation‟s accounts receivable
are due from companies in the oil and natural gas industry and are subject to normal industry credit risks. Management views the
credit risk related to accounts receivable as low. Funds drawn under the credit facility bear interest at a floating interest rate.
Therefore, to the extent that the Corporation borrows under this facility, the Corporation is at risk to rising interest rates. The
Corporation is also exposed to credit risk with respect to its cash and cash equivalents. However, the risk is minimized as all cash is
held at a major Canadian financial institution.
2012 Second Quarter Interim Report page 28
CRITICAL ACCOUNTING POLICES AND ESTIMATES
In the preparation of the Corporation‟s condensed consolidated interim financial statements, management has made estimates that
affect the recorded amounts of certain assets, liabilities, revenues and expenses, as well as the disclosure of commitments,
contingencies and guarantees. Estimates and judgments used are based on management‟s experience and the assumptions used are
believed to be reasonable given the circumstances that exist at the time the condensed consolidated interim financial statements are
prepared. Actual results could differ from these estimates. Please refer to the Corporation‟s consolidated financial statements for the
year ended December 31, 2011 for a complete description of the accounting policies of the Corporation. The Corporation considers
the following to be its critical accounting policies and estimates:
Depreciation, depletion and amortization
Secure has significant estimates related to the depreciation policies for property, plant and equipment. Factors that are included in the
estimates include, but are not limited to, the economic life of the asset and the residual value of the asset at the end of its economic
life. The Corporation makes an estimate based on the best information on these factors that it has at the time these estimates are
performed. The Corporation also has significant estimates related to the depletion policy for landfill cells. Factors included in the
estimation include the capacity of the cell when constructed, and the units of total capacity utilized in a period. Actual results could
differ materially if any of these factors for estimating depreciation or depletion, or amortization are different in the future than the
current estimates. The assets‟ residual values, useful lives, and methods of depreciation and amortization are reviewed at each
financial year end and adjusted prospectively, if appropriate.
Inventories
Inventories are comprised of crude oil, natural gas liquids, drilling fluids and spare parts and are measured at the lower of cost and net
realizable value. Net realizable value is the estimated selling price in the ordinary course of business, less the estimated costs
necessary to make the sale. The volume of oil held in inventory and the value of the oil in inventory will fluctuate based on the normal
capacity of the facility and the market price of crude oil and natural gas liquids in any given month. Drilling fluids inventories are
measured at the lower of cost and net realizable value, cost being determined on a weighted-average basis. The cost of drilling fluids
inventory comprises all costs of purchase, costs of conversion and other costs incurred in bringing the inventories to their present
location and condition. The amount of drilling fluids inventory held will fluctuate depending on activity levels during a given period.
The reversal of previous net realizable value write-downs to inventories is permitted when there is a subsequent increase to the value
of inventories.
Asset retirement obligations and accretion
Secure is required to provide for the cost of restoring its facility sites to an acceptable condition, as determined by regulatory
authorities. The Corporation estimates the cost to remediate, reclaim and abandon the Corporation‟s facilities based upon current
regulations, costs, technology, and industry standards. Asset retirement obligation costs associated with well sites and facilities are
recognized as a liability at fair value and are provided at the present value of expected costs to settle the obligation using estimated
cash flows and are recognized as part of the cost of that particular asset. The cash flows are discounted using a risk free rate. Accretion
is expensed as incurred and recognized in the condensed consolidated interim statement of comprehensive income as interest,
accretion and finance costs. The estimated future costs of the asset retirement obligations are reviewed at each reporting period and
adjusted as appropriate
Share-based payment transactions
The Corporation provides share-based awards to certain employees in the form of stock options and warrants. The Corporation
follows the fair-value method to record share-based payment expense with respect to stock options and warrants granted. The fair
value of each option or warrant granted is estimated based on the date of grant and a provision for the costs is provided for with a
corresponding credit to reserves in shareholders‟ equity over the vesting period of the option agreement. Share-based payment expense
associated with options issued to employees, consultants, officers and directors of the Corporation are expensed. The consideration
received by the Corporation on the exercise of share options and warrants is recorded as an increase to issued capital together with
corresponding amounts previously recognized in reserves in shareholders‟ equity. Forfeitures are estimated for each tranche, and
adjusted as required to reflect actual forfeitures that have occurred in the period. In order to record share-based payment expense, the
Corporation estimates the fair value of share options and warrants granted using assumptions related to interest rates, expected lives of
the options, volatility of the underlying security, forfeitures and expected dividend yields.
2012 Second Quarter Interim Report page 29
The Corporation has a deferred share unit (“DSU”) plan for its non-employee directors. The DSU‟s vest immediately and the fair
value of the liability and the corresponding expense is charged to profit or loss on the consolidated statements of comprehensive
income at the grant date. Subsequently, at each reporting date between the grant date and settlement date, the fair value of the liability
is revalued with any changes in the fair value recognized in profit or loss for the period on the consolidated statements of
comprehensive income. When the awards are surrendered for cash, the cash settlement paid reduces the outstanding liability. The fair
value of DSU‟s is recognized based on the market value of the Corporation‟s shares underlying these compensation programs.
Goodwill
The Corporation measures goodwill as the fair value of the consideration transferred less the net recognized amount (generally fair
value) of the identifiable assets acquired and the liabilities assumed, all measured as of the acquisition date. Since goodwill results
from the culmination of purchase accounting, it is inherently imprecise and requires judgement in the determination of the fair value
of assets and liabilities. Goodwill is allocated as of the date of the business combination to the Corporation‟s cash generating units.
Goodwill is not amortized, but is tested for impairment at least annually. An impairment loss in respect of goodwill is not reversed. On
the disposal or termination of a previously acquired business, any remaining balance of associated goodwill is included in the
determination of the gain or loss on disposal. Any goodwill balances in subsidiaries whose functional currency is not the Canadian
dollar are translated at period end exchange rates.
Intangible assets
Intangible assets acquired outside business combinations are measured on initial recognition at cost. Following initial recognition,
intangible assets are carried at cost less any accumulated amortization and any accumulated impairment losses. Internally generated
intangible assets are not capitalized and the expenditure is reflected in the consolidated interim statement of comprehensive income in
the period in which the expenditure is incurred. Intangible assets resulting from a business combination are recorded at fair value. Fair
value is estimated by management based on the expected discounted future cash flows associated with the intangible asset. Intangible
assets with a finite life are amortized over the estimated useful life and intangible assets with an indefinite life are not subject to
amortization and are tested for impairment annually. Any impairment is identified by comparing the fair value of the indefinite life
intangible asset to its carrying value. Any excess of the carrying value of the intangible asset over the implied fair value is the
impairment amount and will be charged to profit in the period of the impairment.
Current and deferred tax
Current income tax assets and liabilities for the current and prior periods are measured at the amount expected to be recovered from or
paid to the Canadian taxation authorities. The tax rates and tax laws used to compute the amount are those that are enacted or
substantively enacted, by the reporting date, in Canada where the Corporation operates and generates taxable income. Deferred tax is
provided using the liability method on temporary differences at the reporting date between the tax bases of assets and liabilities and
their carrying amounts for financial reporting purposes. Estimates of the Corporation‟s future taxable income have been considered in
assessing the utilization of available tax losses in both the current and future periods. The carrying amount of deferred tax assets are
reviewed at each reporting date and reduced to the extent that it is no longer probable that sufficient taxable profit will be available to
allow all or part of the deferred tax asset to be utilized. Unrecognized deferred tax assets are reassessed at each reporting date and are
recognized to the extent that it has become probable that future taxable profits will allow the deferred tax asset to be recovered.
Deferred tax assets and liabilities are measured at the tax rates that are expected to apply in the year when the asset is realized or the
liability is settled, based on tax rates and tax laws that have been enacted or substantively enacted at the reporting date.
Financial instruments – initial recognition and subsequent measurement
Financial assets
Financial assets within the scope of IAS 39 Financial Instruments: Recognition and Measurement are classified as financial assets at
fair value through profit or loss, loans and receivables, or as derivatives designated as hedging instruments in an effective hedge, as
appropriate. The Corporation determines the classification of its financial assets at initial recognition. All financial assets are
recognized initially at fair value. Investments not recognized at fair value through profit or loss are recognized at fair value plus
directly attributable transaction costs. The Corporation‟s financial assets include cash and short term deposits, accounts receivable and
accrued receivables, other receivables and notes receivable. The subsequent measurement of financial assets depends on their
classification.
2012 Second Quarter Interim Report page 30
Financial liabilities
Financial liabilities within the scope of IAS 39 Financial Instruments: Recognition and Measurement are classified as financial
liabilities at fair value through profit or loss, other financial liabilities, or as derivatives designated as hedging instruments in an
effective hedge, as appropriate. The Corporation determines the classification of its financial liabilities at initial recognition. All
financial liabilities are recognized initially at fair value. Other financial liabilities are recognized at fair value plus directly attributable
transaction costs. The Corporation‟s financial liabilities include, accounts payable and accrued liabilities, and long term borrowings.
The subsequent measurement of financial liabilities depends on their classification.
Fair value of financial instruments
For financial instruments not traded in an active market, the fair value is determined using appropriate valuation techniques. Such
techniques may include using recent arm‟s length market transactions; reference to the current fair value of another instrument that is
substantially the same; discounted cash flow analysis; or other valuation models. The Corporation has classified its financial
instrument fair values based on the required three- level hierarchy:
Level 1: Valuations based on quoted prices in active markets for identical assets or liabilities;
Level 2: Valuations based on observable inputs other than quoted active market prices; and,
Level 3: Valuations based on significant inputs that are not derived from observable market data, such as discounted cash flows
methods.
Cash and short term deposits are recorded at fair value under level 1. The fair value hierarchy level at which a fair value measurement
is categorized is determined on the basis of the lowest level input that is significant to the fair value measurement in its entirety.
Provisions
Provisions are recognized when the Corporation has a present obligation, legal or constructive, as a result of a past event, it is probable
that an outflow of resources embodying economic benefits will be required to settle the obligation, and a reliable estimate can be made
of the amount of the obligation. Where the Corporation expects some or all of a provision to be reimbursed, for example under an
insurance contract, the reimbursement is recognized as a separate asset but only when the reimbursement is virtually certain. The
expense relating to any provision is presented in the consolidated statement of comprehensive income net of any reimbursement. If the
effect of the time value of money is material, provisions are discounted using a risk free rate that reflects the risks specific to the
liability. Where discounting is used, the increase in the provision due to the passage of time is recognized as a finance cost.
FUTURE ACCOUNTING PRONOUNCEMENTS
At the date of authorization of the consolidated financial statements, certain new standards, amendments and interpretations to existing
IFRS standards have been published but are not yet effective, and have not been adopted early by the Corporation. Management
anticipates that all of the pronouncements will be adopted in the Corporation‟s accounting policies for the first period beginning after
the effective date of the pronouncement. Information on new standards, amendments and interpretations that are expected to be
relevant to the Corporation‟s consolidated financial statements is provided below. Certain other new standards and interpretations
have been issued but are not expected to have a material impact on the Corporation‟s consolidated financial statements.
In 2010, the IASB issued IFRS 9 Financial Instruments, which addresses the classification and measurement of financial assets. The
new standard defines two instead of four measurement categories for financial assets, with classification to be based partly on the
Corporation‟s business model and partly on the characteristics of the contractual cash flows from the respective financial asset. An
embedded derivative in a structured product will no longer have to be assessed for possible separate accounting treatment unless the
host is a non-financial contract. A hybrid contract that includes a financial host must be classified and measured in its entirety.
Application of IFRS 9 is mandatory for financial periods beginning on or after January 1, 2013. The new standard is not expected to
have a material impact on the presentation of the Corporation‟s financial position and results of operations.
In May 2011, the IASB issued IFRS 10 Consolidated Financial Statements, which supercedes IAS 27 Consolidation and Separate
Financial Statements and SIC-12 Consolidation – Special Purpose Entities. This standard provides a single model to be applied in
control analysis for all investees, including special purpose entities. IFRS 10 is effective for annual periods beginning on or after
January 1, 2013, with earlier application permitted. The Corporation is currently assessing the impact, if any, that the adoption of this
standard will have on its consolidated financial statements.
In May 2011, the IASB issued IFRS 11 Joint Arrangements, which will supersede existing IAS 31 Joint Ventures effective for annual
periods beginning on or after January 1, 2013, with early application permitted. IFRS 11 provides for the accounting of joint
arrangements by focusing on the rights and obligations of the arrangement, rather than its legal form (as is currently the case). The
standard also eliminates the option to account for jointly controlled entities using the proportionate consolidation method. The
2012 Second Quarter Interim Report page 31
Corporation is currently assessing the impact, if any, that the adoption of this standard will have in its consolidated financial
statements.
In May 2011, the IASB issued IFRS 12 Disclosure of Interests in Other Entities, which is a new and comprehensive standard on
disclosure requirements for all forms of interests in other entities, including subsidiaries, joint arrangements, associates and
unconsolidated structured entities. IFRS 12 is effective for annual periods beginning on or after January 1, 2013, with earlier
application permitted. The Corporation is currently assessing the impact, if any, that the adoption of this standard will have in its
consolidated financial statements.
In May 2011, the IASB published IFRS 13 Fair Value Measurement, which is effective prospectively for annual periods beginning on
or after January 1, 2013. IFRS 13 replaces fair value measurement guidance contained in individual IFRSs, providing a single source
of fair value measurement guidance. The standard provides a framework for measuring fair value and establishes new disclosure
requirements to enable readers to assess the methods and inputs used to develop fair value measurements and for recurring valuations
that are subject to measurement uncertainty and the effect of those measurements on the financial statements. The Corporation is
currently assessing the impact, if any, that the adoption of this standard will have in its consolidated financial statements.
In May 2011, the IASB published IAS 28 Investments in Associates and Joint Ventures, which are effective for annual periods
beginning on or after January 1, 2013 with early adoption permitted. Amendments to IAS 28 provide additional guidance applicable to
accounting for interests in joint ventures or associates when a portion of an interest is classified as held for sale or when the
Corporation ceases to have joint control or significant influence over an associate or joint venture. When joint control or significant
influence over an associate or joint venture ceases, the Corporation will no longer be required to remeasure the investment at that date.
When a portion of an interest in a joint venture or associate is classified as held for sale, the portion not classified as held for sale shall
be accounted for using the equity method of accounting until the sale is completed at which time the interest is reassessed for
prospective accounting treatment. The amendments to the standard are not expected to have a material impact on the presentation of
the Corporation‟s financial position and results of operations.
In June 2011, the IASB issued IAS 1 Presentation of Items of OCI: Amendments to IAS 1 Presentation of Financial Statements. The
amendments stipulate the presentation of net earnings and OCI and also require the Corporation to group items within OCI based on
whether the items may be subsequently reclassified to profit or loss. Amendments to IAS 1 are effective for the Corporation beginning
on January 1, 2012 with retrospective application and early adoption permitted. The adoption of the amendments to this standard is not
expected to have a material impact on the Corporation‟s consolidated financial statements.
In December 2011, the IASB issued amendments to IFRS 7, “Financial Instruments: Disclosures” and IAS 32, “Financial
Instruments: Presentation” to clarify the current offsetting model and develop common disclosure requirements to enhance the
understanding of the potential effects of offsetting arrangements. Amendments to IFRS 7 are effective for the Corporation on January
1, 2013 with required retrospective application and early adoption permitted. Amendments to IAS 32 are effective for the Corporation
on January 1, 2014 with required retrospective application and early adoption permitted. The adoption of these amended standards is
not expected to have a material impact on the Corporation‟s consolidated financial statements.
INTERNAL CONTROLS OVER FINANCIAL REPORTING & DISCLOSURE CONTROLS AND PROCEDURES
Management has evaluated disclosure controls and procedures to provide a reasonable level of assurance that material information
relating to the Corporation is made known to the Chief Executive Officer and the Chief Financial Officer by others within the
Corporation, particularly during the period in which the annual and interim filings of the Corporation are being prepared, in an
accurate and timely manner in order for the Corporation to comply with its disclosure and financial reporting obligations. Consistent
with the concept of reasonable assurance, the Corporation recognizes that the relative cost of maintaining these controls and
procedures should not exceed their expected benefits. As such, the Corporation‟s disclosure controls and procedures can only provide
reasonable assurance, and not absolute assurance, that the objectives of such controls and procedures are met.
The Chief Executive Officer and Chief Financial Officer of the Corporation are responsible for establishing and maintaining adequate
internal control over financial reporting to provide reasonable assurance regarding the reliability of financial reporting and the
preparation of financial statements for external purposes in accordance with IFRS. While management of the Corporation has put in
place certain plans and procedures to mitigate the risk of a material misstatement in the Corporation‟s financial reporting, a system of
internal controls can provide only reasonable, not absolute, assurance that the objectives of the control system are met, no matter how
well conceived or operated. No changes were made to the Corporation‟s internal control over financial reporting during the three and
six months ended June 30, 2012 that have materially affected, or are reasonably likely to materially affect, the Corporation‟s internal
control over financial reporting.
2012 Second Quarter Interim Report page 32
LEGAL PROCEEDINGS AND REGULATORY ACTIONS
On December 21, 2007, Tervita Corporation (formerly known as CCS Inc.) (“Tervita”) filed a statement of claim commencing Action
No. 0701-13328 (the “Tervita Action”) in the Judicial District of Calgary of the Court of Queen‟s Bench of Alberta (the “Court”)
against the Corporation, certain of the Corporation‟s employees who were previously employed by Tervita (collectively, the “Secure
Defendants”) and others in which Tervita alleges that the defendants misappropriated business opportunities, misused confidential
information, breached fiduciary duties owed to Tervita, and conspired with one another. Tervita seeks damages in the amount of
$110.0 million, an accounting and disgorgement of all profits earned by the Corporation since its incorporation and other associated
relief.
A statement of defence was filed by the Secure Defendants on November 10, 2008, after the Court ordered Tervita to provide further
particulars of its claim. The Secure Defendants then filed an Amended Statement of Defence (the “Defence”), and the Corporation
filed an Amended Counterclaim (the “Counterclaim”), on October 9, 2009. In their Defence, the Secure Defendants deny all of the
allegations made against them. In its Counterclaim, the Corporation claims damages in the amount of $37.9 million against Tervita,
alleging that Tervita has engaged in conduct constituting a breach of the Competition Act (Canada) and unlawful interference with the
economic relations of the Corporation with the intent of causing injury to the Corporation. The Corporation is currently seeking
permission to amend the amount of the Counterclaim to $97.8 million.
Examinations for discovery began in 2010 and will continue through 2013. The Corporation intends to continue to defend against the
Tervita Claim and to prosecute the Counterclaim.
ADDITIONAL INFORMATION
Additional information, including Secure‟s AIF, is available on SEDAR at www.sedar.com and on the Corporation‟s website at
www.secure-energy.ca