Embed Size (px)
Citation preview

Special Publication SJ95-SP5
MANAGEMENT EFFECT ONIRRIGATION WATER USE
FOR POTATO FARMSOF NORTH FLORIDA
Prepared by
University of FloridaInstitute of Food and Agricultural Sciences
Food and Resource Economics DepartmentGainesville, Florida
Prepared for
St. Johns River Water Management DistrictPalatka, Florida
1995

Special Publication SJ95-SP5
MANAGEMENT EFFECT ON IRRIGATION WATER USE FOR POTATOFARMS OF NORTH FLORIDA
by
Austin TrippenseePatrick Byrne
William BoggessAlan Smajstrla*
July 1995
*The authors are respectively Graduate Research Assistant, Assistant Professor, and Professor,Food and Resource Economics Department, and Professor, Department of AgriculturalEngineering, University of Florida.

EXECUTIVE SUMMARY
Approximately 29,500 acres of potatoes are grown in the tri-county area of St. Johns,
Putnam, and Flagler counties. The majority of this acreage is located in St. John's county. The major
water use in St. Johns County is agriculture with an average daily usage of 35.57 million gallons per
day. In 1994, the St. Johns River Water Management District (SJRWMD) identified St. Johns
County as a "Water Resource Caution Area" based on findings of the report, "Waste Supply Needs
and Sources Assessment." The purpose of this study was to determine key factors that influence
water usage among potato farms in this tri-county area. Previous efforts have been limited to
analyzing physical characteristics, such as soil type and plant age. This research effort analyzes<
management and production techniques, as well as the aforementioned physical characteristics, to
achieve a more comprehensive understanding of irrigation water use for potatoes.
Information for this study was collected from three sources: 1) SJRWMD Benchmark Farm
Project; 2) STATGO soil maps; and 3) a comprehensive potato grower survey where 62 of 69
identified growers were interviewed for the study. Surveys were conducted through a live interview
format. The questionnaire contained 77 questions dealing with such topics as: general farm
information; farm operator information; pest management and fertilization practices; irrigation
management and decision criteria; planting characteristics; general management information; and
grower opinions on the future of potato production. Interviews would typically take about 45
minutes each to complete. Individual grower responses were kept confidential.
The survey revealed that potato acreage has increased 10 percent over the last 5 years. Most
growers use a seep, semi-closed pipeline distribution system for potato irrigation. Physical
characteristics of the actual systems are similar between growers. Most growers use some form of
sensory observation (e.g., sight and/or fed) to verify irrigation effectiveness, rather than a mechanical

form (e.g., tensiometer). Specifically, 96.8 percent of growers use soil appearance as an indicator
of irrigation effectiveness. The bulk of potatoes (76.5 percent) were planted between the middle of
January and the middle of February. Planting dates are driven by variety and market forces, as
opposed to irrigation concerns. Growers plant in hopes of harvesting during desirable potato price
periods or to fulfill forward contracts.
There were some observed differences between growers with respect to management
practices. Many growers do shut off the irrigation system based on rain expectations, but the amount
of expected rainfall needed for shutoff and the shutoff timing varied between growers. There were
also variations in delay time to restart irrigation after an actual rainfall. In a typical rainfall year,
approximately 35 percent of the growers will not start up the irrigation system for at least 30 days
after planting, while almost two-thirds of the growers will start up within 30 days. These differences
in management practices were of particular interest for analysis of factors that affect water usage on
these North Florida potato farms.
Over 40 percent of the growers could not comfortably recall or estimate their electricity
expenditures for pumping irrigation water. Water distribution costs represent only 1 to 2 percent of
total costs per acre for potato production. As a result, growers view water as a low-cost risk
reducing input. Growers are more concerned with the soil drying out to a critical level where yield
and plant vigor would be significantly impacted then they are with over-irrigation. Use of water is
valuable to the farmer for two reasons: 1) helps minimize yield risk; and 2) improves return
potential. Growers are using several water conservation components in their systems, such as furrow
and ditch risers, land leveling, and closed pipe distribution. In general, growers do not appear to be
very optimistic about the technical feasibility of irrigation alternatives, and they are even less
optimistic with regard to the economic feasibility of irrigation alternatives.

The analysis portion of this study demonstrates that water use was significantly affected by
soil type, planting date, irrigation start up timing, irrigation shut off and restart criteria, irrigation shut
off with respect to harvest, and grower familiarity with energy costs for pumping water. Soil types
that required a greater quantity of water represent only 3 percent of the sample acreage. Planting
date decisions do not ordinarily rely on irrigation concerns. Also, the shut off timing before harvest
is determined by potato type. Delaying irrigation start up to at least 30 days post-plant does
significantly reduce water consumption. This decision is frequently based on weather rather than
management decisions. Later planting dates result in a wanner growing season that may have higher
moisture needs during the early growth stages. Shutting off the irrigation system based on rainfall<
expectations does reduce the water consumption, as does a longer restart delay after actual rainfall.
These decisions are most likely based on specific site characteristics and the grower's level of risk
aversion. Finally, growers who are aware of their energy expenditures for pumping irrigation water
tend to use significantly less irrigation water than those growers who are not readily aware of these
expenditures. While the relative proportion of costs is low, the absolute amount of energy
expenditures is estimated to be almost 8 thousand dollars per grower. Li summary, some educational
efforts may heighten grower awareness of those factors which significantly impact water use, but
there would seem to be greater potential benefits to finding a new type of irrigation system or
modifications to the current system. This new system or modification would have to be cost-effective
and manageable for the grower.
This study also recommends some additional information that should be included in the
Benchmark Farm Program to increase future understanding and monitor evolving trends of water
usage.

ACKNOWLEDGEMENTS
EXECUTIVE SUMMARY
INTRODUCTION 1Background 1Objectives 4
THEORY 5Irrigation Systems 5Factors that Affect Water Use 7Previous Work 12
PROCEDURES 14Questionnaire Design and Development 14Interviewing Process 14Data Handling and Summary Procedures .15Statistical Analysis Procedures .-. 16
POTATO PRODUCTION AND IRRIGATION QUESTIONNAIRE 18General Information 19Farm Operator Information 21Pest Management Practices 23Fertilization Practices 24Irrigation Management Information 26Specific Field Information 29Planting Characteristics 33Management Information 35Future of Potato Production 40
WATER USE MODELS AND EMPIRICAL RESULTS 42BaseModel 43Base Model Results 45Management Model 46Management Model Results 49
CLOSING COMMENTS 52Limitations 53Conclusions and Recommendations 54
REFERENCES 58
SAMPLE QUESTIONNAIRE

LIST OF TABLES
Table 1: 1992 Water Use by Category 3
Table 2: Crops Included in Estimates of Water Use for Agricultural Irrigation 3
Table 3: Average Change in Potato Acreage over the Last Five Years 21
Table 4: Fertilizer Applications 25
Table 5: Descriptive Statistics for Base Model 45
Table 6: Regression Results for Water Use Base Model 46
Table 7: Descriptive Statistics for Water Use Management Model 49
Table 8: Regression Results for Water Use Management Model 51
LIST OF FIGURES
Figure 1: Average Gross Acres of Potato Production 19
Figure 2: Average Yields by Potato Type 20
Figure 3: Potato Farm Acreage Today vs Five Years Ago by Grower 21
Figure 4: Highest Level of Education Attained by Grower 22
Figure 5: Grower Sources for Information 22
Figure 6: Proportion of Potato Growers that Use the Telephone Blight Advisory . . . 23
Figure 7: Proportion of Acreage Maintained with Cover Crop 24
Figure 8: Potato Irrigation Check Systems 26
Figure 9: Soil Appearance Criteria for Irrigation Check 27
Figure 10: Potato Irrigation Systems in North Florida 27
Figure 11: Types of Pumps for Potato Irrigation 28

LIST OF FIGURES (cont.)
Figure 12: Specific Field Slope Verification Procedures 30
Figure 13: Proportion of Row Heights for Specific Fields 31
Figure 14: Well Casing Diameters for Specific Fields 31
Figure 15: Pump Types for Specific Fields 32
Figure 16: Potato Planting Dates 33
Figure 17: Frequency of Pre-Plant Irrigation in Last Ten Years 33
Figure 18: Irrigation Delay After Planting 34
Figure 19: Potato Harvest Dates : 35
Figure 20: Record Keeping for Fertilizer, Yield, and Pesticides by Field 36
Figure 21: Irrigation and Crop Age 36
Figure 22: Average Delay in Restarting Irrigation Based on Actual Rainfall 37
Figure 23: Criteria for Restarting Irrigation 38
Figure 24: Conservation Measures Used by Potato Growers 38
Figure 25: Technical and Economic Feasibility of Conservation Practices According toPotato Growers 39
Figure 26: Importance of Various Factors on the Future of Florida Potato Production 40

ACKNOWLEDGEMENTS
The authors wish to express their appreciation to the Saint Johns River Water Management
District (SIRWMD) for funding this project. Special thanks to Cynthia Moore and Vince Singleton
of the SJRWMD for their invaluable assistance and interest in this research effort. We extend our
sincere appreciation to Austin Tilton for his time and energy in setting up this project, as well as to
Jim Dilbeck and Dan Schrader. Finally, we would like to thank the growers for taking the time to
talk with us about their operations and concerns. We appreciate their candor, frankness, and
hospitality with respect to this project.

INTRODUCTION
Background
Water resource management has become a major concern in the State of Florida. In response,
the Florida Legislature passed the Water Resources Act in 1972. This act provides the framework
for Florida's water management system and establishes the water management districts. After a
statewide referendum in 1976, the district's governing boards obtained the ability to levy taxes. The
Water Resources Act has been amended several times, but the structure has gone mostly unchanged
(St. Johns River Water Management District).
The St. Johns River Water Management District (SJRWMD), located in Northeast Florida,
is one of the five water management districts in the state. The district consists of all or part of 19
counties. Within the district, there are 3,500 lakes, 56 springs, 12,400 square miles, and an estimated
population of 3.3 million people (St. Johns River Water Management District).
The mission of the St. Johns River Water Management District is "to manage water resources
to insure their continued availability while maximizing environmental and economic benefits"
(Singleton 1990, ii). The district accomplishes this mission through regulation; applied research;
assistance to federal, state, and local governments; operation and maintenance of water control
works; and land acquisition and management (Singleton 1990).
Over the past few years, conflicts related to water resources in Northeast Florida have
increased. Increases in resident population have resulted in an increased demand in water
consumption. Also, recent years have had below-average rainfall amounts. These factors have
affected the recharge of groundwater resources, causing decreases in the amount of water available.

Residents along the St. Johns River have reported that some wells that were formerly free-flowing
artesian now require pumps, and some wells dry up periodically. These concerns have led the water
management district to study the users and uses of water in this area. As shown in table 1, the major
users of water for the St. Johns River Water Management District are agriculture, public supply, and
commercial and industrial self-supply. Within agriculture, the three major crop types were fruit crops
(44 percent), ornamental/turf (27 percent), and vegetables (22 percent) (Florence 1995). Table 2 lists
the crops included in each crop category.
The potato industry in North Florida is located primarily in St. Johns, Putnam, and Flagler
counties. This three county area covers over 1.16 million acres with an average daily water-«•
withdrawal of 171.6 million gallons. Agriculture accounts for 35 percent of total water usage
(Florence 1995). For the 1994 growing season there were approximately 29,500 planted acres of
potatoes in North Florida (Vegetable Summary 1993-1994).
In Flagler County, the major use of water was for agricultural irrigation (8.02 million gallons
per day). Agriculture in Putnam County used 17.38 million gallons per day (Florence 1995). In St.
Johns County, the major user of water was agriculture with 35.57 million gallons per day.
In 1994, the St. Johns River Water Management District (SJRWMD) completed the "Waste
Supply Needs and Sources Assessment." In accordance with the requirements of the Needs and
Source Assessment, SJRWMD identified "Water Resource Caution Areas" within the District, as
areas where future water supply needs may be difficult to meet without incurring undesirable
environmental impacts. One of these areas is located in St. Johns County. The major agricultural
crop grown in this area is the potato.

Table 1: 1992 Water Use by Category (in million gallons per day), St. Johns River WaterManagement District.
Category
Public supply
Domestic self-supply
Commercial/industrial self-supply
Agricultural irrigation
Recreational irrigation
Thermoelectric power generation
Abandoned artesian wells
Total
Total
424.63
84.92
148.20
624.60
17.44
136.43
75.67
1511.89Source: Florence 1995, p. 12.
Table 2: Crops Included in Estimates of Water Use for Agricultural Irrigation
Vegetable Crops
Cabbage
Carrots
Cucumbers
Peppers
Potatoes
Tomatoes
Sweet corn
Watercress
Miscellaneous vegetables
Fruit Crops
Blueberries
Citrus
Ornamental
Peaches
Pecans
Strawberries
Watermelons
Miscellaneous fruits
Ornamental and Grasses
Ferns
Flowers and foliage
Woody ornamental
Improved pasture
Sod
Source: Florence 1995, p. 7.
Li early 1980, the St. Johns River Water Management District initiated a "Benchmark Farm"
Program. This program was designed to collect technical data on agricultural water use, including

potatoes. To collect information, potato growers were asked to voluntarily participate in the
Benchmark Farm program to form a network of potato production water use monitoring sites. At
each she, a flow meter was placed on a well and information was collected by St. Johns River Water
Management District personnel. There are currently a total of 55 sites for potatoes in the program.
These sites are located in Putnam, St. Johns, and Flagler counties (Lhtell and Portier 1994). Data
have been collected for these sites from 1990 through 1994.
In June 1994, Dr. R. Littell and Dr. K. Portier conducted an analysis on four years of data
collected in the Benchmark Farm Program for potatoes (Littell and Portier 1994). These data only
contained technical and climatic information. The objective of their analysis"... was to quantify the
temporal and spatial variability of water pumped and, using statistical analysis techniques, determine
whether and what fraction of this variability could be attributed to variation in site (agronomic) or
environmental (rainfall) parameters" (Lhtell and Portier 1994, p. 3). Management practices were not
used to explain variations in water consumption. By increasing the amount of information contained
in the model, the model could explain more of the variation observed in the amount of water pumped
for potato irrigation.
Objectives
The purpose of this study was to determine key factors that influence water usage among
potato farms in Flagler, Putnam, and St. Johns counties. Specific objectives were as follows:
1. To collect information from potato growers with regard to management andproduction techniques, as well as differences in site characteristics.
2. To determine which factors account for variations in irrigation water use.

3. To provide implications and recommendations to the St. Johns River WaterManagement District as to how management, production, and site characteristiceffects may be used to improve the management of available water resources.
THEORY
Irrigation Systems
Currently, growers use a water furrow system to distribute irrigation water to the potato
plants. This system is commonly referred to as a sub-irrigation system. Water furrows are typically
spaced 60 feet apart between planted rows. There are approximately 16 rows of potatoes between
the water furrows. These rows range in height from approximately 8 to 14 inches. The water from
the furrows is distributed laterally to the potato beds (Hensel 1964). Moisture reaches the plant roots
through capillary movement upward (Fox et al. 1956).
The main requirements for this type of system to be practical and successful are as follows:
1. The surface soil must be of uniform texture, deep, and highly permeable.
2. There must be a natural high water table or a restricting layer in the soil profile uponwhich a perched or temporary water table can be developed at a reasonable depthbelow the normal foot zone of the crops.
3. The land surface must be smooth with a gentle slope.
4. The restricting layer in the soil profile must be reasonably parallel with the groundsurface.
5. During the growing season, the water table must be controlled within certain limits,depending upon the crop-growth cycle.
6. Adjacent fanners must agree as to the desirable position of the water table fordifferent times during the season. Thus, sub-irrigation may require special communitycooperation (Fox et al. 1956).

The tri-county area, in which potatoes are grown, is known to have a water table that comes within
a couple feet of the surface. The irrigation process works by artificially raising the water level. Water
is pumped into the water furrows and allowed to seep out and feed the water table. The depth of the
water table should be controlled approximately 9 inches below the bottom of the alley in the middle
of the bed between water furrows (Hensel 1964).
For irrigating potatoes in the tri-county area, there are two main system types. Semi-closed
pipeline seepage irrigation is the most widely used system in the area. The other type of irrigation
system is an open ditch seepage irrigation system.
In a semi-closed pipeline system, water is pumped from a well into a distribution pipeline.«•
This pipeline then carries the water to the individual furrows. At each furrow there is a nozzle or
valve through which the water is transferred to an open water furrow. The growers who have
installed valves at the water furrows can adjust these valves to control how much water is applied to
an individual furrow. An open ditch system uses a well to pump water directly into the ditch which
is used to carry water to the individual water furrows.
Drainage ditches around the perimeter of the fields are used to carry off excess water that can
occur due to a storm event. On the end of the field opposite where water is distributed into the water
furrows is another ditch which has a water control structure. The water control structures aid the
grower in maintaining proper moisture levels in the field. Some growers may also build earthen dams,
lined with plastic, in the water furrow to control water levels in the field.
The growers use centrifugal, turbine, and submersible pumps to withdrawal water from their
wells. All of the pumps use electricity as the power source. The flow rate on a gallons per acre per

minute basis is very low (approximately 6 gallons per acre per minute). Because of this low flow rate,
most growers operate their pumps 24 hours per day to keep up with the needs of the potato plants.
Factors Affecting Water Use
Factors that affect the quantity of water required by a particular field include site,
management, and production characteristics.
The main site specific characteristics include soil and field preparation characteristics. The
soil characteristics that affect water usage are the depth, texture, and permeability of the soil.
Properties of the soil that affect these characteristics include the.content of organic matter, soil
texture, bulk density, and soil structure (Soil Survey of St. Johns County 1983).
Field preparation can differ between fields. One factor is the slope of the field. The most
important measurement is the slope of the field. As the slope of the field increases, water will pass
through the field more quickly and the ability of the water to be retained in the field decreases. This
incidence increases the demand for water. Field preparation also includes the spacing of water
furrows, the height of the planted rows, the depth of the water furrows, and the design of perimeter
ditches.
Management and production factors include the decision rules used by the grower to
determine when to turn on and off the irrigation systems, when the grower plants and harvests the
fields, and how precisely the grower monitors the inputs required for the production process.
Obviously, the longer a grower operates the pumps the more water they will use. The factors
that affect when a grower turns on the system include: the age of the plant; the soil moisture levels
in the field, water furrows, and drainage structures; fertilization schedules; pest management

procedures; and weather conditions. Factors that would affect when a grower turns off the irrigation
system include: expected rainfall; actual rainfall; soil moisture levels in the field, water furrows, and
drainage structures; and harvesting schedules.
Another explanation for differences in water usage could be the grower's risk perception. It
is known that water is a very critical input in the production process. Irrigation water could be
considered a risk-reducing input to the production process.
For the 1994 growing season the average yield was 225 hundred weights (cwt.) per acre for
the Hastings area (Smith and Taylor). Using a five year (1988-1993) average of $9.58 per cwt., the
average value for an acre of potatoes is $2,155 (Vegetable Summary 1992-1993,1994). The average
pre-harvest costs per acre were $1,623.81, with fixed costs of $436 per acre, and variable costs of
$1,188 per acre (Smith and Taylor). Growers spend an estimated $10 to $20 per acre for electricity
to operate their pumps, representing only 1 to 2 percent of variable costs.
For profit maximization the grower will maximize the following equation,
Y=pq-C(q>B
where
Y = profitp = output priceq = outputC(q>= variable costB = fixed cost.
This equation has the first-order condition
P=C'(q).
Under perfect competition, the first-order condition requires marginal revenue equal marginal cost.
8

If one assumes that water is the only input of interest, the profit maximization equation can
be represented by the following equation,
(v)-rv-B
where
Y- profitp - output pricef(w) = production function for potatoes with respect to waterr - marginal cost of waterw = quantity of water.
The first order condition for this equation would be
pf(w)=r.
This first order condition implies the price of the output times the marginal product (marginal revenue
product) for an input will equal the marginal cost for that input (Robison and Barry 1987).
Since the cost of pumping water is very low when compared to the value of the crop, the
profit maximizing level of water use will occur at a point where the marginal product of water is quite
low. The marginal product for water decreases as the amount of water pumped increases. Hence,
the level of water use will be relatively high under the profit maximization paradigm.
Under yield maximization, the grower will maximize output. The grower will use an input
until the marginal product for that input is equal to zero. Therefore it can be shown that under profit
maximization or yield maximization the value of the marginal products are similar, indicating that the
optimal levels of water use under either maximization strategy are about equal.
An important objective met by pumping water for irrigating potatoes is to reduce the risk
associated with output. Under expected utility maximization, a grower will use inputs in

combinations that provide the maximum level of utility. The utility for a grower is affected by the
amount of profit received by the grower for a level of risk. The level of risk a grower faces is directly
related to the amount of variance associated with the output A grower who is risk averse will accept
reduced profits for a decrease in the variability of his profits.
Applying this concept to profit maximization gives the optimal output under risk for a grower
as the certainty equivalent. A certainty equivalent can be defined as the return on a risk-free
investment, equaled to the expected return on the risky investment less the risk premium (Robison
and Barry 1987). The equilibrium point for the certainty equivalent is determined by the tangency
between an iso-expected utility line and an expected value-variance set. The expected value-variance
set is defined as the choices or sets of choices that provide minimum variance for alternative levels
of expected returns (Robison and Barry 1987). The certainty equivalent can be expressed by the
following equation,
where
YCE~ certainty equivalent outputp - output pricef(w) = production function for waterr = variable cost for waterA. » measure of risk aversion62
e = variance of the error.
The first-order condition for the certainty equivalent is
pf(w)-r-A,p2f(w)f(w)62e=0.
10

So long as the marginal cost for the input is positive the output satisfying the first-order condition
under risk will be less than the corresponding output under profit maximization. The difference
between the two levels of output will be equal to Ap^w^^^ which represents the cost of risk. The
cost of risk can be explained as costs the firm would willingly forgo from its expected profits if the
difference were received with certainty (Robison and Barry 1987).
Risk can be associated to the moisture levels in the soil. Plant stress as a result of insufficient
moisture levels in the soil negatively affects the yield. Growers may use pumped irrigation water as
a cheap insurance policy to guard against decreases in yield as a result of stress caused by insufficient
moisture levels in the soil. Using water in this manner will decrease the variability in the .output
causing the utility of the grower to increase. The grower faces little economic incentive to conserve
water under the current system.
The amount of risk caused by decreased moisture levels in the soil will be different for every
grower. One would expect that if the grower had a large capacity and could replenish the moisture
levels in the field rapidly, the risk level would be low. Also, the soil type for a given field will affect
the rate water can seep into the soil. If the grower had an irrigation system that could not replenish
the moisture level in the soil once the moisture level dropped below a certain level, the grower would
have a higher risk level. This higher risk level would cause the grower to pump more water.
Consequently risk averse growers will use more water than profit maximizing (risk neutral) growers
under this scenario.
11
Previous Work
The only previous work conducted, with regard to irrigation water usage in potatoes in North
Florida, was the work reported by Littell and Portier in 1994. Their analysis used data on potatoes
collected by the Benchmark Farm Program over a four year period beginning in 1989.
The Benchmark Farm Program collected data on the amount of water pumped for potatoes
using flow meters installed at the well heads. As a back-up, data was collected from the electrical
meters for the pumps. This electrical meter data could be used to impute the amount of water
pumped, if the flow meter broke or malfunctioned. A data quality variable was inserted into the
database to identify readings that were estimated or inaccurate. The Benchmark Farm database also
contained information on: the date the field was planted; the 'date the flow-meter and time-meter
were read; rainfall; field soil information, size, and location.
Littell and Portier chose to use a regression technique that analyzed both the time-series and
cross-sectional differences between Benchmark Farm sites. The model from their work was
where:
W = acre inches of water pumped per acret = time periodi = siteA = crop-ageM = month in which the reading was taken
(l=January, 2=February, etc.)S = soil series dummy variable
(1-St Johns, 0=other).
12

The crop-age and month factors included all of the product and cross-product terms. This model was
selected as the best model because this combination of variable provided the highest R-square with
the fewest amount of parameters (Littell and Portier 1994).
In theory, as the plant gets older the amount of water required by the plant should increase.
This increase will cause the crop-age variable to have a positive effect on the amount of water
required. As the observation period moves further into the year, the average daily temperature
increases along with the amount of daylight. The month variable will have a positive effect on the
amount of water pumped for irrigation. Water will pass through and be retained in different soils at
different rates. A variable for differences in soil characteristics will account for differences between•4'
soils.
The model used by Littell and Portier had an R-square of 0.618 and all of the coefficients
except for the one associated with the crop-age squared term were statistically significant. The most
significant effect from their model was for the dummy variable for whether the soil series was called
St. Johns. The model showed that if the soil series for the field was called St. Johns, the field used
3.07 acre inches of water per acre less per month than the other fields (Littell and Portier 1994).. The
Littell and Portier study also demonstrated that planting date had a significant effect on the amount
of water pumped for irrigation purposes.
The limitations to this work were that the model did not account for differences in
management and production practices. In addition, the Littell and Portier study only had one field
that had a soil series called St. Johns. It cannot be said that the effect is due to soil characteristics.
13

PROCEDURES
Questionnaire Design and Development
The purpose of the questionnaire was to collect management, production, and site information
from individual potato growers. The framework for the questionnaire came from a Fernery
Management Survey (Boggess et al. 1991). With the help of Dr. Pat Byrne, Dr. Bill Boggess, Dr.
Allen Smajstrla, Dr. Dale Hensel, Austin Tilton (Extension Director - Putnam County), Jim Dilbeck
(Extension Director - St. Johns County), and Dan Schrader (Extension Director • Flagler County)
the fen survey was revised to apply to the potato industry in North Florida. The questionnaire was
organized into sections that pertain to general farm information, farm operator information, pest
management practices, fertilization practices, irrigation management information, specific field
information, farm management information, and information dealing with the future of potato
production.
The questionnaire was reviewed by the St. Johns River Water Management District personnel,
county agents from the respective counties, and Hastings Research Center Personnel. Two growers
were selected to pre-test the questionnaire. The goals of the questionnaire were explained to the
growers who were then interviewed using the questionnaire. After being interviewed, the growers
were asked to comment on the questionnaire and about how improvements could be made to the
questionnaire. After all comments had been noted the questionnaire was finalized. (A copy of the
final questionnaire is in Appendix A.)
Interviewing Process
Names, addresses, and phone numbers for potato growers were collected from the county
extension offices for the three counties. After identifying relationships between growers, it was
14

determined there were 69 farms or farming operations in the three county area, made up of
approximately 90 individuals.
A letter explaining the questionnaire and uses of the information to be collected was mailed
to everyone on the revised potato grower list. Approximately two weeks later representatives from
the Institute of Food and Agricultural Sciences went to a North Florida Growers Exchange meeting
at the Putnam County Extension Office. At this meeting, the representatives discussed with the
growers who was conducting the research, for whom the research was being done, who would have
access to the information, and what were the goals of the research. The growers asked questions
concerning why they should participate and possible effects of the/esearch.
Personal interviews were used to collect the questionnaires from the growers. All interviews
were conducted by the same person and in the same manner. The questionnaire was collected by
personally interviewing a representative from each farm or fanning operation. The interview
consisted of the grower identifying the fields he grew potatoes on in the 1994 growing season and
answering questions on a written questionnaire. Responses to the questionnaire were recorded by
the interviewer.
The St. Johns River Water Management District assisted in the data collection process by
providing maps containing all of the potato fields in the tri-county area with field identification
numbers and a computer database containing the respective soil characteristics.
Data Handling and Summary Procedures
The responses to the questionnaire were entered into a computer using Questionnaire
Programming Language (QPL) software (Dooley 1991). The QPL software created a collection
program which facilitated the data entry process. The QPL software was also used to write a
15

program that could be used with Statistical Analysis Software (SAS 1985) to generate summary
statistics of the survey results.
In order to statistically analyze variations in the amount of water pumped for irrigation use,
the database containing the information from the questionnaire was merged with information from
the Benchmark Farm Program and soil characteristics information. Both the Benchmark Farm data
and the soil characteristics data were provided by the St. Johns River Water Management District.
Information from the Benchmark Farm data included the date the field was planted, acre inches of
water pumped per acre, and the data quality. The data quality was either "good", "estimated", or
"inaccurate". "Estimated" meant that the meter malfunctioned and the amount of water pumped was•4"
calculated using the number of kilowatt hours and the pump specifications. If the data quality was
"inaccurate" ft meant the flow meter malfunctioned and the kilowatt hour method could not be used
to estimate the amount of water pumped.
The St. Johns River Water Management District also provided information about the soil
characteristics from a geographic information system (GIS) database containing state soils
information called STATSGO (State Soil Geographic Data Base 1991). Soil variables included the
map unit identification number (MUID) and number of acres of each map unit for a specific field.
The MUID is a number provided by the STATSGO program that represents areas comprised of
specific soil types. A specific soil type can appear in more than one MUID. Each MUID has a
proportion for each soil type in the unit, as represented in that unit throughout the state.
Statistical Analysis Procedures
The work done by Littell and Portier analyzed the amount of water pumped on a monthly
basis. Their model suggested that the age of the crop, the month of measurement, and the soil type
16

could be used to explain differences in the amount of water pumped. This study includes
management, production, and she variables which have the same value throughout the growing
season. Consequently, this analysis was conducted over the entire growing season.
To adapt the variables used in the Littell and Portier model to a growing season basis, some
modifications were made to the model. To capture the crop-age and month variation, a new variable
was used in the seasonal model. The new variable was the number of days after December 1 of the
preceding year the field was planted. A more specific grouping method for soil differences was
created, using the MUHD data to create three different categories. These categories would give the
proportion of the field contained in each MUID group.
The data collected from the questionnaire were examined with respect to management or site
variation. Variables to be included in the analysis were selected based on a three stage process. First,
there had to be a theoretical reason for why the variables were believed to be important. Second,
there had to be variation in the responses given by the growers. Third, there had to be an adequate
number of responses to be used in a model. The model for the seasonal regression was,
where
W - amount of water pumped per seasonk = number of site variablesSt = i* site variableAj = weight for the i* site variablen = number of management variablesMj = j* management variableB, - weight for the j* management variable.
17

There are over 20 variables in this model with less than SO observations for a given season.
As a result, initial inclusion of all variables would raise efficiency concerns. Therefore, the variables
were added to the base model one at a time. A variable was retained if the estimated coefficient was
statistically significant at the . 10 level. Variables that explain differences in management practices
were then added to the model in a similar manner as the site variables. The same criteria was used
for retaining management variables. After all of the significant site and management variables were
determined, a final single season model containing the significant variables was estimated. The final
single season model was then applied to the five years of Benchmark Farm Data. A dummy variable
was used to account for rainfall differences between study years.1'
POTATO PRODUCTION AND IRRIGATION QUESTIONNAIRE
A total of 62 interviews were completed between September and December 1994. Limited
responses to certain questions were most often a result of the perceived sensitive nature of the
question or that the information was not readily available. Growers were not given advance notice
of the types of information required for the questionnaire. The questionnaire was designed to collect
information that the grower uses to make decisions on a day-to-day basis. The assumption is that
information that is important to the grower could be recalled. To give the growers advance notice
of the types of data being collected would bias the results of the questionnaire.
The questionnaire was broken down into eight sections. These are General Information, Farm
Operator Information, Pest Management Practices, Fertilization Practices, Irrigation Management
Information, Specific Field Information, Farm Management, and the Future of Potato Production.
The results are presented under these headings.
18

General Information
The objective of this section was to collect general information about the potato industry in
North Florida. This included the size and location of the fields for the individual growers, type and
size of different operations undertaken by the growers, and information on whether the industry is
increasing or decreasing in this area.
Of the growers that responded to the questionnaire, 71 percent are participating in the
Benchmark Farm Program. The average grower has been producing potatoes for 24 years. This
section also asked for the respondents to indicate their gross acres of potato production and the yield<
by type, season, and ownership status.
For the Fall 1993 season, four respondents (6.5 percent) grew a fall potato crop. All
respondents grew potatoes in the spring 1994 season. Three respondents (4.9 percent) grew only
table potatoes, 42 respondents (68.9 percent) grew only chip potatoes and the remaining 16
respondents (26.2 percent) grew
both types. The total number of
acres reported by interviewed
growers represents 27,734 acres and
the average number of acres per
grower for potato production was
450 acres.
wo
IS*
Table CUp
(Figure 1 Average Gross Acres of Potato Production
Overall, growers commit a
larger portion of their acreage to
19

1M
100
chipping potatoes. Of the nearly 84 percent of the growers who grow chipping potatoes, the average
acreage size was 302 acres owned (figure 1). Over 69 percent of the growers lease land for chipping
potatoes as well. The average amount of acres for this purpose was 174. For table potatoes, 27.4
percent grow on their own acreage with an average of 199 acres and nearly 13 percent lease an
average of 178 acres for table
production. Yields are higher for
chipper potatoes with yields
averaging 230 cwt/ac for leased land<and 234 for owned land. Reported
yield averages for table potatoes
ranged from 182 cwt/ac for leased
land to 201 for owned land (figure
2). Table potatoes usually bring a
higher market price than chipping
potatoes, but there is also a thin market associated with this type. Even though the yields for table
potatoes are lower, it is not known if the water requirements are lower as well.
Over the last 5 years, almost 42 percent of the current growers have increased their planted
potato acreage, while only 14.5 percent have decreased the acreage planted (figure 3). On average,
growers who increased acreage did so by about 164 acres. The average change for growers who
reduced their acreage was almost 126 acres (Table 3).
figure 2
Table CMp
Average Yields (cwt/ac) by Potato Type
20

424%
DecreasedM5M
«UK
igure 3 Potato Farm Acreage Today vs 5 Years Agoby Grower
Iabk_3_: Average Change in Potato Acreage over the Last 5 Years
Change
Increase
Decrease
Frequency
25
9
Mean
163.76
125.56
Min
30
30
Max
500
400
Farm Operator Information
Of the persons interviewed, all respondents were men. The average age was 48 years with
a range from 29 to 73 years. The respondents highest level of education was broken into four
categories: a) less than high school (4.8 percent); b) high school graduate (53.3 percent); c) some
college (30.6 percent); and d) college graduate (11.3 percent) (figure 4). Of those who responded
they had some college, the average number of years completed was 1.82 years with a range from 1
to 4 years.
21

Growers were asked to identify, in no particular order, up to three sources that they consider
to be important information resources. The number of responses from each grower ranged from one
to three sources. Vendors were
most frequently identified as a key
information resource (72.6 percent),
followed by IFAS (50 percent (figure
5). Private consultants were only
identified by 12.9 percent of the
growers. Under the "other"
category, most growers responded
with "other growers", as an
souRCE
p***lIP*"* I
re 4
9JK
MUM
Highest Level of Education Attained byGrower
gureS Grower Sources for Information
important source of information;
however, two growers responded
that literature was an important
source, while two other growers
identified potato processors as
"other" sources for information.
22

Frequently, growers live on or next to one or more of their potato field sites. The respondents
were asked for a weighted average of the distances for all sites. However, if the respondent lived on
or next to a site and all sites border each other, then the respondent was considered to live zero miles
from the sites. The average distance was 3.25 miles with a range from 0 to 20 miles. Over 90
percent of the respondents indicated that the owner was responsible for overseeing irrigation
management. In almost every situation, there are no automatic controls for pumping irrigation water.
Manual systems are more effective if the sites are readily accessible. Further, owners would be more
motivated to check the system than hired labor.
Pest Management Practices
Questions in this section pertained to experiences and practices with respect to blight, as well
as diseases preventioa Almost 68 percent of the interviewed growers reported reduced potato yields
due to blight in 1994. The average
reduction in yields were estimated
to be 30 percent for affected fields.
For those affected growers, the
average acreage affected for each
grower was 40 percent. Less than
one half of the growers (48.4
percent) stated that they use the
telephone blight cast advisoryfigure 6 Proportion of Potato Growers that Use the
Telephone Blight Advisory (figure 6). Blight advisory
23

recommendations are usually followed by 83 percent of those that use the advisory.
All of the growers, except one, stated that they fumigated their entire potato acreage prior
to planting. The exception only fumigated SO percent of that operation's acreage.
Cover crops are frequently
used in potato production to reduce
disease incidence for the following
season. The overwhelming choice
(91.9 percent) for 1994 was the use
pf sorghum as a cover crop during
the off-season (figure 7). Other
fields were maintained in the
summer with a corn cover, which
could be used for silage.
Figure 7 Proportion of Acreage Maintained withCover Crop
Fertilization Practices
Responses in this section concern timing, frequency, and types of fertilizer applications used
by the potato growers. Some growers were concerned with revealing certain types of fertilizer
information, especially with regard to fertilizer analysis. In these cases, growers indicated that these
practices involve their own "trade secrets." Lime applications were not included in the information,
24

since this is not usually an annual practice. Fertilizer analysis was given with respect to nitrogen (N),
phosphorous (P), and potassium (K).
The mean values are provided in table 4. The "»*" column gives the number of growers who
gave fertilizer analysis information. Means were calculated based on complete information
Table 4: Fertilizer applications.
Application Date
Prior toPlanting
AfterPlanting
5-6 weeks
3-4 weeks
1-2 weeks
< 7 days
2-4 weeks
5-6 weeks
> 6 weeks
Frequency
12
29
12
7
54
28
21
N
2.11
5.64
5.11
22.00
28.45
29.32
24.93
P
9.22
12.00
8.44
7.50
0.66
0.00
0.14
K
31.67
24.84
17.00
3.50
3.48
2.52
5.43
n*
9
25
9
6
44
25
14"•^frequency of responses for N, P, K.
observations only. In general, fertilizer is applied once prior to planting. The key components of
this application are P and K. Higher nitrogen analysis is observed when application occurs within 7
days of planting. Applications after planting are related to the timing chosen for the pre-plant
application. For instance, if application occurs weeks before planting, then the grower is likely to
fertilize again soon after planting. Some growers apply two applications or more after planting.
Nitrogen is the key component for post-plant applications.
25

Irrigation M&nagement Information
The purpose of this section was to determine how the respondents regulate their irrigation
systems, the type of system, and
attributes of the planted rows. Sub-
irrigation provides moisture from
the bottom, opposite of the
overhead system. As such, visual
checks may have some differences.
'Growers mostly use soil appearance
as an indicator of irrigation
effectiveness (96.8 percent) (figure
8). Plant appearance (58.1 percent)
is also used as a check by the majority of the potato growers. To a lesser degree, growers evaluate
their systems based on water levels in the furrows and ditches, 14.5 and 11.3 percent respectively.
Less than 5 percent of the respondents indicated that they use a tensiometer to determine the moisture
content of the soil.
Soil appearance evaluations appear to be based on experience as opposed to mechanical
measurement. Approximately sixty percent of the respondents indicated that the soil appearance is
acceptable if the top is dry, but the soil lower than one inch from the top is moist (figure 9). Another
method for evaluating soil appearance used by growers is the clumping of soil in the alley. This "rule
of thumb" is based on a handful of soil taken from the alley. If the soil clumps in the hand, then
cHECK
/I ammmmmmmmmmm
IB* \'~ *;;•*'* .* * J
'SWl " " ' - ' ' •• sOvfs*»>* i>WMO.% t t v> » to t i n > ^•™s££\fe&Aw"ru s " s •• §
;• - i Fmiow
"'?'"• Ditch 1 i I
1 Tendometo i i !
j| Flags i I | !
^* ,•••'' ,-•• ' ' ,•••'' • ,•••'' /0 20 40 60 80 100
H
Figure 8 Potato Irrigation Check Systems
26

cR
TBRIA
0
ic
1M
1
*»riU,| : : ; :
m*i&^v$$™i$z^' \
I0** ! i i i !
I°*t | I 1 | j
/ •••'' .,•••'' , • • • ' ,•••'' .,•••'' ,•••' /
10 20 30 40 SO 60 70M
f igure 9 Soil Appearance Criteria for IrrigationCheck
moisture is considered adequate.
This method is used by 36.7 percent
of the growers. Surface color and
other methods are only used by 5
percent of the growers.
The most popular irrigation
system used for potatoes in this
North Florida area is the seep, semi-<
closed pipeline water delivery system
(figure 10). Ninety-seven percent of
the potato acreage in North Florida uses this system. The seep, semi-closed pipeline water delivery
refers to a system which distributes water by using a pipe from the well to an open water furrow in
the field. This system allows the
grower to control, with better
accuracy, the amount of water
delivered to each water furrow. This
system also does not have a long delay
between water being pumped from the
well and delivered to the water
furrow.
Ditch
97%
igure 10 Potato Irrigation Systems in North Florida
27

The seep, open ditch water delivery refers to a system where the water is carried from the well
to the field in an open ditch or furrow. The other system that was found was a tile system. The tile
system consists of a network of perforated pipe buried approximately three feet below ground level.
On average, growers have 13 wells over four inches and use 12 of these wells for potato
irrigation. Over 70 percent of the growers responded that at least one of their wells are "free-
flowing" at some time during the year. In this context, "free-flowing" refers to wells where water
would flow without mechanical assistance at any time during the year. This does not mean that
pumps are not required for the irrigation season.<
Centrifugal pumps were the most common choice (71.4 percent) for irrigation wells (figure
11). The "other" category represents wells that did not use any pump and accounted for only 1.3
percent of the irrigation wells.
Electricity was the power
source for all of the pumps.
Growers were asked if they could
recall their energy expenditures for
their pumps over the 1994 growing
season. Growers were not given
advance notice that this question
would be asked. The purpose of
this question was to determine if
growers knew this answer without
SubmcnibleMM
CcoMftval7UM
TuWne1S.9H
[Figure 11 Types of Pumps for Potato Irrigation
28

having to check their records. If energy expenditures for pumping water were an important
component for the operation, then it was assumed that growers would be more likely to recall the
amount. If energy expenditures were not an important management component for the potato
operation, then the grower presumably may be less likely to recall this information. Only 9 growers
(14.3 percent) knew the exact amount spent on electricity for their pumps; however, 24 respondents
(38.1 percent) could make a rough approximation of their energy expenditures for the 1994 growing
season. In all, over 52 percent of the growers had some notion of their energy expenditure.
Combining the actual figures with the estimations, the average amount spent on irrigation by each<
grower was $7,945.47 (w=33) with a range from $1,000 to $30,000.
For the growers who knew exactly what their expenditures were, the average was $4,520 per
grower. The average amount spent per acre was $11 with a standard deviation of $4.62. For the
growers who could make an estimate, the average was $9,373 per grower. The average amount
spent per acre was $18 with a standard deviation of $8.10. Energy expenditures for pumping water
represented about 1 percent of estimated costs of production. The average size of a farm for growers
who knew their expenditures exactly was 428 acres versus 495 acres for those growers who
estimated their usage.
{j)P6CJfic Field Information
Specific information was gathered for one field belonging to the respondent, in order to gain
insight into the differences in growing techniques used by the growers. For the purposes of this
questionnaire, a specific field was defined as a field being irrigated by one well or one irrigation
system. If the grower participated in the Saint John's River Water Management District (SJRWMD)
29

Benchmark Farm Program, then that field was used as the specific field. If the grower did not
participate in the Benchmark Farm Program, then a field was randomly chosen from the field maps
provided by the SJRWMD
The average field size was 41.25 aces (w=60) with a range from 10 to 167 acres. All of the
fields used the seep, semi-dosed pipeline water delivery system, except for one field which used a tile
system. The average slope was 7.38 inches per 1,000 feet (w=34) with a range from 0 to 20 inches.
Slope information was not readily known by many of the growers.
Field slope was most
•commonly verified with a land laser
technique (66.2%), but 29 percent
of the growers responded that they
did not verify the slope of this
specific field (figure 12). About 5
percent of the respondents used a
land plane to verify field slope.
The average row height, as
measured at the time of planting, was 10.86 inches (n=50) with a range from 8 to 18 inches. Since
water travels to the plant through capillary action, the row height could be used as an approximation
of how far the water must travel vertically. Li theory, as the row height increases more water would
be required for effective irrigation. Higher rows would require more stacking of the water table to
provide adequate moisture for the plant. Twelve inch row heights were used by 38 percent of the
Laid User663%
Land Plane4.8%
Figure 12 Specific Field Slope Verification Procedures
30

8
9
10
11
12
15-18
XI
*" »\"\r" v° " *TS. ";£ -" jr "£» "1* v»w •• r- ^^>» * s "• " "•> \»fVs •
| |
fe^vv^rv^4^!(%s m « Sw
m*mm^Ki'\ "**
: I !
/0 10 20 30 40
IFigure 13 Proportion of Row Heights (in) for SpecificFields
growers followed by 24 percent for 8
inch rows and 22 percent for 10 inch
row heights (figure 13). Only 12
percent of the row heights exceeded
twelve inches.
The average number of wells
was 1.06 for each specific field with
a range from 0.4 to 3.0 wells. Since
some wells serve more than one field
60
SO
403020
10
and some wells serve less than one
field, well fractions are appropriate.
The most common well diameters
were 4 and 6 inches for the specific
fields (figure 14). Larger diameters
would expectedly be positively
correlated with water flow.
Two-thirds of the pumps were
centrifugal while 23.3 percent were
turbine (figure IS). Only one well did
not require a pump since it was a free-flowing well. Horsepower ratings of the pumps varied from
Figure 14
6 S ft*
Diameter (In)
Well Casing Diameters (in) for SpecificFields
31

T
Y
P
^
jw*Nr^^TS:'>l i%** vC •» ss^ssj :
FlsutanOTaOe |
None i
/ / ..-- ,-- ,-- /0 20 40 60 SO 100
%
Figure 15 Pump Types for Specific Fields
1.5 to 20 hp with an average of 6.9
hp. Five growers were unsure of the
horsepower rating for the field site
pump(s). Growers were unsure of
the well's discharge capacity, in
general. Sixteen growers reported
discharge rates ranging from 140 to
800 gallons per minute with a mean
t>f420gpm. The small response to
this question may suggest that this information is not commonly used by the growers for managing
their irrigation activities.
Seventy-five percent of the growers used a 3/4 inch valve at the water furrow. The remaining
25 percent used a 1 inch valve. Larger valve sizes would indicate higher potential flow rates. In most
powers have the ability to control the water flow rate at the well and/or water furrow valve.
The majority of the growers (62.3) do not adjust the flow rate at the well, while 86.7 percent
indicated that they do control the flow rate at the water furrow valve. Their criteria for adjustment
closely mirrors the guidelines set forth by the consumptive use permits issued by SJRWMD. These
permits state that the discharge is not allowed to overtop the control structures by more than one-half
inch. Furthermore, most growers are not allowed any discharge from 1:00 pm to sundown, unless
associated with a storm event. (Florida Administrative Code 40C-2 1995).
32

Plantine Characteristics
The bulk of potatoes, 76.5 percent of total acreage, are planted between the 16th of January
and the 15th of February (figure 16).
Earlier planting dates would have
tower irrigation requirements for the
season, due to the cooler
temperatures. Average seed depth
at planting was 3.18 inches with a
range of 1 to 7 inches. One common
"rule of thumb" mentioned by
growers was to use the distance
too
80
60
40
20
DK.1MI JB.M5 JB.M41 M.M5 M.1MS
Figure 16 Potato Planting Dates
igure 17 Frequency of Pre-plant Irrigation in Last 10Years
33
from the first joint on their middle
finger to the tip of the same finger
for depth measurement. Planting
depth may be useful in determining
how far the moisture must travel
vertically in the soil to reach the
plant.
Over 40 percent of the
growers responded that they will

irrigate prior to planting during "dry" years. Since "dry" is a rather subjective term, growers were
asked to indicate the number of times that they irrigated prior to planting over the last 10 years. Only
about 8 percent of the respondents indicated that they irrigated prior to planting more than once
during the last 10 years (figure 17). As such, Pre-plant irrigation does not appear to be an important
factor in water demand. On average growers wait 3.82 weeks to begin irrigating after planting.
Growers indicated that they usually
start irrigating when the plant
emerges about 2 to 4 inches above
the ground. Almost sixty percent of
the respondents indicated that they
begin irrigating 3 to 4 weeks after
planting (figure 18). Premature
irrigation is not conducive to the
3530
25
2015
10
4 S
Weeks
plant's growth. Longer delays [Figure 18 Irrigation Delay After Planting in Weeks
would reduce overall water
consumption, but the moisture will be necessary after about thirty days.
Over 60 percent of potatoes are harvested during the month of May (figure 19). Harvest date
information is useful in detennining the growing season length when used in conjunction with planting
dates. It may also be assumed that potatoes harvested earlier in the year required less irrigation water
due to cooler temperatures and rainfall patterns. Water use is expected to have little influence on
34

grower decisions on when to plant and harvest. Planting and harvest dates are driven by other
factors, namely production and market window.
35
30
2520
1510
5**•>?,
A*. 1-15 MS te.1540
Hvvert
Figure 19 Potato Harvest Dates
Management Information
A key component to good management practices is record keeping. Thorough and up-to-
date records can assist managers during the decision-making process. Three key areas for record
keeping in potato production are fertilizer application by field, yield by field, and pesticide
applications by field. Over 96 percent of the growers indicated that they regularly maintain pesticide
application records by field (figure 20). Pesticide operators are required to maintain these records
for many pesticides used in potato production. Over 70 percent of the respondents indicated that they
also regularly keep records for fertilizer applications and yield information by field.
35

too
'igure 20 Record Keeping for Fertilizer, Yield, andPesticides by Field
All of the respondents
indicated that they normally irrigate
all day (24 hours), however, 81.9
percent of the growers said that
they do turn off or delay irrigation
based on expected rainfall.
Television was identified as the
major source for growers to base
their rain expectations. On
average, an expectation of .94
inches of rainfall was necessary to turn off or delay irrigation, with a range from 0.10 to 2.0 inches.
Growers reported that they would
turn off the system at an average of
11.54 hours before the expected rain,
with a range from 1 to 48 hours.
All of the respondents irrigate
when the crop is 31 to 90 days old
(figure 21). Irrigation is rare when
the plants are less than two weeks
old, but about 42 percent of the
100n
60
40
20
0-15 lt-30 3140CtapAflB
figure 21 Irrigation and Crop Agegrowers do irrigate between 16 and
36

30 days. Growers were not aware of specific water table levels in the potato fields. Maintenance of
water table levels is important for meeting the plant's moisture requirements.
Regardless of crop age,
growers would turn the irrigation
system off with an actual rainfall of
at least .8 inches on overage. All of
the growers indicated that they
would turn the irrigation system off
if actual rainfall event was 1 inch or
more, while 70 percent said they
would shut the system off if actual
rainfall was a half inch. Seventeen
025
Figure 22 Average Delay in Restarting Irrigation basedon Actual Rainfall (in)
percent indicated that they would
turn the system off for rainfalls of. 1 to .25 inches. Figure 22 shows the average number of days that
the growers would keep the irrigation off, given different rainfall amounts. Soil moisture was the
number one criteria for turning the system back on according to 72.6 percent of the growers (figure
23). Plant condition was identified as the important criteria by almost 20 percent of the growers.
Water level in the furrows, field water table level, and weather conditions were other identified
criteria.
37

IT
B
I
I
A
(Figure 23 Criteria for Restarting Irrigation
The average time for turning off
irrigation prior to harvest was 8.41
days, with a range from the actual
day of harvest to 30 days prior to
harvest. Potato type, table or
chipper, plays an important role in
this decision.
As mentioned earlier, the-4"
potato growers use the same basic
irrigation system. There are some differences in water conservation measures already in use by the
growers. Currently, over 80 percent of the growers use risers (furrow and\or ditch), regulate water
flow, land leveling techniques, and
closed pipeline delivery systems.
Other measures include "sub-
soiling," tile systems, water
recovery, different potato varieties,
and a shorter row height. These
conservation measures are believed
to have a significant impact on
water consumption. In fact, over 77
percent of the growers feel their
MB
A
8
U
100
Figure 24 Conservation Measures Used by PotatoGrowers
38

operation is cost efficient and over 80 percent feel their water usage is technically efficient.
Growers were asked whether they thought certain conservation techniques were technically
and/or economically feasible. Five different conservation methods were discussed with the
respondents. First, a water recovery system where water would be recovered after traveling through
the field and into the ditch and recycled back to the pump. Second, an automatic irrigation timer or
controller that would turn the
system off during certain hours or
conditions. Third, a computerized
water distribution system would
control the entire system using
sensors for moisture, humidity, et
cetera. Fourth, a sub-irrigation
system using drip tubing. Finally,
moisture sensors in the field that
could indicate whether irrigation
was necessary. The majority of
Recycle
Auto
Figure 25 Technical and Economic Feasibility ofConservation Practices According to PotatoGrowers
growers, 71 percent, felt that moisture sensors would be a technically feasible method, but less than
half of the growers thought it would be economically feasible (figure 25). Less than half of the
growers felt that the other methods were technically feasible. Even less thought that these practices
were economically feasible. Of note, less than 10 percent indicated that they thought water recovery,
computerized systems, and sub-irrigation were economically feasible. Obviously, the growers are not
39

convinced that these alternative practices would improve the profitability of their operations. Perhaps
they are correct. Further research into these areas would be needed to determine the feasibility of
alternative practices for potatoes.
Future of Potato Production
The purpose of this section was to collect information that would identify major concerns of
the growers. The growers were asked what they thought the importance of the following factors on
the future of Florida potato production would be over the next five years. The growers used a ranking
system from 1 to 4, with 1 being most important. Water availability and environmental regulations
were consistently considered more important concerns for potato growers than urban development
and labor regulations (figure 26). Admittedly, the concerns for water availability may be biased due
to this survey instrument at the time, but the results are still evident that water is a real concern to the
growers. Growers were asked what
did they feel to be a significant
obstacle or threat with respect to the
profitability and viability of potato
production in this tri-county area.
Water regulations, environmental
regulations, and market conditions
were the most frequently discussed
threats. Most growers who
mentioned water regulations said they
so
40
30
2010
Figure 26 Importance of Various Factors on theFuture of Florida Potato Production
40

felt that water resources in the future may be so limited that they would not have enough water to
stay in business. Growers who responded with environmental regulations were referring to the lack
of effective pesticides to control blight. The market conditions refer to problems the growers face
in marketing their crop and being able to maintain a profit margin.
From the questionnaire, a great deal of information was collected. The questionnaire
identified variables that present enough variation and number of observations to be used for
evaluating the amount of water pumped for irrigation. Data concerning when a grower turns on and
off his irrigation system and how a grower responds to both expected and actual rainfall should
benefit the analysis. When a grower plants or harvests his field, although determined by marketing
and production influences, should also benefit the analysis. Growers feel they are already
implementing conservation procedures and see little value in other alternatives at this time.
41

WATER USE MODELS AND EMPIRICAL RESULTS
The purpose of this section is to determine and measure the effects of various factors on
irrigation water consumption for potatoes in North Florida. Water use can vary between fields for
a variety of reasons, such as: type of irrigation system; soil characteristics; planting and harvest
decisions; associated costs; and management practices. Irrigation systems are somewhat
homogenous for the potato producing area. As such, there are little to no measurable differences in
capital outlays and maintenance costs that would account for water usage. For example, other types•4'
of systems may be more expensive to operate, motivating the grower to operate the system less to
reduce costs. This would result in a difference in water usage due to the type of system. Or, a
different type of system may be less efficient in delivering the water to the plants, which would
increase water usage.
Soils, on the other hand, do vary from field to field. Organic content, sand composition, and
other factors can affect the hydroconductivity (water movement) and moisture retention abilities.
Planting and harvest dates also vary somewhat and could potentially impact the demand for water.
Plants growing in the cooler season would require less water than plants growing during a warmer
time. Rainfall and evaporation measures also differ during the year. Selection of planting and harvest
dates are usually based on growing conditions and market expectations, not water requirements.
Water is essentially cost-less to the grower except for permit costs. Distribution of water is not cost-
less. Expenditures exist for the equipment, supplies, and labor for construction and maintenance of
the delivery system; however, there is little reason why these would impact in-season water
42

consumption. Electrical expenditures exist for the actual pumping of water. Here, some growers
may be more sensitive to this expenditure than others, resulting in differences in water use.
Other management practices would include field preparation, system operation, and overall
level of management. These practices are affected by market expectations, experience, and level of
risk aversion.
Data for the analysis were obtained from the grower survey and associated Benchmark Farm
information. Only those growers who participated in the Benchmark Farm program were used for
the analysis. Further, some observations had to be deleted due to data contradictions and/or
incomplete information. As a result, there were 34 fields that were deemed suitable for the analysis.
Base Model
As discussed earlier, the Littell and Portier study modeled water usage as function of crop-
age, month, and a zero-one indicator variable identifying whether the soil type was St. Johns or not.
Water use was measured monthly rather than for the entire growing season requirement. The analysis
for this current study is concerned with total growing season requirements. As such, water use is
modeled as a function of planting date (alternative to crop-age) and soil type for the base model.
Planting date was represented by the number of days after December 1 that the field was planted,
since no planting was reported prior to this date.
To evaluate differences caused by variations in soil characteristics, map unit identification
numbers (MUID) were used for soil grouping. There are 8 different MUID numbers for the study
area. These numbers were grouped into three groups. Any MUID in which the majority of soils were
spodosols were placed in one group. This spodosol group was called FLSUMA and consisted of
43

MUID FL100, FL103, and FL106. The second group was made up of any MUID which had a
majority of soils with high organic content at the surface. This group of organic soils was called
FLSUMB and consisted of MUID FL10S and FL107. The third group, FLSUMC, consisted of any
MUID which contained a majority of soils that were sandy, low in organic material, and had no clay.
The MUID's for the groups in FLSUMC were FL101 and FL1 13. FLSUMC was used as the base
group.
The base model regressed the total number of acre inches of water pumped per acre for the
growing season as a function of planting date (PLDATE) and soil differences. In theory, more water
will be required by a field the later in the growing season the field is planted. Because the soil group
FLSUMC contains heavier soils than FLSUMA and FLSUMB, both FLSUMA and FLSUMB should
require less water pumped for irrigation. The actual equation used for the base model was as follows:
SACJ . p0
where SACI refers to the number of acre inches of water pumped per acre for each field; PLDATE
is the number of days after December 1, 1993 the field was planted; FLSUMA represents the
proportion of the field in soil group FLSUMA; FLSUMB represents the proportion of the field in
soil group FLSUMB; and e denotes the error term. Simple statistics for these variables are given
in table 5.
44
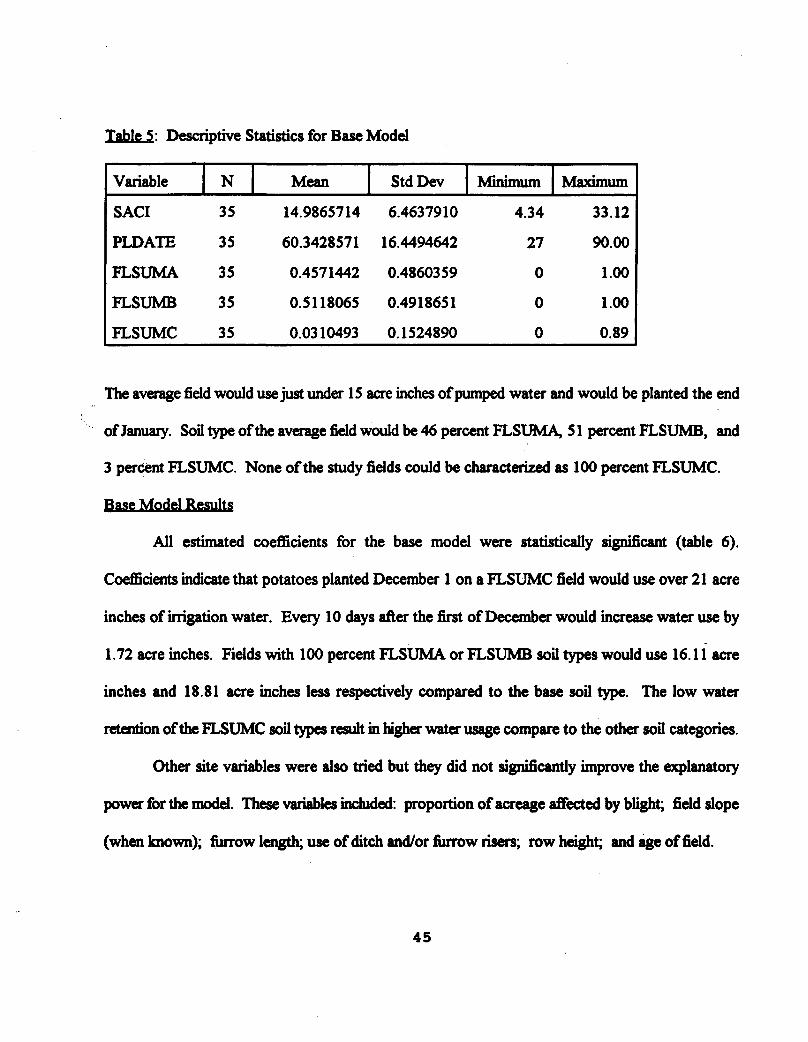
Table 5: Descriptive Statistics for Base Model
Variable
SACI
PLDATE
FLSUMA
FLSUMB
FLSUMC
N
35
35
35
35
35
Mean
14.9865714
60.3428571
0.4571442
0.5118065
0.0310493
StdDev
6.4637910
16.4494642
0.4860359
0.4918651
0.1524890
Minimum
4.34
27
0
0
0
Maximum
33.12
90.00
1.00
1.00
0.89
The average field would use just under 15 acre inches of pumped water and would be planted the end
of January. Soil type of the average field would be 46 percent FLSUMA, 51 percent FLSUMB, and
3 percent FLSUMC. None of the study fields could be characterized as 100 percent FLSUMC.
Base Model Results
All estimated coefficients for the base model were statistically significant (table 6).
Coefficients indicate that potatoes planted December 1 on a FLSUMC field would use over 21 acre
inches of irrigation water. Every 10 days after the first of December would increase water use by
1.72 acre inches. Fields with 100 percent FLSUMA or FLSUMB soil types would use 16.11 acre
inches and 18.81 acre inches less respectively compared to the base soil type. The low water
retention of the FLSUMC soil types result in higher water usage compare to the other soil categories.
Other site variables were also tried but they did not significantly improve the explanatory
power for the model. These variables included: proportion of acreage affected by blight; field slope
(when known); furrow length; use of ditch and/or furrow risers; row height; and age of field.
45

Table_6 Regression Results (standard error) for Water Use Base Model
Variable
Intercept
PLDATE
FLSUMA
; FLSUMB
NAdj.R2
MSB
Coefficient Estimate
21.5657*(6.577)
.1723*(.0579)
-16.1131*(6.3480)
-18.8091*C6.2902}
34.28 "'
30.07* denotes significance at the . 10 level
Management Model
The management model includes those variables specified in the base model, as well as
managemer variables. These variables provide indications on timing of irrigation start-up after
planting, system shutdown based on rainfall expectations during the growing season, timing of
irrigation shutdown before harvest, and ability to recall electricity expenditures. A dummy variable
was used to denote whether or not the grower irrigated within 30 days of planting. If the growers
wait at least 30 days before irrigation, then water consumption would expectedly be less than for
those that began irrigation within 30 days of planting.
Information about expected rainfall was condensed into a single variable by first determining
the range for the minimum expected rainfall for the grower to turn off the irrigation system. The
46

range was found to be from 0.1 inches to 2.0 inches with some growers indicating they did not turn
off their system based on rain expectations. This indicated rainfall amount was subtracted from 2.1,
and indexed by the mean. Fields where growers did not turn off their irrigation were assigned a value
of zero. Next, the number of hours prior to the expected rainfall that the grower would turn off his
irrigation was indexed by the mean. The variable used in the model was then created by multiplying
the two indexes together. The result provides an index that increases in value with grower sensitivity
to expected rainfall. Consequently, a higher index value indicates that the grower is either more likely
to turn system off based on a lower rainfall expectation, or more likely to turn system off sooner, or•<
some combination of the two than a grower with a lower index number.
Irrigation shutdown was also measured as the days prior to harvest. Electricity expenditures
could not be directly specified since most growers were not aware of this expenditure. Instead, a
dummy variable was used to indicate whether the grower was familiar with the operation's electricity
expenditure for water distribution. If yes, this is hypothesize to indicate that the grower is more
sensitive to the costs of pumping water. This sensitivity would expectedly reduce the water
consumption since the grower is sensitive to the associated costs.
The last 5 years of Benchmark Farm Program information were used in conjunction with the
added management variables to improve the efficiency of the model estimates. Management variables
are considered constant for this period. The Benchmark Farm Program data provide the needed
planting date and water usage values for each of the five growing season. As a result of adding
additional growing seasons, there were 145 usable observations for this portion of the analysis.
47

Inter-period variations in water requirements were accounted for by rainfall differences.
Specifically, rainfall measurement for the month of March at the Hastings station was determined to
explain water consumption differences between years. Rainfall information was gathered from the
Climatological Data Annual Summaries for Florida. Higher rainfall would result in lower irrigation
water use, provided the growers regulate water flow.
The management model can be expressed as:
SAO . P0 * PfLDATE . QflSUMA - p/LSOMB . B/RRWe
where IRR30 is 1 if irrigated during first 30 days after planting, 0 otherwise; INDEX is the product
of the expected rainfall index and the pre-rainfall expectation shutdown index discussed earlier; FM7
is the number of days prior to harvest which the grower turns off the irrigation system; EEXP is 1
if the grower knew or could estimate expenditures for electricity, 0 otherwise; and RAIN is the
inches of rainfall during March for the respective year.
Descriptive statistics for the model are shown in Table 7. About 35 percent of the fields were
irrigated within 30 days of planting and the irrigation was turned off an average of 8 days before
harvest. Over 59 percent of the respondents were able to recall or comfortably estimate electricity
costs. Average March rainfall was 3.59 inches with a range of 1.64 to 6.86 inches.
48

Table 7: Descriptive Statistics for Water Use Management Model
Variable
SACI
FLSUMA
FLSUMB
INDEX
FM7
IRR30
MONEY
RAIN
1 *145
145
145
145
145
145
145
145
Mean
13.6627586
0.4942486
0.4717308
0.8458106
7.9586207
0.3517241
0.5931034
3.5865517
Std Dev Minir
6.5700126
0.4863445
0.4889611
1.7837601
6.6623693
0.4791635
0.4929581
1.7735657
num Maximum
1.92 36.69
0 1.00
0 1.00
0 8.98
0 30.00
0 1.00
0 1.00
1,64 6.86
Management Model Results
All coefficient estimates were statistically significant at the .10 level and the explanatory
power, as measured by adjusted R2, improved from .28 in the base model to .57 in the management
model (table 8). Marginal effects for planting date and soil types decrease in magnitude from those
estimates in the base model. A ten day delay in planting date increases the water requirement by one
inch, while FLSUMA uses 9.96 inches less and FLSUMB uses 10.90 inches less than the FLSUMC
grouping.
Irrigation within 30 days of planting resulted in 2.48 acre inches more than when irrigation
did not begin until after 30 days. Sensitivity of system operation to rainfall expectations had a
significantly negative effect on water used for the season. A 10 percent decrease in the minimum
rainfall expectation or a 10 percent increase in time before expected rainfall for shutoff at the sample
means would result in .04 acre inches (-.3806*. 1) less water used for irrigation. At first glance, this
49

effect may seem minor, but there is substantial variation in INDEX values. Using the minimum and
maximum values reported in table 7 for the variable INDEX, the estimated coefficient shows that the
grower with the highest value would use 3.4 acre inches less (-.3806*8.98) of irrigation water than
growers with a zero INDEX value. Fields that are irrigated up to the day prior to harvest use 1.26
acre inches more than those that stop irrigation ten days prior to harvest.
Fields used 2.85 acre inches less of water when the operator could recall or comfortably
estimate energy costs for pum[ ;g water which was consistent with expectations. One inch of rainfall
in March reduces pump water used by 1.65 acre inches, indicating a more than proportional reduction<
in water demand.
In summary, these empirical results show that water demand is significantly impacted by
planting date and soil characteristics. Planting date is determined by growing conditions and market
expectations; thus, there is little information here that could be used to reduce water requirements.
Similarly, it would not be plausible to sufficiently adjust soil characteristics to reduce water needs.
With respect to the management practices, certain adaptations may be plausible. Irrigation start-up
and shutdown timing have been shown to significantly impact water usage, but shutdown timing does
have possible links to potato type and harvest planning. Growers who curtail irrigation due to rainfall
expectations use less water, however, growers are reluctant to curtail irrigation due to risk concerns.
It is apparent that as grower risk concerns are alleviated, water use will decrease. Further, sensitivity
to pumping costs results in less water used for potato irrigation. Still, there would seem to be limited
potential for substantially reducing water requirements for this irrigation system under the current
environment.
50

Tables Regression Results (standard error) for Water Use Management Model
Variable
Intercept
PLDATE
FLSUMA
FLSUMB
INDEX
FM7
IRR30
EEXP
RAIN
NAdj. R2
MSB
Coefficient Estimate
25.8690*(3.045)
.0977*(.0240)
-9.9593*(2.3999)
-10.9011*(2.3907)
-.3806*(.2276)
-.1258*(.0596)
2.4792*(.8394)
-2.8480*(.8425)
-1.6495*r.2038^
145.57
18.75* denotes significance at the. 10 level
51

CLOSING COMMENTS
The purpose of this study was to determine key factors that influence water usage among
potato farms in Flagler, Putnam, and St. Johns counties. In doing so, information was collected from
the potato growers using a questionnaire collected by personally interviewing a representative from
each farm or fanning operation. Data concerning the demographics of the potato growers,
management practices, production practices, and site characteristics were collected and reported.
This data was combined with information from the Benchmark Farm Program and soil characteristic
information to create a database that could be used for empirical analysis.-«'
Potato growers in North Florida use the same type of irrigation system. The sub-surface seep
system raises the natural water table to facilitate capillary movement of water into the potato root
system. For the most part, water is delivered to the field from a well through a closed pipe system.
Water is delivered to furrows which are located 16 rows apart. A ditch is used at the other end to
collect water that passes through the field. No overhead irrigation is used. Variations in water
consumption are chiefly due to planting dates, soil type, rainfall, and irrigation practices. Costs of
pumping water account for about 1 percent of total production costs. However, growers that are
sensitive to this cost use significantly less water. Most management practices are based on growing
conditions, market expectations, and yield assurance. As such, growers are more sensitive to plant
condition than gallons of water pumped. Most growers do feel that their current irrigation system
is efficient, when considering the need for yield assurance and product marketability. A majority of
the growers do currently use risers to control water levels in their fields; regulate the water flow
52
either at the well, the furrow, or both; use land leveling techniques; and have a closed pipeline water
distribution system.
Since questionnaires were completed for 90 percent of all the farms or farming operations,
the results from the questionnaire provide an accurate insight into the fanning practices of the
growers. The 34 observations used in the analysis accounts for over half of the growers who
participate in the Benchmark Farm Program. Therefore, the results can be reasonably applied to the
entire population of potato growers.
Limitations
There do exist some limitations to this research. First, many of the management practices
studied are quite subjective. These practices are a result of extensive experience, but they are difficult
to quantify satisfactorily. For instance, growers often irrigate based on soil "clumping" as opposed
to a physical measure of moisture or water table level. Statistical significance is still valid, but the
exact marginal effect measures are difficult to ascertain with a high level of confidence.
Another limitation was the number of fields used in the analysis. Previous research indicated
that it would be necessary to use 55 of the 169 permits to be able to predict water usage within 20
percent of the actual amount used (Portier 1988). A permit can contain more than one well, but each
Benchmark Farm site monitors only one well. Consequently, the 55 wells in the program do not
represent the number of wells suggested by Portier; however, it would seem that the 55 Benchmark
Farm sites do provide an adequate representation for management practice information, since there
are only 69 potato operations.
53

Finally, there was some uncertainty and reluctance on the part of the respondents. Growers
seemed uncertain as to the value to them for providing this information and some were reluctant to
reveal practices that they felt were "trade secrets."
Conclusions and Recommendations
With the current environment, there is little motivation for growers to alter their irrigation
practices, except for some relatively small savings in pumping costs. Growing conditions, market
expectations, and yield assurance are the strong influences on fanning practices, not the volume of
water. Growers will be reluctant to change their practices unless assurances can be made that it
would increase the profitability of the operation. Many growers expressed that these operations have
been in the family for generations. They consider water use to be a right rather than a privilege.
Growers would be willing to conserve more water only if it would be cost-effective and if they were
assured of an equal or improved yield. As a business operation, these concerns and rationale are
legitimate, at least in the short run.
Still, the objective of this research was to determine if there are current adjustments that could
be made at the grower level which would result in a reduction of water use. The analysis identified
several factors that significantly impact irrigation water consumption. First, earlier planting dates
significantly reduce the water requirements for the potato growing season; however, planting date
decisions are based on market forces rather than irrigation concerns. Thus, there is a low likelihood
of altering when growers choose to plant. Second, the soil group FLSUMC was shown to use
considerable more water than the other two soil types. However, FLSUMC represents only about
3 percent of the land in potato production. Third, growers who turn off their irrigation system due
54

to rainfall expectations use significantly less water than those that do not turn off based on rainfall
expectations. On average, growers who do turn off use .32 acre inches of water less than those who
do not The actual water savings are based on grower risk perceptions. If the growers risk concerns
are too high, then education and assurances could raise the average conservation rate. Fourth, pre-
harvest irrigation shutoff also will significantly reduce the amount of water demanded, but these
decisions are often based on the type of potato (table or chipper) as opposed to water use concerns.
Water consumption tends to be higher toward the end of the growing season due to size of plant and
environmental conditions. Fifth, post-plant irrigation startup timing impacts water requirements.
Growers who wait at least 30 days post-plant will use an estimated 2.5 acre inches less water than
those that irrigate within 30 days. Horticultural research should suggest what the optimal timing
would be to begin irrigation. Sixth, growers that are aware of the costs associated with pumping
water to the fields use significantly less water than those who cannot readily estimate their pumping
costs. On a relative basis, pumping costs represent a very minor portion of the overall production
expenses, but the average grower still spends thousands of dollars on electricity to pump water. A
growing awareness of the absolute rather than relative amount may provide some incentive for
growers to conserve energy which would subsequently lead to diminished water use. Finally, the
amount of rainfall during the growing season affects the amount of irrigation water needed, but there
is little the District or the growers can do to alter natural rainfall. In summary, there are several
factors that affect water usage. Changes in certain important characteristics (planting date and soil
group) are not plausible. But, there does seem to be potential in certain management practices that
could reduce water requirements. Adoption of these practices would require grower education and
55

possibly additional research to raise awareness and/or confidence with respect to how these practices
would benefit the grower.
Changes to the Benchmark Farm database would aid research in the future. The site-specific
variables that had variation should be added to the collection procedures. These variables include the
soil group, potato variety, field slope, furrow length, harvest dates, and rainfall data.
The water management district may also want to add more information concerning the
irrigation system itself. This cou.u include actual flow rates and the hours the irrigation system was
used each month. Monthly operation calculations would enable projections within season as well.
Yield information would help substantiate whether certain management practices were crucial to yield
and yield assurance.
Future research should be focused on trying to develop irrigation methods that could improve
the efficiency of water pumped for irrigation. Work is currently being conducted in Hastings by IF AS
personnel, using sub-surface drip irrigation. Future research may also determine the feasibility of
using other modifications to the irrigation system that could recharge the moisture levels more
quickly. This would reduce the risk of turning off an irrigation system and the moisture level in the
field dropping to a critical point. Growers expressed a higher confidence level, technically and
economically, for moisture sensor use in the current irrigation system. Investigation into this area
would also be warranted.
The St. Johns River Water Management District may also want to consider implementing
some direct (i.e., subsidy) or indirect (i.e., longer duration permits) economic incentives for the
growers to manage their water resources more efficiently. Economic incentives would cause the
56

marginal cost of water to increase. The increase in the marginal cost of water would cause the
optimal value of the marginal product to increase. If the growers use water as a risk-reducing input,
the cost of using water to decrease the variability in output would increase. Growers would either
have to accept more variability in their output or adopt new technologies that could reduce the
variability of their output.
A collaborative effort between the St. Johns River Water Management District personnel,
IF AS research personnel, and growers could be used to help the growers become better managers
and producers. To aid in this collaborative effort, the water management district and the growers
need to maintain a close working relationship.
Phase II
A Phase n was originally proposed as a potential follow-up to this research. The objectives
would be to develop a management index based on scoring key management decisions points and
production practices and integrate this index into the Benchmark Farm Program data. Phase n is not
recommended at this time for a couple of reasons. First, the management practice information is
highly subjective and would require periodic personal interviews. Secondly, subjective data collection
is valid for determining which practices have significant impacts, but the marginal effect estimates are
not strong tools for forecasting. Additional investigation will be done to determine if the measures
can be more objectively determined, resulting in a more accurate index measure.
57


REFERENCES
Bajwa, Rajinder Singh. "Analysis of Irrigation Potential in the Southeast: Florida, A SpecialReport." United States Department of Agriculture, Economic ResearchService, Natural Resource Economics Division, 1985.
Boggess, W. G., Amy Purvis, R H. Stamps, Randy Motes, and Sue Ferenc. "FerneryManagement for Groundwater Quality Protection: Leatherleaf Grower Survey."University of Florida, Institute of Food and Agricultural Sciences, Gainesville, FL, May1991.
"Climatological Data Annual Summary: Florida 1990." National Climatic Data Center,Asheville, NC, 1991 94(13).
"Climatological Data Annual Summary: Florida 1991." National Climatic Data Center,Asheville, NC, 1992 95(13).
•*•
"Climatological Data Annual Summary: Florida 1992." National Climatic Data Center,Asheville, NC, 1993 96(13).
"Climatological Data Annual Summary: Florida 1993." National Climatic Data Center,Asheville, NC, 1994 97(13).
"Climatological Data Summary: Florida, February 1994." National Climatic Data Center,Asheville, NC, 1994(a) 98(2).
"Climatological Data Summary: Florida, March 1994." National Climatic Data Center,Asheville, NC, 1994(b) 98(3).
"Climatological Data Summary: Florida, April 1994." National Climatic Data Center, Asheville,NC, 1994(c) 98(4).
D'Almada, Philip J. Agricultural Economic Impact from Water Restrictions in South Florida.University of Florida, Department of Food and Resource Economics, 1984.
Dooley, Kevin. QPL Reference Manual, Version 3.0. United States General Accounting Office,Human Resources Division. United States Department of Commerce, Springfield, VA,September 1991.
"Florida Administrative Code 40C-2: The Permitting of Consumptive Uses of Water."Department of State, State of Florida Darby Printing, Atlanta, GA, Volume 14,February, 1995.
58

Florence, Bruce. "Annual Water Use Survey: 1992." Technical Publication SJ9S-2, St. JohnsRiver Water Management District, Palatka, FL, 199S.
Fox, R. L., J. T. Phelan, and W. D. Griddle. "Design of Subirrigation Systems." AgriculturalEngineering, St. Joseph, Michigan, 1956 37(2): 103-108.
Good, J. C., D. S. Harrison, and A. G. Smajstrla. "Performance of Irrigation Pumping Systems inFlorida." Florida Cooperative Extension Service, University of Florida, Institute of Foodand Agricultural Sciences, Gainesville, FL 1985.
Haman, D. Z., A. G. Smajstrla, and F. S. Zazueta. "Measuring Pump Capacity for IrrigationSystem Design." Florida Cooperative Extension Service, University of Florida, Instituteof Food and Agricultural Sciences, Gainesville, FL 1994.
Harrison, D. S. "Irrigation in Florida Agriculture in the 80's." Florida Cooperative ExtensionService, University of Florida, Institute of Food and Agricultural Sciences, Gainesville, Fl1983.
Harrison, D. S. and A. G. Smajstrla. "Measurement of Soil Water Use for IrrigationManagement." Florida Cooperative Extension Service, University of Florida,Institute of Food and Agricultural Sciences, Gainesville, FL 1982.
Harrison, D. S., A. G. Smajstrla, and F. S. Zazueta. "Irrigation Systems and Costs Estimates forRow Crop Production in Florida." Florida Cooperative Extension Service, University ofFlorida, Institute of Food and Agricultural Sciences, Gainesville, FL 1985.
Hensel, D. R. "Irrigation of Potatoes at Hastings, Florida." Proceedings of Soil and CropScience Society of Florida, Florida, 1964 24:105-110.
Littell R. and K. Portier. "Statistical Analysis of Agricultural Water Consumption Data - PotatoCrop Analysis." University of Florida, Institute of Food and Agricultural Sciences,Gainesville, FL, June 1994 (unpublished mimeograph).
Pitts, Donald and Allen Smajstrla. "Irrigation Systems for Crop Production in Florida:Descriptions and Costs." Florida Cooperative Extension Service, University of Florida,Institute of Food and Agricultural Sciences, Gainesville, FL 1989.
Portier, Ken. "Statistical Sample Survey Design for Estimation of Agricultural Water Use."University of Florida, Institute of Food and Agricultural Sciences, Gainesville, FL,October 1988.
Robison, L. J. and P. J. Barry. The Competitive Firm's Response to Risk. Macmillan PublishingCompany, New York, New York, 1987.
59

"St. Johns River Water Management District: A Brief Overview." St. Johns River WaterManagement District, Palatka, FL, (no date).
SAS Institute Inc. SAS* User's Guide: Statistics, Version 5 Edition. Gary, NC: SAS InstituteLie. 1985.
Singleton, Vince. "Investigation of Potato Water Use in the Tri-County Area of Putnam, St.Johns, and Flagler Counties, Florida." Technical Publication SJ 90-13, St. Johns RiverWater Management District, Palatka, FL, 1990.
Smajstrla, Allen G. "Potential Evapotranspiration Probabilities and Distributions in Florida."Florida Cooperative Extension Service, University of Florida, Institute of Food andAgricultural Sciences, Gainesville, FL 1984.
Smajstrla, Allen G. "Basic Irrigation Scheduling in Florida." Florida Cooperative ExtensionService, University of Florida, Institute of Food and Agricultural Sciences, Gainesville, FL1988.
•*"
Smajstrla, Allen G. "Efficiencies of Florida Agricultural Irrigation Systems." Florida CooperativeExtension Service, University of Florida, Institute of Food and Agricultural Sciences,Gainesville, FL 1991.
Smajstrla, Allen G. "Florida Irrigation Systems." Florida Cooperative Extension Service,University of Florida, Institute of Food and Agricultural Sciences, Gainesville, FL1992(a).
Smajstrla, Allen G. "Irrigated Acreage in Florida" Florida Cooperative Extension Service,University of Florida, Institute of Food and Agricultural Sciences, Gainesville, FL1992(b).
Smith, Scott and Timothy Taylor. "Production Cost for Selected Vegetables in Florida, 1993-94." University of Florida, Institute of Food and Agricultural Sciences. Circular 1146(no date).
Soil Survey of St. Johns County, Florida. United States Department of Agriculture, SoilConservation Service. October 1983.
State Soil Geographic Data Base (STATSGO): Data Users Guide. United States Department ofAgriculture, Soil Conservation Service, Miscellaneous Publication 1492, August 1991.
"Vegetable Summary 1992-1993." Florida Department of Agriculture and Consumer Services,Florida Agricultural Statistics Service, Orlando, FL, April 1994.
60

"Vegetable Summary 1993-1994." Florida Department of Agriculture and Consumer Services,Florida Agricultural Statistics Service, Orlando, FL, (to be published in late spring 1995).
Vergara, Barbara. "Water Supply Needs and Sources Assessment 1994." Technical PublicationSJ94-7, St. Johns River Water Management District, Palatka, FL, 1994.
61