Embed Size (px)
Citation preview
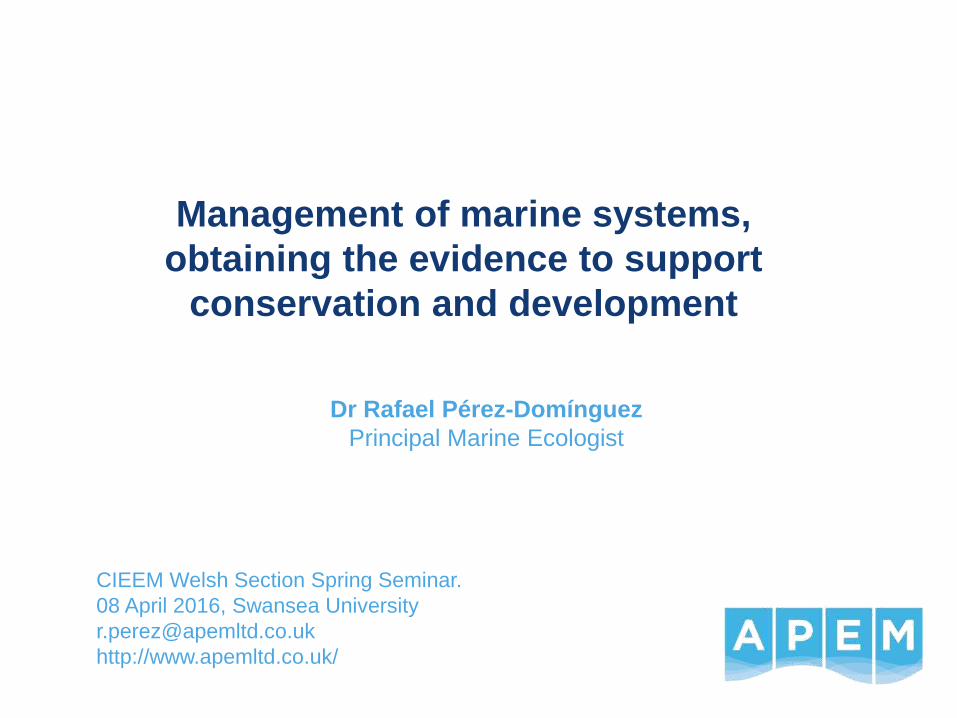
Dr Rafael Pérez-Domínguez
Principal Marine Ecologist
CIEEM Welsh Section Spring Seminar.
08 April 2016, Swansea University
http://www.apemltd.co.uk/
Management of marine systems,
obtaining the evidence to support
conservation and development
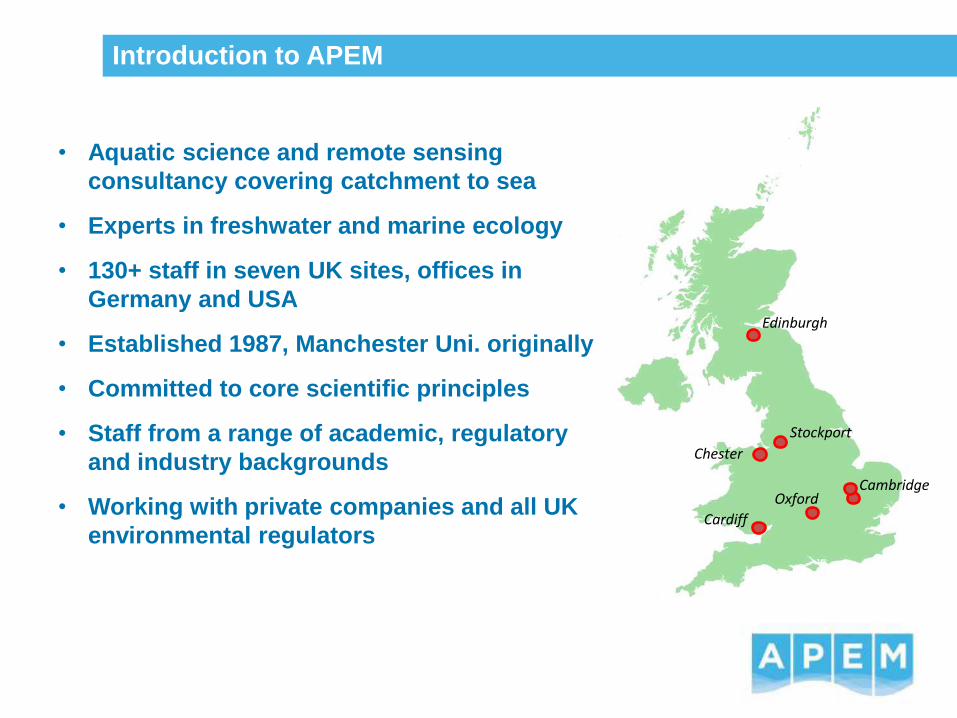
Introduction to APEM
Edinburgh
Stockport
Oxford
Cardiff
Chester
Cambridge
• Aquatic science and remote sensing
consultancy covering catchment to sea
• Experts in freshwater and marine ecology
• 130+ staff in seven UK sites, offices in
Germany and USA
• Established 1987, Manchester Uni. originally
• Committed to core scientific principles
• Staff from a range of academic, regulatory
and industry backgrounds
• Working with private companies and all UK
environmental regulators
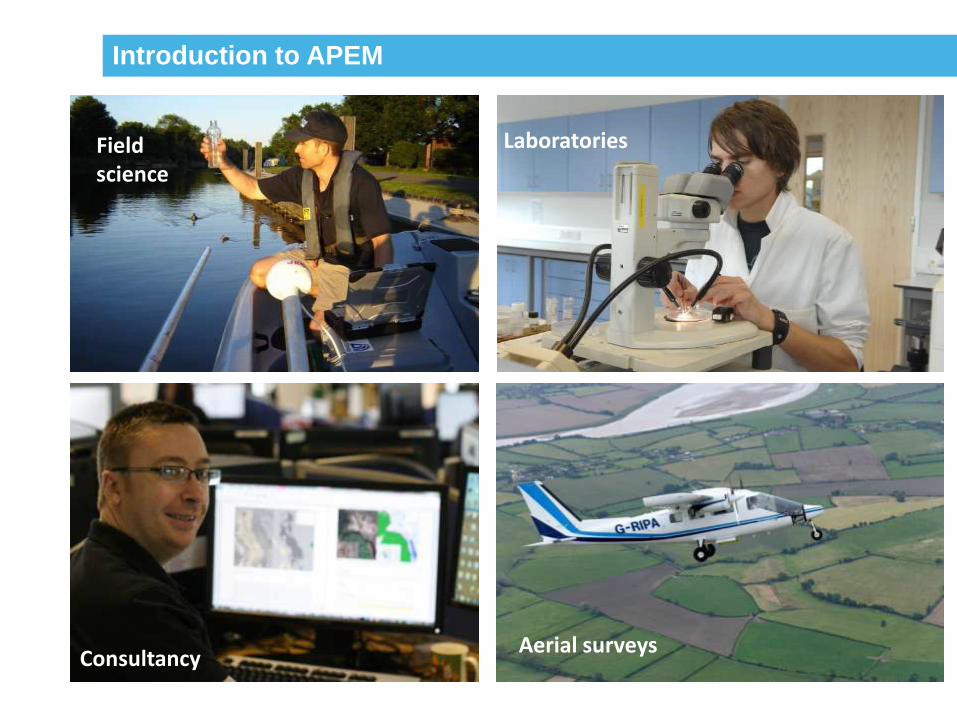
Laboratories Field science
Aerial surveys Consultancy
Introduction to APEM
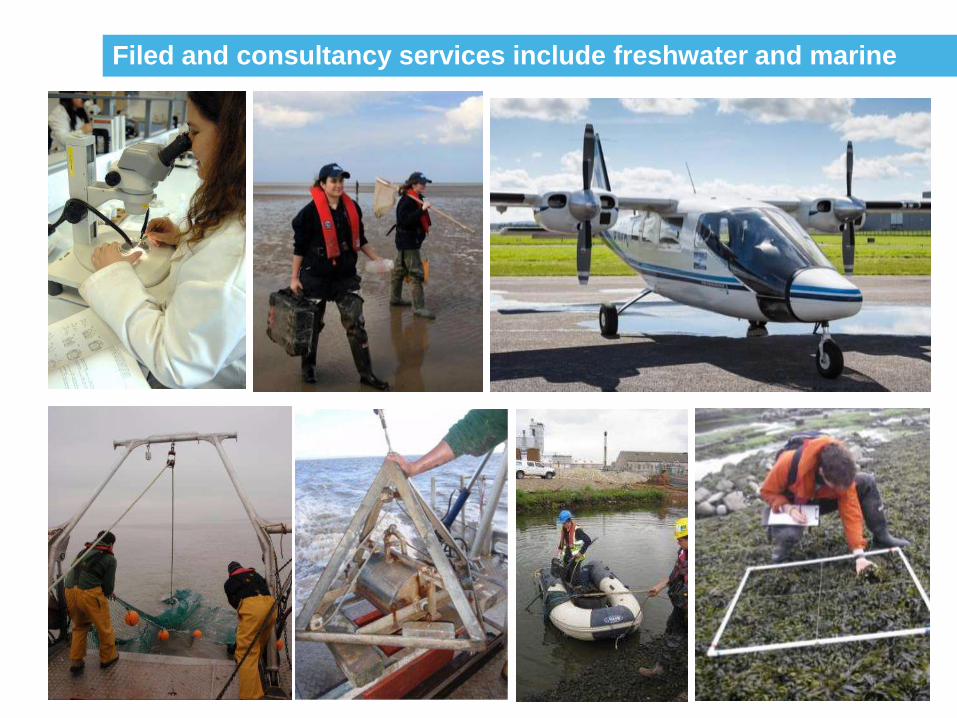
Filed and consultancy services include freshwater and marine
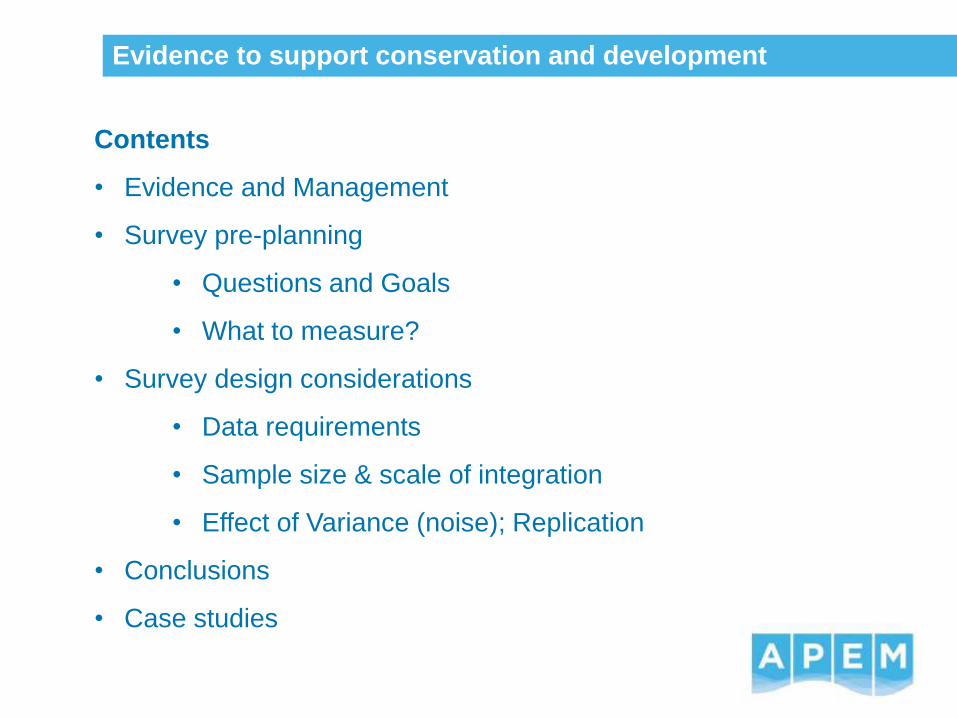
Evidence to support conservation and development
Contents
• Evidence and Management
• Survey pre-planning
• Questions and Goals
• What to measure?
• Survey design considerations
• Data requirements
• Sample size & scale of integration
• Effect of Variance (noise); Replication
• Conclusions
• Case studies

Evidence and Management
Main questions for managers:
• What is the normal situation?
• How does it vary?
• Has there been a change?
• How big is the change?
• What caused it?
• Can we propose a mechanism?
• Can we predict further changes?
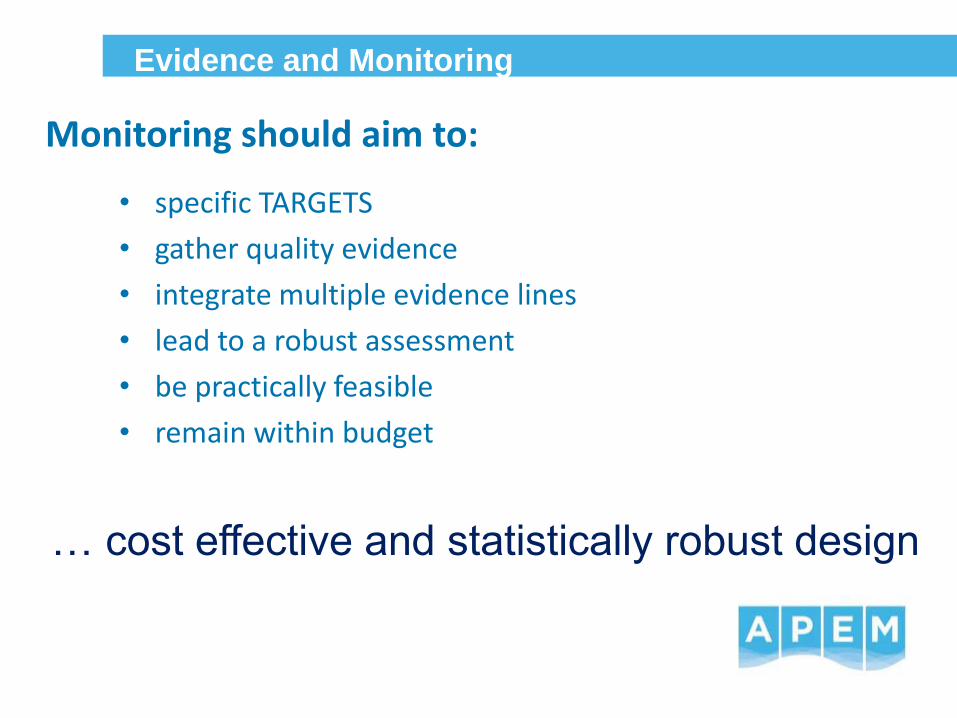
Evidence and Monitoring
Monitoring should aim to:
• specific TARGETS
• gather quality evidence
• integrate multiple evidence lines
• lead to a robust assessment
• be practically feasible
• remain within budget
… cost effective and statistically robust design
Survey pre-planning: Questions and Goals
Monitoring objectives I:
1. Estimation of temporal & spatial changes in abundance (e.g. species distribution; diversity)
2. Prediction at unsampled locations & times (species-habitat models)
set baseline conditions…
Bijleveld et al. 2012 Methods in Ecology and Evolution 3: 526-536

Survey pre-planning: Questions and Goals
Monitoring objective II:
1. be able to answer few questions: a. does change correlate with the onset of a disturbance?
b. is it specific to the impacted location?
c. do we have enough confidence to rule out effects when we do not see change? POWER!
How to do it? Measure something…
Survey pre-planning: What to measure?
Best quality metrics for monitoring should:
– be sensitive to human pressure
– provide a robust indication (signal to noise ratio high)
– be accurate and technically feasible
– have available reference
– have wide biogeographical relevance
– be bound by time and budget constraints
– be of easy interpretation by non-specialists
follow best practice and guidance
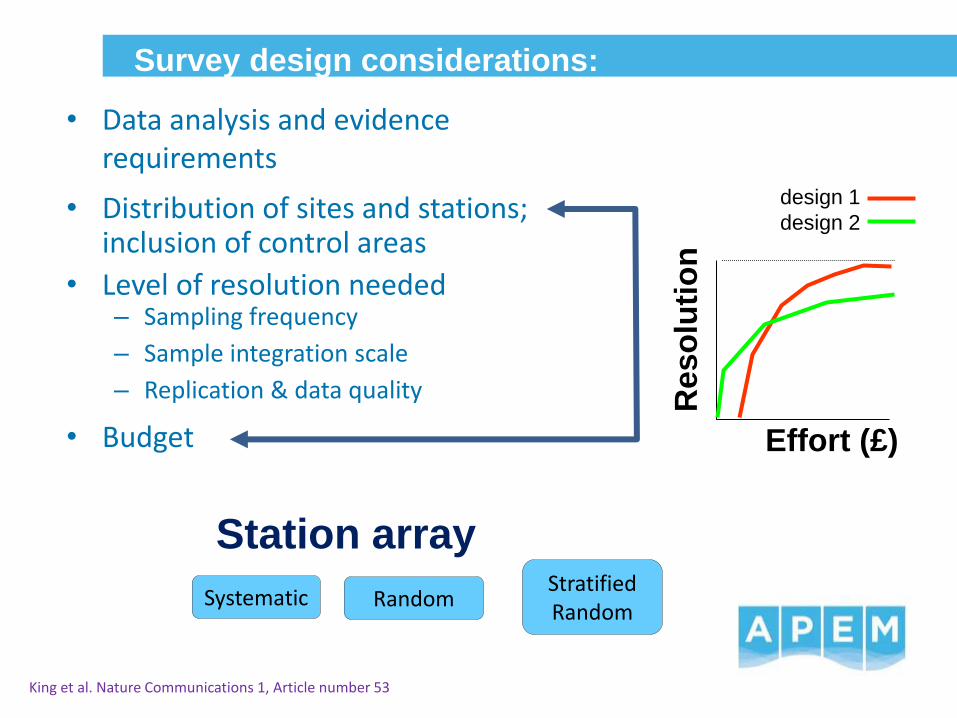
Survey design considerations:
• Data analysis and evidence requirements
• Distribution of sites and stations; inclusion of control areas
• Level of resolution needed – Sampling frequency
– Sample integration scale
– Replication & data quality
• Budget Effort (£)
Reso
luti
on
design 1
design 2
King et al. Nature Communications 1, Article number 53
Systematic Random Stratified Random
Station array
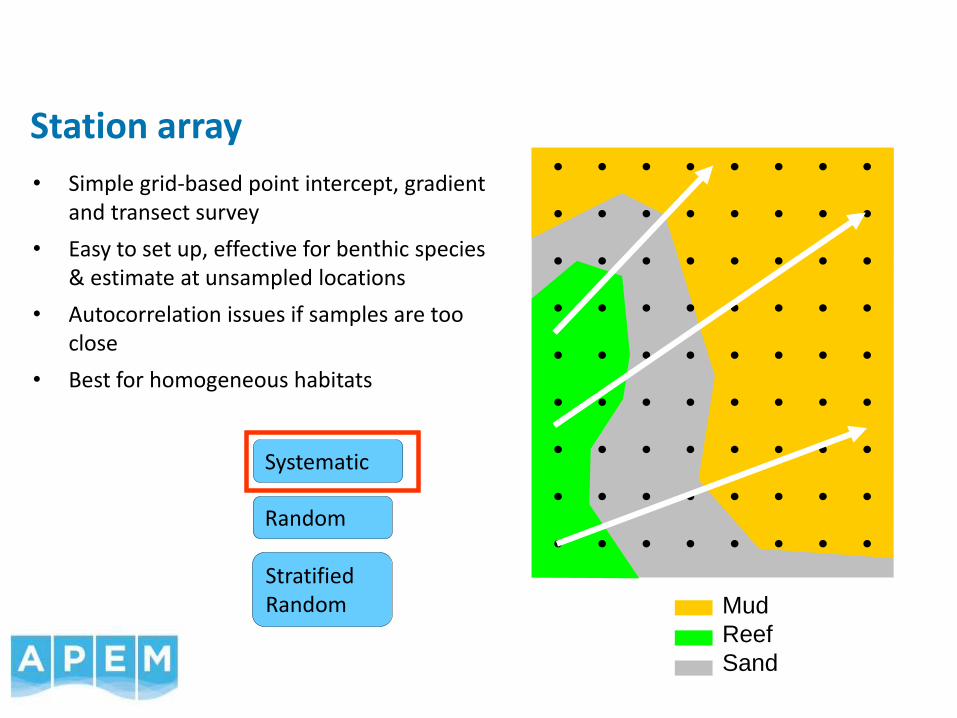
Mud
Reef
Sand
Systematic
Random
Stratified Random
Station array
• Simple grid-based point intercept, gradient and transect survey
• Easy to set up, effective for benthic species & estimate at unsampled locations
• Autocorrelation issues if samples are too close
• Best for homogeneous habitats
Mud
Reef
Sand
Systematic
Random
Stratified Random
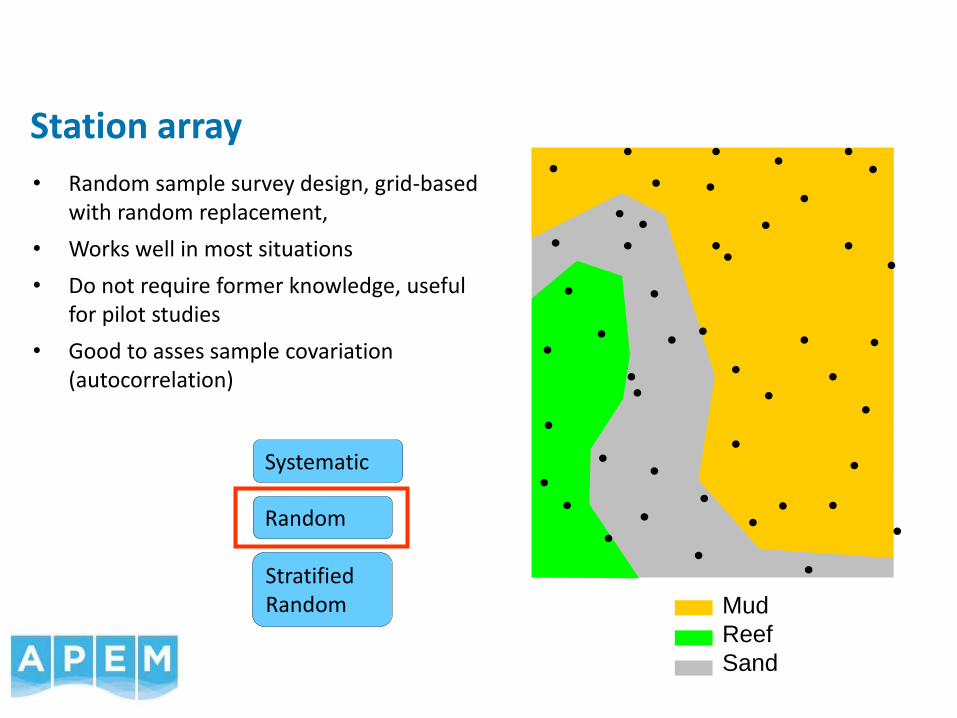
• Random sample survey design, grid-based with random replacement,
• Works well in most situations
• Do not require former knowledge, useful for pilot studies
• Good to asses sample covariation (autocorrelation)
Station array
Mud
Reef
Sand
Systematic
Random
Stratified Random
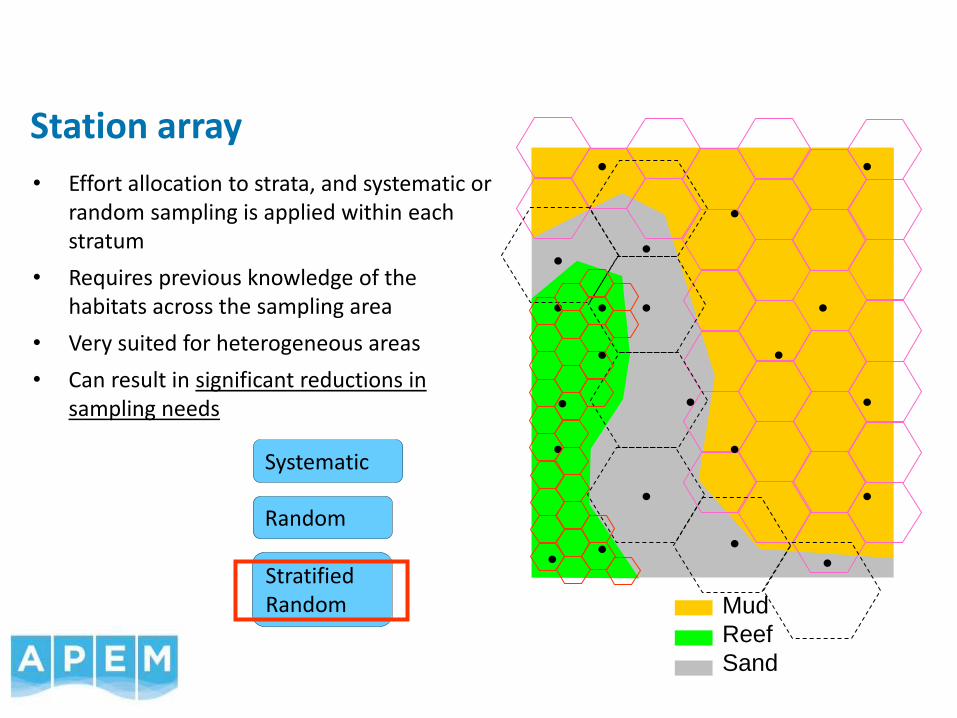
• Effort allocation to strata, and systematic or random sampling is applied within each stratum
• Requires previous knowledge of the habitats across the sampling area
• Very suited for heterogeneous areas
• Can result in significant reductions in sampling needs
Station array

Survey design considerations: Diversity
• Minimum sampling effort
• Probability estimates
• Density of target species
– Doubling the area yields < 5-10% new species
– Estimated sample area needed to get a particular Taxa 90% of the times
ARBITRARY cut-off points
aim for a reasonable balance
Ranked Species
To
tal
ab
un
da
nce
habitat 1
habitat 2
K dominance curves
Area / Vol. / no samples or no ind.
Nu
mb
er
of
Sp
ec
ies
Spp. accumulation curves
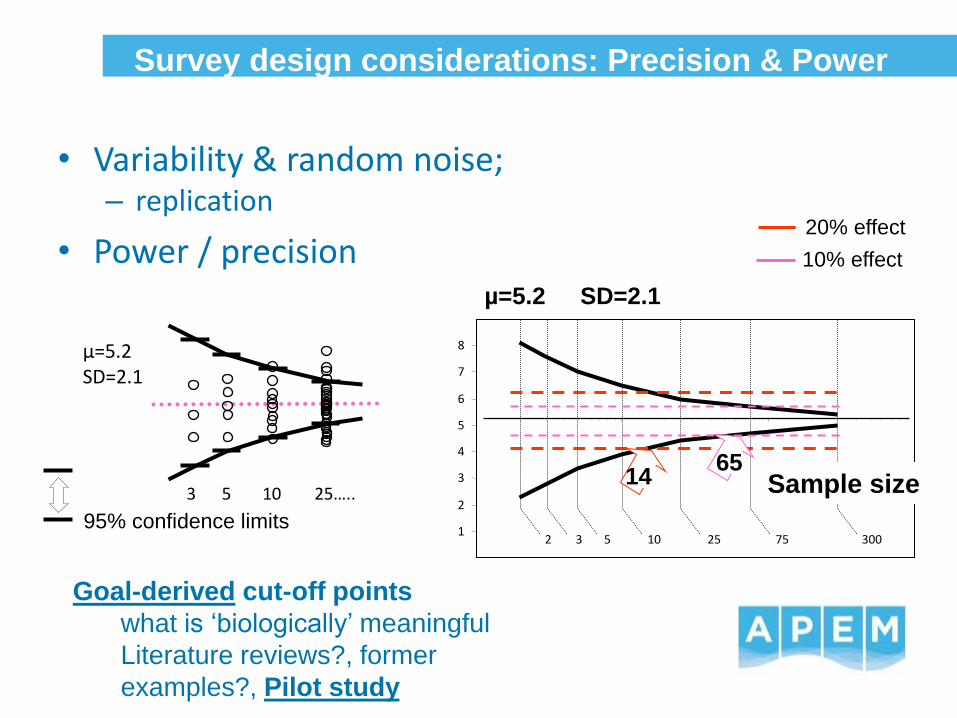
Survey design considerations: Precision & Power
• Variability & random noise; – replication
• Power / precision
Goal-derived cut-off points
what is ‘biologically’ meaningful
Literature reviews?, former
examples?, Pilot study
µ=5.2 SD=2.1
1
2
3
4
5
6
7
8
2 3 5 10 25 75 300
Sample size 3 5 10 25…..
µ=5.2 SD=2.1
14
20% effect
10% effect
65
95% confidence limits

Sample autocorrelation Habitat heterogeneity
Behaviour & Seasonality
Patchiness
Dissimilar abundance Sampling bias
Uncertainty on sample
integration Operational conditions
problems
Sample array Stratified random designs; modelling Target times-areas of max activity / abundance Replication & sample integration Intercalibration & standards; multi gear assessments Sp. accumulation curves and / or proxy habitat quantification Modify methods & gear to increase operational range
adjustments
Conclusions: Improving sampling design
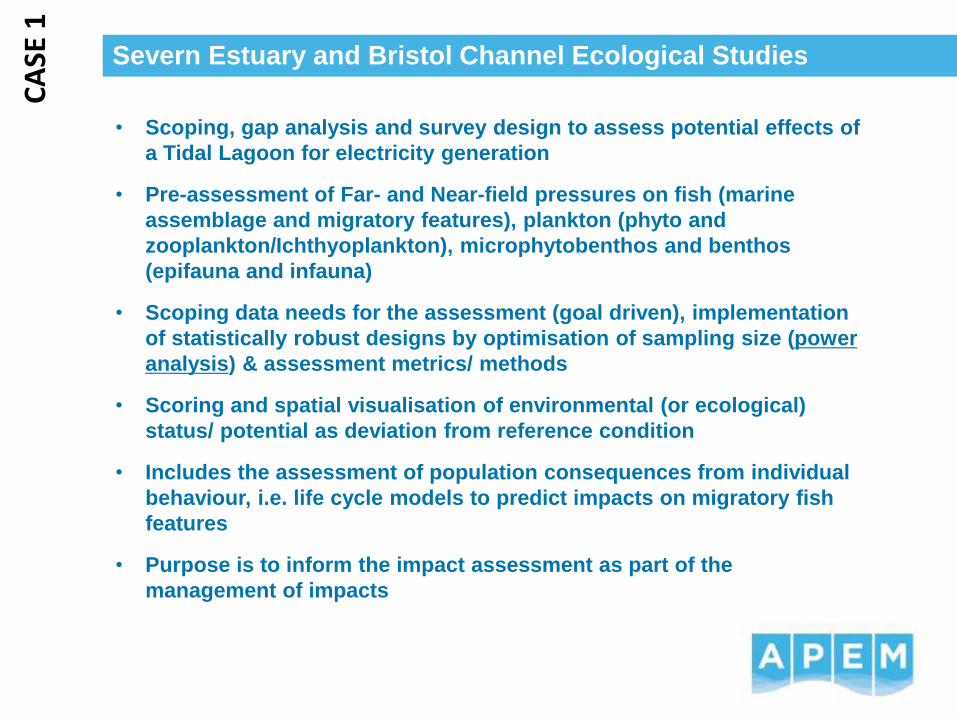
Severn Estuary and Bristol Channel Ecological Studies
• Scoping, gap analysis and survey design to assess potential effects of
a Tidal Lagoon for electricity generation
• Pre-assessment of Far- and Near-field pressures on fish (marine
assemblage and migratory features), plankton (phyto and
zooplankton/Ichthyoplankton), microphytobenthos and benthos
(epifauna and infauna)
• Scoping data needs for the assessment (goal driven), implementation
of statistically robust designs by optimisation of sampling size (power
analysis) & assessment metrics/ methods
• Scoring and spatial visualisation of environmental (or ecological)
status/ potential as deviation from reference condition
• Includes the assessment of population consequences from individual
behaviour, i.e. life cycle models to predict impacts on migratory fish
features
• Purpose is to inform the impact assessment as part of the
management of impacts
CA
SE 1
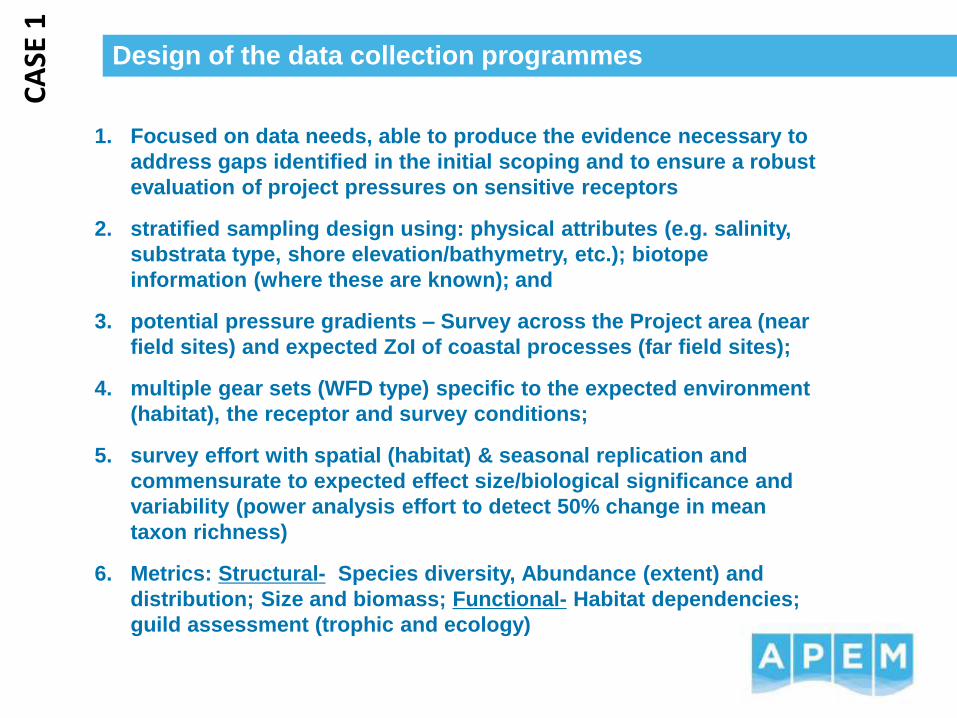
Design of the data collection programmes
1. Focused on data needs, able to produce the evidence necessary to
address gaps identified in the initial scoping and to ensure a robust
evaluation of project pressures on sensitive receptors
2. stratified sampling design using: physical attributes (e.g. salinity,
substrata type, shore elevation/bathymetry, etc.); biotope
information (where these are known); and
3. potential pressure gradients – Survey across the Project area (near
field sites) and expected ZoI of coastal processes (far field sites);
4. multiple gear sets (WFD type) specific to the expected environment
(habitat), the receptor and survey conditions;
5. survey effort with spatial (habitat) & seasonal replication and
commensurate to expected effect size/biological significance and
variability (power analysis effort to detect 50% change in mean
taxon richness)
6. Metrics: Structural- Species diversity, Abundance (extent) and
distribution; Size and biomass; Functional- Habitat dependencies;
guild assessment (trophic and ecology)
CA
SE 1

FISH CHARACTERISATION
• 10 inshore trawl
boxes – WFD-
compliant 1.5 m-
wide beam trawl
• 20 offshore trawl
lines – WFD-
compliant Otter
trawl
A2 littoral biotopes (soft sediments) A3 infralittoral biotopes (rock) A4 circalittoral biotopes (rock) A5 sublittoral biotopes (soft sediments) A5.6 Biogenic Reef; B3.1 splash zone
Total effort 560 sampling events (2 years plan & 4 seasonal
surveys), 45-65 species expected (lower estimate from
species accumulation curves & pilot survey results) by the
end of the programme
CA
SE 1
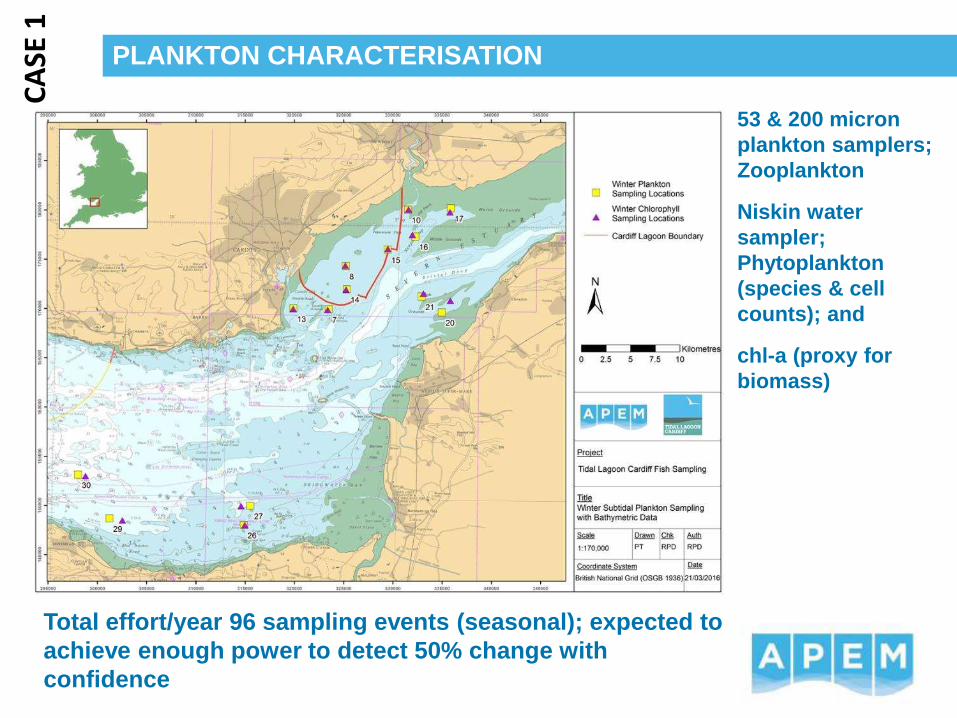
PLANKTON CHARACTERISATION
• 53 & 200 micron
plankton samplers;
Zooplankton
• Niskin water
sampler;
Phytoplankton
(species & cell
counts); and
• chl-a (proxy for
biomass)
Total effort/year 96 sampling events (seasonal); expected to
achieve enough power to detect 50% change with
confidence
CA
SE 1

BENTHOS CHARACTERISATION
Subtidal habitats
• Single Day grab (0.1m2) sample
for fauna; PSA subsample from
sediment texture
• 2 seasonal surveys (Feb and
June)
Intertidal habitats
• Aerial survey & Phase I survey
(data for biotope/habitat
distribution)
• Phase II survey (Quantitative
data -species richness,
diversity, abundance/density)
• One survey/year (August to
September)
CA
SE 1
Swansea Bay Topographic and Habitat Mapping project
• Survey design & habitat mapping project
• Full area coverage and transect-based Phase I intertidal verification
survey
• Purpose was to inform the impact assessment as part of the
management of impacts
• High-resolution aerial surveys of the coastal area from The Mumbles to
Kenfig using one of APEM’s survey aeroplanes
• Geo-referencing of images
• Digital Elevation Model (DEM) extraction for topography
• Review and analysis of imagery in GIS to determine broadscale
habitat types
• Targeted Phase I biotope survey to ground truth imagery & provide
greater detail on habitat types
• Outputs were sent to the Regulator as part of the consenting process
for the Swansea Bay Tidal Lagoon project
CA
SE 2
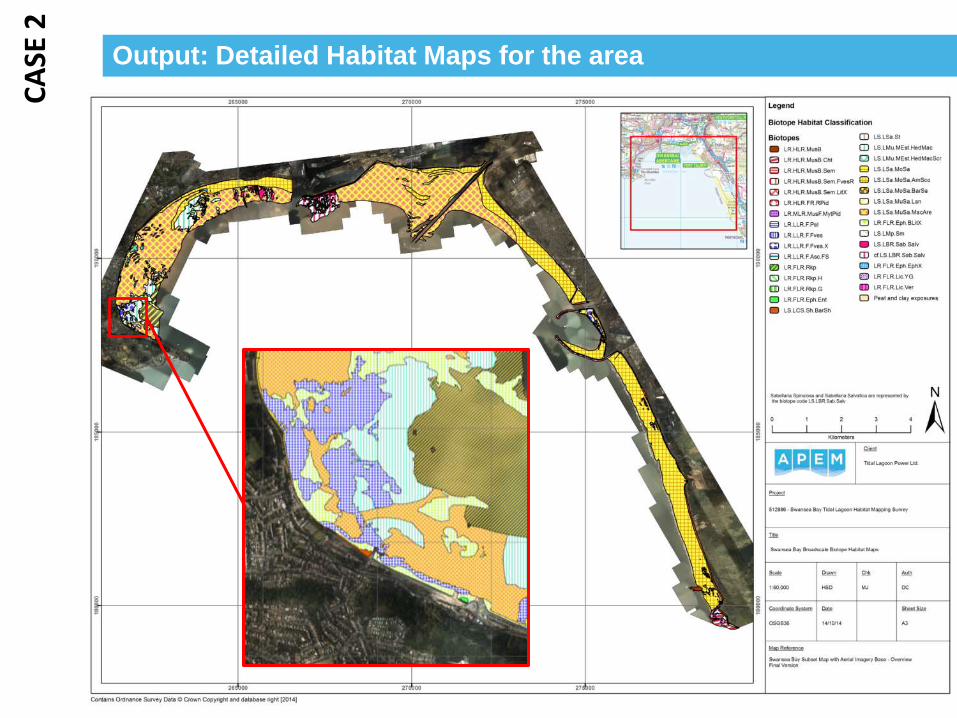
Output: Detailed Habitat Maps for the area C
ASE
2
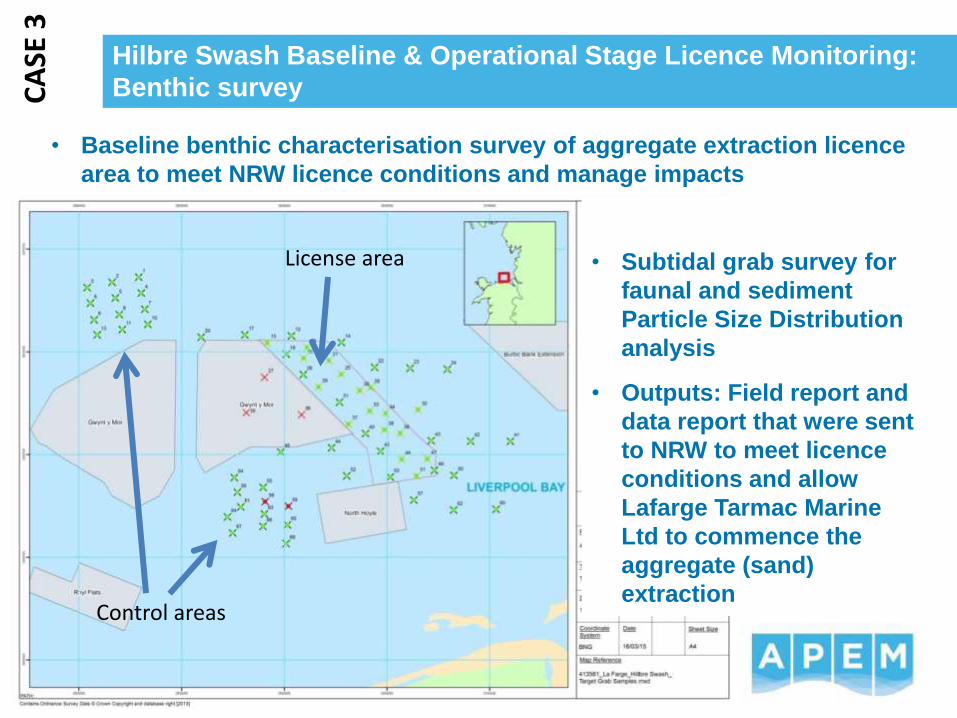
Hilbre Swash Baseline & Operational Stage Licence Monitoring:
Benthic survey
• Baseline benthic characterisation survey of aggregate extraction licence
area to meet NRW licence conditions and manage impacts
CA
SE 3
License area
Control areas
• Subtidal grab survey for
faunal and sediment
Particle Size Distribution
analysis
• Outputs: Field report and
data report that were sent
to NRW to meet licence
conditions and allow
Lafarge Tarmac Marine
Ltd to commence the
aggregate (sand)
extraction
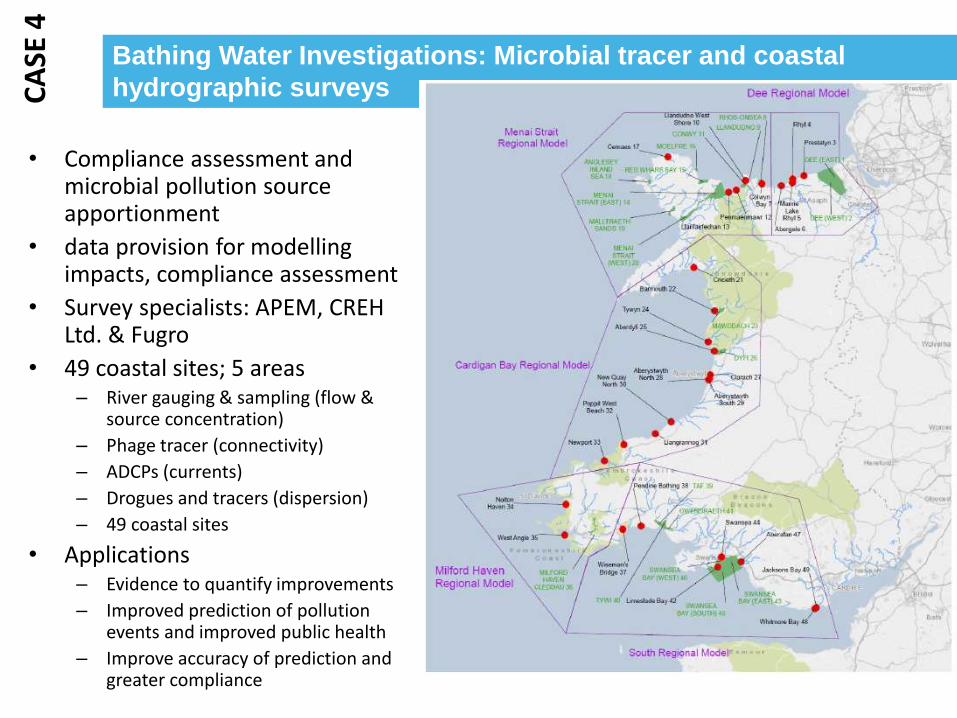
Bathing Water Investigations: Microbial tracer and coastal
hydrographic surveys
• Compliance assessment and microbial pollution source apportionment
• data provision for modelling impacts, compliance assessment
• Survey specialists: APEM, CREH Ltd. & Fugro
• 49 coastal sites; 5 areas – River gauging & sampling (flow &
source concentration)
– Phage tracer (connectivity)
– ADCPs (currents)
– Drogues and tracers (dispersion)
– 49 coastal sites
• Applications – Evidence to quantify improvements
– Improved prediction of pollution events and improved public health
– Improve accuracy of prediction and greater compliance
CA
SE 4
Dr Rafael Perez-Dominguez Principal Marine Ecologist [email protected]
Conclusions: Improving evidence for management
• Objectives must be defined early in the planning phase
• Add as much replicated sites as practically feasible. If possible impact areas
should also be replicated to improve ability to detect changes
• Interanual variability, temporal and spatial covariation must be considered to
scope the number of sites and times in monitoring programmes. How many
years are required for a characterisation?
• Robust designs require robust assessment metrics, low natural variability and
good signal-to-noise ratio. Standard sampling protocols should be used.
• Pilot studies are a very useful design tool for scoping sampling needs and
sampling designs (e.g. stratified designs)
• Increasing sampling effort (sample size & number of replicates) generally
improves resolution, but effort cannot be increased indefinitely… cost
• Increasing size effect reduces the number of samples required (power
increases)… alternatively delaying the assessment reduce sampling needs as the
deviation from baseline would be larger. Acceptable?