Embed Size (px)
Citation preview
Management of new deerpopulations in Northlandand Taranaki
SCIENCE FOR CONSERVATION 212
K.W. Fraser, J.P. Parkes and C. Thomson
Published by
Department of Conservation
P.O. Box 10-420
Wellington, New Zealand

Science for Conservation is a scientific monograph series presenting research funded by New Zealand
Department of Conservation (DOC). Manuscripts are internally and externally peer-reviewed; resulting
publications are considered part of the formal international scientific literature.
Titles are listed in the DOC Science Publishing catalogue on the departmental website http://
www.doc.govt.nz and printed copies can be purchased from [email protected]
© Copyright January 2003, New Zealand Department of Conservation
ISSN 1173�2946
ISBN 0�478�22346�3
This report was prepared for publication by DOC Science Publishing, Science & Research Unit; editing
by Lynette Clelland and layout by Ruth Munro. Publication was approved by the Manager, Science &
Research Unit, Science Technology and Information Services, Department of Conservation, Wellington.
CONTENTS
Abstract 5
1. Introduction 6
2. Background 6
3. Objectives 9
4. Methods 9
5. Results 10
5.1 Nature and scale of deer farming 10
5.2 Extent of new deer populations 11
5.3 Escapes from deer farms 11
5.4 Farmer awareness of conservation and agricultural threats 13
5.5 Early reporting of new deer populations 14
5.6 Surveillance and monitoring of new or remnant deer populations 14
5.6.1 Different questions�different methods 14
5.6.2 Methods to detect deer 15
5.6.3 Search design and detection probabilities 16
5.7 Methods to eradicate low-density deer populations 17
5.8 Current eradication campaigns 18
5.8.1 Allocation of resources 18
5.8.2 Deer killed 19
5.9 Priorities for managing new deer populations 21
6. Discussion 22
7. Recommendations 23
8. Acknowledgements 23
9. References 24
Appendices 26

4 Fraser et al.�Managing new deer populations in Northland and Taranaki

5Science for Conservation 212
© January 2003, Department of Conservation. This paper may be cited as:
Fraser, K.W.; Parkes, J.P.; Thomson, C. 2002: Management of new deer populations in Northland and
Taranaki. Science for Conservation 212. 30 p.
Management of new deerpopulations in Northlandand Taranaki
K.W. Fraser, J.P. Parkes, and C. Thomson
Landcare Research, PO Box 69, Lincoln 8152, New Zealand
A B S T R A C T
Over the last decade, many new populations of deer, mainly red deer (Cervus elaphus
scoticus), but also wapiti (C. e. nelsoni), sika (C. nippon), fallow (Dama dama dama),
and sambar (C. unicolor unicolor) deer, have established in the wild in the previously
deer-free areas of Northland and Taranaki in New Zealand. Deer regularly escape from
farms, but in about 85% of cases the animals are quickly recaptured. No new populations
established via escapes in the areas where deer farming is banned in either region. The
Department of Conservation (DOC) has been largely successful in eradicating those
populations that were not recaptured by the farmers. Illegal liberations of deer pose a
more serious problem, and two sika herds have established in eastern Northland in an area
where deer farming is banned. Deer farmers were surveyed on the status of their farming
enterprises and on the number, size, and causes of any escapes, and on their views on the
potential threats to conservation and bovine Tb issues that new deer populations pose. In
42 escape events reported by farmers, an average of 13 deer escaped per incident. In 33
cases where a cause was identified, human error was blamed in 30%, damage to fences in
30%, the rest resulting from inadequate fences. Between June 1997 and May 2000, DOC
killed 74 deer in 18 areas in Northland, eradicating all but one herd (sika in Russell Forest).
Between June 1997 and June 2001, DOC killed 323 deer in 20 areas in Taranaki,
eradicating 8 herds. The eradication programmes for new populations of deer should be
continued in Northland and Taranaki, and extended to other deer-free areas north of
Auckland, on the Coromandel Peninsula, and on Banks Peninsula. The time spent on
different activities related to prevention and eradication of new wild deer populations
should be recorded as either �proactive� or �reactive� for either escapee populations or
illegal liberation populations, so that a cost�benefit analysis of the two strategies can be
developed for each situation.
Keywords: deer, deer farming, new populations, illegal liberations, escapes,
surveillance, control, eradication

6 Fraser et al.�Managing new deer populations in Northland and Taranaki
1. Introduction
In recent years new deer populations have established in previously deer-free areas in
Northland and Taranaki. This has led the New Zealand Department of Conservation
(DOC) and other agencies to intensify their surveillance of deer farming in these
areas, and to initiate programmes to remove any wild populations that have
established. These programmes have been conducted with funding and/or other
forms of support from the Animal Health Board (AHB), the local branches of the Deer
Farmers� Association, and, for Northland, the Northland Regional Council. The
Science & Research Unit of DOC commissioned Landcare Research, Lincoln, to survey
deer farmers to review the causes of new deer populations, to summarise the
Department�s actions, and to consider management options to reduce the risk of new
populations occurring.
2. Background
Wild populations of one or more of the seven species of deer that are present in New
Zealand have established over about 125 000 km2 (66%) of New Zealand (Fraser et al.
2000). Wild deer have historically been largely absent from areas such as Northland,
the Coromandel Peninsula, and Taranaki, but since the late 1980s there have been an
increasing number of deer seen in parts of these areas as a consequence of animals
escaping from deer farms or from illegal liberations (Fraser et al. 2000).
The forests of Northland and Taranaki are not without introduced herbivores
(possums (Trichosurus vulpecula) in all, and feral goats (Capra hircus) in many).
But these species are often the subject of extensive control operations in both areas
(Department of Conservation 1998, 1999), and it would be counter-productive to
control one ungulate (feral goats) only to have them replaced by another (deer).
Therefore, new deer populations represent a significant threat to conservation values
in the two areas (Nugent et al. 2001a, b). New populations of deer also present a risk
to the farming industry through the potential maintenance and transmission of bovine
tuberculosis (Tb) to other wildlife (possums and ferrets) and to livestock (Alspach
1993; Nugent et al. 2001a). It is perhaps not a coincidence that areas free of wild deer
in New Zealand have also remained free of Tb in possums, i.e. deer (as an amplifying
host) may be the link between Tb in cattle and Tb in possums (Morris & Pfeiffer 1995;
Lugton et al. 1998).
The management response to the new deer populations has been both proactive and
reactive. Proactive management, aimed at reducing the risk that new populations will
become established, has been attempted by legal and social instruments. Deer farming is
prohibited by regulation in parts of both Northland and Taranaki (see Figs 1 and 2).
Where it is permitted, farming is regulated under the Wild Animal Control Act 1977,
particularly section 12, which requires farmers to obtain a permit to farm and to maintain
adequate fences. Fencing standards on deer farms are prescribed generally in the Wild
Animal Control Act. DOC is currently developing more comprehensive standards and

7Science for Conservation 212
��
��
��
��
��
��
��
��
�
����
�� �
��
�
�
��
����
��
�� �� �
�
��������
� �
��������������������
��
� �� ��
��
�
�!������ �
���"��!�
#"!��
�
�
�
�
�
��
�
$!���!�!
%!���! &��� �!�'�(����)(�
&���!�!
�����"���
*���+��, �
-!�����
�� $����!�� �������� ���������� &�������� ����!�� *����� ����� ��.������
��
��
��
��
��
��
�
�� ��!��!�!"�!� %!���!��� ���� & ��"� %���� ��!��!�!����"!
� %�!���� #��� � ��
/����0��� ���"��� + ���
��)�"�"!��� ���
Figure 1. Approximate range boundaries of new deer populations (darker shading), and thedeer-farming exclusion boundaries (lighter shading) in Northland, 1999.

8 Fraser et al.�Managing new deer populations in Northland and Taranaki
��
�
�
�
���
��
��
��
���
��
���
��
��
��
��)�%�(��!��
��
�
�
��
����������
��
��
� �� ��
�������
�
�
�
�
�
��
�
��
�������� ������ ���!1������/�!����-�)� � ���
�� ���� 00�
�� ��
#�!��
%�� ��!
�� '!���1 ����� &�������� �� ������1%������� &�����1����!��!��� $!� )� � � �� ������� &� ��
��
��
��
��
��
��
-���� ��%!�������2�!� 1%!����!��&��������!#����#�!���!�!3�)�������!��!��
�� ������
/����0��� ���"��� + ���
��)�"�"!��� ���
Figure 2. Approximate range boundaries of new deer populations (darker shading), and thedeer-farming exclusion boundaries (lighter shading) in Taranaki, 1999.
inspection procedures that will be a prerequisite for farmers to obtain approval to farm
deer, and as a guide to DOC managers� inspections in areas where escaped deer pose an
additional risk. Finally, public and stakeholder awareness of the problem is reinforced in
proactive planning documents such as the local Conservation Management Strategies and
Regional Pest Management Strategies. Reactive management, aimed at dealing with the
new populations as they are discovered, has focused on surveillance, early detection, and
on eradicating any populations discovered.

9Science for Conservation 212
3. Objectives
The objectives are to reduce the risk that new deer populations will establish in Northland
and Taranaki, and to improve the chance that any that do establish will be detected and
removed by:
� describing the main causes of farm escapes and illegal liberations of deer
� reviewing methods for the early detection of new deer populations
� reviewing control techniques most suited to eradicating new deer populations
� developing a ranking system and procedures to identify priorities for managing new
deer populations by proactive and reactive strategies.
4. Methods
A national survey of the distribution and mode of establishment of newly established
introduced wild animal populations was conducted between 1993 and 1996 (Fraser
et al. 1996, 2000), and the data from Northland and Taranaki were updated for this
review using information provided by local DOC staff and various unpublished
reports. In addition, all deer farmers in Northland and Taranaki were surveyed using
a postal questionnaire in 1999 (Appendix 1). This survey was used to assess the scale
and type of deer farming operations in each region, the frequency and causes of farm
escapes, farmers� views on escaped deer, the threats they posed, and DOC�s
management responses. A total of 125 questionnaires were posted to all members of
the Northland (n = 75) and Taranaki (n = 50) Deer Farmers� Association, from which
58 responses (32 from Northland and 26 from Taranaki) were returned.
From June 1997 to May 2000 for Northland, and from June 1997 to July 2001 for
Taranaki, data on DOC�s operational activities were collected as staff attempted to
eradicate some of the new populations of deer. Monthly reports were provided on the
effort spent on planning, administration, inspecting deer farms, surveillance of
suspected new herds, liaison and communication with stakeholders, training staff,
deer control, and other �miscellaneous� activities for each region. DOC staff also
provided a standardised record for each deer killed that included the species, the area
where it was killed, how it was killed, its reproductive status and sex, and whether it
had an ear tag (or a hole in an ear) indicating it had been farmed. They also supplied
a lower jawbone from which we determined its age (using tooth eruption or dental
cementum layers: Fraser & Sweetapple 1993). Additional information was gleaned
from each Conservancy�s annual wild deer reports (e.g. McKenzie 1997, 2000) and
from periodic operational reports.
10 Fraser et al.�Managing new deer populations in Northland and Taranaki
5. Results
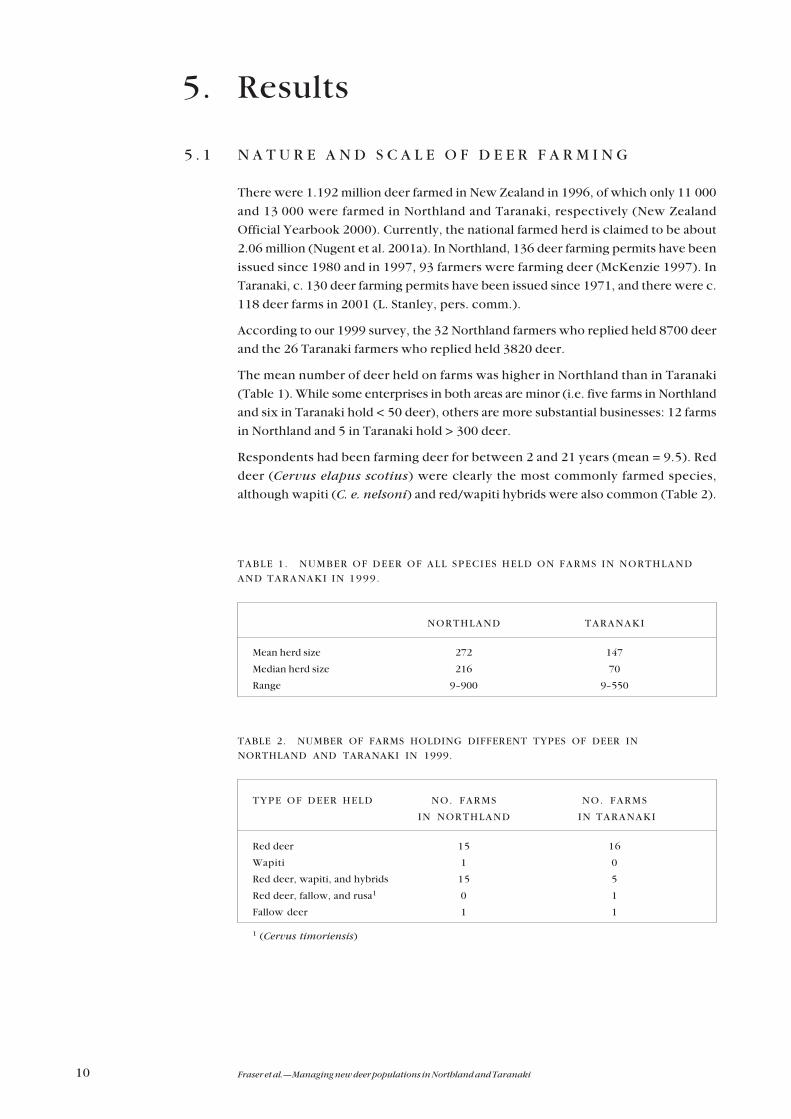
5 . 1 N A T U R E A N D S C A L E O F D E E R F A R M I N G
There were 1.192 million deer farmed in New Zealand in 1996, of which only 11 000
and 13 000 were farmed in Northland and Taranaki, respectively (New Zealand
Official Yearbook 2000). Currently, the national farmed herd is claimed to be about
2.06 million (Nugent et al. 2001a). In Northland, 136 deer farming permits have been
issued since 1980 and in 1997, 93 farmers were farming deer (McKenzie 1997). In
Taranaki, c. 130 deer farming permits have been issued since 1971, and there were c.
118 deer farms in 2001 (L. Stanley, pers. comm.).
According to our 1999 survey, the 32 Northland farmers who replied held 8700 deer
and the 26 Taranaki farmers who replied held 3820 deer.
The mean number of deer held on farms was higher in Northland than in Taranaki
(Table 1). While some enterprises in both areas are minor (i.e. five farms in Northland
and six in Taranaki hold < 50 deer), others are more substantial businesses: 12 farms
in Northland and 5 in Taranaki hold > 300 deer.
Respondents had been farming deer for between 2 and 21 years (mean = 9.5). Red
deer (Cervus elapus scotius) were clearly the most commonly farmed species,
although wapiti (C. e. nelsoni) and red/wapiti hybrids were also common (Table 2).
TABLE 1 . NUMBER OF DEER OF ALL SPECIES HELD ON FARMS IN NORTHLAND
AND TARANAKI IN 1999.
NORTHLAND TARANAKI
Mean herd size 272 147
Median herd size 216 70
Range 9�900 9�550
TABLE 2. NUMBER OF FARMS HOLDING DIFFERENT TYPES OF DEER IN
NORTHLAND AND TARANAKI IN 1999.
TYPE OF DEER HELD NO. FARMS NO. FARMS
IN NORTHLAND IN TARANAKI
Red deer 15 16
Wapiti 1 0
Red deer, wapiti, and hybrids 15 5
Red deer, fallow, and rusa1 0 1
Fallow deer 1 1
1 (Cervus timoriensis)

11Science for Conservation 212
5 . 2 E X T E N T O F N E W D E E R P O P U L A T I O N S
Between 1993 and 1996, 30 and 10 new deer populations were reported in
Northland and Taranaki, respectively (Fraser et al. 1996). In Northland, 10 new
populations (7 red deer, 2 fallow deer (Dama dama dama), and 1 wapiti) had
resulted from farm escapes, 4 (3 red deer and 1 sika (C. nippon)) were attributed
solely to illegal liberations, 1 (red deer) resulted from escapes following an accident
while transporting deer, and 12 (10 red deer and 2 fallow deer) had unknown origins.
A further 3 new populations (all of red deer) were believed to have originated from
both farm escapes and illegal liberations in the same area. In Taranaki, 1 new
population (red deer) resulted from a farm escape, 7 (3 red deer, 3 fallow deer, and 1
sika) were attributed to illegal liberations, and 2 (1 red deer and 1 sika) are believed to
have resulted from natural dispersal from adjacent wild herds.
In the current study, 28 new populations were identified in Northland (Fig. 1). Only
two of these herds, the sika populations at Opua and Russell, which both originated
from illegal releases, were within the areas where deer farming is prohibited. The
range sizes of these new herds varied from 360 ha to 24 148 ha, with an average of
3700 ± 2040 (95% C.L.) ha. Most (18) covered less than 2000 ha and only three (all
red deer) extended over 10 000 ha. Overall, deer populations in Northland inhabited
an area of c. 103 000 ha.
In Taranaki, 26 new populations were identified in the current study, with none being
recorded within the deer-farming exclusion zone (a 7-km-wide buffer around Egmont
National Park) (Fig. 2). The range sizes of these herds varied from 112 ha to c.
11 175 ha, with an average of 3329 ± 1177 ha. Only the Makino red deer herd
occupied more than 10 000 ha, and the total range of all herds was c. 80 000 ha.
Since the data collection phase of this project was completed, evidence of three new
deer populations in Taranaki has come to light (L. Stanley, pers. comm.): one for red
deer in the Waipapa catchment, and two for fallow deer in the Mt Messenger and
Maikaikatea areas.
5 . 3 E S C A P E S F R O M D E E R F A R M S
In Northland and Taranaki, 13 of 32 and 14 of 26 respondents, respectively, reported that
they have had escapes of deer from their farms, with 12 of the 27 farmers reporting
escapes having had more than one incident (Table 3). Most escapes involved a small
number of deer (36 of the 42 events reported involved < 10 deer), but the remaining six
events involved 20 or more animals. The largest escapes involved 70 red deer in Northland
and 270 red deer/wapiti hybrids in Taranaki. In most cases all deer were recaptured and
returned to captivity (Table 4).
The causes of escapes were provided for only two of the three farms with three
escape events. In both cases, only two of the three events could be attributed to
human error. For only one of the nine farms with two escape events, could both
escapes be attributed to human error. For the remaining 15 escape events, only five
were due to human error with the remainder attributed either to weather damage to
fences, malicious damage, or unknown.

12 Fraser et al.�Managing new deer populations in Northland and Taranaki
Failure in fences was the main cause reported for the 33 escape events where a cause
was identified. Ten escapes were due to human error (gates were left open or
unlatched), and 11 were due to inadequate fences (the deer jumped the fence: twice
when stags were fighting, and once when an animal was frightened by a helicopter).
Ten events were due to fence failure following damage in storms. The nine escapes
where a cause was not known are likely to have been due to animals jumping fences,
as farmers would presumably have noticed open gates or damaged fences (Table 5).
TABLE 3 . NUMBER OF ESCAPE EVENTS REPORTED FROM DEER FARMS IN
NORTHLAND AND TARANAKI .
NO. OF ESCAPE EVENTS N O R T H L A N D T A R A N A K I
None 19 12
1 7 8
2 5 4
3 1 2
TABLE 4 . NUMBER OF DEER INVOLVED IN 20 ESCAPE EVENTS FROM
NORTHLAND DEER FARMS AND IN 22 ESCAPE EVENTS FROM TARANAKI DEER
FARMS, AND THE % OF TIMES ALL ANIMALS WERE RECAPTURED AND RETURNED
TO CAPTIVITY.
NORTHLAND TARANAKI
Minimum no. of deer escaping 1 1
Maximum no. of deer escaping 70 270
Average no. of deer escaping 10 16
% of times all were recaptured 85% 86%
TABLE 5 . MAIN CAUSES OF REPORTED DEER ESCAPES IN NORTHLAND AND
TARANAKI .
CAUSE NO. OF ESCAPE EVENTS
NORTHLAND TARANAKI
Human error: gates left open 5 5
Human error: escaped during handling 0 2
Inadequate fences: jumped fence 4 4
Inadequate fences: jumped when fighting 0 2
Inadequate fences : jumped when scared 0 1
Unknown (inadequate fences?) 6 3
Damaged fences 5 5

13Science for Conservation 212
5 . 4 F A R M E R A W A R E N E S S O F C O N S E R V A T I O N A N D
A G R I C U L T U R A L T H R E A T S
Most farmers were aware of the threats wild deer posed to conservation values
and as possible vectors of bovine Tb. However, this awareness was greater
among Northland farmers than Taranaki farmers. In Northland, all respondents
reported that they were aware of the conservation threat posed by wild deer in
the area, and 61% viewed the threat as serious or extremely serious. However,
in Taranaki only 81% of respondents said they were aware of a conservation
threat, and only 28% thought the threat serious or extremely serious (Table 6).
In Northland, 100% of respondents were aware of the Tb issue, with 74%
believing it to be a serious or extremely serious problem; only 92% of Taranaki
respondents were aware of a problem and only 50% thought it serious or extremely
serious. Many farmers in both areas (24% in Northland and 40% in Taranaki) thought
the Tb threat from wild deer was �not very serious�. There was a significant difference
between the two regions in the level of support for the eradication programmes
against escaped or illegally liberated deer (χ2 = 18.2, d.f. = 1, P < 0.0001), perhaps a
reflection of the farmers� different perceptions of the adequacy of information
provided (Table 6).
In both regions fewer than 70% of respondents reported having a Deer QA Manual.
This manual describes the minimum operating standards that a deer farmer must
meet to achieve accreditation under the New Zealand Game Industry Board�s Deer QA
On-Farm Programme. It includes operating standards for facilities such as boundary
and internal fences and gates for both the �non-risk/non-regulated� areas and the �risk/
regulated� areas. Despite the fact that more than 30% of the farmers did not have a
manual, most thought that they complied with current regulations, and most (over
80%) reported that they checked boundary fences and gates at least monthly.
TABLE 6 . DEER FARMERS� RESPONSES TO A QUESTIONNAIRE ON DEER
FARMING AND RELATED ISSUES.
QUESTION % OF RESPONDENTS ANSWERING POSITIVELY 1
N O R T H L A N D T A R A N A K I
Do you have a Deer QA manual? 69 60
Are you aware of the specific fencing regulations for Regulated/At-risk areas? 88 81
Are you aware of bans on farming some deer species in the region? 75 69
Do your fences, gates, pens comply with current regulations? 94 92
Are you aware of the Tb risk posed by wild deer? 100 92
Are you aware of the conservation risk posed by wild deer? 100 81
Do you support DOC�s eradication operations? 90 36
Has DOC/AHB provided sufficient information about the eradication campaigns? 47 32
1 While the total numbers of respondents to the questionnaire were 32 and 26 for Northland and Taranaki, respectively, not all
respondents answered all questions; therefore, the percentages presented are calculated from the number of responses to each specific
question.

14 Fraser et al.�Managing new deer populations in Northland and Taranaki
5 . 5 E A R L Y R E P O R T I N G O F N E W D E E R P O P U L A T I O N S
It is obviously important that any new population of deer, whether from escaped
animals or from an illegal liberation, is dealt with before the animals disperse and/or
breed. Farmers� first reaction to an escape of their deer has generally been to attempt
to recapture the animals, and in most cases they have been successful in this (Table 4).
The risk is that if they wait too long to report the c. 15% of events they do not solve
themselves, or do not report them at all, a new wild population may establish,
disperse, breed, and so be more difficult to eradicate.
Unreported escapes and illegal liberations of deer are generally first noticed by members
of the rural community, so any formal reporting system to management agencies needs to
be widely known and accessible to such people. In Northland, DOC has a toll-free number
(0800 FIND DEER), which reports to the deer project coordinator through a cellphone, a
pager, and a message centre. Mischievous and �crank� calls were an initial problem, but
these were reduced by tracing such calls. Typically, DOC Northland receives about four
calls each month and checks the reports within 24 hours. This system has already resulted
in the successful recapture of several mass deer escapes, i.e. it encourages farmers to
report early and not just rely on their own devices, and is visible evidence that
management agencies are taking the problem seriously.
In Taranaki, a toll-free hotline (0800 4DEERS) was established in 1998/99, and is
supported with a range of publicity material on the threats posed by new deer
populations, the responsibilities of deer farmers, and the ways in which people could
support the DOC-led campaign to keep Taranaki forests free of deer. In 1998/99,
7339 pamphlets and stickers were sent to all rural post office box holders in the
region, followed by media publicity and meetings with various interest groups. The
publicity material was updated in 2000/01, particularly to include the Animal Health
Board�s logo to reinforce the risks deer pose to the Tb-free status of the region. Since
the hotline was established, the number of deer-related calls has halved from c. two
each month, presumably because there are fewer new events to report, and because
the close communication between the hunting team and local land owners has
ensured early notification and quick solution of any new escapes (L. Stanley,
pers. comm.).
5 . 6 S U R V E I L L A N C E A N D M O N I T O R I N G O F N E W O R
R E M N A N T D E E R P O P U L A T I O N S
The best method and search design to detect low-density deer populations will
depend on the circumstance of each case and nature of the question being
asked. In this section we first discuss the different questions faced by managers,
and then summarise the advantages and disadvantages of different methods to
detect and survey low-density deer populations.
5.6.1 Different questions�different methods
Detection/surveillance: Are any deer present or has an eradication attempt
succeeded? The answer to this question requires just enough effort to confirm
the presence of at least one deer, after which either the �detection/surveillance�
phase would stop and some management action (a survey of how many and

15Science for Conservation 212
where they are, or a control operation) would begin or continue. The problem in both
parts of the question is one of balancing the intensity of the survey against the risks of
being wrong�deer were really present but were not detected, or eradication was
falsely claimed. The solution to this problem, search design, and detection
probabilities are discussed below.
Population monitoring: Deer are present but how many and where are they? This
question requires a full survey of the whole area known or suspected to have deer.
The usual methods in New Zealand are to use randomly located faecal pellet transects
(Baddeley 1985), but in the case of low-density and/or patchy new deer populations
a stratified design is recommended, i.e. more transects would be located in areas
known or suspected to have most deer.
5.6.2 Methods to detect deer
Information from the public: In the simplest case, managers might believe deer are
present if the informant is reliable or enough independent reports are received.
However, managers usually require more certainty judging by the effort Northland
and Taranaki managers invested in �area inspections and surveillance� (see section
5.8), although much of this time may be aimed at assessing numbers and distribution
rather than just confirmation of presence (see Table 7).
Deer sign: Sign of deer (Challies 1990) is more common than the deer that make it, so
looking for faecal pellets, footprints, browse, or other sign is the usual way deer are
first detected. Deer defaecate about 20 times each day and the pellet groups can last
for many months (Nugent et al. 2001a). However, a problem with faecal pellets is that
they are similar to those of feral goats and sheep, which are common in the deer-free
areas of Northland and Taranaki. Therefore, the most reliable evidence will be some
physical proof such as a carcass or a jawbone (which can also be aged as evidence of
possible breeding), or hair samples, which can be identified to a species.
Deer sightings: The cheapest way to attempt to confirm the presence of deer is to
send in hunters to look for sign or animals, or to actually hunt them. Spotlighting,
aerial surveys, or the use of dogs may all increase the probability of detection under
appropriate circumstances. Expert hunters should be able to prioritise their effort by
predicting the most likely areas where deer would live, or they may know where
animals were reported.
For patchy forest and low scrub, an aerial survey with lightweight helicopters flying at
dusk or dawn is probably the best option. For tall, continuous forest, use of ground
hunters, usually with trained dogs, is the best option.
Thermal infrared cameras: Infrared video cameras (FLIR) detect the body heat of
warm-blooded animals when this is above that of surrounding material. Their use has
been tested in New Zealand as a method of estimating deer numbers (Wilde 2000).
This trial was conducted in a 15-ha paddock of mixed pasture and forest containing
80 fallow deer. Under optimal conditions (flying at dawn, between 550 and 1110 m
above the ground, over GPS-determined transects that covered the whole area with no
overlaps) between 31 and 146 deer were counted�the overcounts being due to deer
moving during the helicopter flyovers and so being double counted (Wilde 2000).
The FLIR system cannot detect deer through forest canopy, and from the trial results
appears to be too variable to be of use to estimate numbers with good precision.
However, it appears to be useful in detecting the presence of deer, at least when a

16 Fraser et al.�Managing new deer populations in Northland and Taranaki
reasonable number are present. The worst case under optimal conditions detected
87% of the deer present (Wilde 2000).
5.6.3 Search design and detection probabilities
None of the above methods are capable of detecting the presence of one or more deer
all the time under most realistic search intensities, so managers are often left with the
question �does the absence of evidence mean that deer are really absent?� In most
cases managers have to accept some degree of uncertainty when answering this
question, but they may wish to be able to assess how uncertain they are. To do this,
they will require a measure of the detection probability attained by different survey
methods and designs�basically managers need to detect any deer in any patch
searched with a high degree of certainty (e.g. the FLIR system appears to allow at least
87% detection probability), and search each patch in an area in some rational way and
order.
Female red deer have variable home ranges of c. 1�2 km2 in forested habitats (Nugent
& Fraser 1993), although it is not known if colonising animals behave in the same way.
Of the deer present in Northland and Taranaki, fallow deer are likely to have the
smallest home ranges, then sika, then red deer, and males of all species have larger
ranges than females (Challies 1990). Therefore, to increase the certainty that deer are
present, a survey would need to ensure no home-range-sized patches were left
uninspected if no deer were confirmed in the most likely sites. That is, survey grids
should be about 1 km2, or survey transects should be no more than 1 km apart.
Formally designed surveys are more expensive but may increase the probability of
detection or confirmation of absence. Where deer numbers are suspected to be low
and/or distribution is very patchy, a systematic survey is likely to be the optimal way
to detect presence or absence of deer, prioritised for the presence case in much the
same way as the informal survey. Where numbers are thought to be higher and/or
distribution more general, a random survey is likely to be the optimal method of
detecting deer (and estimating numbers) but, again, to confirm absence, it is essential
that all sites are covered, otherwise a negative claim would have to attach a measure of
confidence.
Choquenot et al. (2001) have modelled the effort required (E) to detect the presence
of at least one animal in a sparse population (stoats in this case, with the effort being
number of traps) with a given degree of confidence (c) over an area (A) where the
sampling method would detect their presence in a proportion of times (d).
E = (1 � (1 � c)1/d) (A � (d/2)) + 1
For detecting deer, the measure of effort might be thought of as the number of 100-ha
blocks within an area that were searched for deer. The model shows that the effort
required to detect at least one animal increases exponentially as the density of animals
decreases, and increases with the level of confidence required.

17Science for Conservation 212
5 . 7 M E T H O D S T O E R A D I C A T E L O W - D E N S I T Y D E E R
P O P U L A T I O N S
There are three necessary (Parkes 1990) and three desirable (Bomford &
O�Brien 1995) strategic management rules that must be met before any
population can be eradicated. The rules that must be met are (a) all animals
must be put at risk, (b) they must be killed faster than they can replace their
losses at all densities, and (c) immigration must be zero. The desirable rules are
that (d) most people must agree with the effort, (e) the benefits must outweigh
the costs, and (f) survivors should be rapidly detected. Most of these rules can
be met for the new deer populations in Northland and Taranaki. However, two
rules are unlikely to be met. The risk of new escapes or liberations remains, so
some ongoing costs to reduce this risk or to deal with new animals will be needed. It
is also likely that eradication will be falsely claimed after some operations that will
have to be reactivated once deer numbers become obvious. Many ungulate
populations have been eradicated from New Zealand (Parkes 1990, unpubl. data) and
in nearly all cases this was achieved finally through various forms of ground hunting.
Many techniques are available to deal with new deer populations. Clearly, the best and
cheapest option is for farmers to immediately muster or lure any escaped deer back
behind their fences, which they appear to be able to do in most cases (Table 4).
Permanent �jump in� or �walk in� devices should be considered for deer farms with
regular escapees. Failure to recapture escapees or illegal liberations require that the
deer be killed.
Typically, managers have begun lethal solutions with aerial hunting (which doubles as a
technique to detect the presence of deer) followed by various forms of ground hunting
(which doubles as a technique to estimate the distribution and approximate density of
deer). More specialised control methods are usually only indicated if animals survive all
attempts to kill them via these normal methods.
Aerial hunting is a well-developed control method for ungulates in New Zealand, and is
commonly used to harvest deer for game meat (Challies 1990; Parkes et al. 1996).
Although this method is most successful in non-forested habitats, it is often possible to
shoot animals in forests either through the canopy or when the animals are using slips,
river terraces, or other �open� habitats.
The various forms of ground hunting, with single or teams of hunters with or without
dogs to locate or bail the animals, are also well-developed techniques for control of
ungulates (particularly feral goats) in New Zealand. Traditional sustained-control
ground hunting allocated a single hunting block to a single hunter (and dogs).
However, this method allows a proportion of animals to escape any encounter with
the hunter (however good he or she is) and rapidly teaches surviving animals to
become very wary, a problem when eradication is the aim. Team hunting is one way
to decrease the proportion of animals that escape their first encounter with the
hunters. It was trialled against deer and chamois in the South Island in the 1950s
(Batcheler & Logan 1963), but has improved considerably in recent years in
campaigns against feral goats with the use of dogs (trained for the purpose) and the
availability of radio communication devices to keep the hunters in contact one with
another (Parkes et al. in press).
The use of radio-telemetered animals released into the control area to act as Judas
animals to lead the hunters (either on foot or in a helicopter) to any of their

18 Fraser et al.�Managing new deer populations in Northland and Taranaki
conspecifics is now a standard method, particularly useful for social species. In New
Zealand it has been used operationally for controlling remnant feral goat populations
(e.g. in the Shotover catchment in Otago: R. Thomas, pers. comm.), and
experimentally to track feral pigs used as sentinels of bovine Tb (G. Nugent, pers.
comm.). The technique has two purposes, either to locate survivors of eradication
campaigns, or to identify when new animals have arrived in an area.
Trapping deer in fenced pens, often with radio-telemetered gates to save on the need
for frequent inspection, is a common method used to live-capture wild deer for
domestication in New Zealand.
Deer can also be poisoned by aerial baiting (Daniel 1965), and between about 30%
and 93% of deer are usually killed during aerial 1080-baiting campaigns aimed mainly
at possums (e.g. Fraser & Sweetapple 2000; Nugent et al. 2001a). Widespread
application of 1080 baits is expensive, but the method might be of use against
localised populations of deer that could not be killed by other means. Similarly, the
use of 1080 gels smeared on leaves of palatable plant species as baits has successfully
reduced high-density white-tailed deer populations on Stewart Island by over 90%
(Challies & Burrows 1984), and a moderate-density red deer population in the central
North Island by 78% (Sweetapple 1997). It is likely to be less successful against low-
density populations where food is abundant, and is unlikely to eradicate such
populations, as shown by the failed attempt to eradicate the colonising populations of
red deer on Secretary Island (Tustin 1977).
5 . 8 C U R R E N T E R A D I C A T I O N C A M P A I G N S
5.8.1 Allocation of resources
The time spent on work related to each eradication operation and the fate of the herd
was recorded between June 1997 and May 2000 for Northland, and June 2001 for
Taranaki (Appendix 2). A total of 26 670 hours was spent on the programme (12 504
in Northland and 14 166 in Taranaki), with about 24% of the effort being spent on
controlling the deer as opposed to 33% being spent on finding out where the deer
were.
A more detailed breakdown of labour and operating costs was available for 2000/01
from Taranaki (Table 7). The annual budget of $100 000 (50% from DOC and 50%
from the Animal Health Board) allowed 48 red deer and 107 fallow deer to be killed.
Three new farm escapes involving 44 red deer were notified, and all of the five animals
not recaptured were killed (L. Stanley, pers. comm.).
In Northland, deer were killed in 18 of the 28 areas inspected, resulting in their
eradication from all but one area, the sika deer herd in Russell Forest (Appendix 2). In
Taranaki, deer were killed in 19 of the 26 areas inspected, resulting in their
eradication from 8 areas (Appendix 2). Note that identification of discrete herds was
more difficult in Taranaki than in Northland.
A two-pronged approach to keep areas free of deer is being implemented. The
current division of time (Appendix 2) indicates that most effort is put into reactive
strategies, with �control� and �surveillance� accounting for over 60% of the effort, and
less into proactive strategies, with �inspection�, �farm inspection�, and �liaison�
accounting for only about 7% of the effort. However, in total it is not clear how the

19Science for Conservation 212
effort was partitioned between the two strategies, so the question remains �is the risk
that new deer populations will establish permanent populations reduced most cost-
effectively by actions that reduce the chances of escapes or liberations, or by actions
that remove those that do establish, or (most likely) by some balance between the two
strategies?� A better categorisation of activities to distinguish between these two
strategies needs to be developed.
Logically, proactive management would seem the best approach to the escaped deer
problem but, because catching the people who deliberately release deer is difficult,
reactive management is likely to be the best approach to the illegal liberation
problem.
5.8.2 Deer killed
During the initial 3 years of the campaigns, data were collected for 74 and 99 deer
from Northland and Taranaki, respectively. Red deer and red/wapiti hybrids
comprised the majority (76%) of the deer killed in Northland, while fallow deer were
the main species (62%) killed in Taranaki (Table 8). Females were twice as common
(in the autopsied samples) as males in both regions (χ2 = 4.38, P = 0.036, and χ2 =
18.68, P < 0.001 for Northland and Taranaki, respectively; Table 8). Only in the sika
deer killed in Russell Forest did males outnumber females.
The mean ages of the 49 and 96 deer whose lower jaws were collected were 3.7 and
3.3 years for Northland and Taranaki, respectively. The median ages of these samples
were 2 years and 1 year for Northland and Taranaki, respectively. The mean ages of
males were lower than those for females in both areas (2.1 versus 5.2 in Northland
and 2.1 versus 3.8 in Taranaki) (Mann�Whitney U test, Z = 2.92, P = 0.003 and Z = �
1.90, P = 0.057 in Northland and Taranaki, respectively).
TABLE 7 . EFFORT (HOURS) AND OPERATING COSTS FOR THE DEER
ERADICATION PROGRAMME IN TARANAKI FOR THE 2000/01 YEAR.
Staff costs (mostly under planning, inspections, and administration) and overheads are not included in
the operating budget figure.
T A S K EFFORT (HOURS) % OF TOTAL
Planning 346
7.1
General inspections 16 0.3
Surveillance 703 14.4
Deer farm inspections 63 1.3
Liaison 151 3.1
Control effort: 1886 38.6
1. Deer traps 23
2. Ground hunting 1524
3. Spotlight hunting 160
4. Foliage bait poisoning 19
5. Aerial hunting 160
Travel 675 13.8
Down time for rain, etc. 557 11.4
Administration 489 10.0
Total operating budget $102457

20 Fraser et al.�Managing new deer populations in Northland and Taranaki
TABLE 8. SEX RATIOS OF DEER SPECIES KILLED IN NORTHLAND AND
TARANAKI .
S P E C I E S N O R T H L A N D T A R A N A K I
M A L E S F E M A L E S TOTAL M A L E S F E M A L E S TOTAL
Red deer 15 35 50 13 18 31
Wapiti 0 1 1 0 0 0
Red × wapiti 1 4 5 0 6 6
Sika 11 5 16 0 1 1
Fallow 1 1 2 15 36 61a
Total 28 (38%) 46 (62%) 74 28 (28%) 61 (62%) 99a
a Includes 10 animals for which the sex was not recorded.
Ten of the deer killed in Northland (all red deer) and 10 of those killed in Taranaki (9
red deer or hybrids and 1 fallow deer) had ear tags or holes in their ears indicating
past tags. Deer with a hole in their ear (4 of the 20) may have lost tags naturally, or this
may be a symptom of illegal release. Those without signs of tags may be wild-born
progeny of the original escapees, illegally released animals or, occasionally (as for
some deer in Taranaki), the result of natural dispersal from wild populations. In both
areas, the mean age of deer that had been tagged was higher than of those without
tags, but not significantly so. The oldest animals without evidence of ear tags were
aged 11 and 15 years in Northland and Taranaki, respectively.
The pooled data on the age of 145 deer shot and aged from both regions show most
(65% and 57% from Northland and Taranaki, respectively) are 2 years old or younger.
However, most of the females of breeding age (2 years or older) were either pregnant
or lactating (Table 9). These data, together with the overall mean and median ages
and the mean ages for deer with and without ear tags, provide strong evidence of
breeding populations in both areas.
During the field operations in Northland, several dead fawns were found and some
appeared to have had heavy infestations of ticks�presumably cattle ticks (A.
Gardiner, pers. comm.). These are not common on deer elsewhere in New Zealand
(Challies 1990) and may be a cause of higher fawn mortality among wild deer in
Northland than elsewhere in New Zealand.
TABLE 9 . SUMMARY OF THE REPRODUCTIVE STATUS OF ADULT FEMALE
DEER OF DIFFERENT SPECIES SHOT IN NORTHLAND AND TARANAKI .
NORTHLAND (n = 19) TARANAKI (n = 38)
R E D WAPITI & HYBRIDS S I K A R E D WAPITI & HYBRIDS F A L L O W
No. females > 2 y 11 4 4 7 4 27
% pregnant 18 0 50 29 75 56
% lactating 73 75 0 0 50 26

21Science for Conservation 212
5 . 9 P R I O R I T I E S F O R M A N A G I N G N E W D E E R
P O P U L A T I O N S
Most (75%) of the escapes from farms (where farmers admitted a cause) appear to be
either �acts of God� or human error and, as such, are not preventable by any increase in
inspection or enforcement activity by DOC staff. The remaining 25% of events were due to
inadequate fences, and so might be prevented by setting or enforcing higher standards of
fencing in risk areas. DOC has drafted a set of standard operating procedures for deer
farming that include an inspection process that should improve sub-standard farming
practices.
Dealing with the escapes and illegal introductions that are not preventable requires
reactive management. The priorities for this are:
� Rapid detection of new populations.
� Rapid recapture of most escaped deer by farmers, but early notification of an escape
irrespective of claims that all were recaptured should be encouraged.
� Rapid response and eradication.
� Probably most important where illegal liberation is the suspected cause, largely
because proactive management (enforcing the law) is very difficult.
� As the culprits are rarely identified and prosecuted, eradication is the best form of
discouragement.
Whether some new populations should take priority over others for eradication is
determined by what species is involved, where the animals are, and who pays. In
terms of the main deer species likely to be involved, the order of priority should be
sika, then red deer, then fallow deer. The rationale for this is their relative potential for
impact on conservation values (Hoffman 1985; Fraser 1996), propensity to disperse
(Nugent et al. 2001a), and difficulty of hunting (Davidson & Fraser 1991). A key
consideration for the �where they are� element of this exercise is an assessment of the
conservation values at risk. For DOC, the priorities could be set according to the
systems used in the feral goat control plan (Department of Conservation 1998), or in
the new Measuring Conservation Achievement (MCA) system when that is adopted
(Department of Conservation 2001).

22 Fraser et al.�Managing new deer populations in Northland and Taranaki
6. Discussion
The eradication programmes in Northland and Taranaki have, to date, been largely
successful in eradicating deer: 27 of 28 new populations identified in Northland have been
eradicated; 8 of 26 new populations identified in Taranaki have been eradicated, 14 are
considered to be still present, and the status of a further 4 is unknown. Whether these
programmes could have been conducted more efficiently is unclear, but the careful
collection of operational data should allow managers to improve this over time�given
that the problem will be ongoing. Furthermore, there is merit in extending the current
eradication programmes to include other deer-free areas north of Auckland, on the
Coromandel Peninsula, and on Banks Peninsula if these are to be maintained as deer-free
areas also. Feral goats are now at low or zero densities in these areas and it makes sense to
also exclude deer in order to maintain the benefits of removing ungulate impacts on the
vegetation communities.
It is unlikely that recreational hunting could eradicate anything but the most
vulnerable new deer populations, but it is likely that encouraging recreational deer
hunting in Northland and Taranaki will lead to expectations that a hunting resource
should be maintained. Therefore, recreational hunting of deer should not be
considered as a control tool and, furthermore, should be actively discouraged in these
regions.
In Northland, red deer, wapiti, and their hybrids are the main species farmed, and
escapes from farms formed the main source of new populations. Two of the
populations established by illegal liberations were sika deer, a species rarely
farmed in New Zealand. It is likely that these animals came from the wild
populations in the central North Island, where bovine Tb is present in parts of
their range. In Taranaki, fewer new populations established from farm escapees
and more from natural dispersal or from illegal liberations, and fallow deer
featured more often. The no-farming (of deer) zones recently established both
in Northland and Taranaki have limited the potential for new populations of
deer to establish in several key conservation areas in these regions.
Our survey of deer farmers indicated that most respondents were aware of the
problems posed by wild deer, but that many of these same respondents did not
fully support DOC�s eradication programmes. The attitudes of some people may
be improved by better or more targeted information from agencies (most
respondents did not consider that they had received sufficient information from
DOC and the AHB). Some deer farmers may also be suspicious of DOC�s
motives, and this will need to be overcome by good communication, by peer
pressure and, as a last resort, by making them aware of their legal obligations.
Finally, some farmers will also be deer hunters and may wish to see wild herds
establish.
Deer farmers probably reflect the same range of views on wild deer as are held by the
wider population (Department of Conservation 2001; Fraser 2001). However, the
fact that most respondents to our questionnaire said that they were aware of the
potential Tb risk posed by new populations of wild deer, but fewer of them
supported DOC�s eradication programmes, indicates a lack of awareness among
them as to the actual risks posed to their own and other farmers� operations by new

23Science for Conservation 212
populations of Tb-infected wild deer. New populations may be infected with Tb if
they originate from deer taken from areas where Tb is endemic in the wild
population. The risk of transmission of Tb to farmed deer is very high if wild deer mix
with farmed deer. However, direct contact between Tb-infected wild deer and farmed
deer is not the only concern with respect to the establishment of populations of Tb-
infected wild deer. Recent evidence suggests that cattle do not transmit Tb to
possums, but deer may do so; and once Tb is established in the possum population, an
ongoing Tb-infection route is established as possums do transmit Tb to cattle (Lugton
et al. 1998).
7. Recommendations
The authors recommend that:
� The eradication programmes for new populations of deer be continued in
Northland and Taranaki, and extended to other deer-free areas north of Auckland,
on the Coromandel Peninsula, and on Banks Peninsula.
� The time spent on different activities related to prevention and eradication of new
wild deer populations be recorded as either �proactive� or �reactive� for either
escapee populations or illegal liberation populations, so that a cost�benefit analysis
of the two strategies can be developed for each situation.
� Recreational hunting of deer should not be considered as a control tool in Northland
and Taranaki and, because of potential expectations by recreational hunters, be
actively discouraged in these regions.
� Fencing standards and other related requirements for deer farming in �at-risk� areas
be more stringent than elsewhere. Farms reporting three or more escapes should be
inspected more frequently to see if the risks can be reduced.
8. Acknowledgements
We thank staff from the Northland and Wanganui Conservancies of DOC, particularly
Don McKenzie, Alan Gardiner, and Les Stanley for providing the data for this report.
We also thank the many deer farmers who participated in our survey and/or supplied
information either on behalf of the Deer Farmers� Association or as private
individuals. Graham Nugent, Peter Sweetapple, and Phil Cowan commented on early
drafts and Christine Bezar provided editorial comments, Kirsty Cullen prepared the
figures, and Wendy Weller completed the final wordprocessing.
24 Fraser et al.�Managing new deer populations in Northland and Taranaki
9. References
Alspach, R. 1993: Pest problems: the view of the Animal Health Board. New Zealand Journal of Zoology
20: 245�246.
Baddeley, C.J. 1985: Assessments of wild animal animal abundance. Forest Research Institute Bulletin No.
106. 46 p.
Batcheler, C.L.; Logan, P.C. 1963: Assessment of an animal-control campaign in the Harper-Avoca
catchment. New Zealand Forestry Research Notes No. 27. 27 p.
Bomford, M.; O�Brien P. 1995: Eradication or control for vertebrate pests? Wildlife Society Bulletin 23:
249�255.
Challies, C.N. 1990: Red deer. Pp. 436�458 in King, C.M. (Ed.): The handbook of New Zealand mammals.
Oxford University Press, Auckland. 600 p.
Challies, C.N.; Burrows, L. 1984: Deer control and vegetation response on Stewart Island. What�s New in
Forest Research No. 126. Forest Research Institute, Rotorua, New Zealand. 4 p.
Choquenot, D.; Ruscoe, W.A.; Murphy, E. 2001: Colonisation of new areas by stoats: time to establishment
and requirements for detection. New Zealand Journal of Ecology 25: 83�88.
Daniel, M.J. 1965: Early trials with sodium monofluoroacetate (compound 1080) for the control of
introduced deer in New Zealand. New Zealand Forest Service Technical Paper No. 51. 27 p.
Davidson, M.M.; Fraser, K.W. 1991: Official hunting patterns and trends in the proportions of sika
(Cervus nippon) and red deer (C. elaphus) in the Kaweka Range, New Zealand, 1958�1988. New
Zealand Journal of Ecology 15: 31-40.
Department of Conservation 1998: Department of Conservation national feral goat control plan 1995�
2004. Department of Conservation, Wellington. 66 p.
Department of Conservation 1999: Department of Conservation national possum control plan.
Department of Conservation, Wellington. 86 p.
Department of Conservation 2001: Making the best choices for conservation. Department of
Conservation, Wellington. 23 p.
Fraser, K.W. 1996: Comparative rumen morphology of sympatric sika deer (Cervus nippon) and red
deer (C. elaphus) in the Ahimanawa and Kaweka Ranges, central North Island, New Zealand.
Oecologia 105: 160�166.
Fraser, K.W. 2001: Introduced wildlife in New Zealand�a survey of general public views. Landcare
Research Science Series No. 23. 45 p.
Fraser, K.W.; Cone, J.M.; Whitford, E.J. 1996: The established distributions and new populations of
large introduced mammals in New Zealand. Landcare Research Contract Report LC9697/22
(unpublished). 65 p.
Fraser, K.W.; Cone, J.M.; Whitford, E.J. 2000: A revision of the established ranges and new
populations of 11 introduced ungulate species in New Zealand. Journal of The Royal Society
of New Zealand 30: 419�437.
Fraser, K.W.; Sweetapple, P.J. 1993: Assessing the age and condition of deer from jawbones.
Manaaki Whenua�Landcare Research New Zealand Ltd. Christchurch, New Zealand. 32 p.
Fraser, K.W.; Sweetapple, P.J. 2000: A comparison of the effectiveness of two toxic loadings (0.08%
and 0.15%) for control of deer during aerial 1080 poisoning using carrot baits. Landcare
Research Contract Report LC9900/84 (unpublished). 22 p.
Hofmann, R.R. 1985: Digestive physiology of the deer: their morphophysiological specialisation and
adaptation. Bulletin of The Royal Society of New Zealand 22: 393�407.
Lugton, I.W.; Wilson, P.R.; Morris, R.S.; Nugent, G. 1998: Epidemiology and pathogenesis of
Mycobacterium bovis infection of red deer (Cervus elaphus) in New Zealand. New Zealand
Veterinary Journal 46: 147�156.
25Science for Conservation 212
McKenzie, D. 1997: Wild deer in Northland. A proposal to eradicate feral populations and reduce the risk
of farm escapes. Unpublished report. Department of Conservation, Northland. 12 p.
McKenzie, D. 2000: Wild deer in Northland. A ten year eradication plan. Annual report 2000. Unpublished
report. Department of Conservation, Northland. 16 p.
Morris, R.S.; Pfeiffer, D.U. 1995: Directions and issues in bovine tuberculosis epidemiology and control in
New Zealand. New Zealand Veterinary Journal 43: 256�265.
New Zealand Official Yearbook 2000: 102nd edition. David Bateman, Auckland. 603 p.
Nugent. G.; Fraser, K.W. 1993: Pest or valued resource: conflicts in game management. New Zealand
Journal of Zoology 20: 361�366.
Nugent, G.; Fraser, K.W.; Asher, G.W.; Tustin, K.G. 2001a: Advances in New Zealand mammalogy 1990�
2000: Deer. Journal of The Royal Society of New Zealand 31: 263�298.
Nugent, G.; Fraser, K.W.; Sweetapple, P.J. 2001b: Top down or bottom up? Comparing the impacts of
arboreal possums and �terrestrial� ruminants on native forests in New Zealand. Biological
Conservation 99: 65�79.
Parkes, J. P. 1990: Eradication of feral goats on islands and habitat islands. Journal of The Royal Society of
New Zealand 20: 297�304.
Parkes, J.P.; Nugent, G.; Warburton, B. 1996: Commercial exploitation as a pest control tool for
introduced mammals in New Zealand. Wildlife Biology 2: 171�177.
Parkes, J.; Macdonald, N.; Leaman, G. in press: An attempt to eradicate feral goats from Lord Howe
Island. Proceedings of an International Conference on Eradication of Island Invasives.
Sweetapple, P.J. 1997: Effectiveness of foliage bait poisoning for controlling low-density deer
populations in forest. Landcare Research Contract Report LC9798/69 (unpublished). 15 p.
Tustin, K.G. 1977: Secretary Island�a problem in deer control. What�s New in Forest Research No.
50. Forest Research Institute, Rotorua, New Zealand. 4 p.
Wilde, R.H. 2000: Thermal infrared imaging for counting deer. Conscience 29: 11�13.

26 Fraser et al.�Managing new deer populations in Northland and Taranaki
Appendix 1
27Science for Conservation 212

28 Fraser et al.�Managing new deer populations in Northland and Taranaki
29Science for Conservation 212
Appendix 2
TIME SPENT ON DEER ERADICATION, NUMBERS OF DEER KILLED, AND
STATUS OF HERDS BY AREA, IN NORTHLAND BETWEEN JUNE 1997 AND MAY
2000, AND IN TARANAKI BETWEEN JUNE 1997 AND JUNE 2001.
The categories used for time spent are: 1, planning; 2, area inspection; 3, surveillance; 4, farm
inspections; 5, liaison and communications; 6, administration, training, and other miscellaneous tasks;
7, control. Abbreviations for fate of herd are: E, eradicated, P, present, ?, unknown. Deer species:
wap. = wapiti, hyb. = red × wapiti hybrid, fal. = fallow.
HERD AREA DEER FATE OF NO. CATEGORY (HOURS)
(ha) SPECIES HERD KILLED 1 2 3 4 5 6 7 TOTAL
Northland
Opua 1005 sika E � � � 182 6 42 � � 230
Russell 3215 sika P 16 76 � 1339 � 104 � 412 1931
Hukerunui 720 red E 1 � � 16 � 8 � � 24
Whakapara 360 red E 1 � � 32 � � � 16 48
Maungakahia 17410 red E 6 � � 176 24 119 � 414 733
Glenbervie 2135 red E 1 � � 88 � 3 � 31 122
Taraunui 790 red E 4 � � 17 � � � 15 32
Pukenui 775 ? E � � � 27 � � � � 27
Tangihua 1355 ? E � � � 24 � � � 8 32
Brynderwyn 1410 ? E � � � 282 � 44 � 17 343
Hakaru 3680 red E 2 8 � 237 � 27 � 54 326
Karaka 1550 red E 1 � � 17 � � � 8 25
Mangarata 1250 red, wap. E 8, 1 8 � 291 10 18 � 124 451
Tokatoka 535 red, hyb. E 2, 1 � � 25 � 8 � � 33
Ararua 6640 red, hyb. E 8, 4 � � 915 � 47 � 109 1071
Greenhills 1990 red E 3 � � 85 � 4 � 522 611
Mt Camel 1060 red E 1 � � 110 � � � 70 180
Kaimaumau 6095 red E 2 32 � 349 172 43 58 286 940
Aupouri 11450 red E 4 8 � 68 41 3 � 92 212
Purerua 700 fallow E 2 � � 35 � 10 � � 45
Waitangi 1225 ? E � 4 � 17 � 9 � � 30
Tinopai 6511 ? E � � � 94 � 37 � 15 148
Poroti 885 red E 1 � � 11 � 25 � 50 86
Ngunguru 1290 ? E � � � 12 � 24 � � 36
Kokopu 680 ? E � � � 19 � � � � 19
Pouto 24148 red E 6 � 8 196 11 21 � 144 380
Oneriri 3111 ? E � � � 88 � 21 � 3 112
Arapohue 1650 ? E � � � 11 � 1 � 16 28
Unspecified � � � � � 24 8 35 � 16 � 83
Conservancy 1638 8 55 468 581 1416 � 4166
TOTALS 103625 74 1774 40 4826 767 1199 1490 2406 12502
% 14.2 0.3 38.6 6.1 9.6 11.9 19.2
Taranaki
Kotare 3920 sika P � 10 16 220 � 18 � 328 592
Panirau 2560 sika E 19 38 60 650 � 3 � 171 892
Moki 2265 red E 3 � 25 182 � � � 197 404
Makino 11175 sika E 1 � 12 287 � 12 16 478 805
Waitaanga 1313 red, fal. E 6, 1 � 8 322 4 36 � 560 930
Ohura 1140 red P � 33 � 182 � 12 � 86 313
Whitcliffs 3110 red E 4 � � � 2 � � � 2

30 Fraser et al.�Managing new deer populations in Northland and Taranaki
N.Waitaanga 735 red, fal. P 1, 5 � 24 290 14 41 � 217 586
Matau 2610 red, fal. P 6, 19 37 � 163 � 34 � 13 247
Rawhitiroa 5110 fallow P 8 6 � 84 � 10 � � 100
Bunns/Miles 2455 fallow ? 12 16 � 21 � 9 � 13 60
Te Wera 4370 red, fal. P 1, 4 67 9 182 � � � 38 296
Waitotara 1390 fallow ? � � � � � � � 18 18
Tarere 7780 red, fal., P 16, 46, 1 13 � 326 � 8 � 112 459
sambar
Puniwhakau ? fallow P 6 8 � 32 � 43 � 38 121
Hutiwai 9620 red P � 8 � 86 � � � 48 142
Maikaikatea 1810 red ? 6 � � � � 4 � 4
Toi 155 red ? 2 15 � 216 � 2 � 93 326
Uruti 2045 fallow P 11 � 56 8 � 5 � 49 127
Tangarakau 520 red E � � � � � � � 1 1
Okara 8850 fallow E 10 � � � � � � 8 8
Otumokuru 7275 fallow P 26 � 20 150 � 9 � 79 258
Patea ? fallow P 41 � 56 � � 9 � 184 249
Whenuakura 2665 red, hyb., fal. P 6, 26, 53 87 22 120 � 38 � 201 468
Rerekino 640 fallow E 1 � � � � � � � �
S. Taranaki � ? P � 34 � 128 � � 16 30 208
Unspecified � red, fal. � 5, 18 44 11 134 10 26 2358 392 3072
Conservancy 83790 400 4 178 25 193 2730 25 3555
TOTALS 323a 816 323 3961 55 513 5120 3379 14167
% of total 5.8 2.3 28.0 0.4 3.6 36.1 23.9
a Total kill comprised 220 fallow deer, 56 red deer, 26 red ´ wapiti hybrids, 20 sika deer, and 1 sambar deer. Following the analysis and
write-up of these deer kill data, we received a further 16 deer kill records for the period July 2001 � February 2002. They comprised 4
fallow deer kills from Maikaikatea, 3 fallow deer kills from Otumokuru, 1 fallow deer kill from Uruti, and 4 red deer, 2 red ´ wapiti
hybrid, and 2 fallow deer kills from Whenuakura.
HERD AREA DEER FATE OF NO. CATEGORY (HOURS)
(ha) SPECIES HERD KILLED 1 2 3 4 5 6 7 TOTAL
Taranaki continued